How ENSO Can Affect Temperature Fluctuations Within a Season Over North America
We know that El Niño and La Niña have an effect on the average surface wintertime temperature over North America. But, can we say anything about the day-to-day temperature fluctuations? For the period 1958-1998, we examined December though February daily surface air temperatures from the NCEP/NCAR Reanalysis. We found that El Niño winters tend to have smaller than normal temperature fluctuations over most of North America. Conversely, La Niña winters had larger fluctuations though the effect is less widespread. The greater chance of extreme weather implied by the increased(decreased) variability during La Niñas (El Niños) and the variability itself has consequences; i.e. farmers, ranchers, and energy providers and many others.
| Fig 1 |
|---|
 |
| Fig 2 |
 |
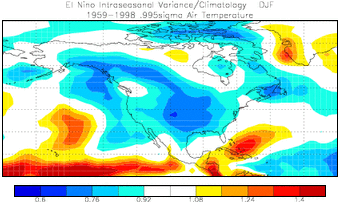
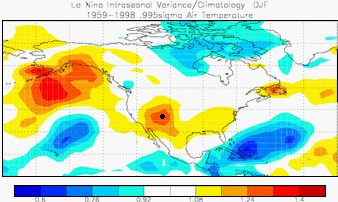
We defined temperature variability as the standard deviation of temperature within a season relative to that season's average temperature. El Niño and La Niña years were selected from the highest and lowest values of a time-series that combined tropical sea surface in the Pacific Ocean with a time series of tropical sea level pressure. The resulting combined time-series contains both the atmospheric and oceanic components of ENSO. The variability was averaged for El Niño and La Niña separately. The figures show the ratio of the variability during El Niño (Fig 1) and La Niña (Fig 2) to that from all years. El Niño years exhibit decreased variability (blue) over much of the US especially along the east side of the Rocky Mountains with some increase in variability over the Caribbean region. La Nina exhibits increased variability (red) over the US especially in the south and southwest. What is particularly interesting is that in general, regions where El Niño shows decreased variability are the same regions as where La Niña shows increased variability and vice versa.
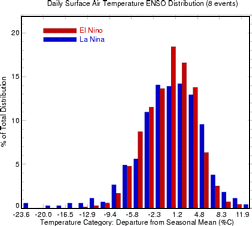
We then examined the actual distributions of temperature of daily temperatures over a location in the southwestern US (indicated by a black circle in Fig 2) where El Niño displayed very low variability while La Niña years showed very high variability. The results are shown in Fig 3. El Niño years (red) have more values closer to the center while La Niña years (blue) have more days which are very high AND more days which are very low. From this we can say that for this location, La Niñas acts to broaden the distribution at both the high and low end.
| Fig 3 |
|---|
 |
Further examination showed the results to be robust with regards to dataset, ENSO definitions and time-period. The results also exhibited a consistent effect during the different events with the suppression/enhancement of variability being similar during most La Niña events and most El Niño events. There was some effect of the strength of the events predominantly with La Niñas. We also looked at heating degree days, cooling degree days and days below freezing to see the effect changes in variance have on "threshold" type statistics. In conclusion, there does appear to be a relationship between ENSO events and temperature variability over North America. We did not study in detail the causes of this effect but it is related to the position of planetary waves that come from the tropics. These occur in different locations during El Niño and La Nina. During La Niña, the waves can block the normal west to east flow of the atmosphere across the US and the air is forced to move more north/south bringing with it very cold/warm temperatures. During El Niño, winds tend to blow more consistenly west to east thus are associated with more consistent air temperatures.
Paper
- Smith, C.A. and P. Sardeshmukh, 2000, The Effect of ENSO on the Intraseasonal Variance of Surface Temperature in Winter. International J. of Climatology, 20 1543-1557.