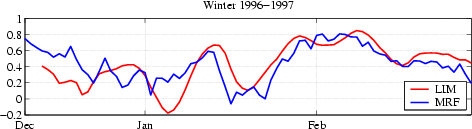
Comparison of MRF Ensemble Mean and LIM Forecasts in week 2
Spatial correlation is computed in the region 0-90N, 120E-60W for 250 hPa streamfunction forecasts.

| main page | week 2 and 3 | weeks 3/4 and 5/6 | technique | verification | heating data |
Document maintained by: CDC MapRoom Last modified: Thu Jun 14 14:24:01 MDT 2001
Privacy statement | Disclaimer | Credits