WelcomeWelcome to the PSL dynamically consistent diabatic heating web site. The following text provides a short discussion of the technique used to create the dynamically consistent heating fields and a comparison with other heating datasets. More detailed examinations are available in the literature. To view the monthly means and standard deviation climatology, please go to the quick-look atlas. Introduction to the Chi ProblemDespite its central importance in climate and climate variability, a detailed knowledge of diabatic heating rates has remained elusive. We have developed a long-term dataset of tropospheric heating rates by diagnosing heating as a residual term in the heat budget: 
The vertical motion, 
An iterative procedure has been applied to the NCEP/NCAR Reanalysis wind fields to minimize the vorticity budget residual, R, and the divergent circulation is further constrained to satisfy the large-scale mass budget. Below is a plot of R at different vertical levels as a fraction of the initial residual for each iteration of the minimization problem. 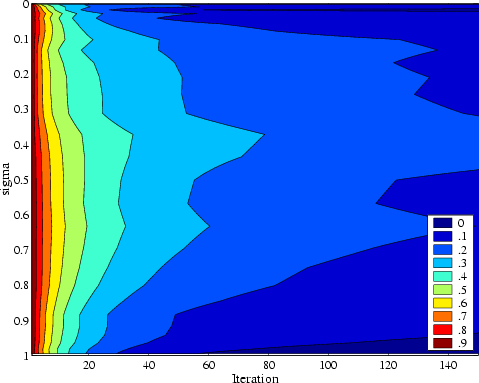
Enforcing dynamical consistency on the divergent circulation has a noticeable effect on the strength, position, and variability of the diagnosed heating extrema. Comparisons with field experiments yield encouraging results. Hereafter we refer to our dynamically consistent heating fields as "chi-corrected" fields. Changes to Mean FieldsThe chi-corrected and NCEP/NCAR Reanalysis monthly mean global heating fields for January 1993 are shown below. 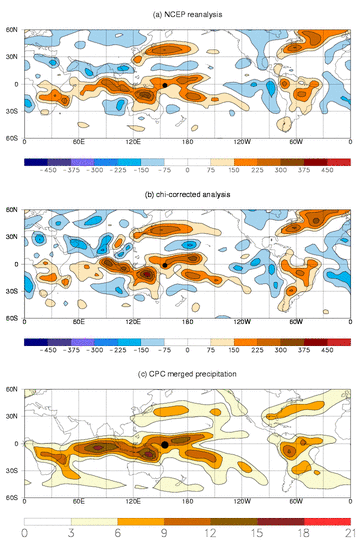
While the large-scale patterns are similar in these two fields, important differences are evident. For example, the magnitude of chi-corrected heating is larger in the Indo-Pacific corridor and central Pacific and smaller over southern Africa and the Indian Ocean. Sub-tropical cooling is also stronger in the chi-corrected dataset. The heating fields are similar to independent observational estimates of precipitation, but cannot be expected to be the same, since diabatic heating and cooling are not strictly due to the release of latent heat. In particular, these fields show that the absence or presence of precipitation in a region (e.g., in the Atlantic storm tract; off the coast of West Africa) is not always a good indicator of the sign or magnitude of the heating in that region. Changes to VariabilityThe interannual standard deviation of January monthly mean heating for 1969-1997 is shown below. 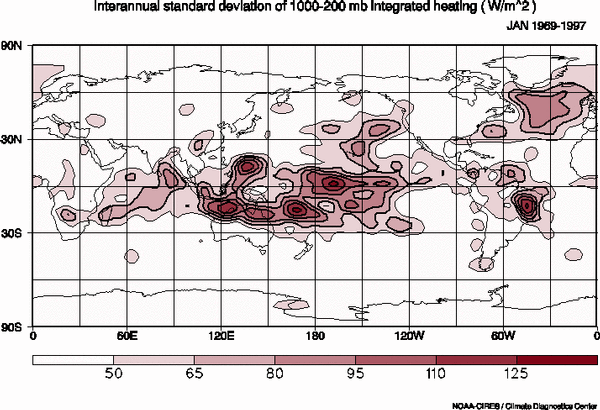
Monthly means for individual years have been calculated from twice daily heating analyses integrated from the surface to 200 hPa. Units are Watts per square meter. Similar figures for other months are available from our quick look page. The dynamically consistent fields show more extensive heating variability that that produced by the NCEP/NCAR Reanalysis, particularly in the Tropics. Increases to the variability in the central equatorial Pacific are due primarily to increases in the strength of ENSO events. Enhanced variability is also evident along the SPCZ. Stronger variability is present in the chi-corrected dataset on all resolved time scales and seasons, not just for the January monthly means discussed here. Comparisons during TOGA-COAREThe vertical profiles of the chi-corrected heat source, Q1, and moisture sink, Q2, during the Intensive Observing Period (1 Nov 1992 - 28 Feb 1993) of TOGA-COARE are in better agreement with observations than those derived from the NCEP/NCAR Reanalysis. 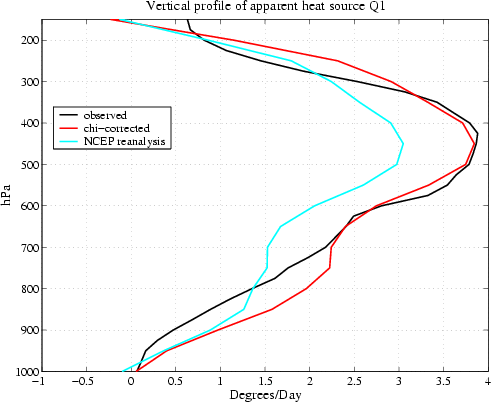 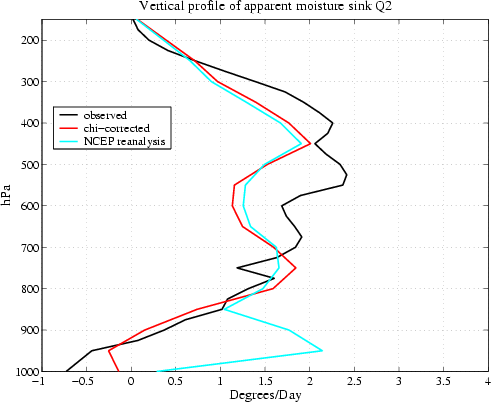
Note in particular that the chi-corrected fields now have a nearly identical estimation of the deep convective heating profile Q1 and the correct sign for Q2 near the surface. The observed data is an updated version of Johnson and Lin (1997) taken over the Intensive Flux Array (IFA) region of COARE. The NCEP/NCAR Reanalysis and chi-corrected data were taken from an area average approximating the IFA region. The center of this region is near 1.4S, 155E and is indicated by a solid black dot on the latitude-longitude plots shown previously. ConclusionsIn the Tropics, the chi-corrected heating fields show substantially greater variability than the unmodified fields. Vertical profiles of chi-corrected diabatic heating and moistening for the northern winter of 1992-93 compare better with the profiles from observational COARE data than do the profiles from the original reanalyses. In the absence of "Diabatic Heating Meters" for directly measuring heating rates in the atmosphere, the approach followed here provides perhaps the most complete diagnosis of global heating rates, with relatively little contamination from a data-assimilating model's parameterizations. ReferencesSardeshmukh, P.D. 1993: The baroclinic chi problem and its application to the diagnosis of atmospheric heating rates. J. Atmos. Sci., 50, 1099-1112. Sardeshmukh, P. D., M. Newman, and C. R. Winkler, 1999: Dynamically consistent estimates of diabatic heating. Proceedings, 24th Climate Diagnostics and Prediction Workshop, Tucson, AZ, 172-175. Johnson, R. H., and X. Lin, 1997: Episodic trade wind regimes over the western Pacific warm pool. J. Atmos. Sci., 54, 2020-2034. Dataset availability: This data may be made available at a latter date. Contact Matt Newman for more information. |
 , used in this heat budget calculation is
diagnosed from the large-scale vorticity budget: