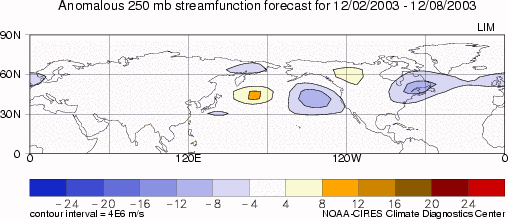
Realtime Forecasts of the Low-Frequency Atmosphere
Latest map

Figures updated:
Wed Nov 26 12:03:08 2003
| main page | WEEK 2 AND 3 | weeks 3/4 and 5/6 | technique | verification | heating data |
Document maintained by: PSL Map Room and Matt Newman Last modified: 3 Jan 2000
Credits