Ocean WRIT Correlation/Timeseries Page: Plot Example
Obtain SSH Time-series: Use it for correlation plot with ORAS5 SST
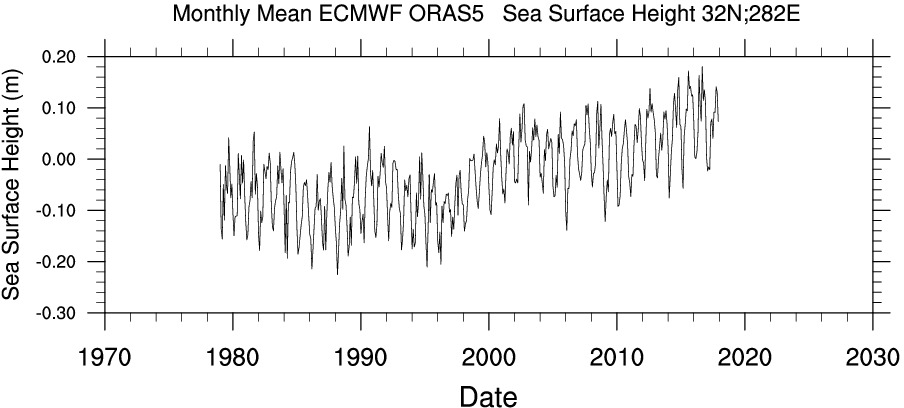 (get timeseries
click for large image)
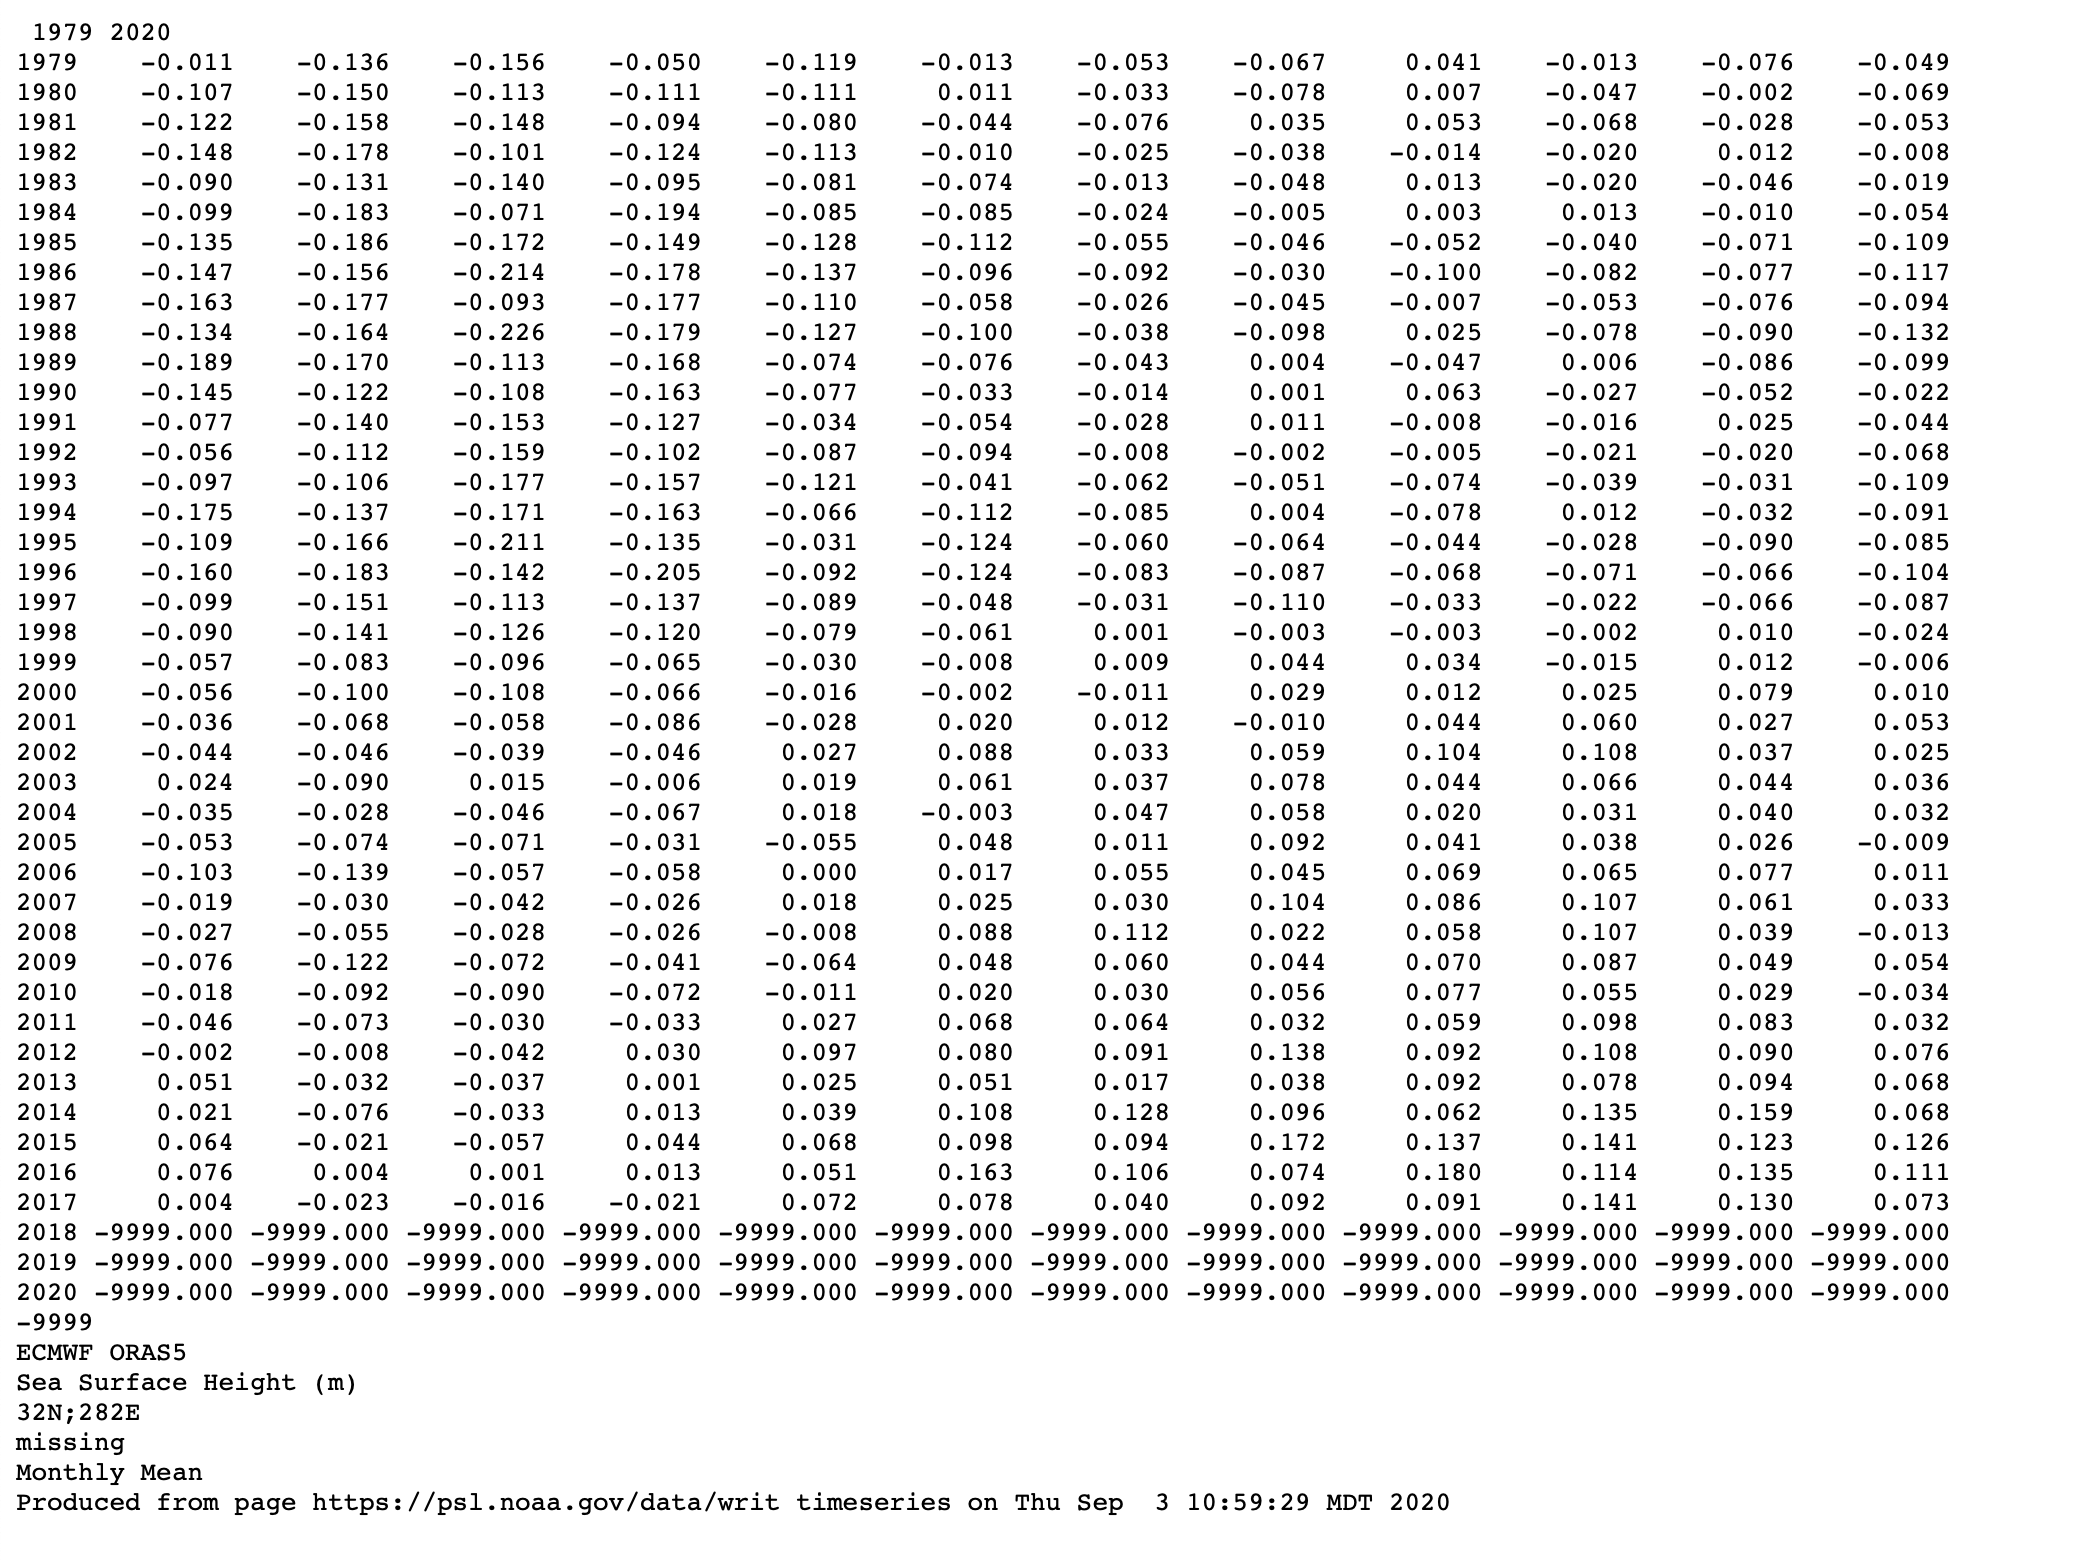 (time-series data. Follow instructions to upload to PSL's FTP site
click for large image)
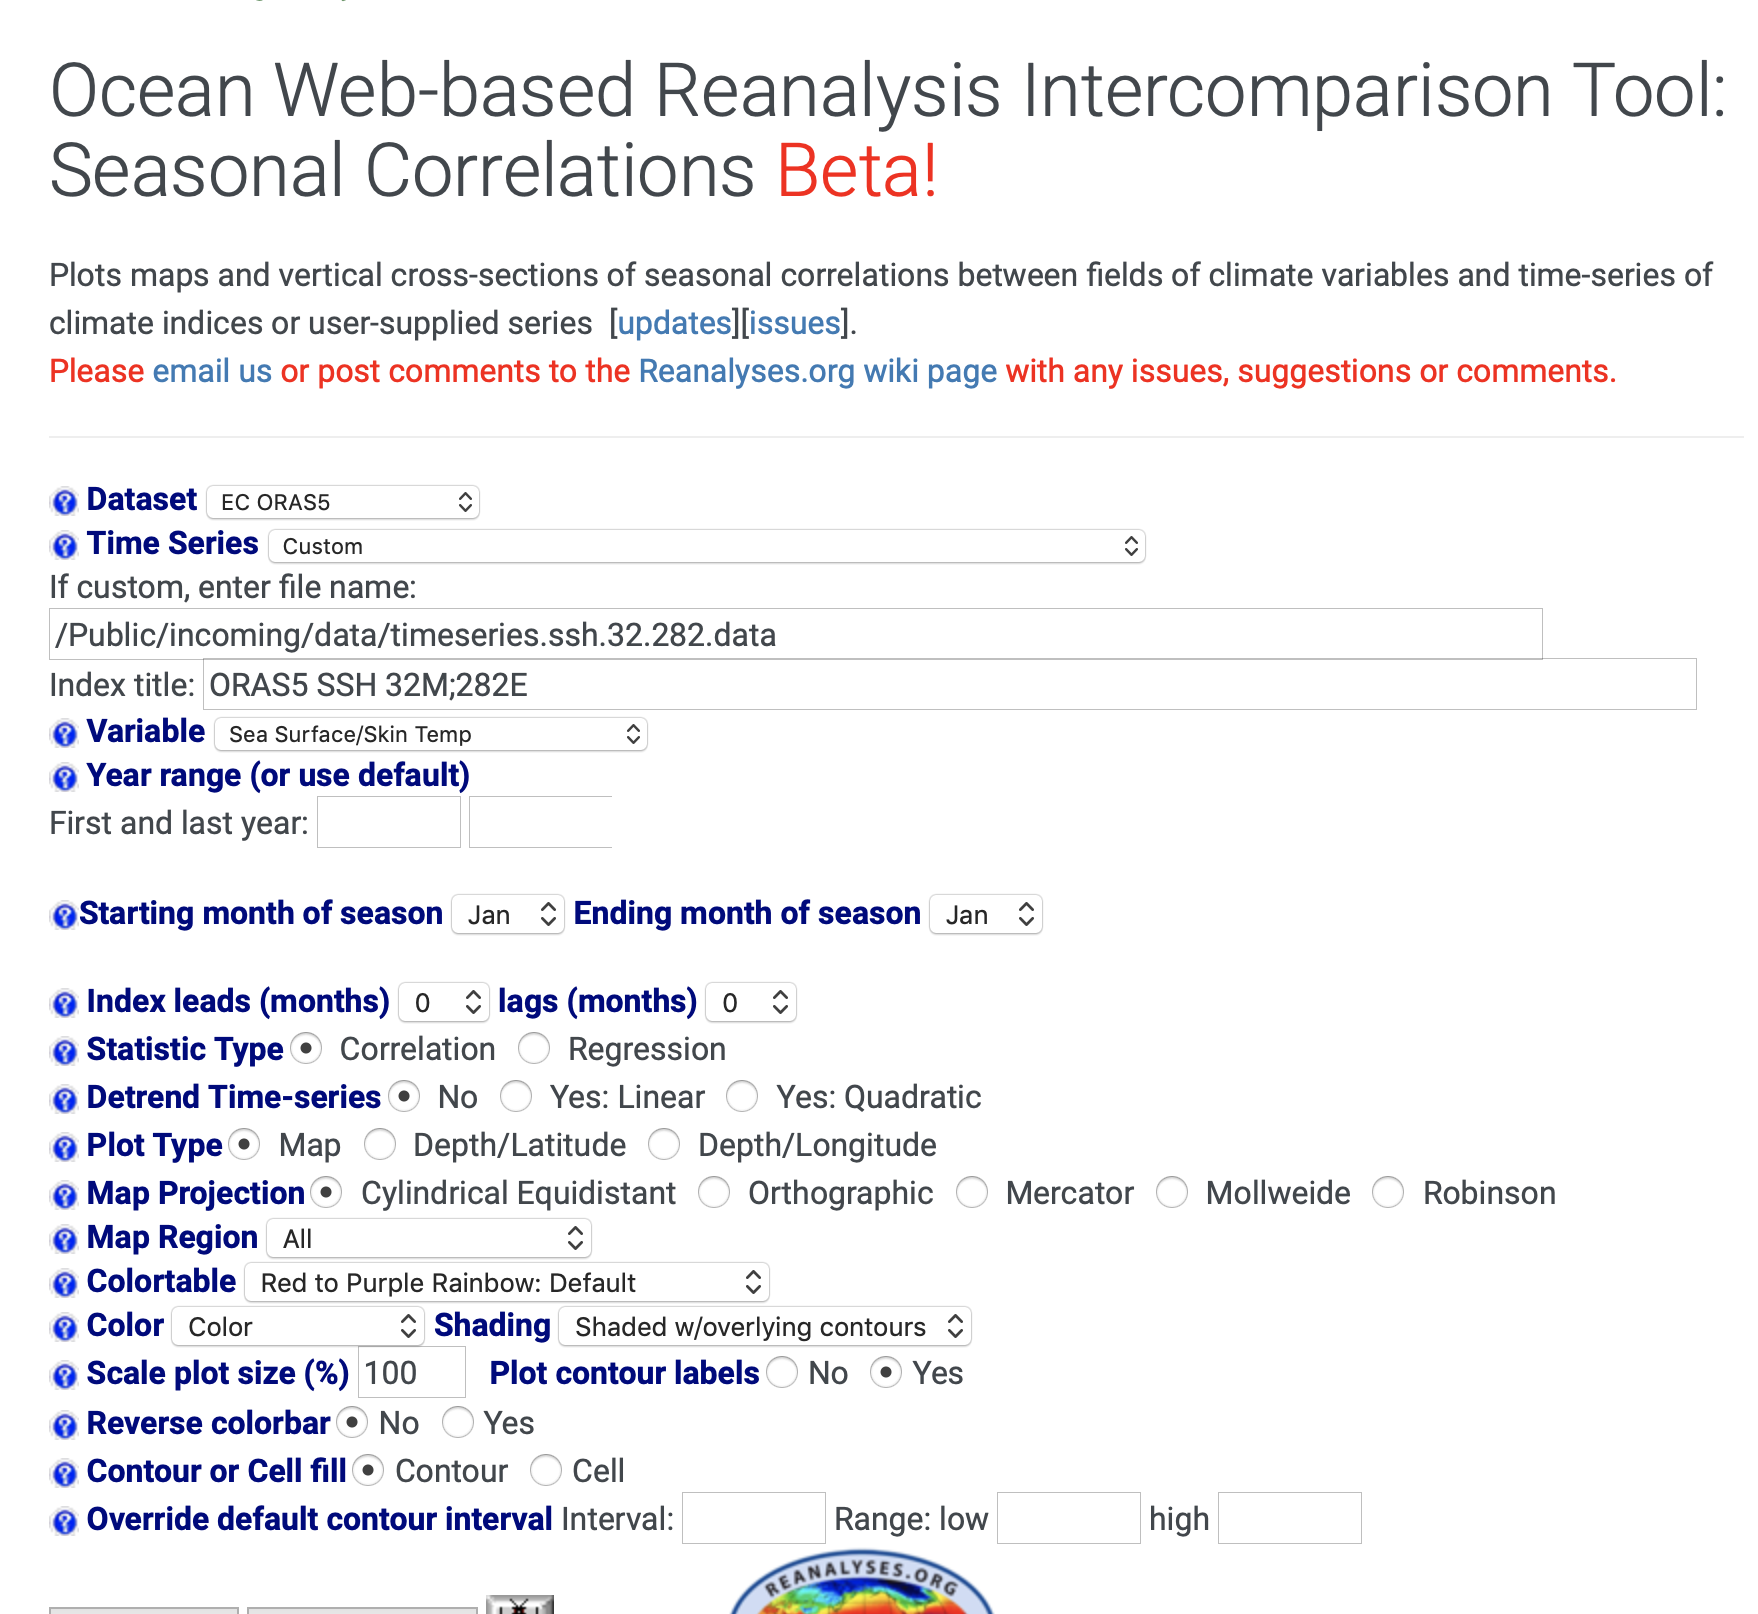
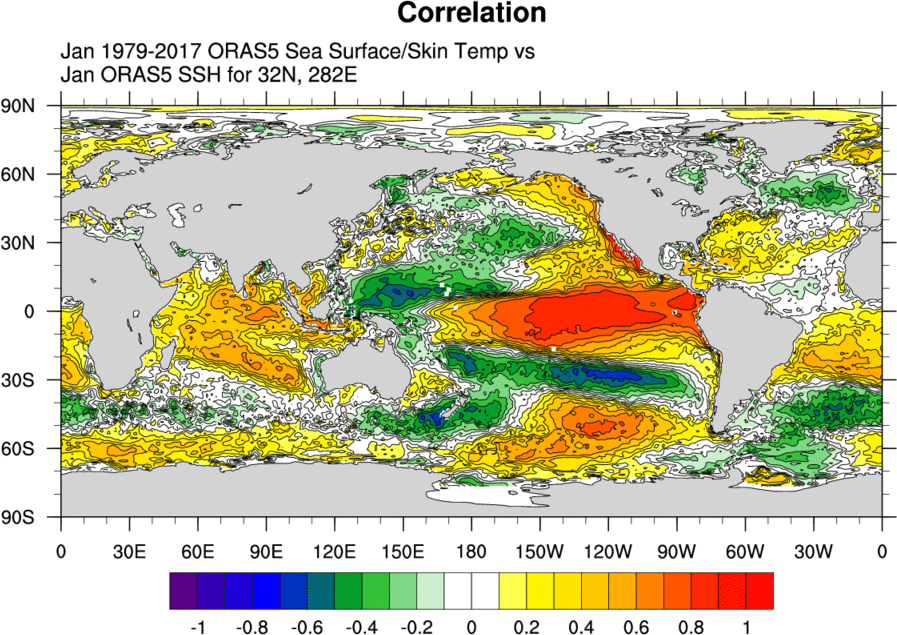 (correlation plot:
 click for large image)
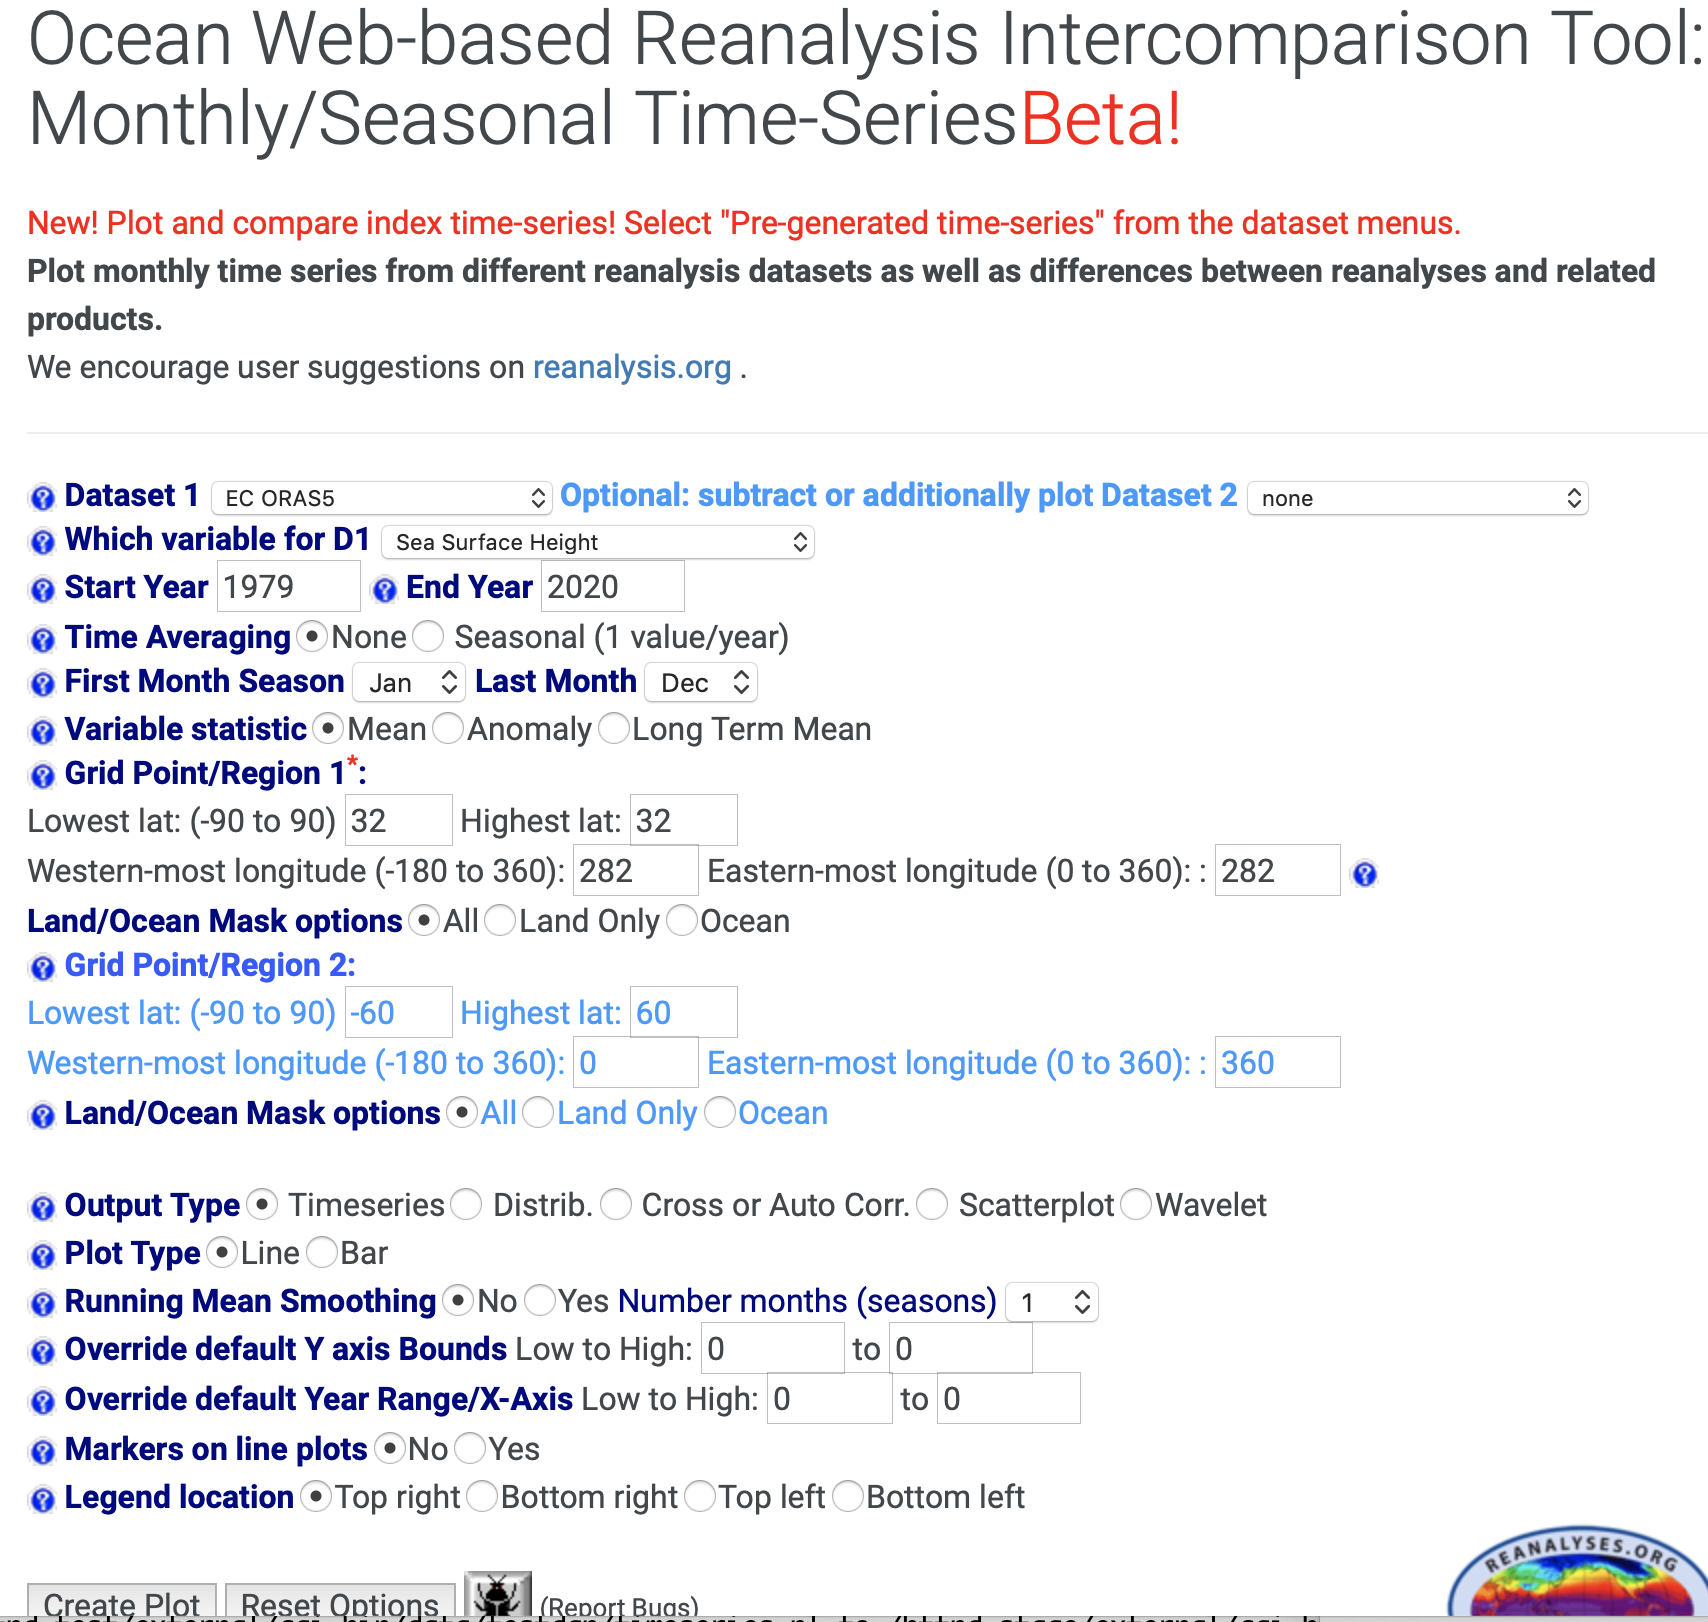
Options for the Ocean WRIT Monthly Timeseries page and the Ocean WRIT Monthly Correlation page
To create the correlation plot. First generate the timeseries. On the page with the plot, select "Data files". Save as a page in browser. Then upload that page with the time-series to PSL's anonymous ftp area. ftp ftp.cdc.noaa.gov. cd Public/incoming/timeseries. put filename. Then go to the corelation page. Use 'custom' for timeseries. You will get a box where you add the location and a title. Location is /Public/incoming/timeseries/filename. Title is ORAS5 SSH 32N;282E.
|
Time-series Page
|  |
|
Correlation Page
|  |