PSL Web Products and Tools
PSL has created a set of web products and tools that we have found useful in our research. These products include those that display data, do analysis and make climate and weather forecasts.
Gridded Observed and Analysis Datasets | Non-Gridded Climate Datasets | Timeseries Data | Climate Process Analysis
 'd items can plot the most recent data as part of the analysis
Perform Analysis
Gridded Observed and Analysis Datasets
- Search and Plot Gridded Climate Data
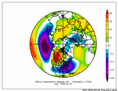
- Plots monthly and seasonal composites of variables (mean, anomalies and long-term means). Lat/Lon plots for any desired region, and height cross-sections are available
|
 |
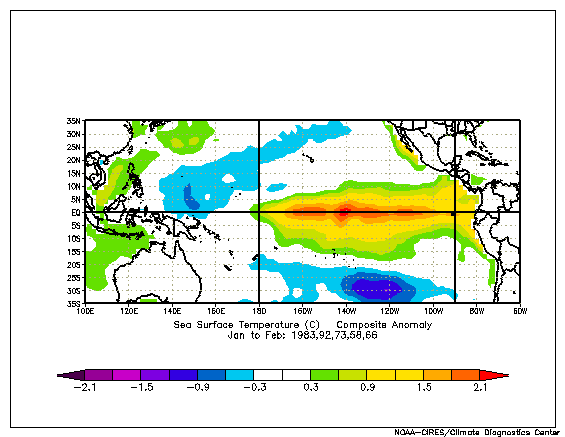
- Monthly/Seasonal Mean Composites
- Plots monthly and seasonal composites of variables (mean, anomalies and long-term means). Lat/Lon plots for any desired region, and height cross-sections are available. Also Day and Hourly)
|
 |
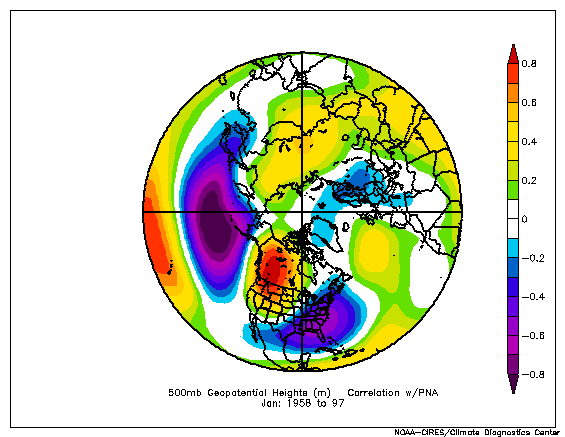
- Linear Monthly/Seasonal Correlations
- Plots monthly and seasonal correlations of gridded variable with ocean/atmosphere index time-series like the PNA or ENSO. User can specify their own time-series
|
 |
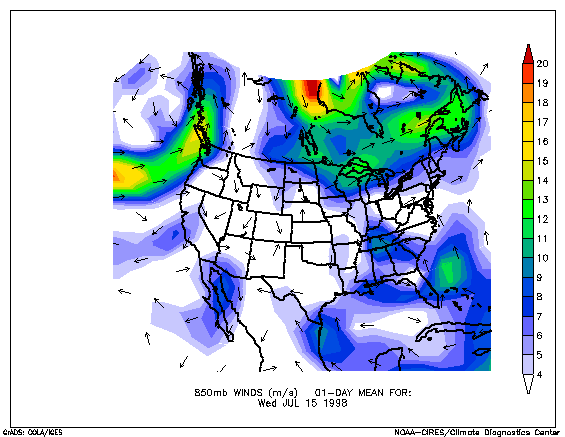
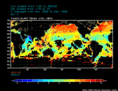
- Daily NCEP Operational Plots
- Plot daily or daily averaged NCEP Operational Data. User can plot means, anomalies or climatology. Plotting options and regions can be specified.
|  |
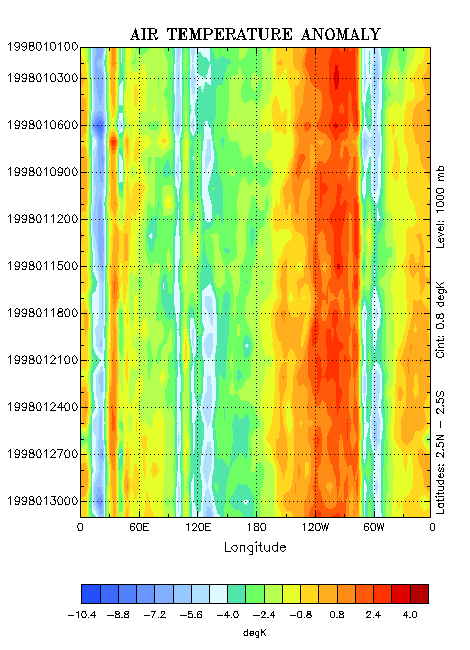
- NCEP Time-section Plots
- Plots time-section (time/lat or time/lon) of daily data
|
 |
Non-Gridded Climate Datasets
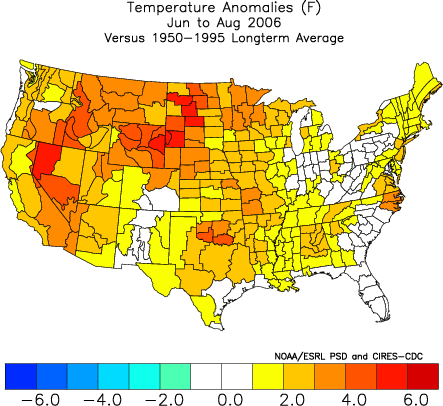
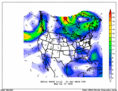
- US Climate Division Maps
- Plots monthly and seasonal composites of US climate Division Data (temperature, precipitation and PDSI). Plots means, long-term means and anomalies and rankings.
|
 |
Timeseries Data
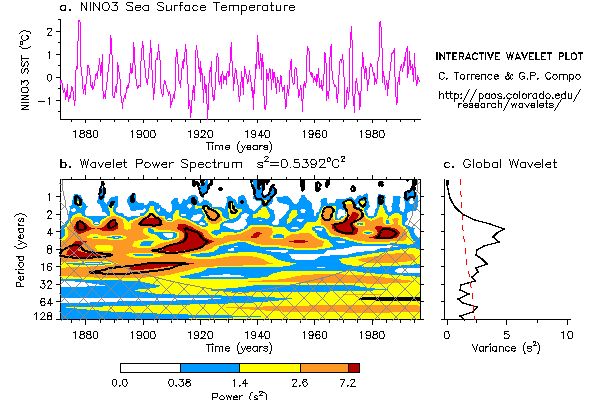
- Wavelets
- Calculates Wavelet analysis of ocean/atmosphere and user time-series. Choose interactive plot from main menu.
|
 |
- Obtain Monthly/Seasonal Time-series
- Obtain Monthly or seasonal time-series from a subset of PSL's datasets
|
Obtain Timeseries |
- US Station Climatologies
- Point and Click or text interfaces to United States station data climatologies of temperature, precipitation and other variables where available.
|
 |
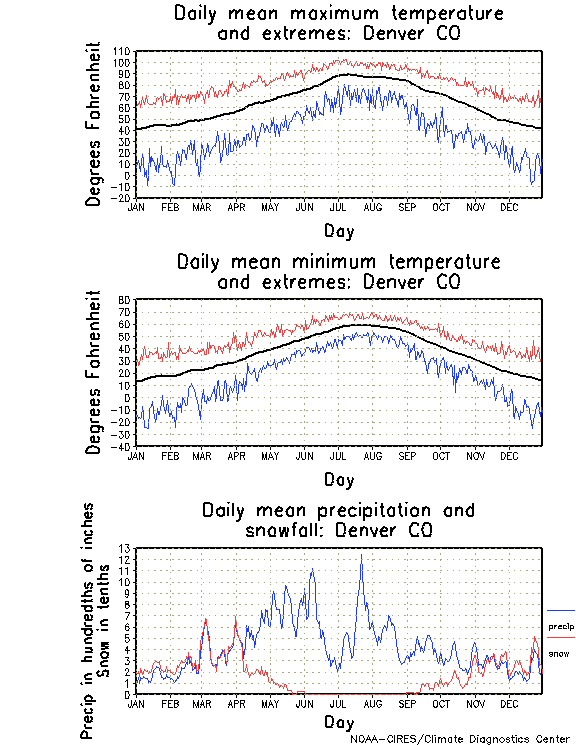
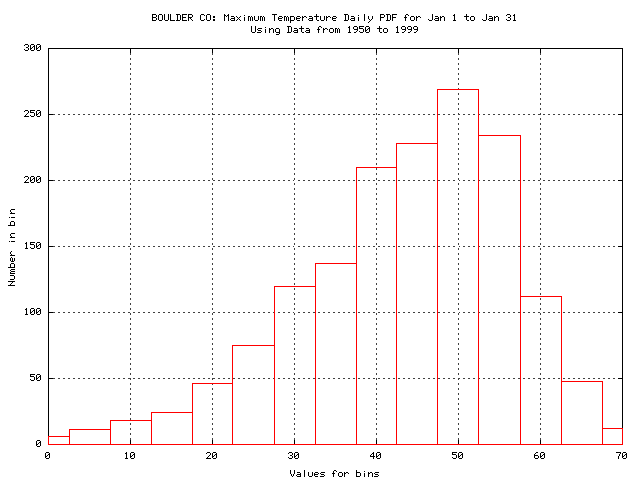
- Daily US Station Data
- Select US cities by state for data from 1950-1999. Timeseries plots, climatologies and data distributions available for temperature(max,min) and precipitation. Some analysis and statistics available.
|
 |
Climate Process Analysis
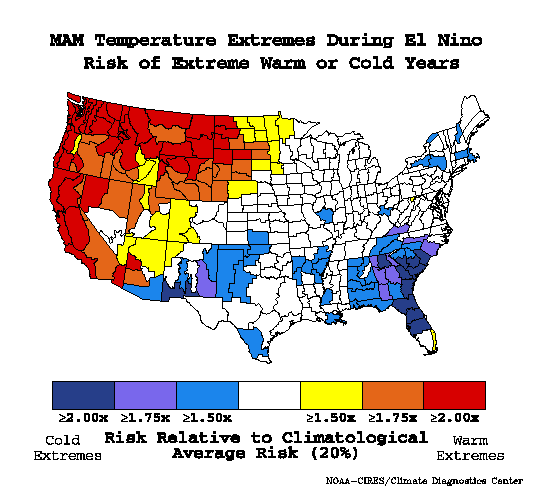
- ENSO Climate Risks
- Displays historical seasonal United States temperature/precipitation odds during El Niño or La Niña events
|
 |
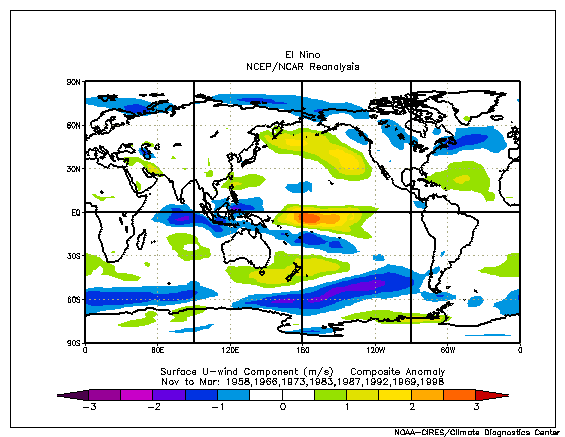
- ENSO Climate Comparisons
- Displays El Niño and La Niña averages of different climate variables for winter and summer and for the entire globe or just the US.
|
 |
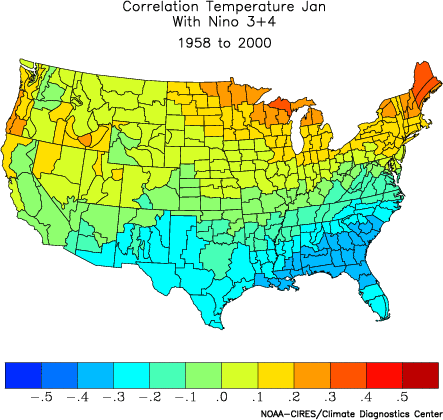
- US Climate Division Correlations
- Obtain maps of correlations with monthly mean or seasonal US Climate Division Data. Use provided atmosphere/ocean time-series like PNA or Niña 3.4
|
 |
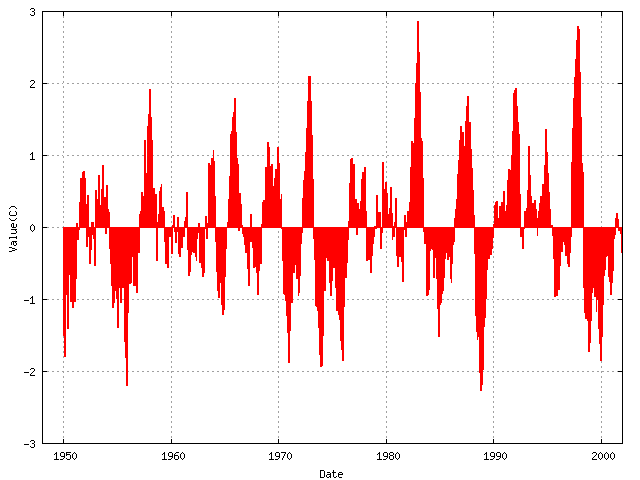
- Climate Indices
- Plot monthly ocean/atmospheric time-series.
|
 |