El Niño Index Dashboard
ENSO is a phenomenon which extends over large spatial area and can have a different seasonal evolution from event to event. The different patterns have implications for climate impacts both locally and at a distance.
The following indices all help characterize El Niño but at different locations and time scales. See the PSL news story on flavors of ENSO and the web page that analyzes and compares time series. There is also a La Niña Dashboard looking at the recent index values and comparing them to historic La Niña events.
There are two products available: (1) Plots of the progression of the current event compared to historic El Niño events. There is a shorter time-series (1948 onward) index section and a longer (1870 onward) one. There are fewer time series that cover from 1870 to present. (2) Time-series plots of various El Niño indices. Note: El Niño events are selected using the MEI.ext and the ERSST V5 SST datasets as a guide (See the event year lists).
Select a tab to view the comparisons and time-series
| These plots show current values of various indices vs. seven events since 1948. | ||||
| Name | Description | Current Value vs. Historic El Niño Events |
Latest Value | Date |
|---|---|---|---|---|
MEI V2 |
Multi-variate ENSO Index which uses SST, winds, SLP, and OLR. It is calculated using the JRAQ-3 reanalysis dataset and the NCEI OLR. Produced at NOAA PSL. | 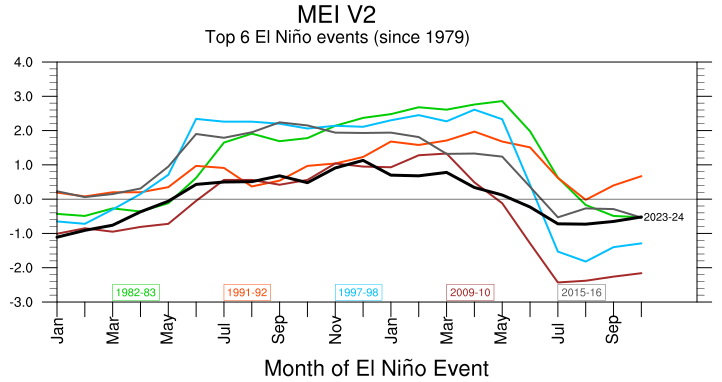 |
1.52 | Jun 2026 |
Niño 4 |
Niño 4 SST Index: SST anomalies averaged over the NINO4 region 5°North-5°South; 160°East-150°West (western most of Niño indices). Total SSTs also available for this region. Calculated from the Monthly NOAA ERSST V5 (at NOAA/CPC). | 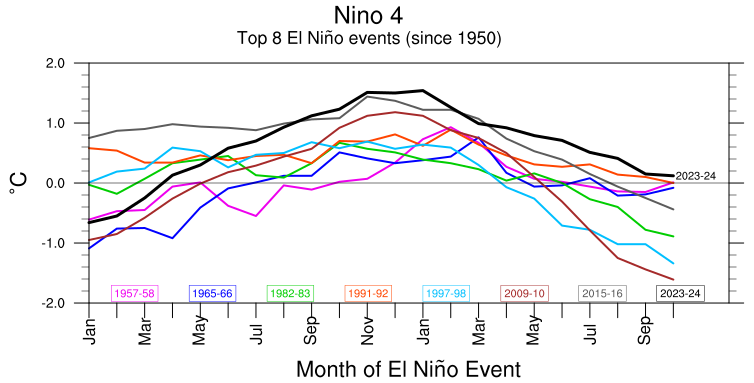 |
1.22 | Jun 2026 |
Niño 3.4 |
Niño 3.4 SST Index: SST anomalies averaged over the NINO34 region 5°North-5°South;170-120°West. Total SSTs also available for this region. Correlates well with teleconnections to North America. Calculated from the Monthly NOAA ERSST V5 (at NOAA/CPC). | 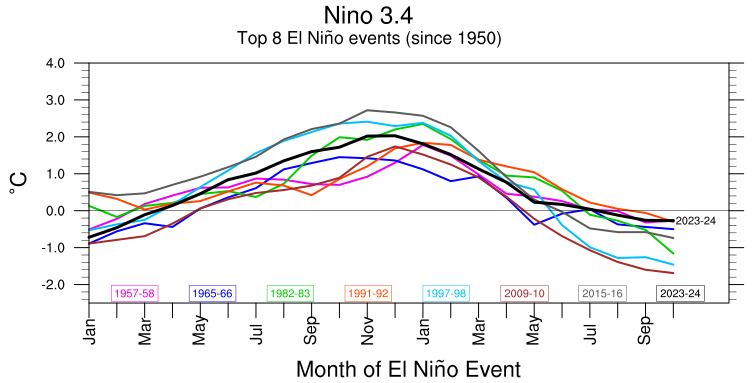 |
1.44 | Jun 2026 |
Niño 3 |
Niño 3 SST Index: SST anomalies averaged over the NINO3 region 5°North-5°South;150°West-90°West. Total SSTs also available for this region. Calculated from the Monthly NOAA ERSST V5 (at NOAA/CPC). | 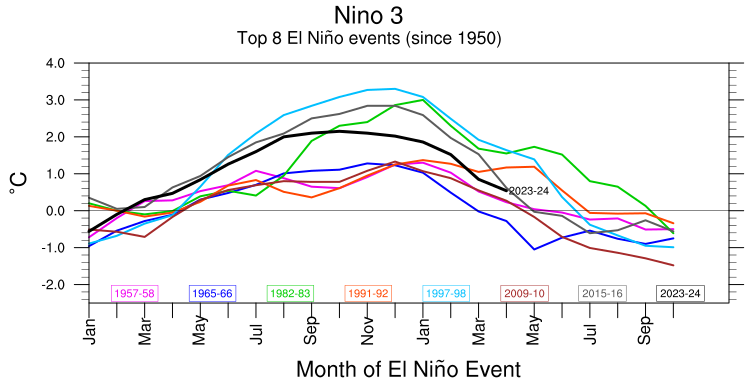 |
1.71 | Jun 2026 |
Niño 1+2 |
Niño 1+2 SST Index: SST anomalies averaged over the NINO1 and NINO2 regions 0-10°South;90°West-80°West (eastern most of the Niña indices). Total SSTs also available for this region. Calculated from the Monthly ERSST V5 (at NOAA/CPC). | 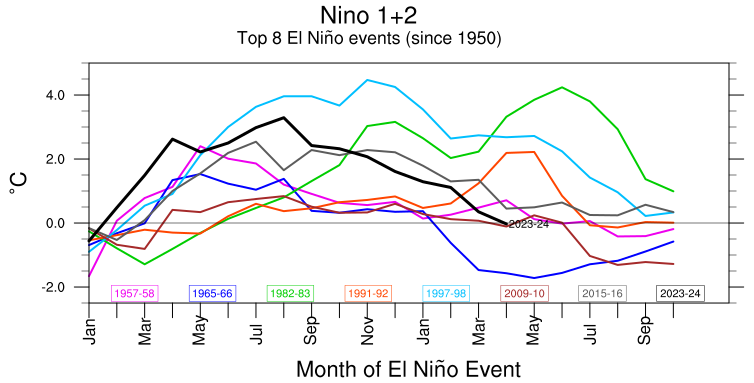 |
2.82 | Jun 2026 |
RONI |
Relative Oceanic Niño Index: 3 month running mean of ERSST.v5 SST anomalies in the Niño 3.4 region (5°N-5°S, 120°-170°W) Calculated from the ERSST V5 (at NOAA/CPC). |  |
0.50 | May 2026 |
ONI |
Oceanic Niño Index: 3 month running mean of ERSST.v5 SST anomalies in the Niño 3.4 region (5°N-5°S, 120°-170°W) Calculated from the ERSST V5 (at NOAA/CPC). | 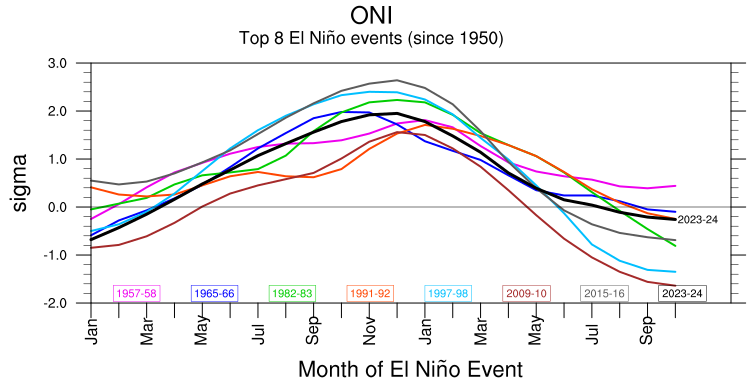 |
0.98 | May 2026 |
BEST |
Bivariate El Niño-Southern Oscillation Index: The Niño 3.4 SST and SOI are normalized and combined. SST is from the HadISST1.1. SOI is from NOAA/CPC. Produced at NOAA PSL. | 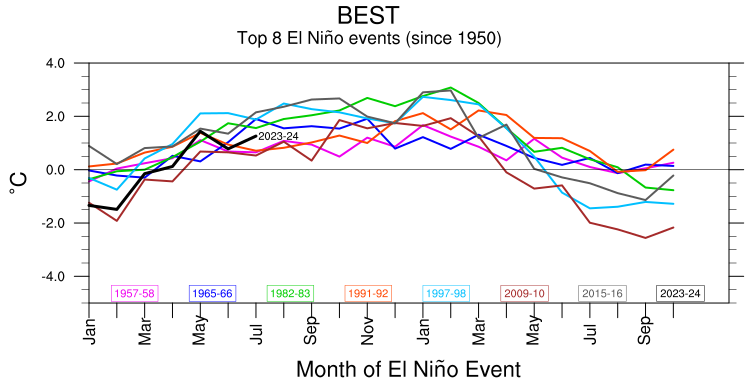 |
1.60 | May 2026 |
SOI |
Southern Oscillation Index: Difference between standardized Darwin and standardized Tahiti surface pressure values. It represents the atmospheric component of the ENSO. The sign is opposite that of the Nino indices and it is noisier than those indices. From NOAA/CPC | 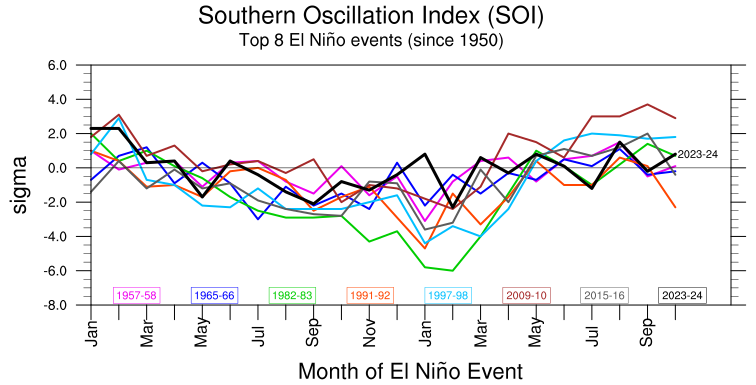 |
-2.40 | Jun 2026 |
THA |
20C Thermocline Depth Anomaly at 95W:0N: Anomaly from 1981-2010 mean of the depth of the 20C Thermocline Depth from the ORAS5 dataset. |  |
45.71 | May 2026 |
CTI |
Cold Tongue Anomaly Tropical Pacific: Anomaly from 1981-2010 mean of the cold tongue temperature from the NOAA ERSST v5 dataset. |  |
0.93 | Jun 2026 |
TNI |
Trans-Niño Index: Standardized Niño 1+2 minus the Niño 4 with a 5 month running mean applied (restandardized). It represents the gradient of the SST in the ENSO region of the tropical Pacific. Calculated from the Month HadISST1.1 dataset. | 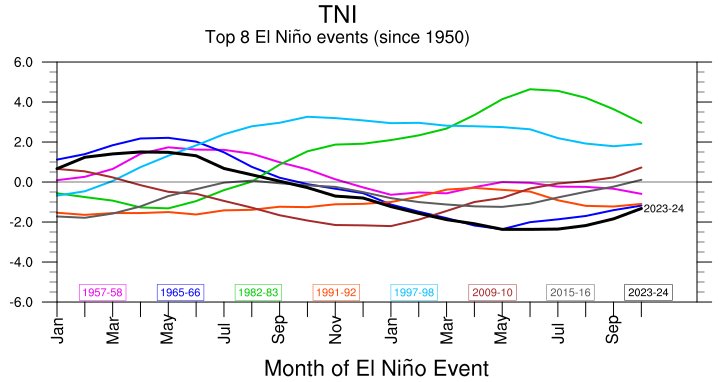 |
-0.44 | Mar 2026 |
PDO |
Pacific Decadal Oscillation: leading principal component of monthly SST anomalies in the North Pacific Ocean, poleward of 20N (global SST mean removed). Calculated from the NOAA ERSSTV5, COBE SST, and HadISST1.1 (NOAA/PSL). | 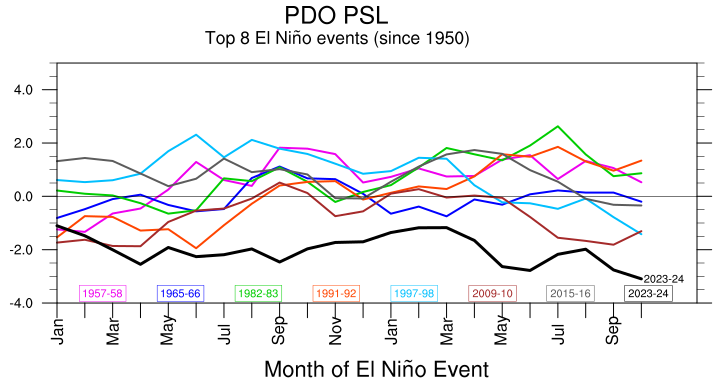 |
-1.22 | Apr 2026 |
PNA |
Pacific North American Pattern. The PNA is one of the most prominent modes of extratropical variability in the northern Hemisphere. This version is calculated at NOAA/CPC. It is based on EOF's calculated from month anomalies of 500mb height from the NCEP Reanalysis. | 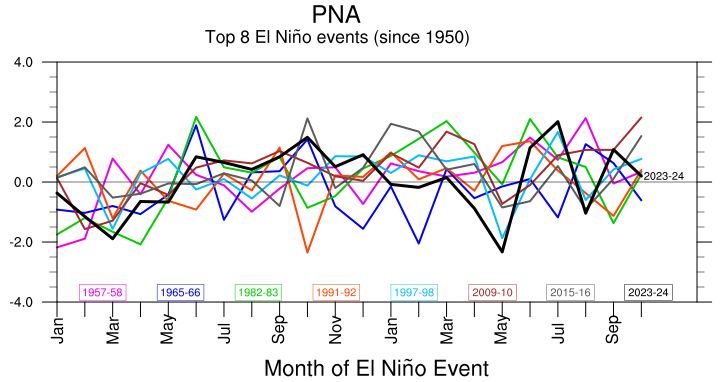 |
-0.42 | Jun 2026 |
OLR |
Central Equatorial Pacific Outgoing Longwave Radiation (OLR) area averages over the central equatorial Pacific (160°E-160°W). OLR is a good measure of convection. Negative OLR represents increased convention. Calculated at NOAA/CPC. | 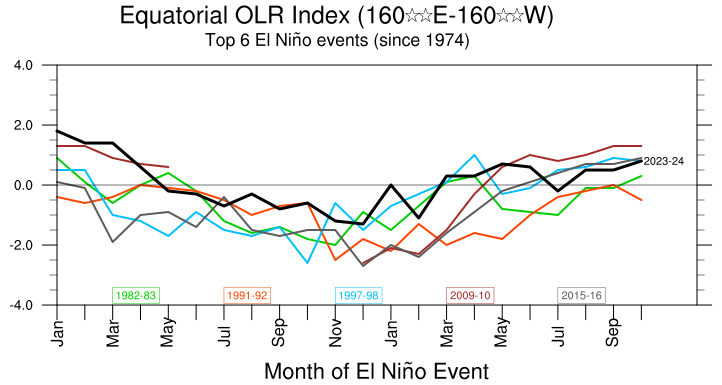 |
-1.10 | Jun 2026 |
Heat Content |
Tropical Pacific 0-300m integrated temperature anomalies 160°E–80°W. Calculated at NOAA/CPC from the GODAS dataset. | 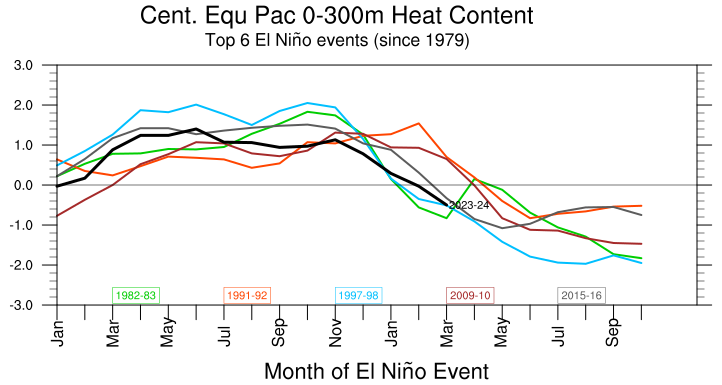 |
2.14 | Jun 2026 |
200mb Zonal Winds |
Tropical Pacific 200mb Zonal Wind anomalies 2.5S-2.5N; 165W-110W. Calculated at NOAA/PSL from the CORe. | 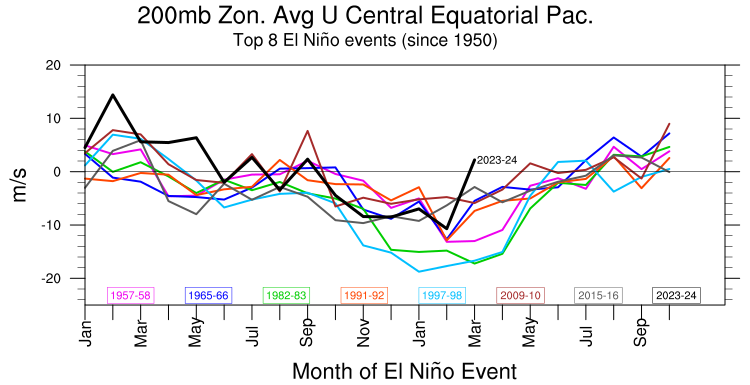 |
-4.87 | May 2026 |
| These plots show current 2025/26 event values of various indices vs eight events since 1870. | ||||
| Name | Description | Current value vs Historic El Niiño Events | Latest Value | Date |
|---|---|---|---|---|
Niño 4 |
Niño 4 SST Index: SST anomalies averaged over the NINO4 region 5°North-5°South; 160°East-150°West (western most of Niño indices). Total SSTs also available for this region. Calculated from the Monthly NOAA ERSST V5 (at NOAA/CPC). | 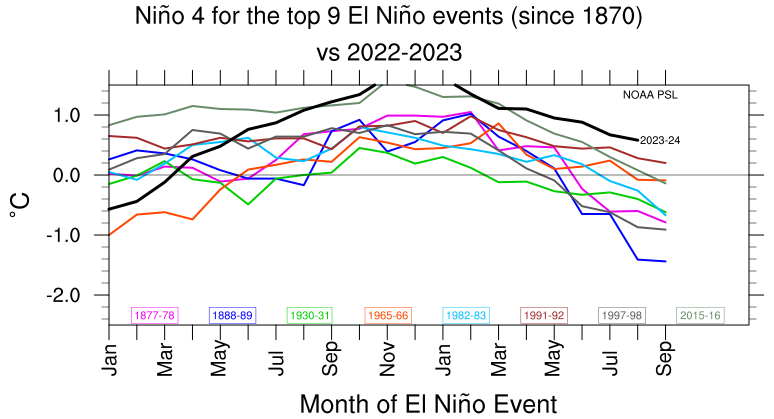 |
1.39 | Jun 2026 |
Niño 3.4 |
Niño 3.4 SST Index: SST anomalies averaged over the NINO34 region 5°North-5°South;170-120°West. Total SSTs also available for this region. Correlates well with teleconnections to North America. Calculated from the Monthly NOAA ERSST V5 (at NOAA/CPC). | 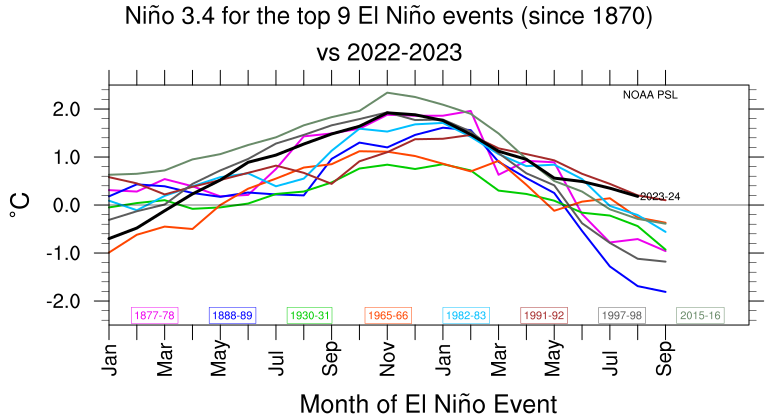 |
1.51 | Jun 2026 |
Niño 3 |
Niño 3 SST Index: SST anomalies averaged over the NINO3 region 5°North-5°South;150°West-90°West. Total SSTs also available for this region. Calculated from the Monthly NOAA ERSST V5 (at NOAA/CPC). | 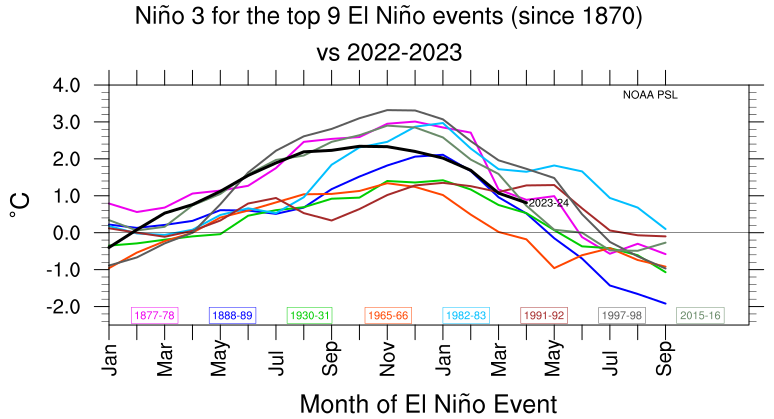 |
1.84 | Jun 2026 |
Niño 1+2 |
Niño 1+2 SST Index: SST anomalies averaged over the NINO1 and NINO2 regions 0-10°South;90°West-80°West (eastern most of the Niña indices). Total SSTs also available for this region. Calculated from the Monthly ERSST V5 (at NOAA/CPC). | 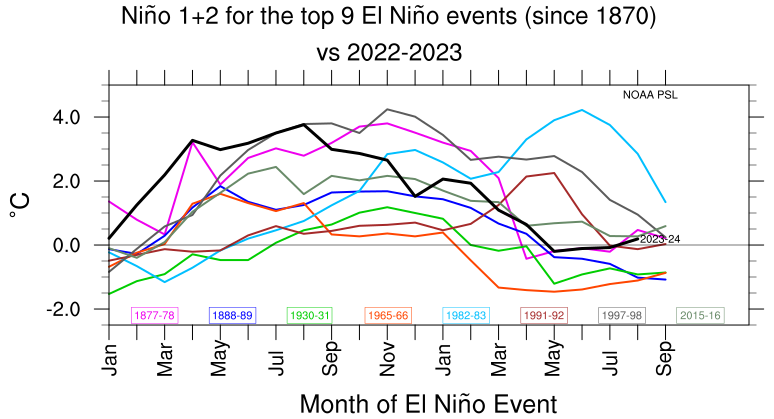 |
2.79 | Jun 2026 |
CTI |
Cold Tongue Anomaly Tropical Pacific: Anomaly from 1981-2010 mean of the cold tonge temperature from the NOAA ERSST v5 dataset. |  |
0.93 | Jun 2026 |
TNI |
Trans-Niño Index: Standardized Niño 1+2 minus the Niño 4 with a 5 month running mean applied (restandardized). It represents the gradient of the SST in the ENSO region of the tropical Pacific. Calculated from the Monthly HadISSTV1.1 dataset. | 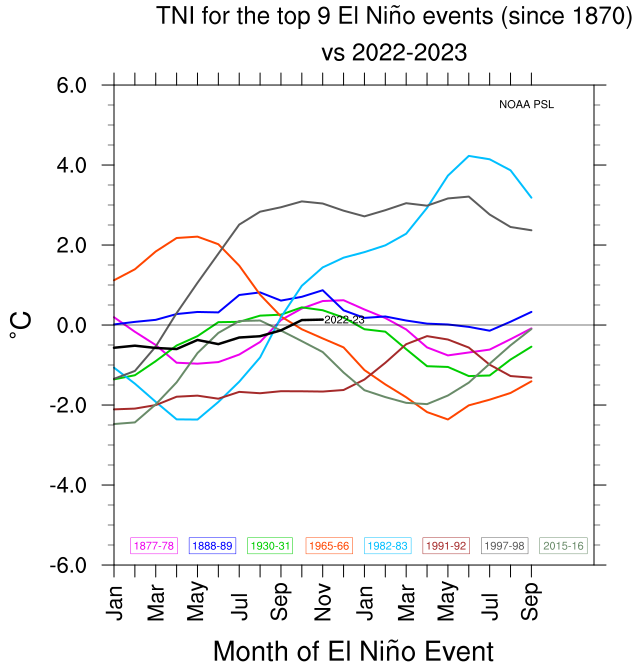 |
-0.44 | Mar 2026 |
| These plots show time-series plots of the monthly values from 1948 to present for the set of ENSO indices. Click plots to enlarge. | ||||
| Name | Description | Time Series | Latest Value | Latest date |
|---|---|---|---|---|
MEI V2 |
Multi-variate ENSO Index which uses SST, winds, SLP, and OLR. It is calculated using the JRAQ-3 reanalysis dataset and the NCEI OLR. Produced at NOAA PSL. | 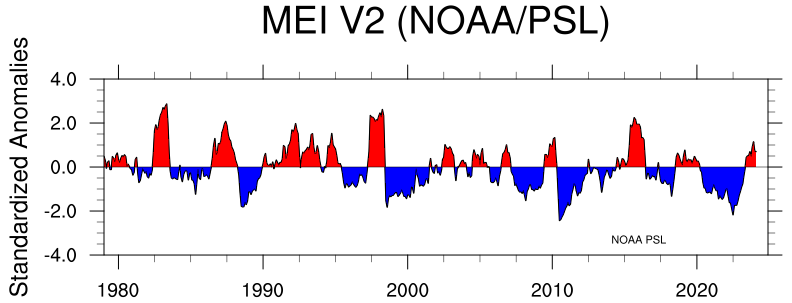 |
1.52 | Jun 2026 |
Niño 4 |
Niño 4 SST Index: SST anomalies averaged over the NINO4 region 5°North-5°South; 160°East-150°West (western most of Niño indices). Total SSTs also available for this region. Calculated from the Monthly NOAA ERSST V5 (at NOAA/CPC). | 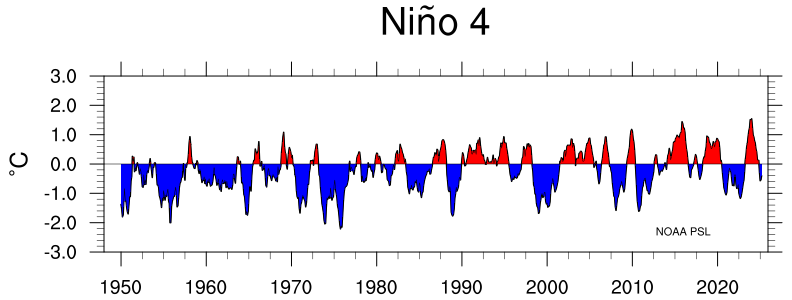 |
1.22 | Jun 2026 |
Niño 3.4 |
Niño 3.4 SST Index: SST anomalies averaged over the NINO34 region 5°North-5°South;170-120°West. Total SSTs also available for this region. Correlates well with teleconnections to North America. Calculated from the Monthly NOAA ERSST V5 (at NOAA/CPC). | 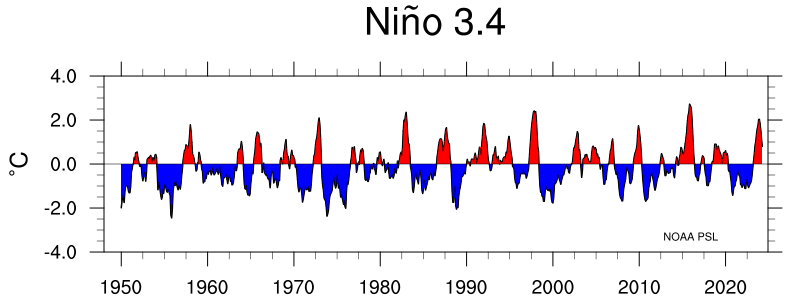 |
1.44 | Jun 2026 |
Niño 3 |
Niño 3 SST Index: SST anomalies averaged over the NINO3 region 5°North-5°South;150°West-90°West. Total SSTs also available for this region. Calculated from the Monthly NOAA ERSST V5 (at NOAA/CPC). | 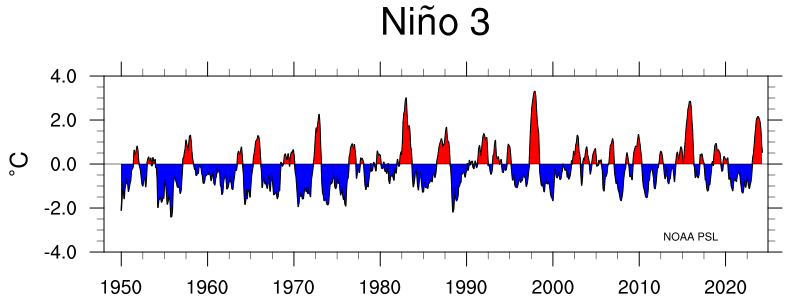 |
1.71 | Jun 2026 |
Niño 1+2 |
Niño 1+2 SST Index: SST anomalies averaged over the NINO1 and NINO2 regions 0-10°South;90°West-80°West (eastern most of the Niña indices). Total SSTs also available for this region. Calculated from the Monthly ERSST V5 (at NOAA/CPC). | 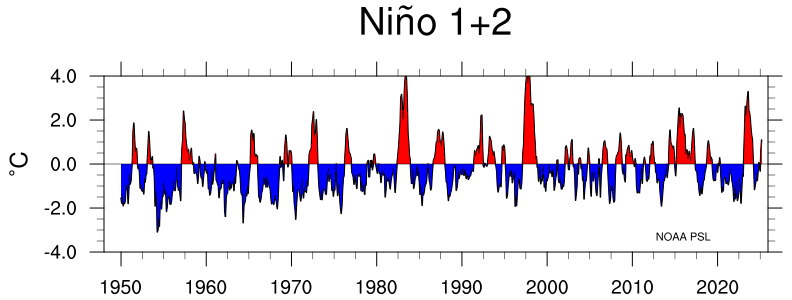 |
2.82 | Jun 2026 |
RONI |
Relative Oceanic Niño Index: 3 month running mean of ERSST.v5 SST anomalies in the Niño 3.4 region (5°N-5°S, 120°-170°W) Calculated from the ERSST V5 (at NOAA/CPC). |  |
0.50 | May 2026 |
ONI |
Oceanic Niño Index: 3 month running mean of ERSST.v5 SST anomalies in the Niño 3.4 region (5°N-5°S, 120°-170°W) Calculated from the ERSST V5 (at NOAA/CPC). | 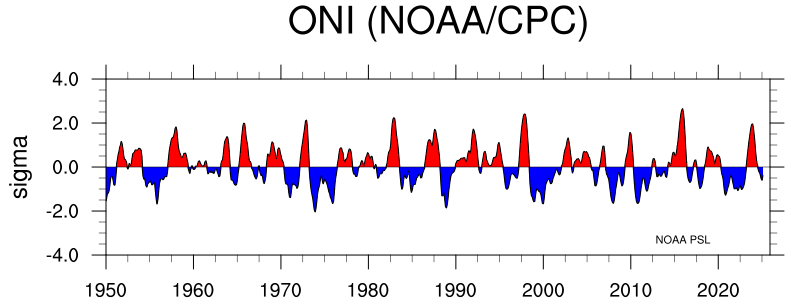 |
0.98 | May 2026 |
BEST |
Bivariate El Niño-Southern Oscillation Index: The Niño 3.4 SST and SOI are normalized and combined. SST is from the HadISST1.1. SOI is from NOAA/CPC. Produced at NOAA PSL. | 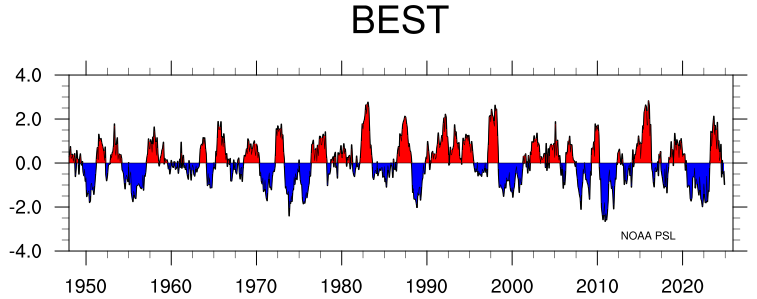 |
1.60 | May 2026 |
SOI |
Southern Oscillation Index: Difference between standardized Darwin and standardized Tahiti surface pressure values. It represents the atmospheric component of the ENSO. The sign is opposite that of the Nino indices and it is noisier than those indices. From NOAA/CPC | 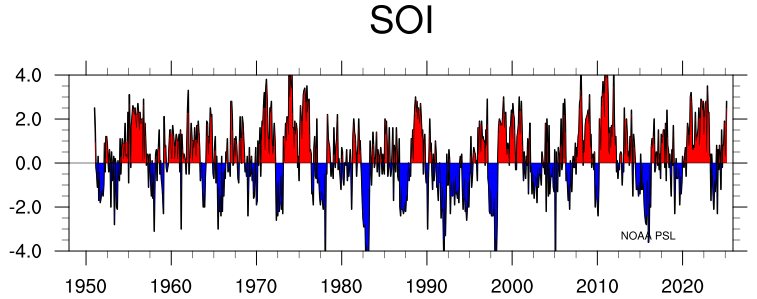 |
-2.40 | Jun 2026 |
THA |
20C Thermocline Depth Anomaly at 95W:0N: Anomaly from 1981-2010 mean of the depth of the 20C Thermocline Depth from the ORAS5 dataset. |  |
45.71 | May 2026 |
TNI |
Trans-Niño Index: Standardized Niño 1+2 minus the Niño 4 with a 5 month running mean applied (restandardized). It represents the gradient of the SST in the ENSO region of the tropical Pacific. Calculated from the Monthly HadISST1.1 dataset. | 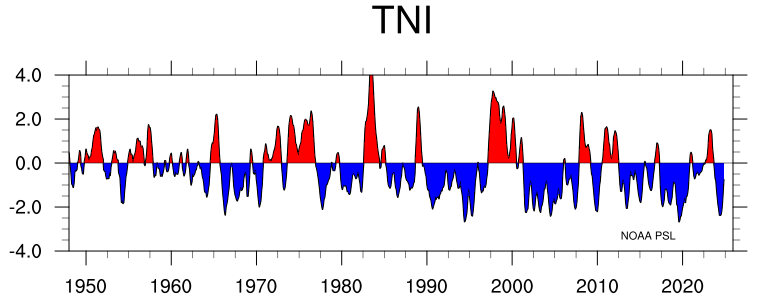 |
-0.44 | Mar 2026 |
CTI |
Cold Tongue Anomaly Tropical Pacific: Anomaly from 1981-2010 mean of the cold tonge temperature from the NOAA ERSST v5 dataset. |  |
0.93 | Jun 2026 |
PDO |
Pacific Decadal Oscillation: leading principal component of monthly SST anomalies in the North Pacific Ocean, poleward of 20N (global SST mean removed). Calculated from the NOAA ERSSTV5, COBE SST, and HadISST1.1 (NOAA/PSL). | 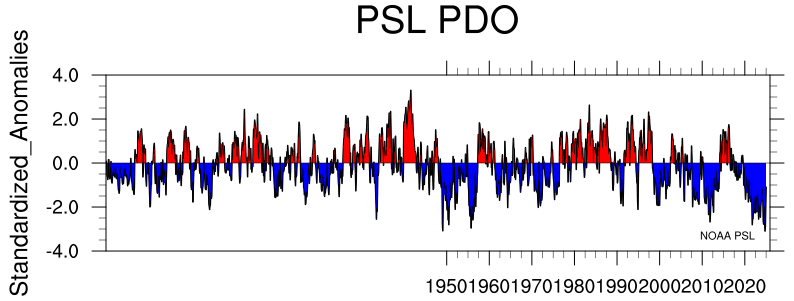 |
-1.22 | Apr 2026 |
PNA |
Pacific North American Pattern. The PNA is one of the most prominent modes of extratropical variability in the northern Hemisphere. This version is calculated at NOAA/CPC. It is based on EOF's calculated from monthly anomalies of 500mb height from the NCEP Reanalysis. | 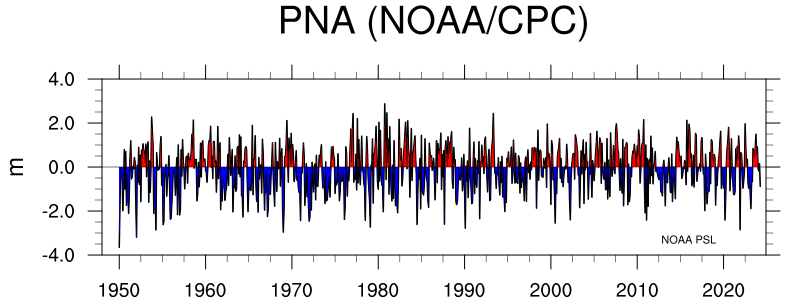 |
-0.42 | Jun 2026 |
OLR |
Central Equatorial Pacific Outgoing Longwave Radiation (OLR) area averages over the central equatorial Pacific (160°E-160°W). OLR is a good measure of convection. Negative OLR represents increased convention. Calculated at NOAA/CPC. | 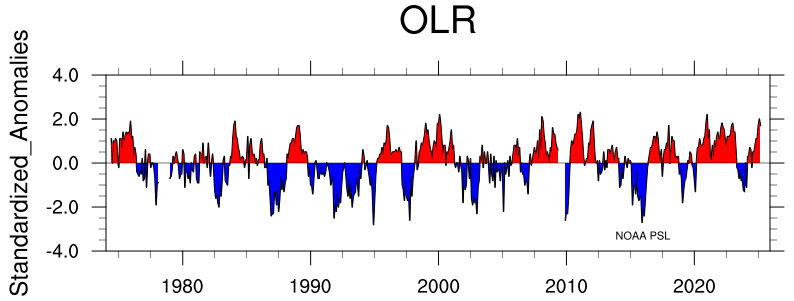 |
-1.10 | Jun 2026 |
Heat Content |
Tropical Pacific 0-300m integrated temperature anomalies 160°E–80°W. Calculated at NOAA/CPC from the GODAS dataset. | 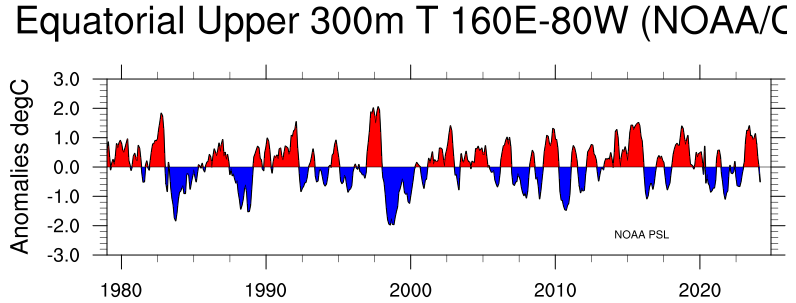 |
2.14 | Jun 2026 |
200mb Zonal Winds |
Tropical Pacific 200mb Zonal Wind anomalies 2.5S-2.5N; 165W-110W. Calculated at NOAA/PSL from the CORe Reanalysis. | 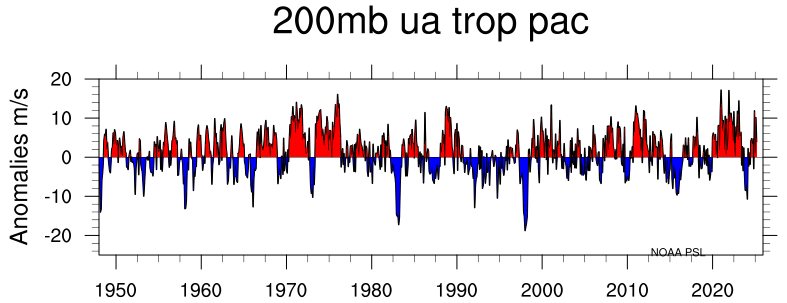 |
-4.87 | May 2026 |
| These plots show time-series plots of the monthly values from 1870 to present for the set of ENSO indices. Click plots to enlarge | ||||
| Name | Description | Time Series | Latest Value | Latest date |
|---|---|---|---|---|
Niño 4 |
Niño 4 SST Index: SST anomalies averaged over the NINO4 region 5°North-5°South; 160°East-150°West (western most of Niño indices). Total SSTs also available for this region. Calculated from the Monthly NOAA ERSST V5 (at NOAA/CPC). | 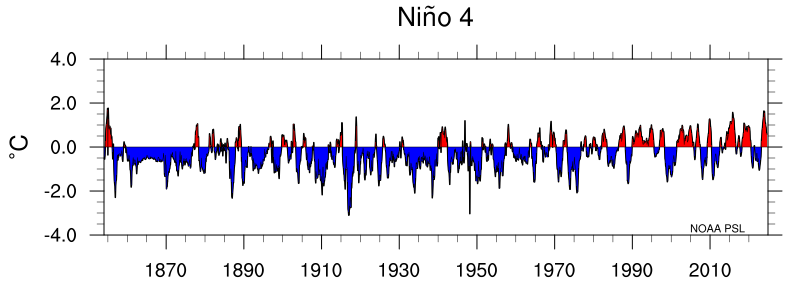 |
1.39 | Jun 2026 |
Niño 3.4 |
Niño 3.4 SST Index: SST anomalies averaged over the NINO34 region 5°North-5°South;170-120°West. Total SSTs also available for this region. Correlates well with teleconnections to North America. Calculated from the Monthly NOAA ERSST V5 (at NOAA/CPC). | 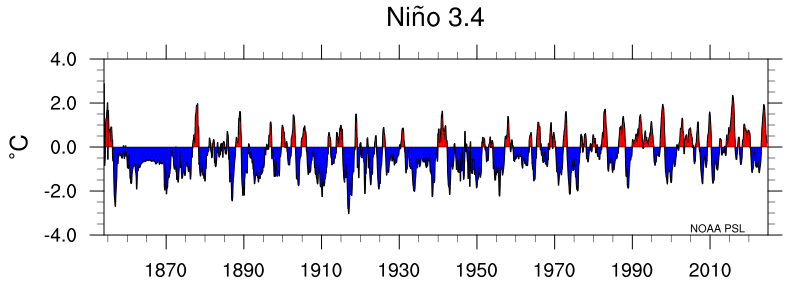 |
1.51 | Jun 2026 |
Niño 3 |
Niño 3 SST Index: SST anomalies averaged over the NINO3 region 5°North-5°South;150°West-90°West. Total SSTs also available for this region. Calculated from the Monthly NOAA ERSST V5 (at NOAA/CPC). | 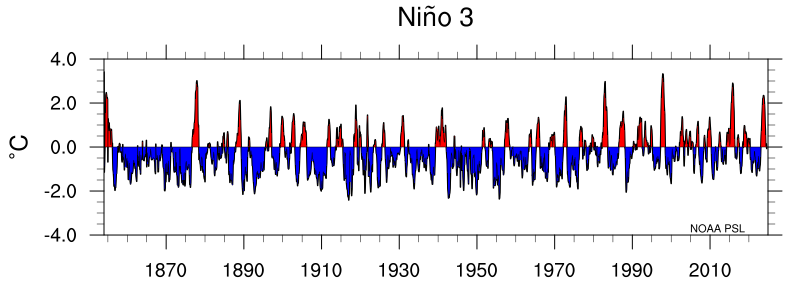 |
1.84 | Jun 2026 |
Niño 1+2 |
Niño 1+2 SST Index: SST anomalies averaged over the NINO1 and NINO2 regions 0-10°South;90°West-80°West (eastern most of the Niña indices). Total SSTs also available for this region. Calculated from the Monthly ERSST V5 (at NOAA/CPC). | 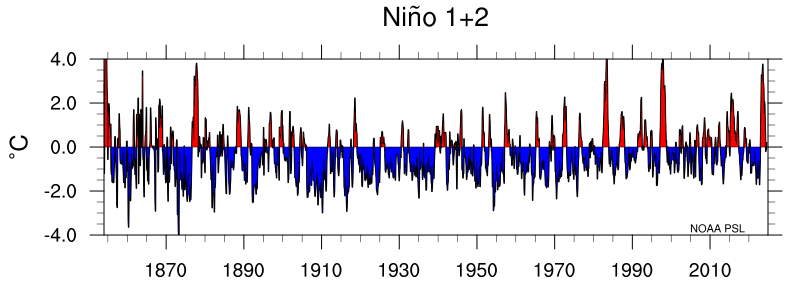 |
2.79 | Jun 2026 |
TNI |
Trans-Niño Index: Standardized Niño 1+2 minus the Niño 4 with a 5 month running mean applied (restandardized). It represents the gradient of the SST in the ENSO region of the tropical Pacific. Calculated from the Monthly HadISSTV1.1 dataset. | 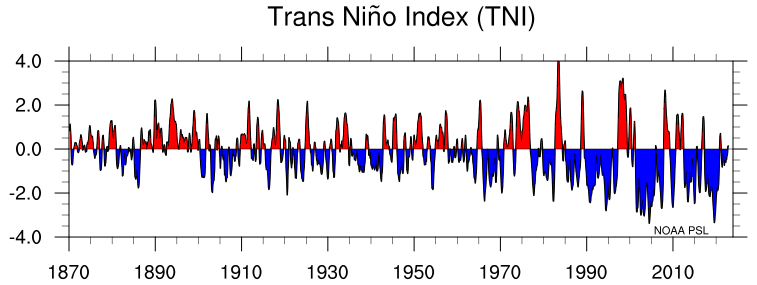 |
-0.44 | Mar 2026 |
CTI |
Cold Tongue Anomaly Tropical Pacific: Anomaly from 1981-2010 mean of the cold tonge temperature from the NOAA ERSST v5 dataset. |  |
0.93 | Jun 2026 |