Lesley L. Smith – Re. Wildland Fire Potential
All plots preliminary.
Re. Fire Weather and Vapor Pressure Deficit Prediction
VPD Prediction Preliminary ML Results: As of ~April 23, 2025
Week3 2007_VPD Week3 2015_VPD Week4 2007_VPD Week4 2015_VPD
Diffs Week3 2007_VPD Diffs Week3 2015_VPD Diffs Week4 2007_VPD Diffs Week4 2015_VPD
Results from ~April 9, 2025 here
For Reference:
2007_ERA5_VPD 2015_ERA5_VPD 2007_Reforecast_VPD 2015_Reforecast_VPD
ECMWF Reanalysis (ERA5) Data
ERA5 sample 2010 (first 1000 timesteps) VPD movie here
Largest Historical ConUS Fires (MTBS) and VPD (ERA5) for ignition days here
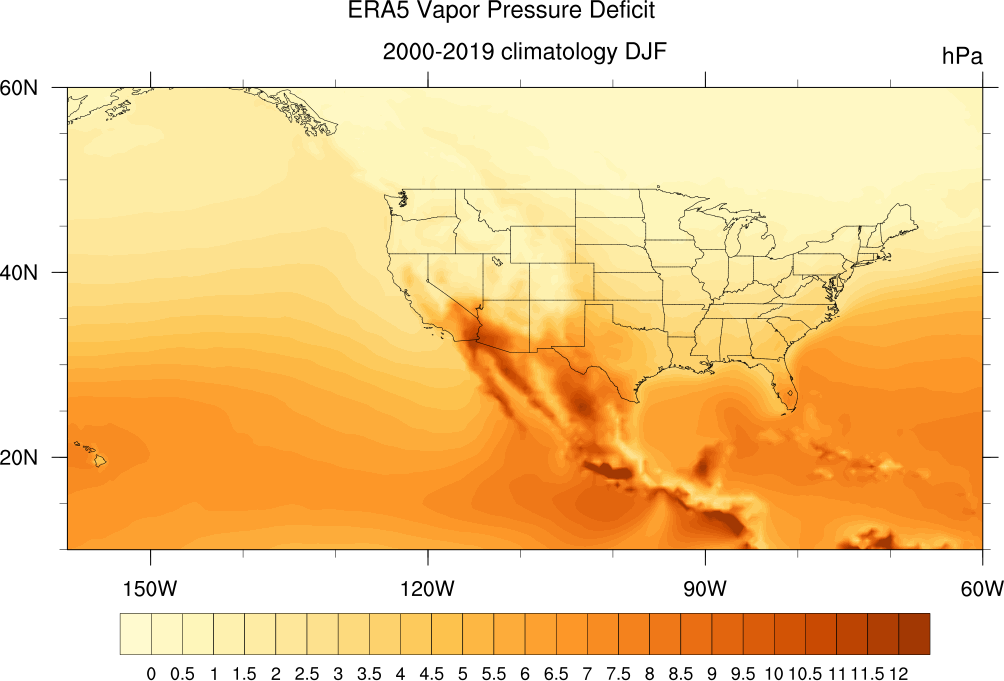
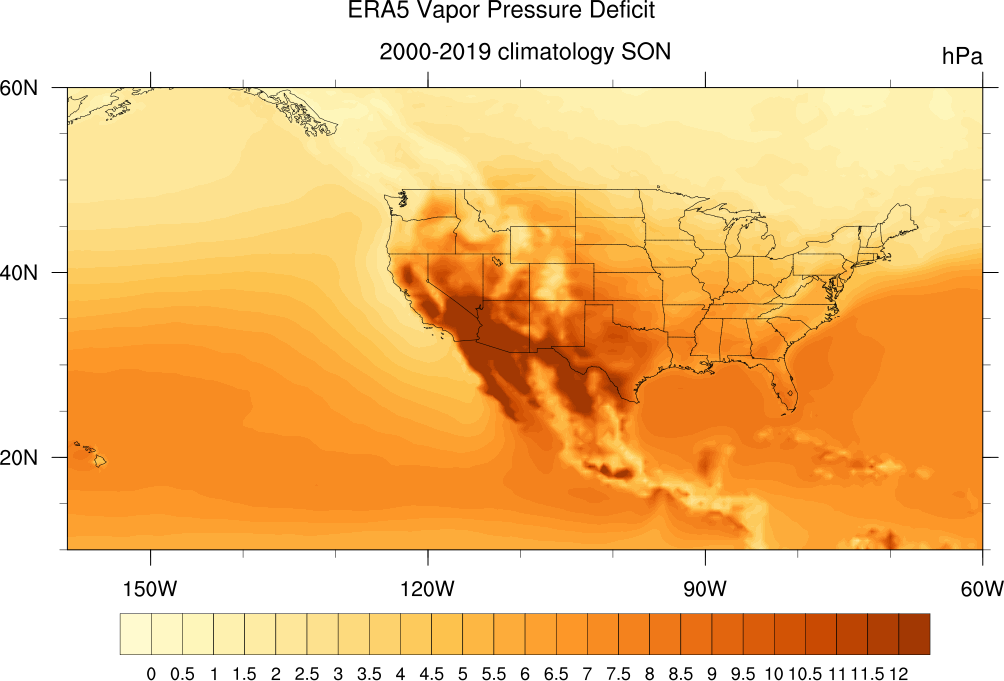
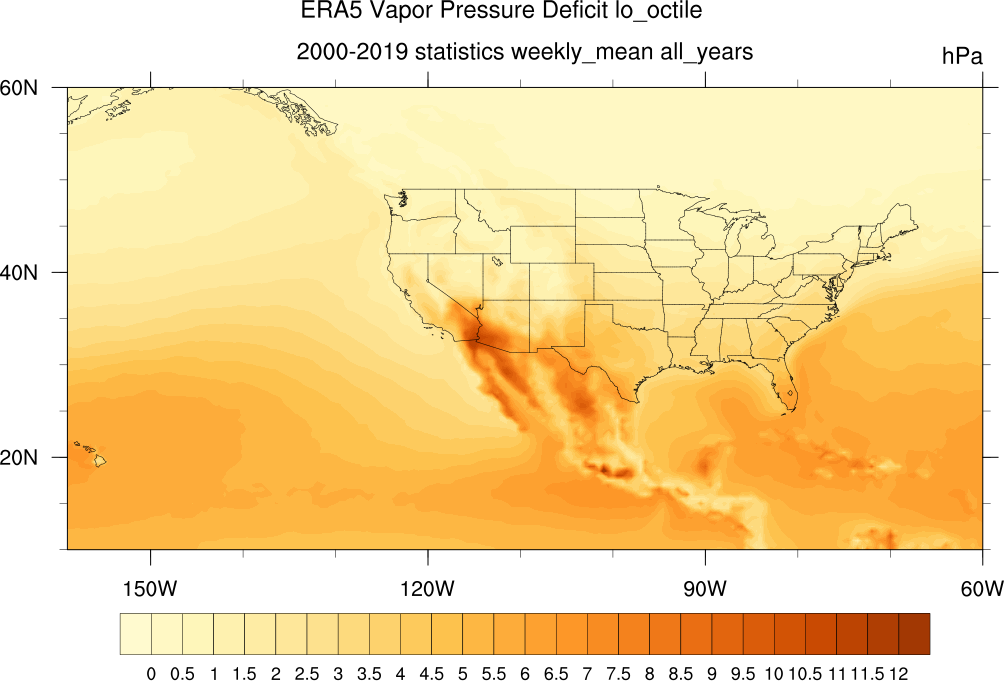
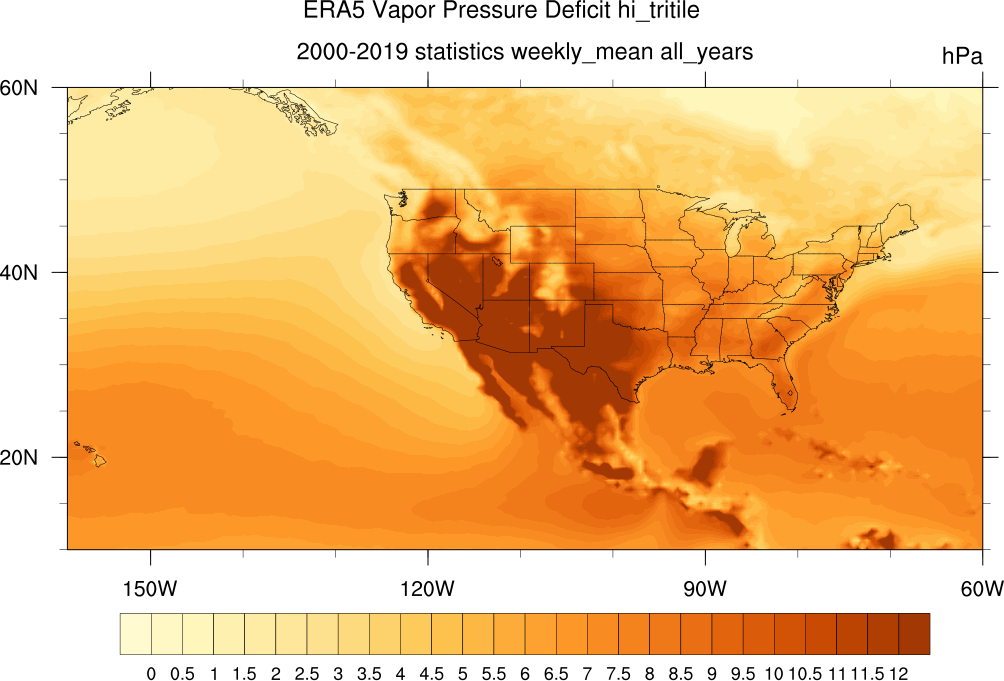
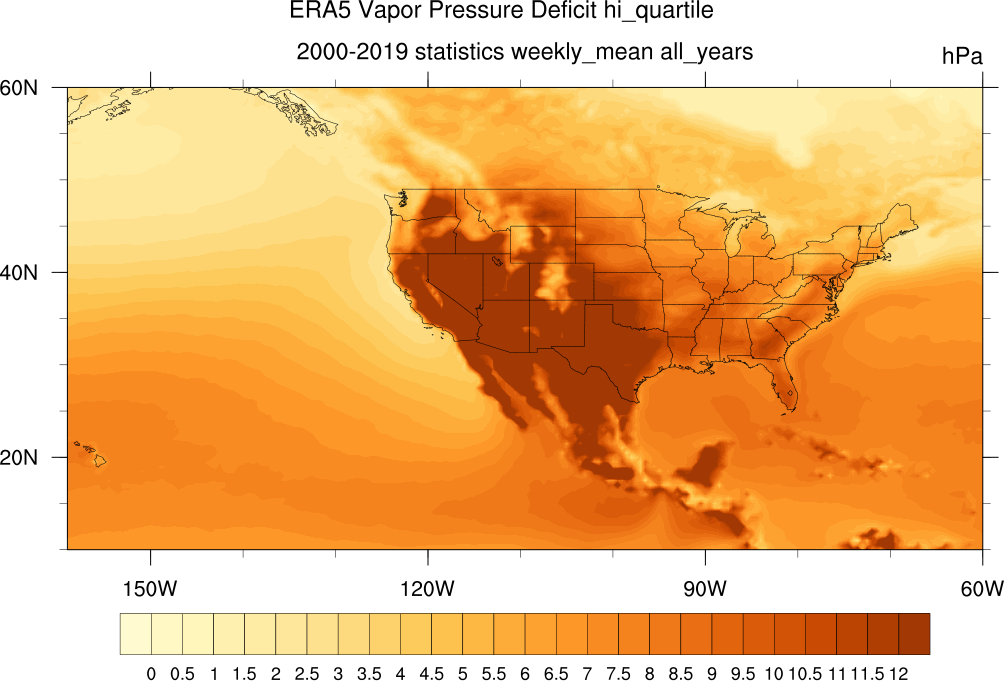
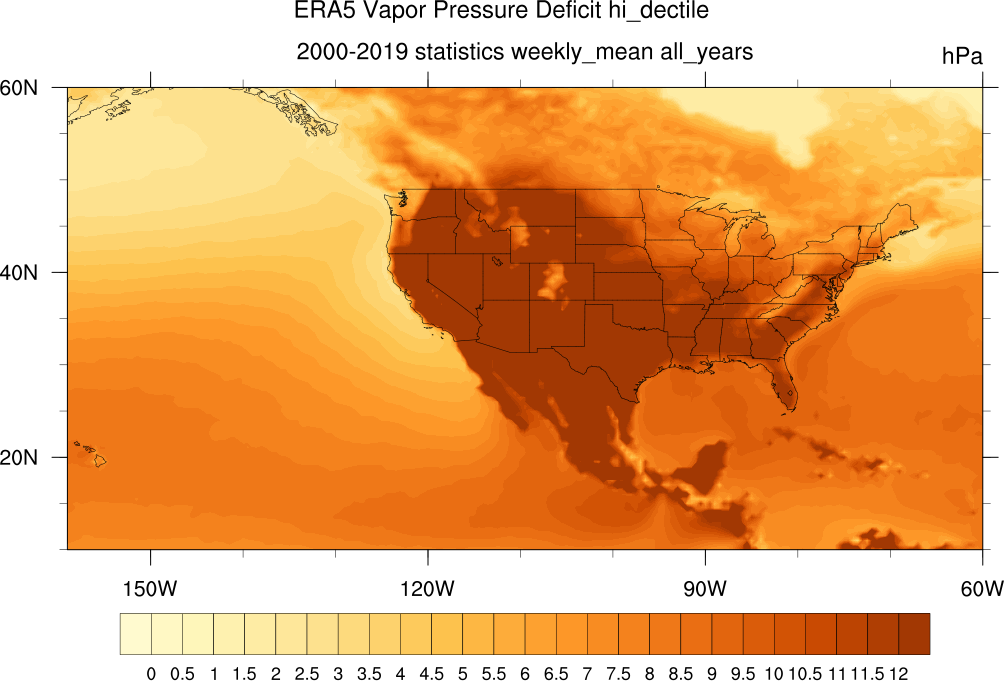
ERA5 VPD Seasonal Climatology 2000-2019:


ERA5 VPD Sample Seasonal Anomalies 2000:


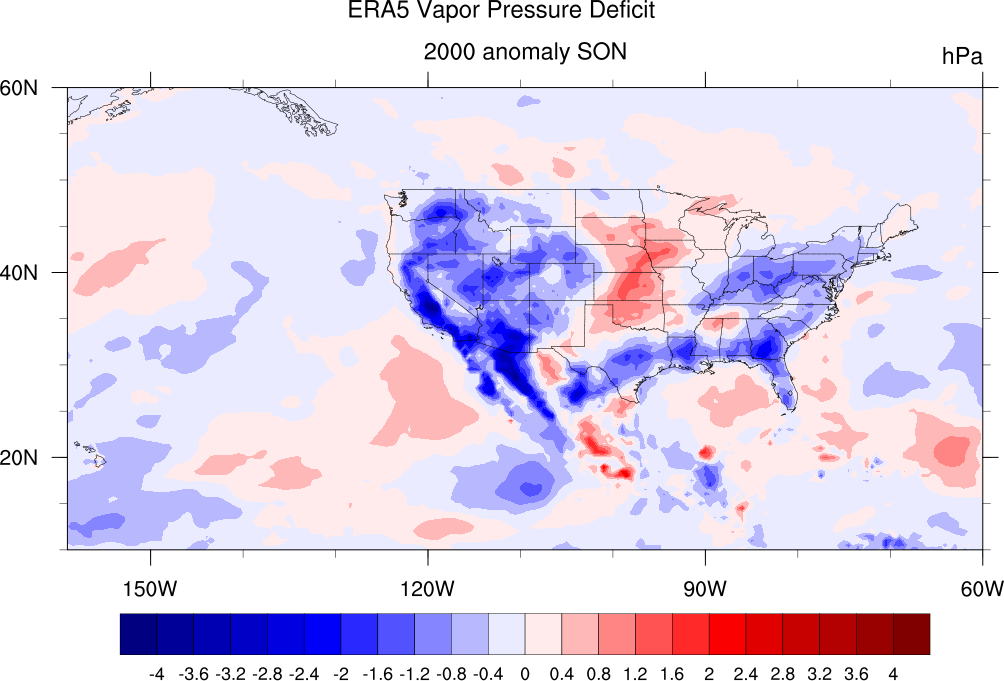
ERA5 VPD Seasonal Anomalies all years here.
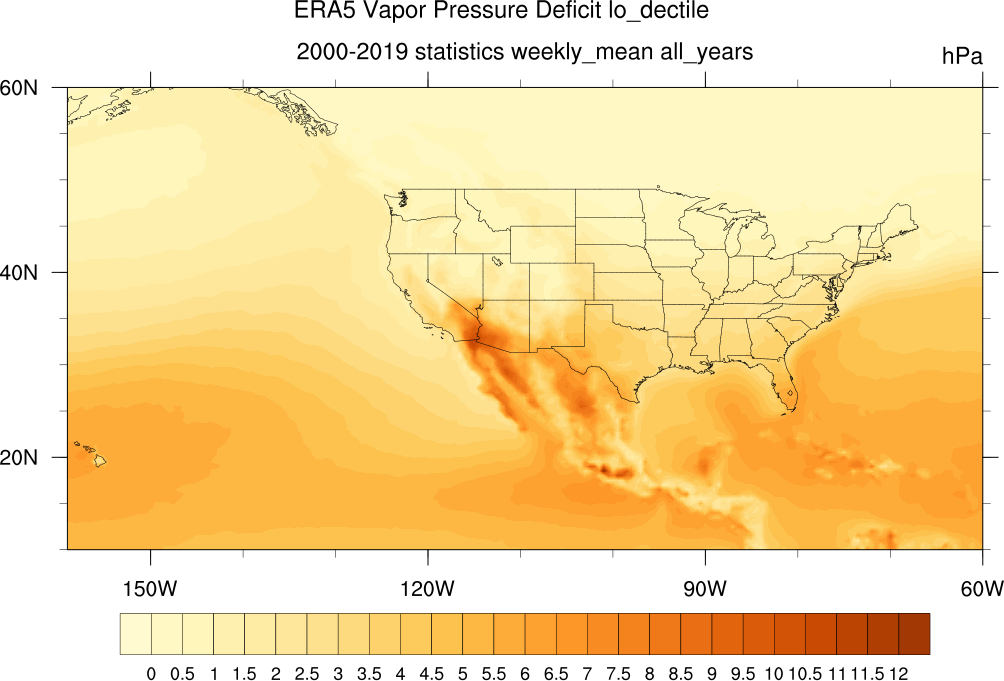
Some statistics on mean weekly ERA5 VPD:


GEFSv12 ReForecast Data
Downloaded GEFSv12 ReForecast Data includes Precipitation, Geopotential_Height at 200mb, 850mb, and surface,
Precipitable_Water, Soil Moisture, Specific Humidity at 200mb, 850mb, Temperature at 200mb, 850mb, and 2-meters, Zonal & Meridional Winds at 200mb, 850mb, Upward Longwave Radiation Flux, Snow Depth Water Equivalent.
Calculated ReForecast GEFSv12 Data includes Wind Speed at 200mb, 850mb, dew point temperature (via relative humidity), vapor pressure deficit
Note each ReForecast has one initiatiation Date with 00Z initiation time; each ReForecast has 11 ensemble members; each ReForecast has 140 6-hour-forecast increments.
Below are links to plots of weekly min, max, and mean for weeks 1,2,3,4 (where statistics performed over forecast_hours) for ensemble means and standard_deviations for various dates.
20000105
20000112
20000119
20000126
20000202
20000209
20000216
More dates available upon request.
GEFSv12 Forecast Data
GEFSv12 Forecast sample 20250202 VPD movie here
Downloaded Realtime GEFSv12 Forecast Data includes Precipitation, Dewpoint_Temperature, Geopotential_Height at 200mb, 850mb, and surface,
Precipitable_Water, Soil Moisture, Specific Humidity at 200mb, 850mb, Temperature at 200mb, 850mb, and 2-meters, Zonal & Meridional Winds at 200mb, 850mb, Upward Longwave Radiation Flux, Snow Depth Water Equivalent.
Calculated Realtime GEFSv12 Data includes Wind Speed at 200mb, 850mb, and Vapor Pressure Deficit.
Note each Forecast has one initiatiation Date with 00Z initiation time; each Forecast has 31 ensemble members; each Forecast has 140 6-hour-forecast increments.
Below are links to plots of weekly min, max, and mean for weeks 1,2,3,4 (where statistics performed over forecast_hours) for ensemble means and standard_deviations for various dates. Lag-0 cross-correlations with VPD are also performed (over all forecast_hours).
20250101
20250108
20250115
20250122
20250129
20250205
20250212
20250219
20250226
20250305
20250312
20250319
20250326
20250402
20250409
20250416
20250423
New plots added in realtime as data becomes available.