Distributions of Daily Meteorological Variables: Background
While the mean (average) of a set of meteorological variables is important to examine, understanding how variables in the atmosphere vary about that mean is also important. For example, we may see that the mean temperature at a location is the same for El Nino and La Nina. But, without full knowledge of the distribution, we cannot say whether there may be more extreme temperature days in El Nino vs La Nina. Or, we may be interested in predicting what the chances of freezing days are. To do that given a limited data record, we may have to make assumptions about the shape of the distribution.
Generally, Gaussianity is assumed (the "bell-shaped curve" for most distributions. Often meteorological data is normally distributed but the image below illustrate that is not always the case. The distribution of daily temperature for the grid at 40N, 255E illustrates a distribution that is heavily skew towards the left (cold). The green plot shows what the Gaussian fit of the data would be for the Mean and STD of the time-series.

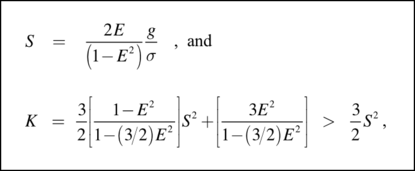
Distributions other than Gaussian have been used to model data. These include Gamma, log-normal, and others. In this application, we will use distribution known as a Stochastically Generated Skewed distribution("SGS"). It can be derived from a Markov model of the atmosphere in which noise is not random but can be correlated in time. This allows for distributions with a non zero Skewness or Kurtosis. More on the background of this method can be found in the journal article Need for Caution in Interpreting Extreme Weather Statistics( Sardeshmukh, P.D., G.P.Compo, and C. Penland, 2015: The distribition is described by three parameters E,g, and b), which are obtained from the data usng the Skewness (S), Kurtosis (K) and sigma.
The two key points about the SGS distribution are that is dynamically derived and that it reduces to a Gaussian in the limit of E-->0.
The webtool fits the requested data to an SGS distribution. For comparison, a Gaussian fit is optionally returned. The SGS (and Gaussian) distributions are used to optionally calculate the probability of a requested value from the distribution(s).
The code was written in NCL (determining the coefficients for the SGS distribution) and Fortran (determining the probability of "x" for a given SGS distribution. As part of the latter calculation, the authors of the page wish to acknowledge the code provided by
This is a Research and Development Application