20th Century Reanalysis
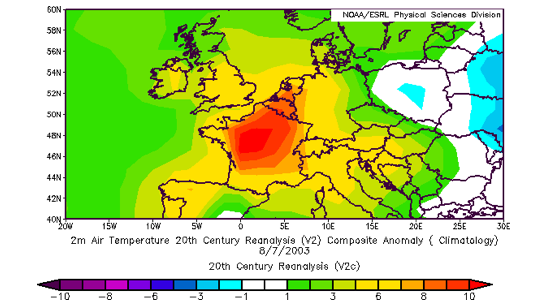
This plot shows temperature anomalies during the August 2003 European heatwave.
Options to produce plot are using the Daily Composites 20th Century Plotting page
- 20CRV2c
- 2m Air temperature
- August 7 2003
- Anomaly
- Europe
Options to produce plot are using the Daily Composites 20th Century Plotting page