20th Century Reanalysis V2
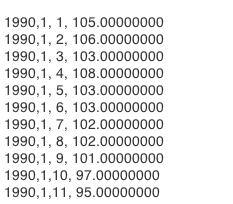
This plot shows a snippet from the timeseries of daily mean 1000mb zonal wind at the grid point 0,0E,0N.
Options to produce plot are using the PSL daily time series extraction web page
- Select 20th Century Reanalysis
- Select: Variable: geopotential height
- Select: Level: 1000mb
- Select: latitude 0 to 0
- Select longitude: 0 to 0
- Select: Get timeseries
- Select: 1990 to 1991