20th Century Reanalysis: : Plot Example
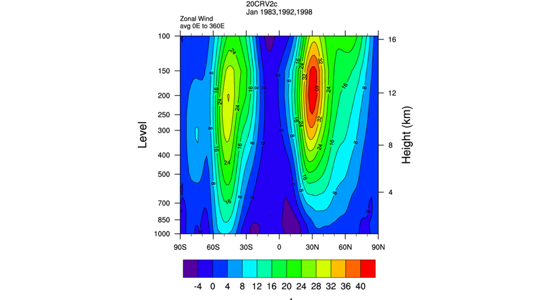
This plot shows the zonally averaged winds averaged over three El Nino events for 20CRV2c
Options to produce plot are using the WRIT Monthly/Seasonaly Mapping page
- Zonal Wind
- 20CRV2c
- Jan
- Jan
- 1983,1992,1998
- Height/Latitude
- Mean
- -90 to 90
- 0 to 357.5
- 1000mb to 100mb