Lesley L. Smith – Rossby Wave Source Tests
All plots preliminary. Right click to see bigger versions.
Back to main Smith page.
New! Newer plots at top of page, older plots at bottom.
ENRRR Analysis 2018
Energy and Moisture Budgets
Older Budget-Related Plots Here
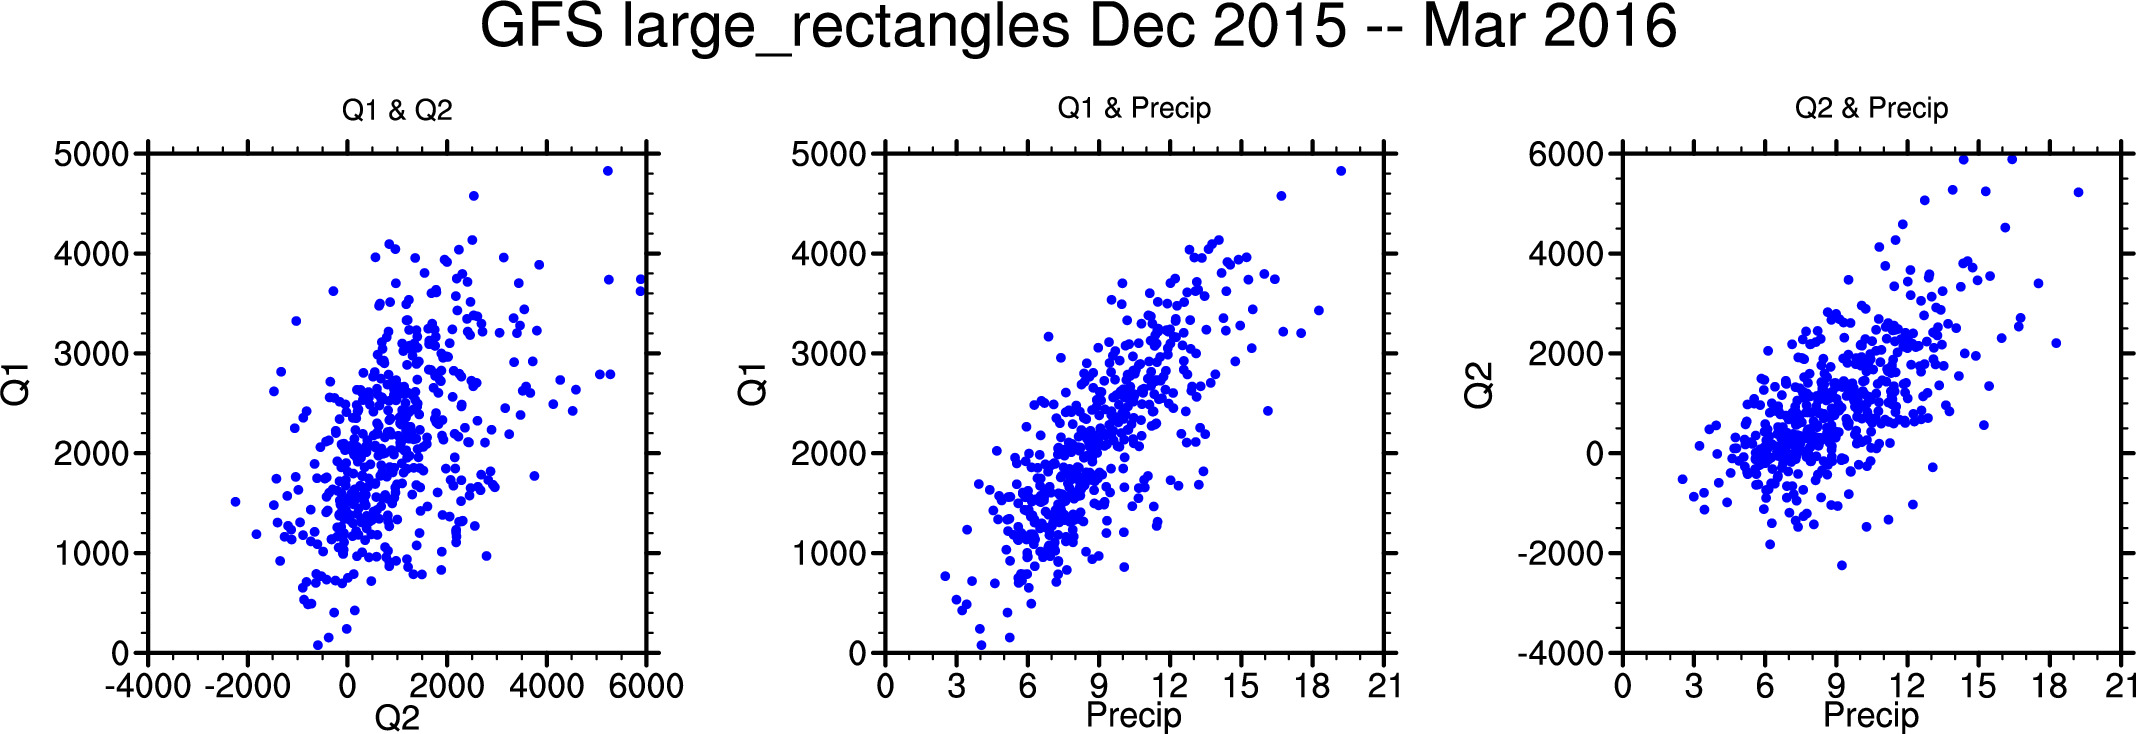
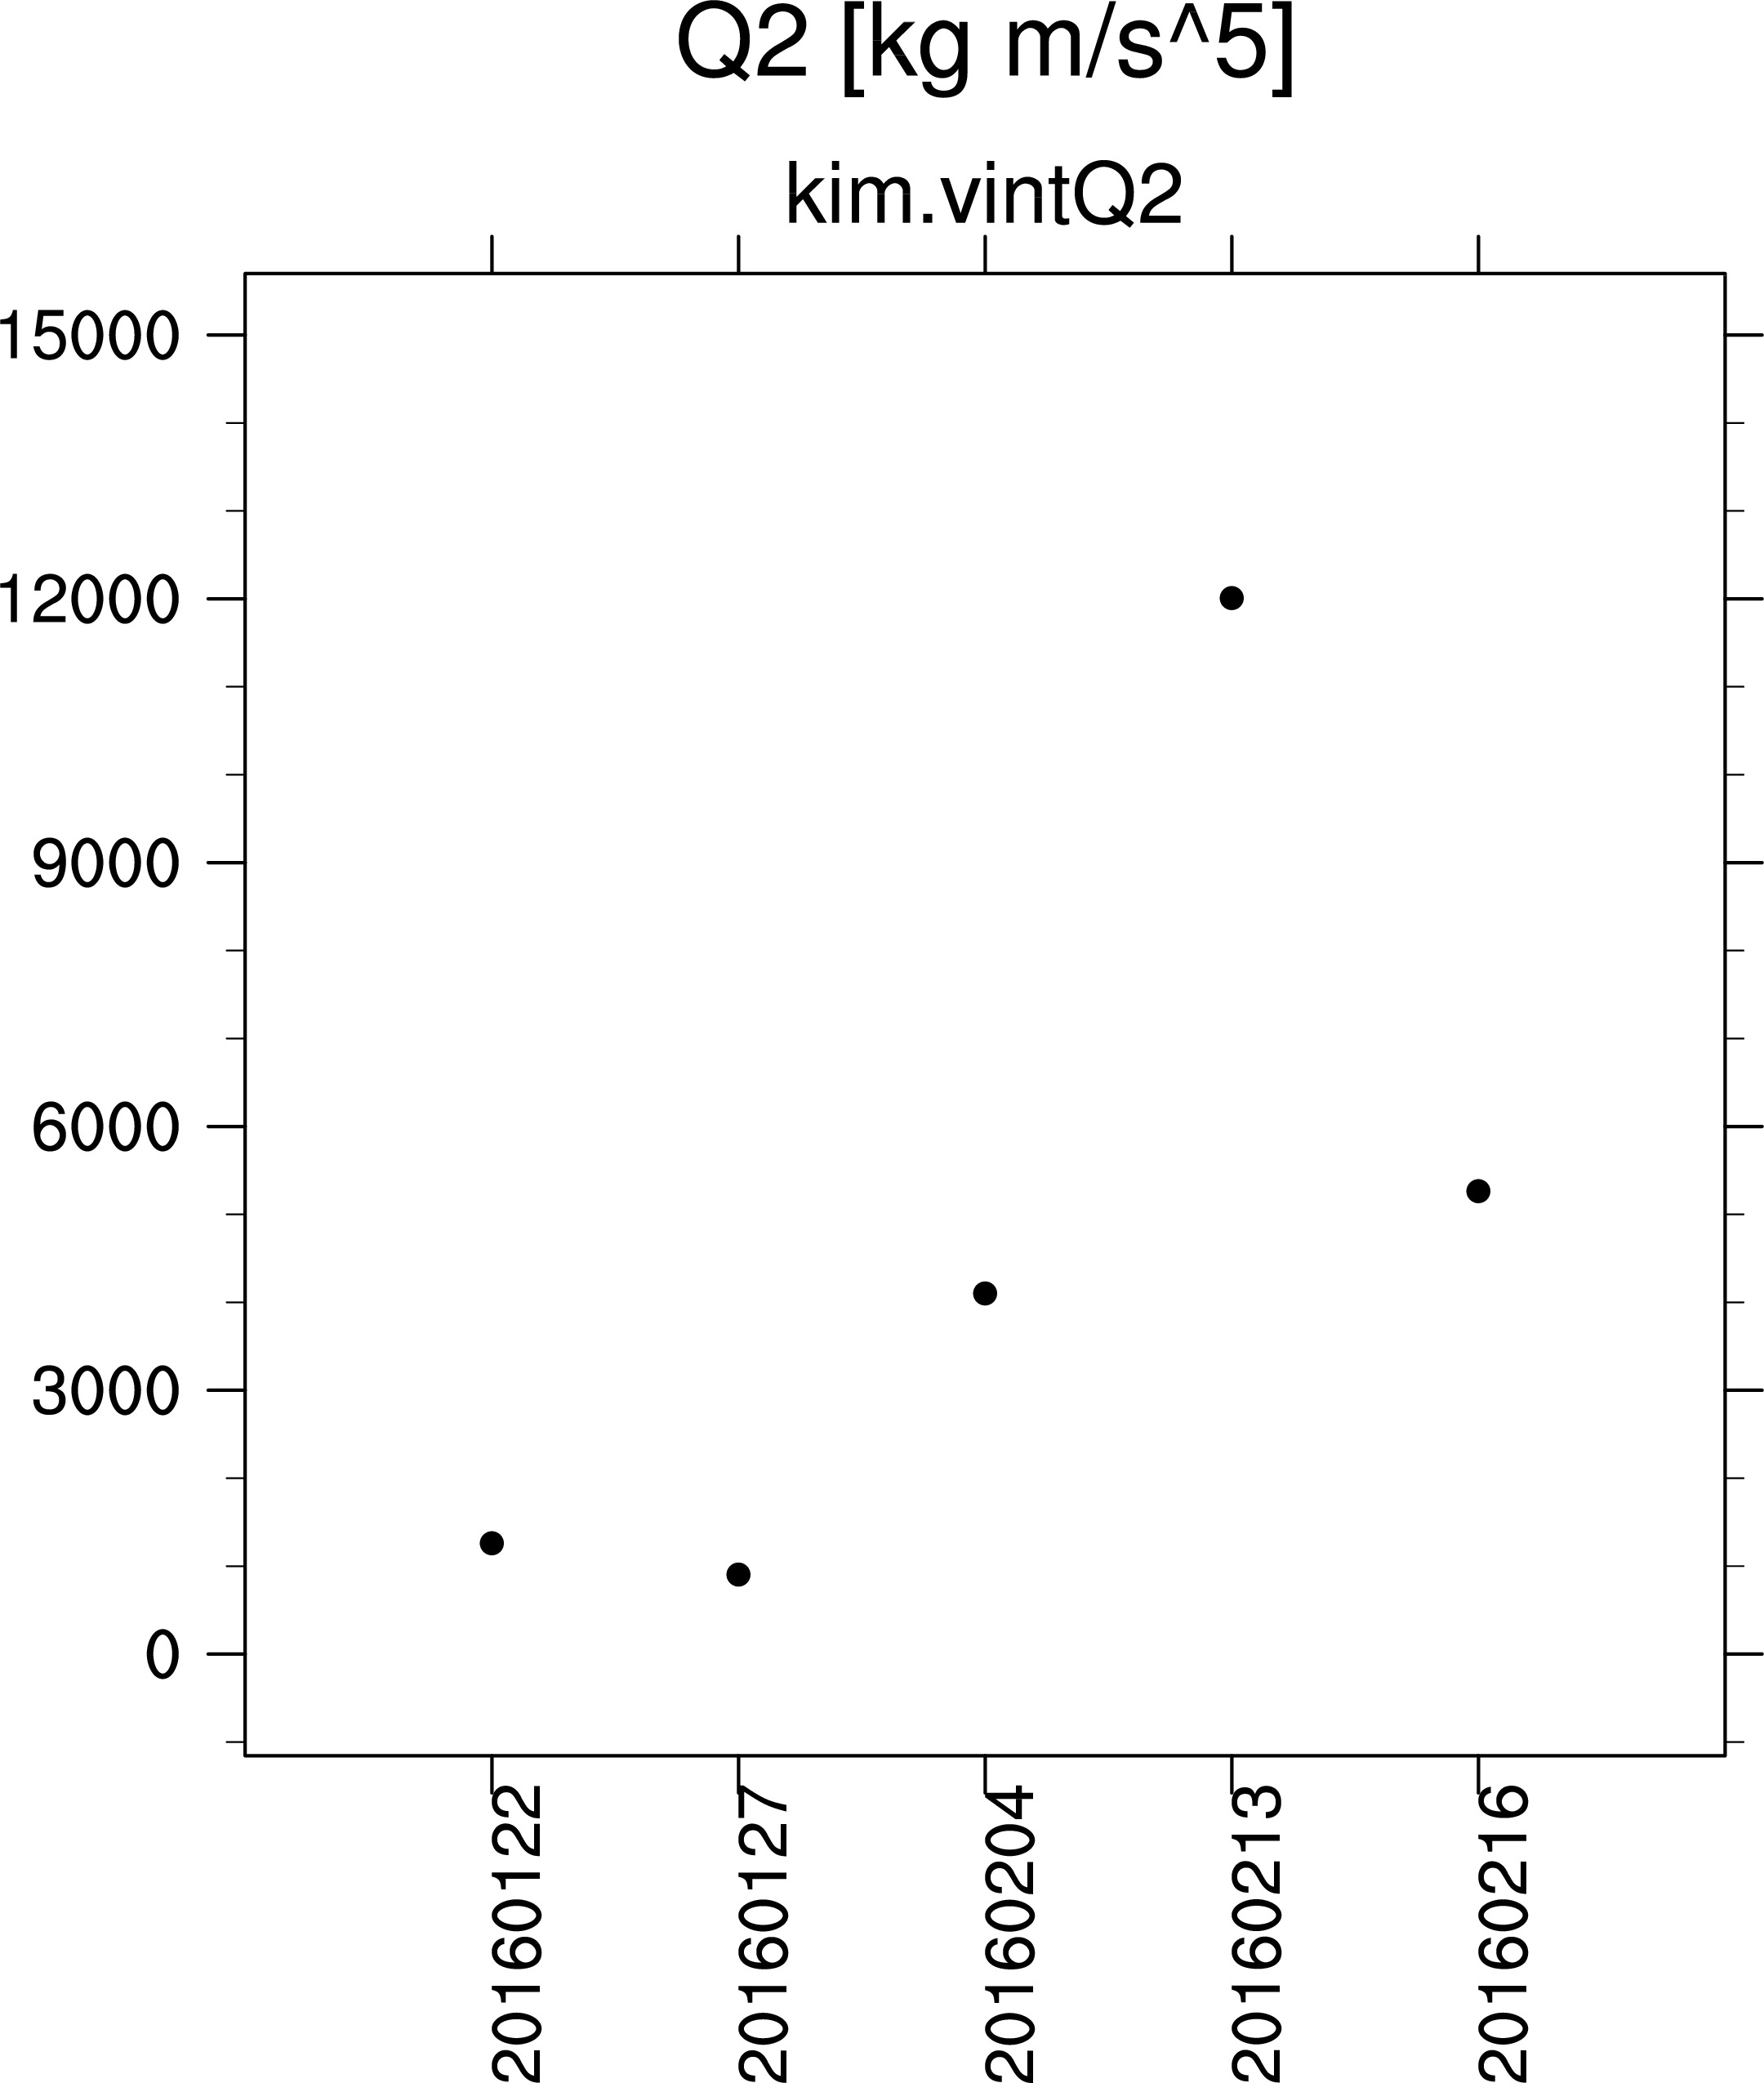
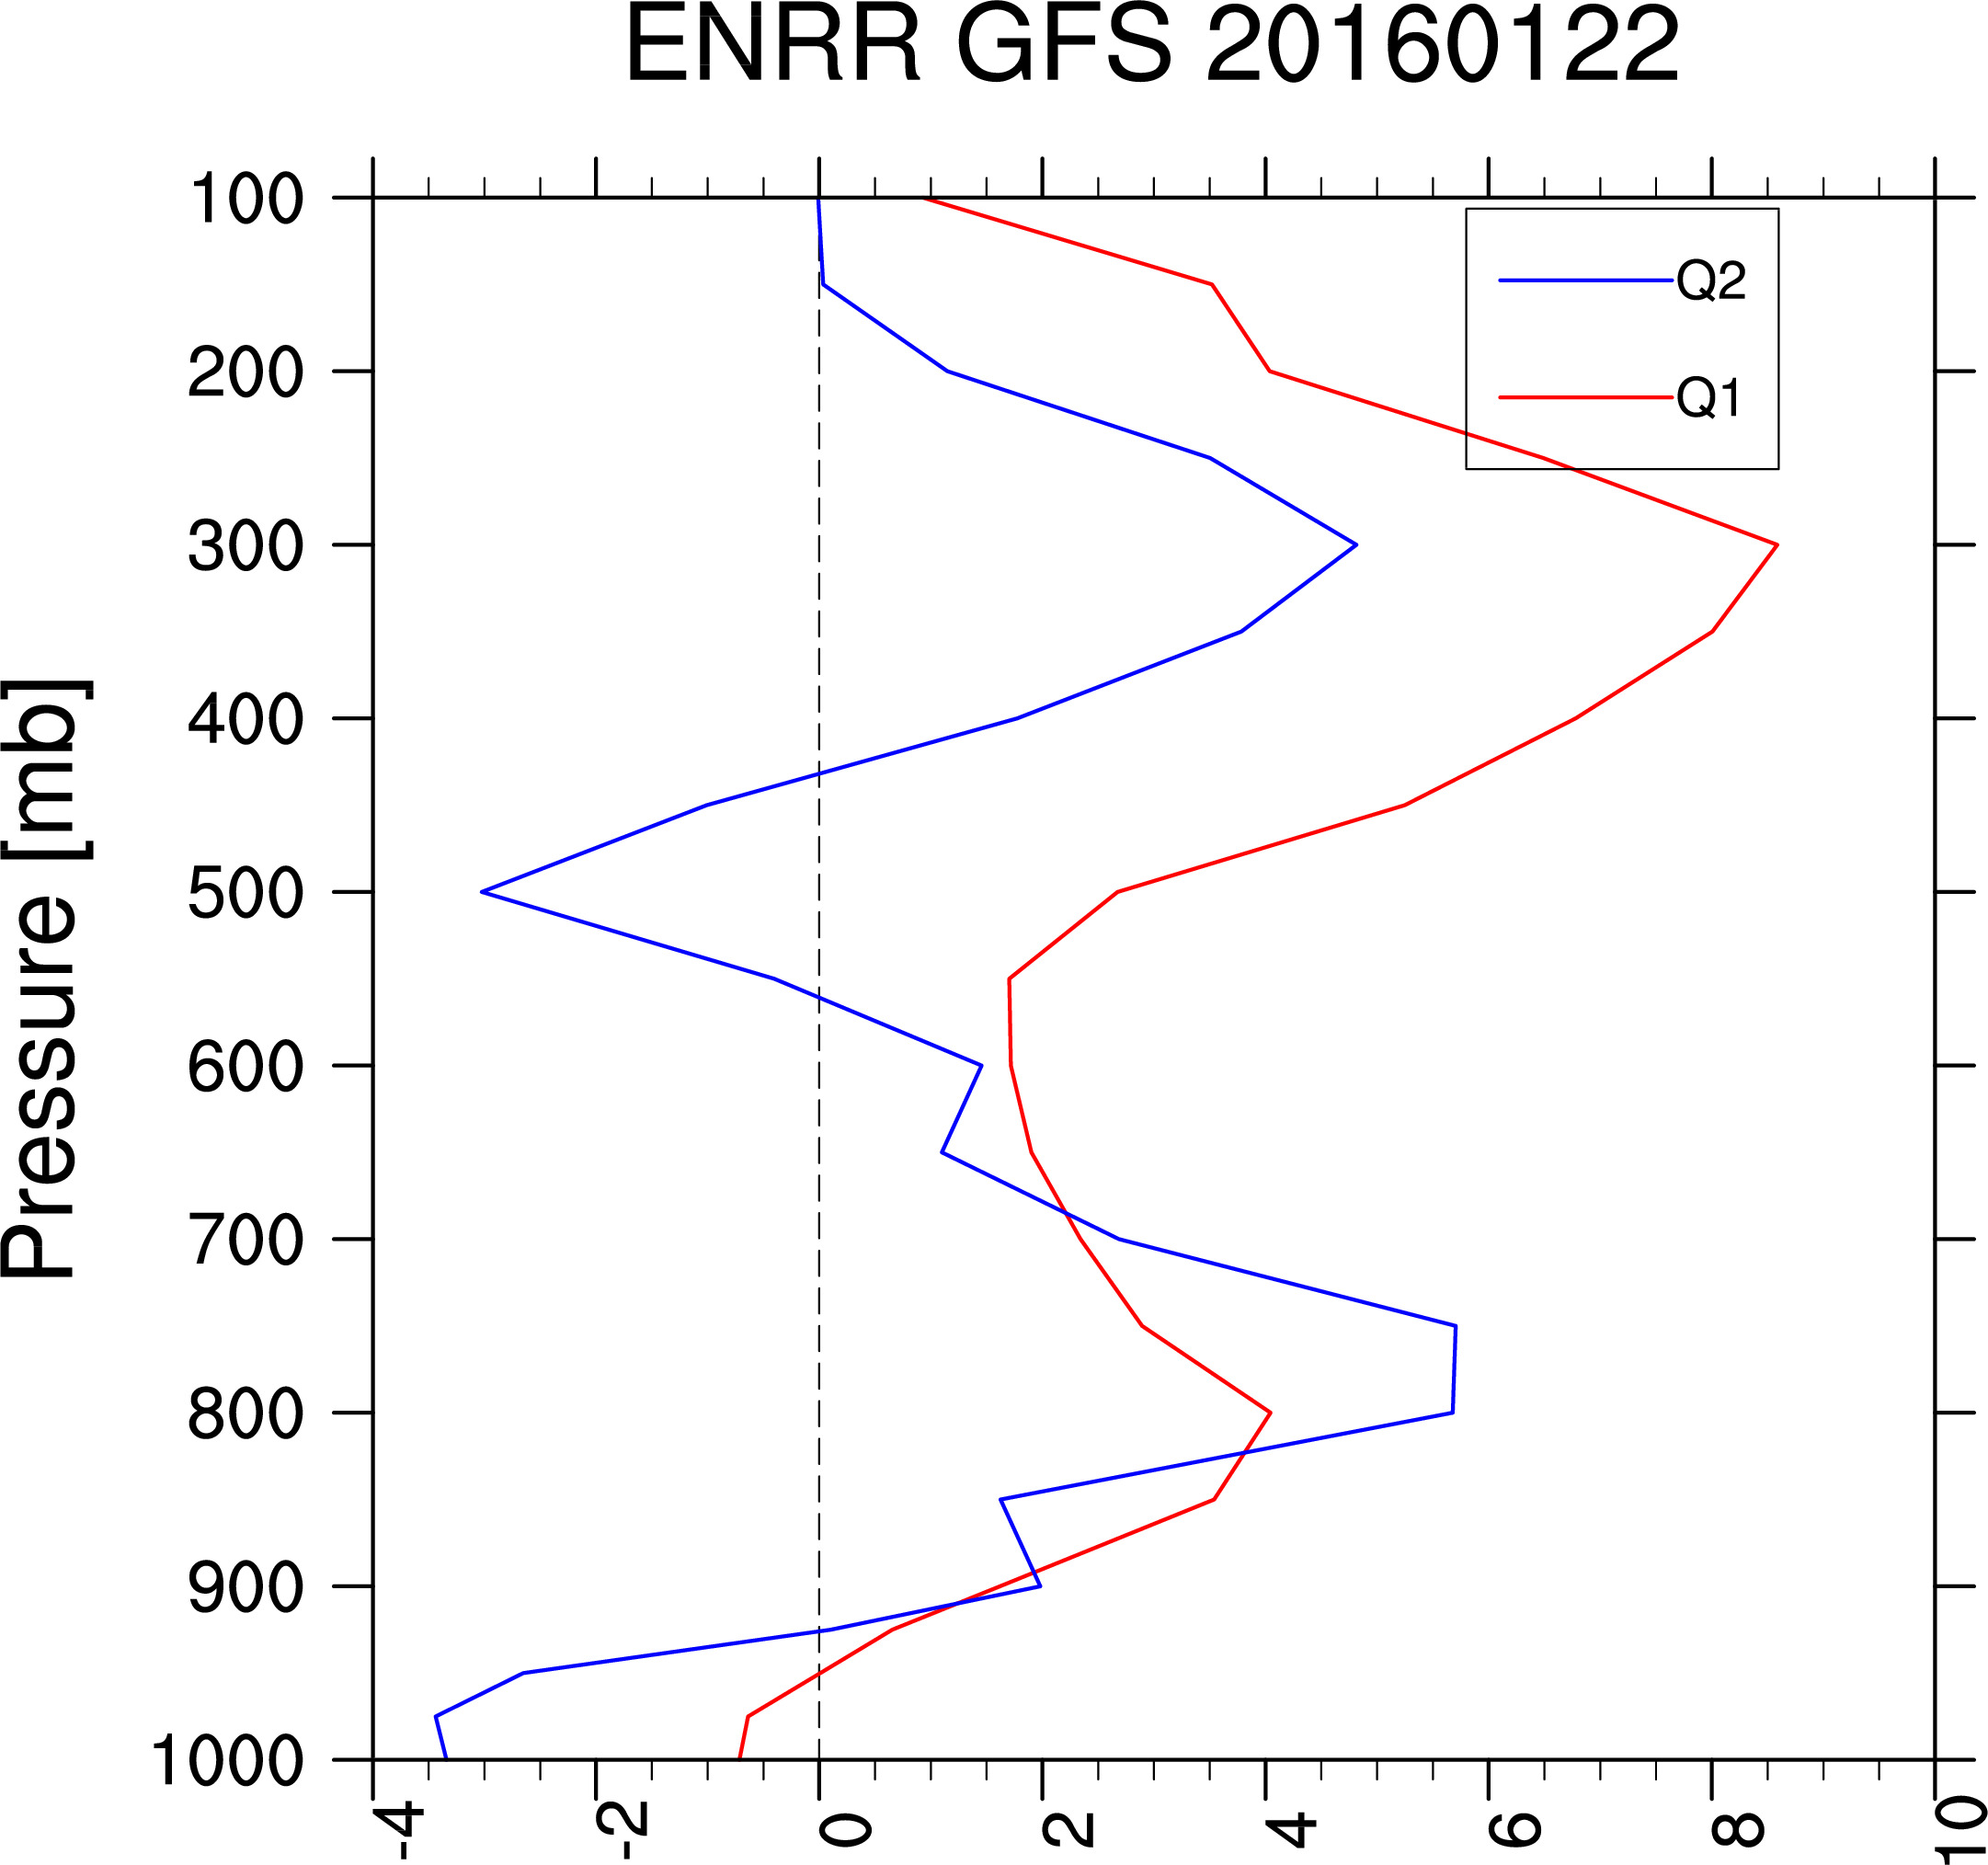
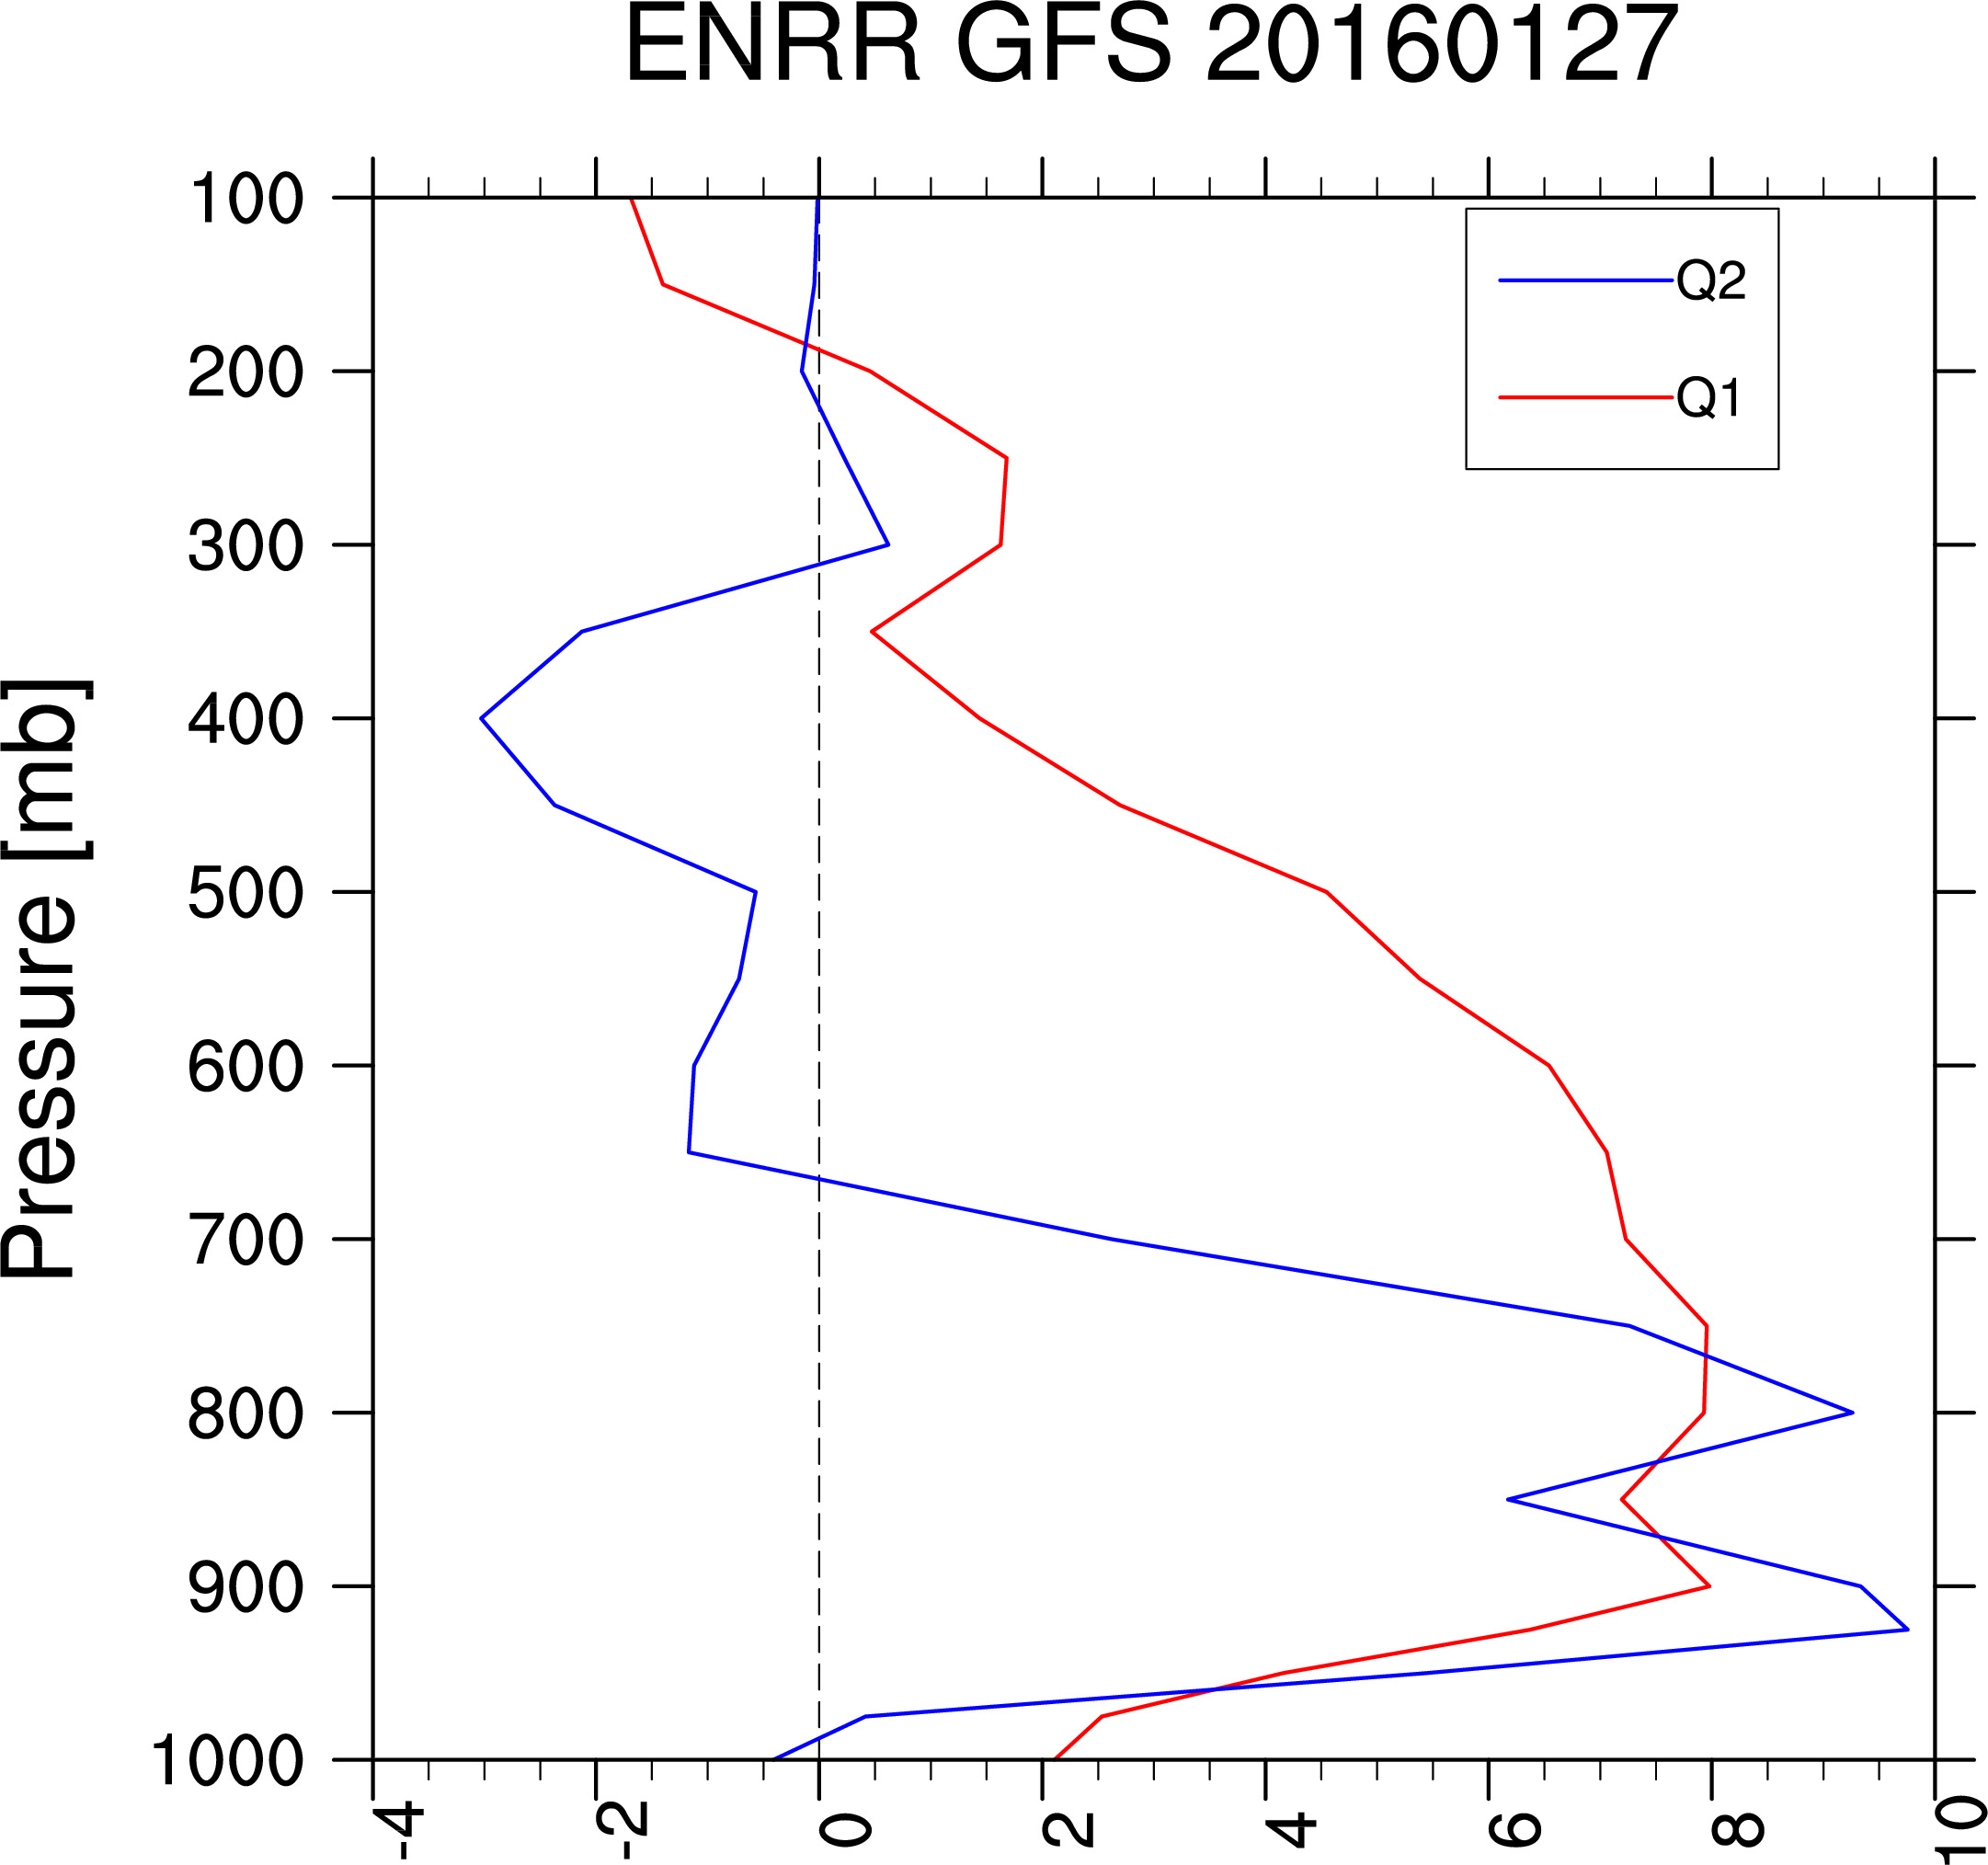
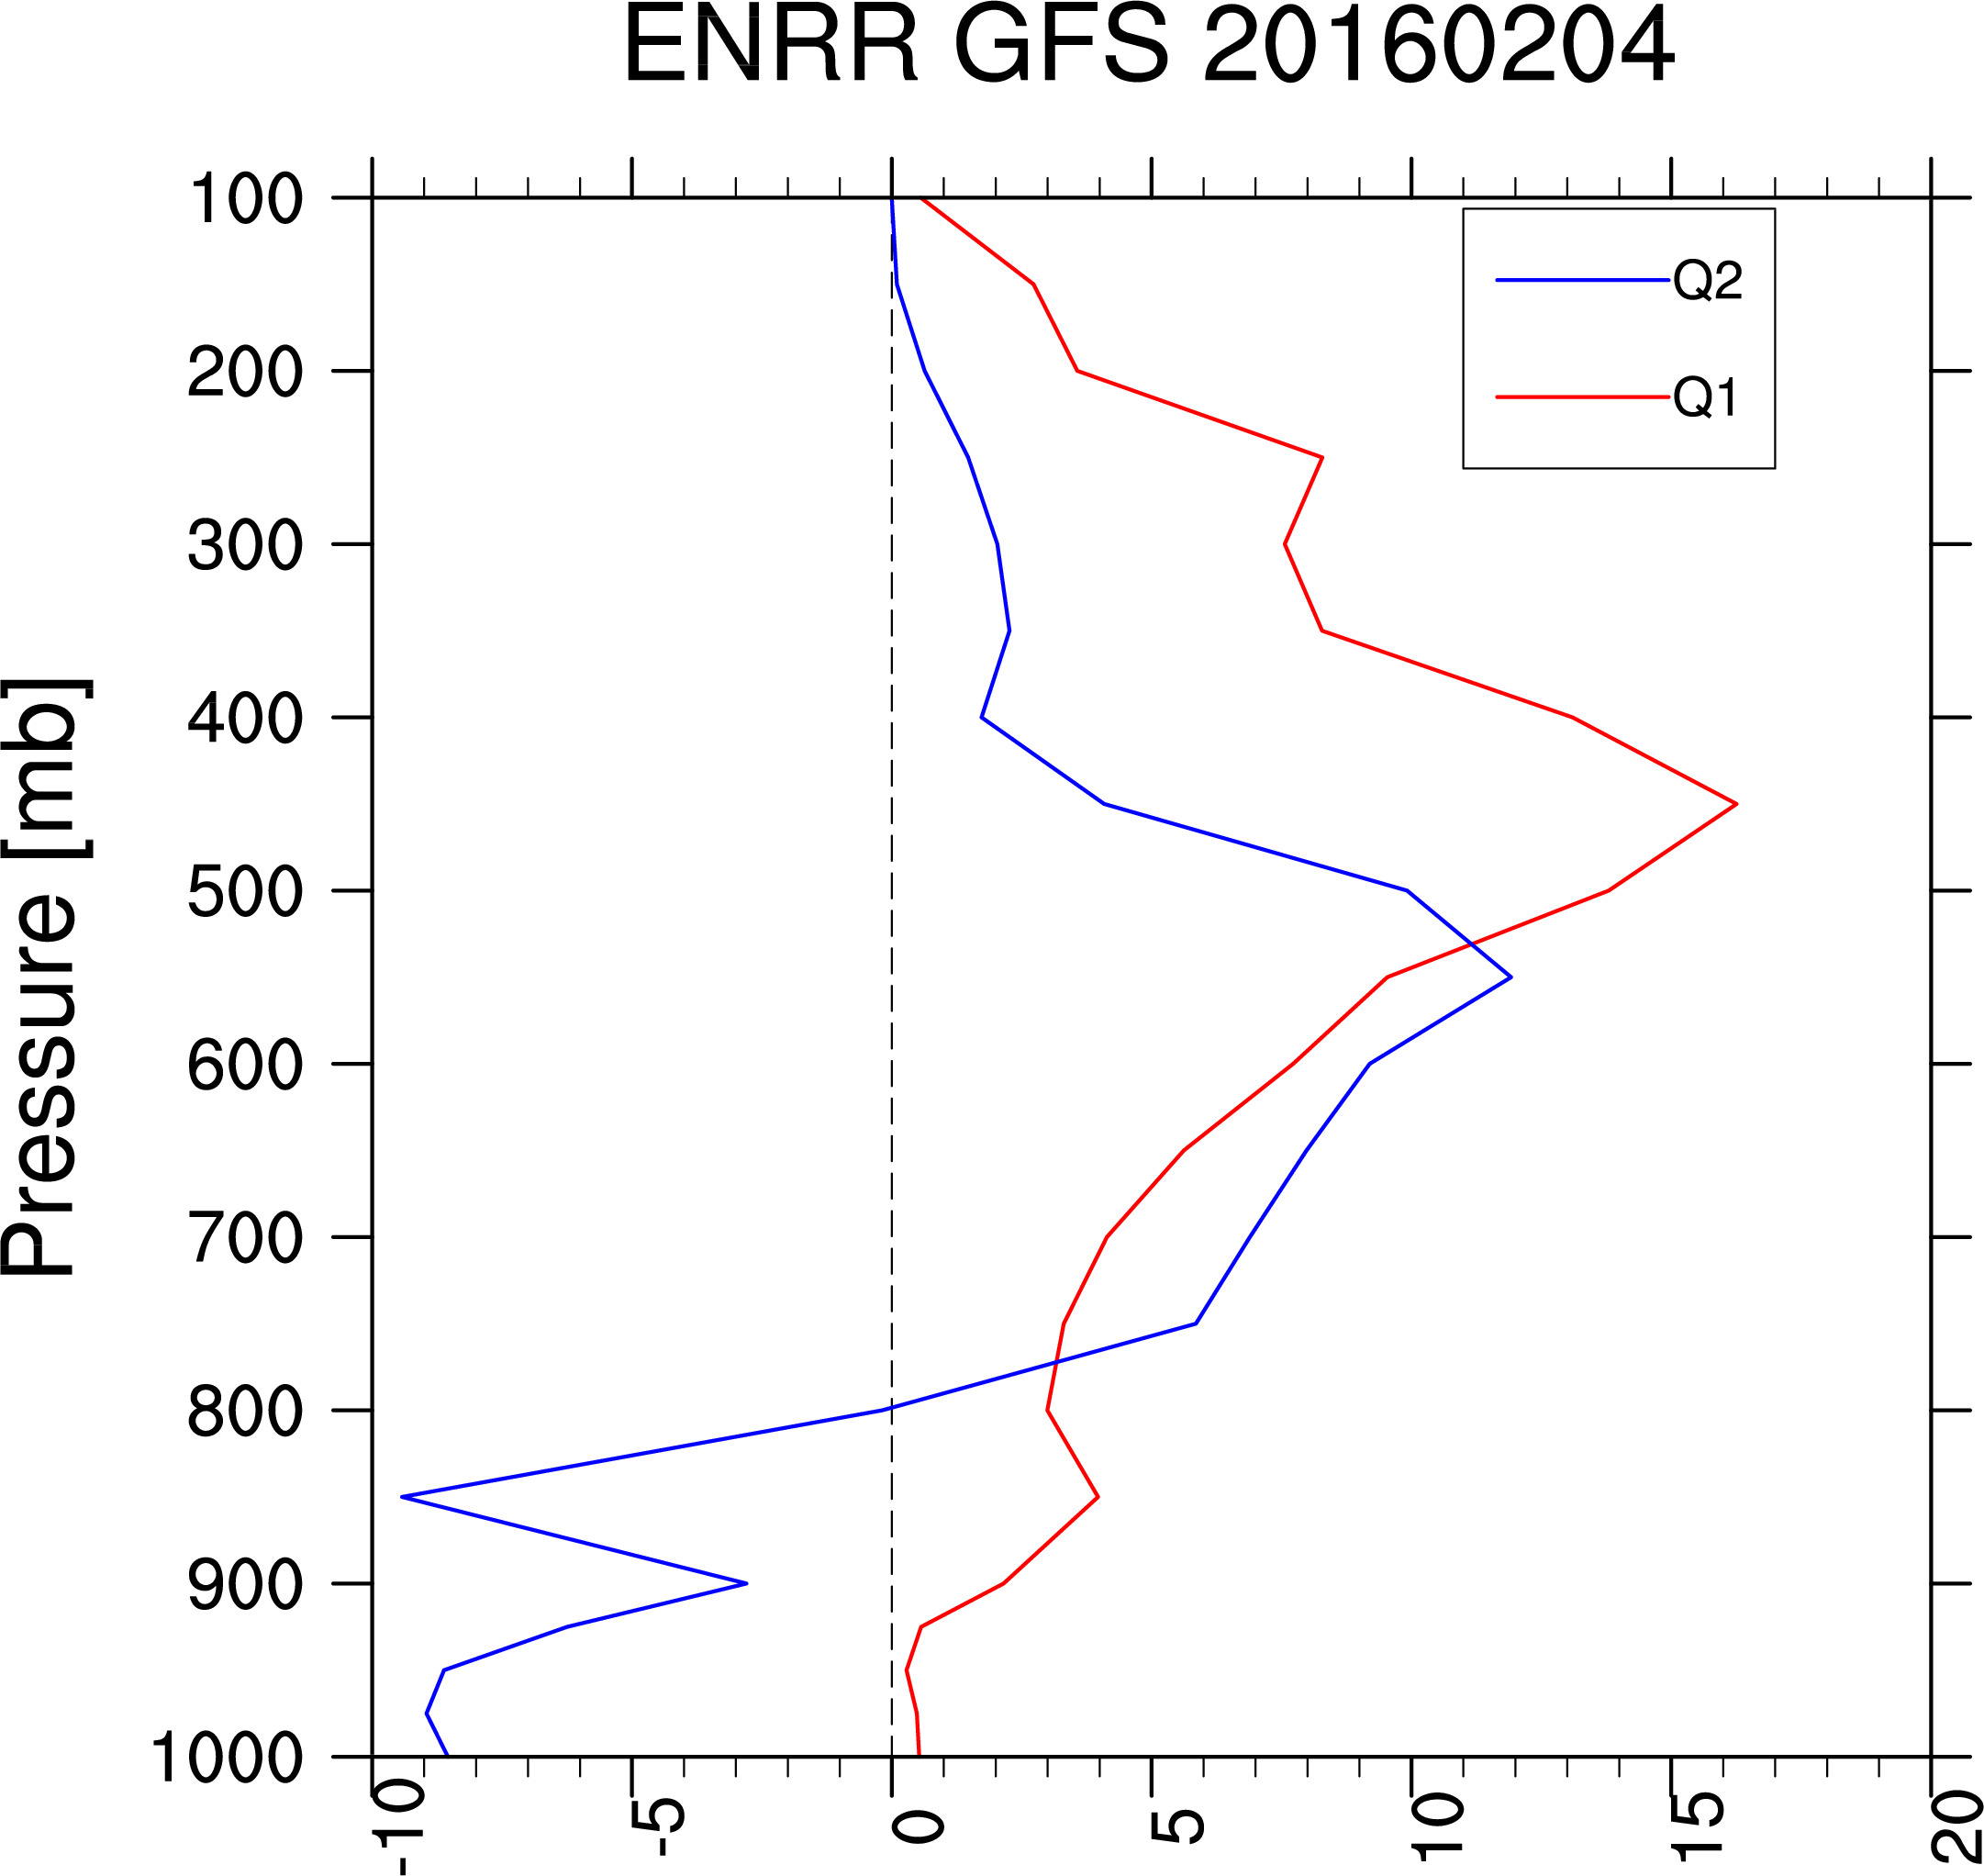
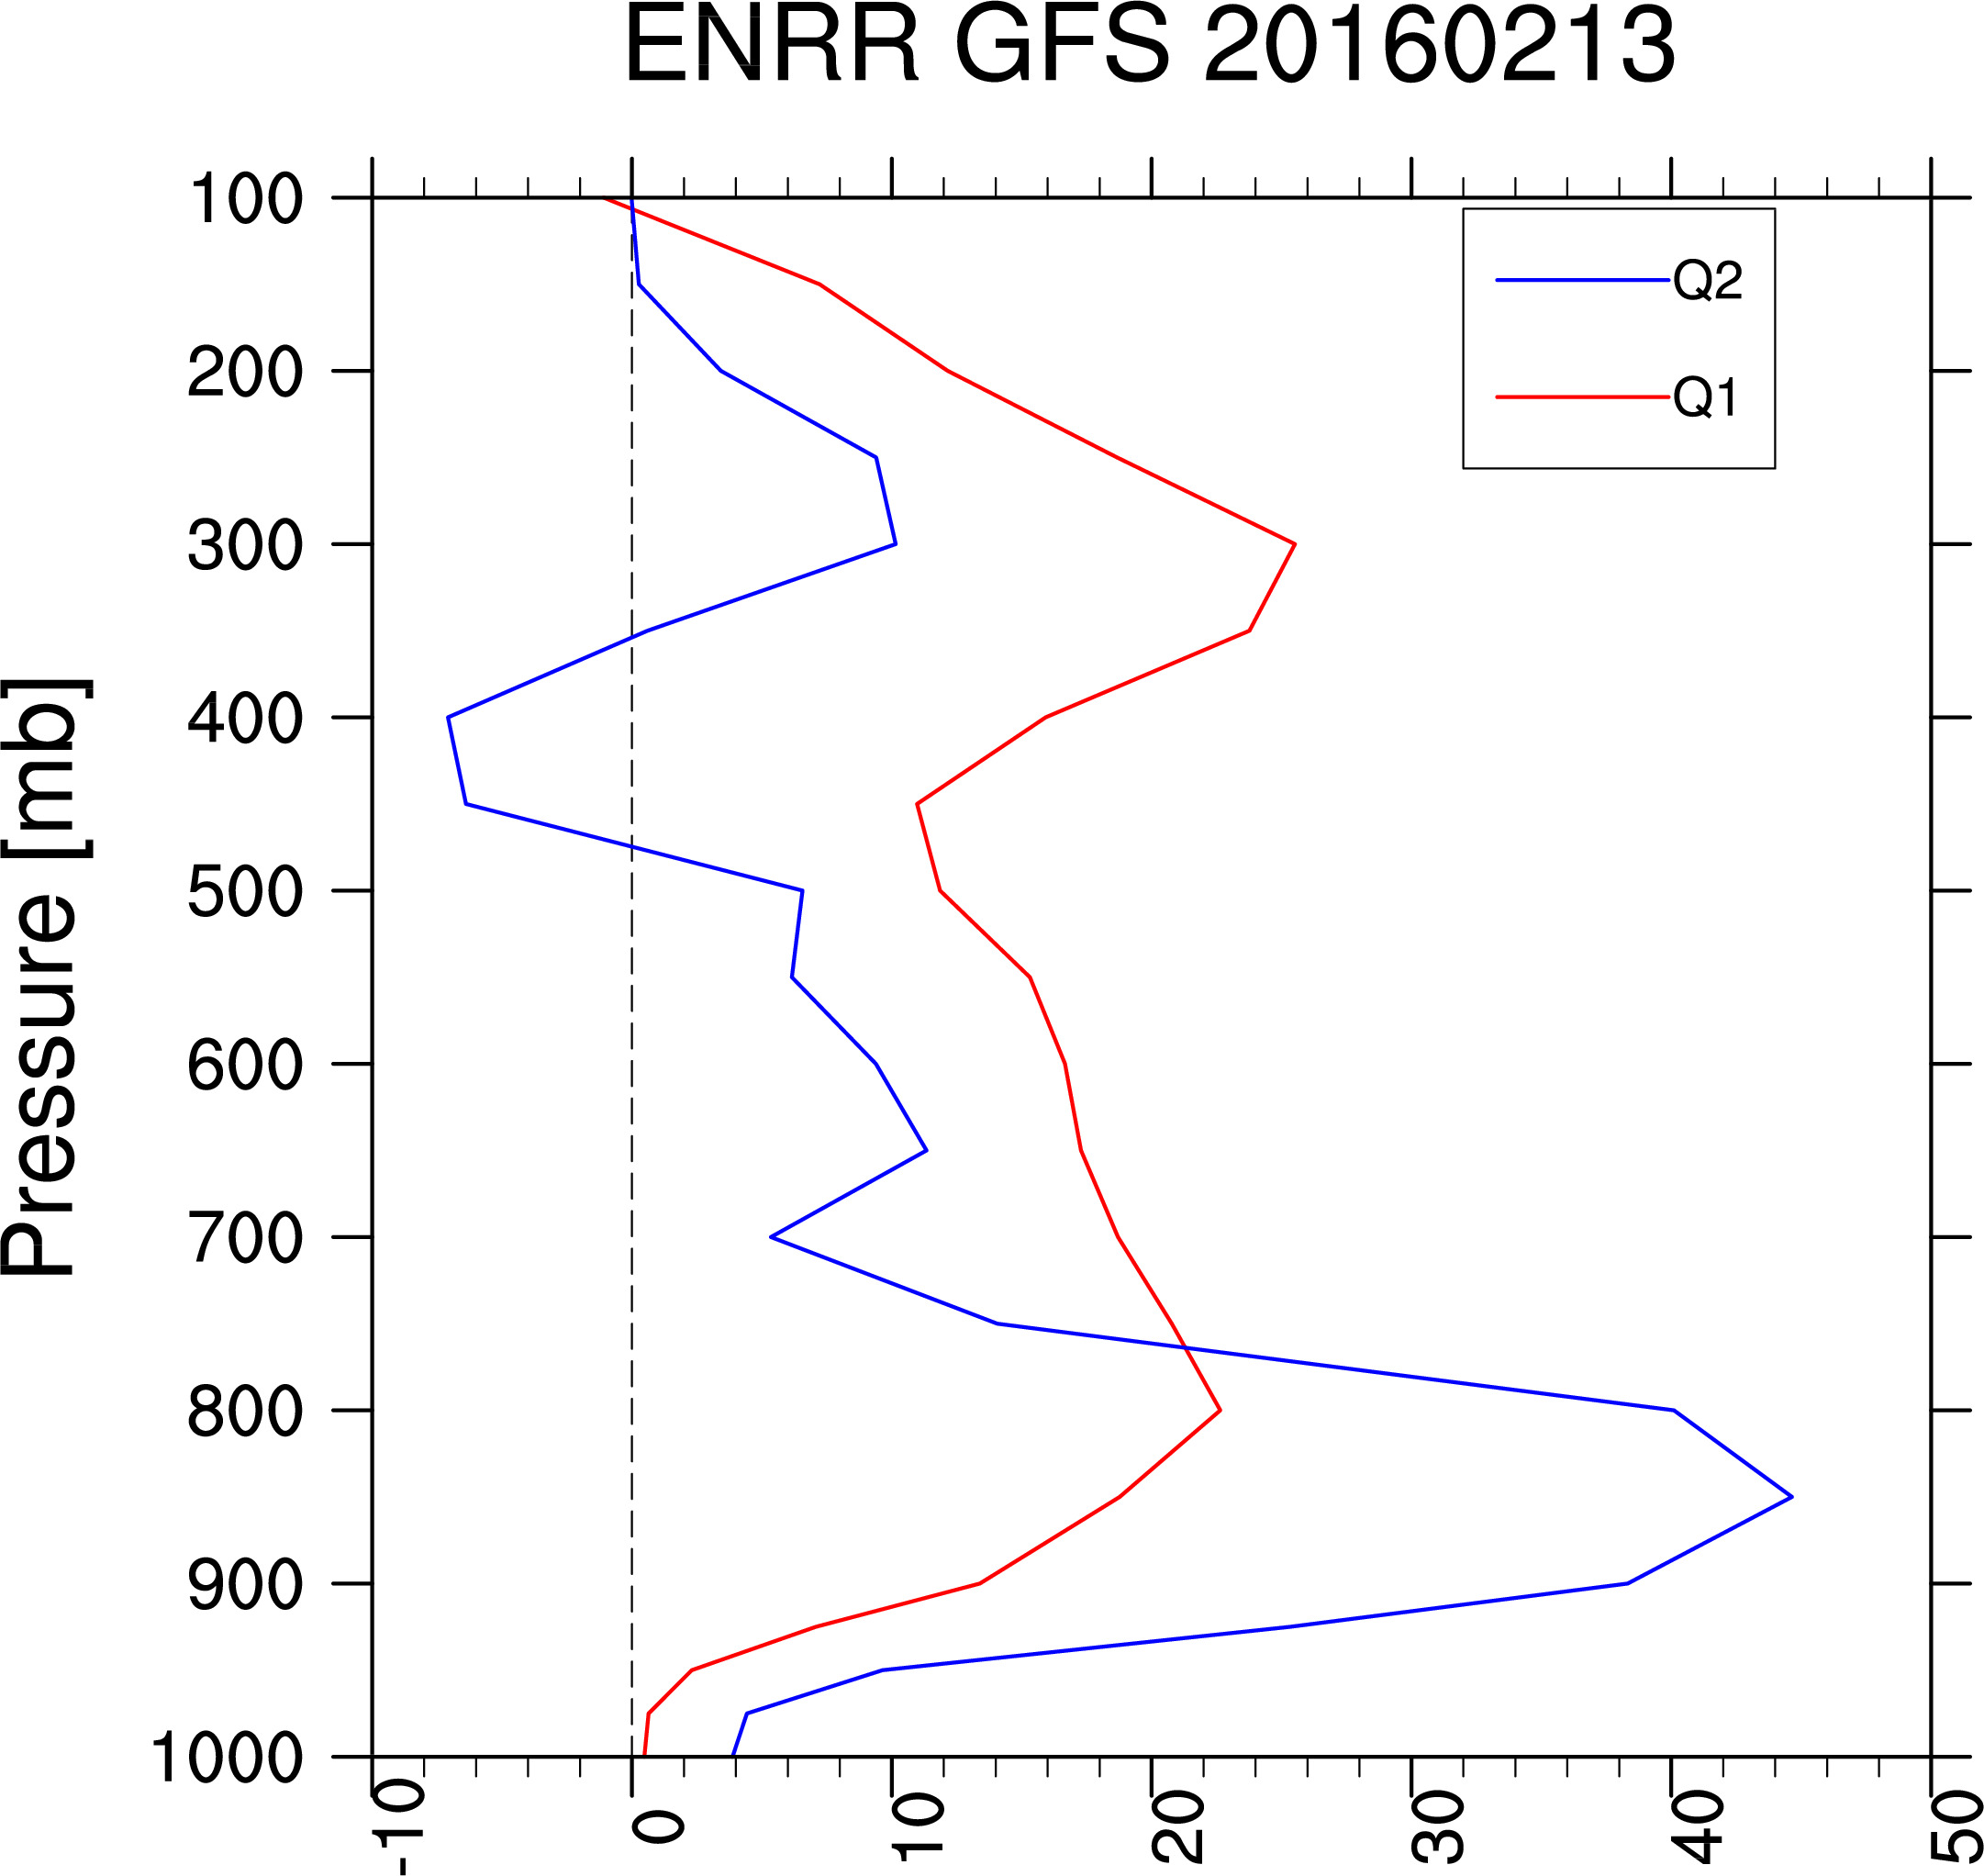
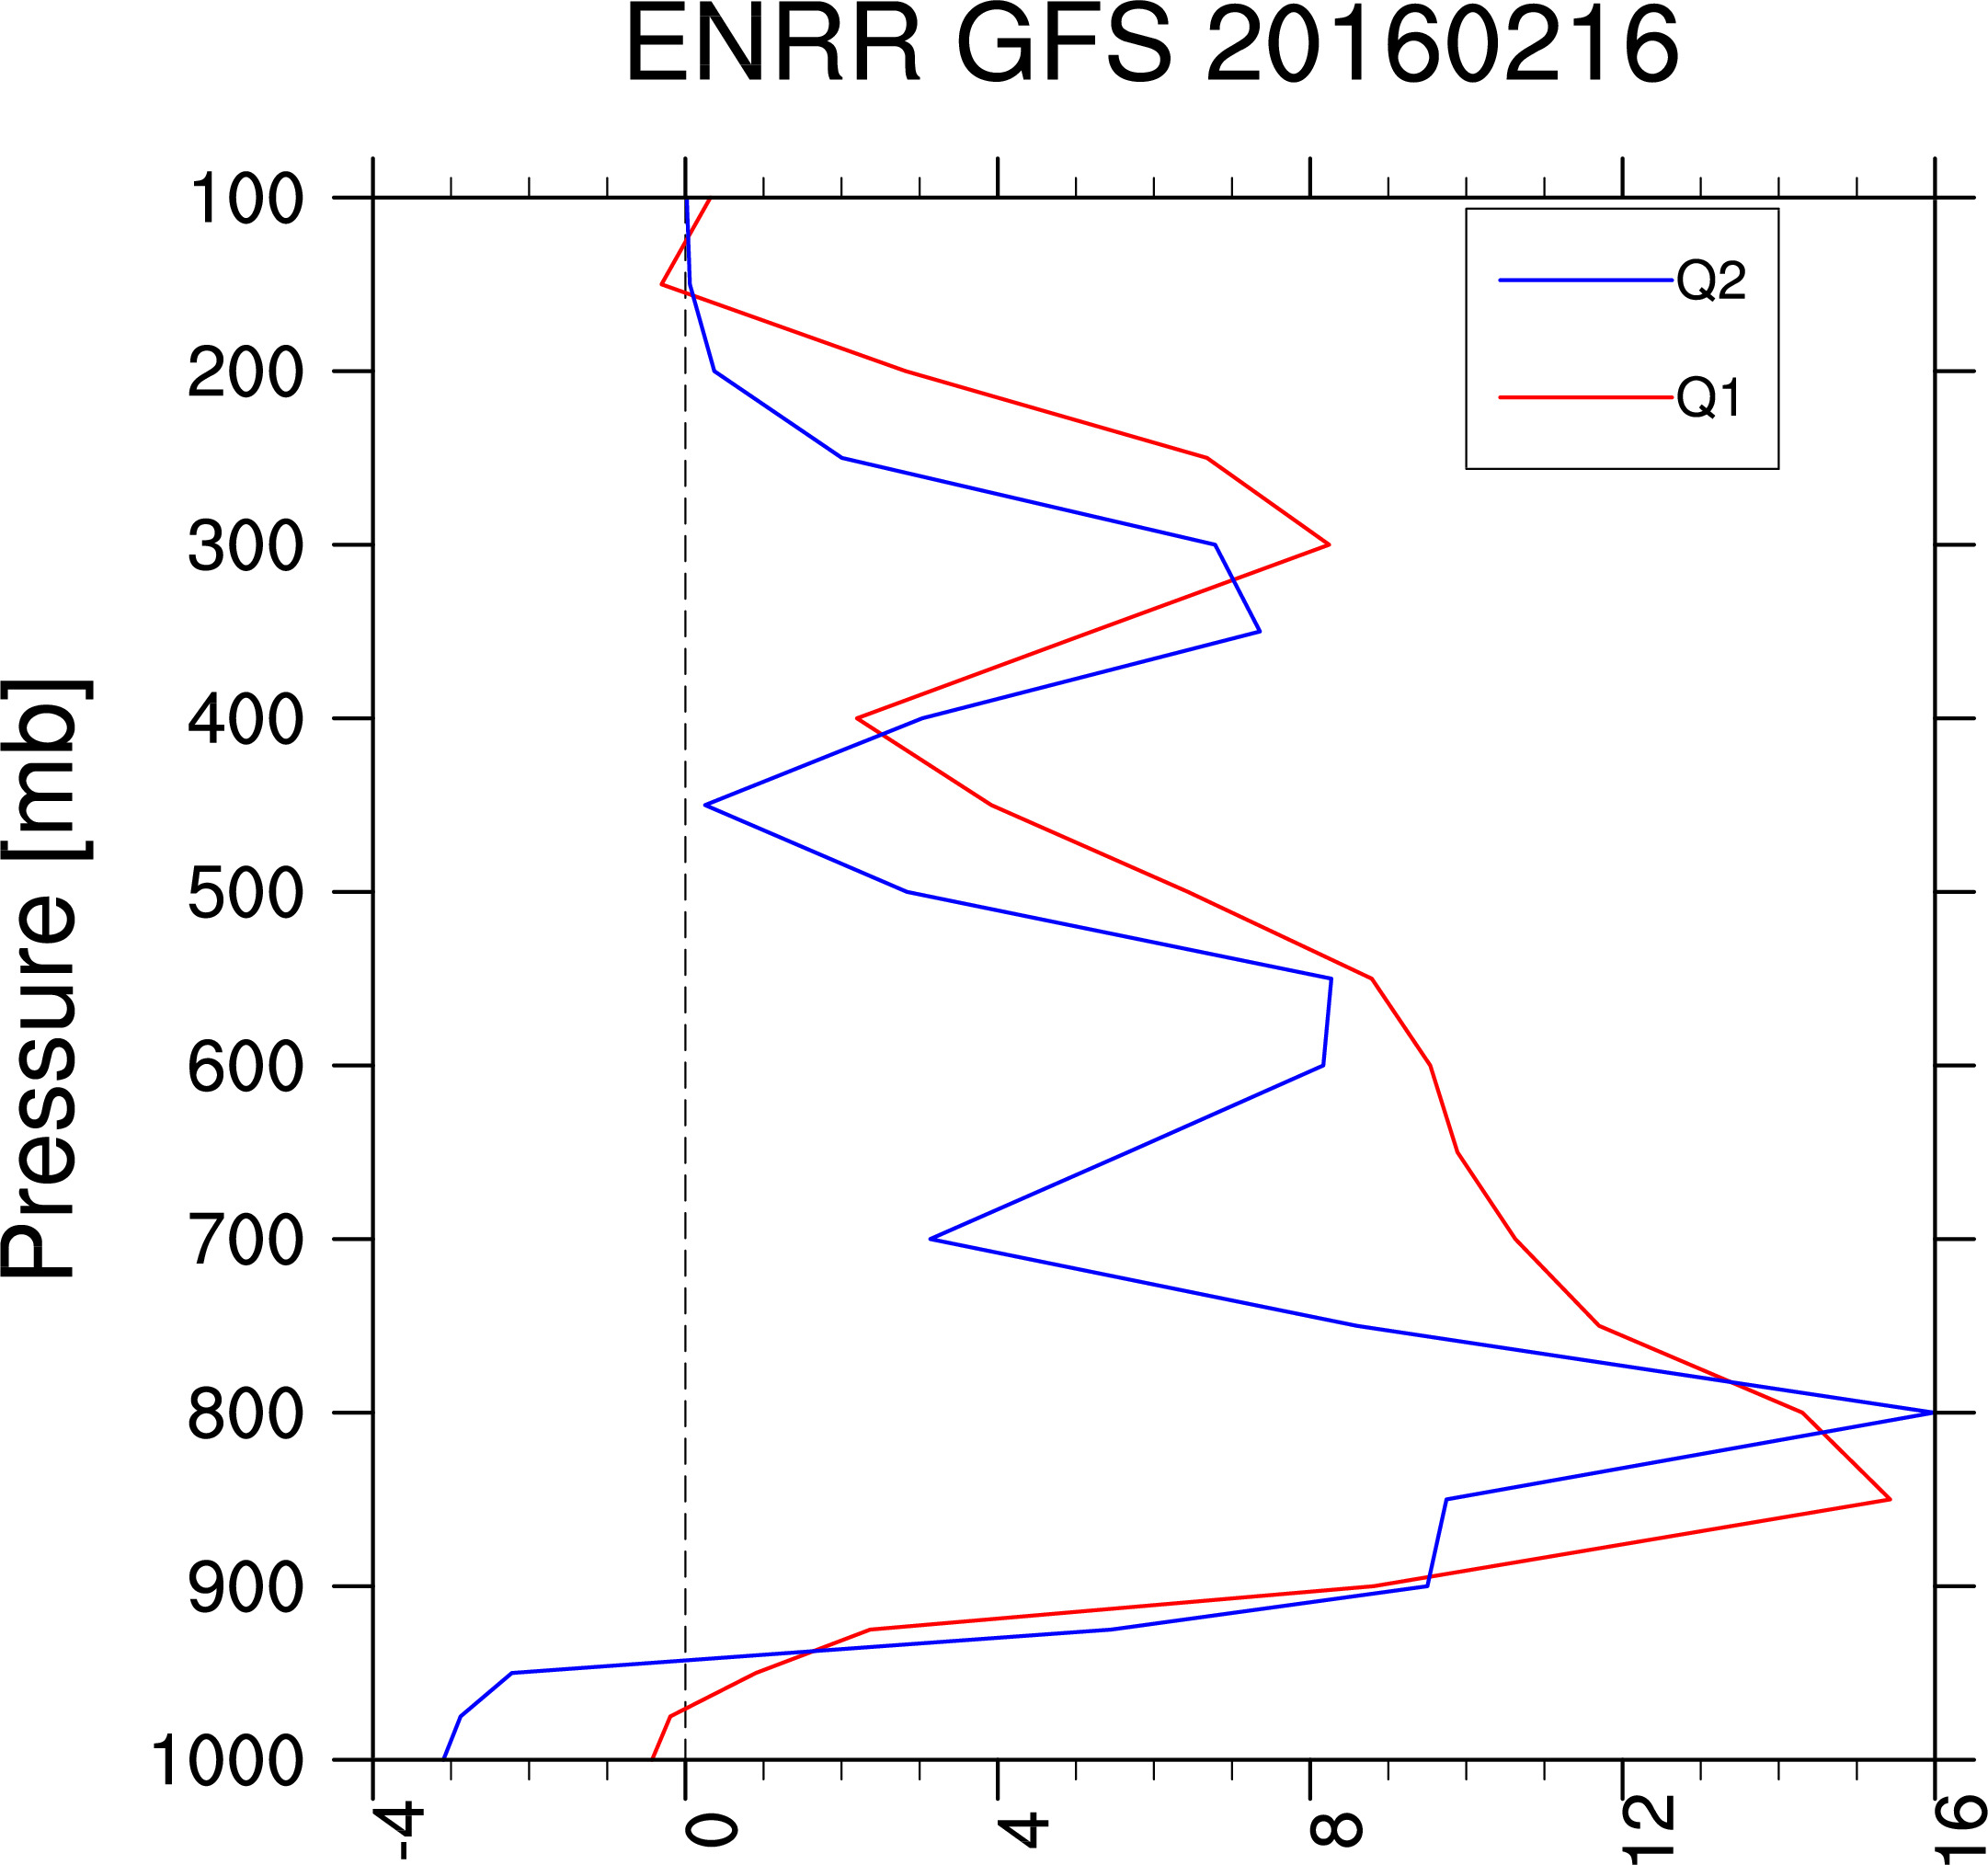
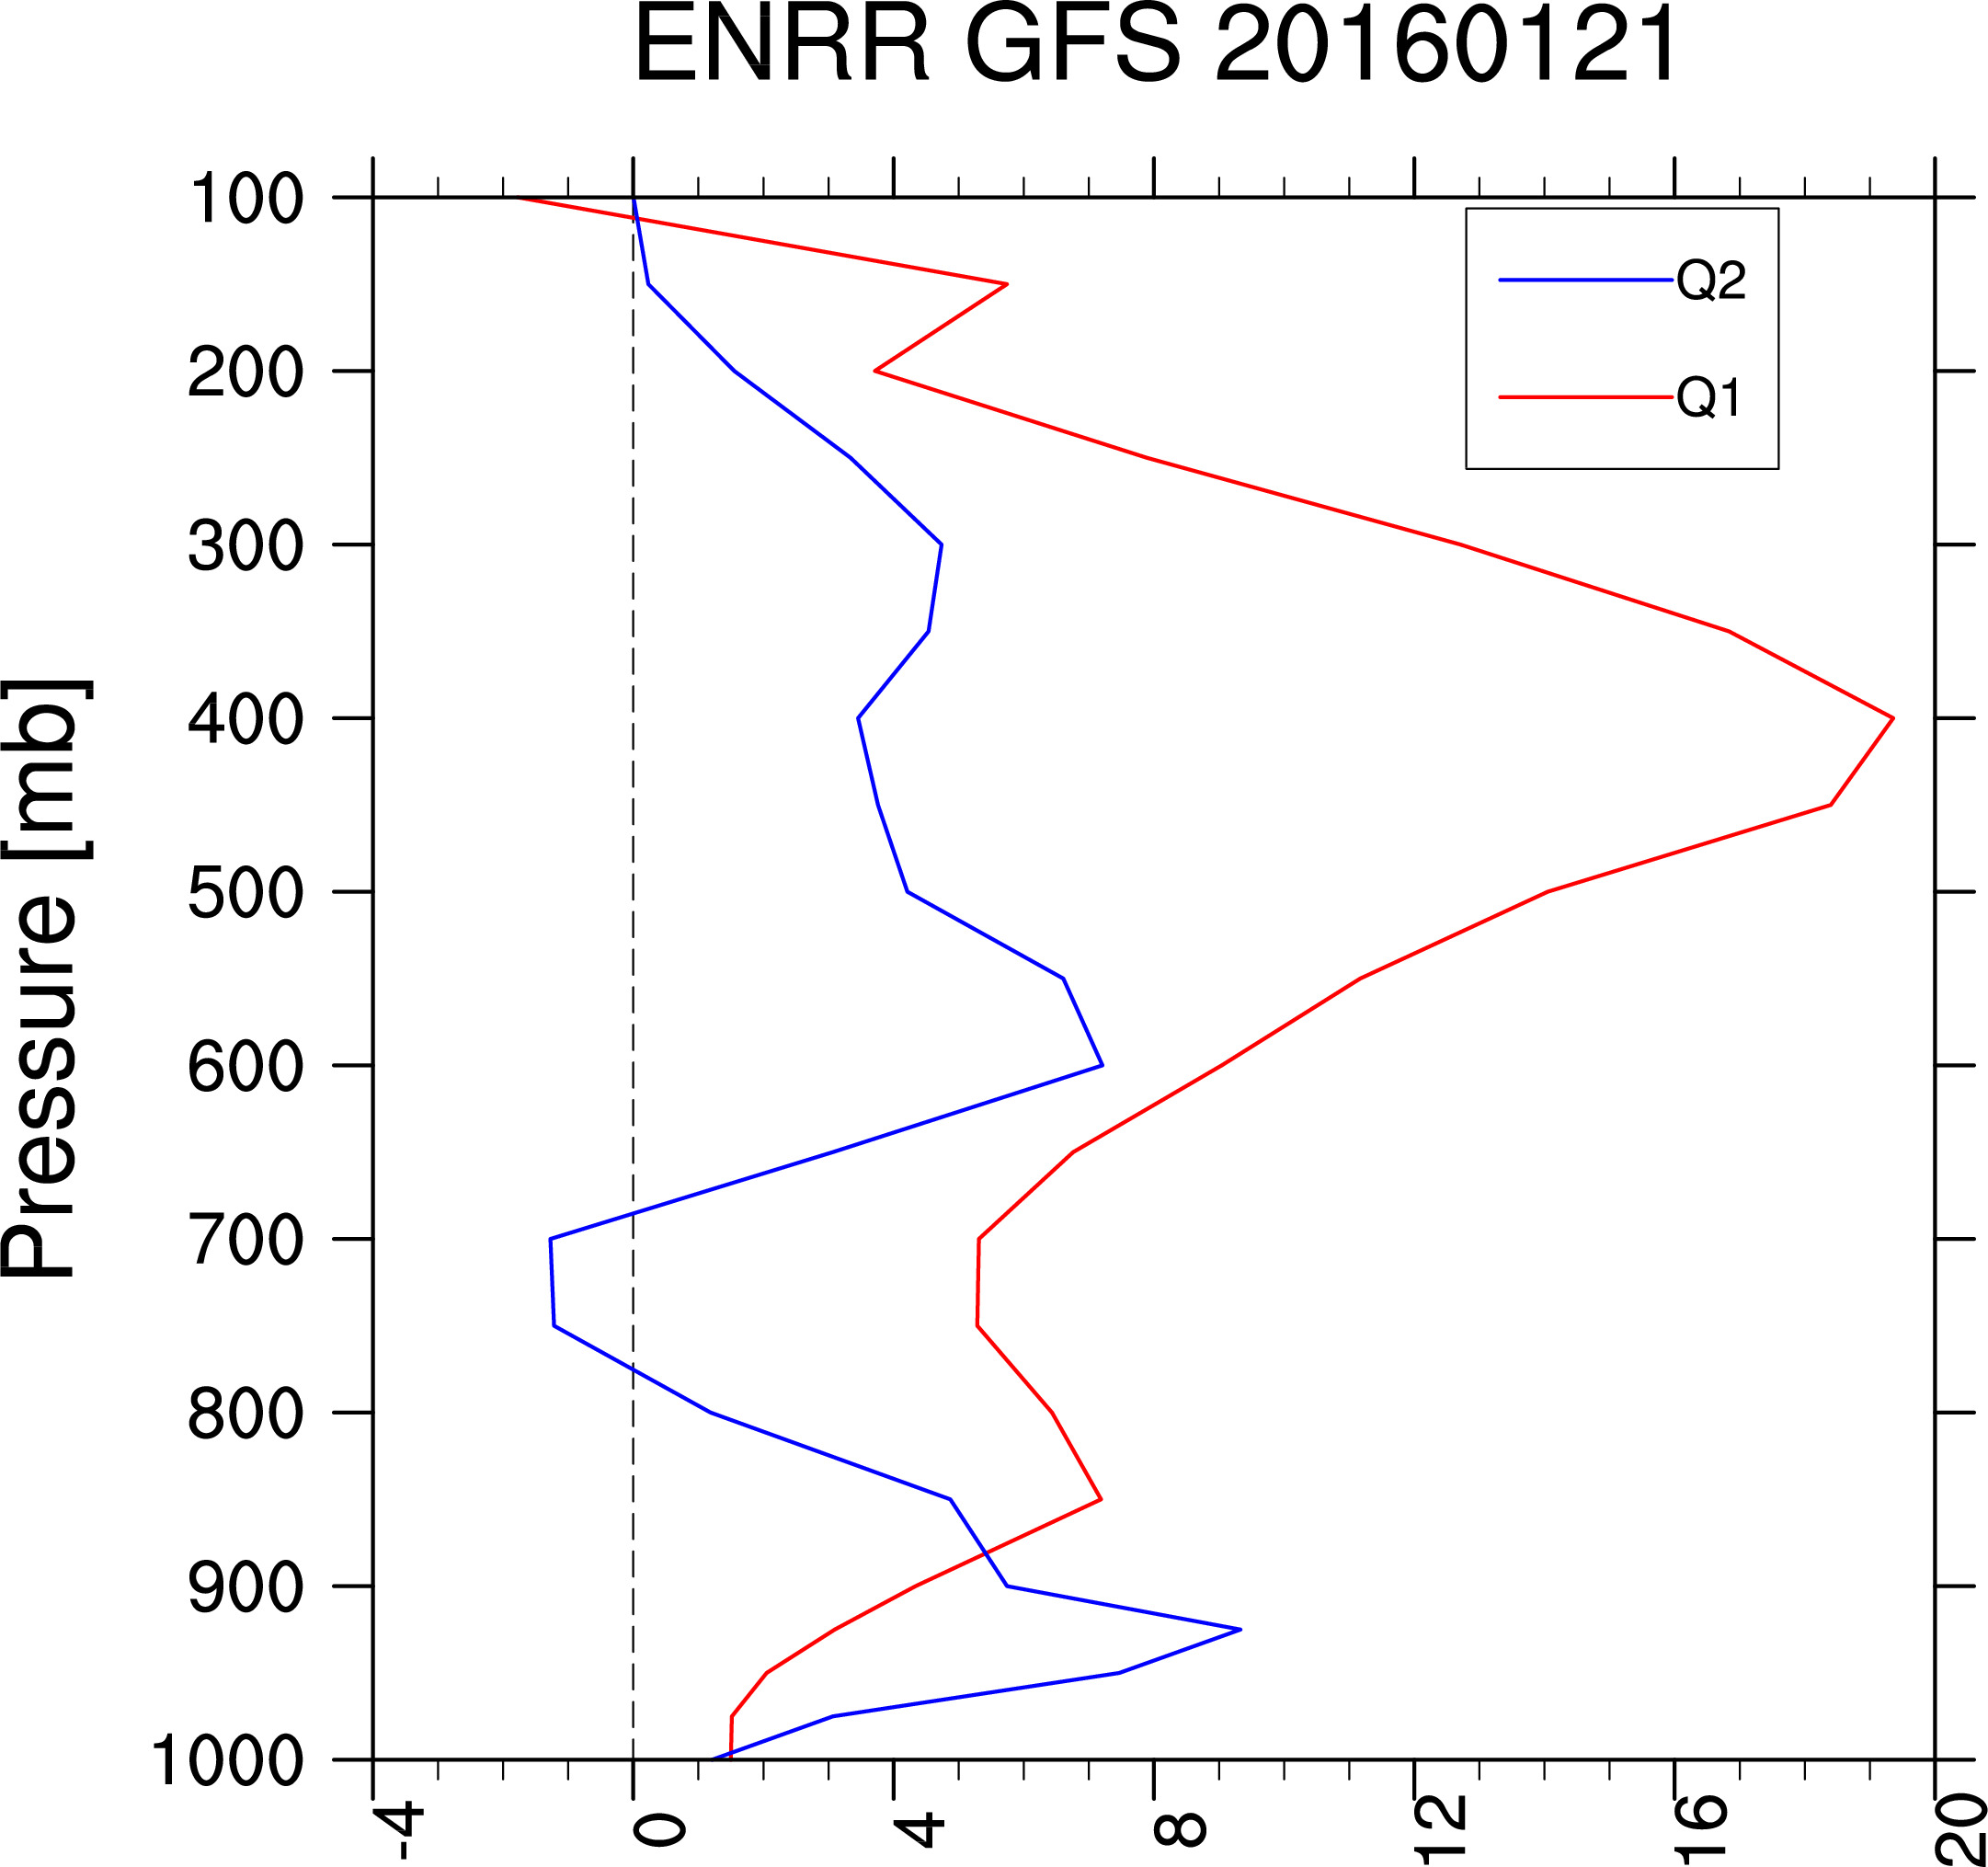
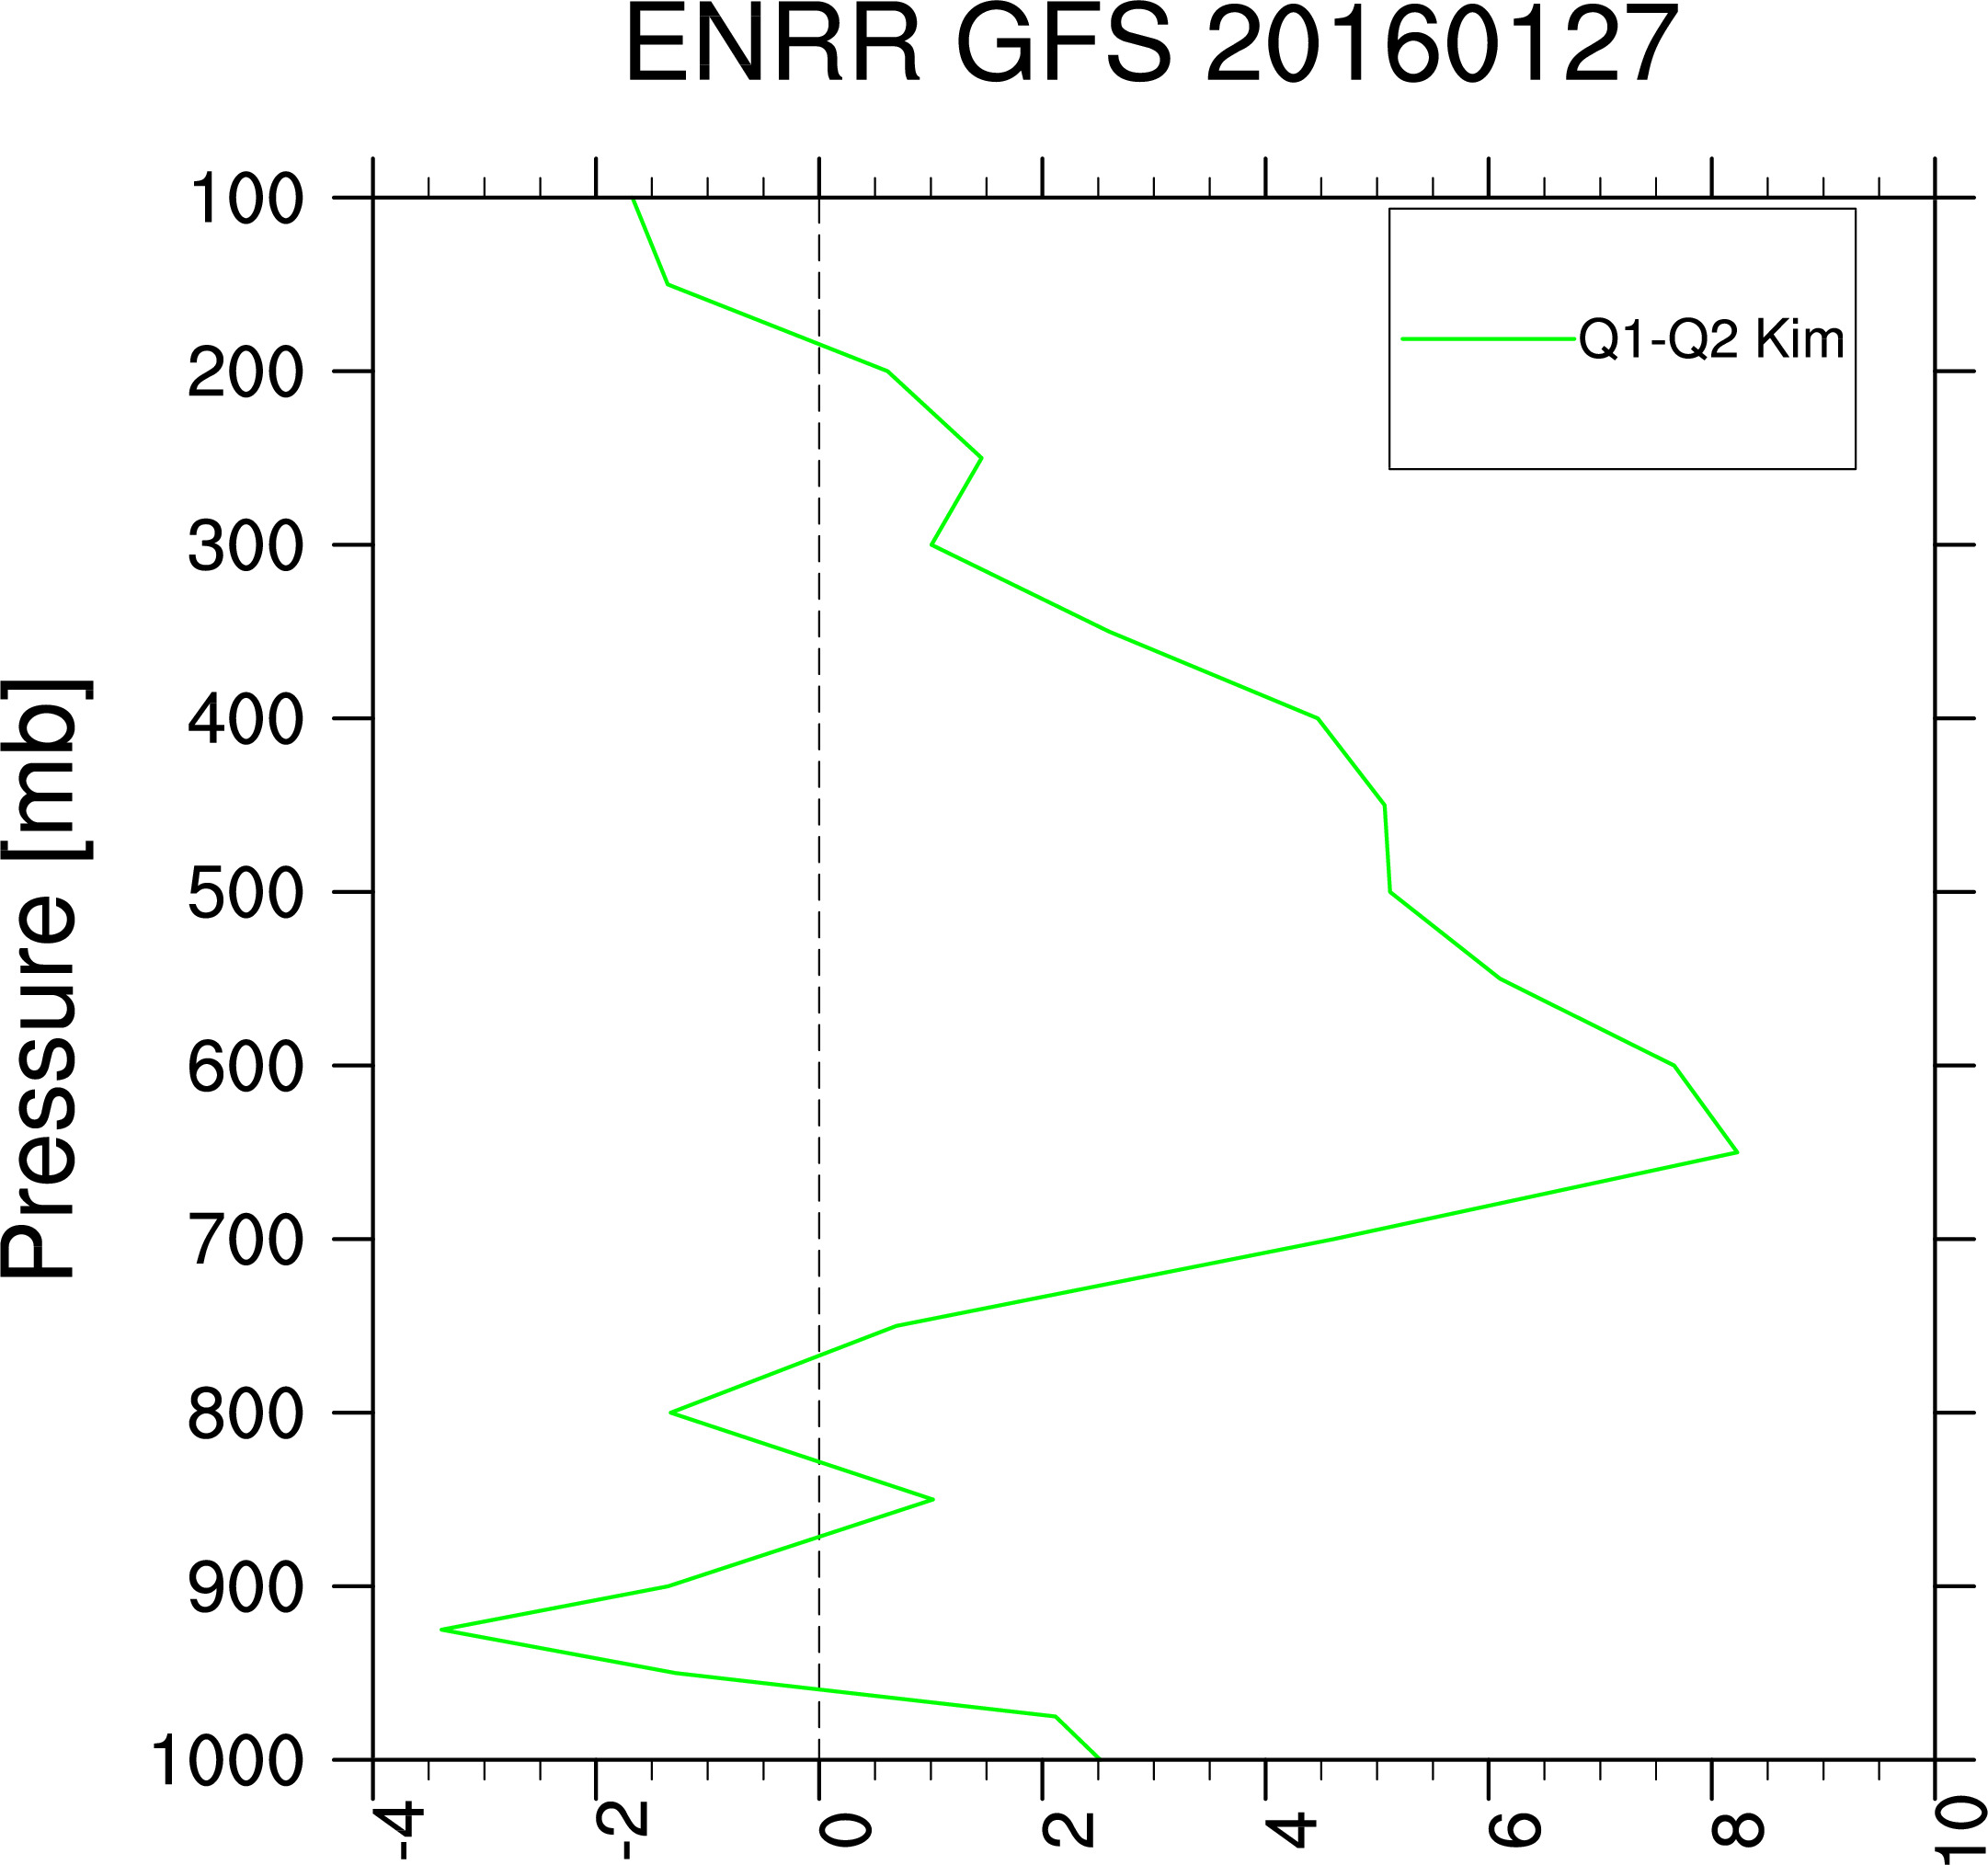
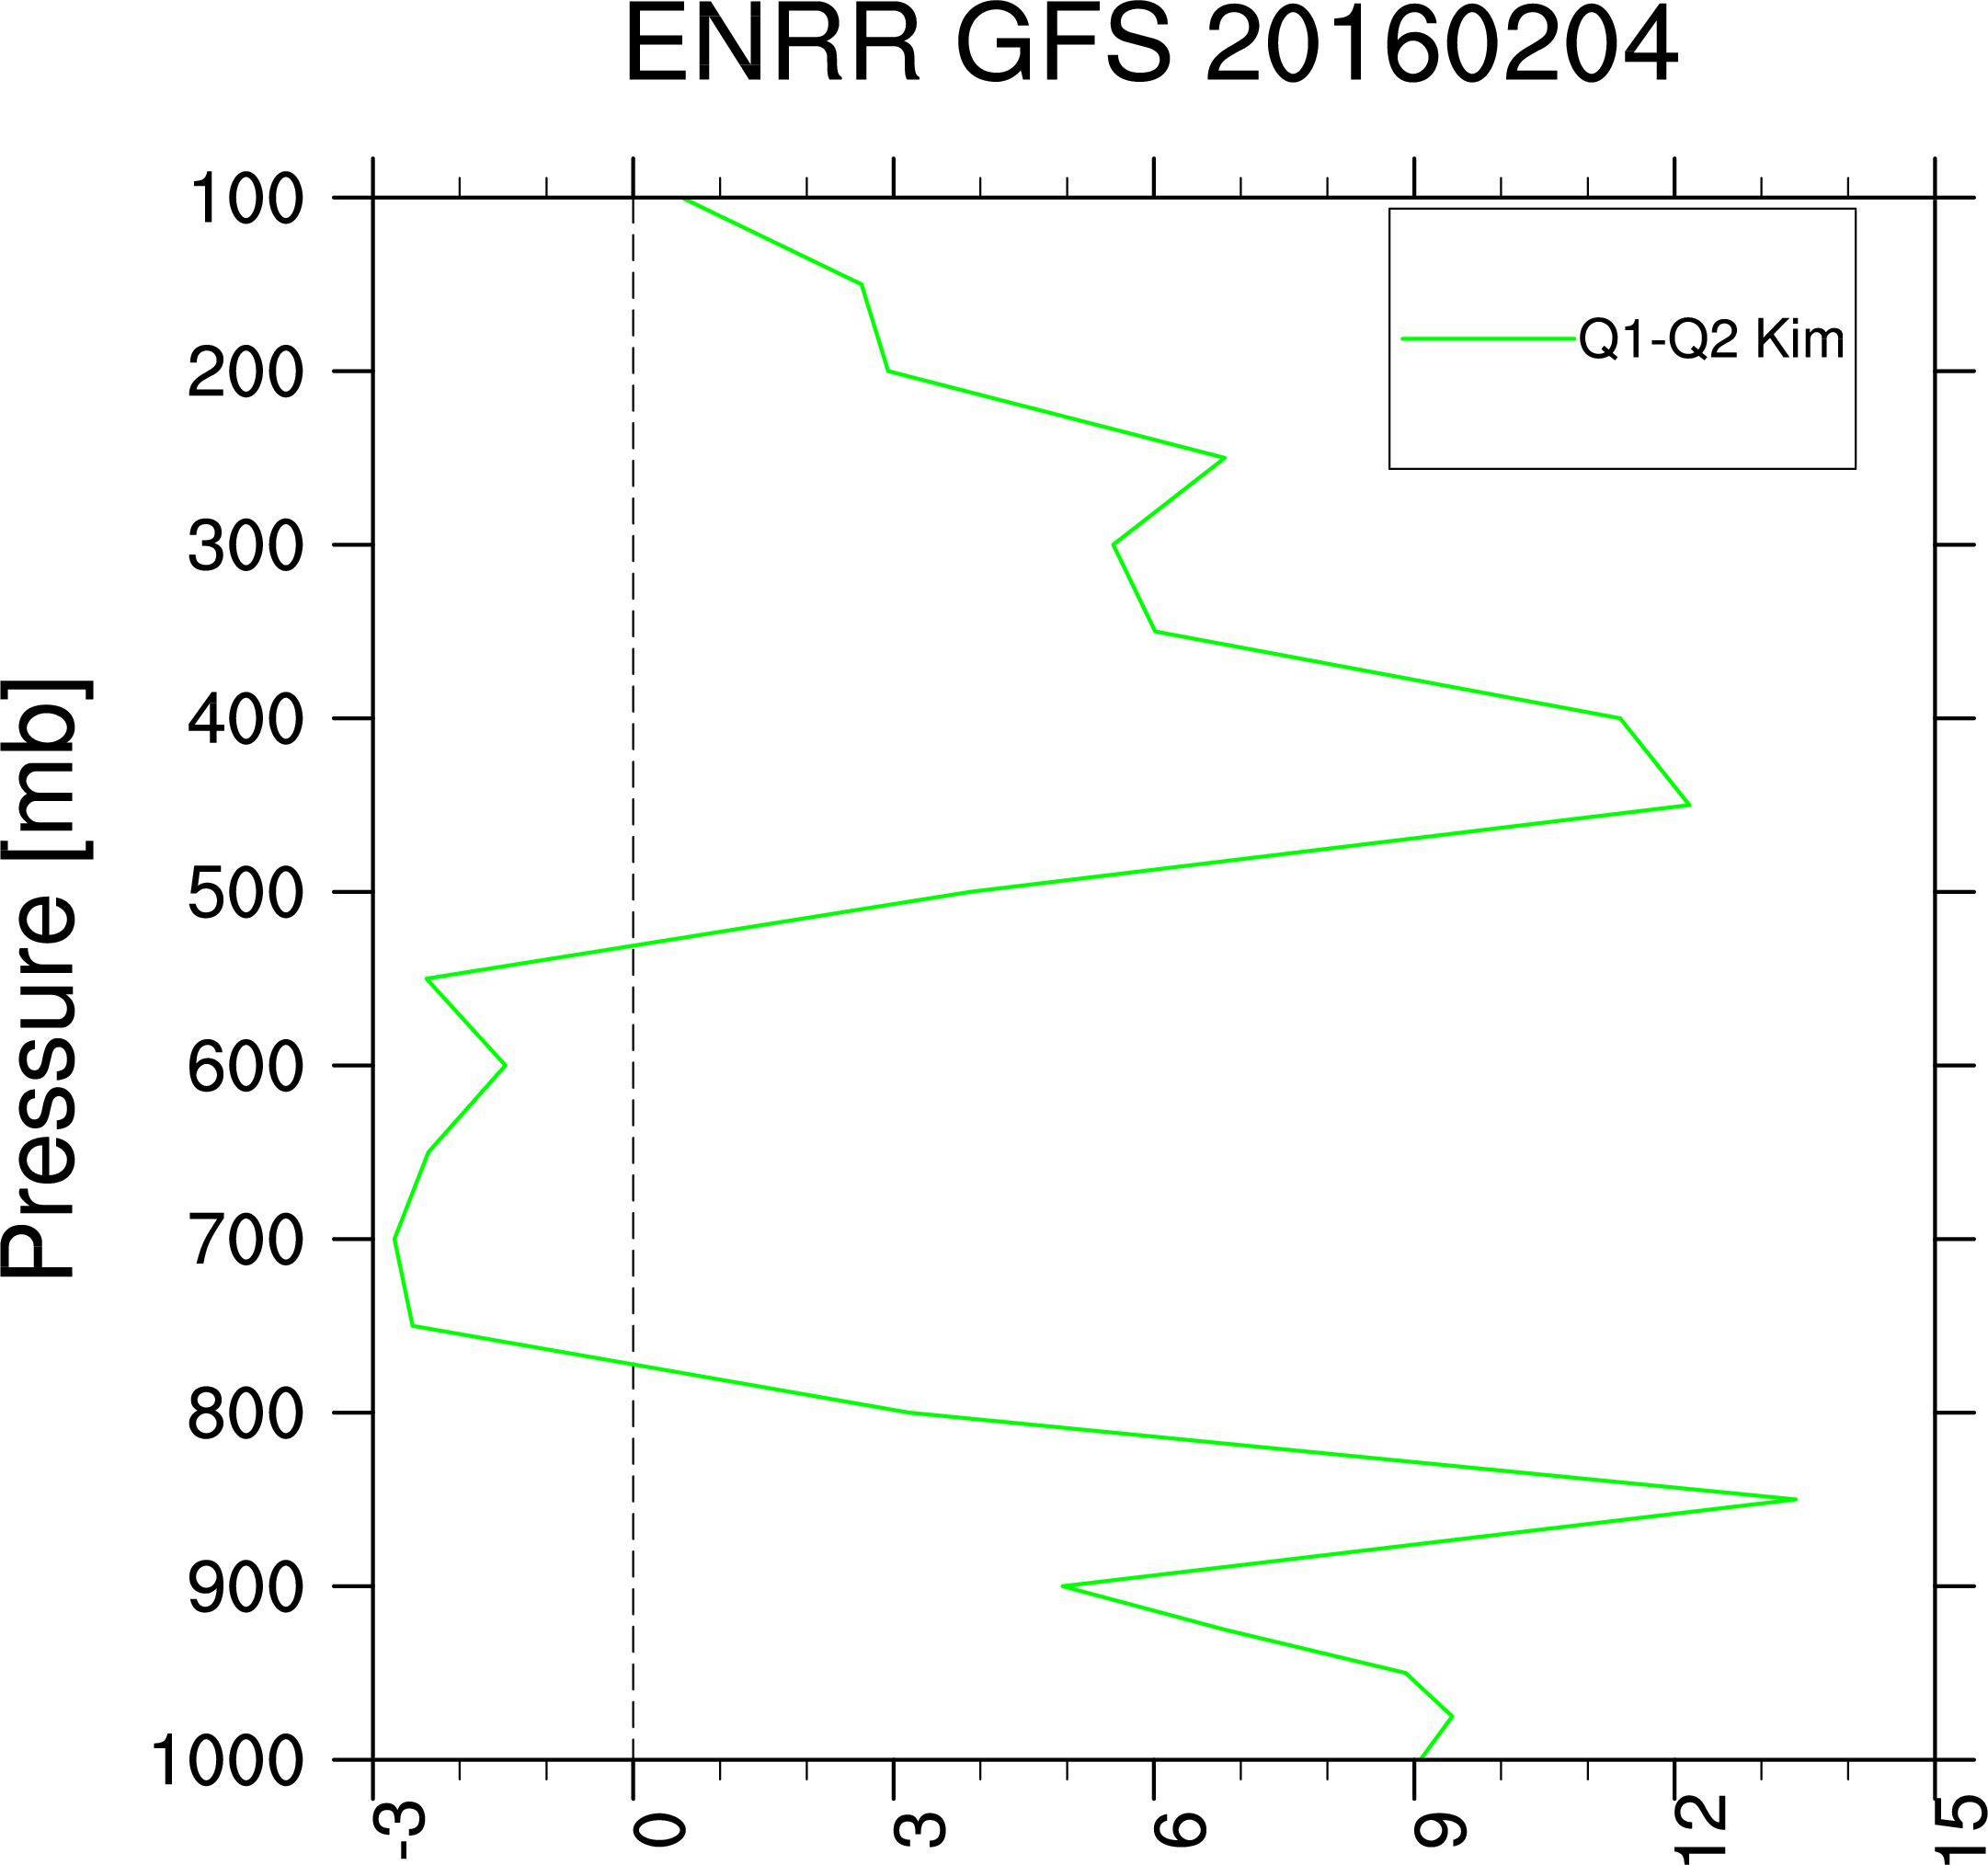
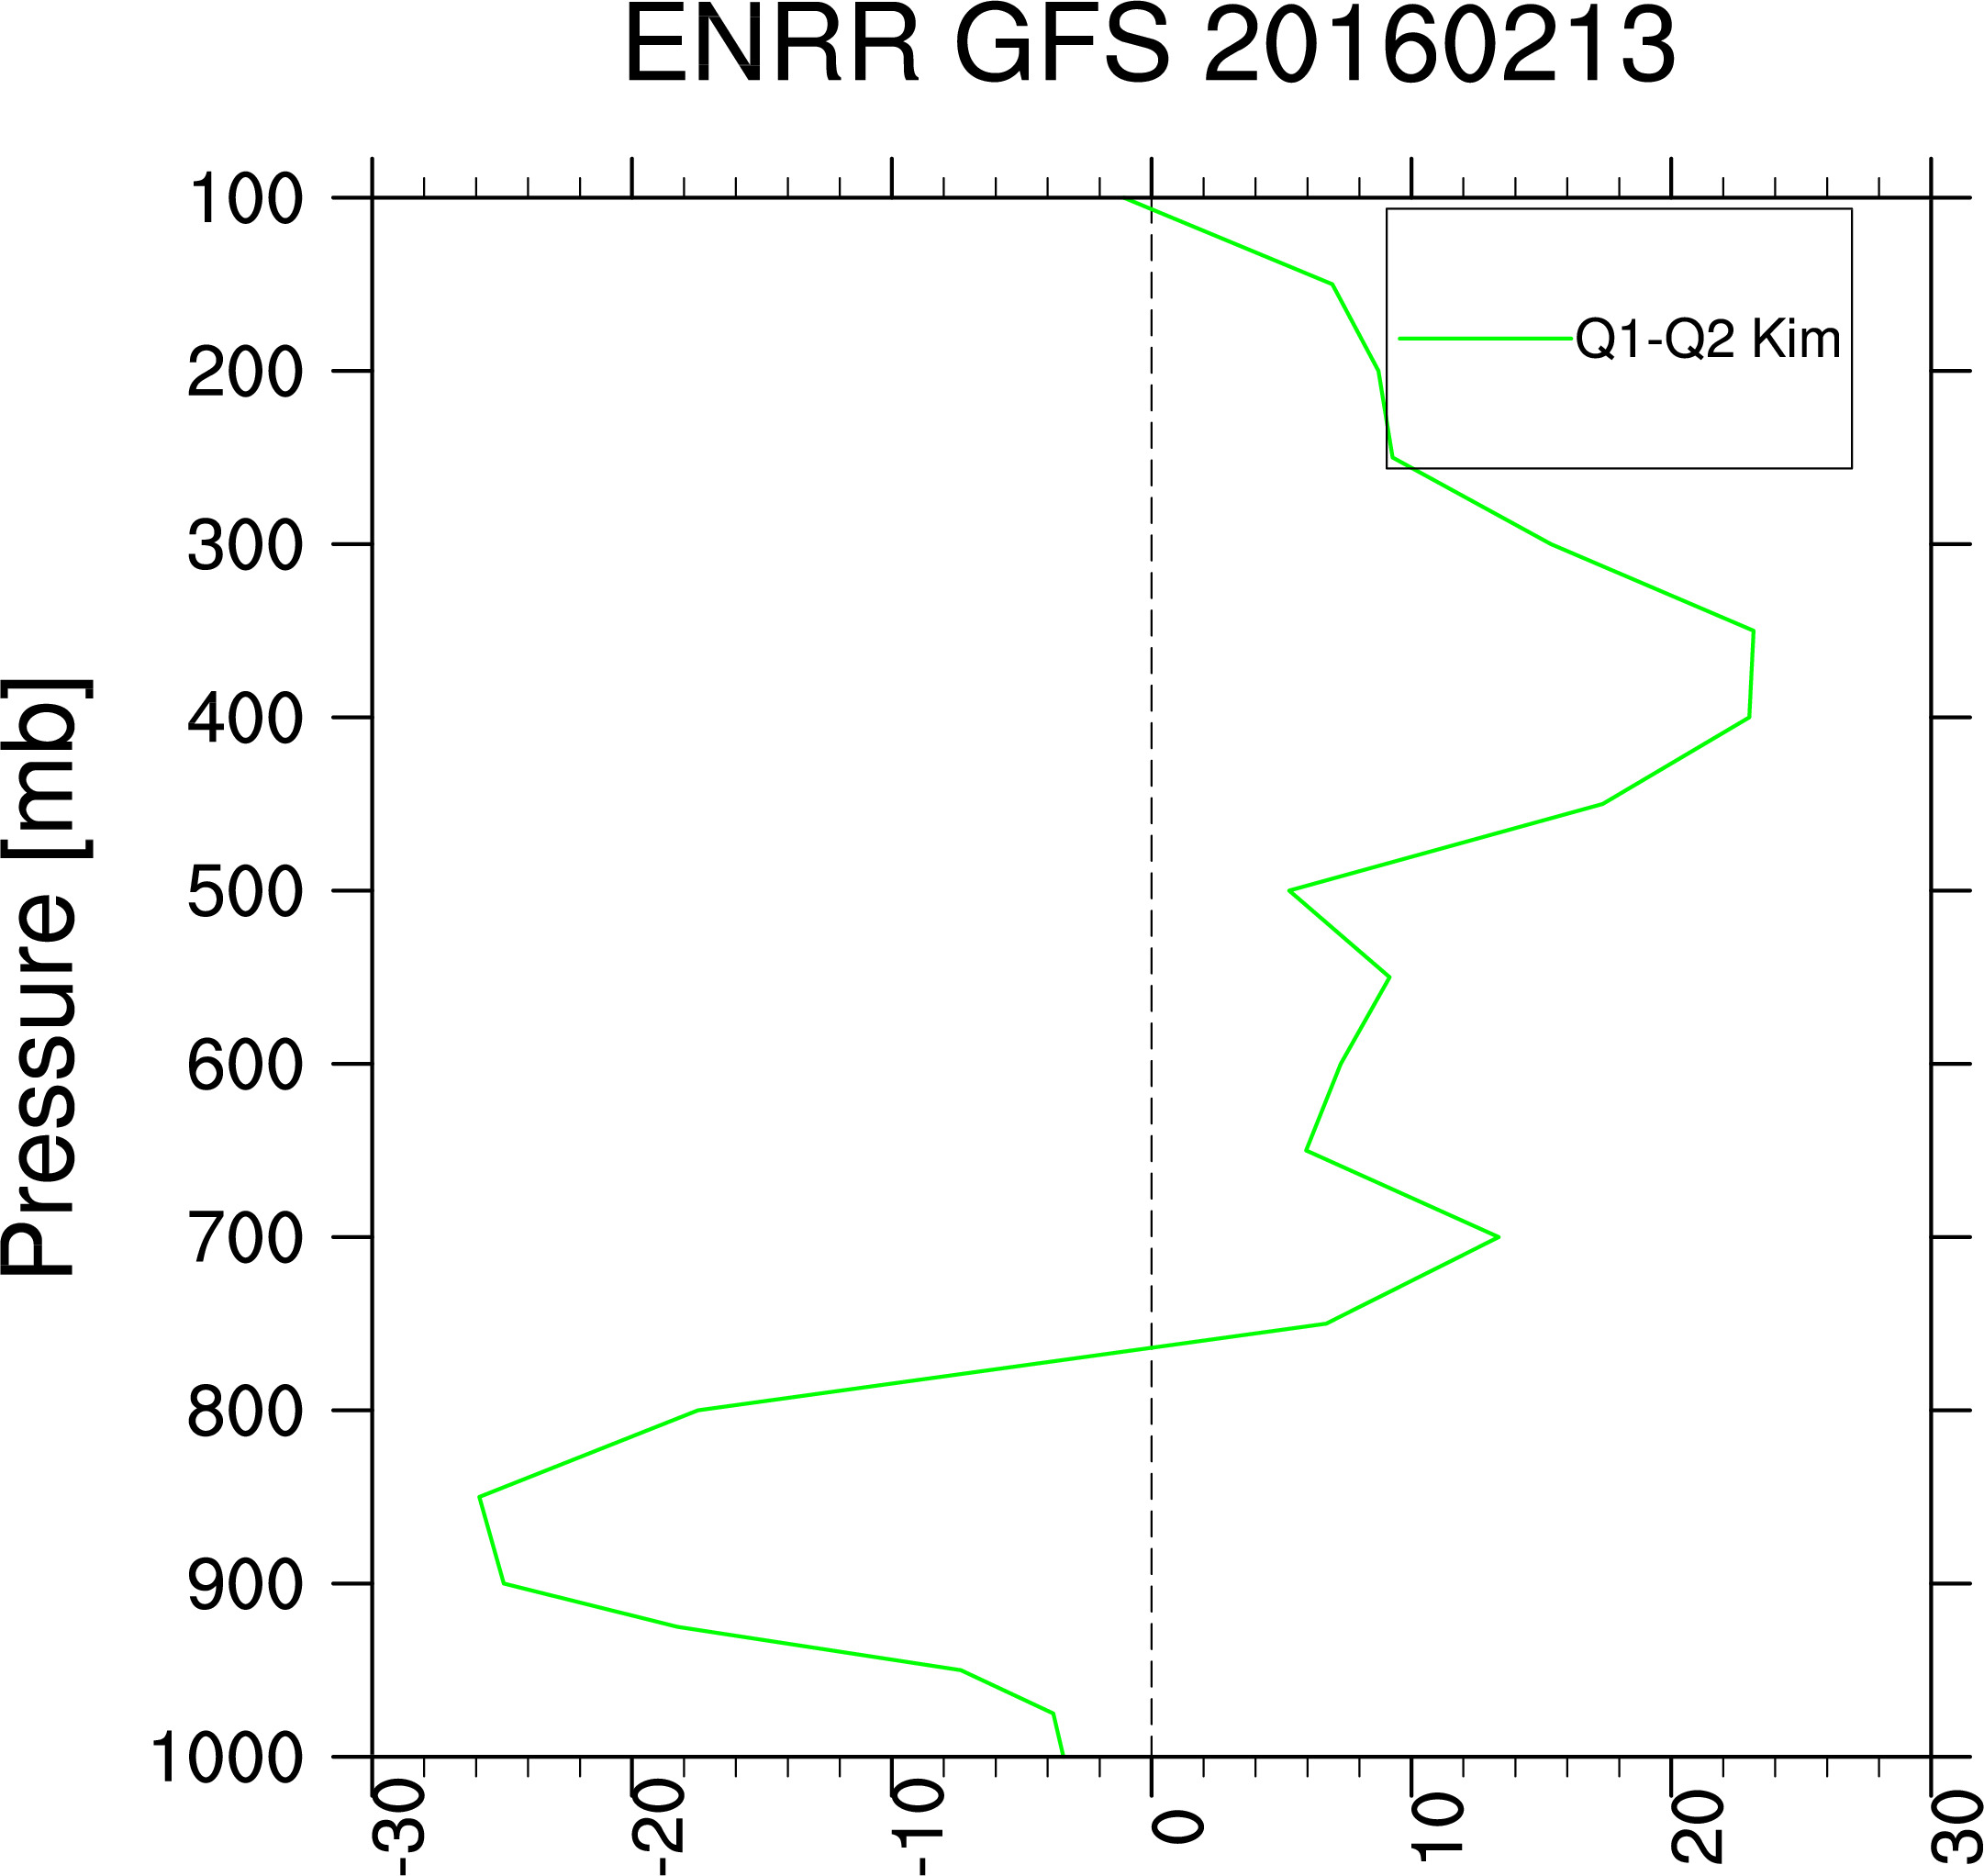
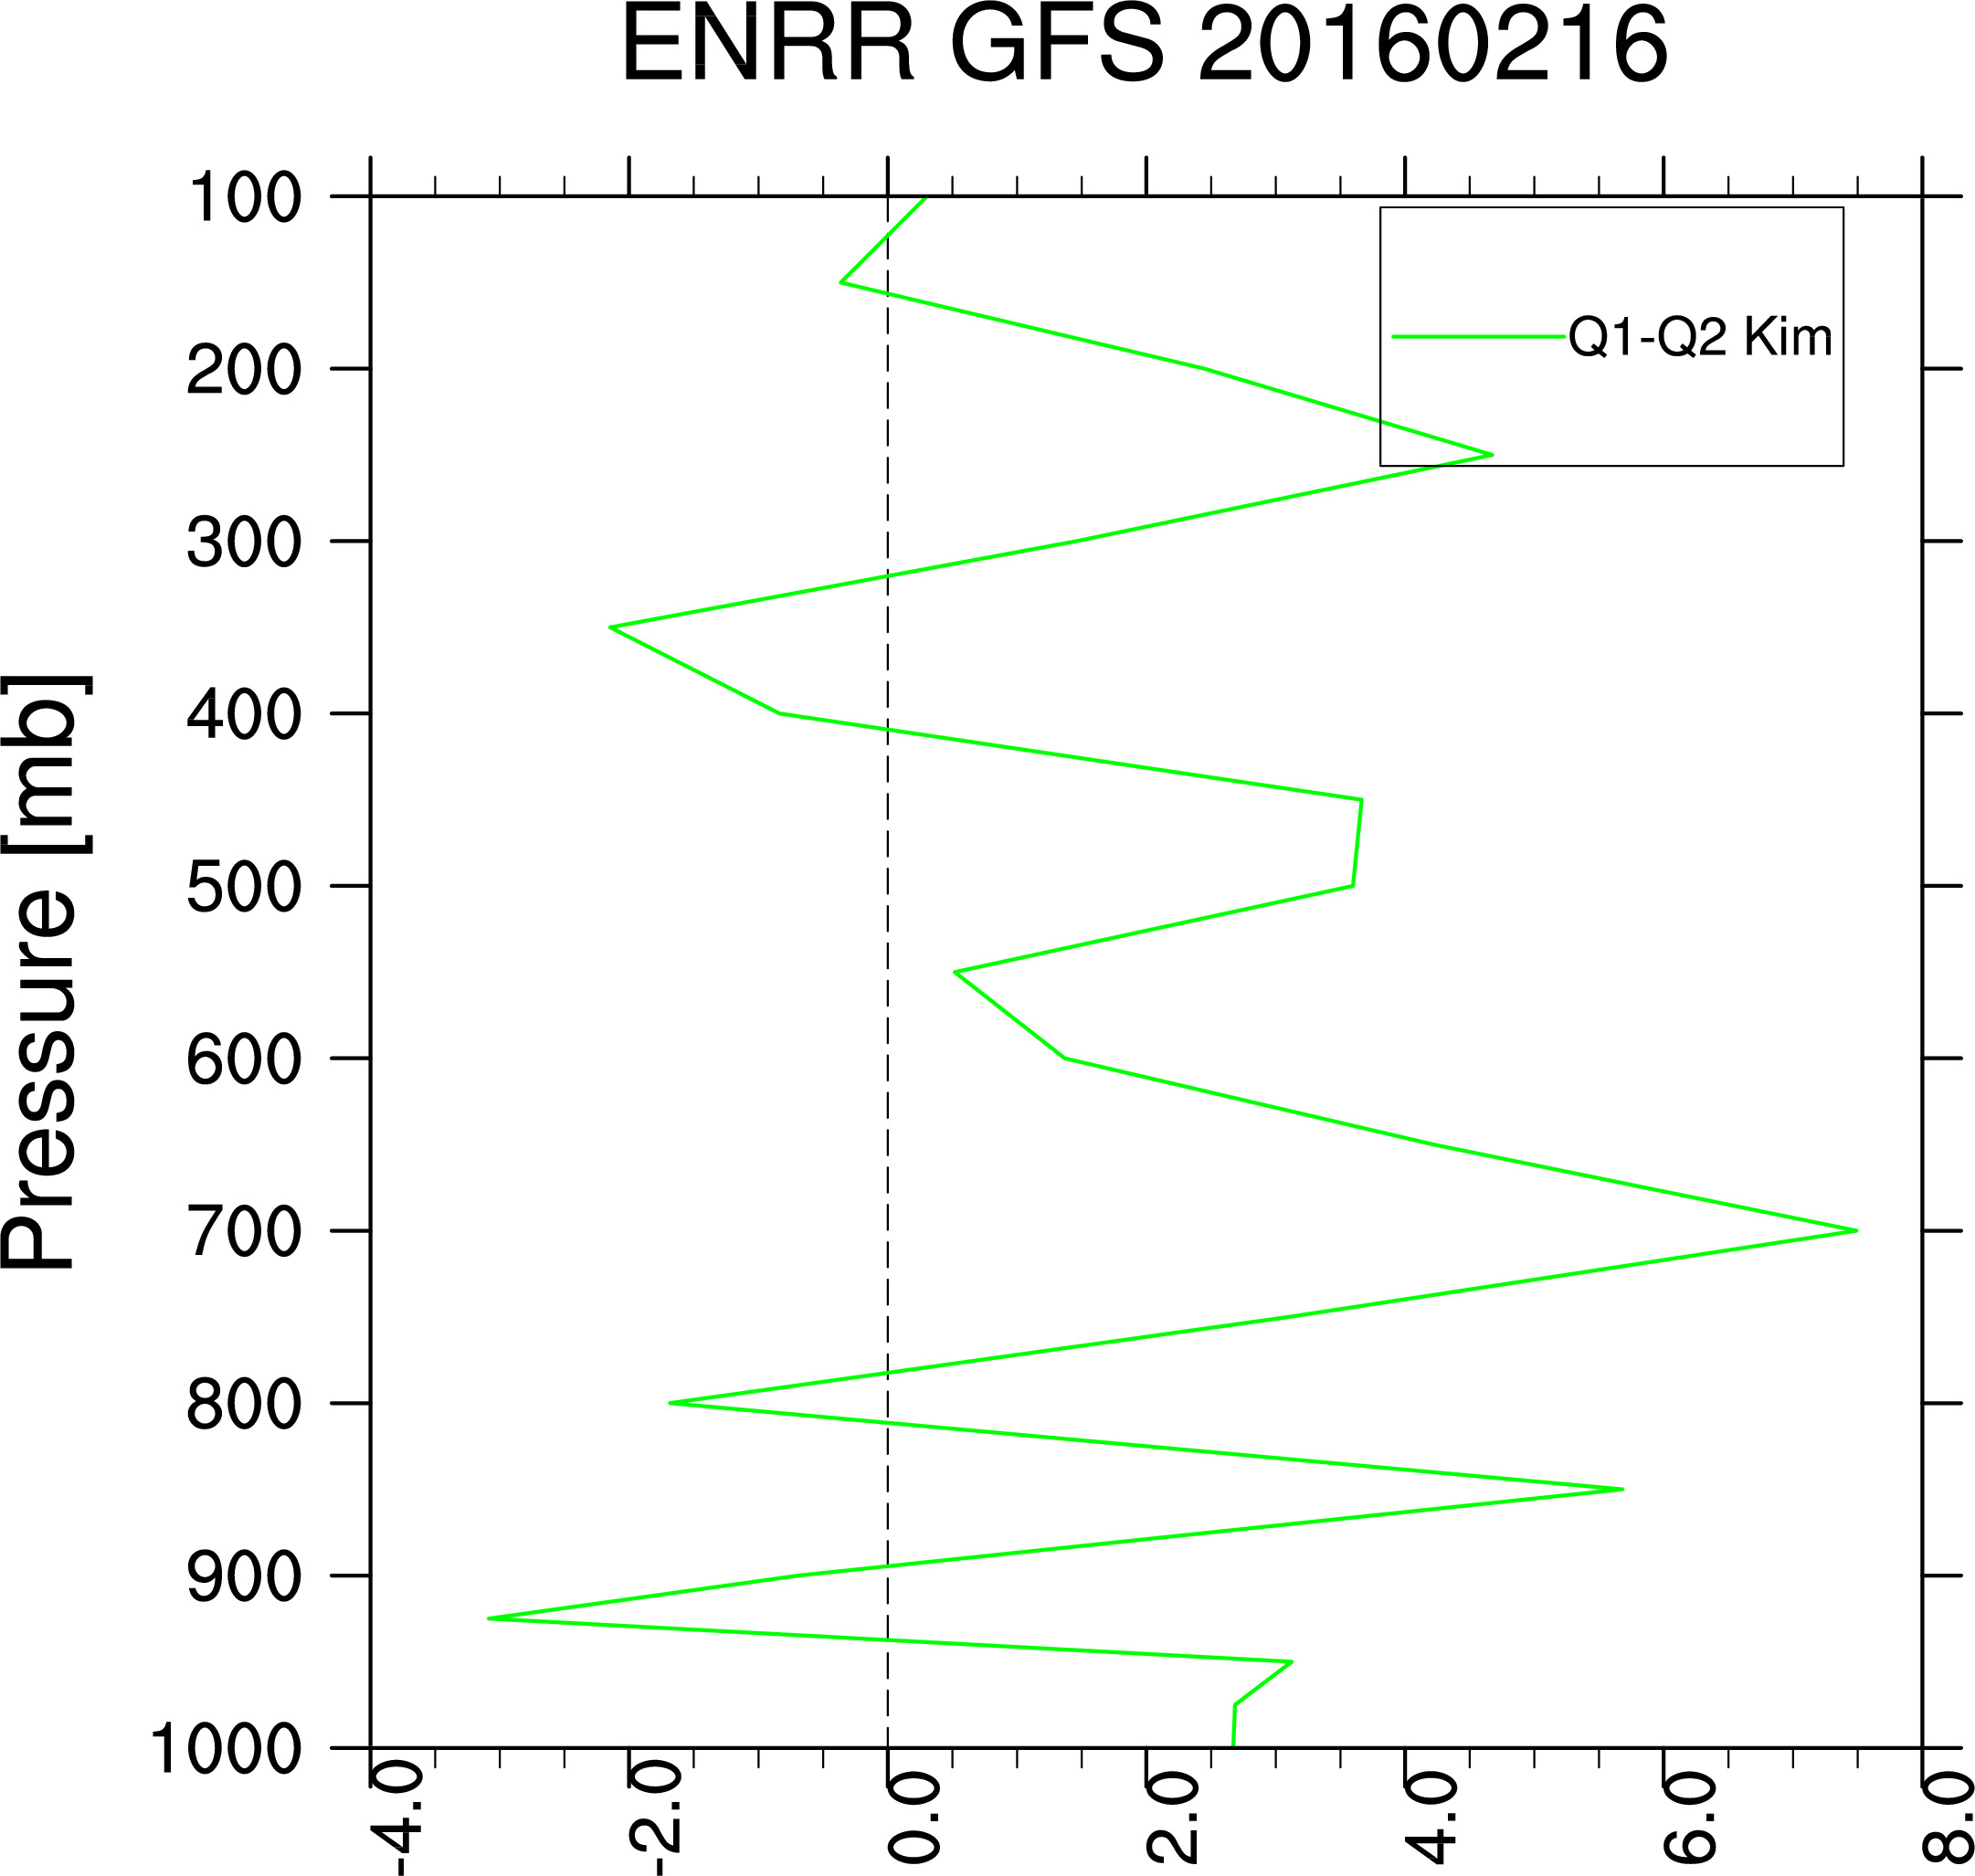
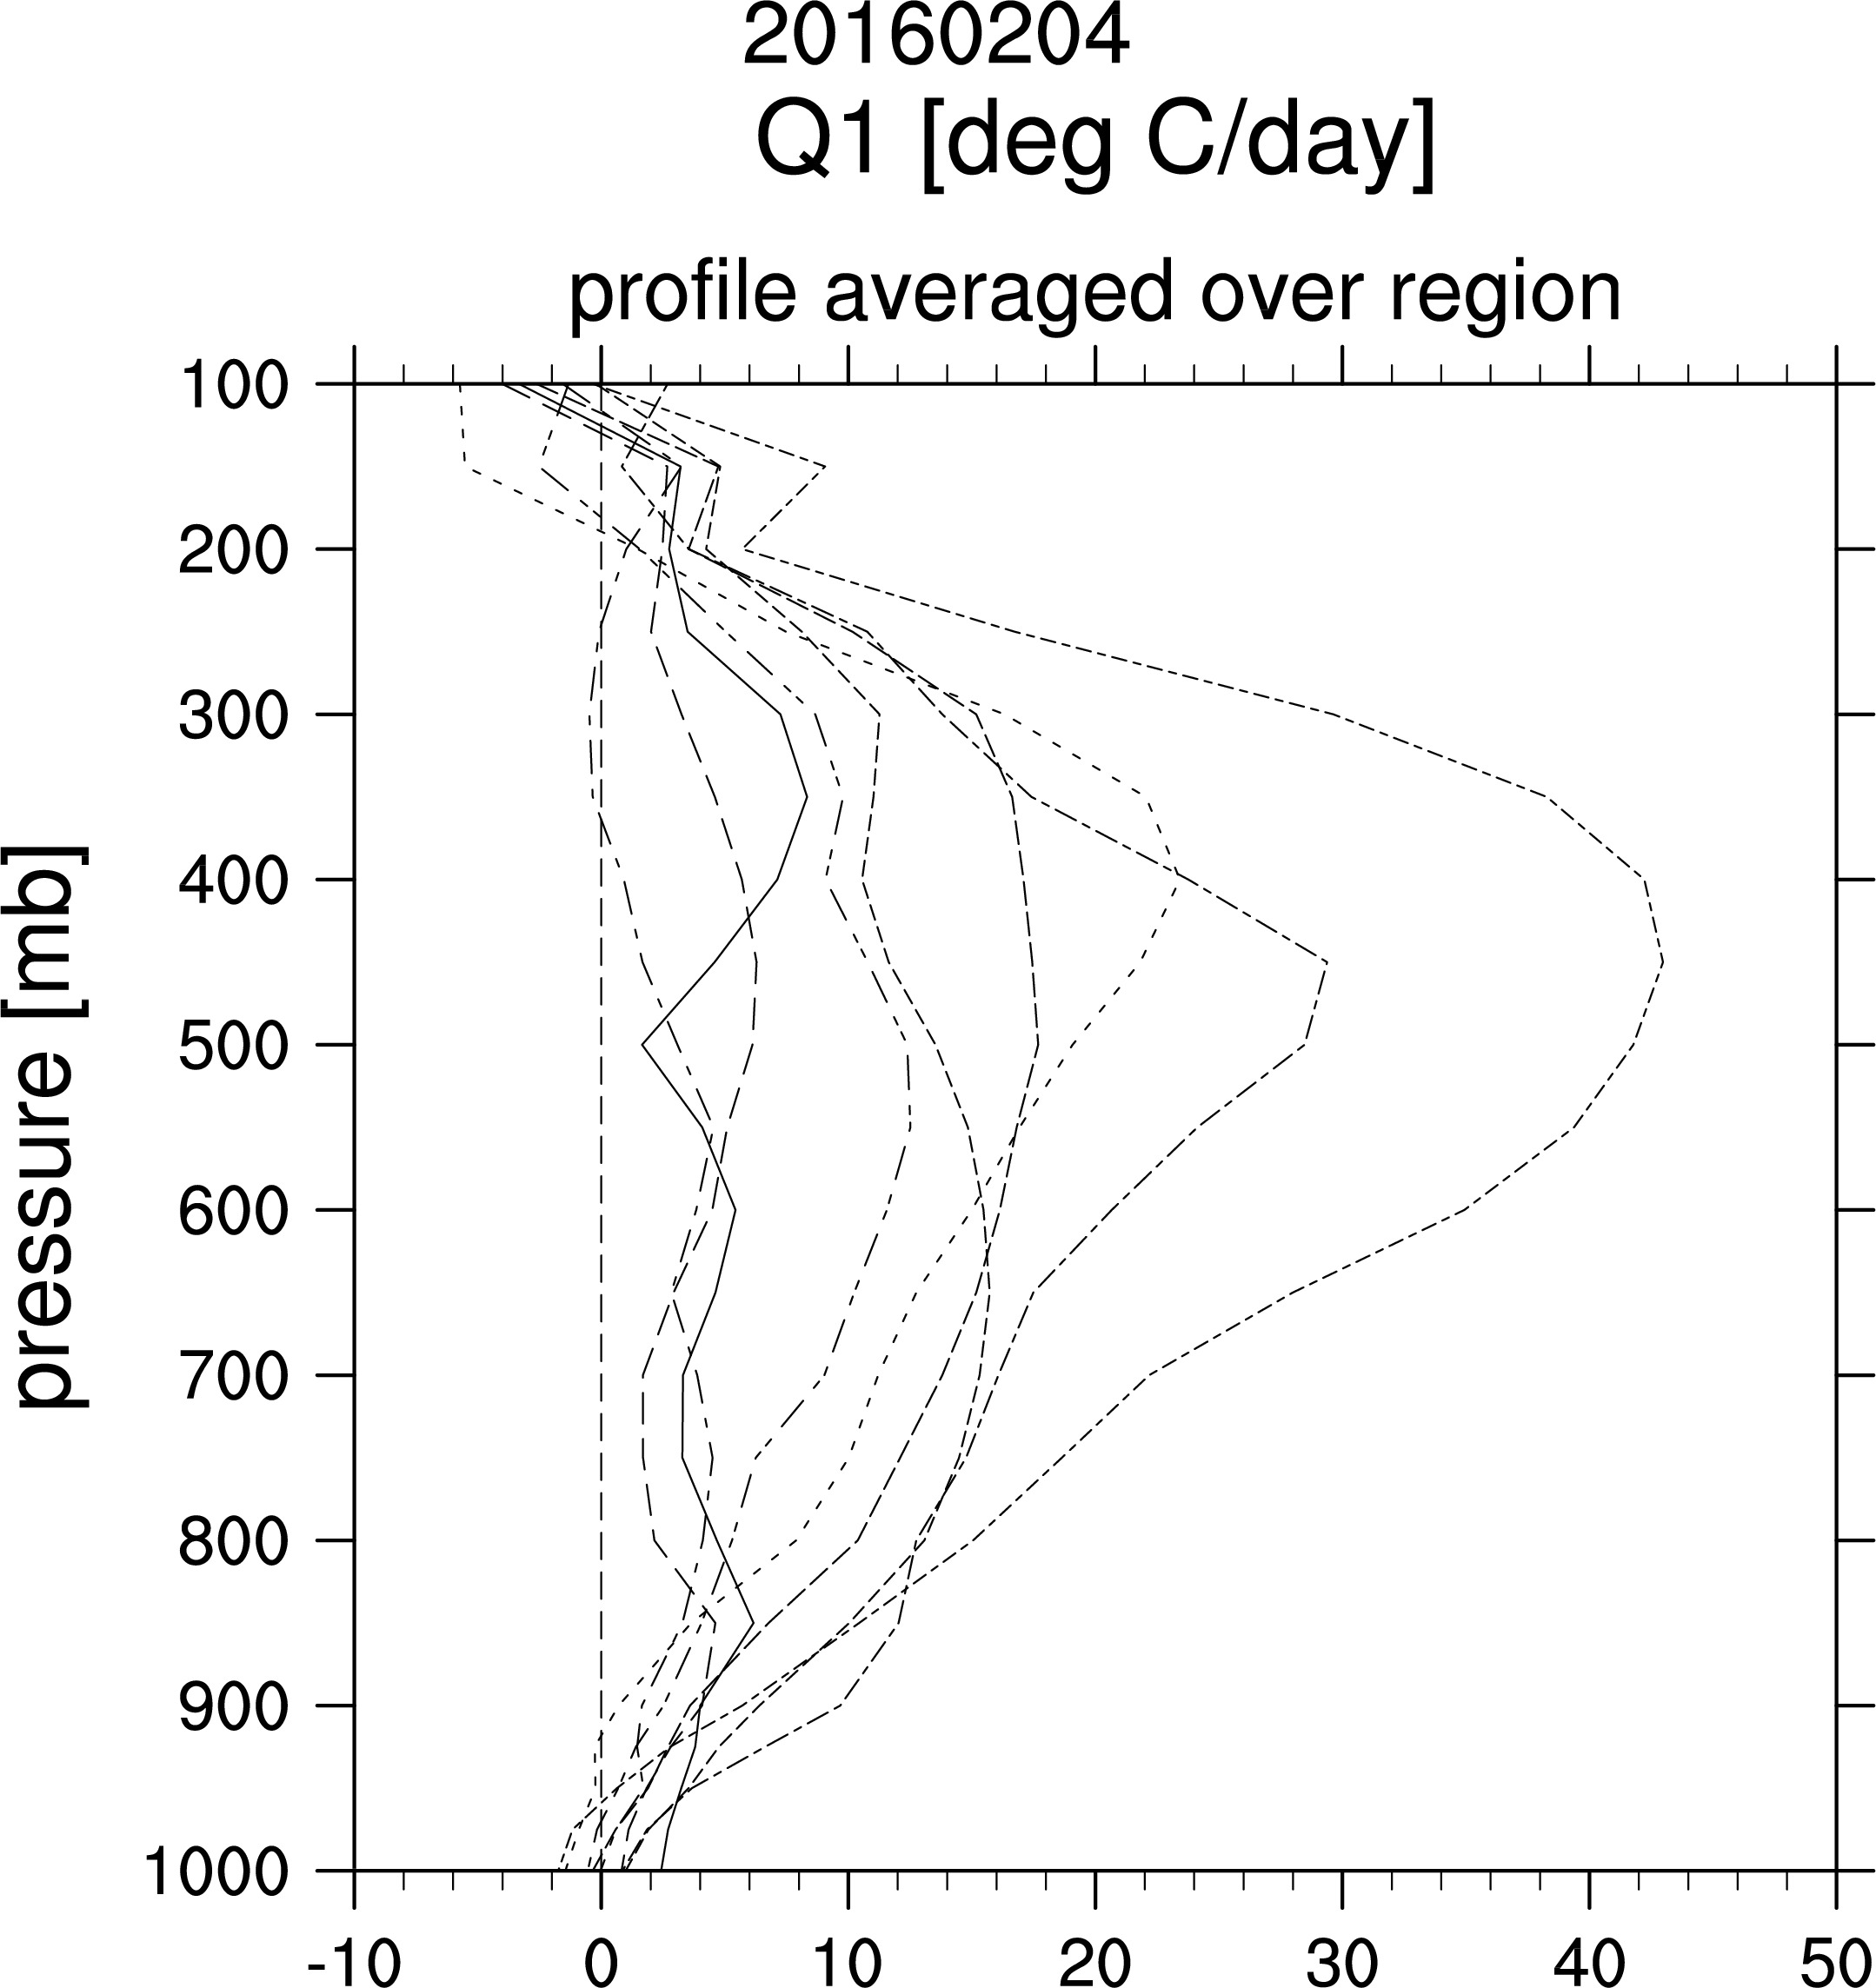
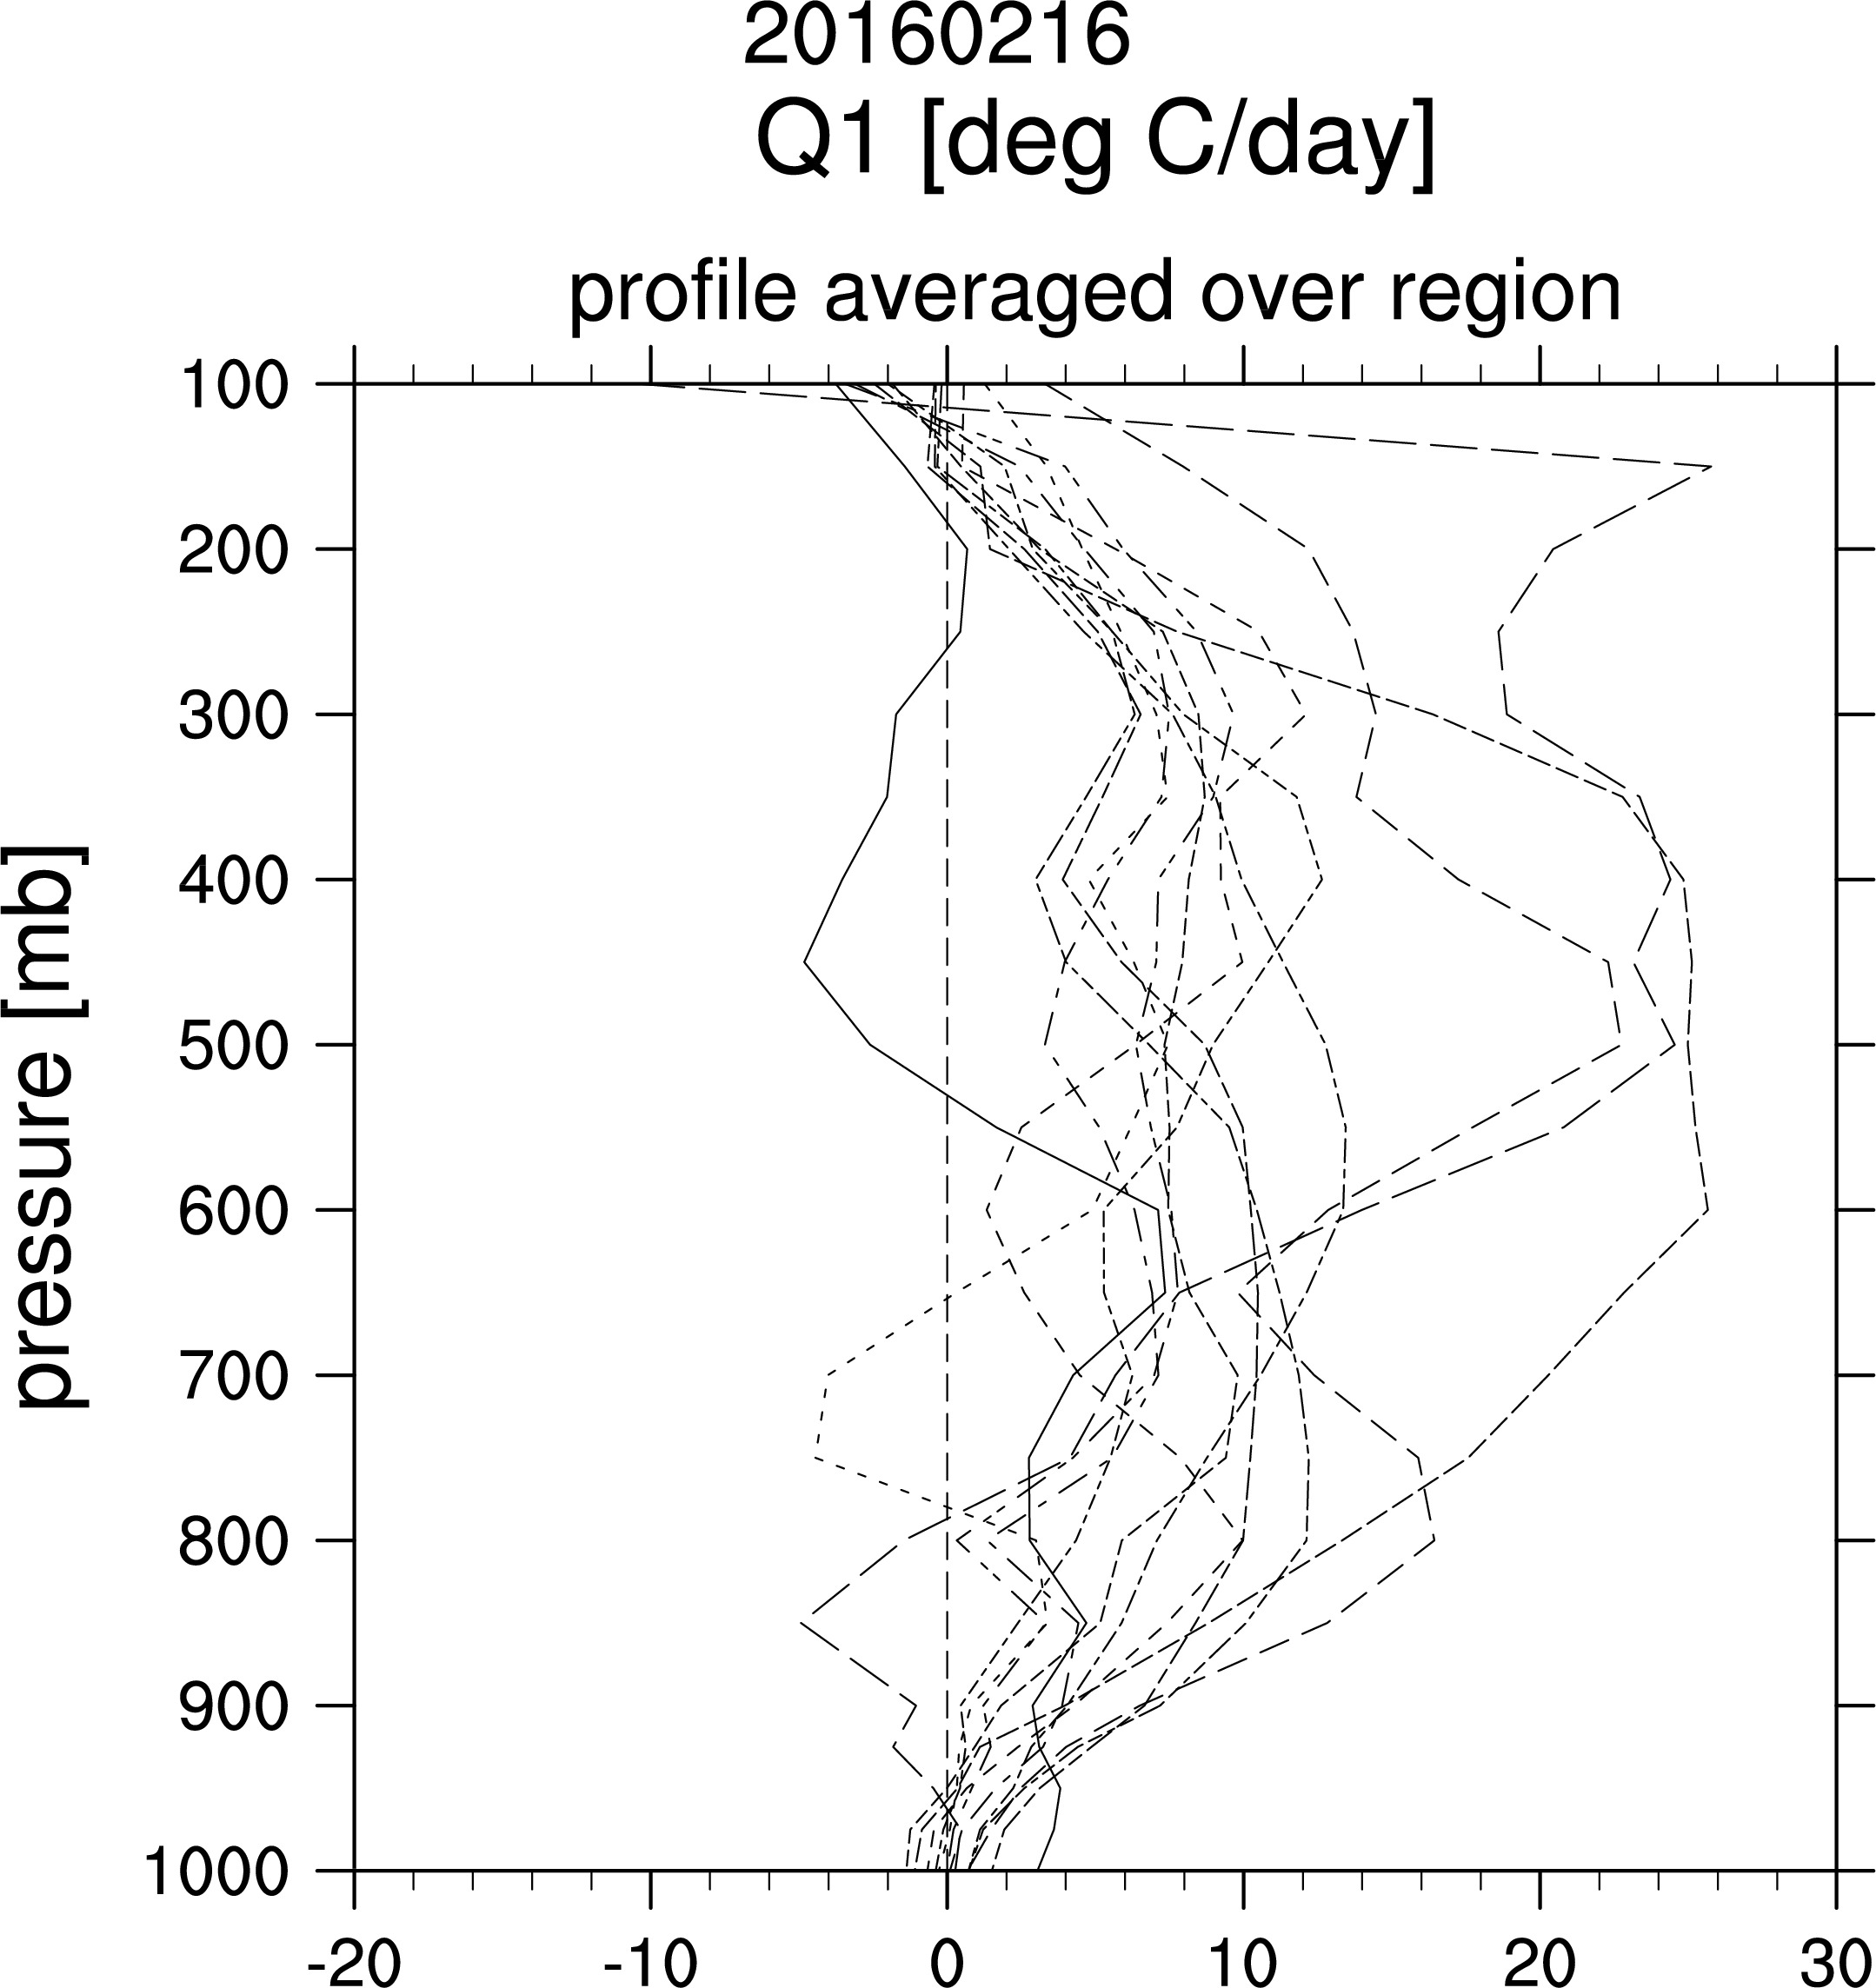
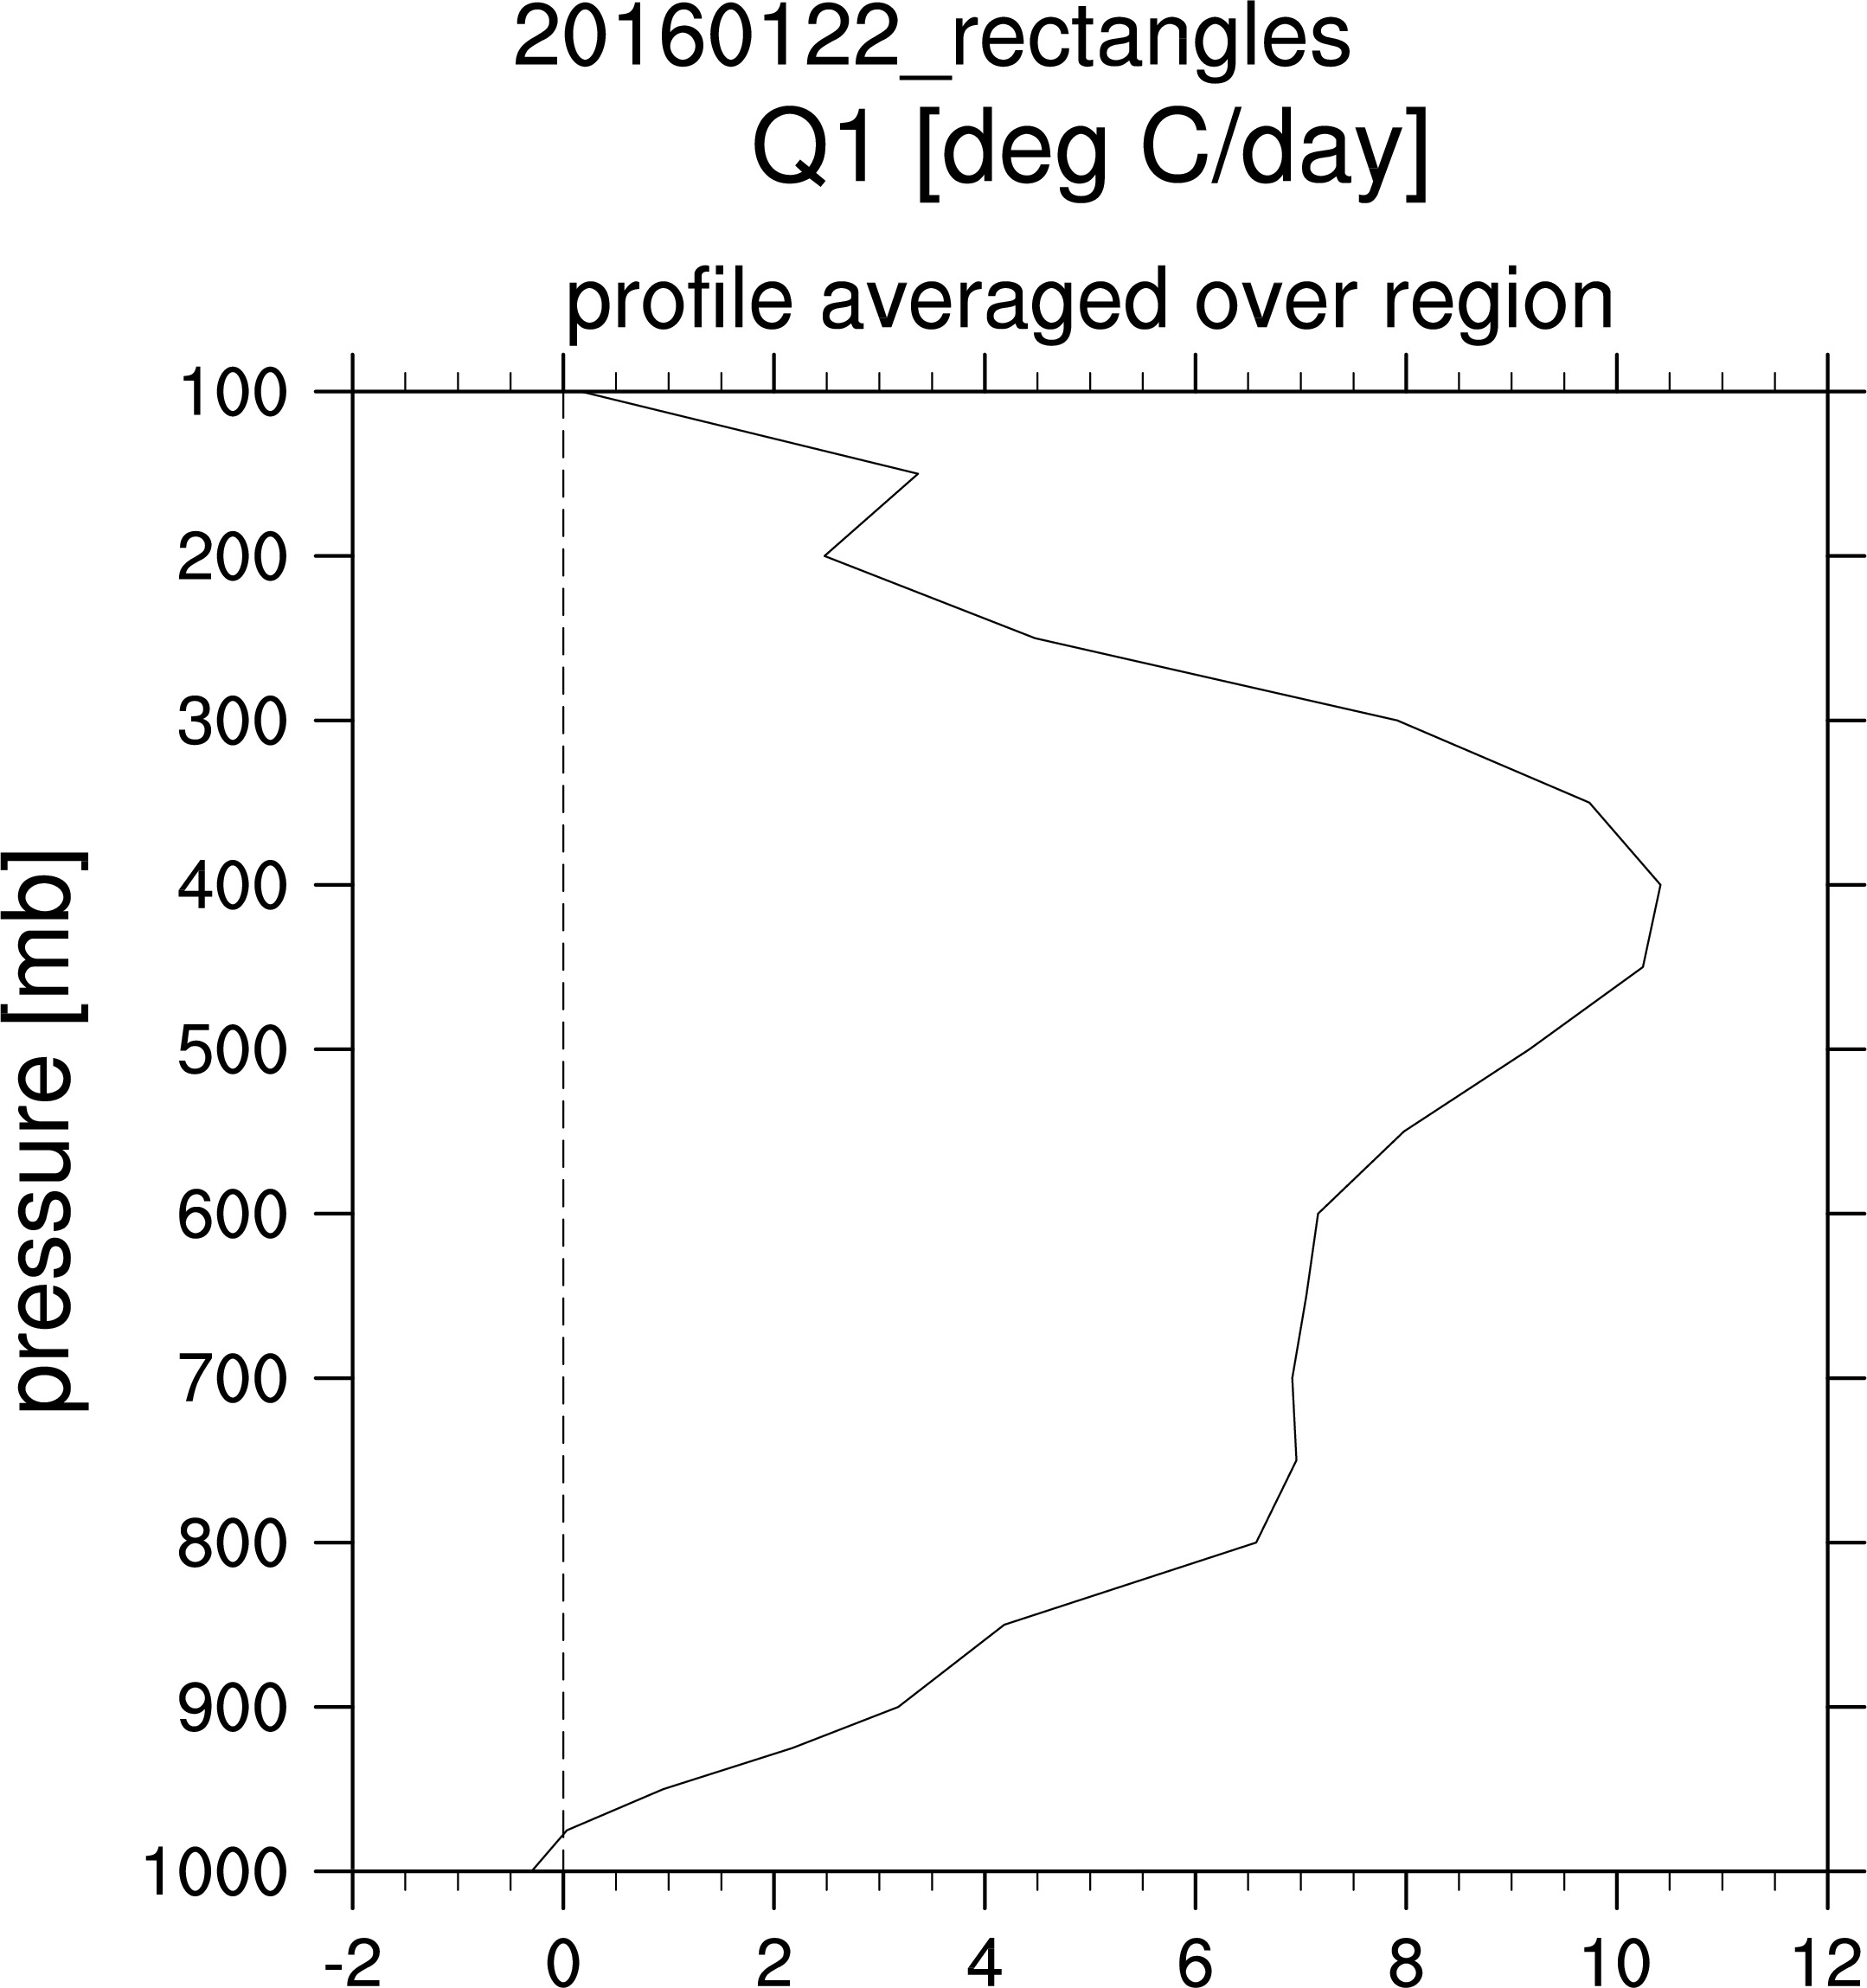
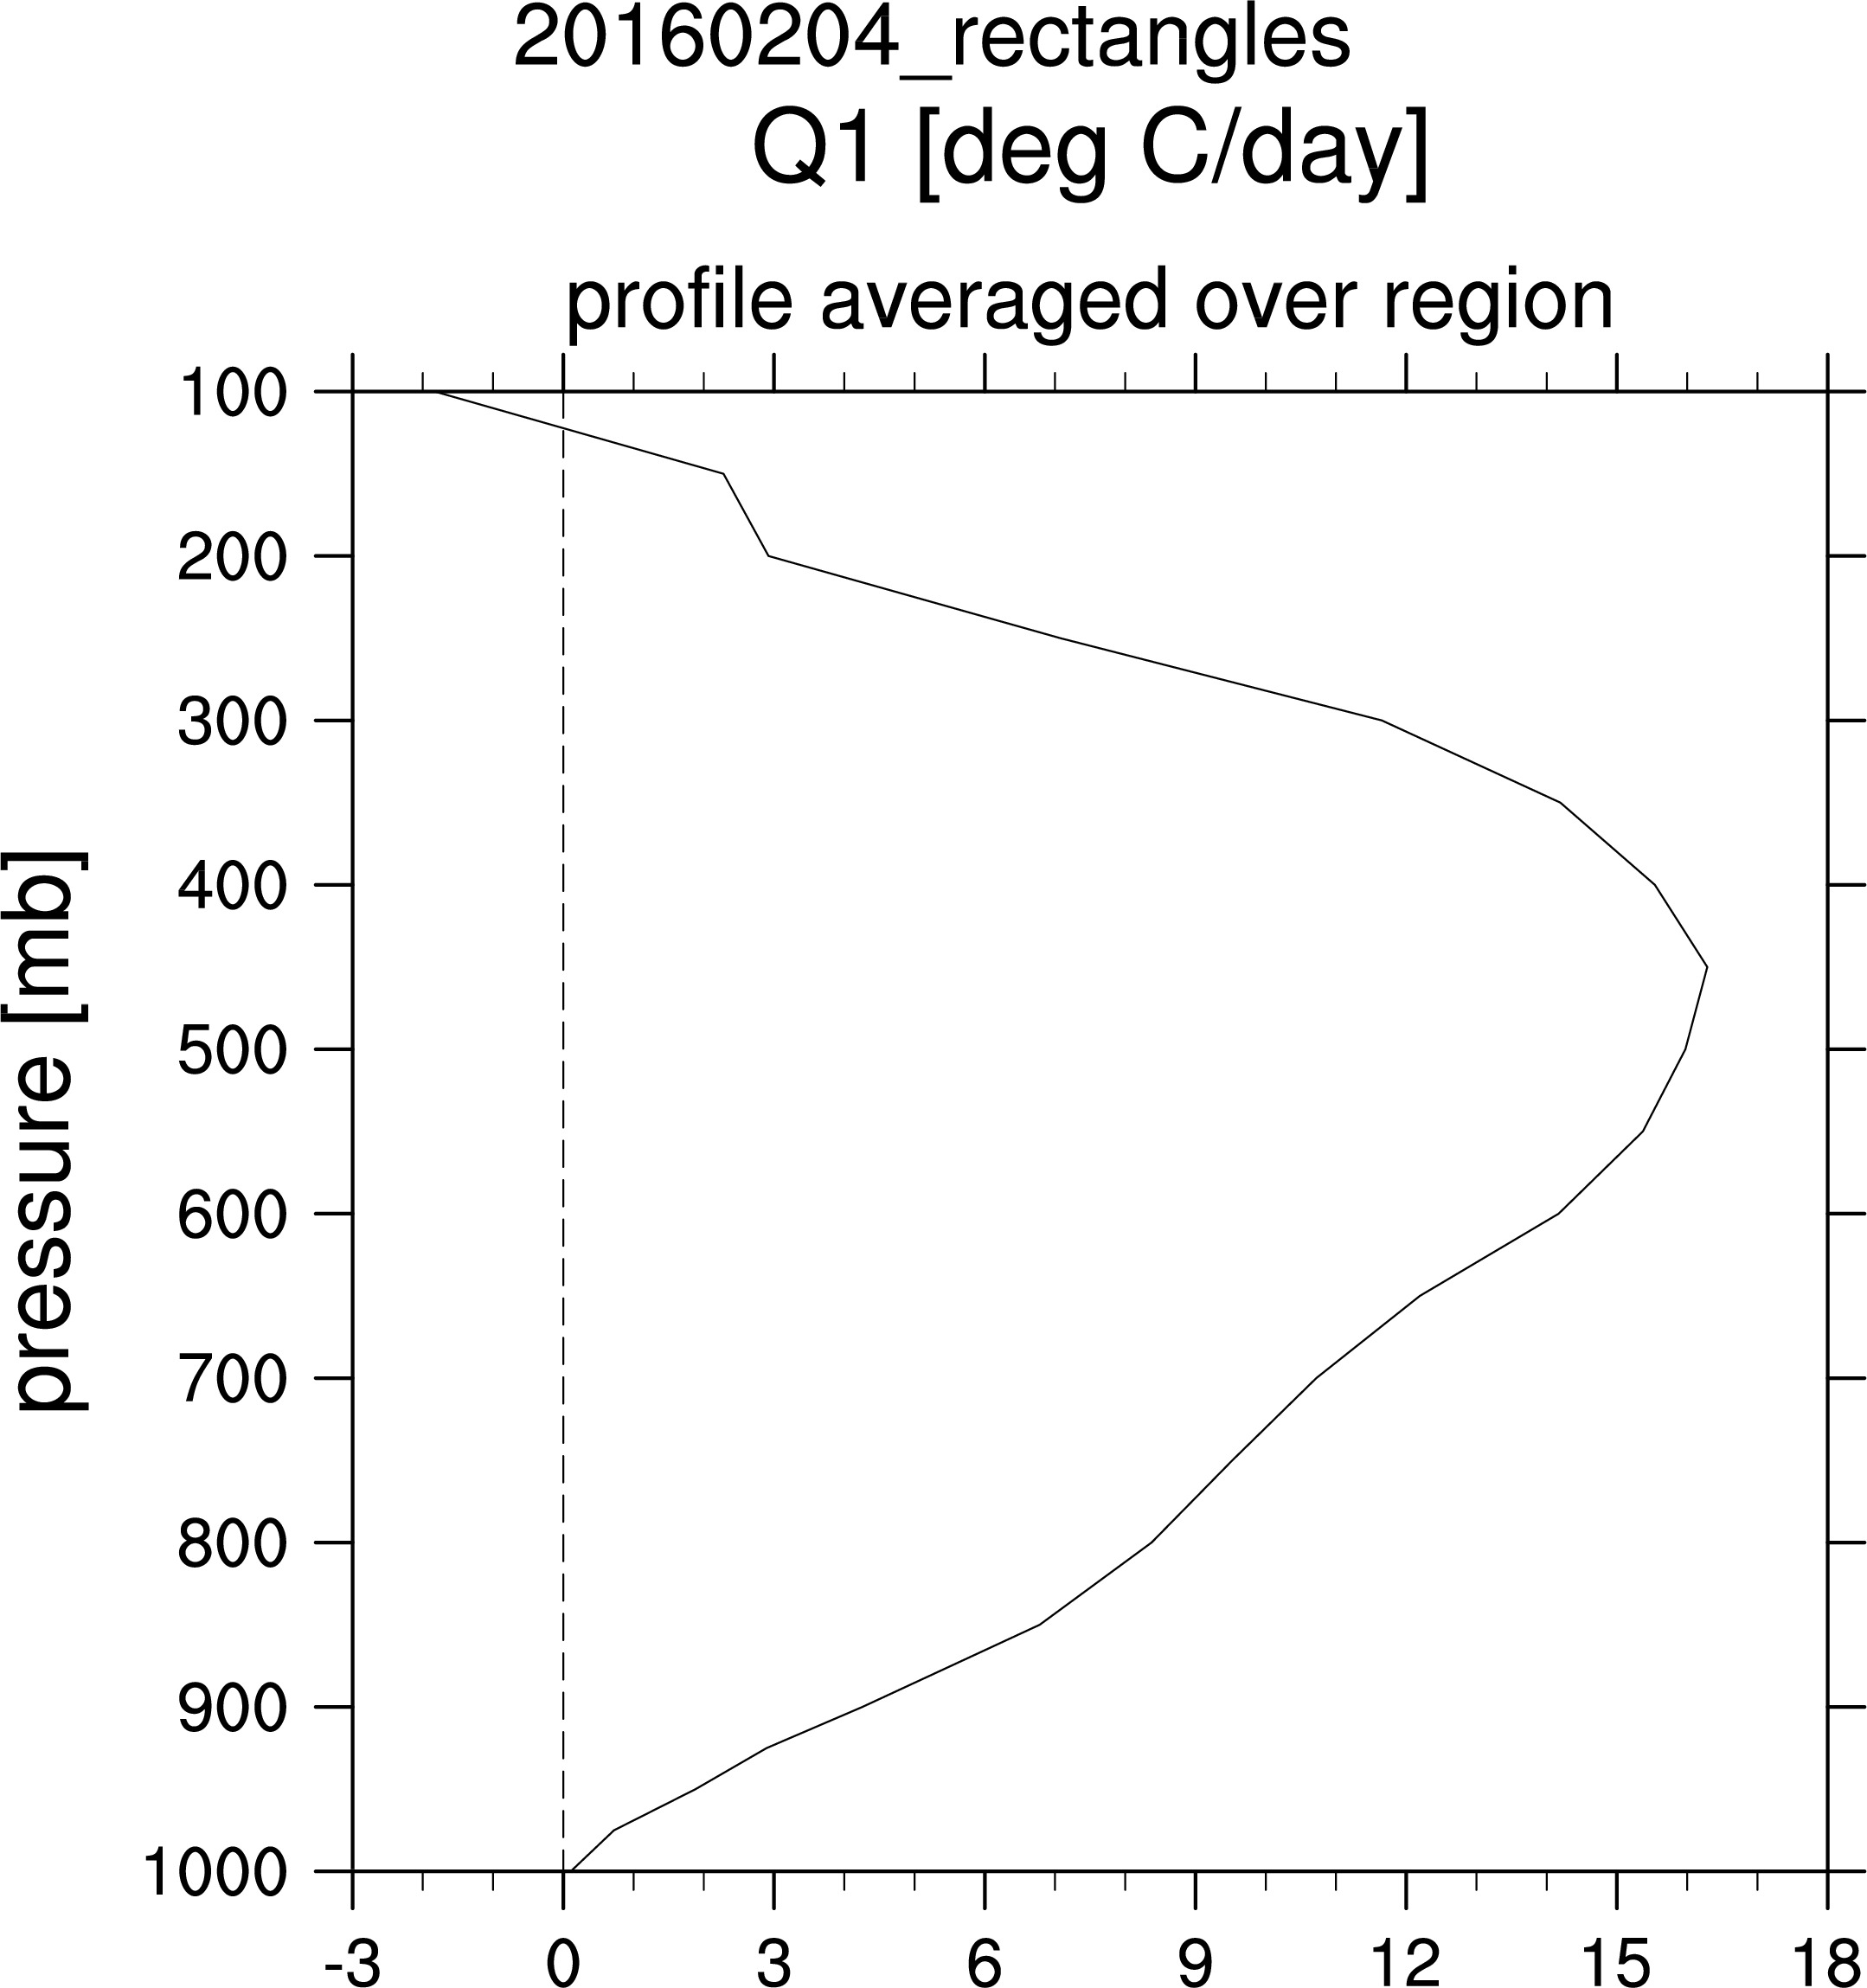
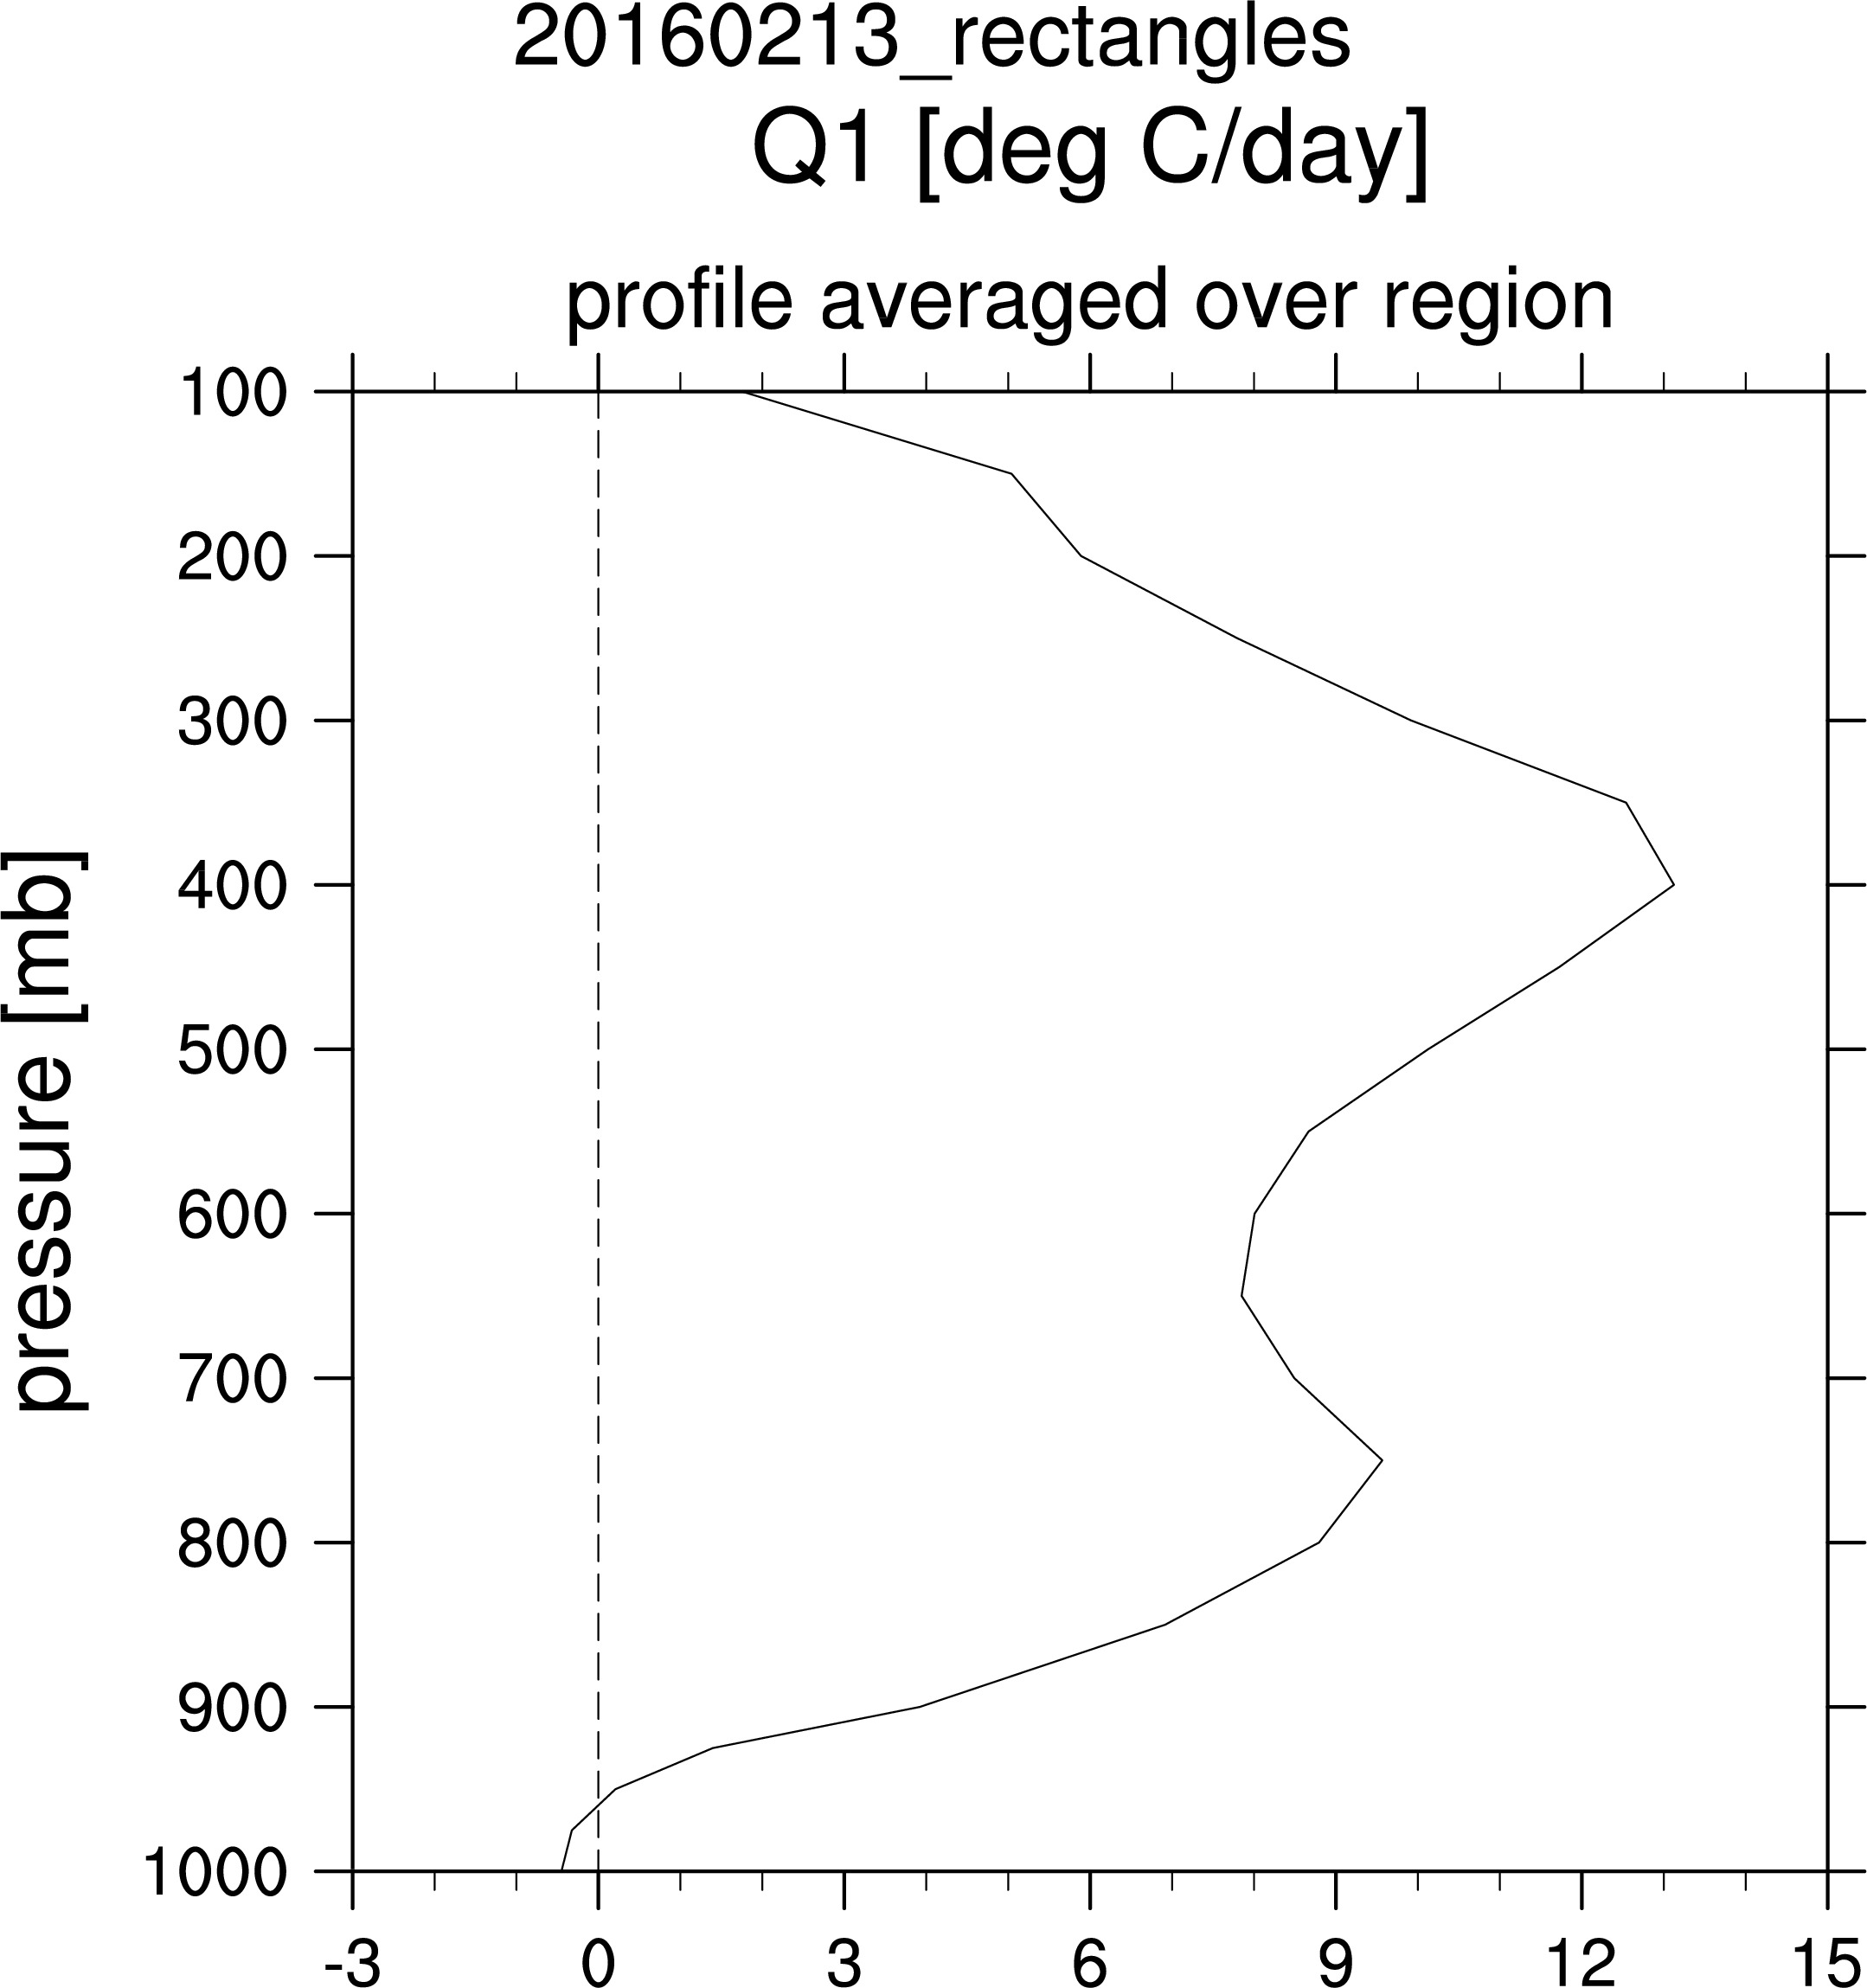
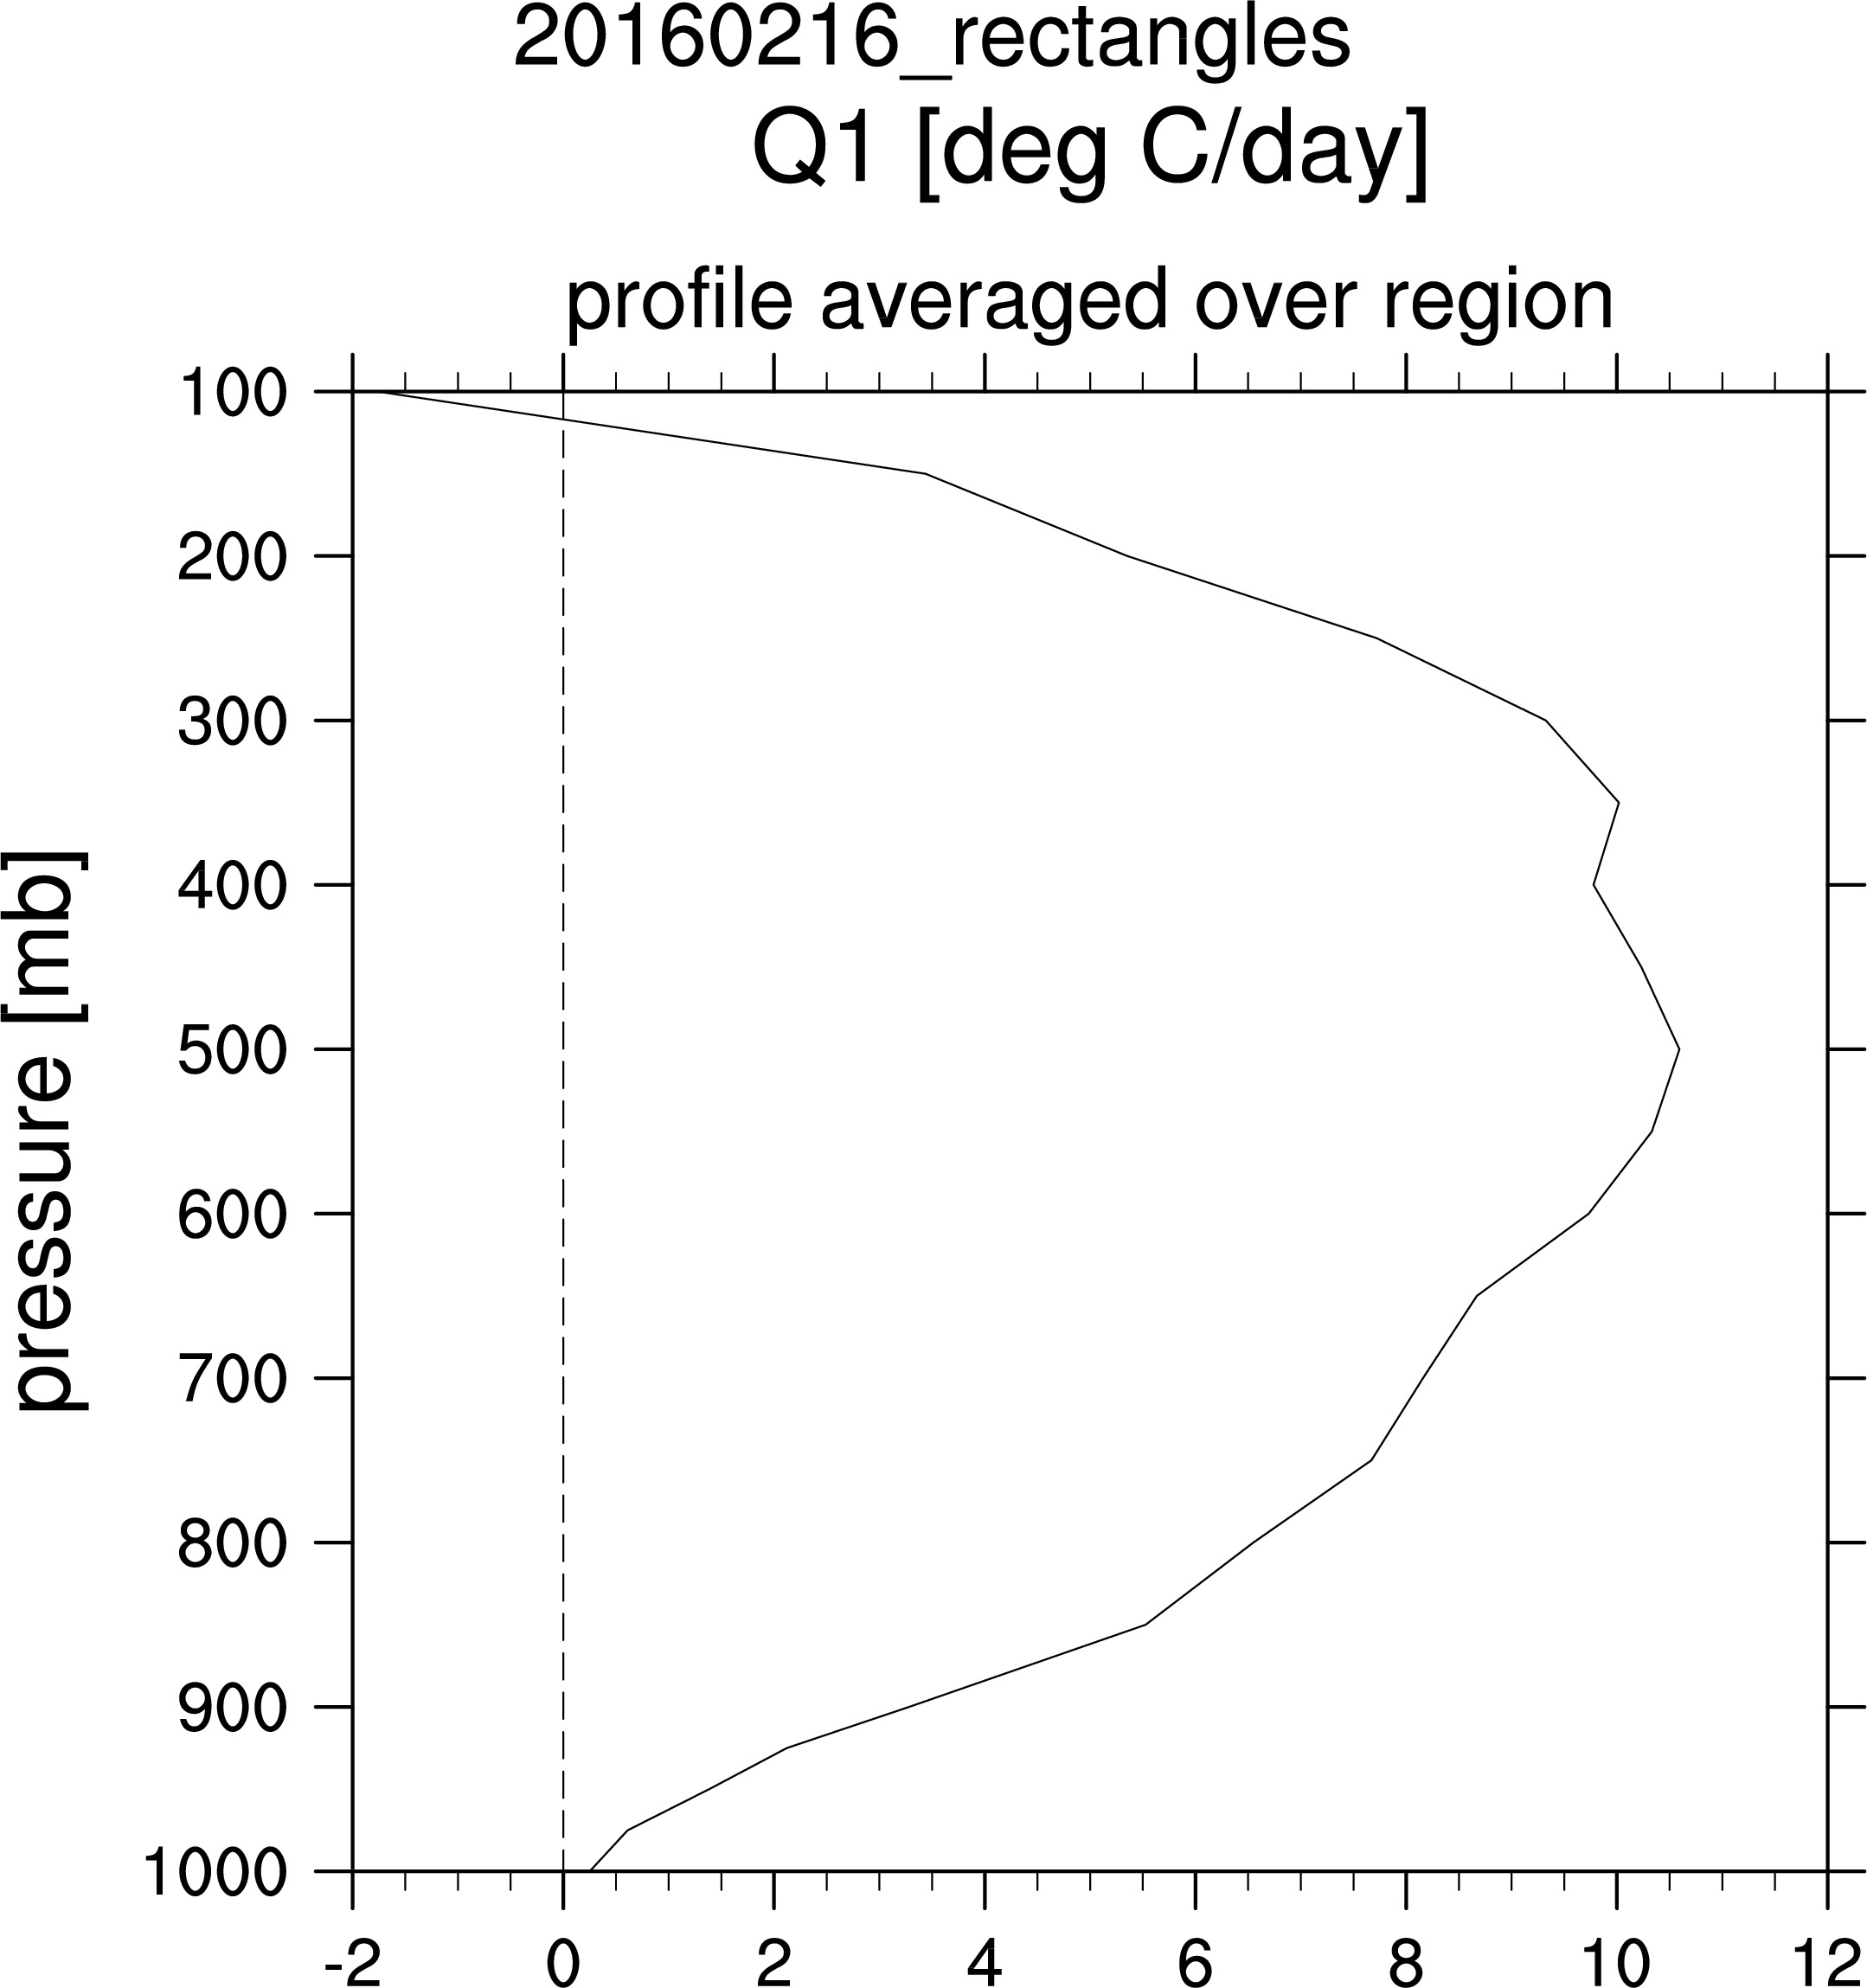
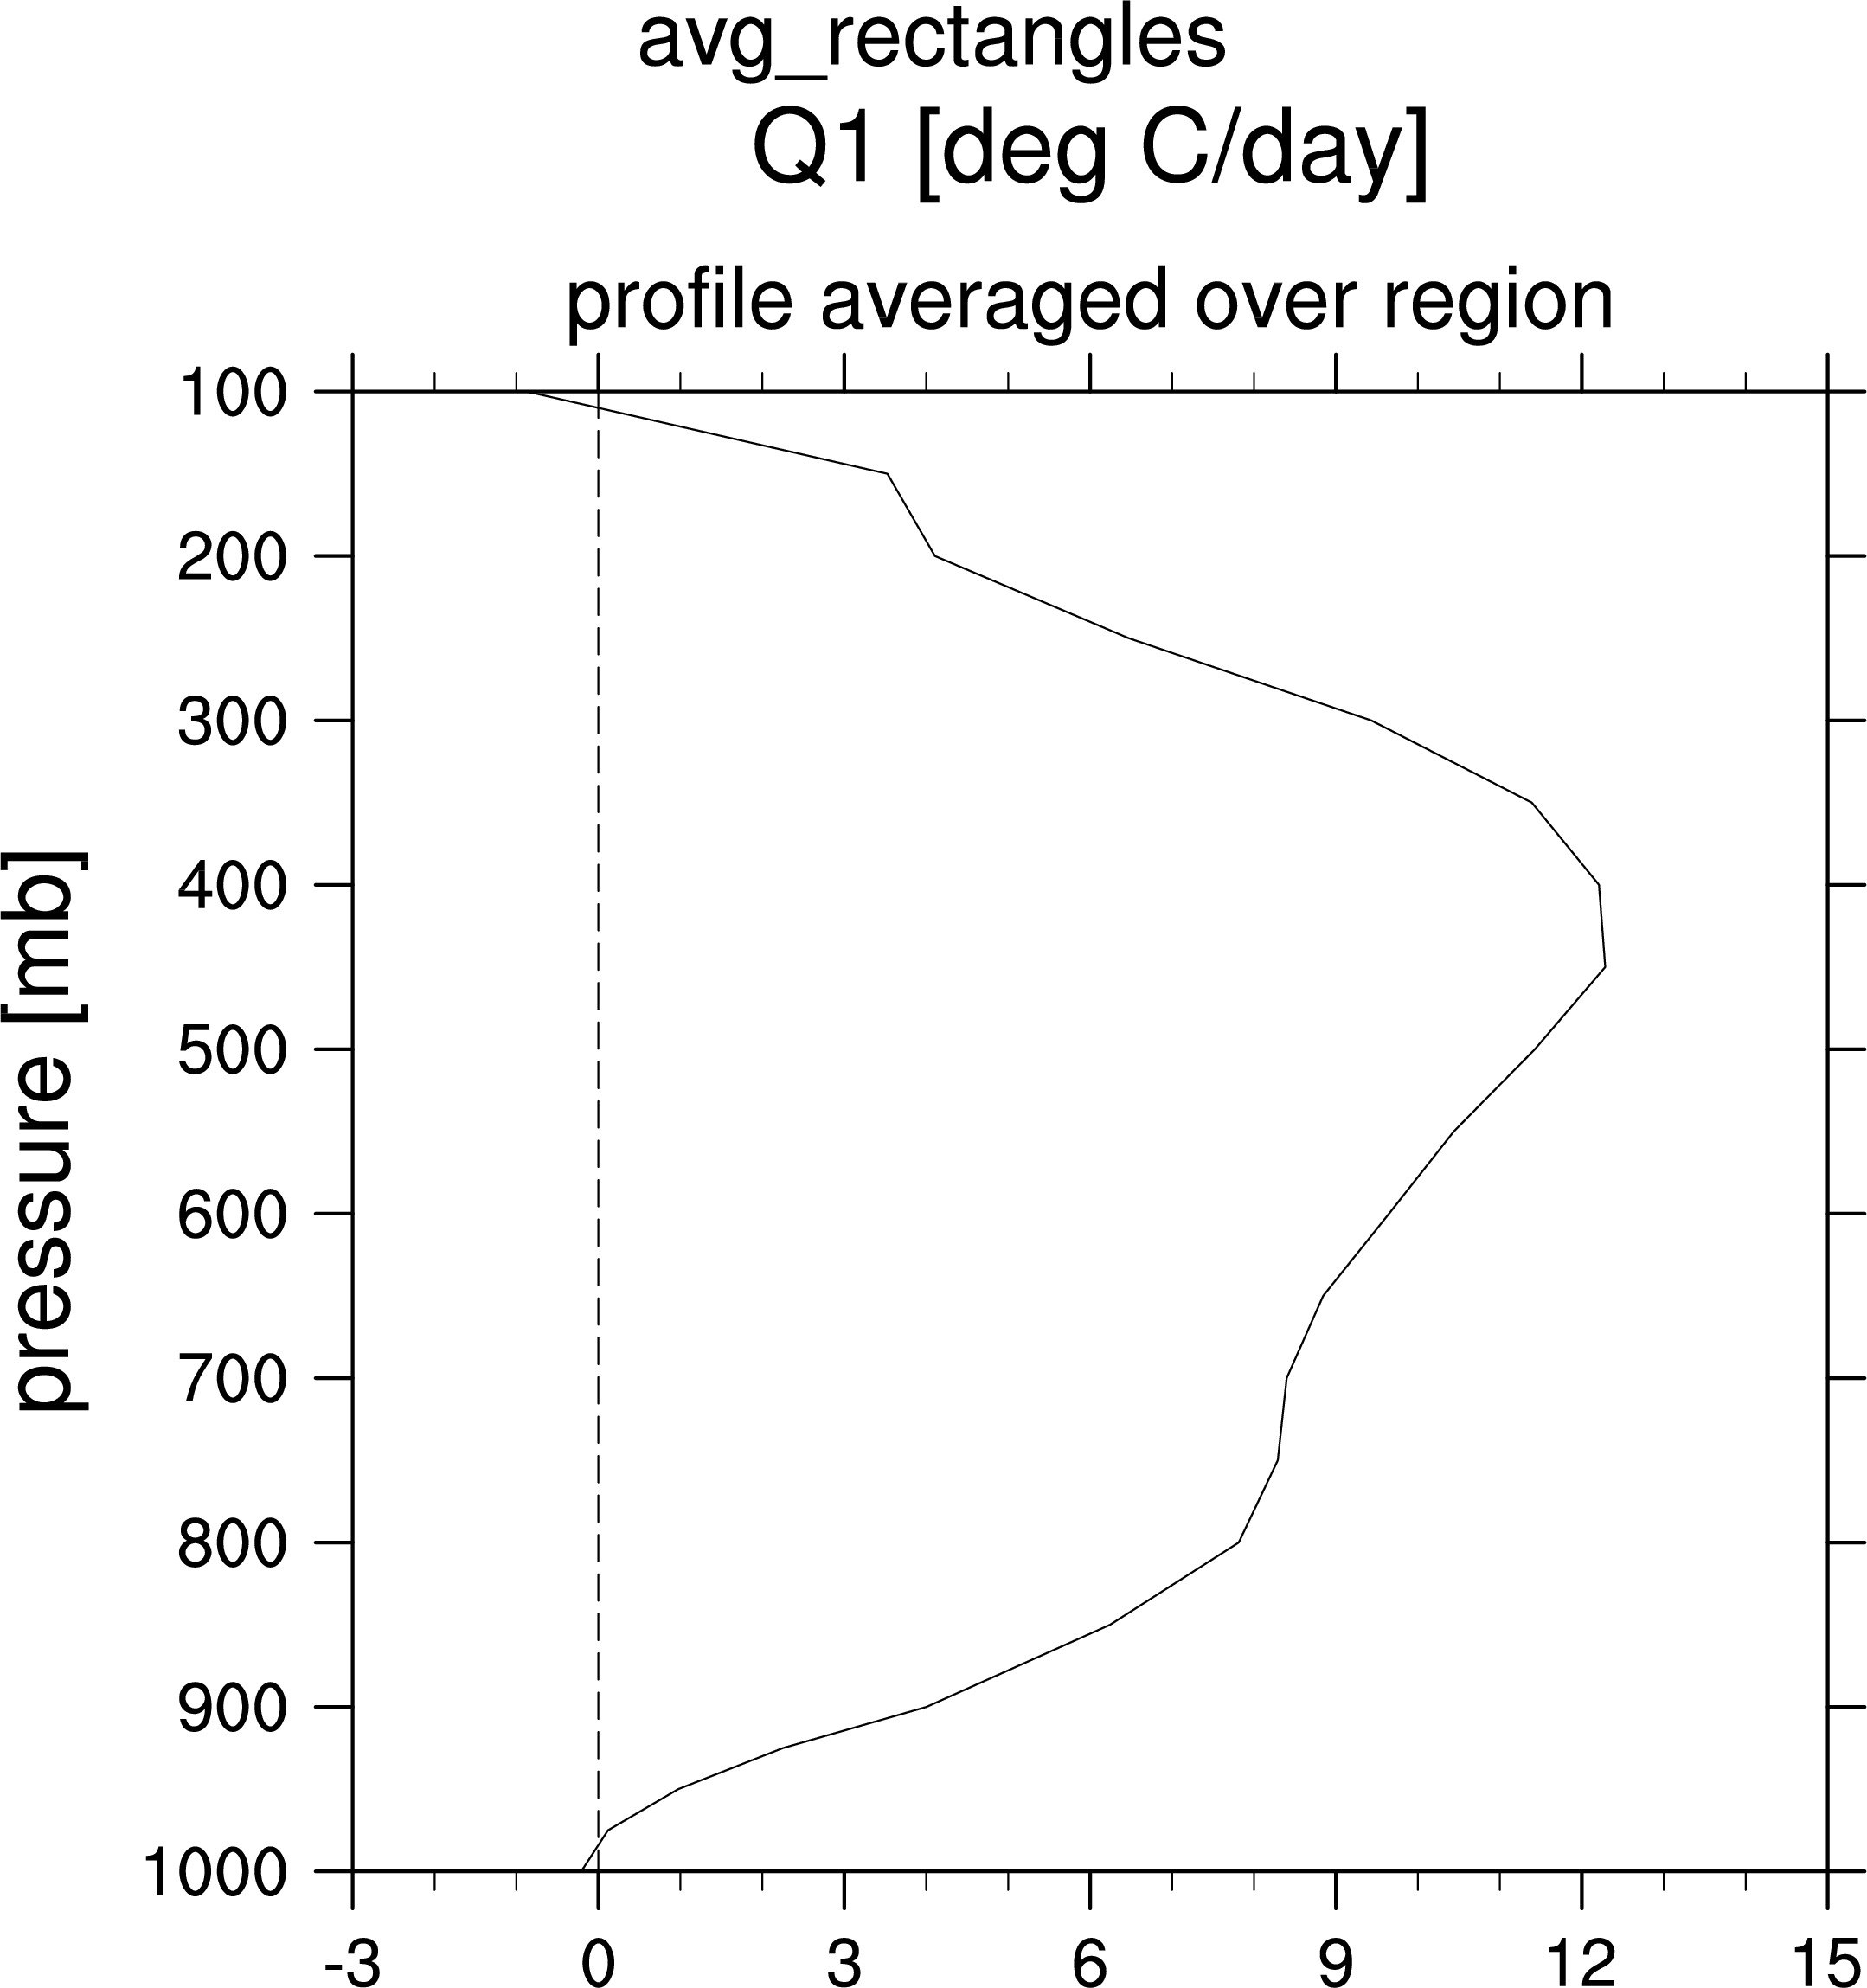
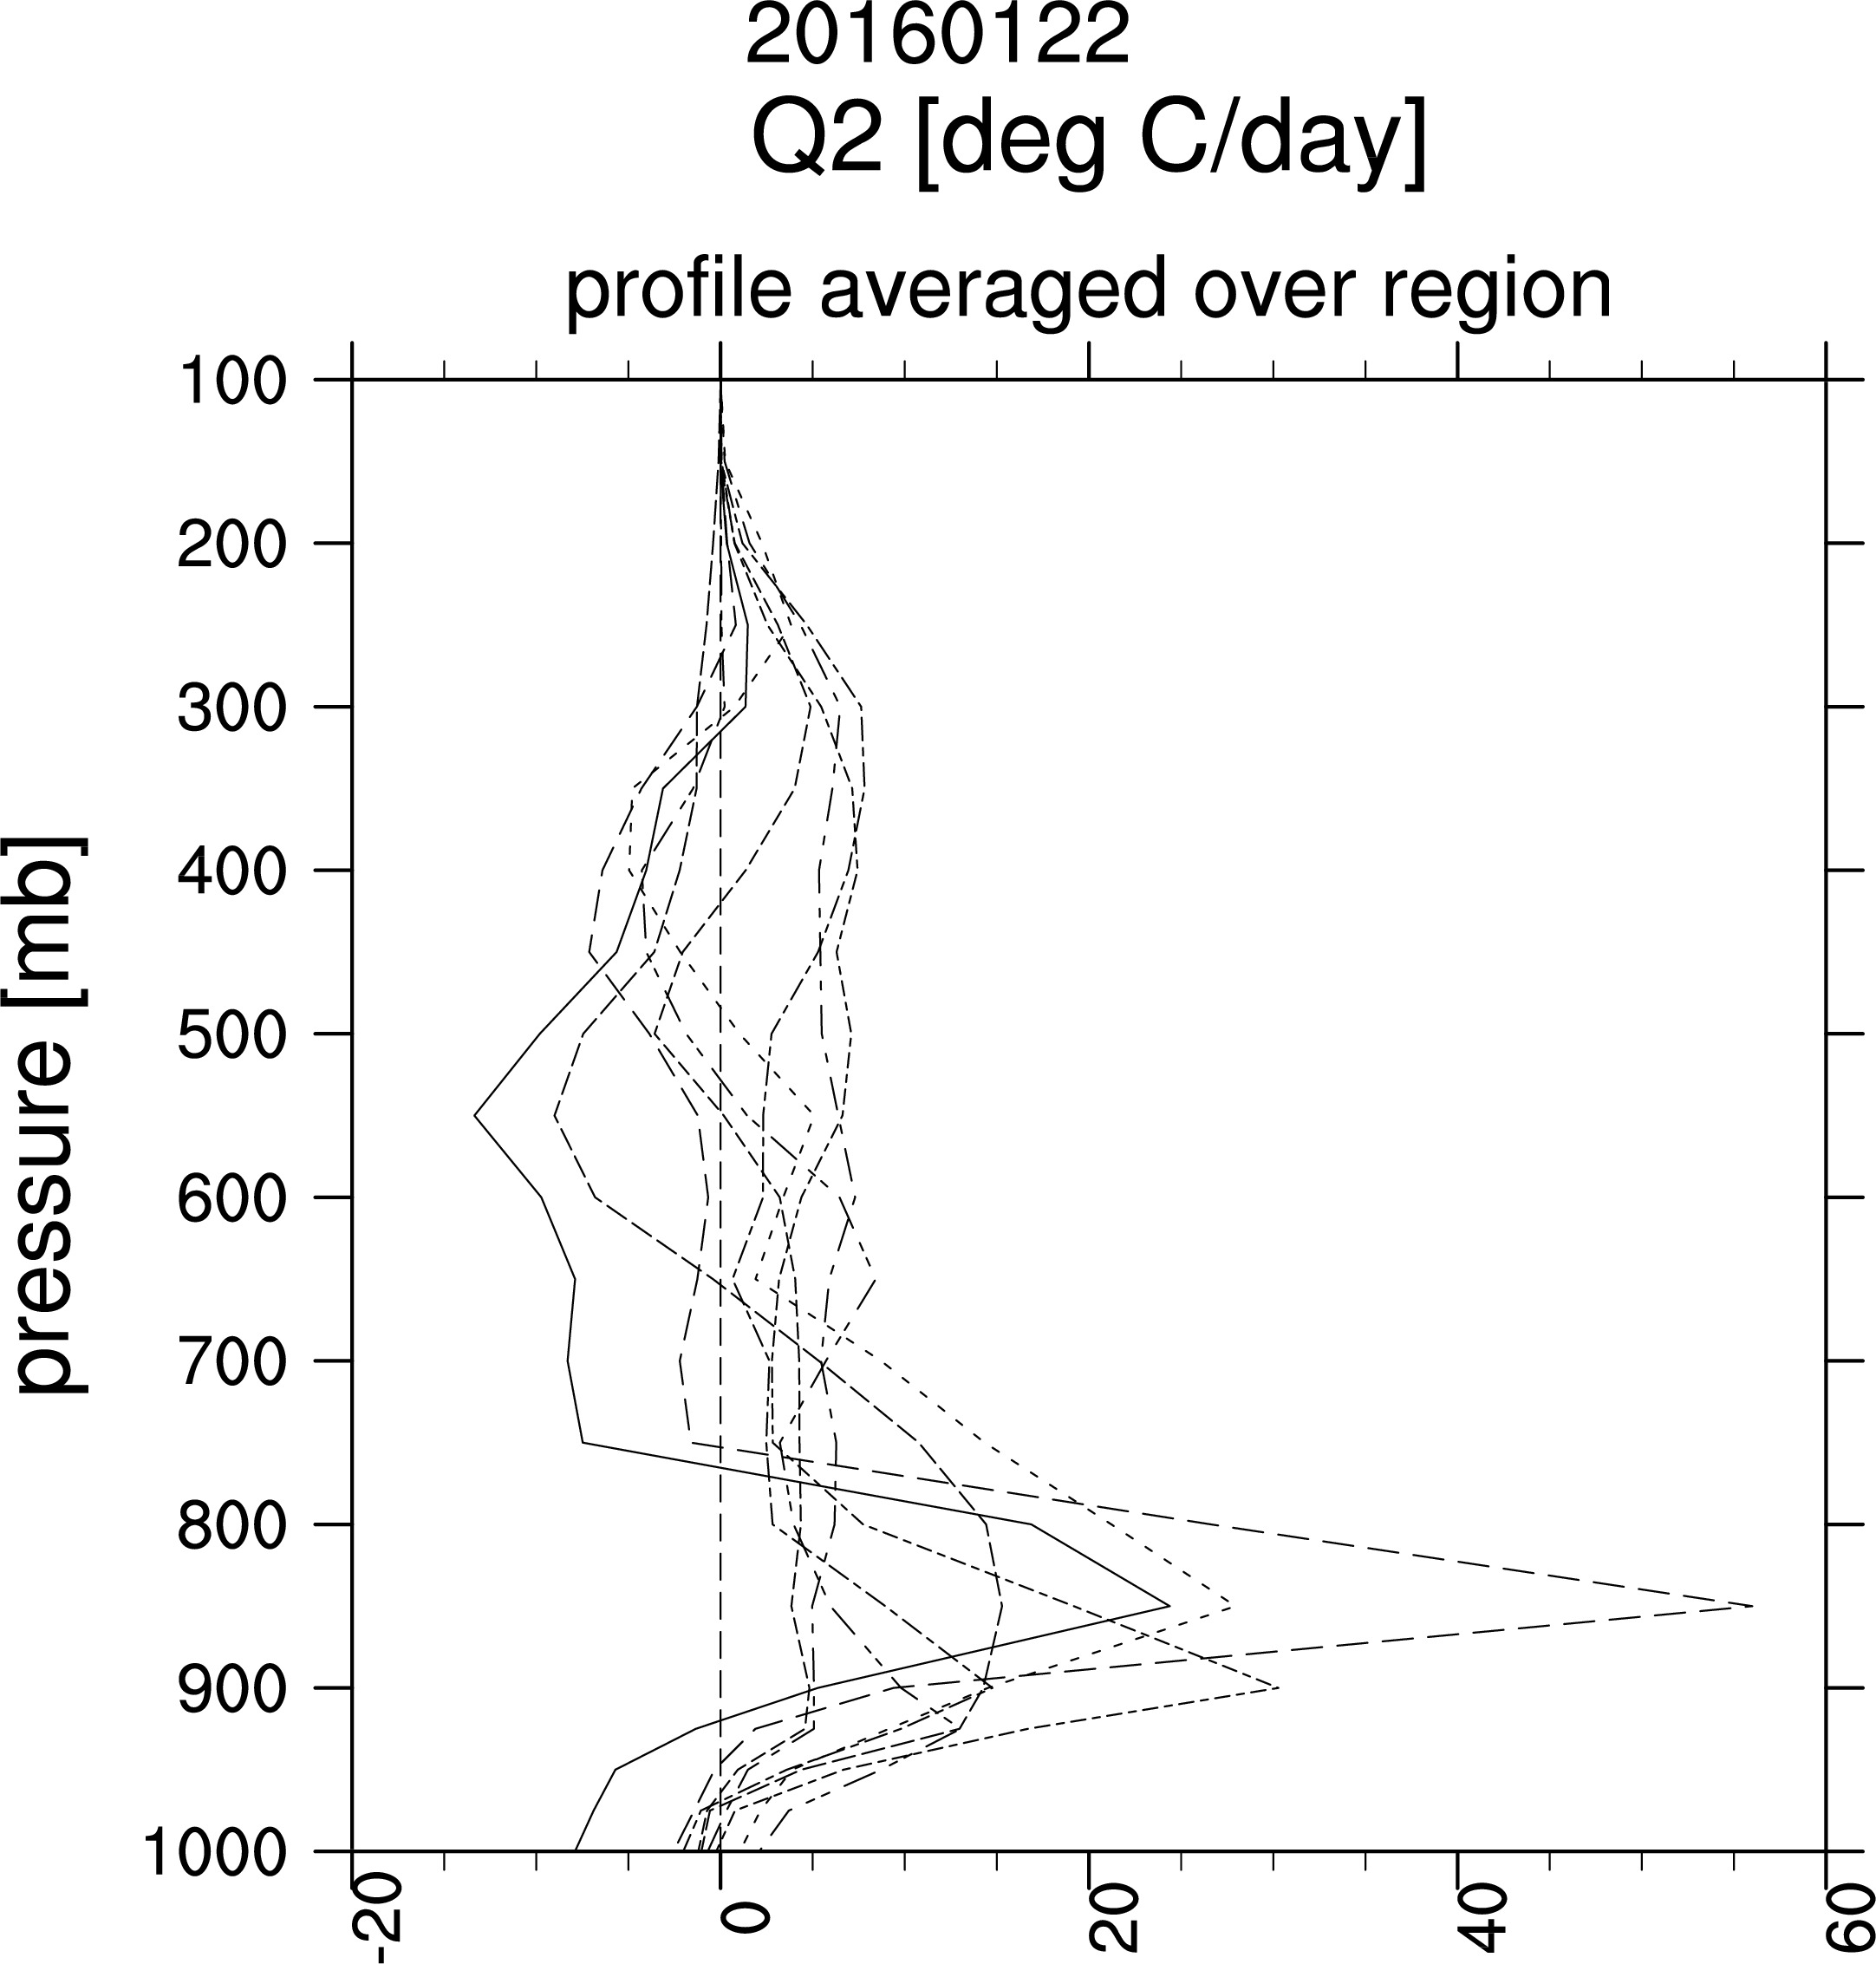
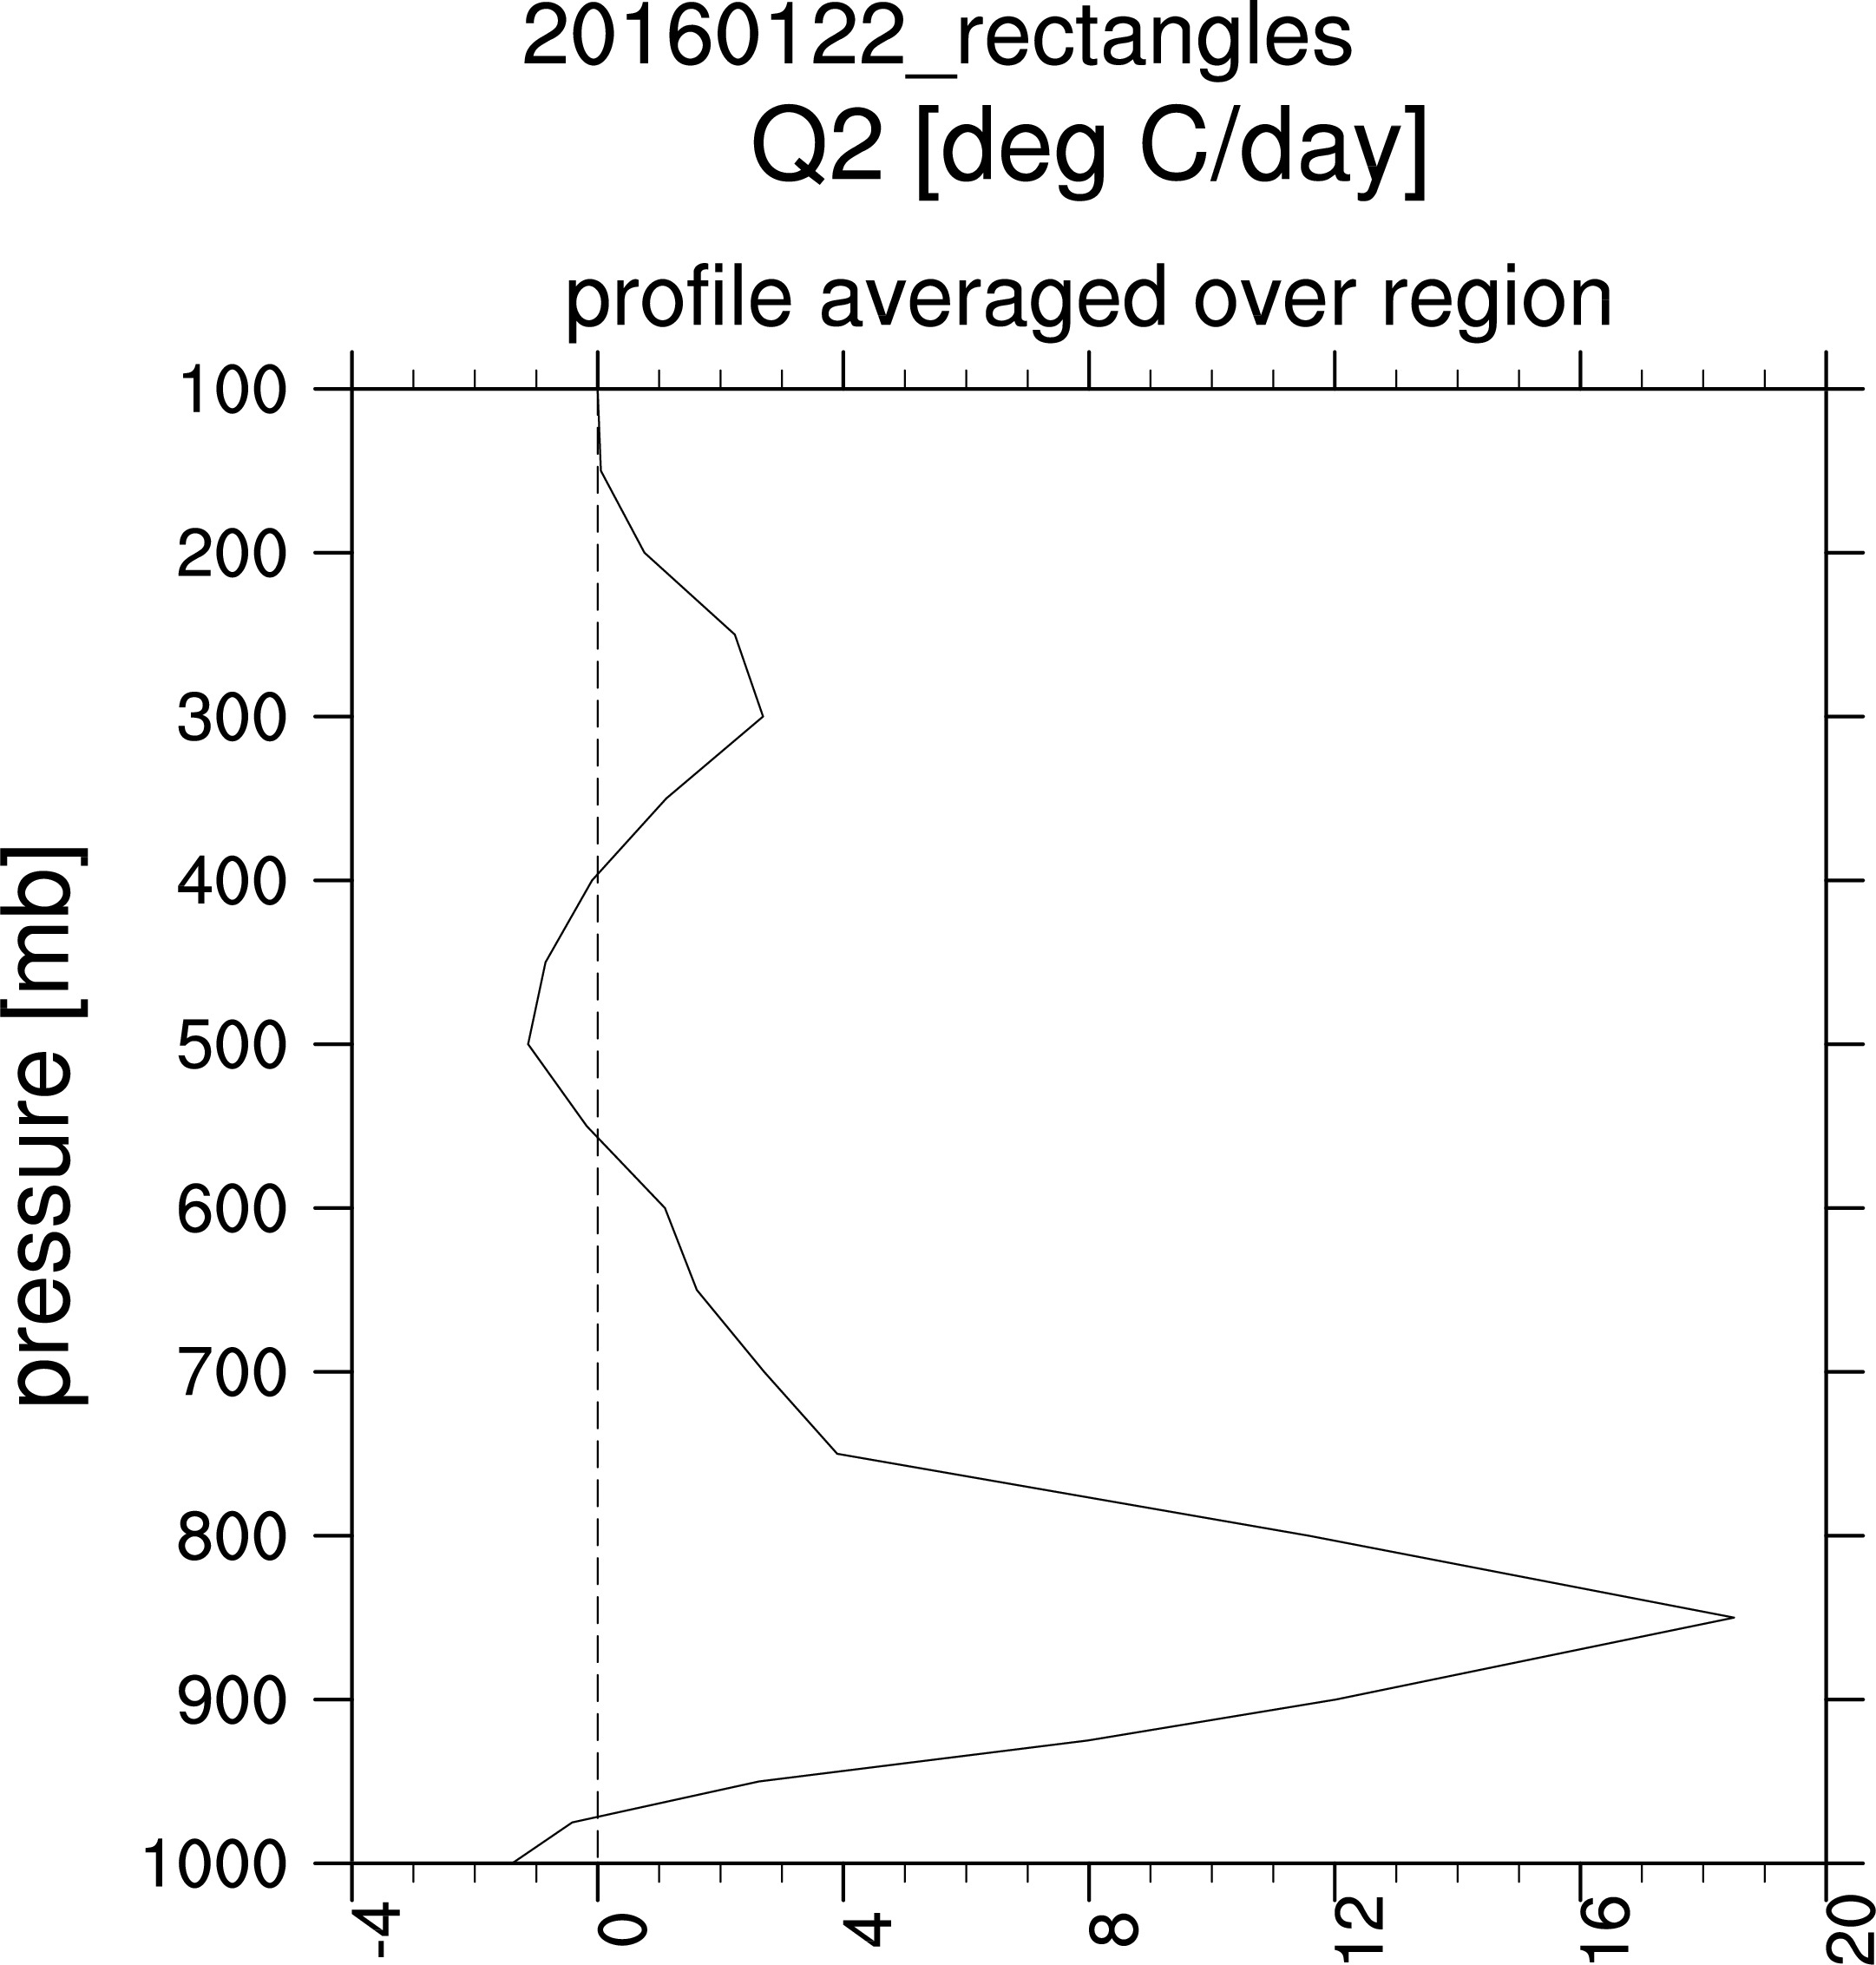
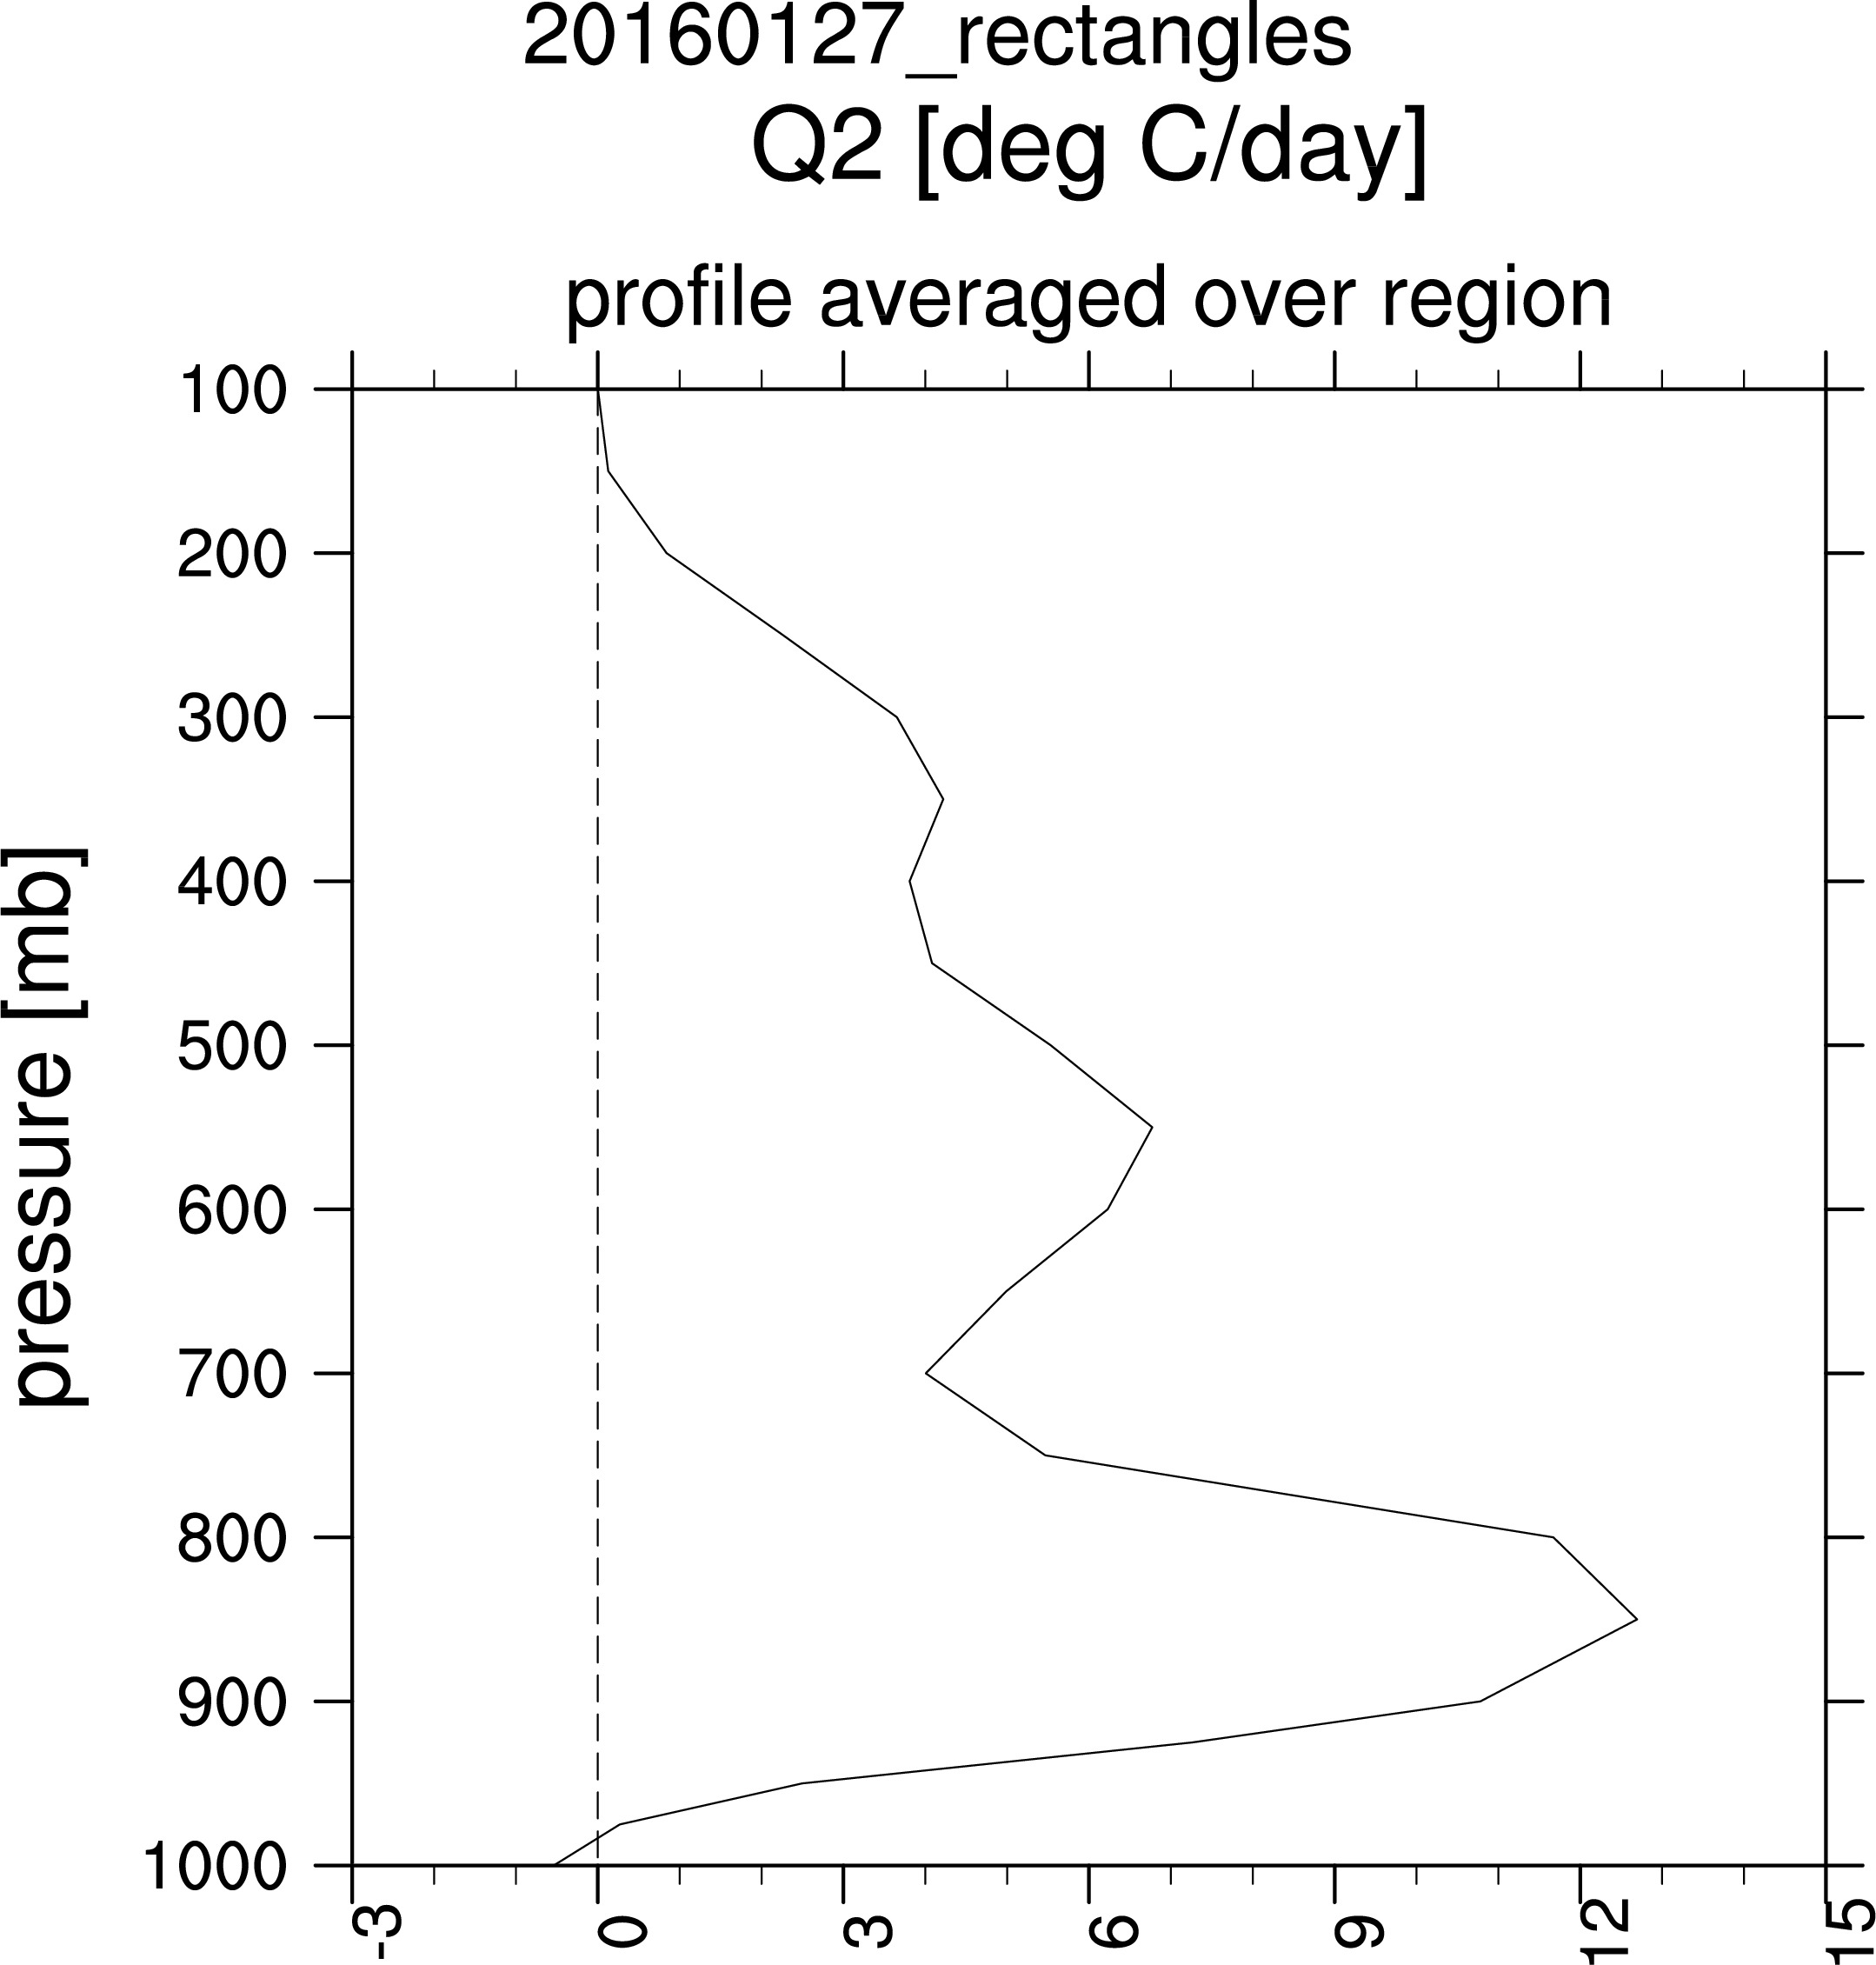
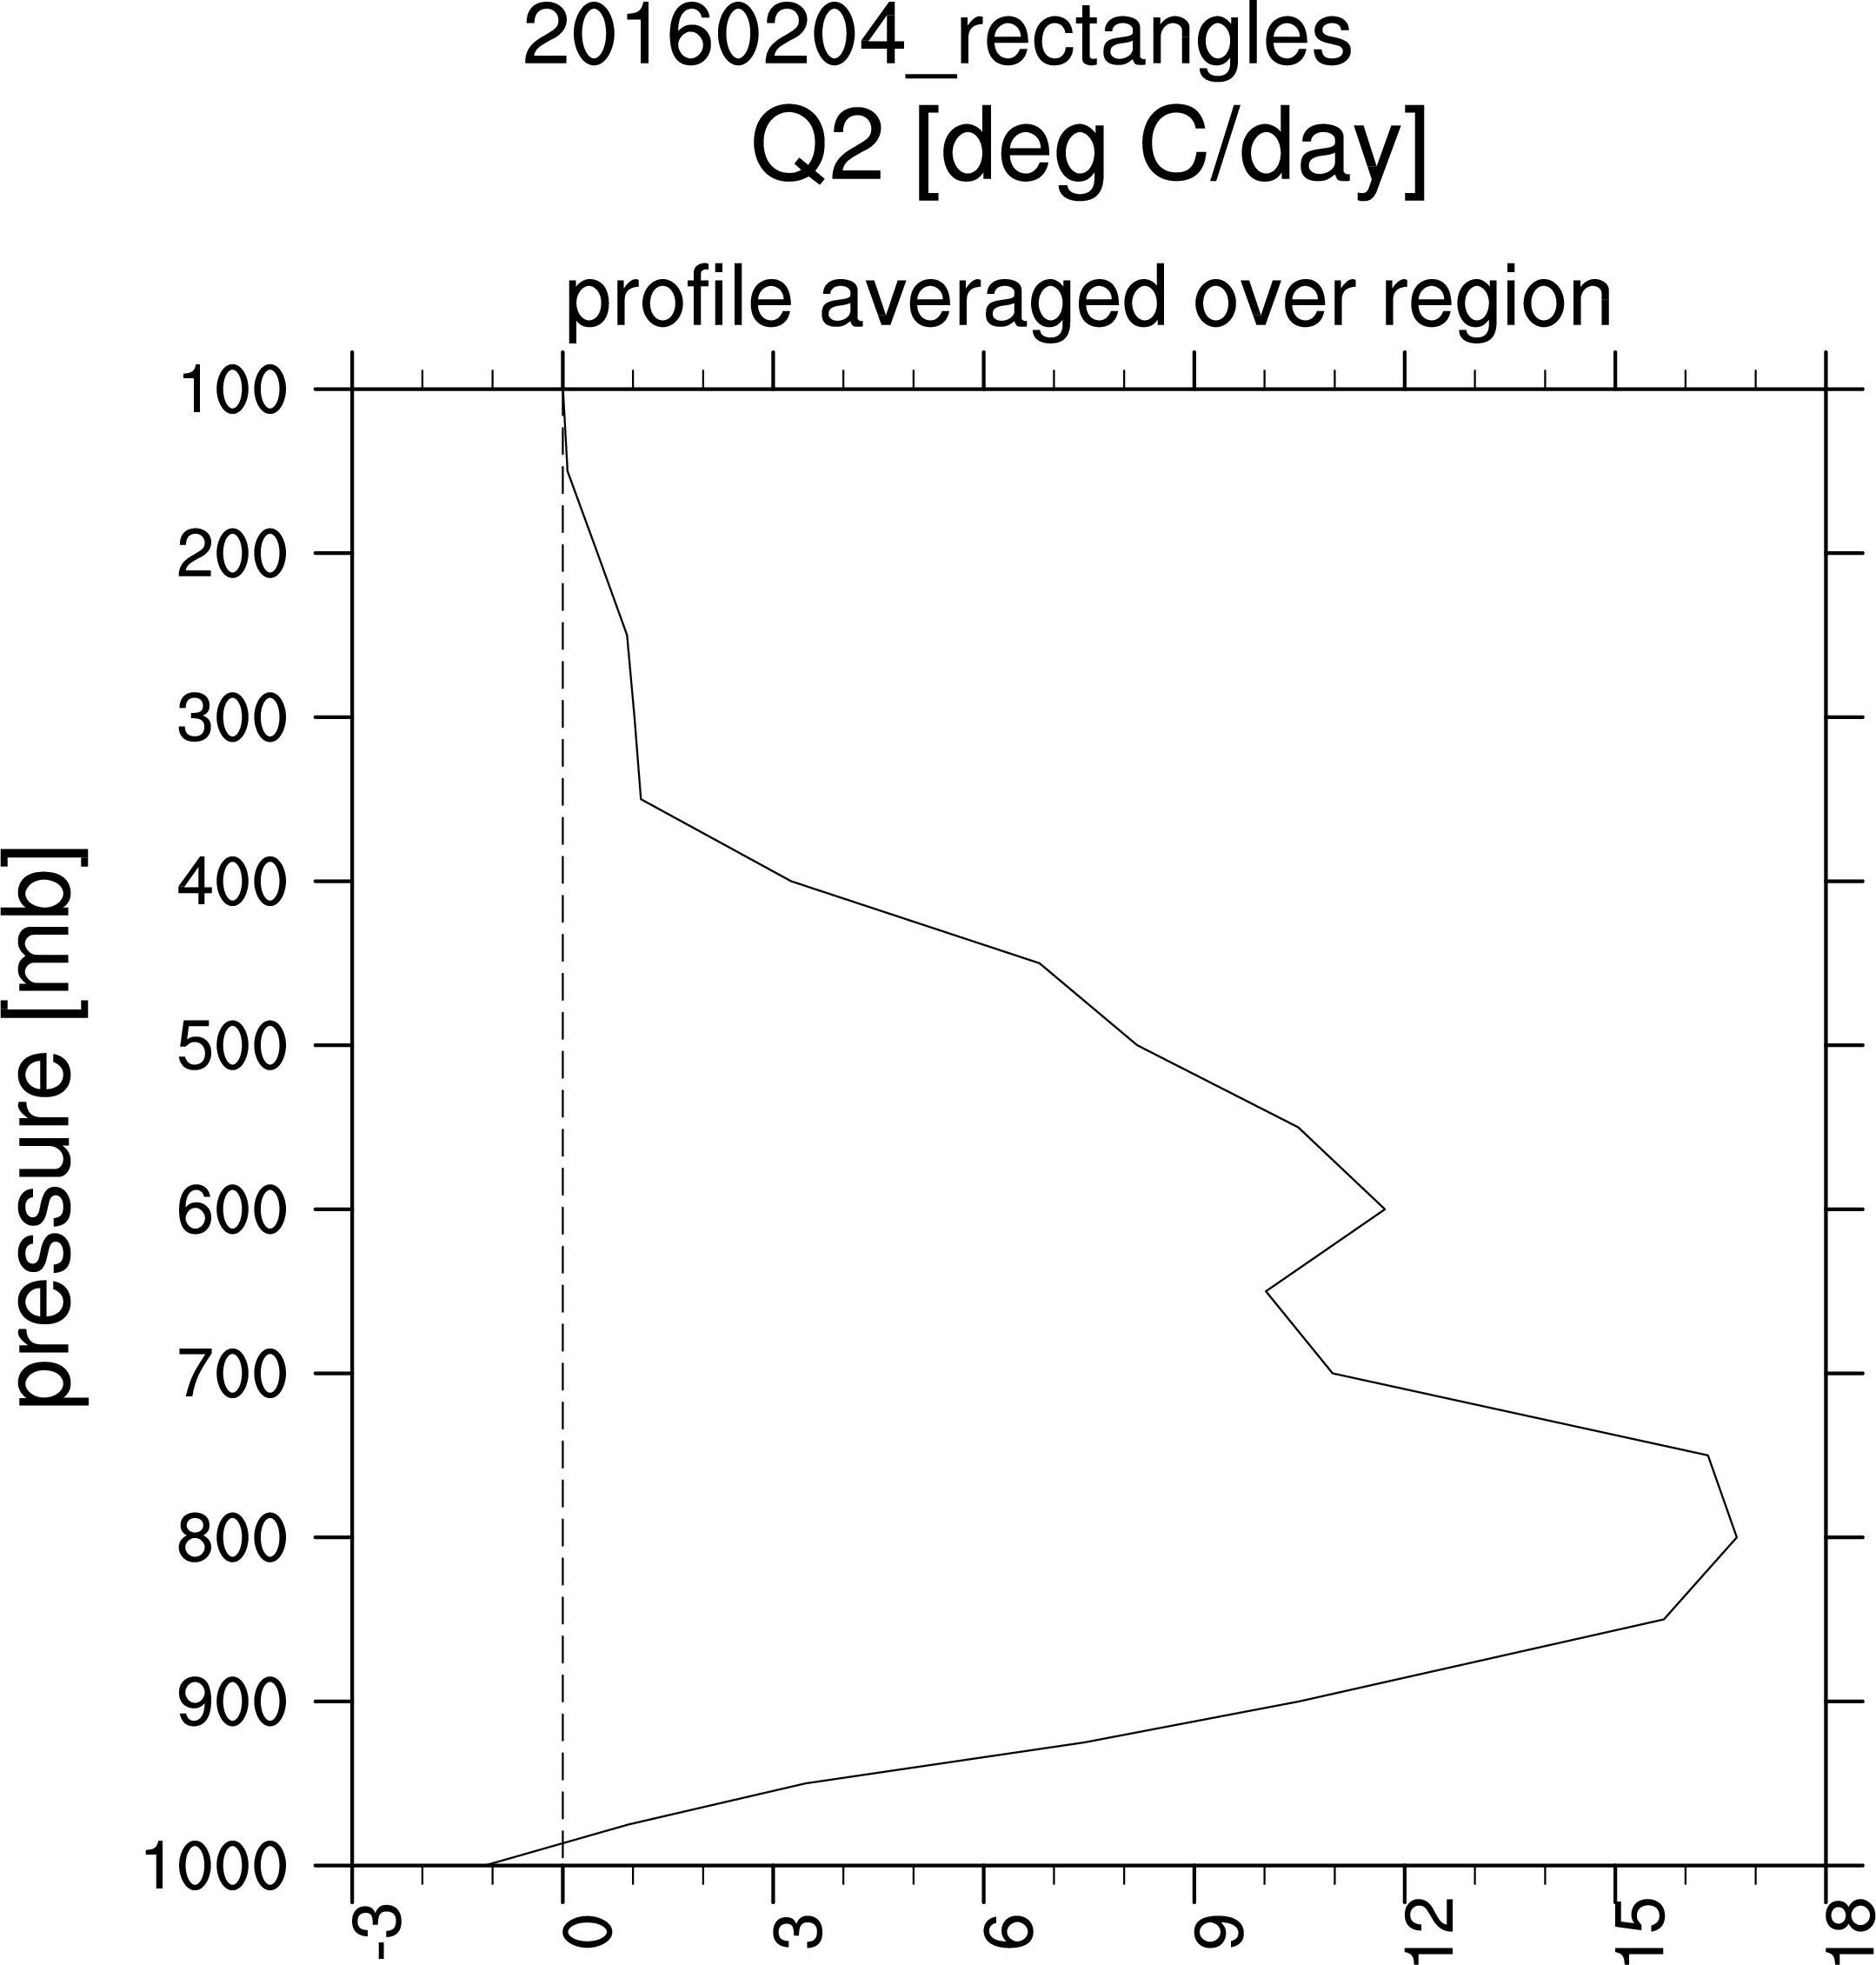
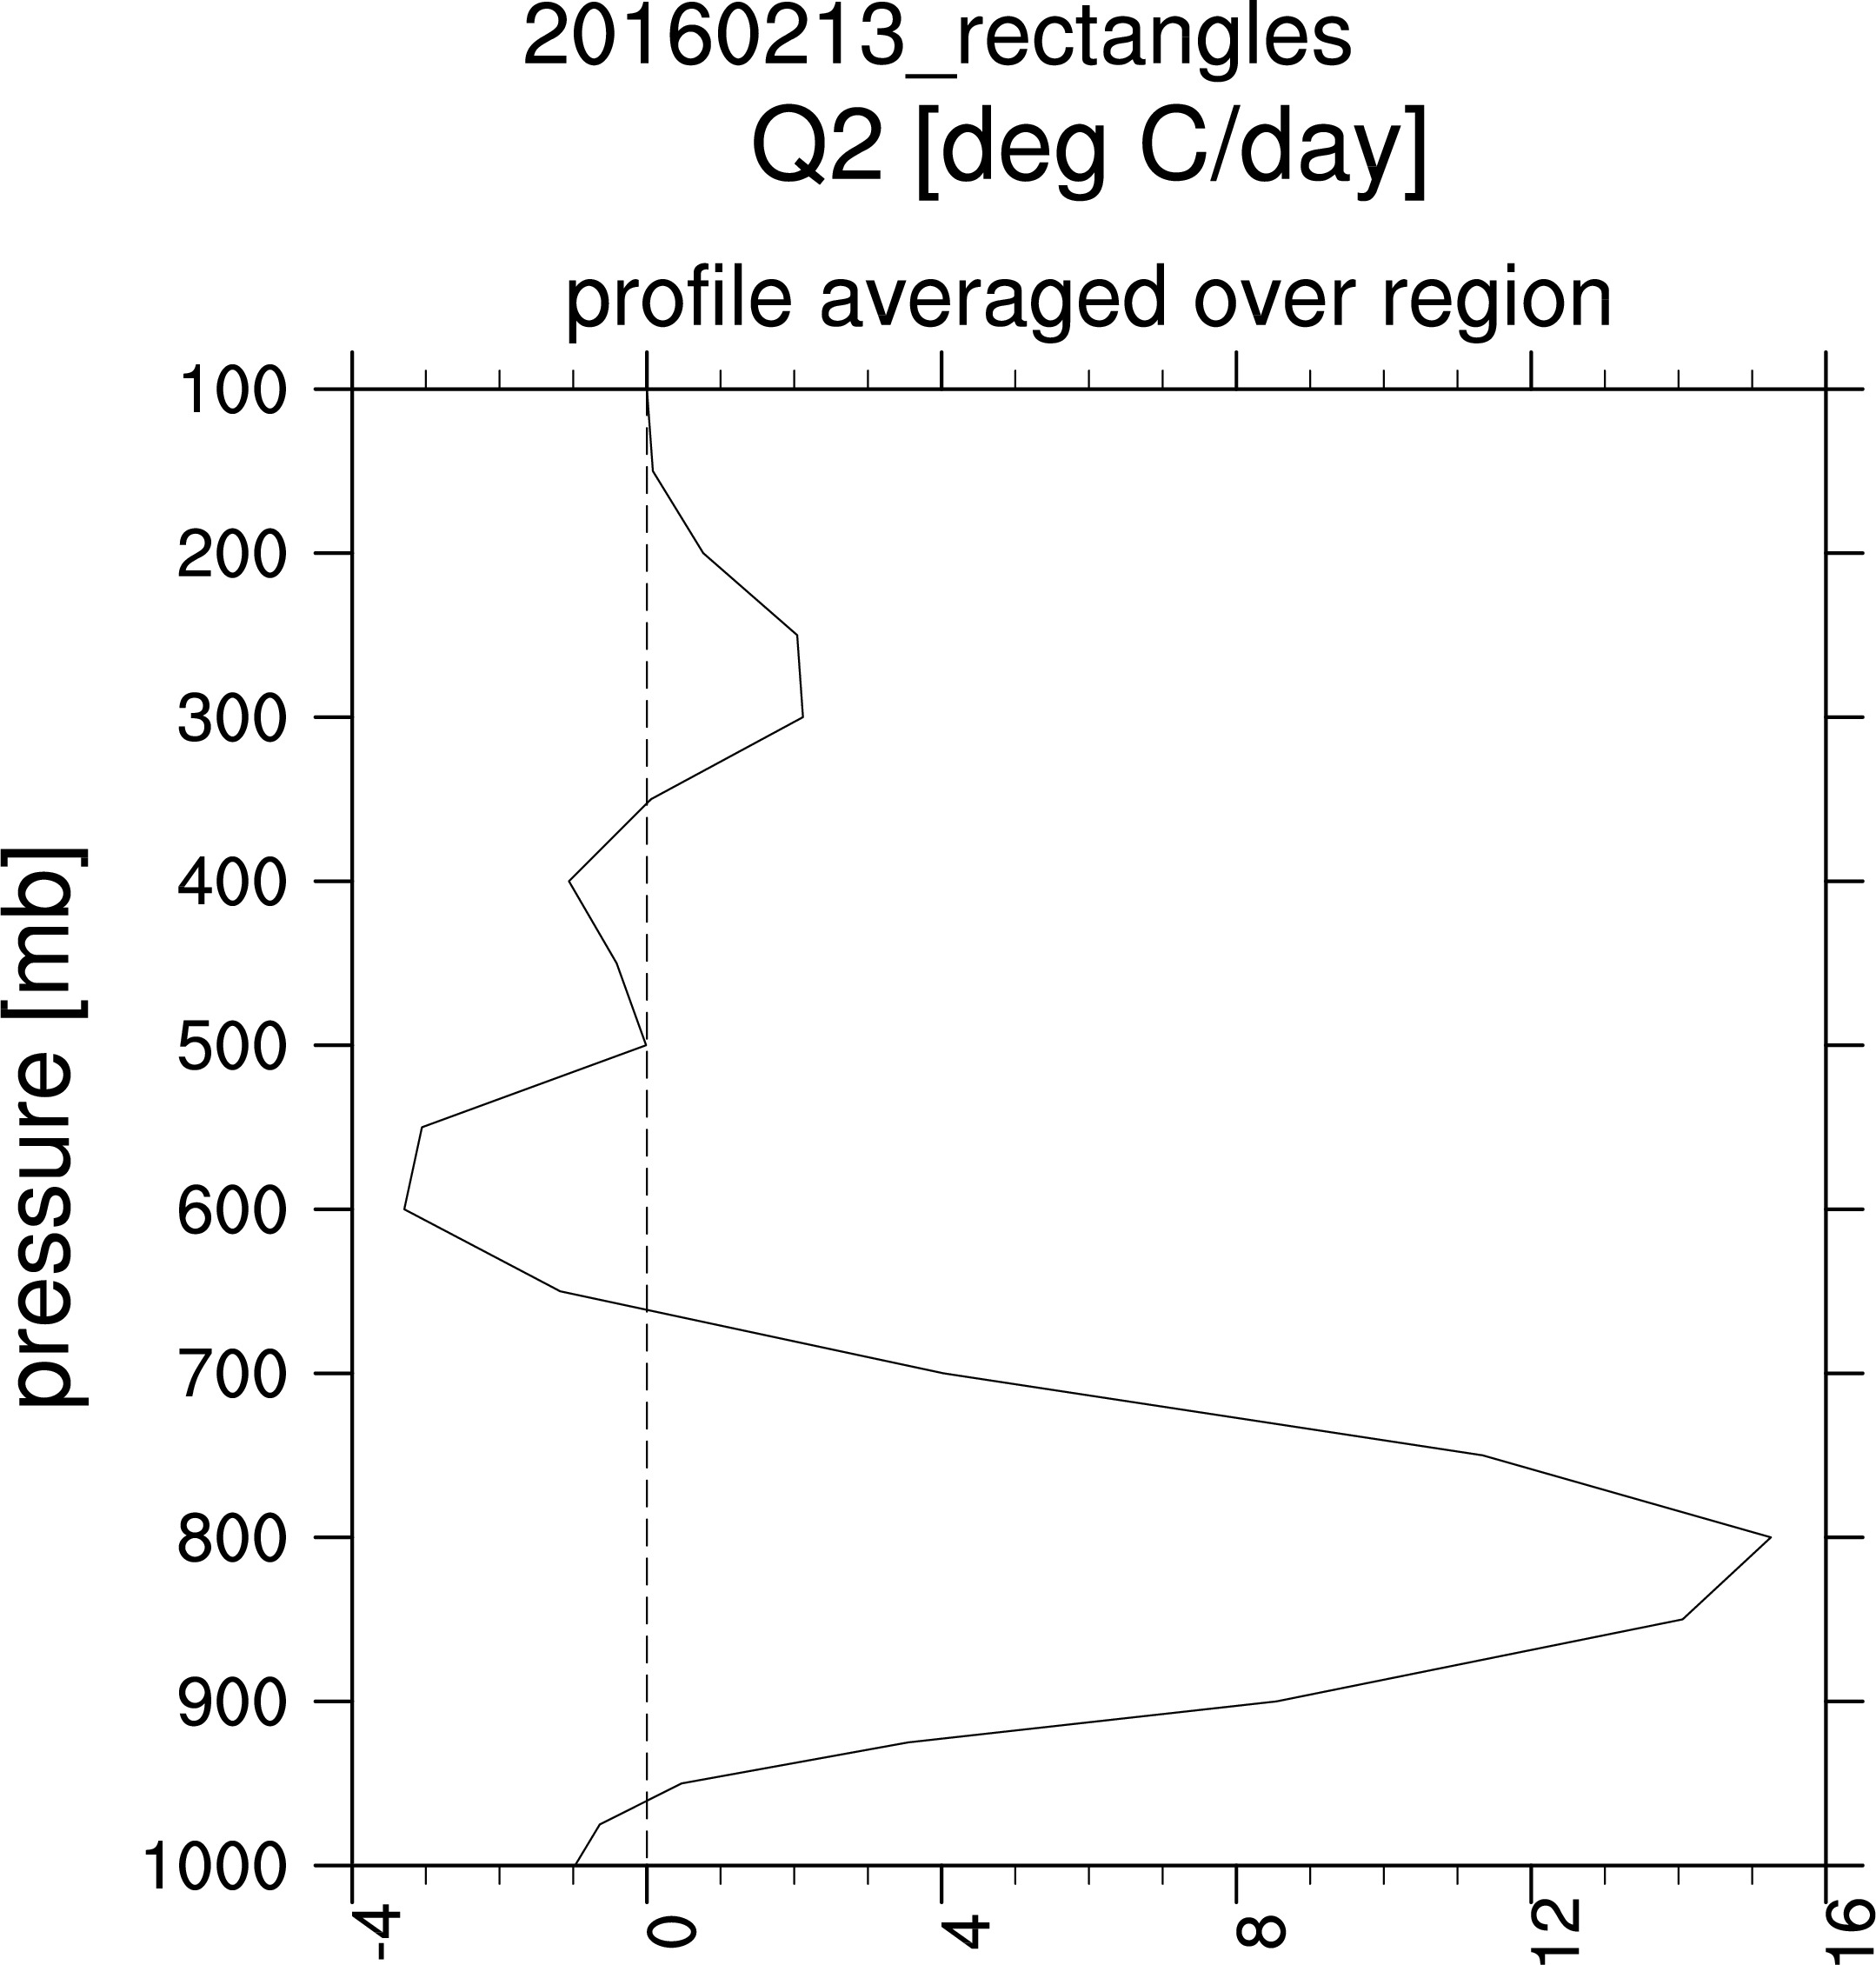
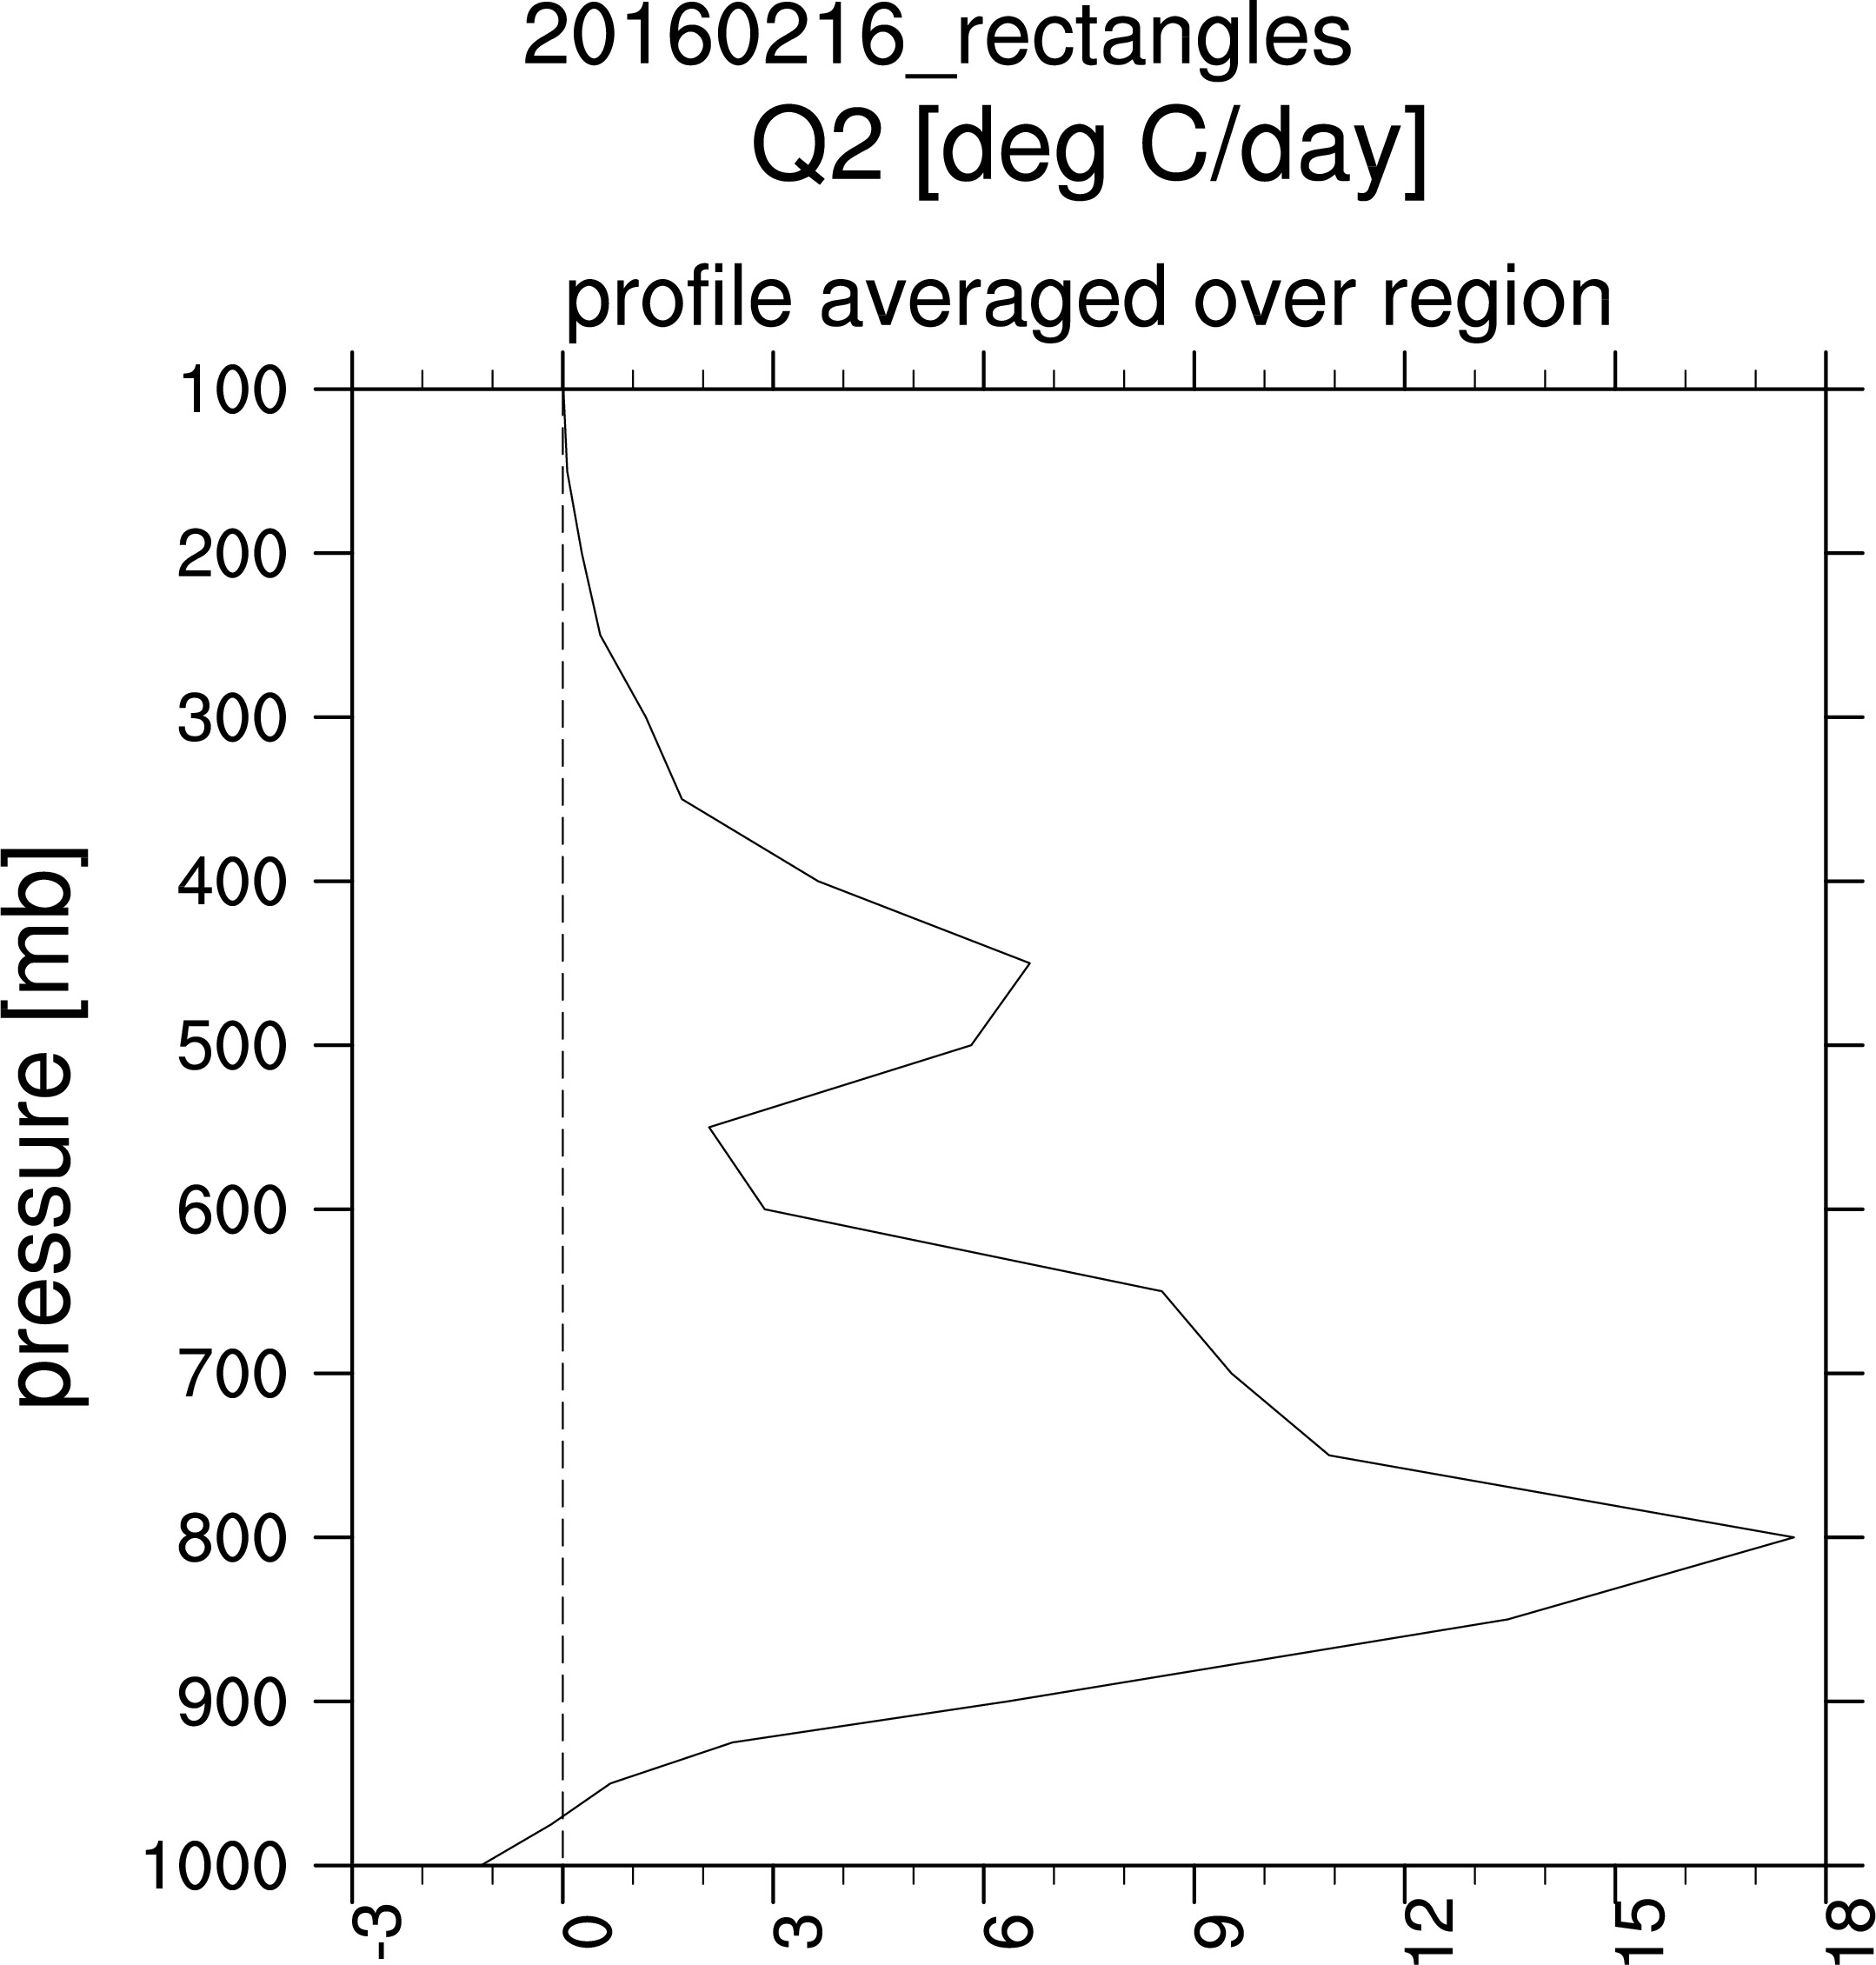
new GFS rectangles Q1 & Q2 3cases, sample results for 'flight' days:
Comparisons of vertically-integrated Qs and Precip
------------------------------------------------------------------------------------------------------------------------------
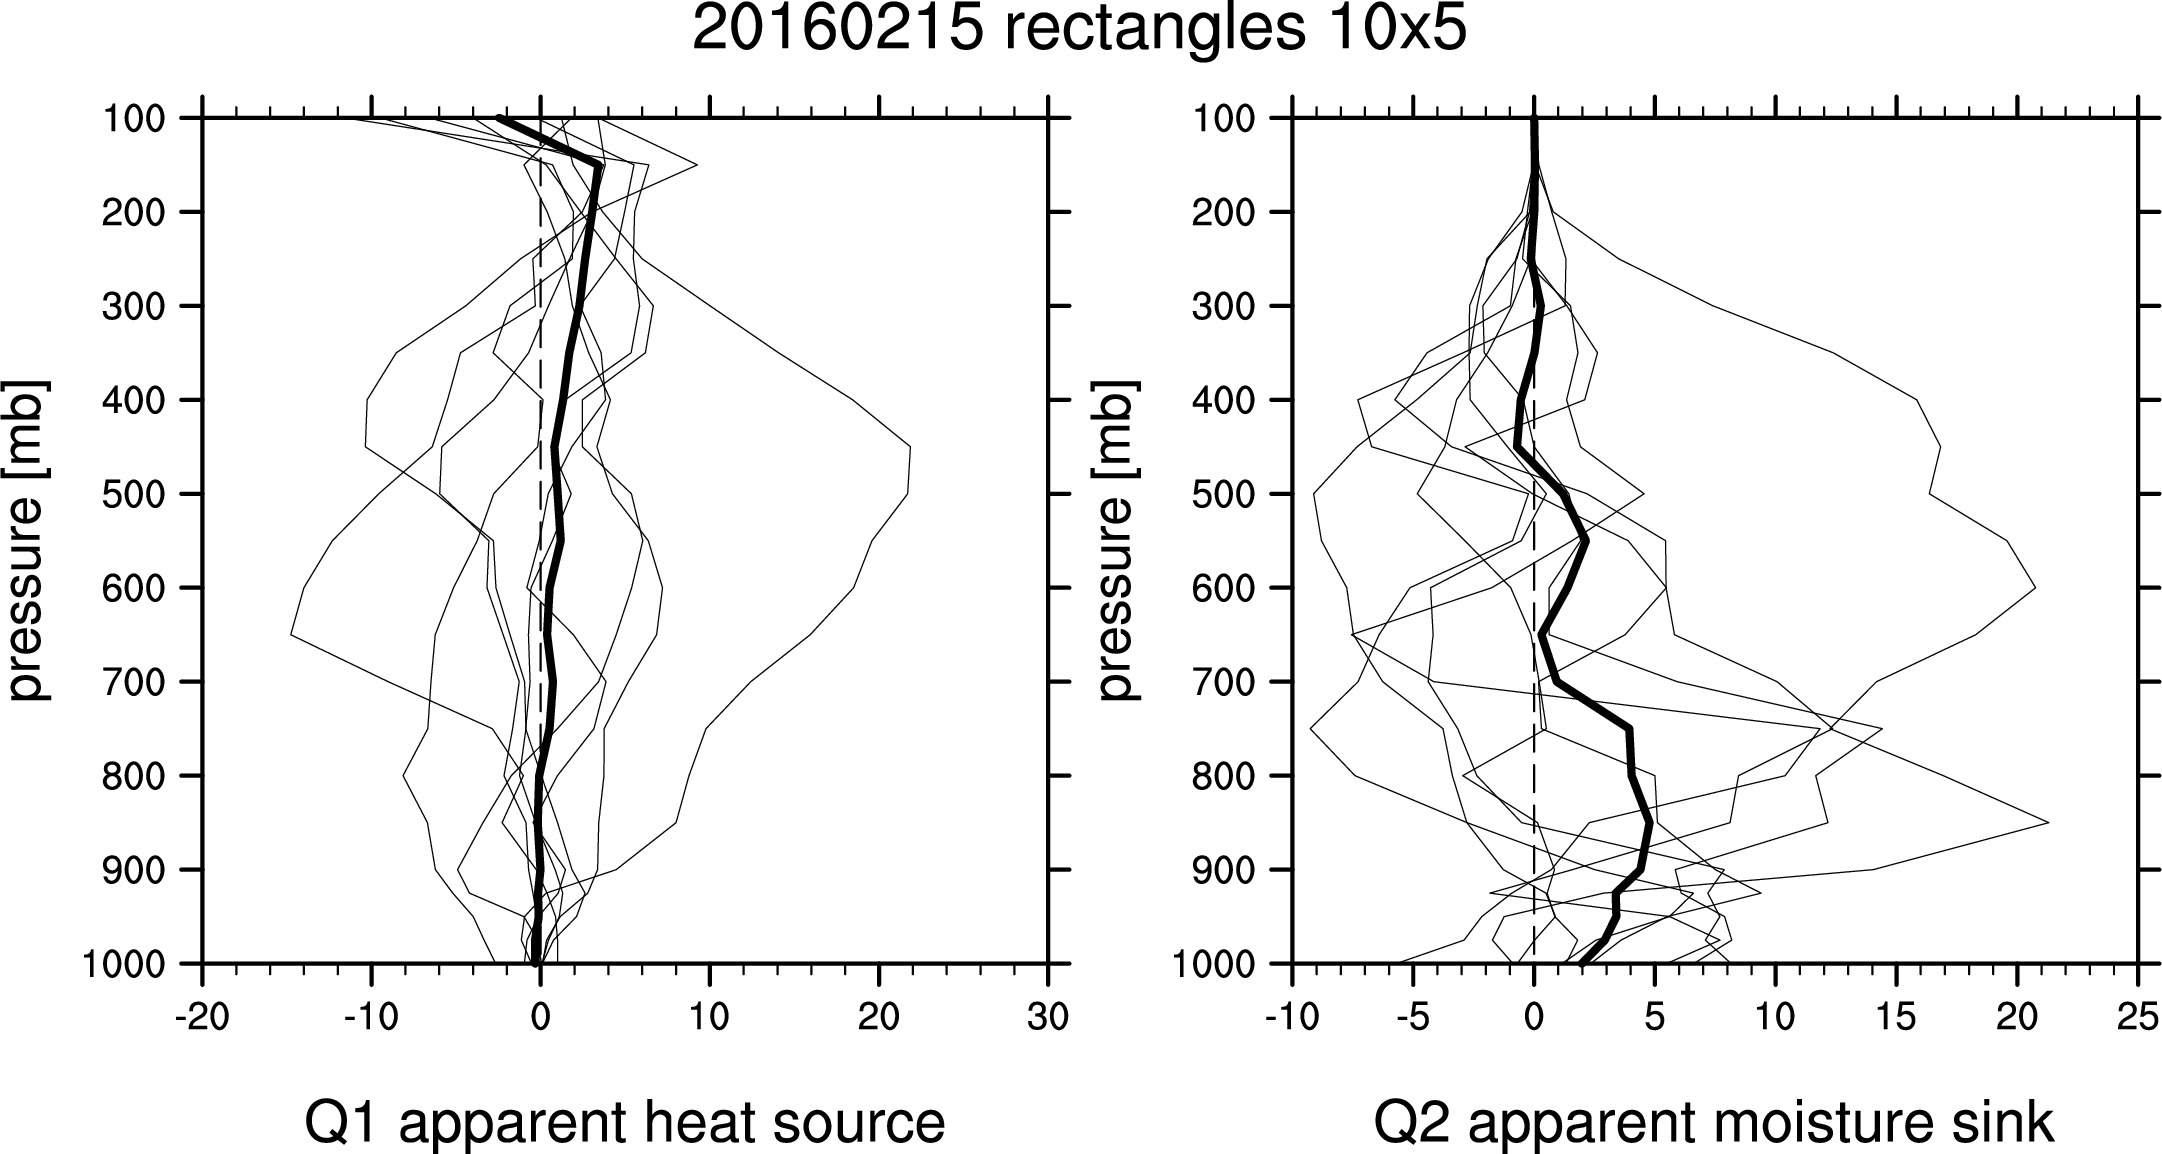
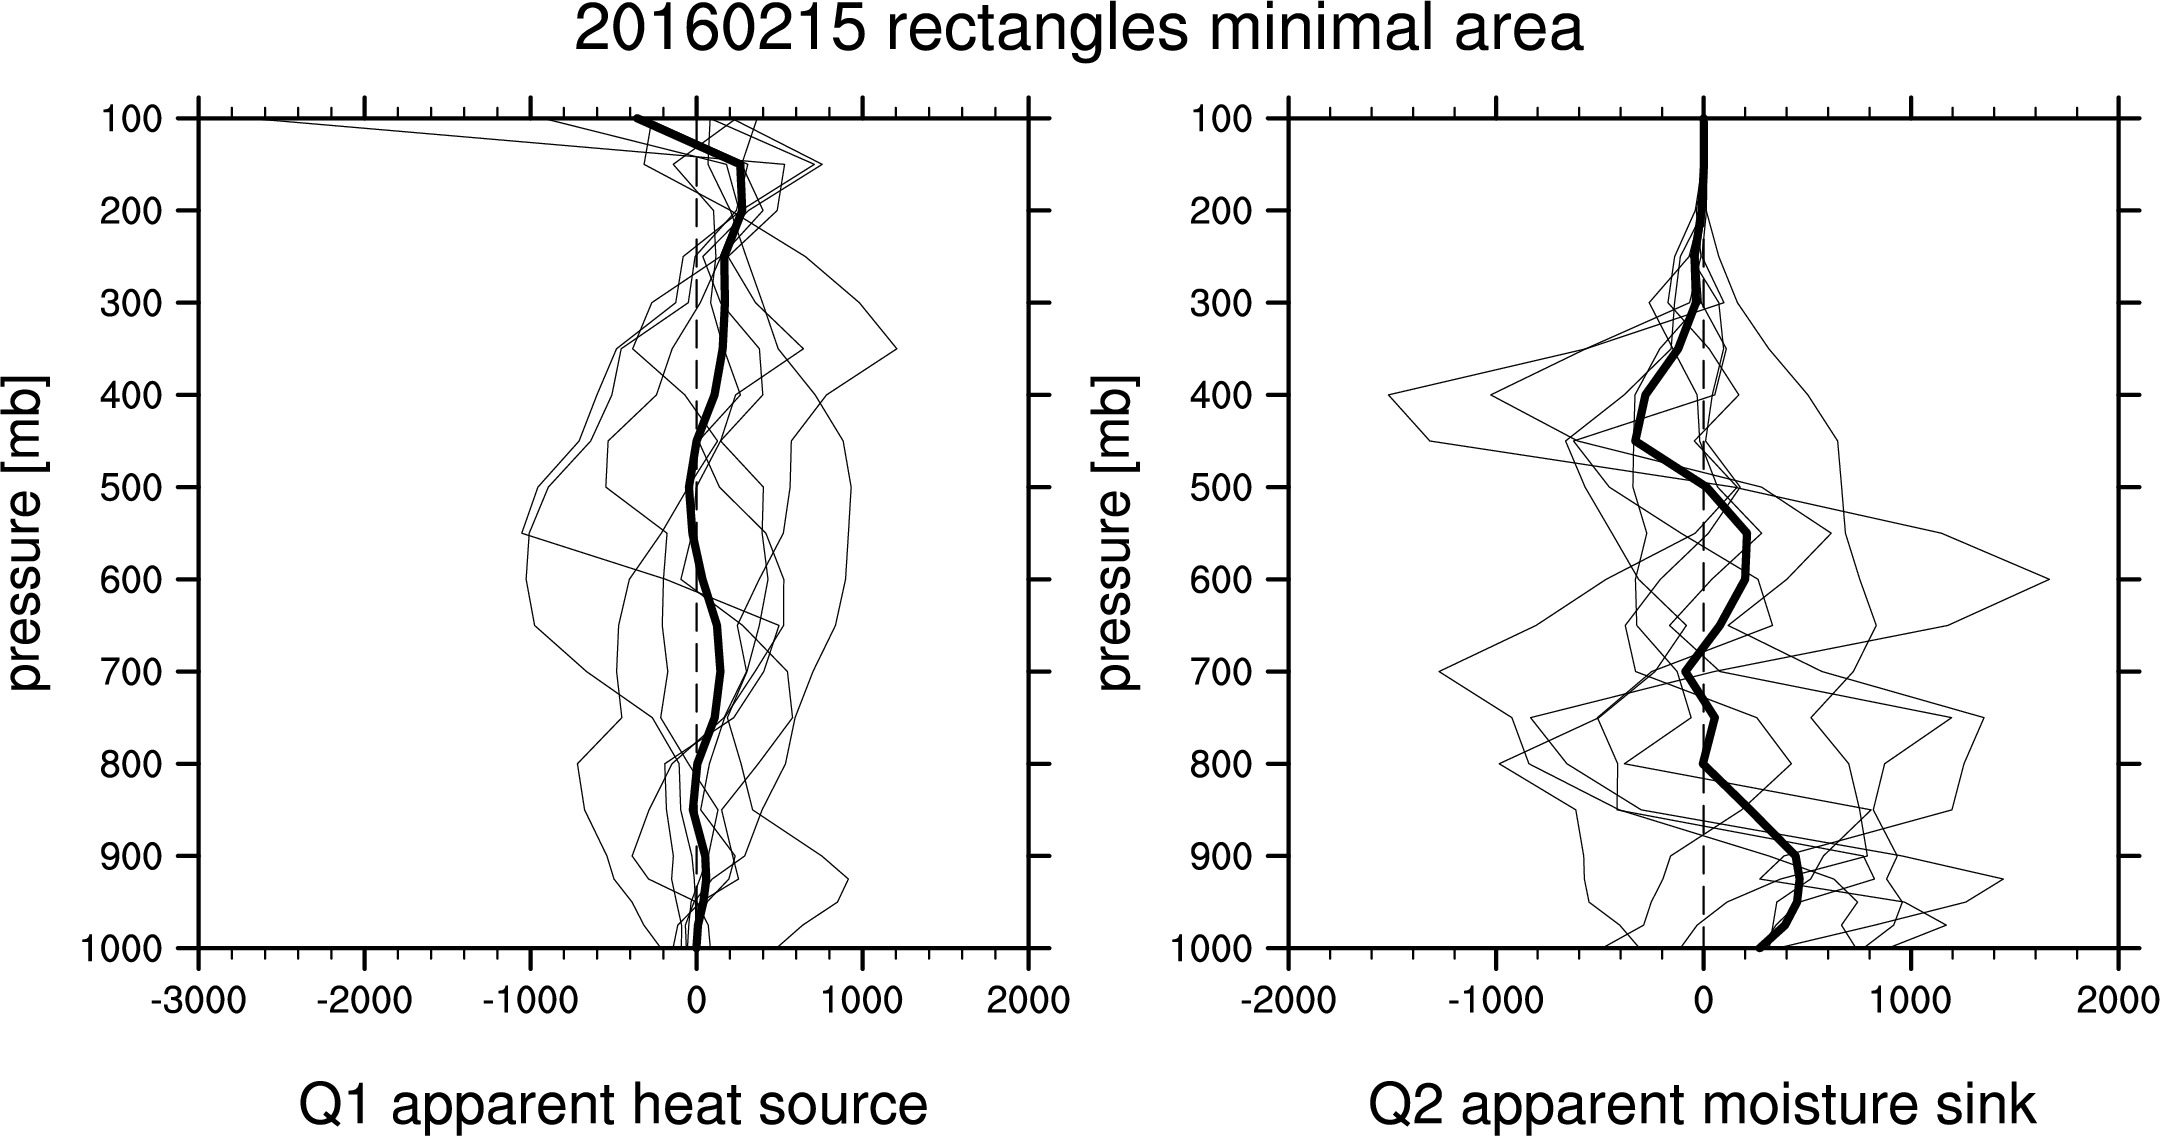
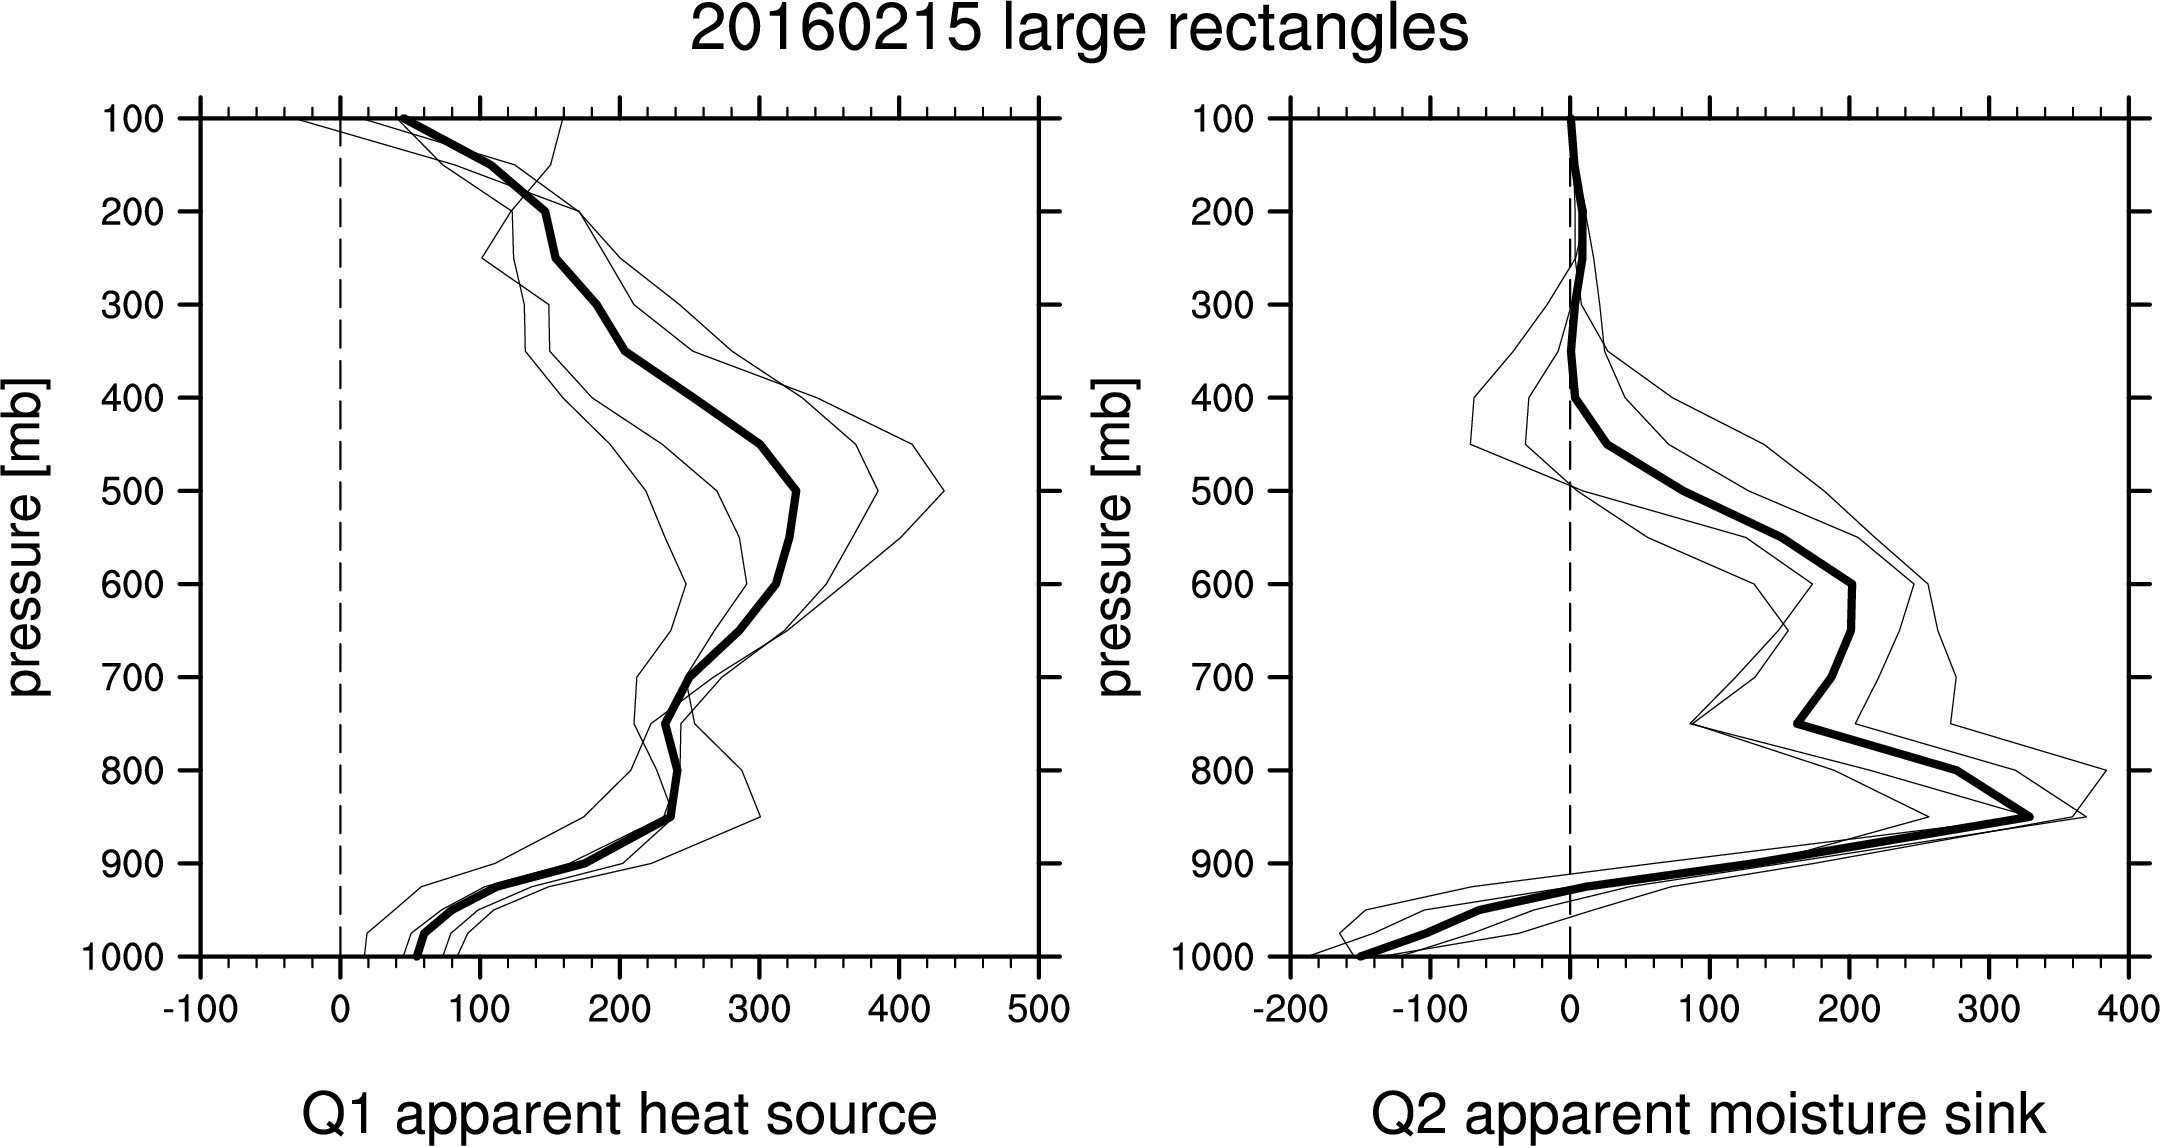
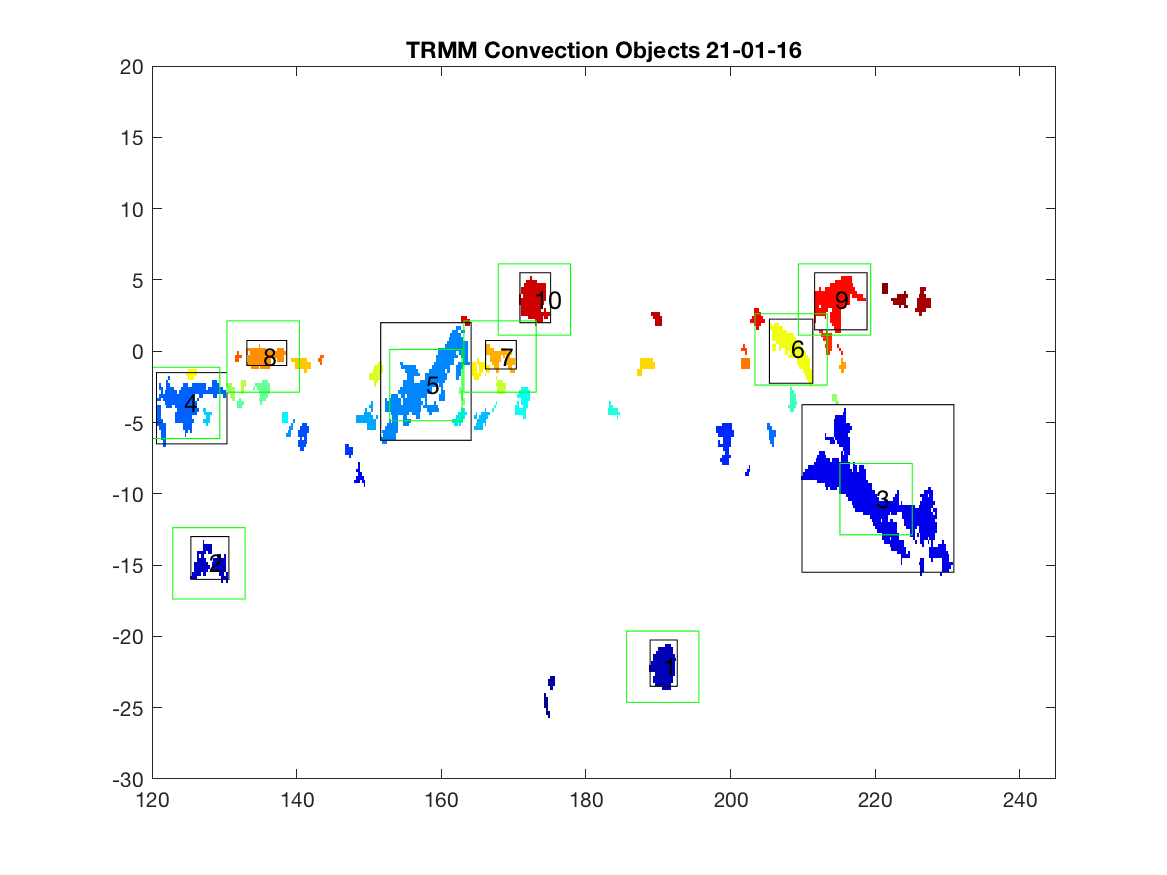
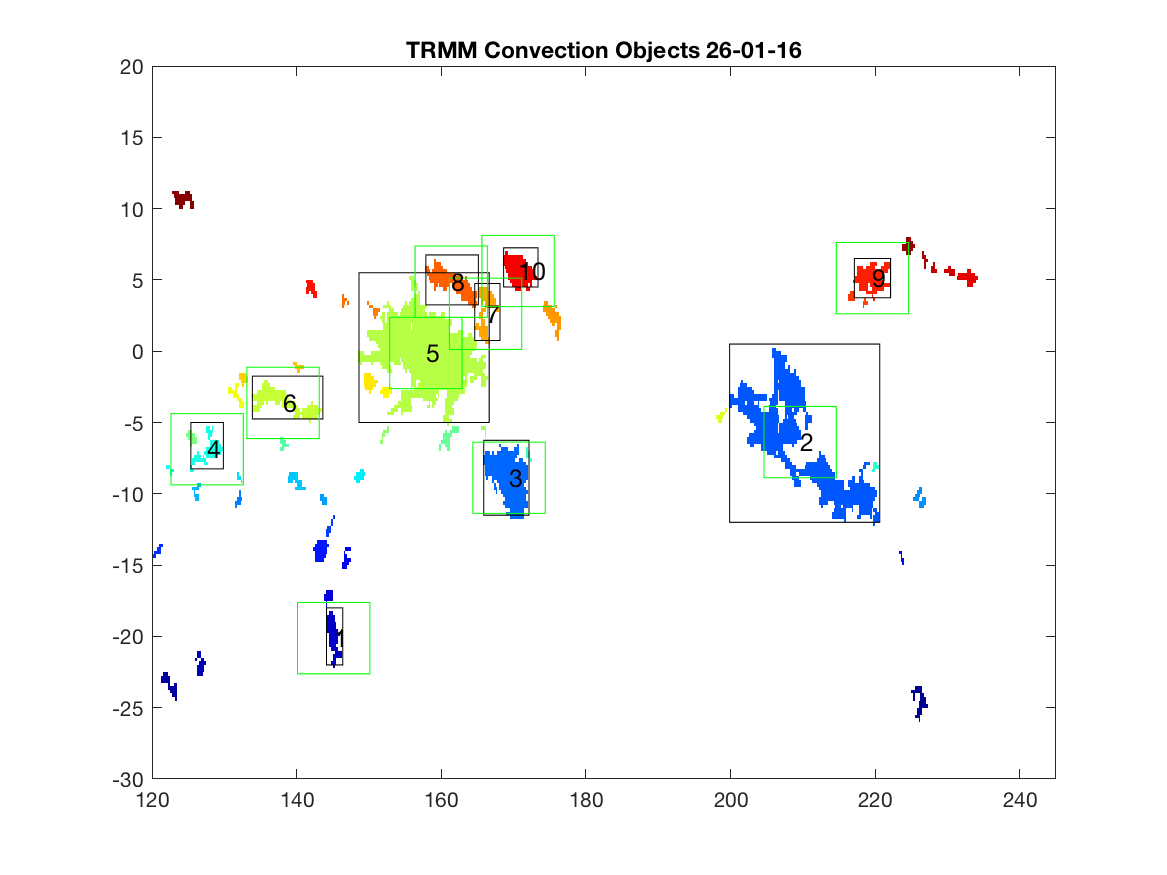
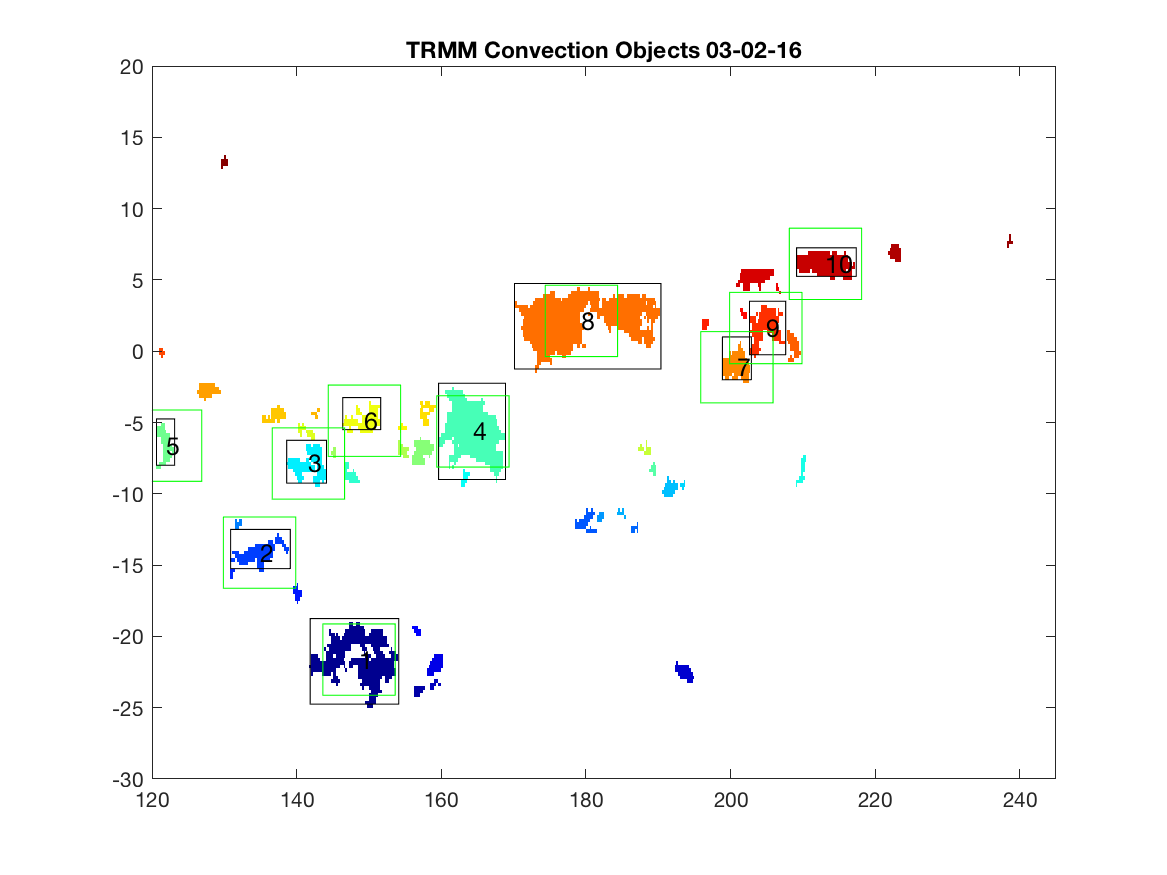
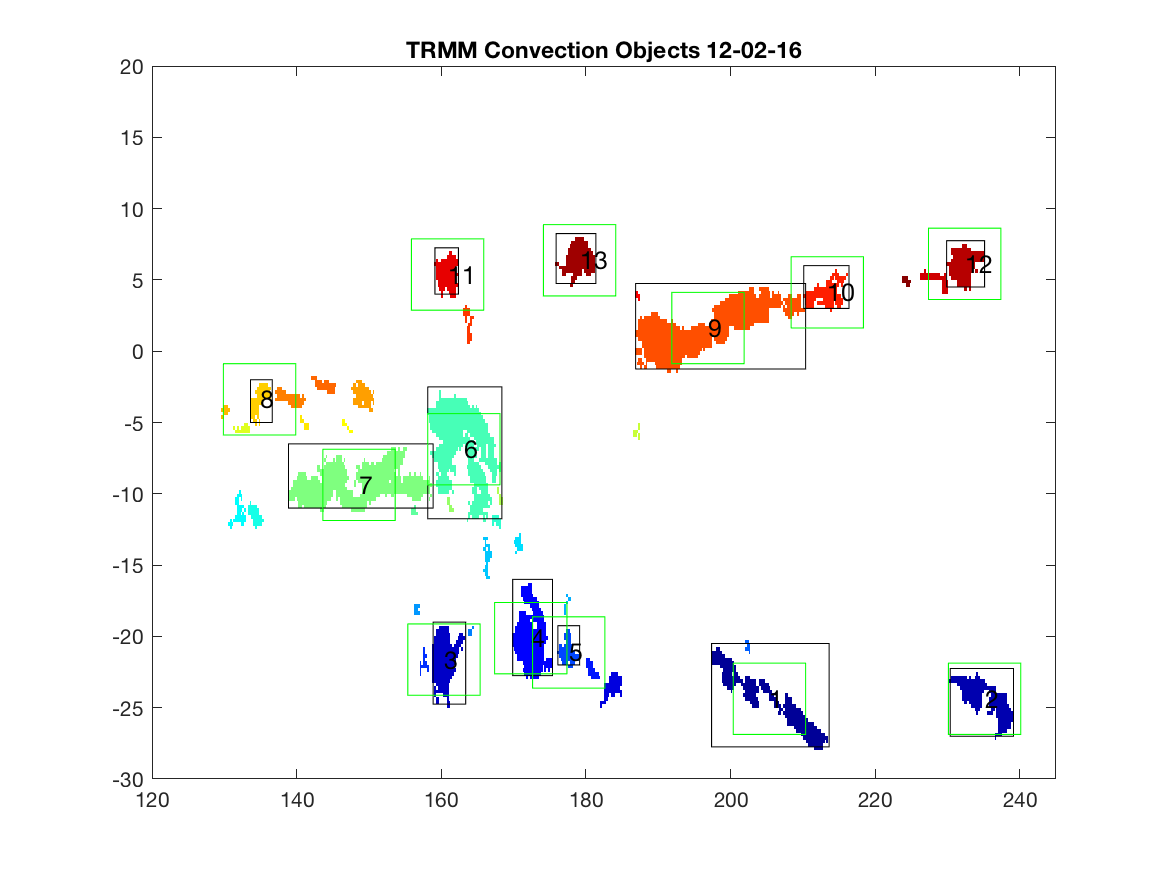
new TRMM rectangles
Samples (day-month-year)
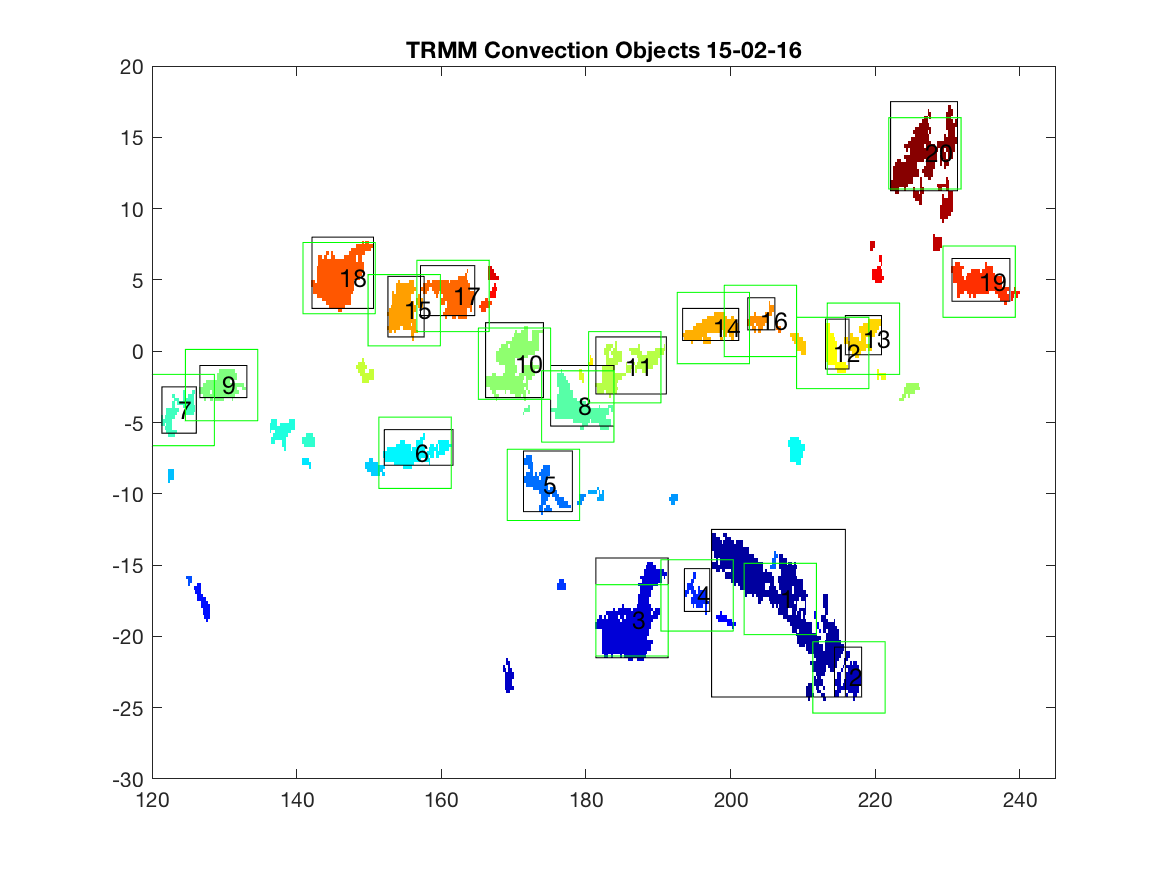
all original June 2018 rectangle images here
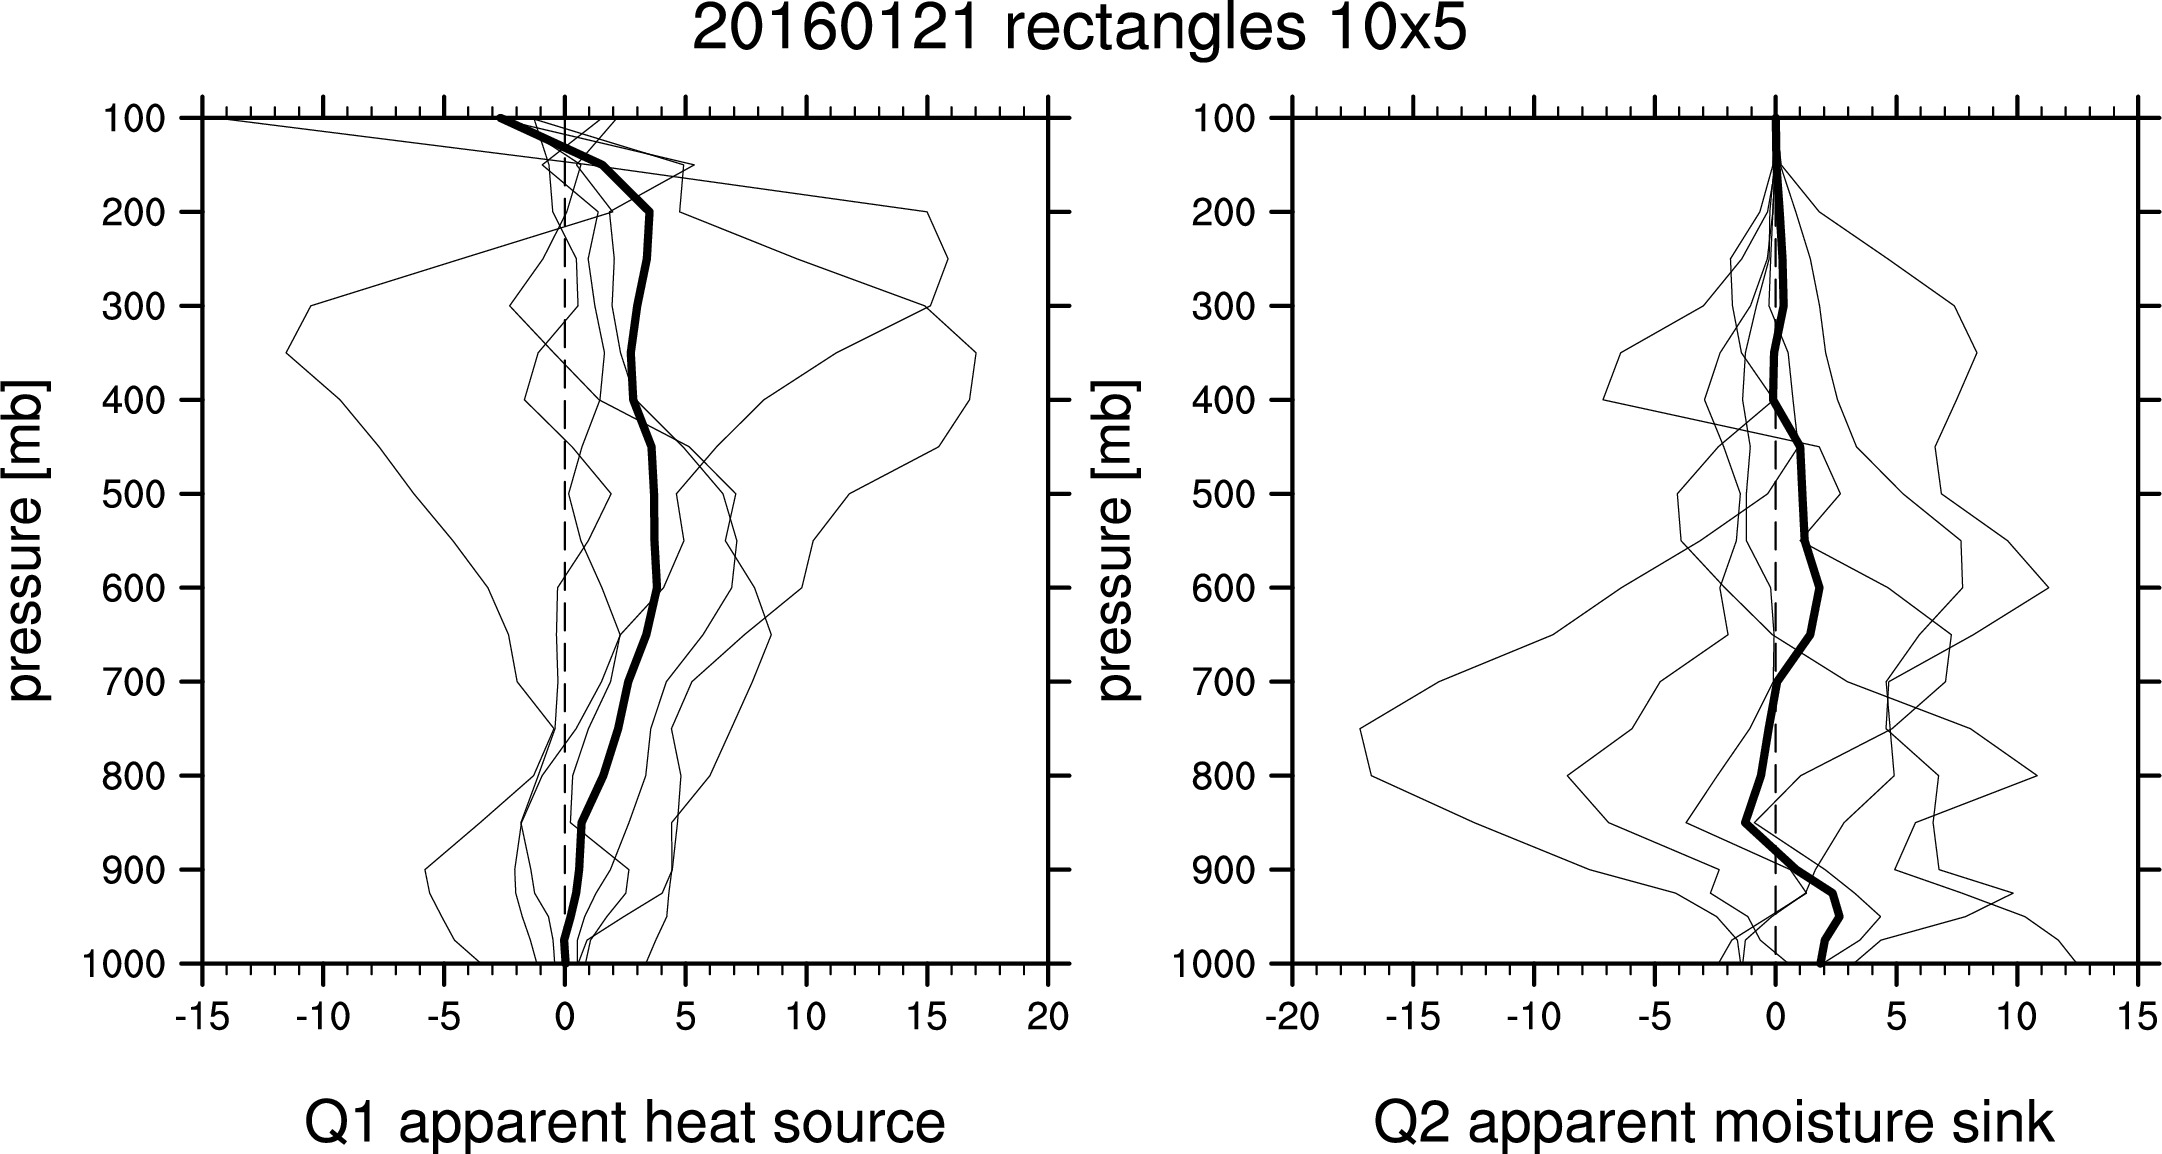
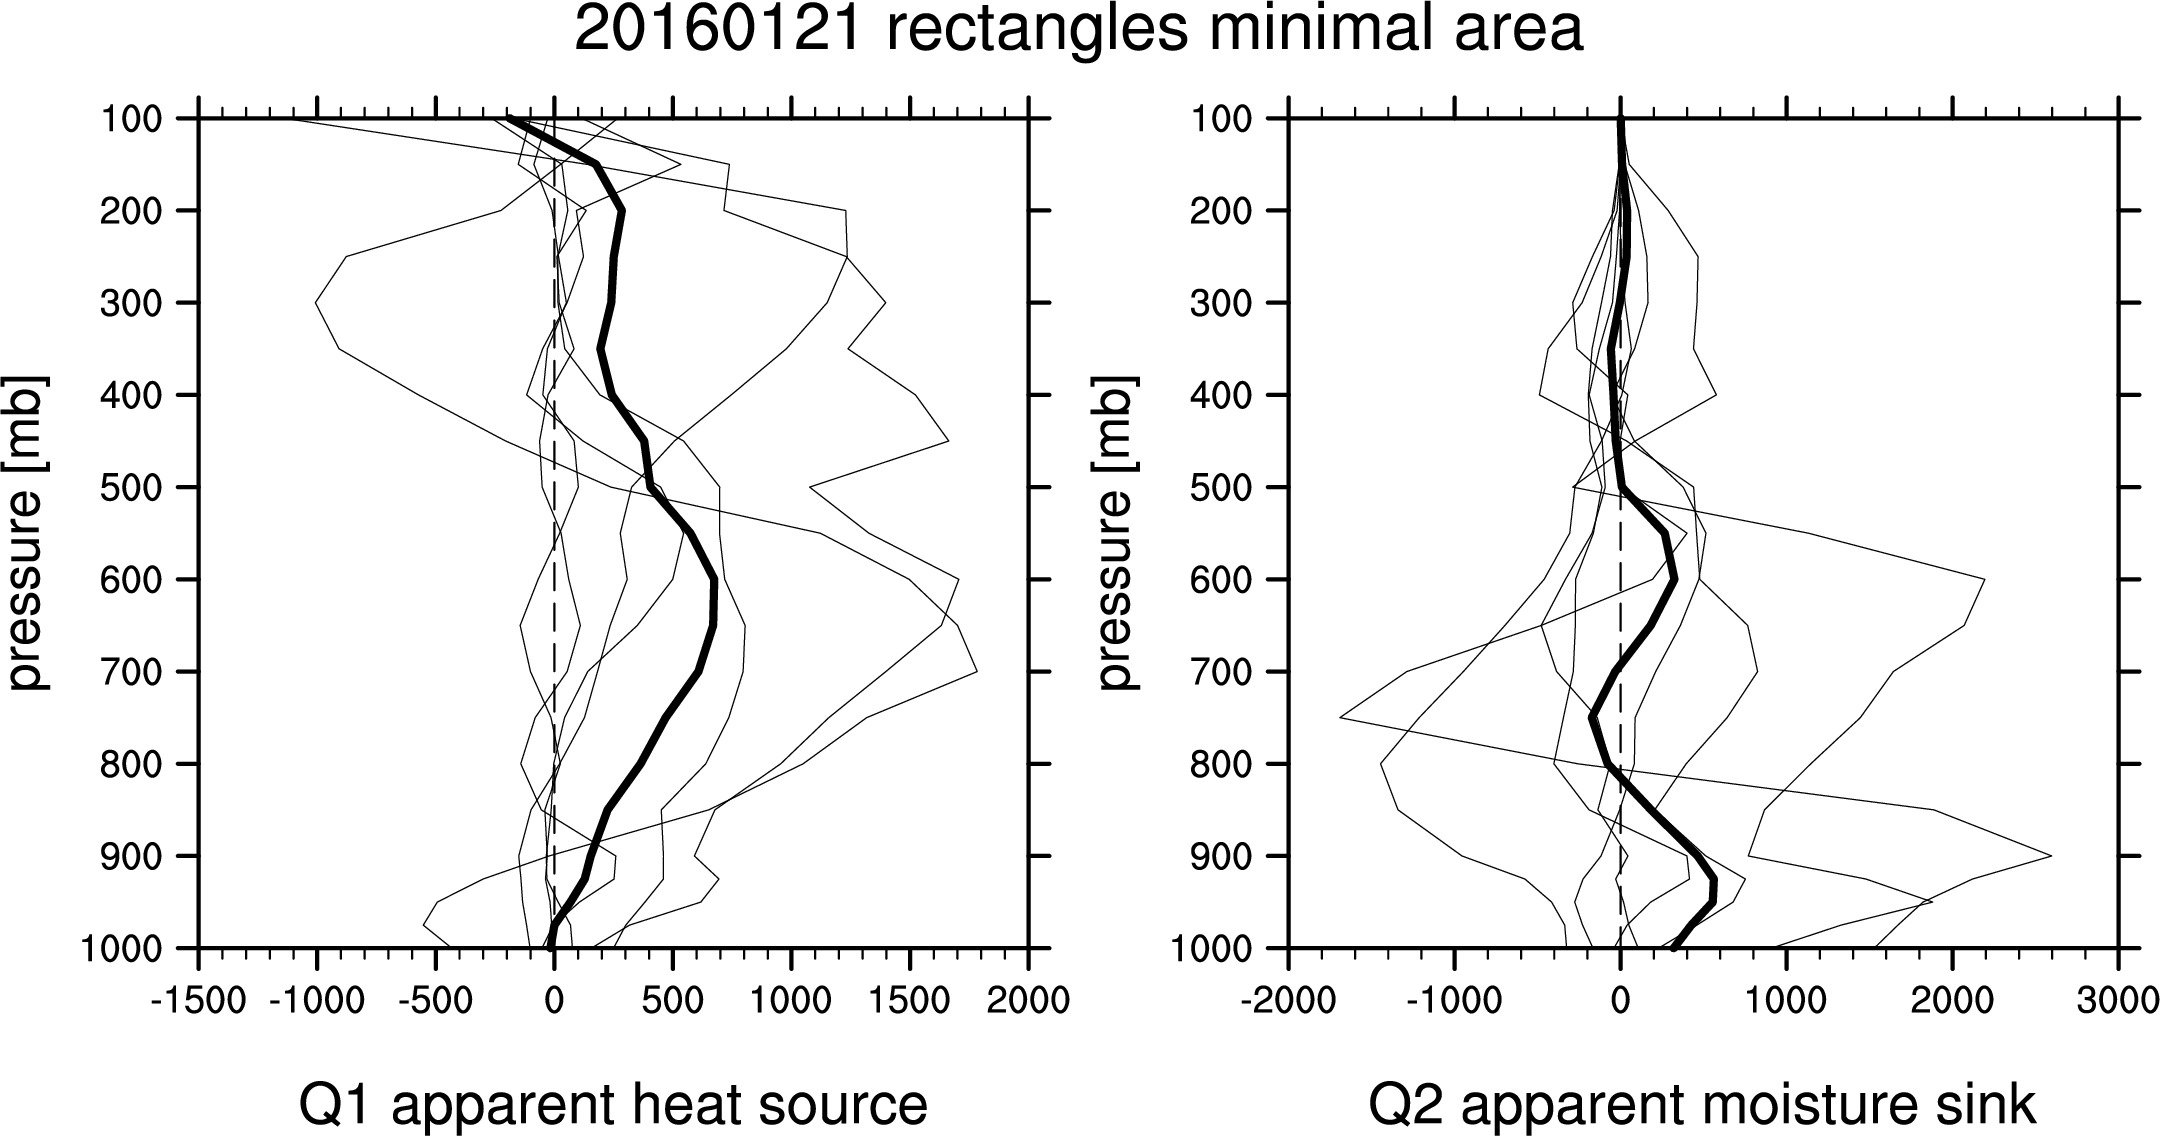
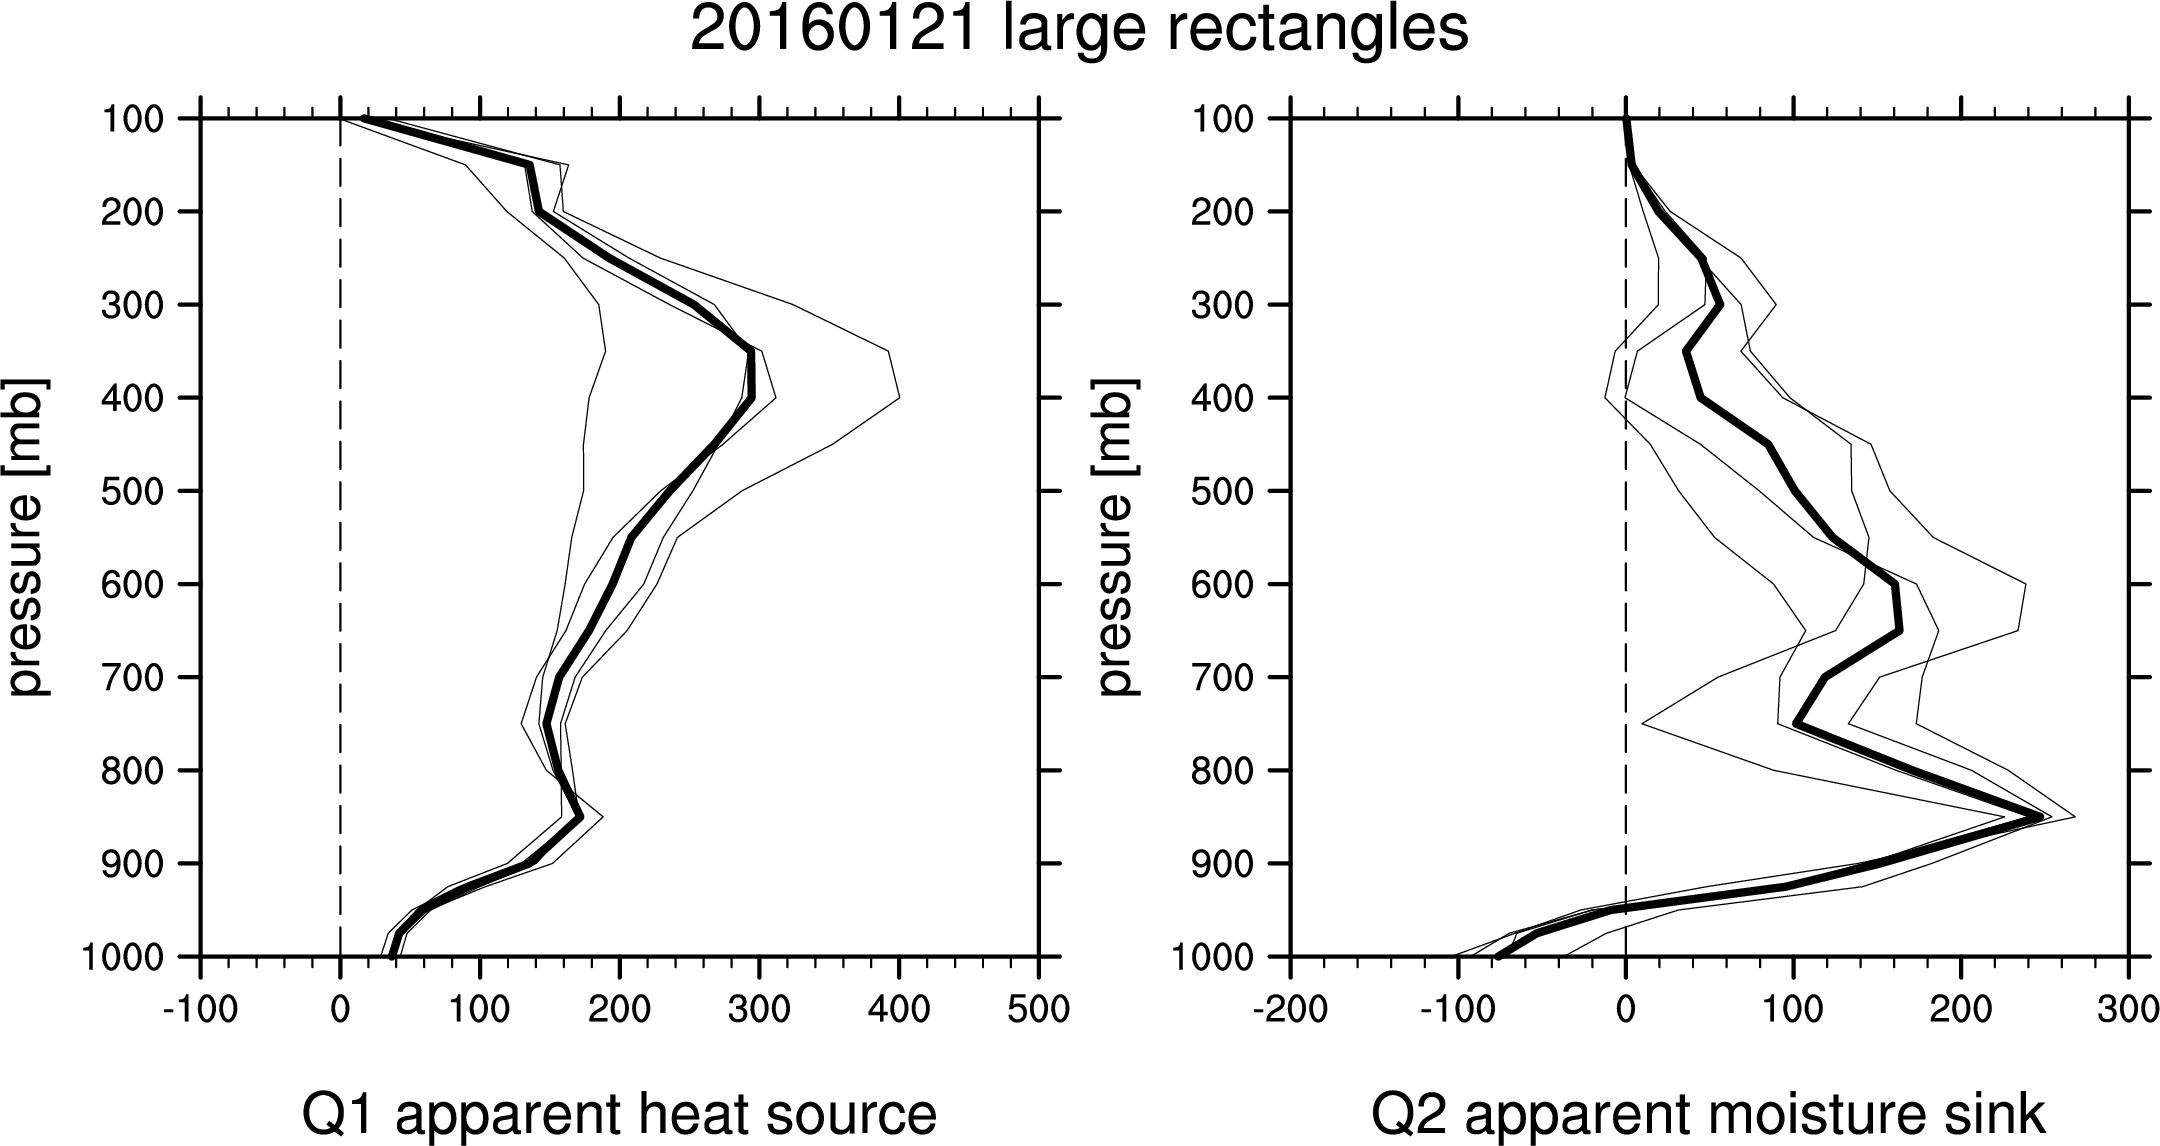
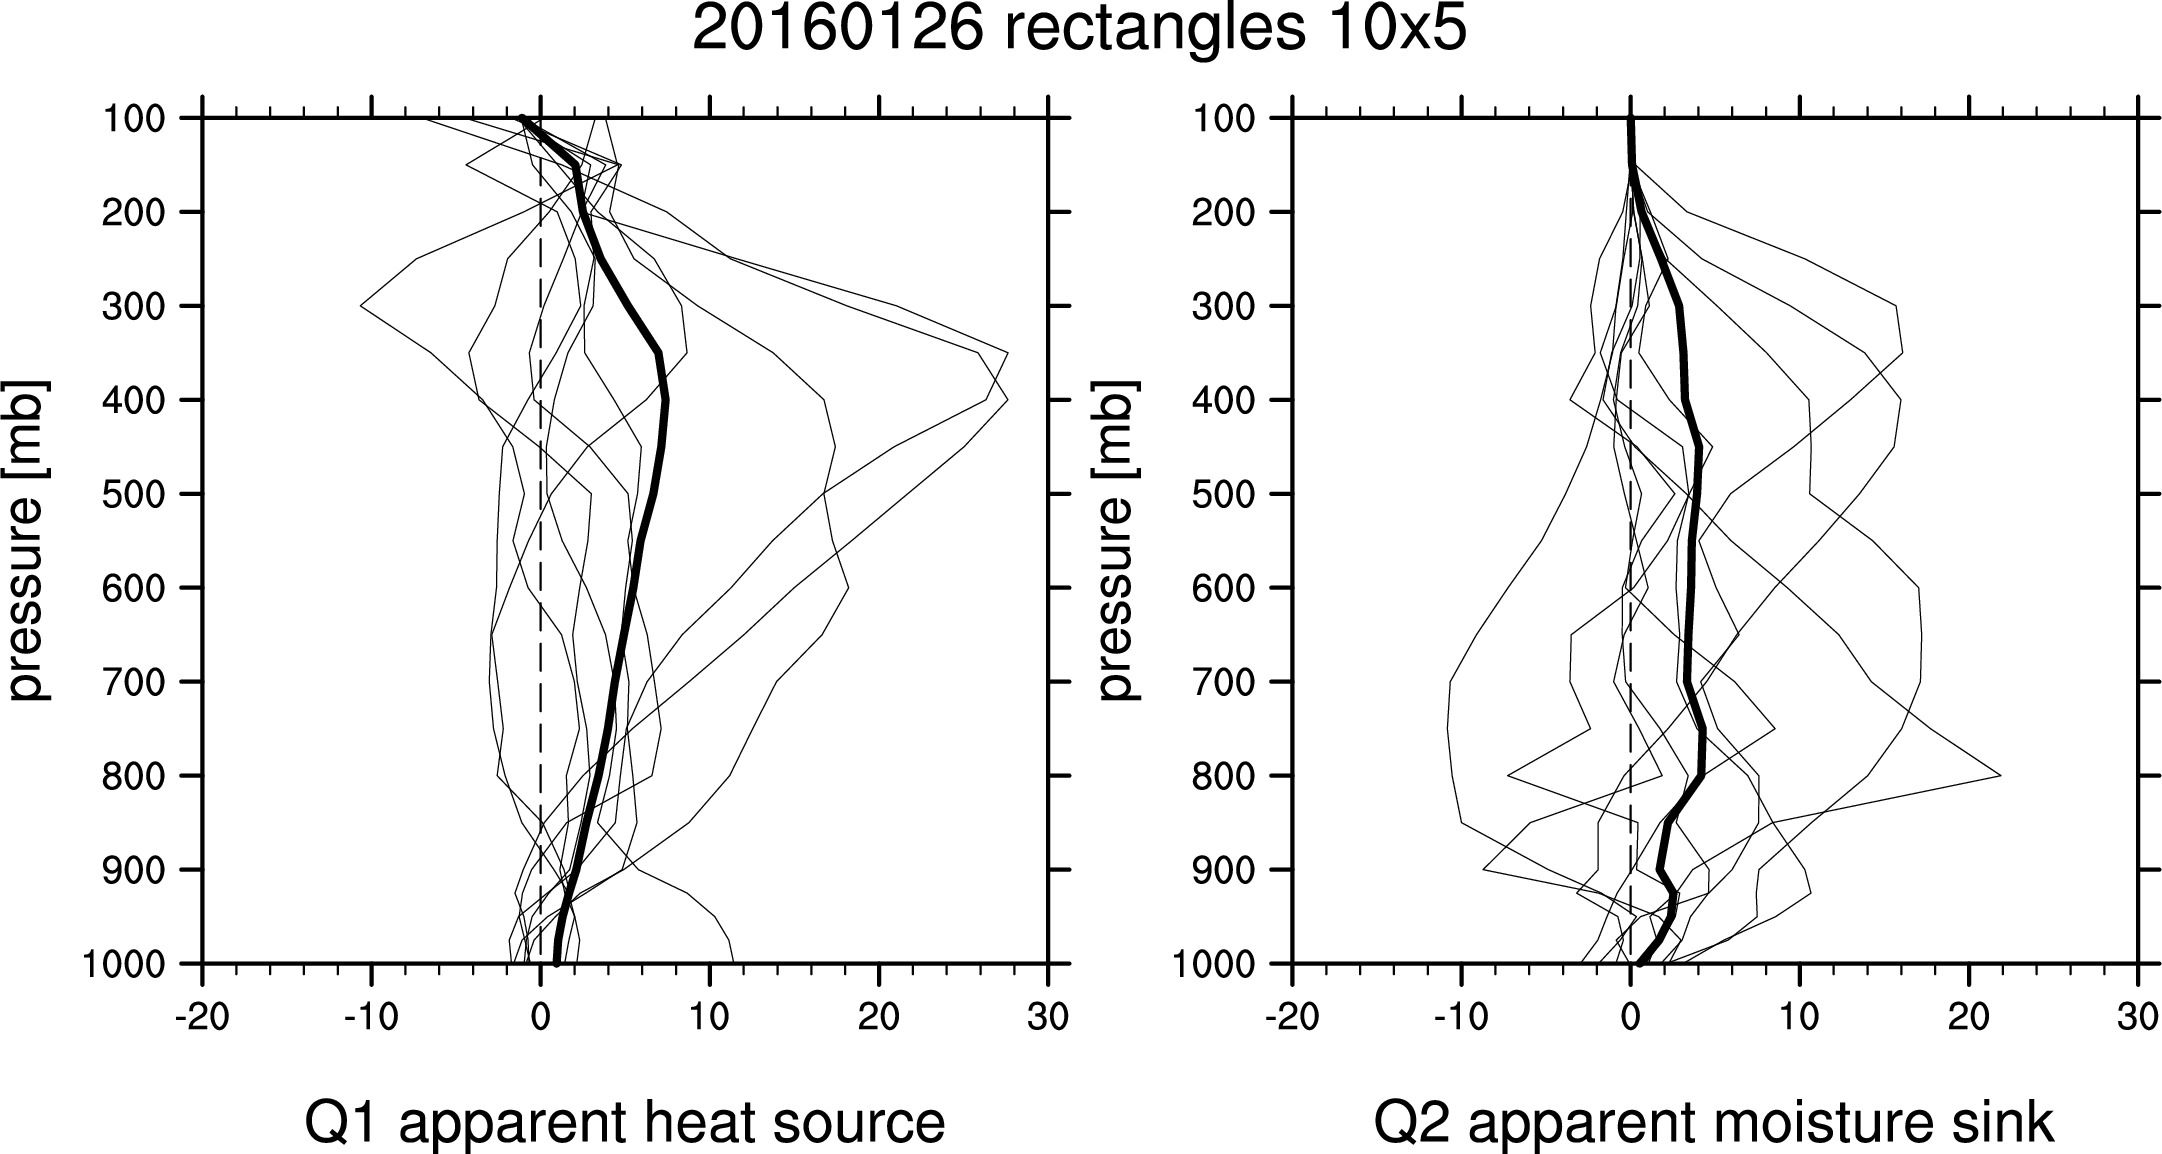
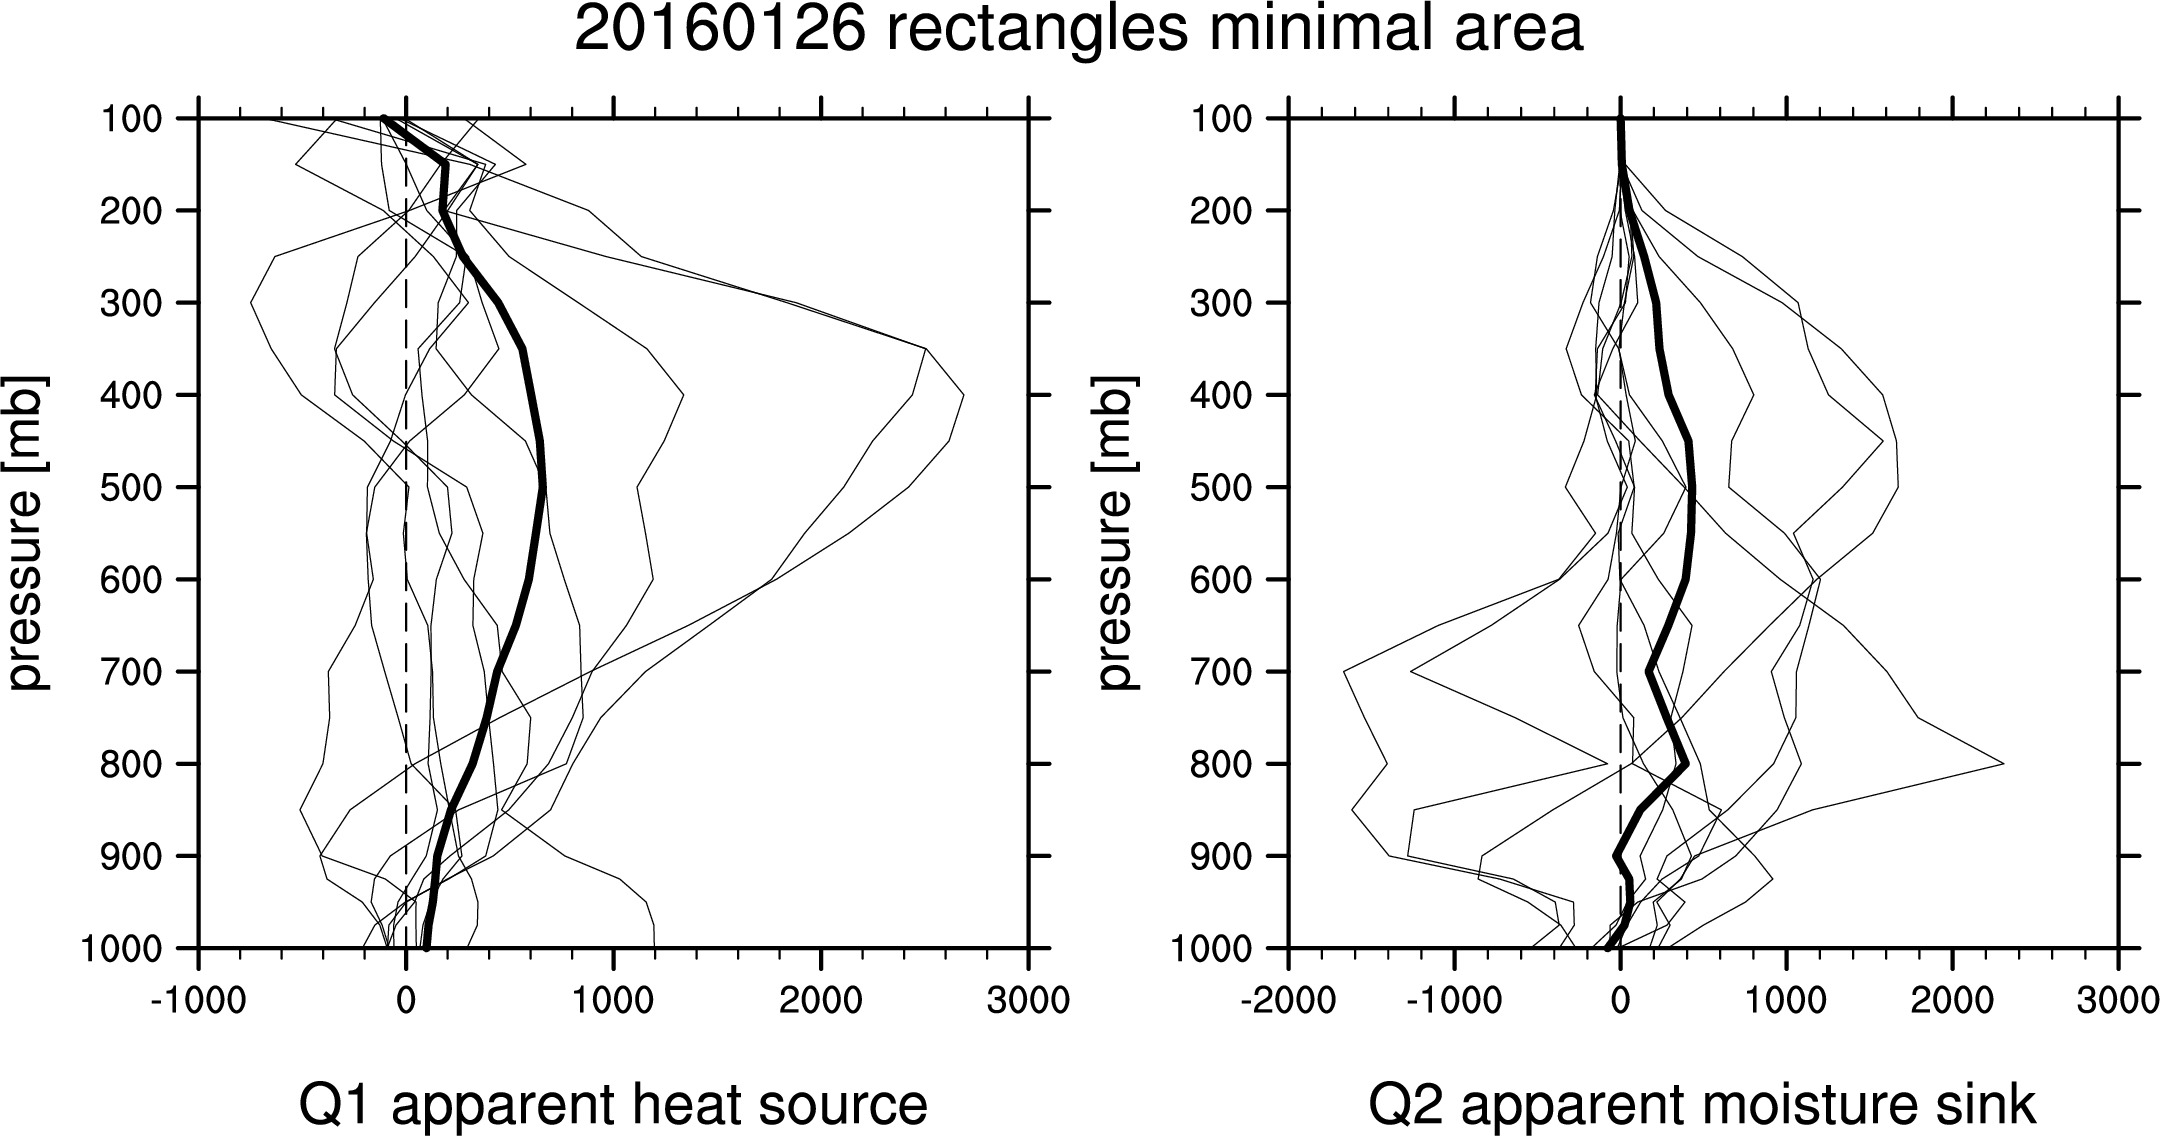
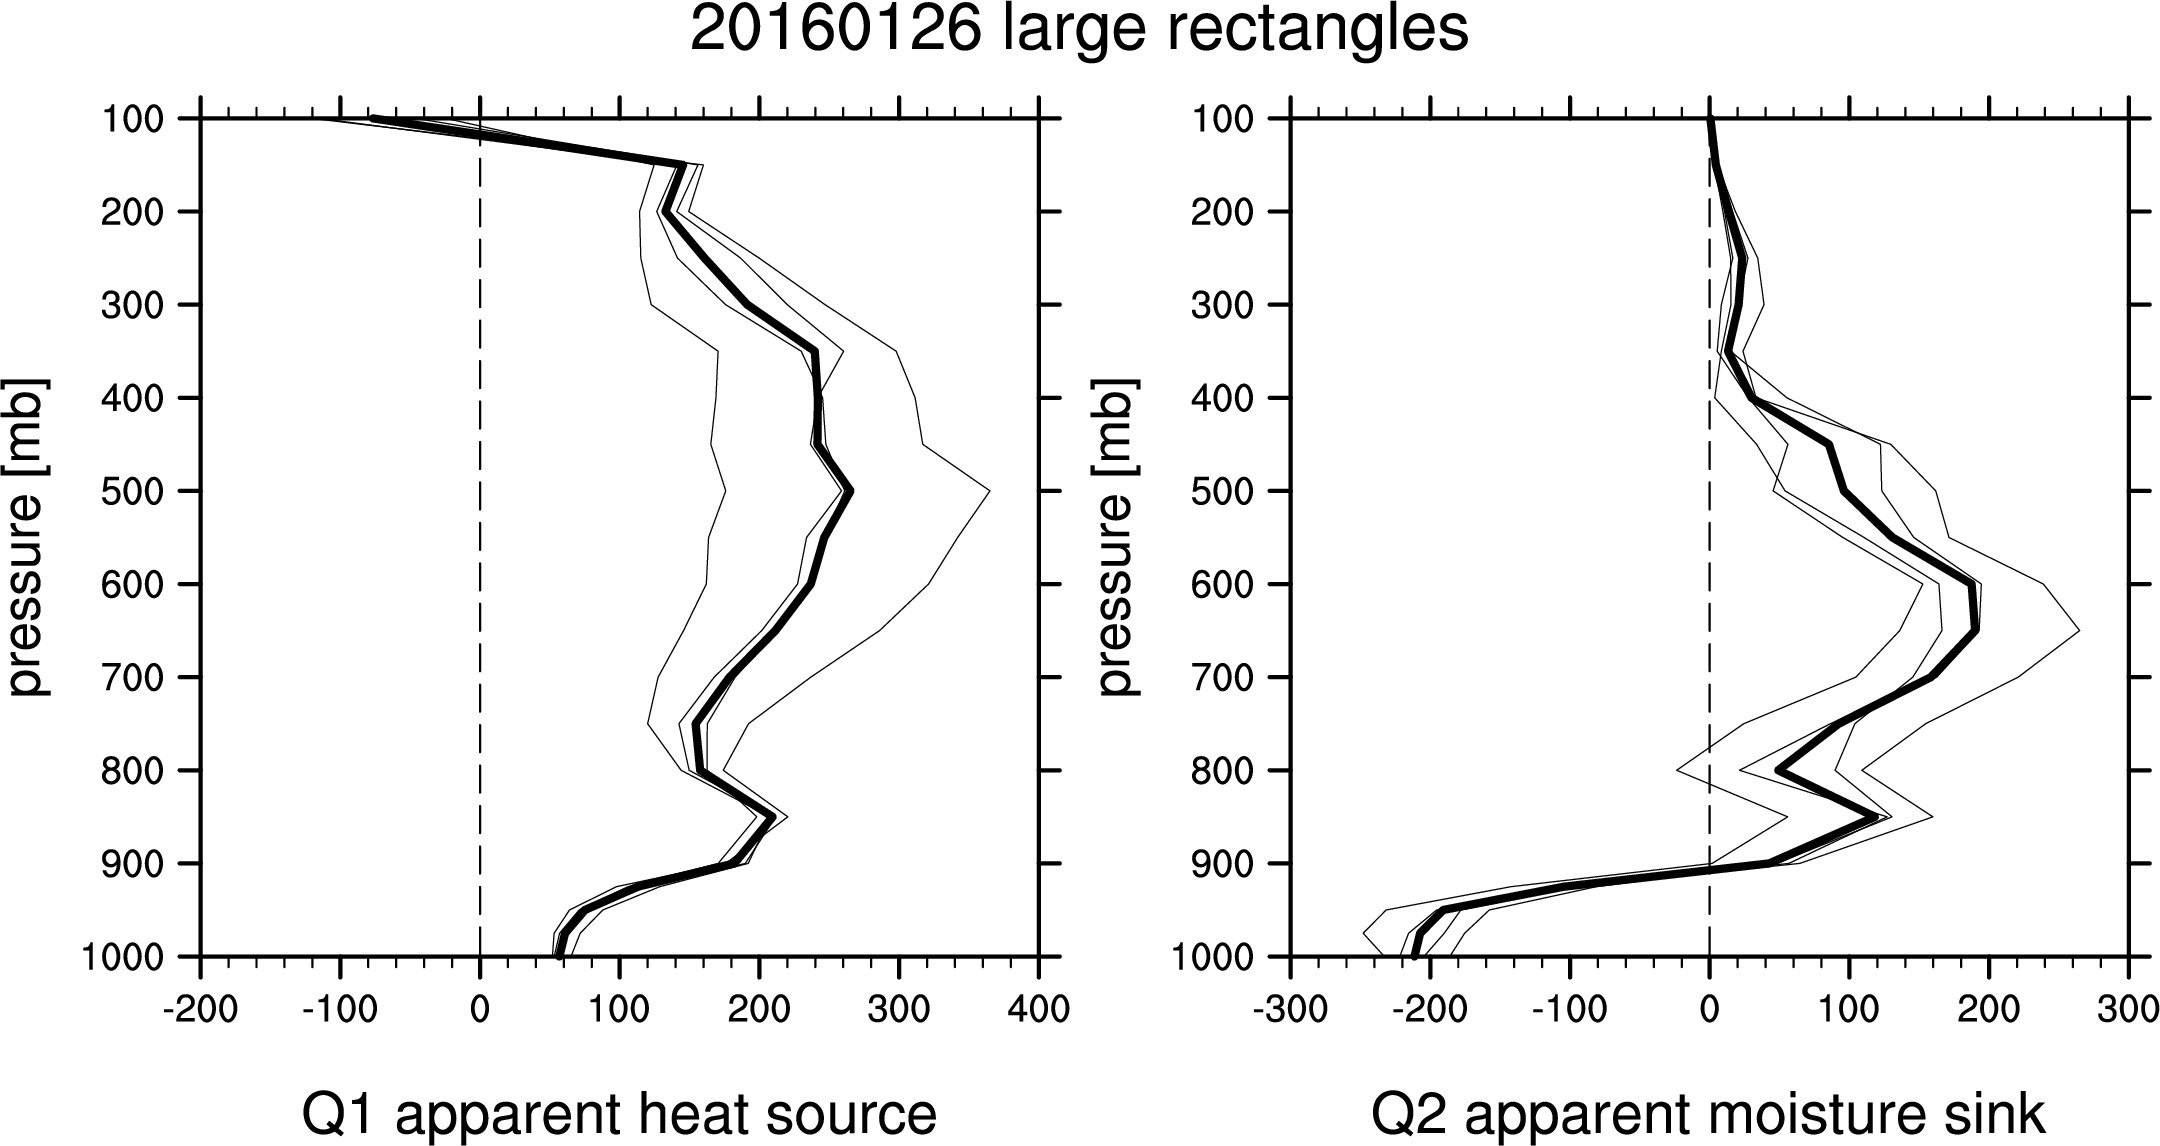
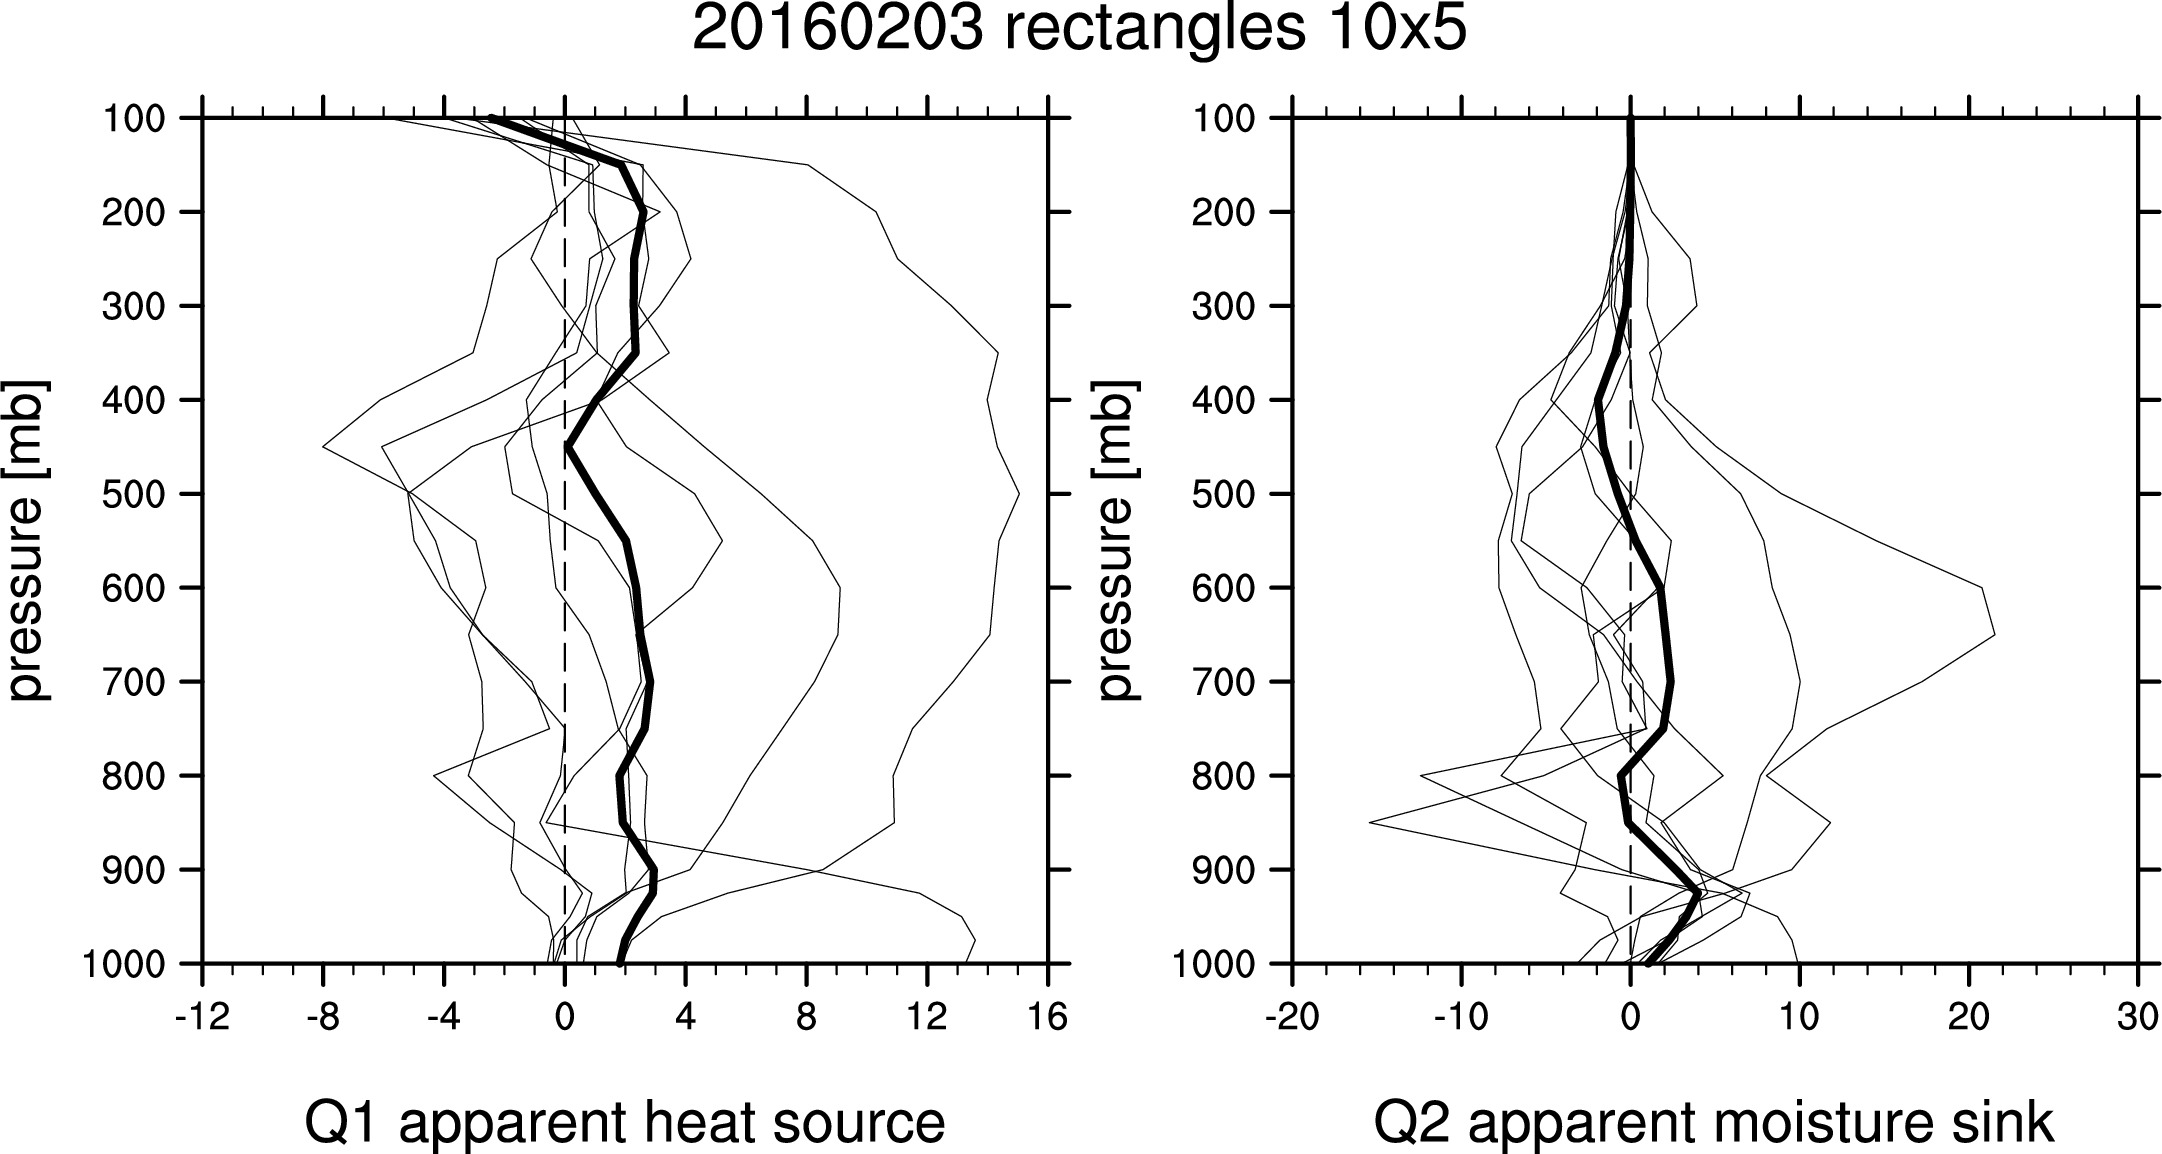
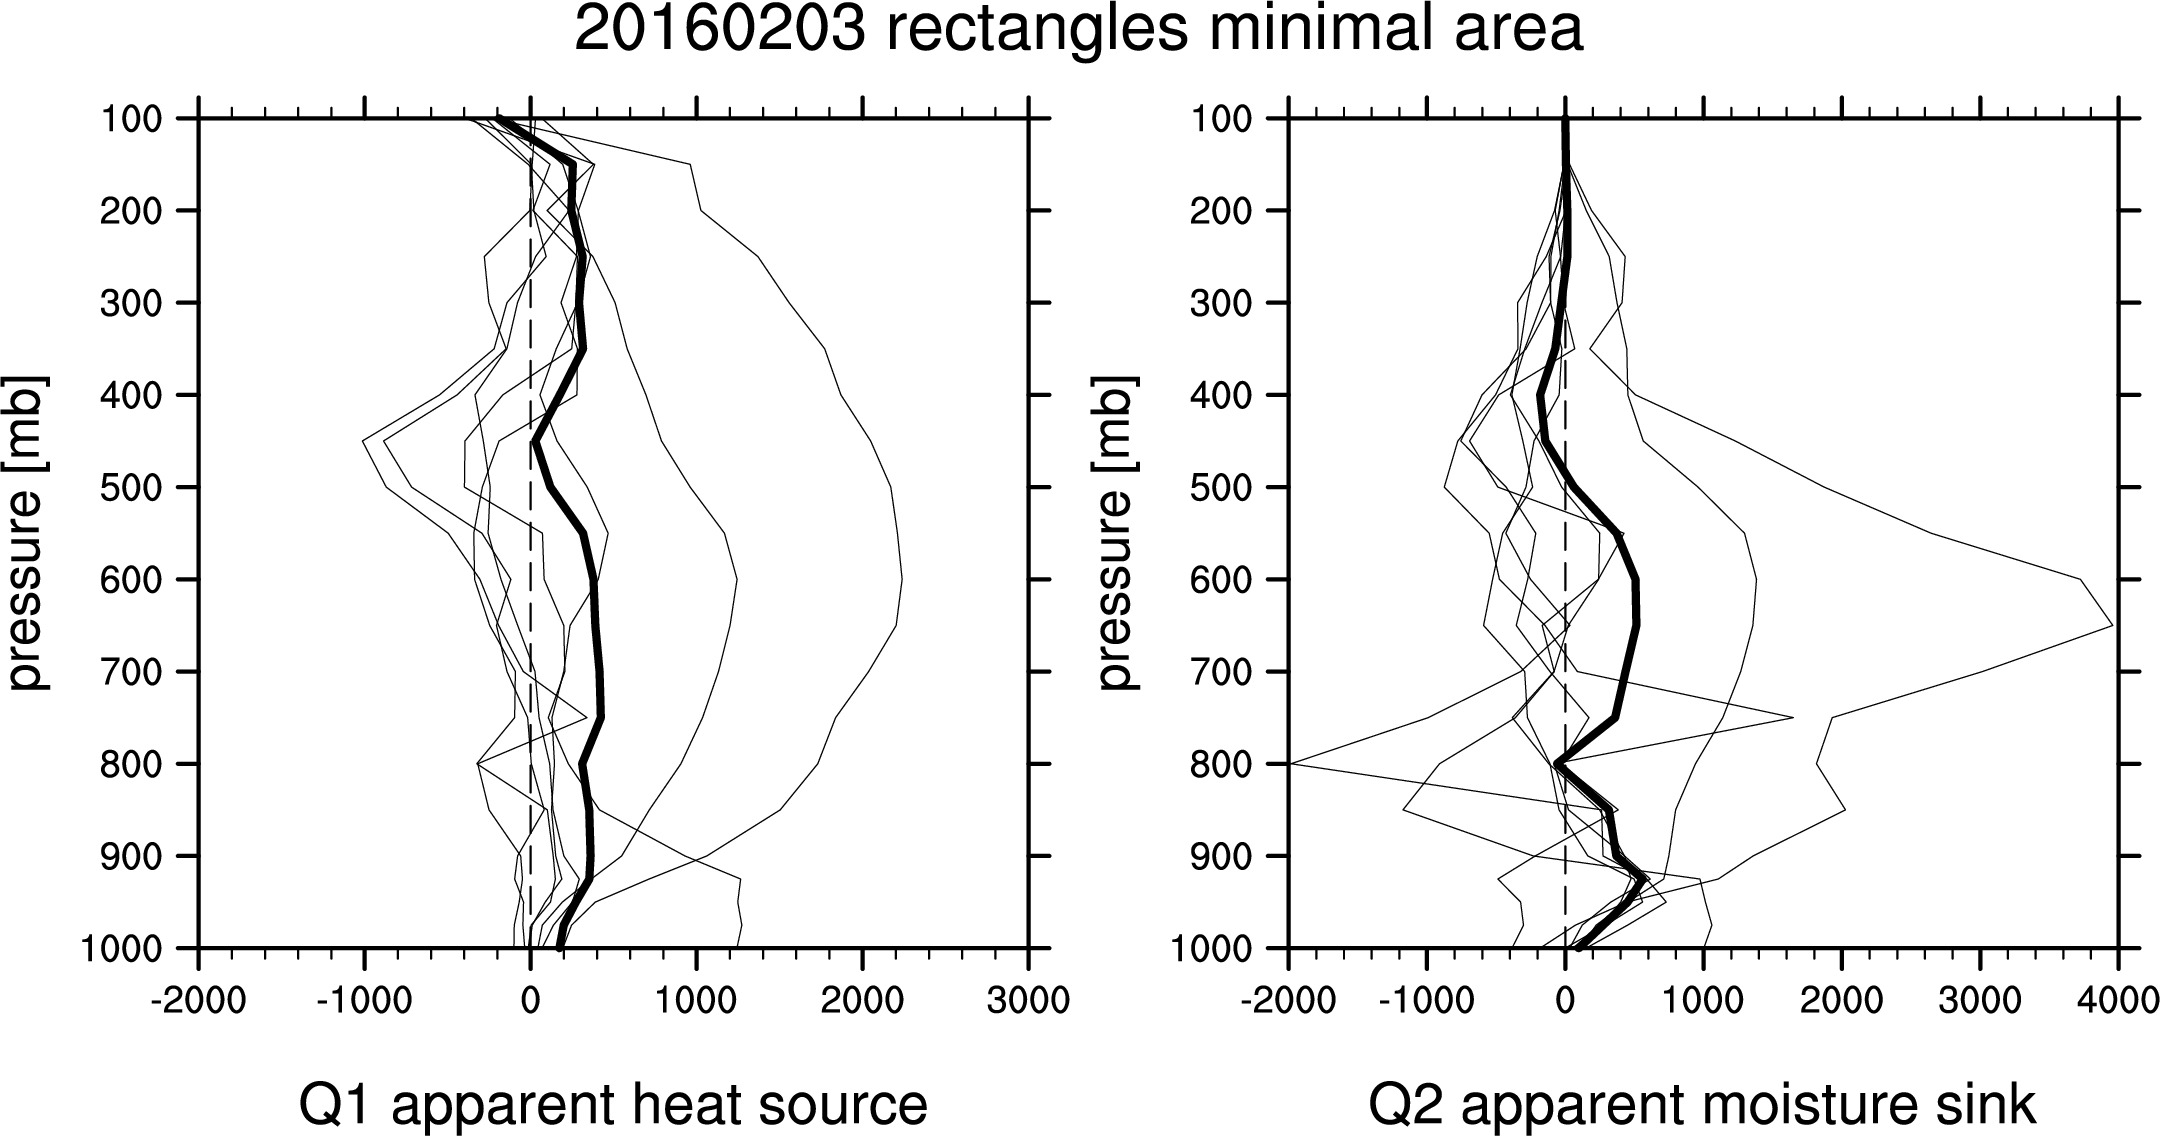
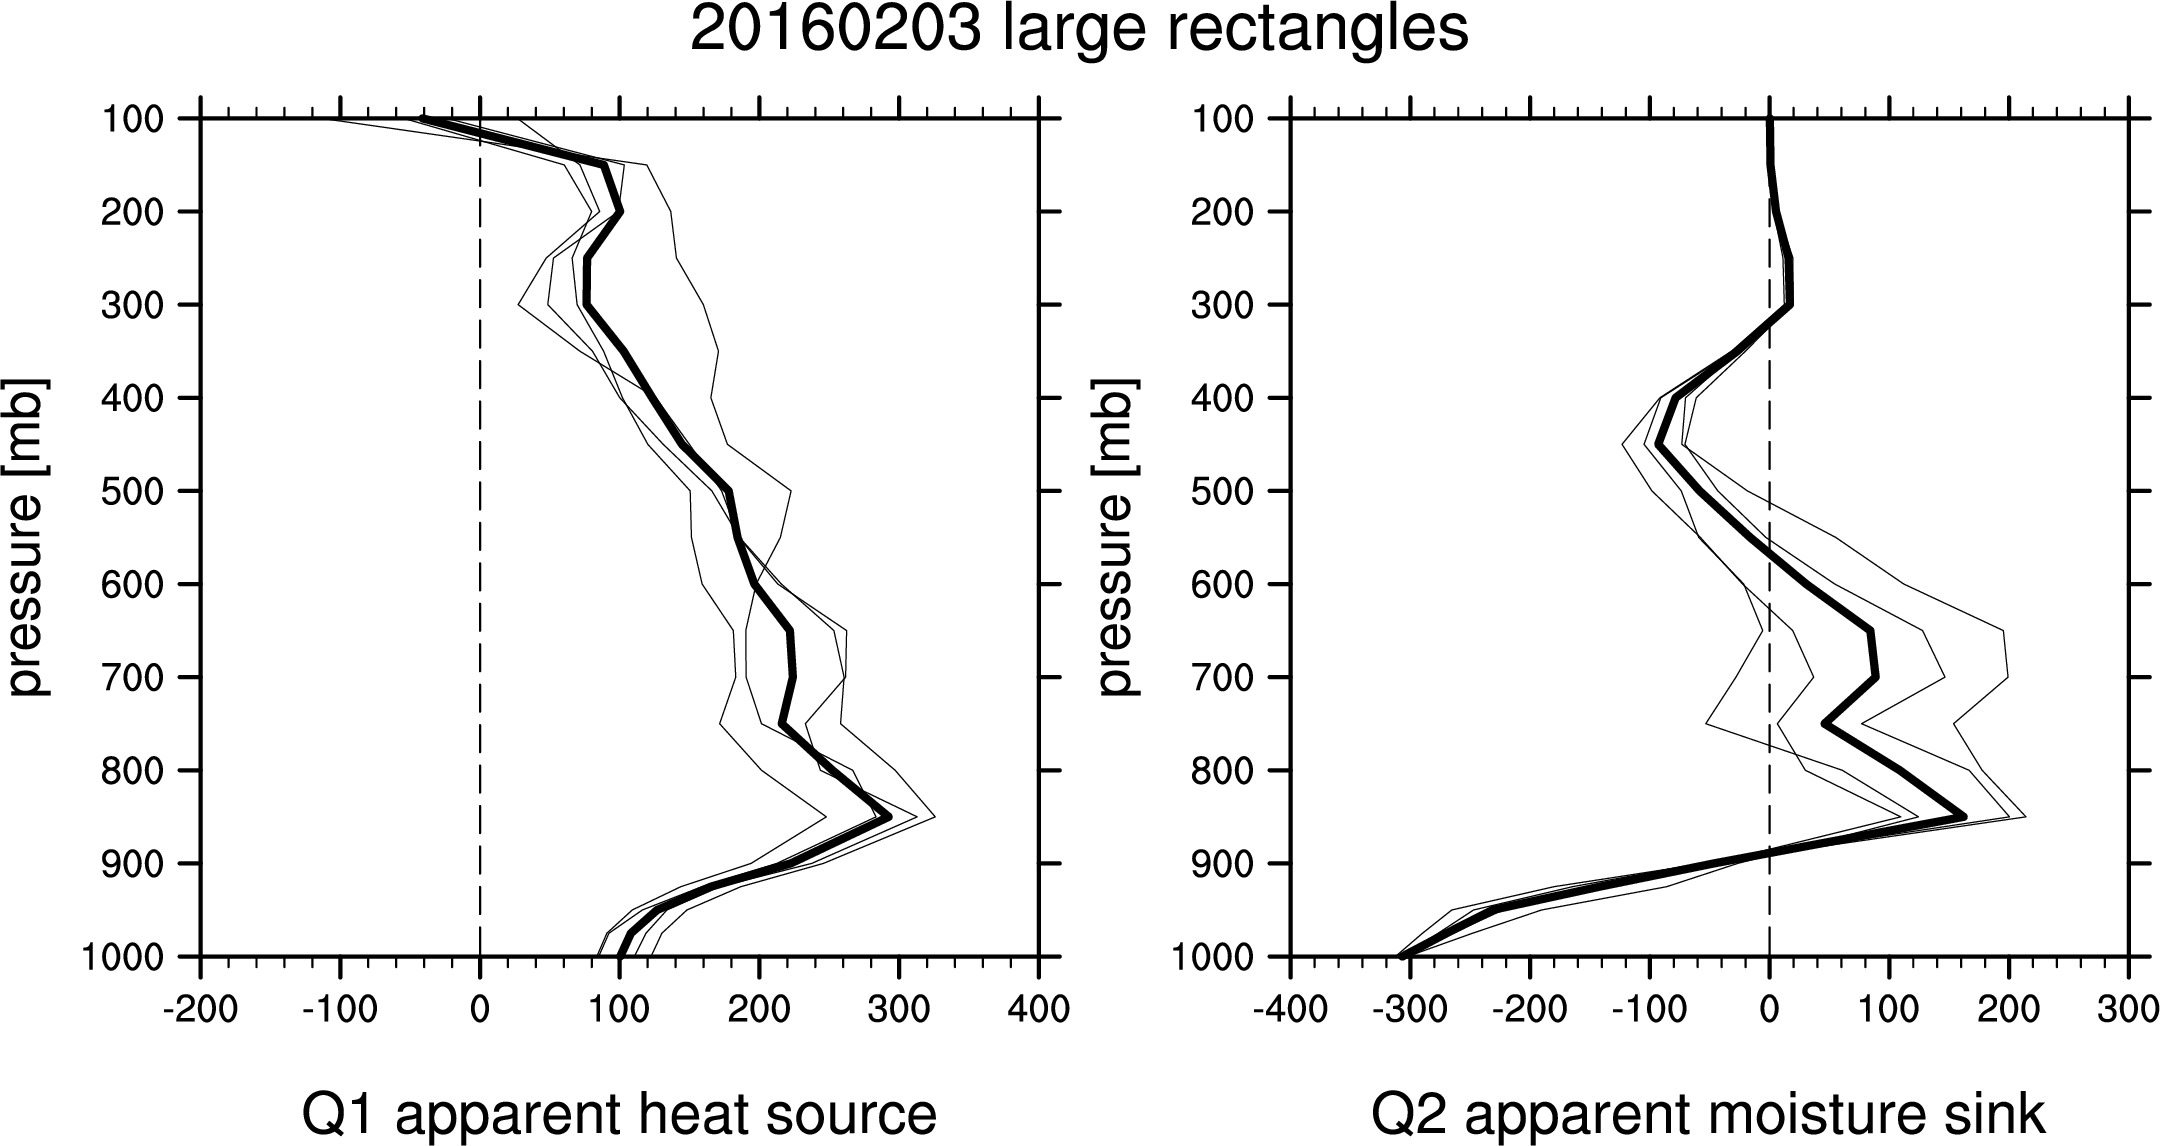
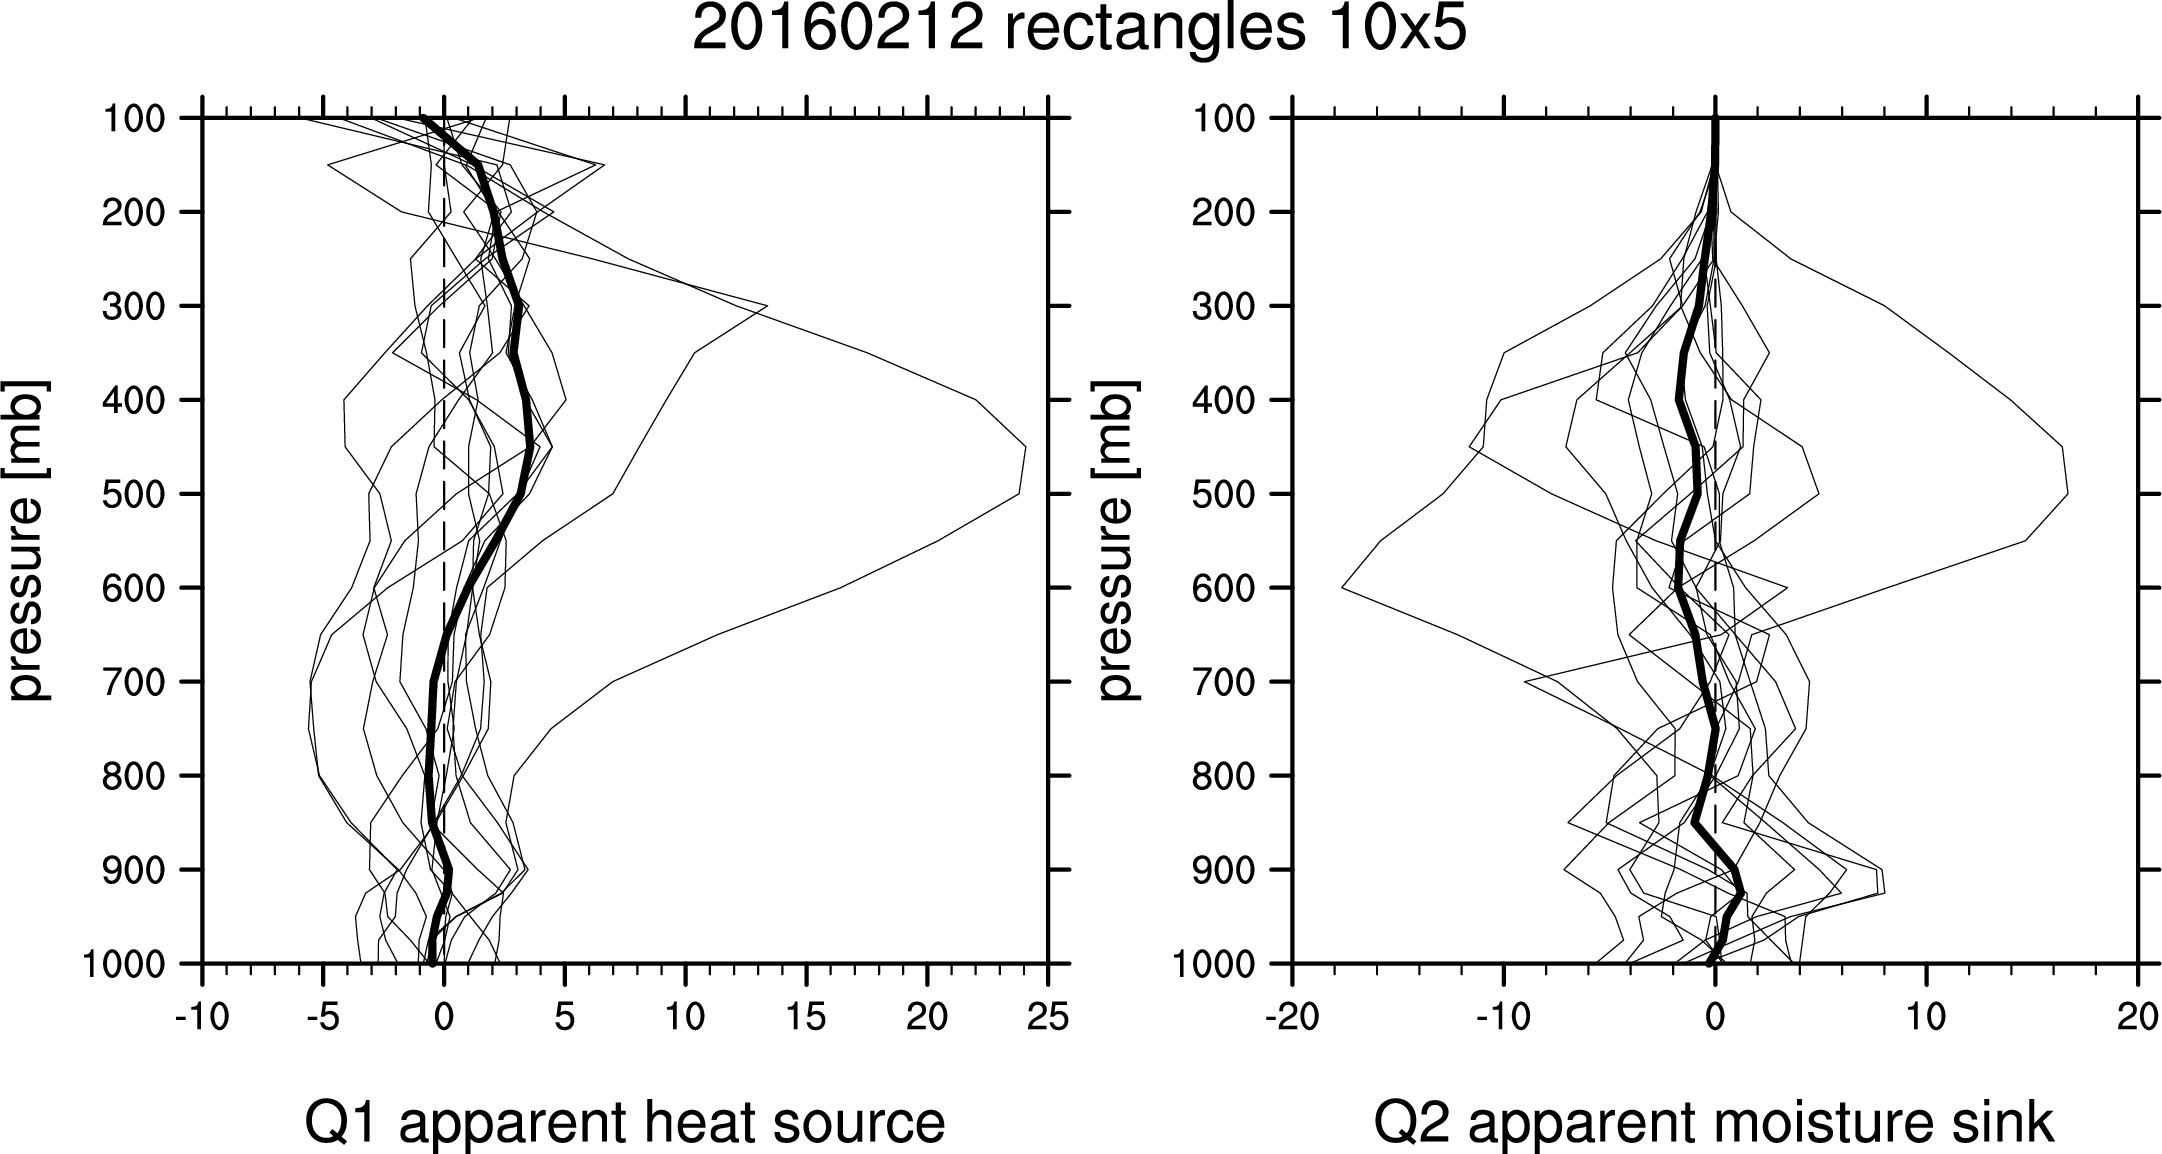
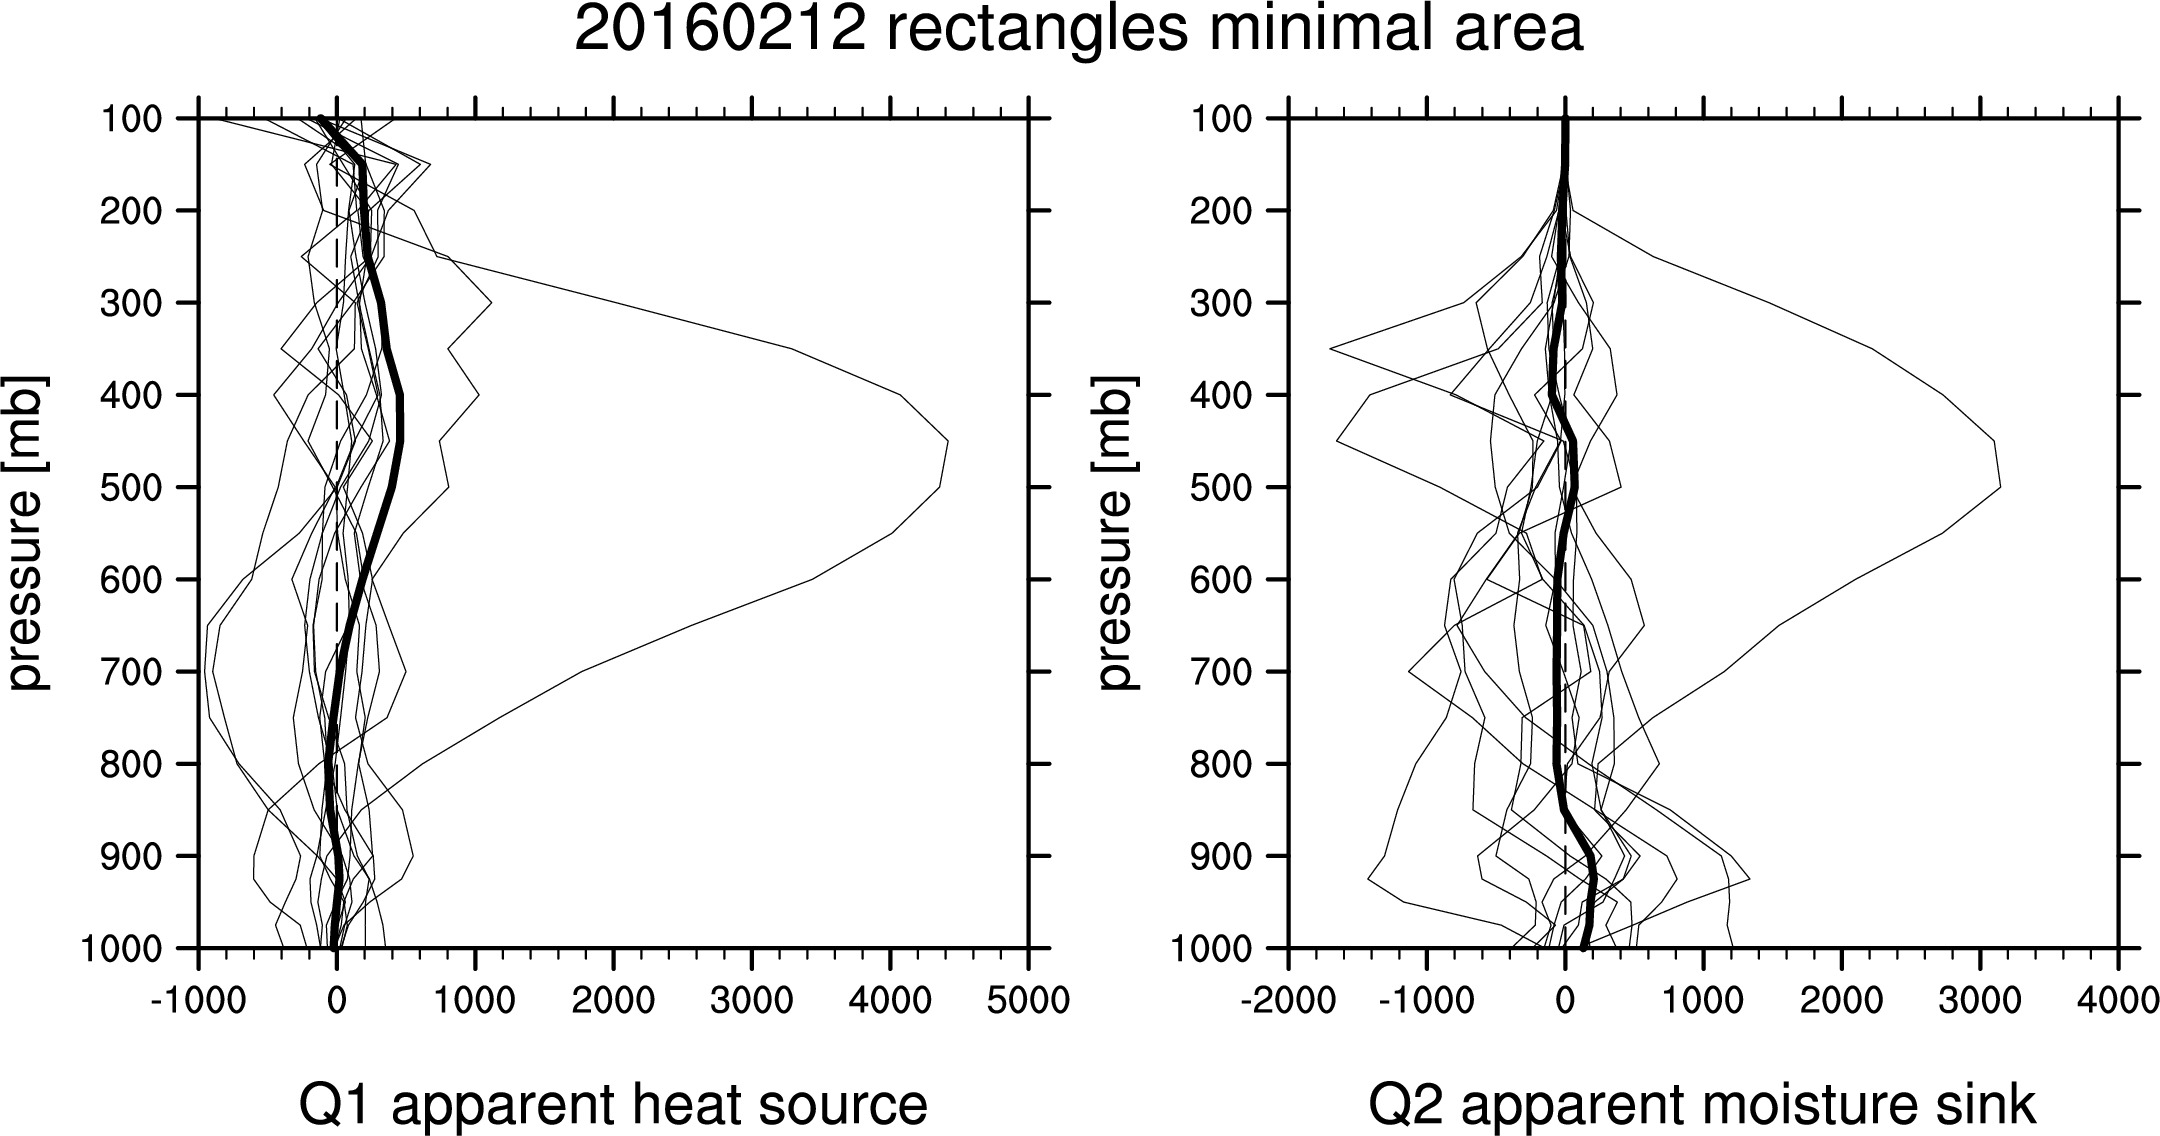
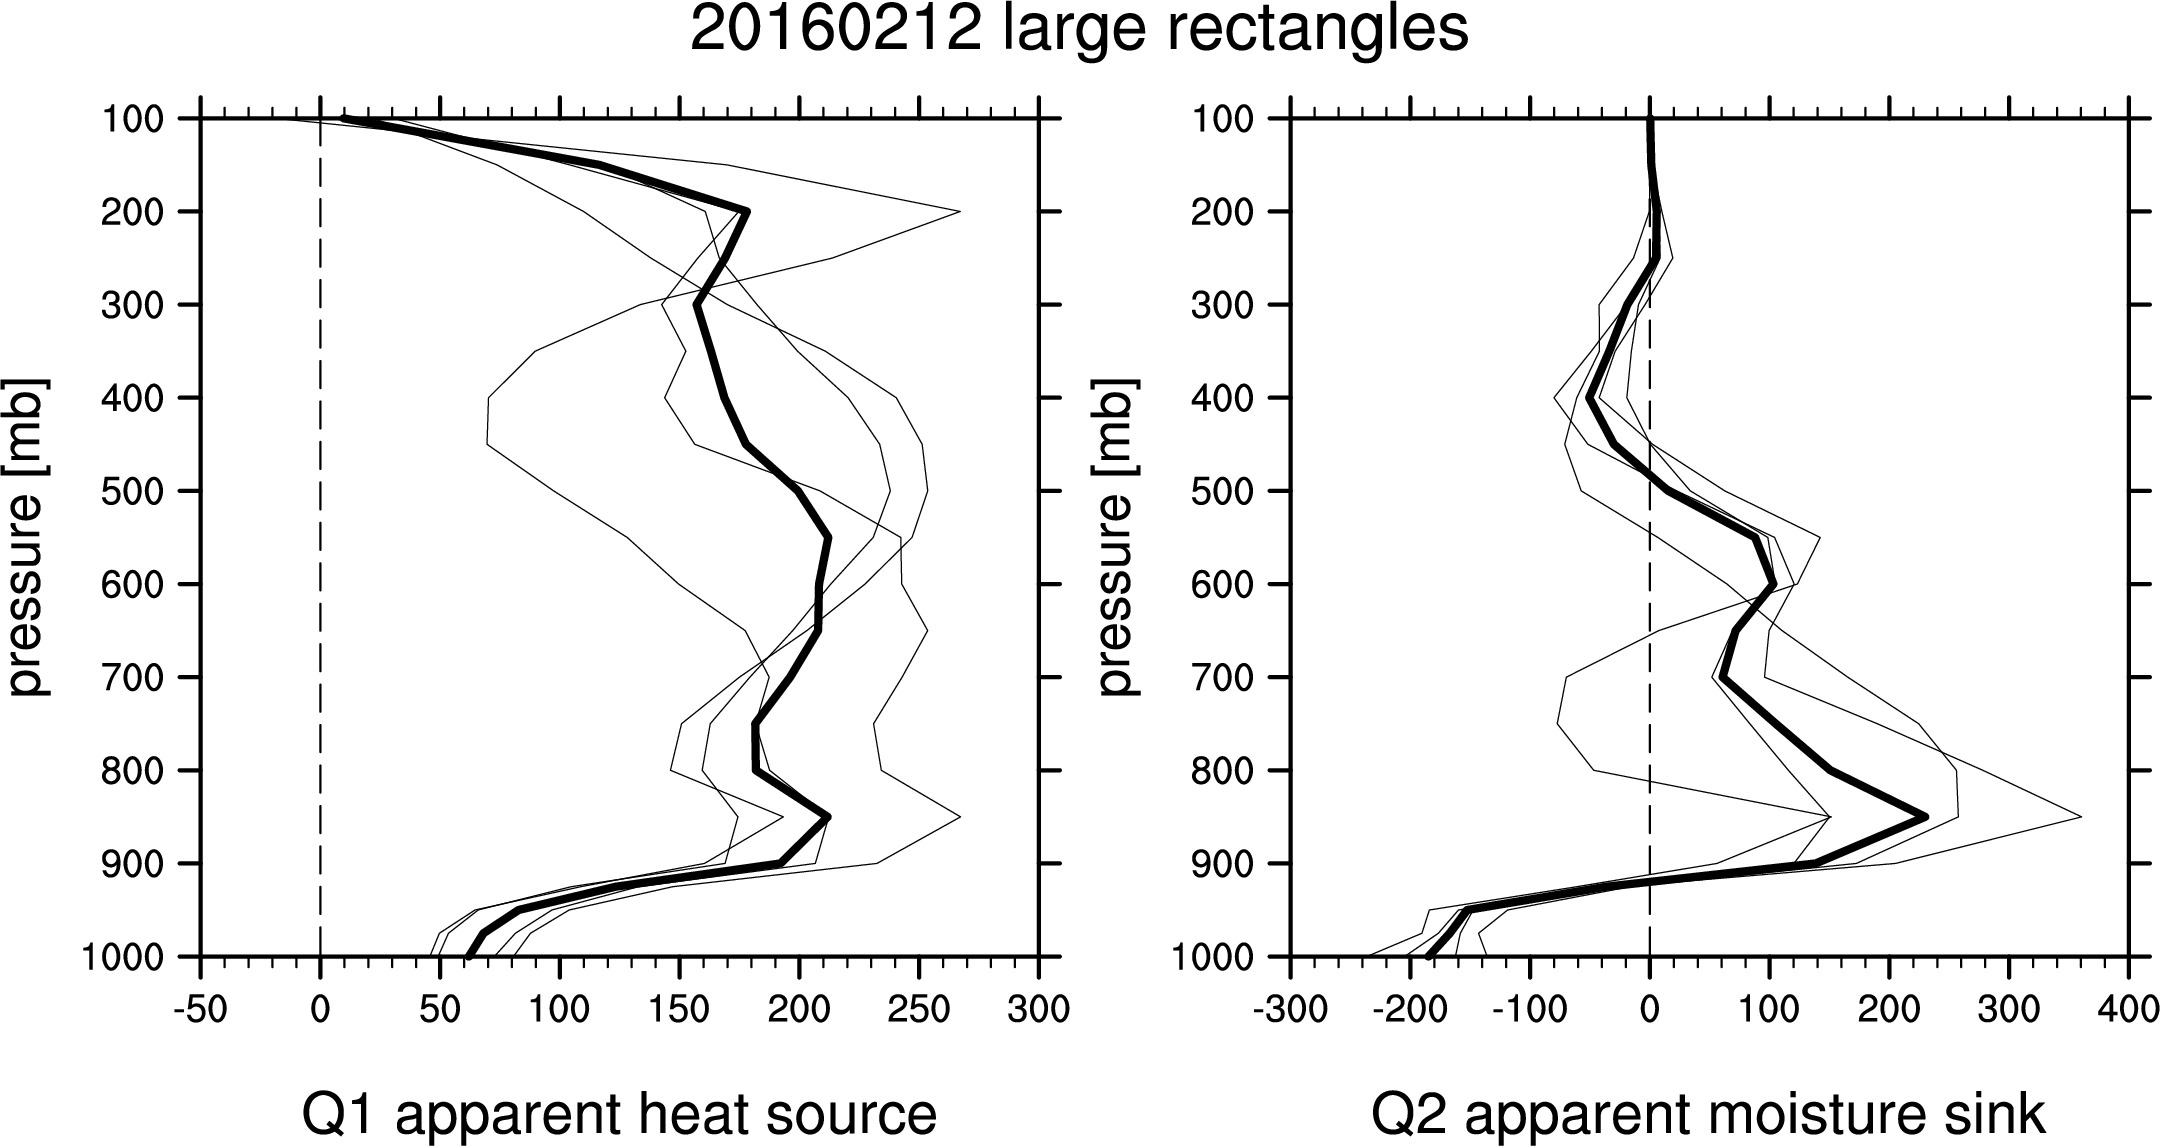
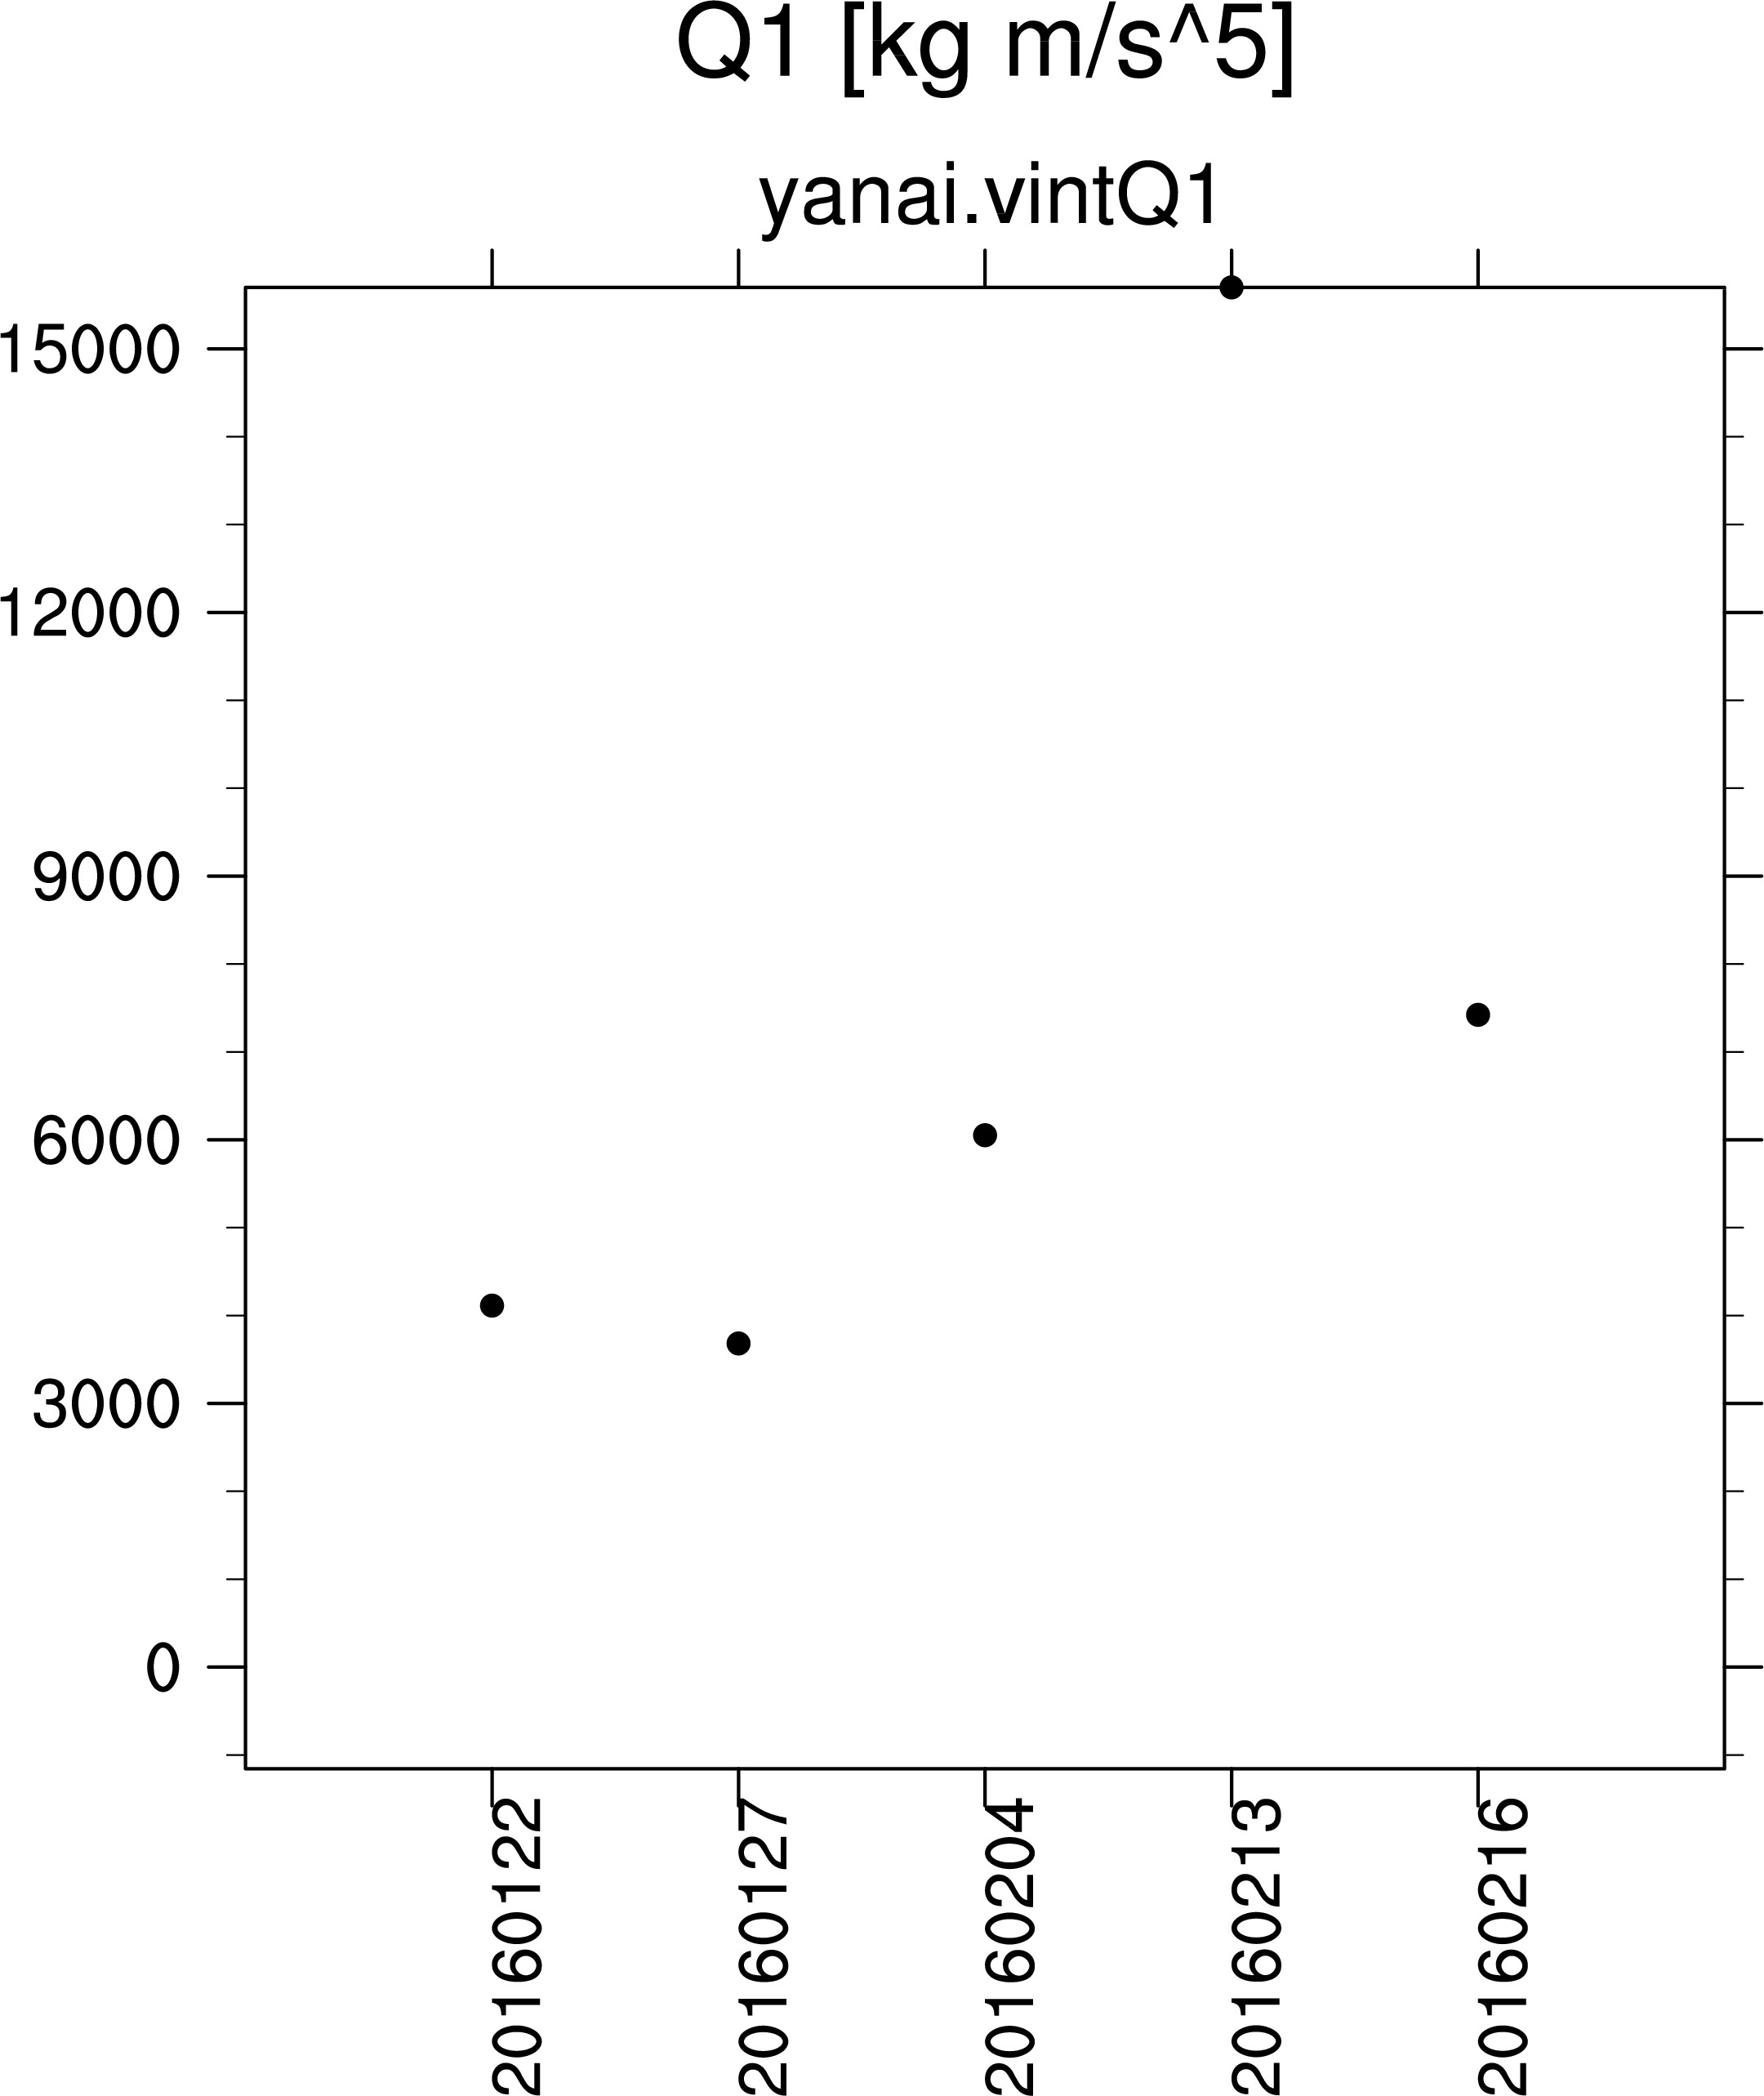
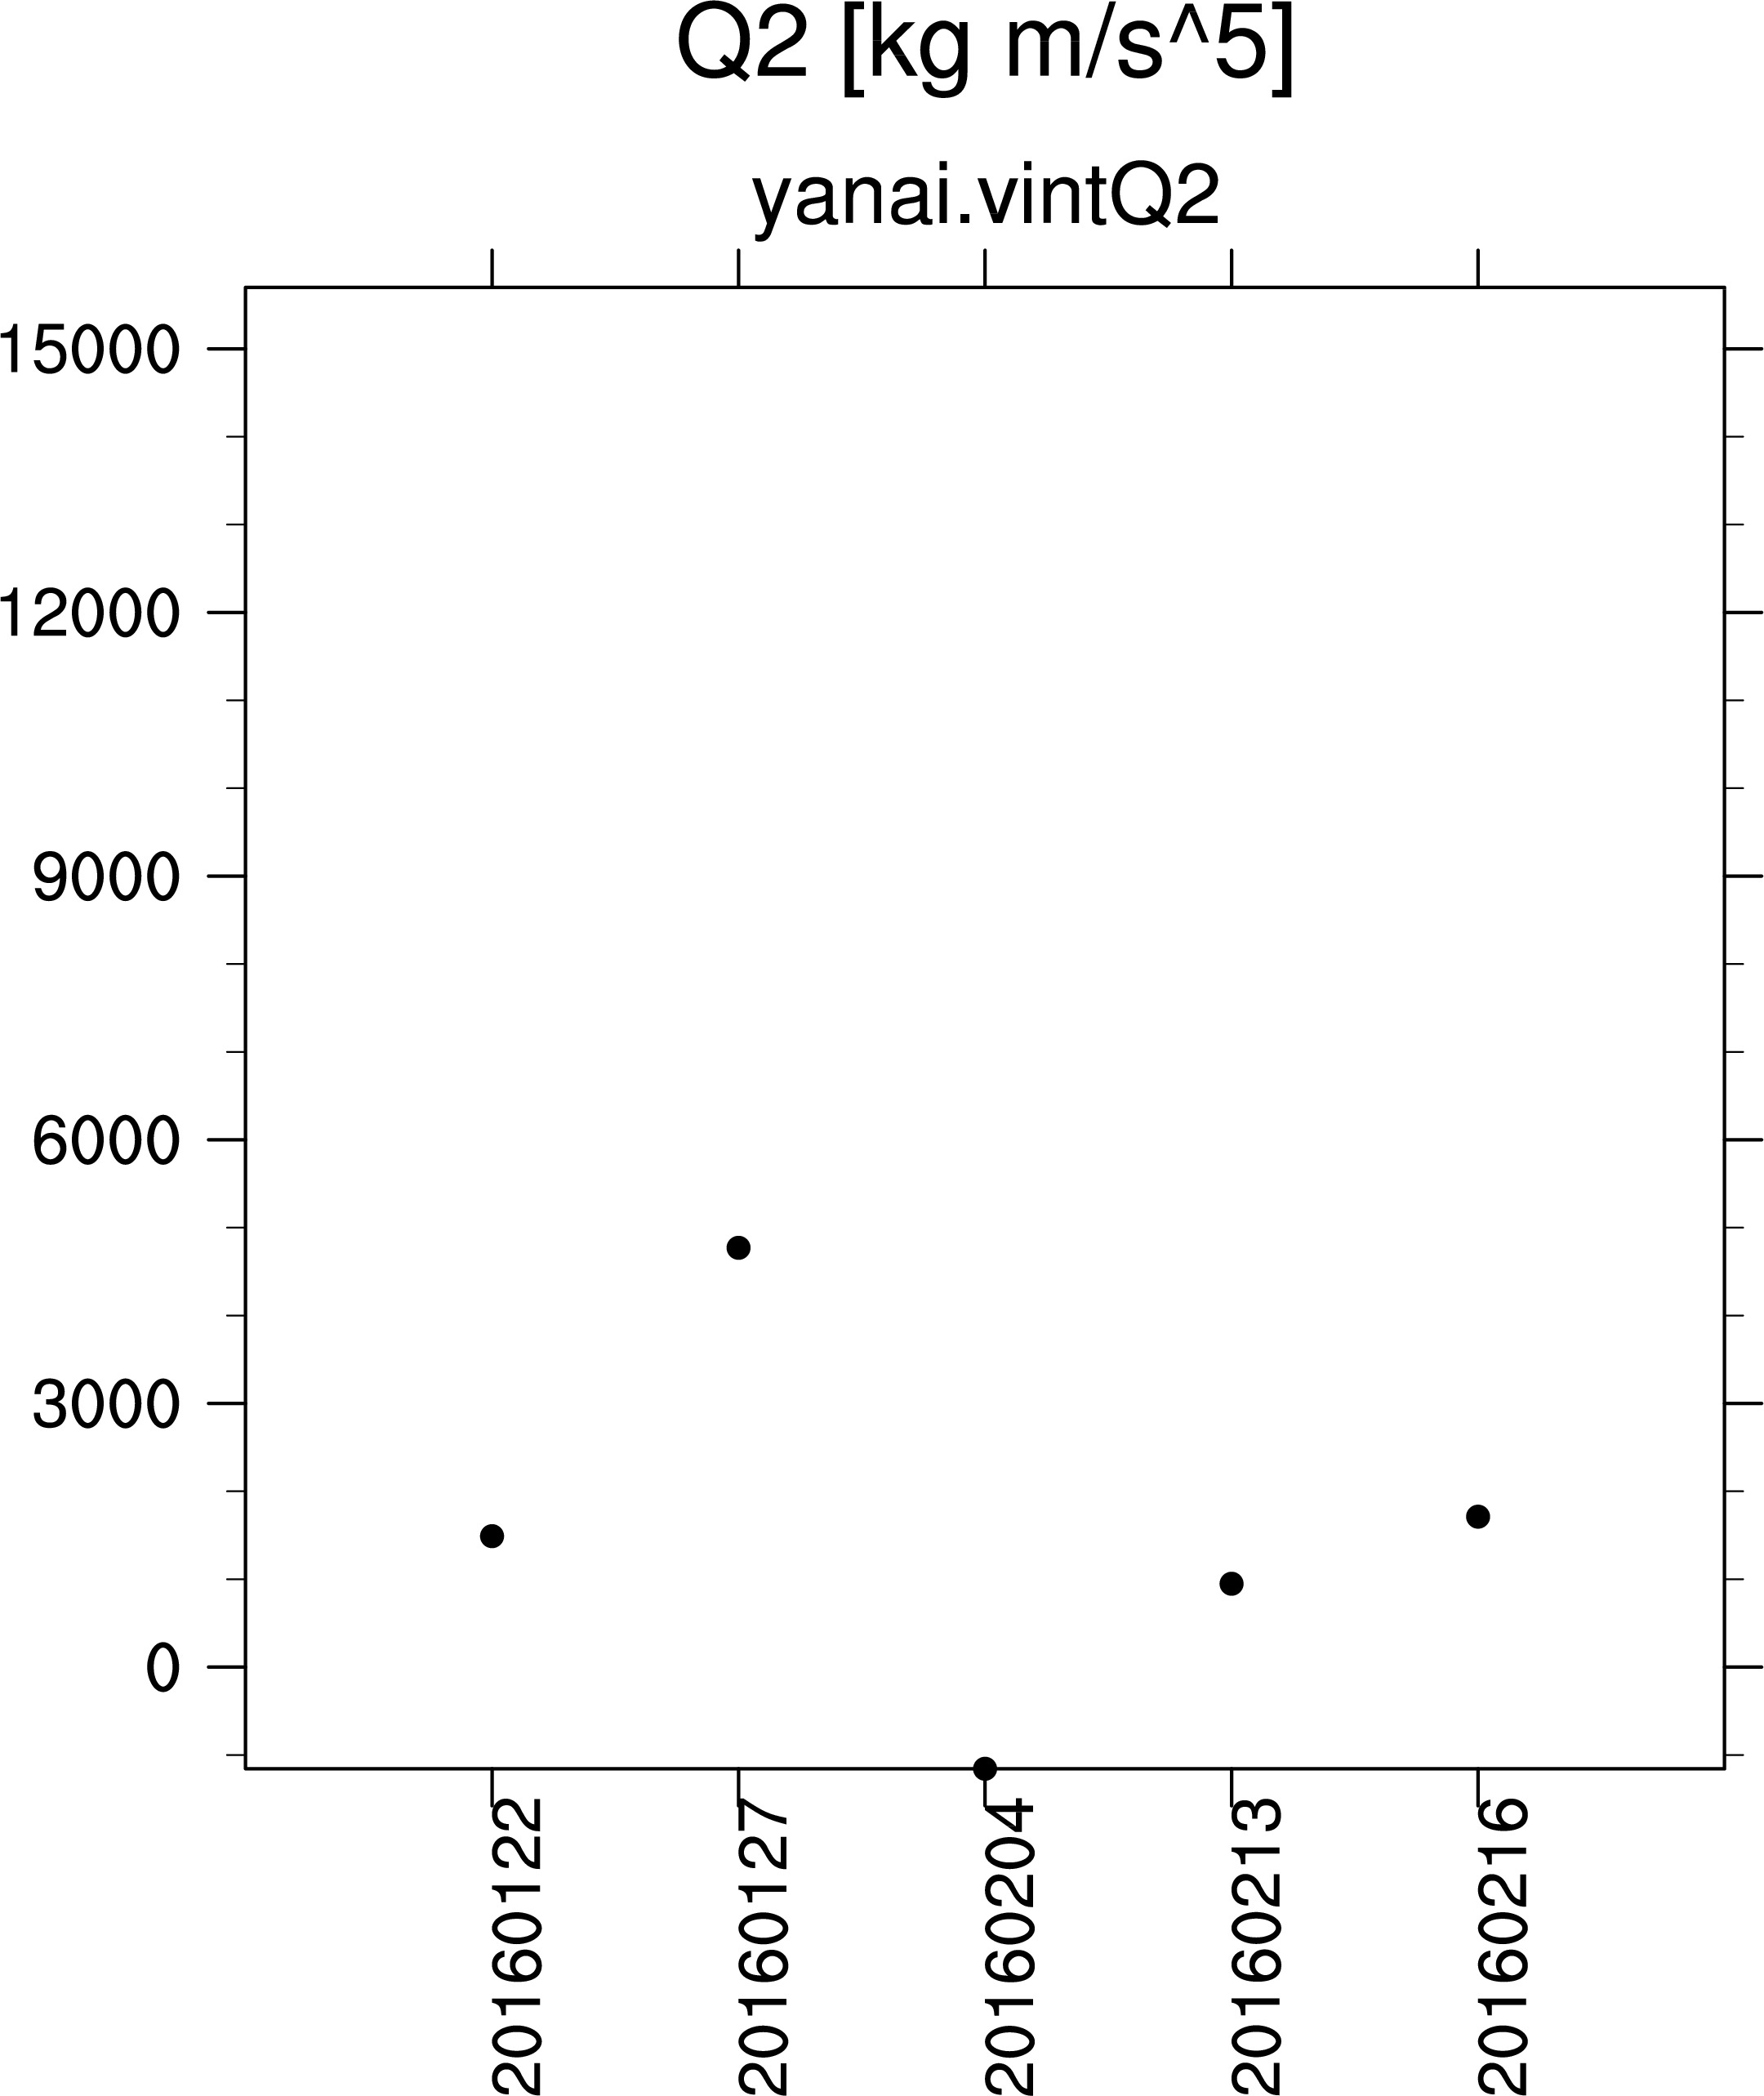
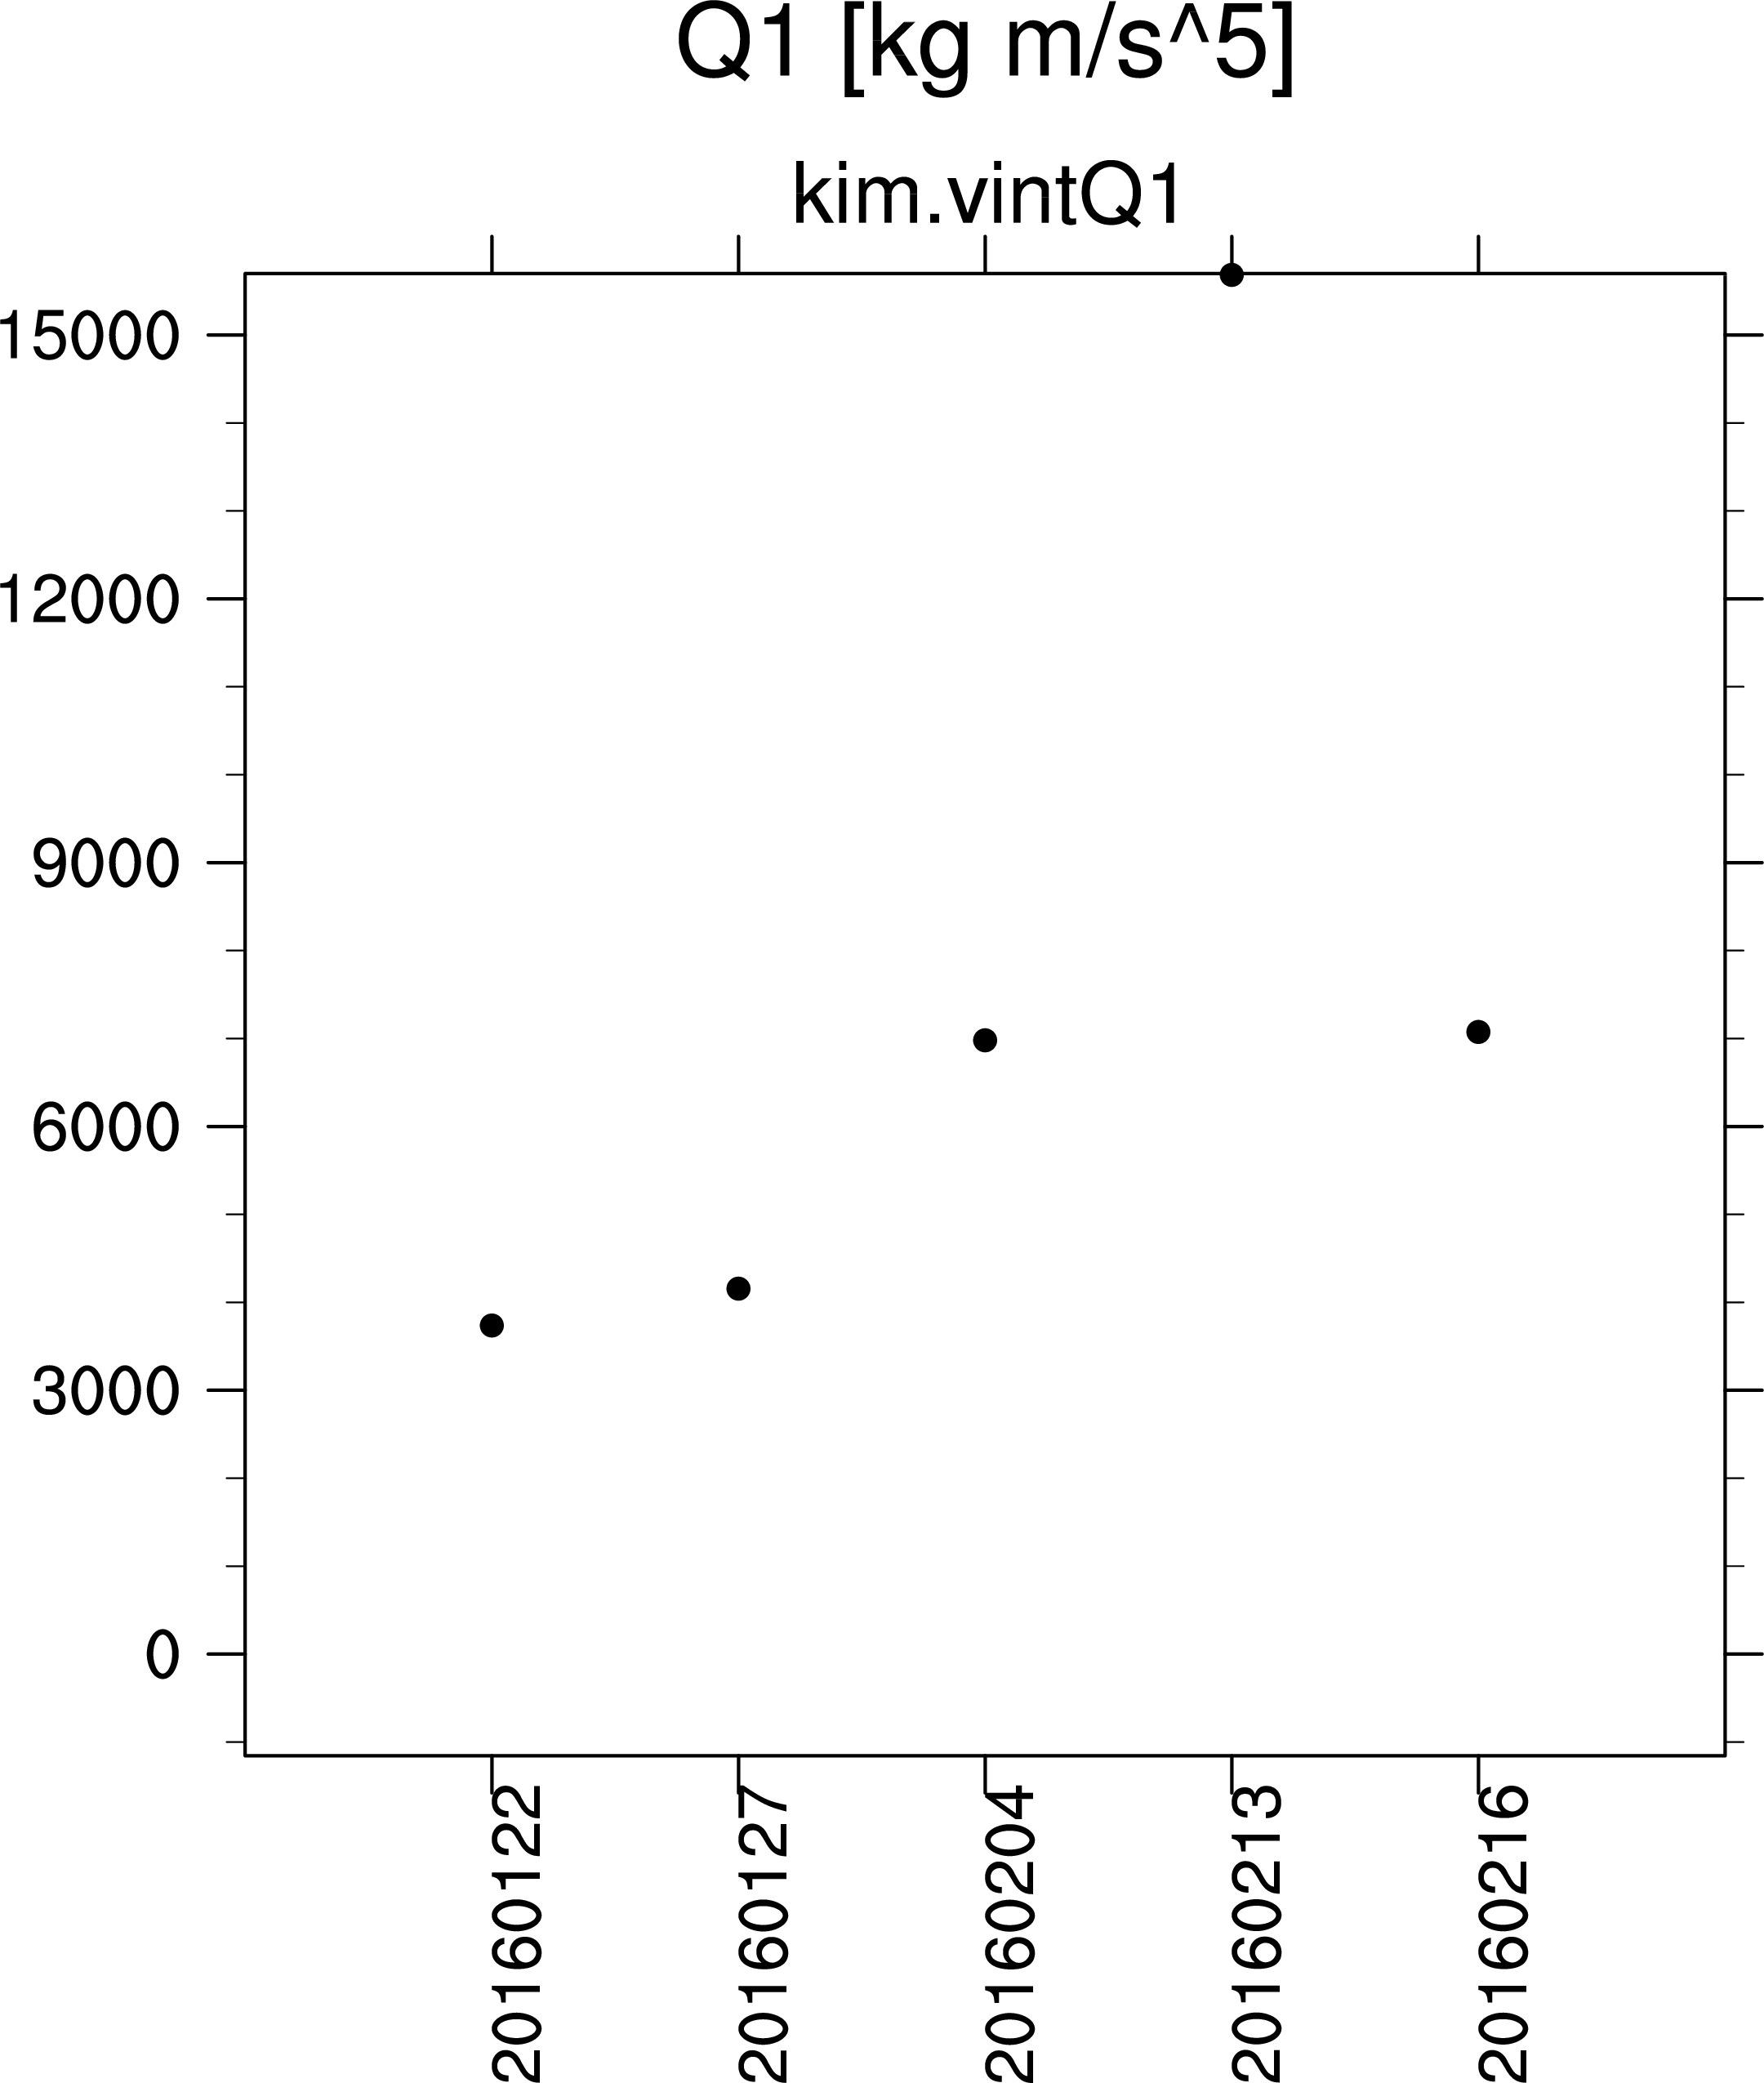
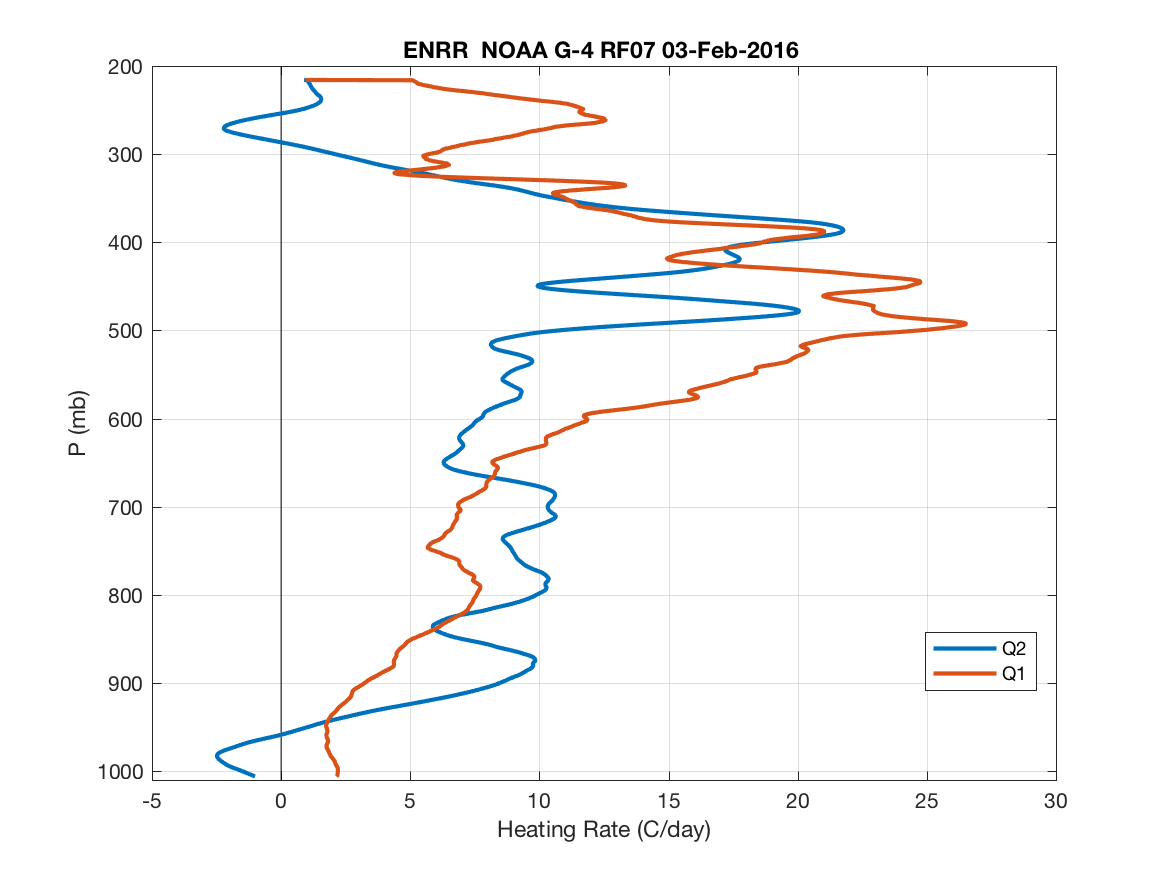
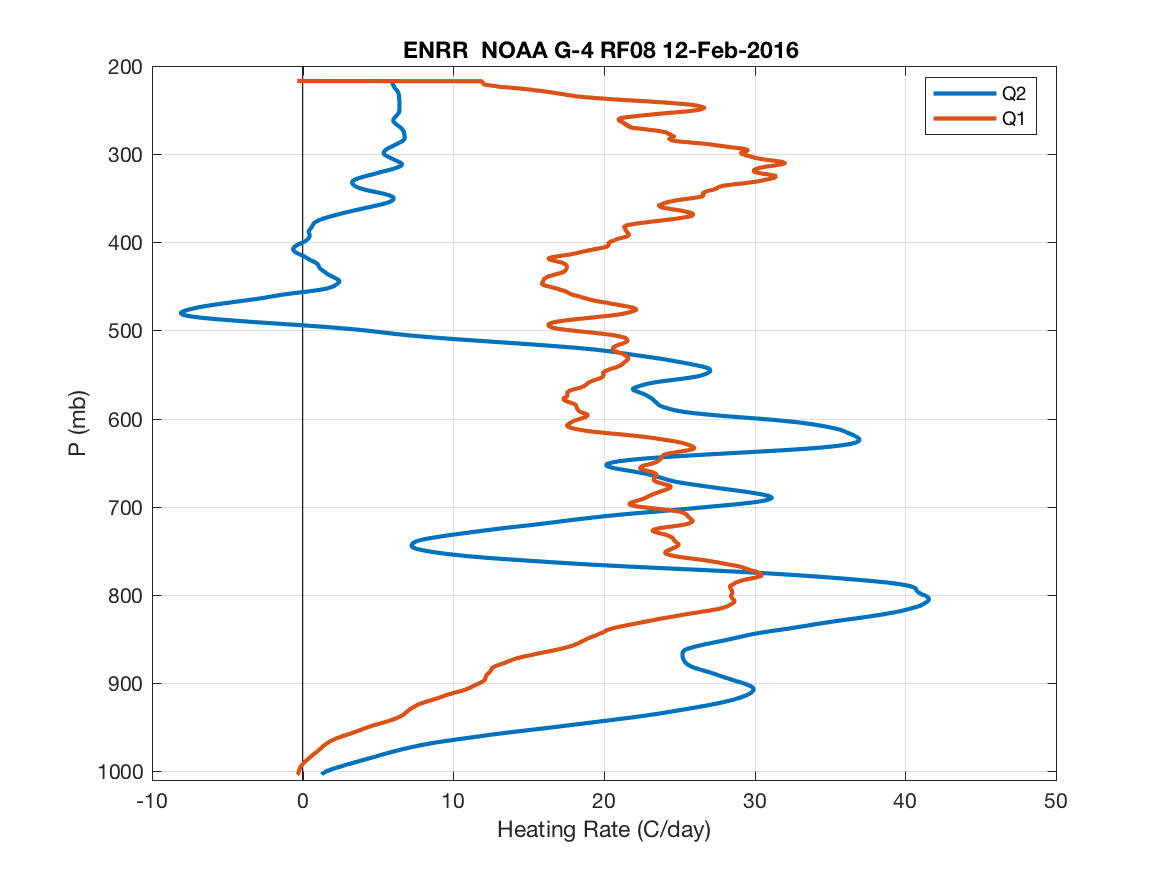
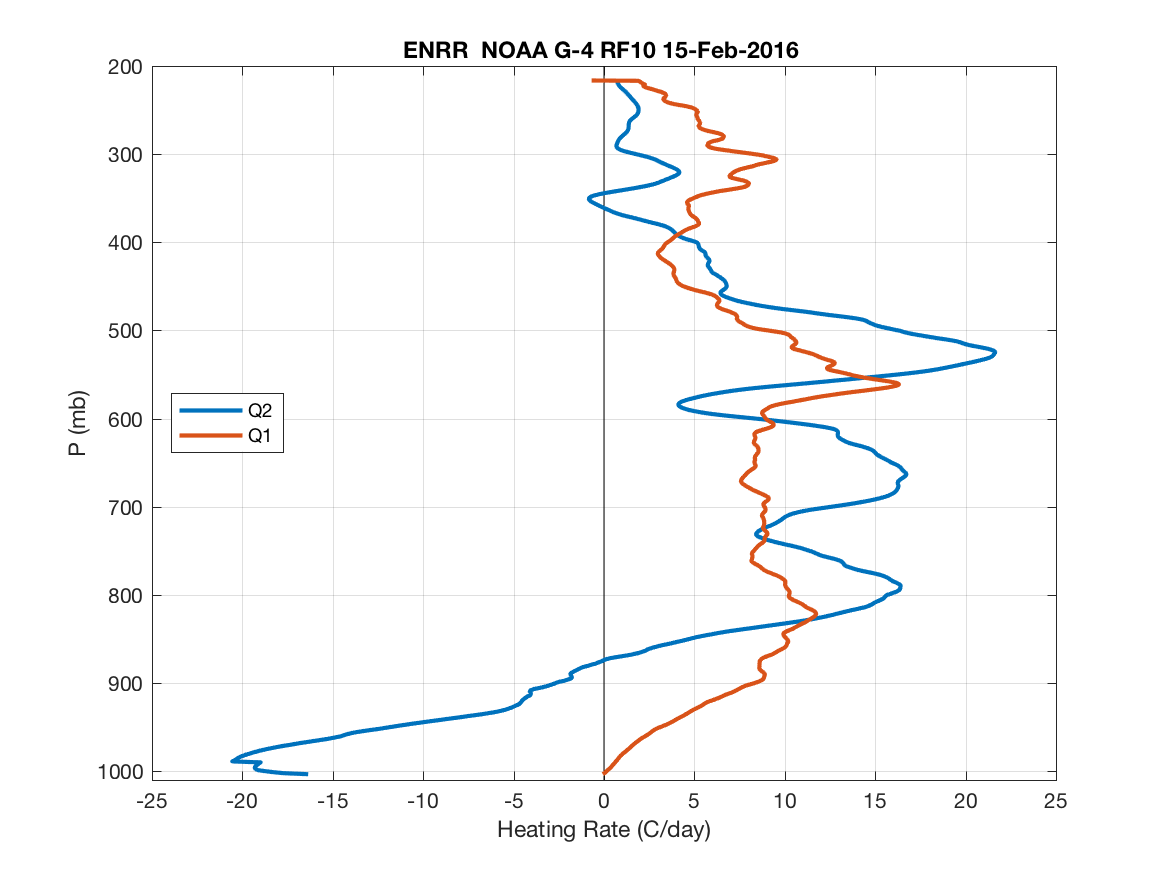
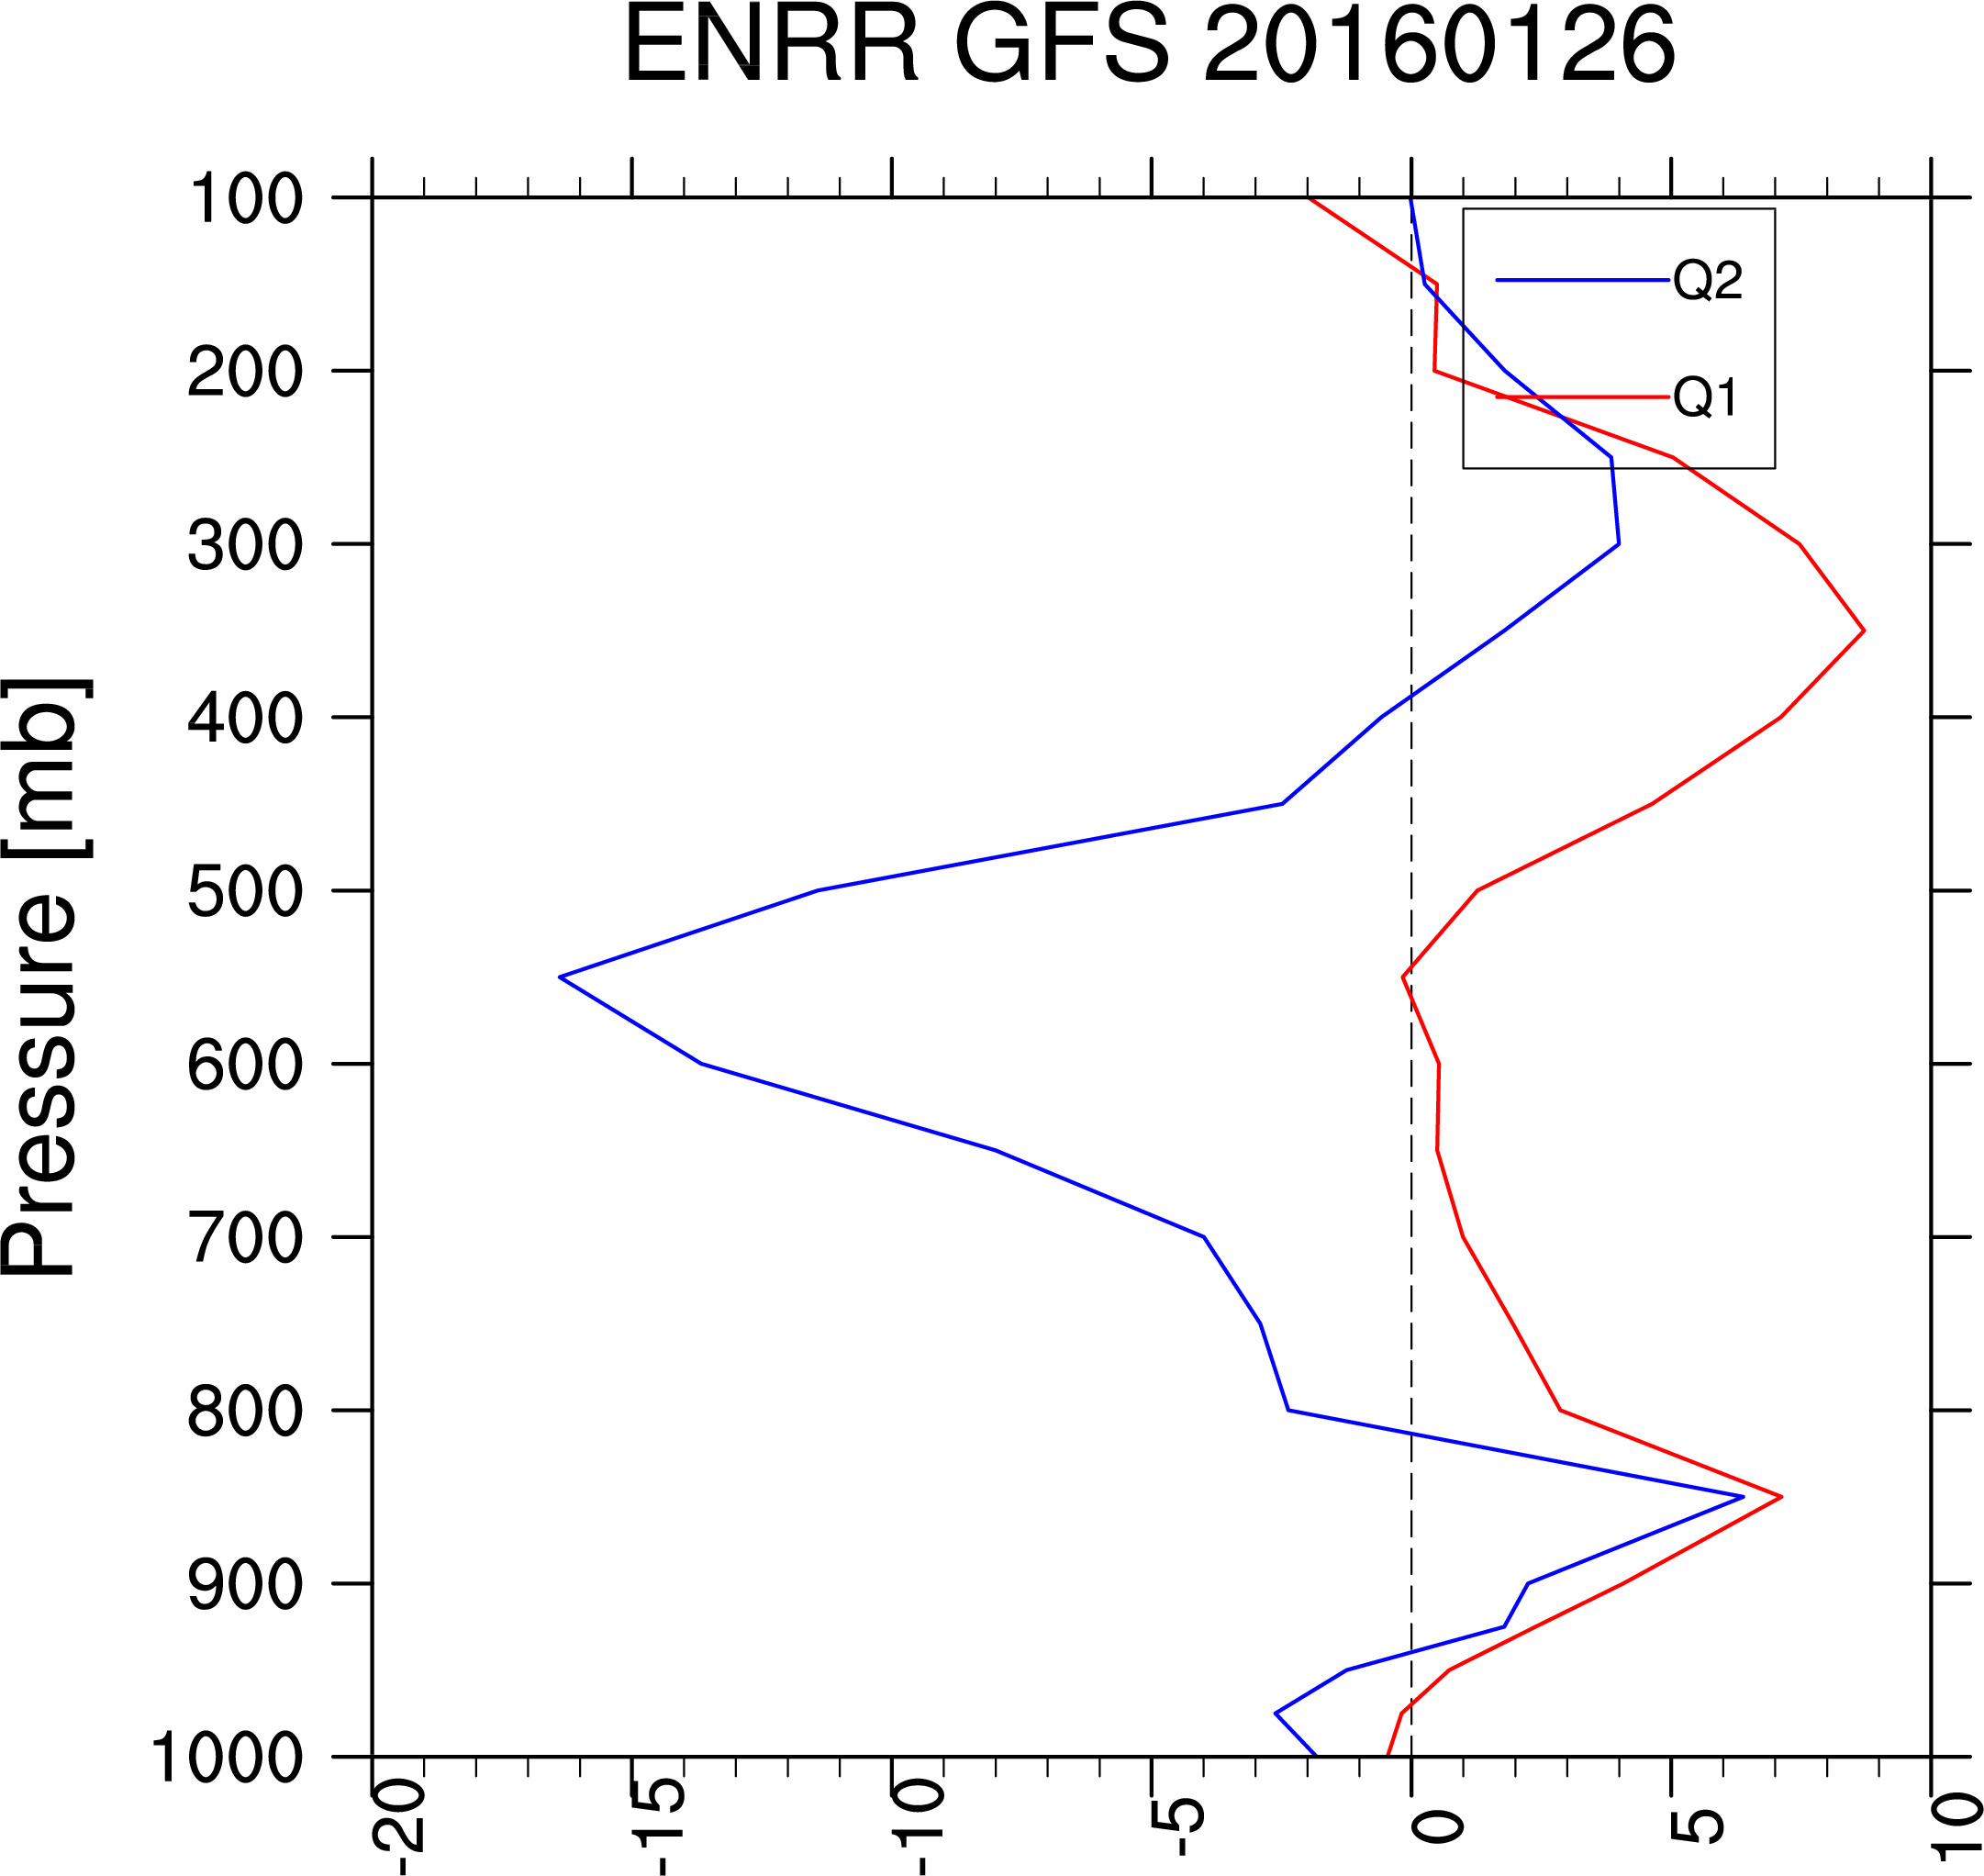
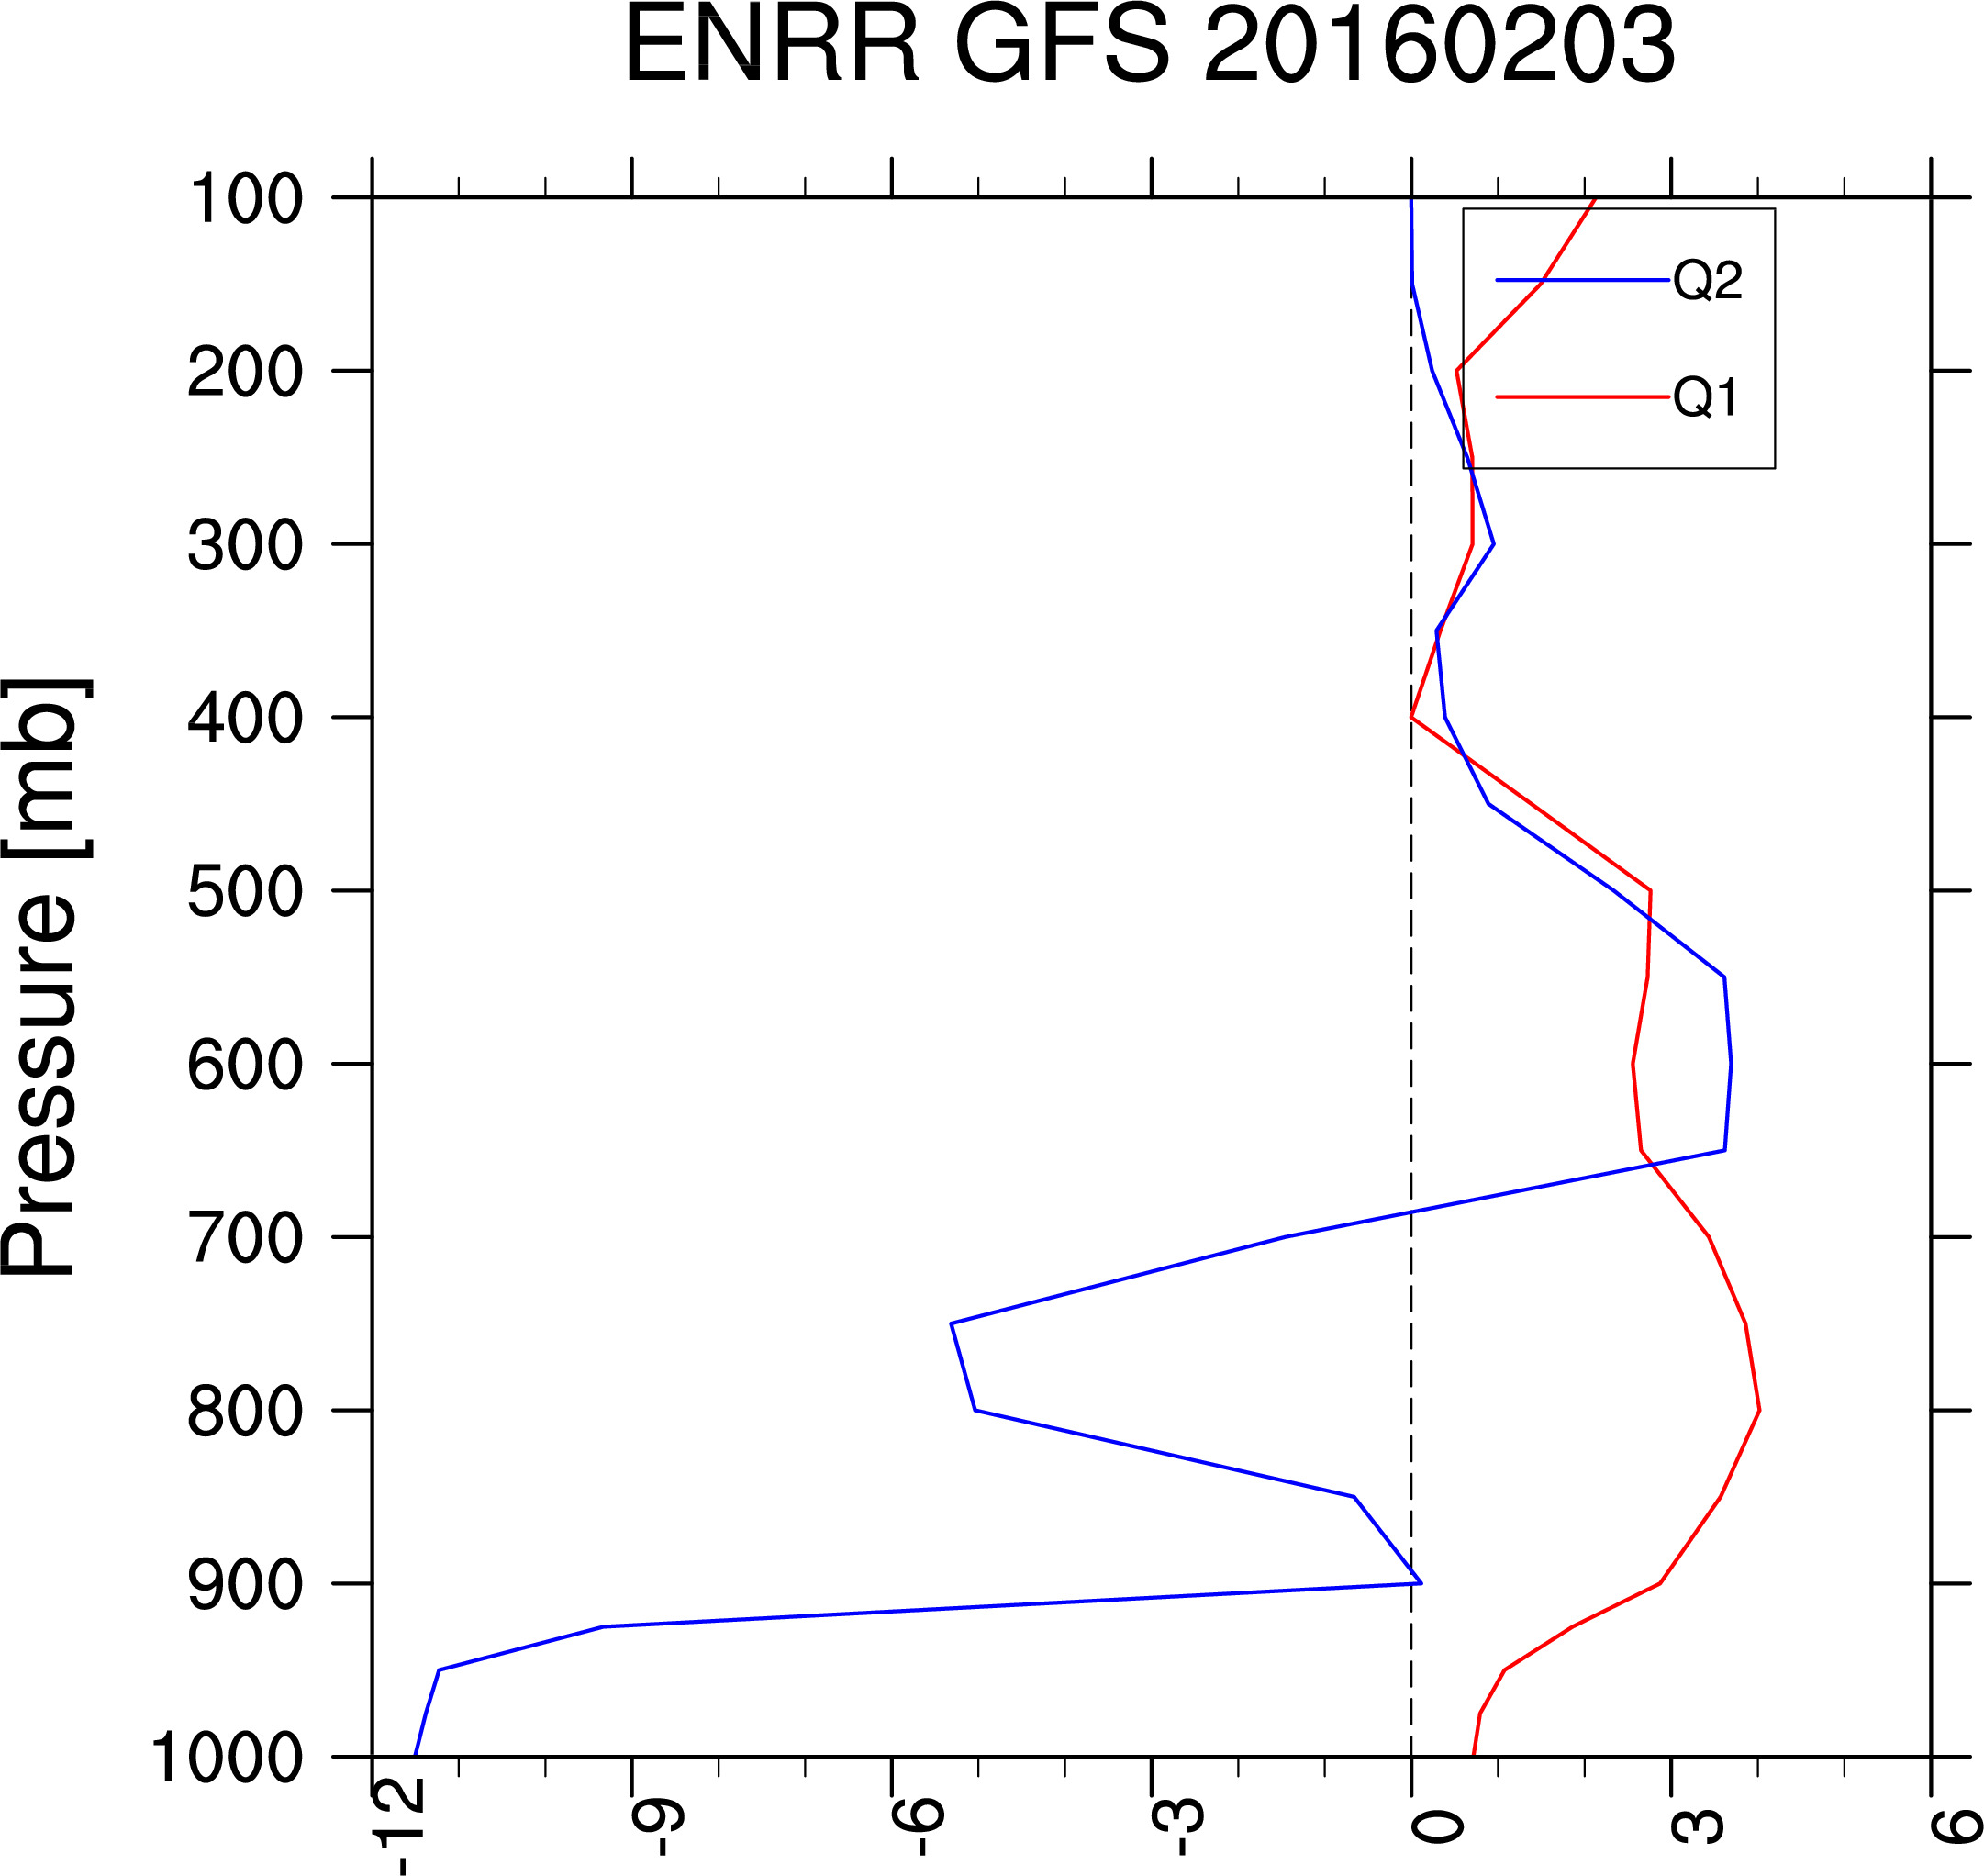
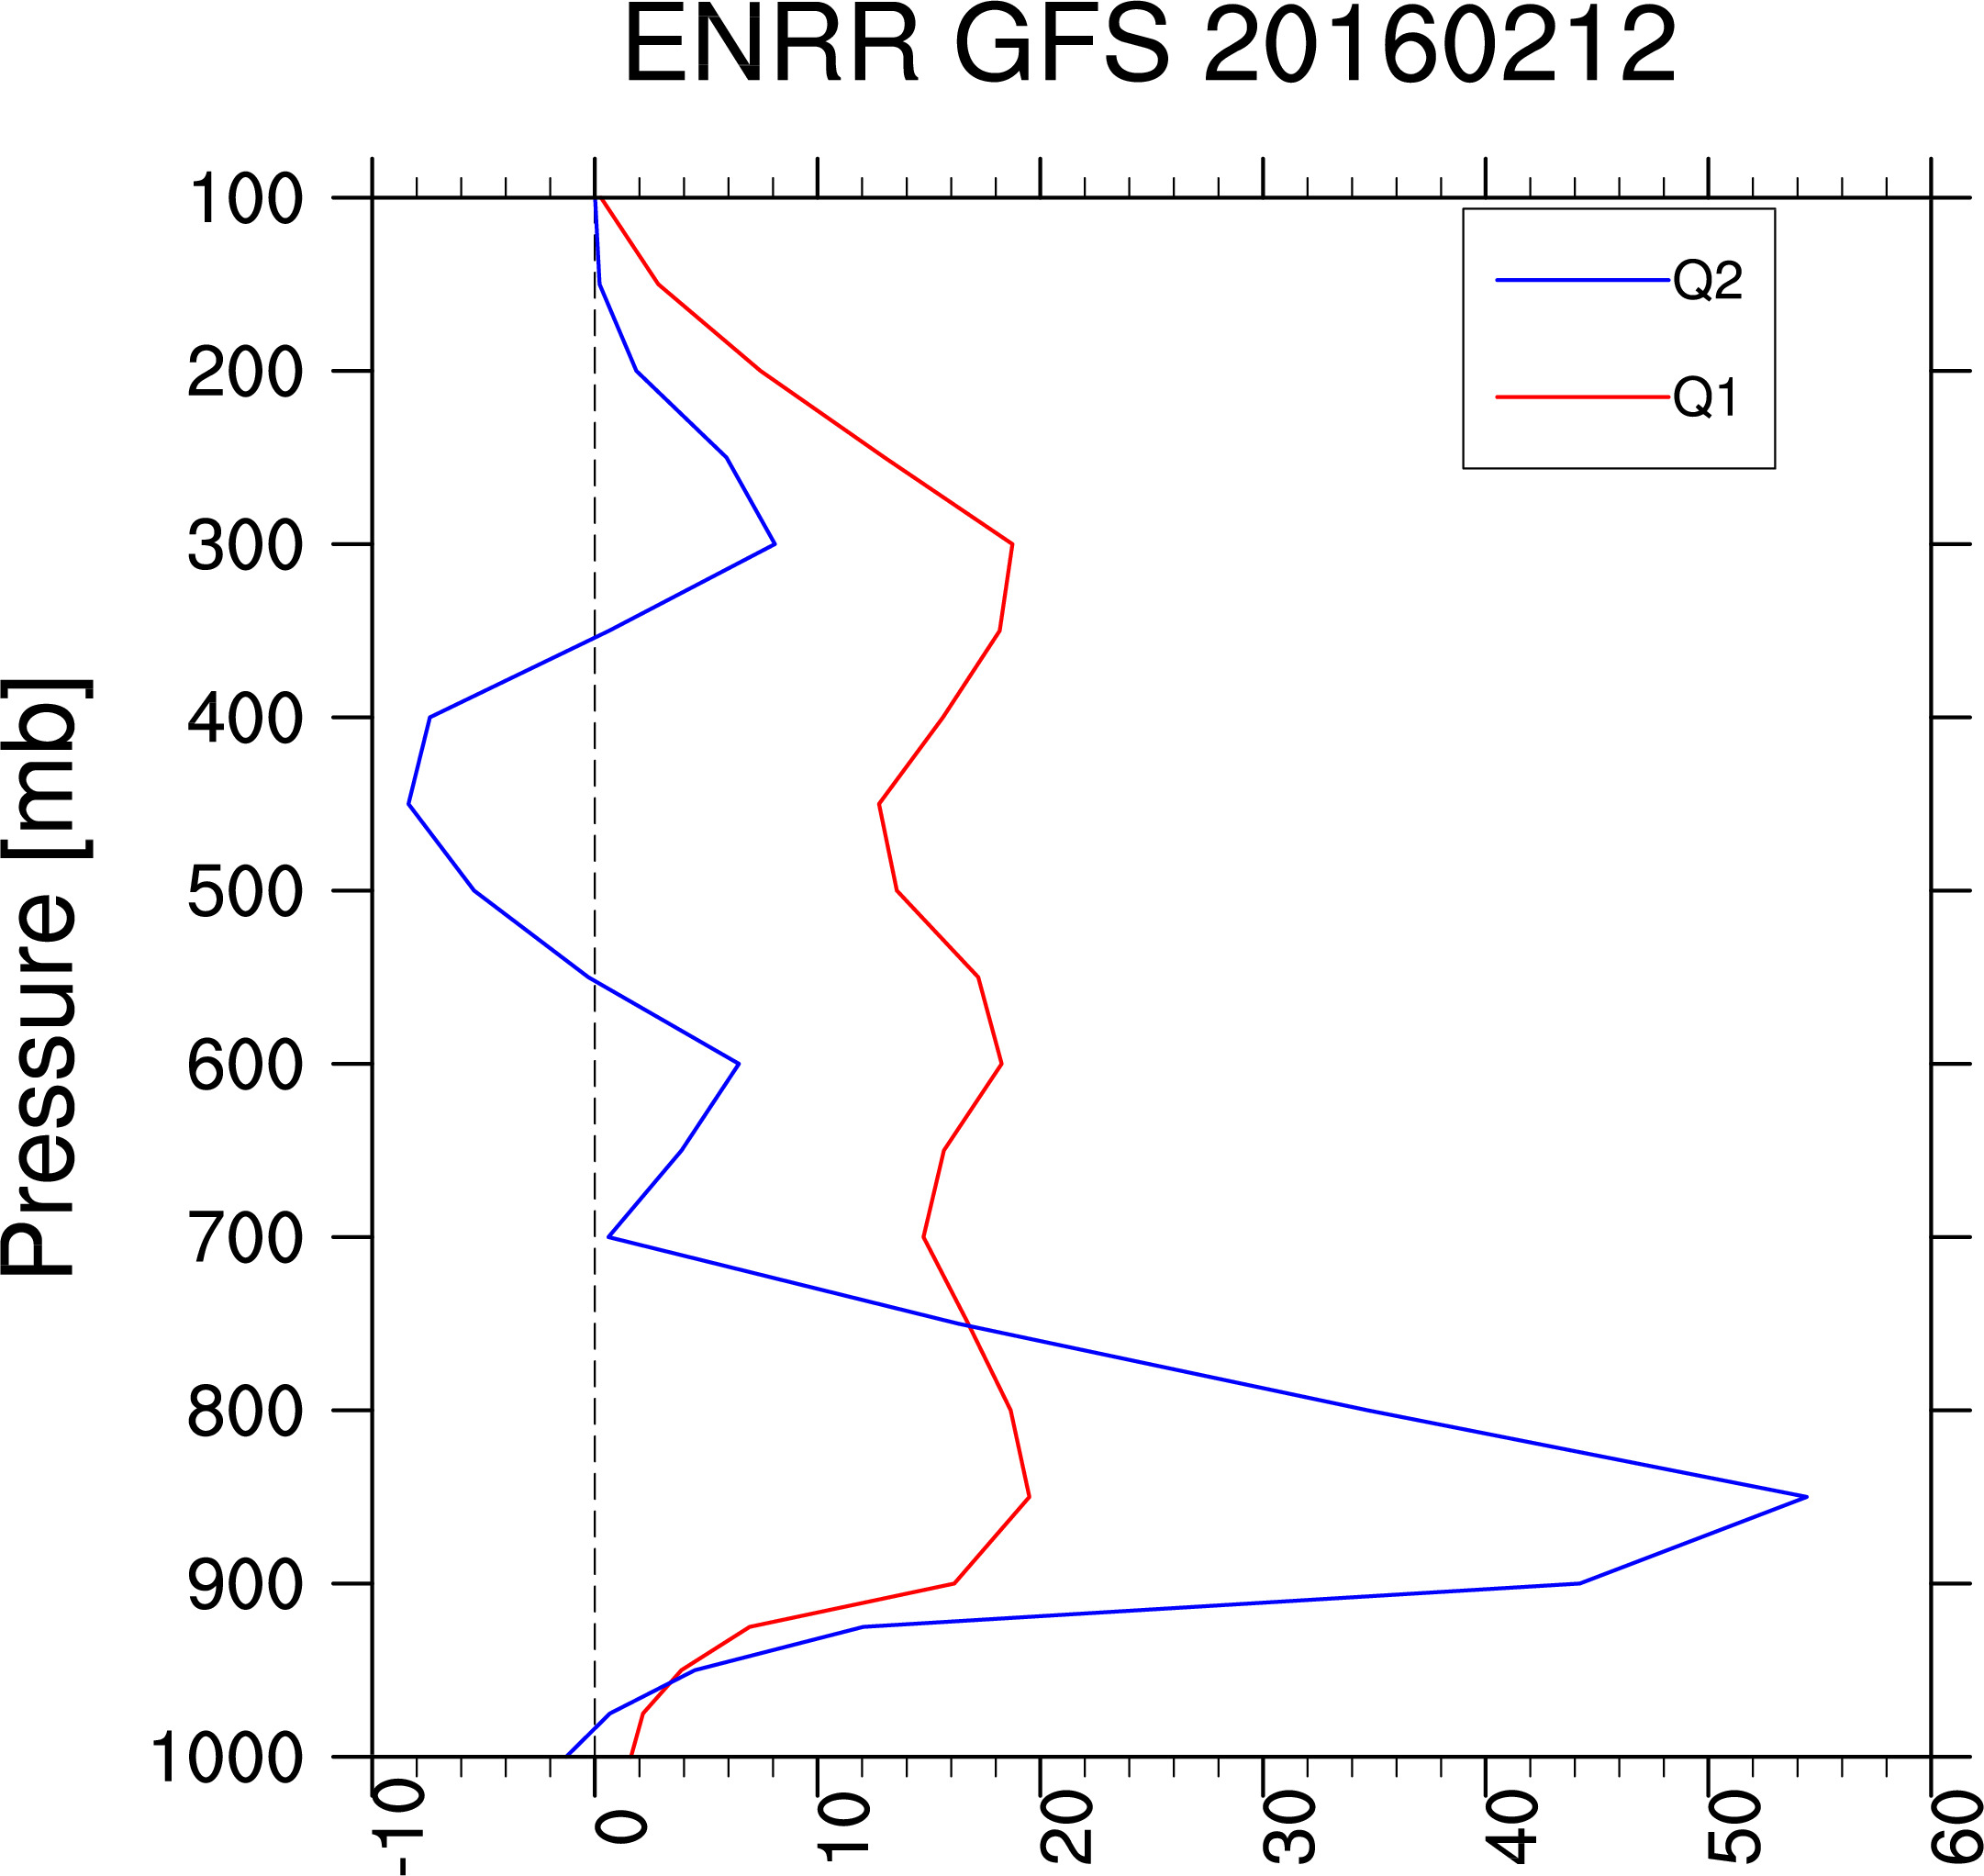
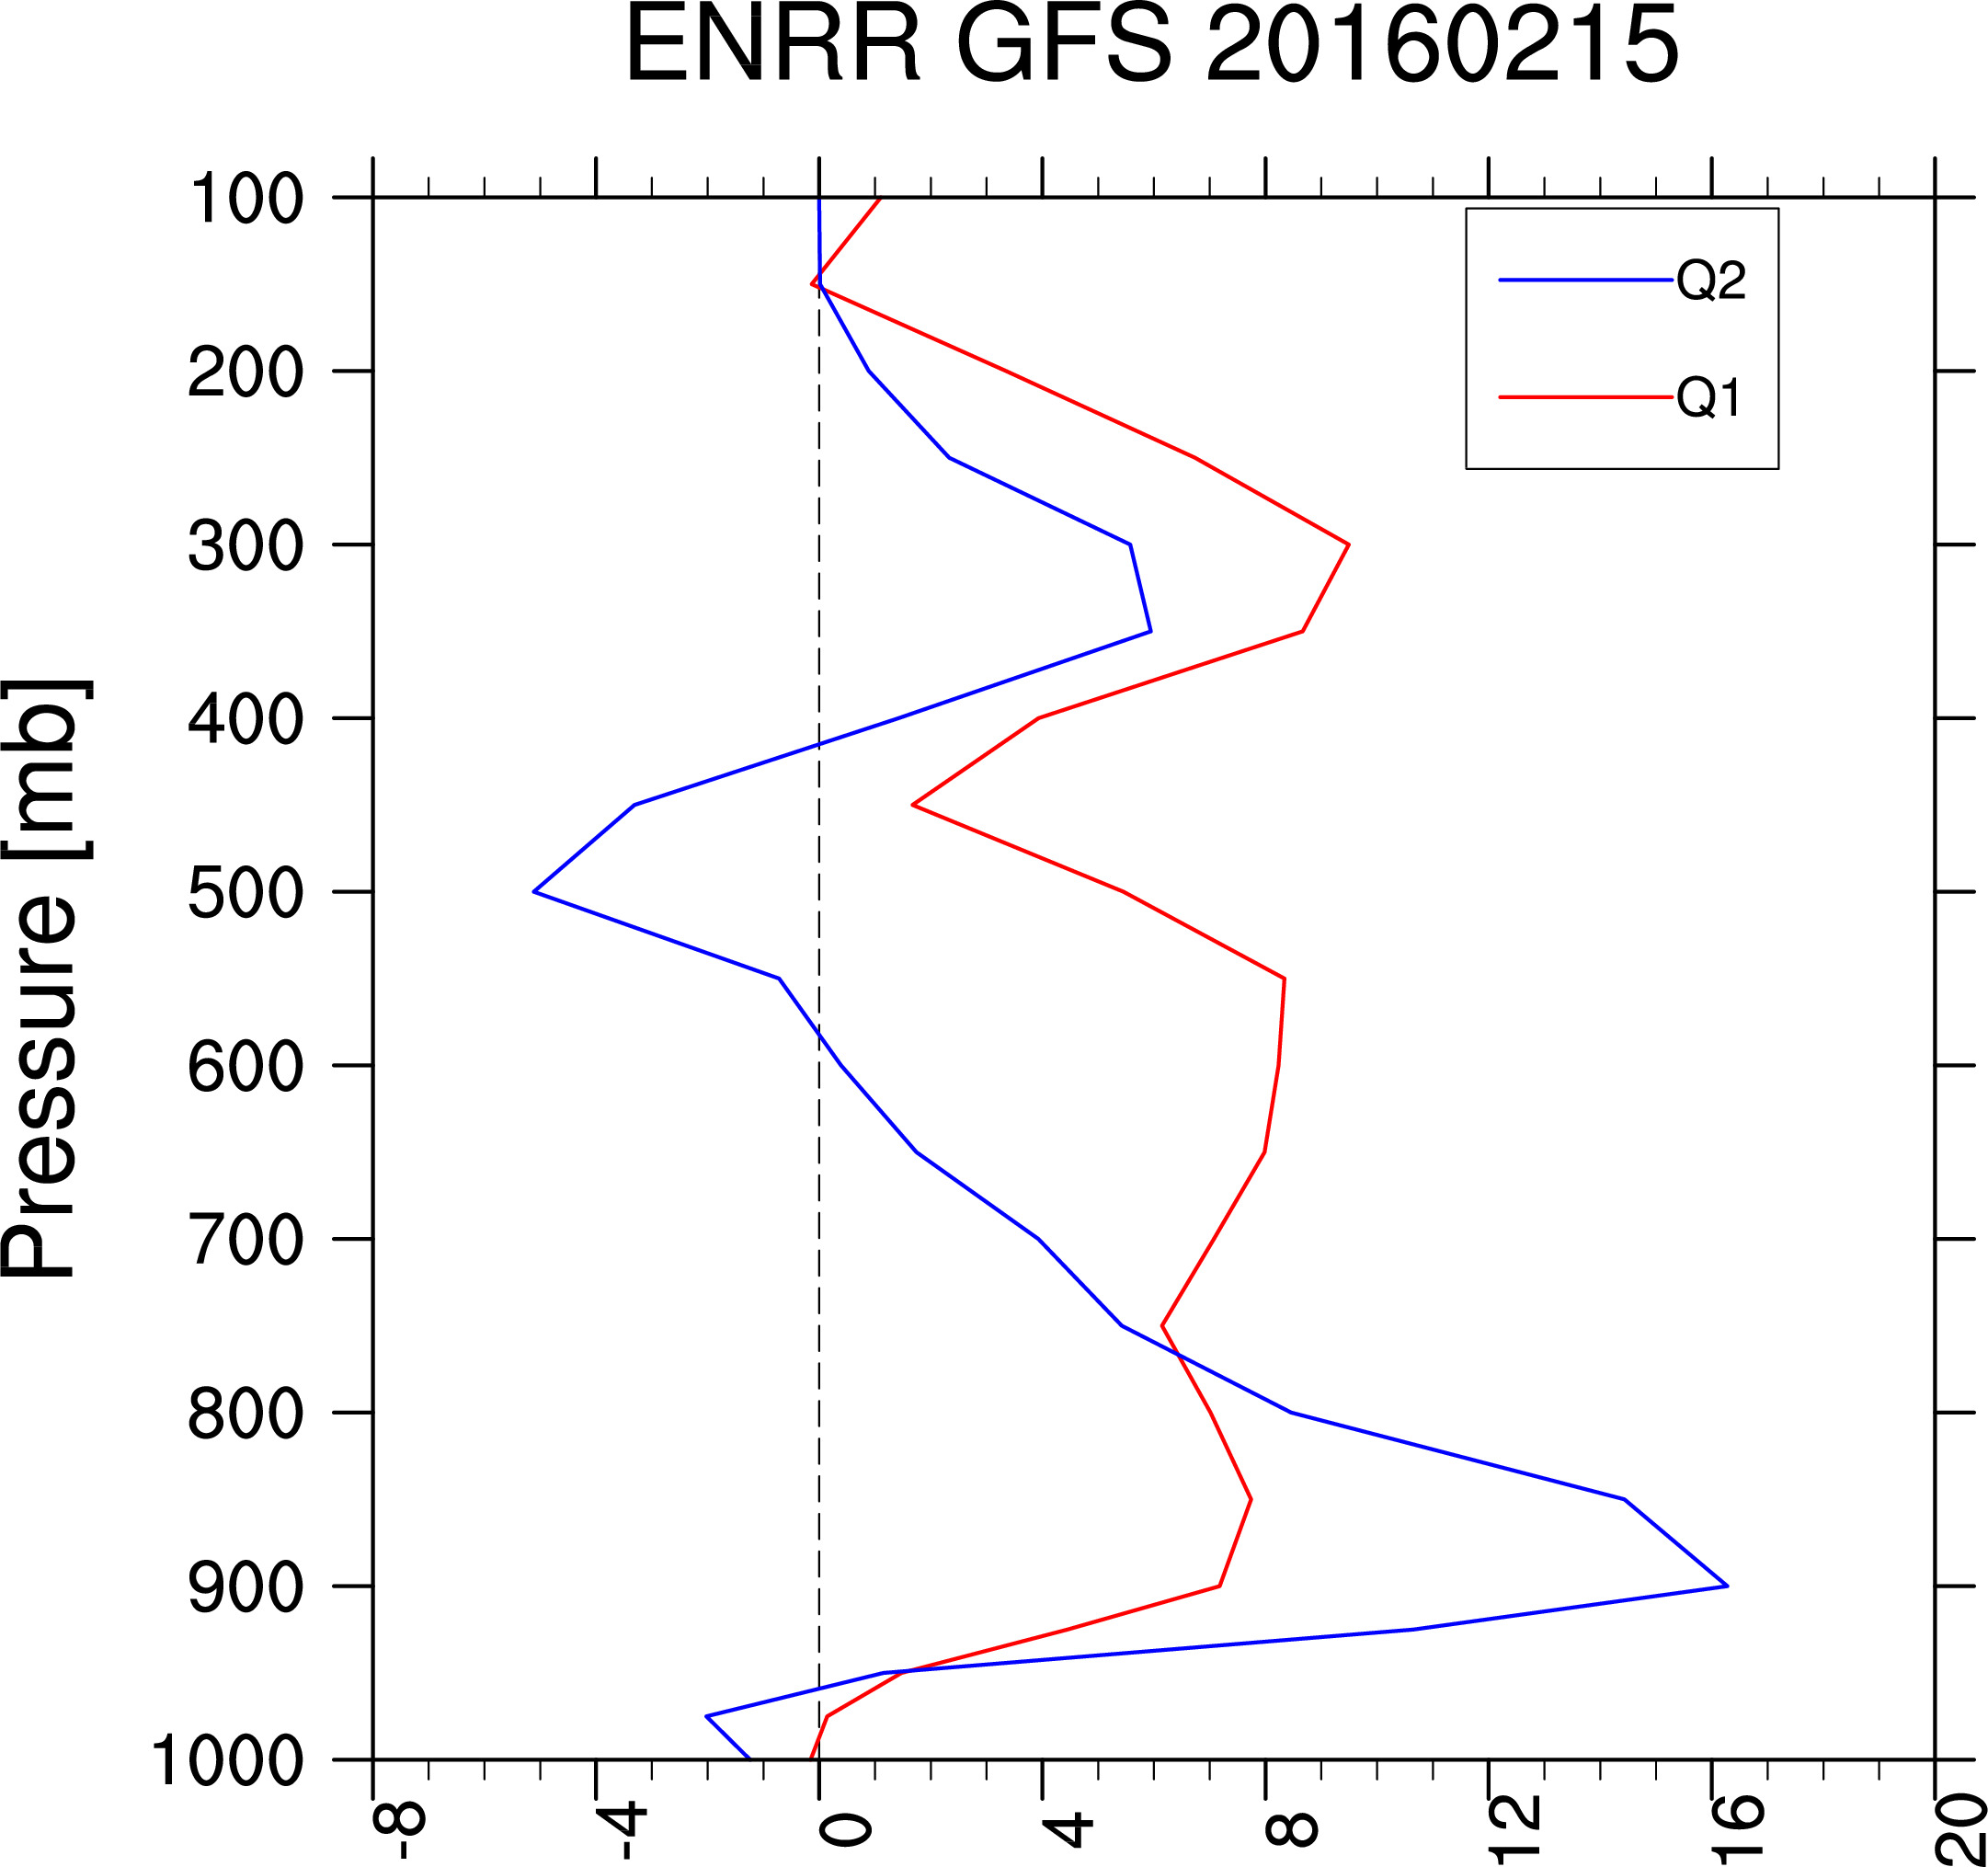
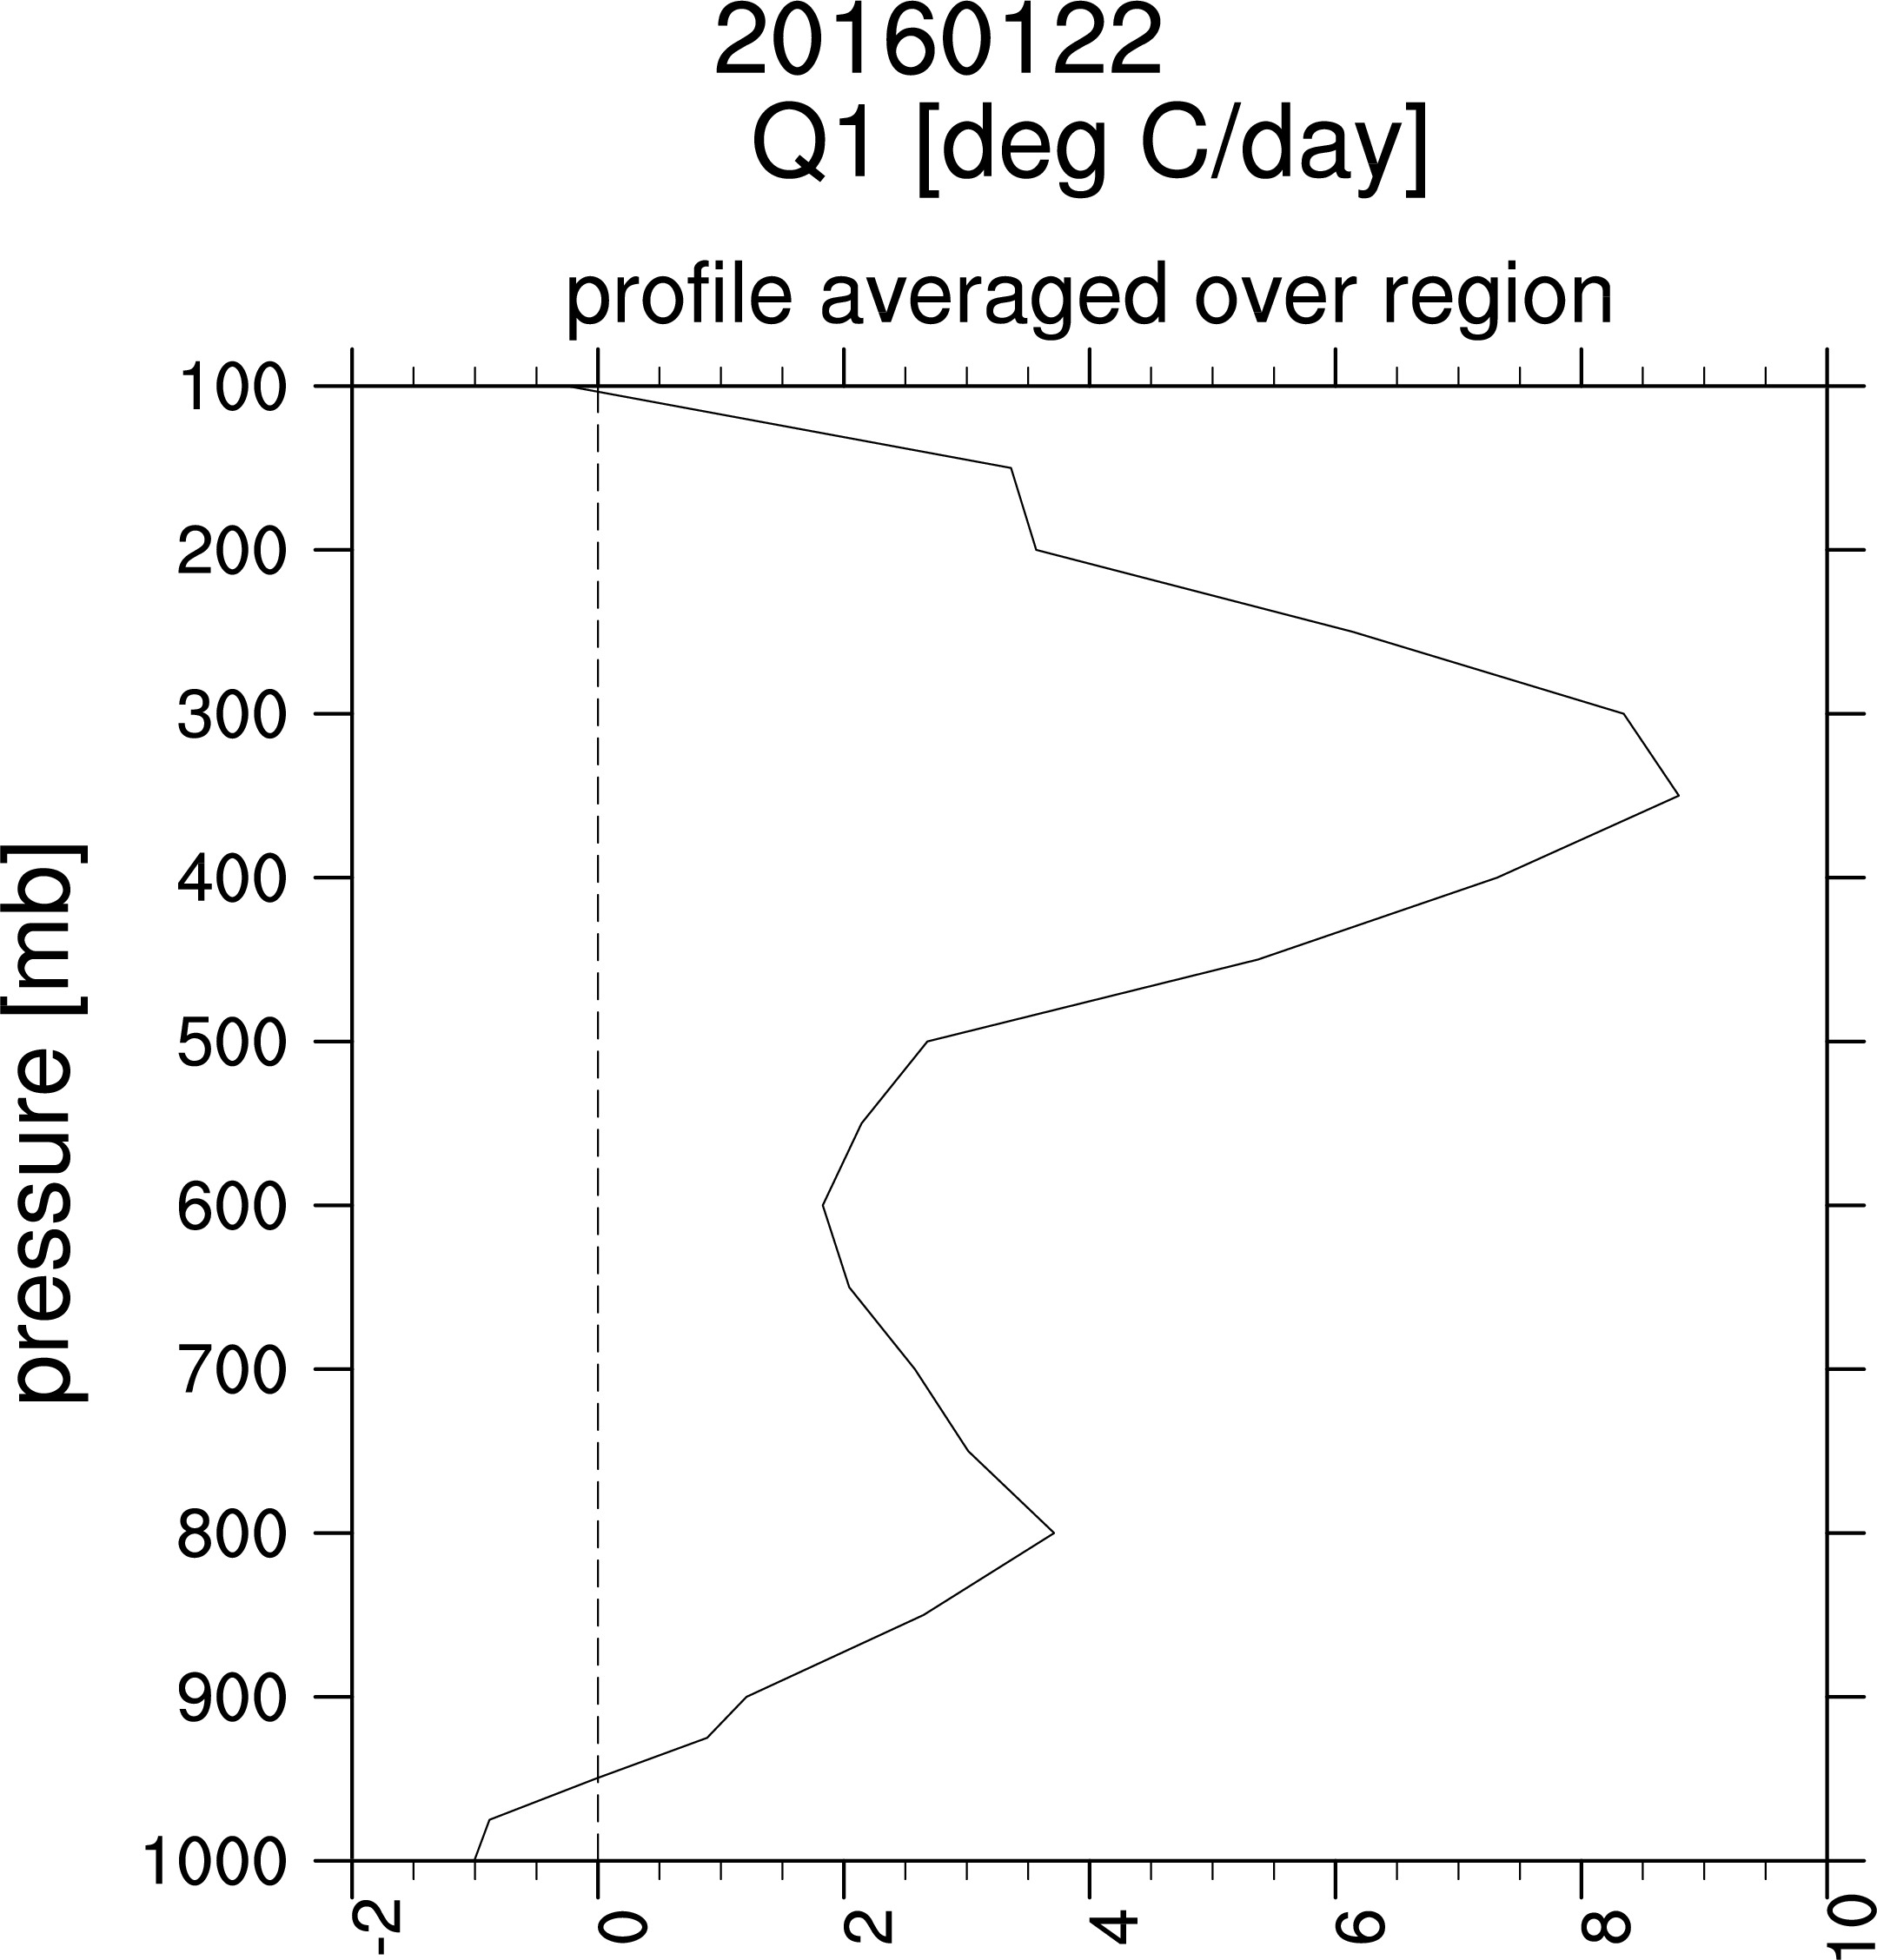
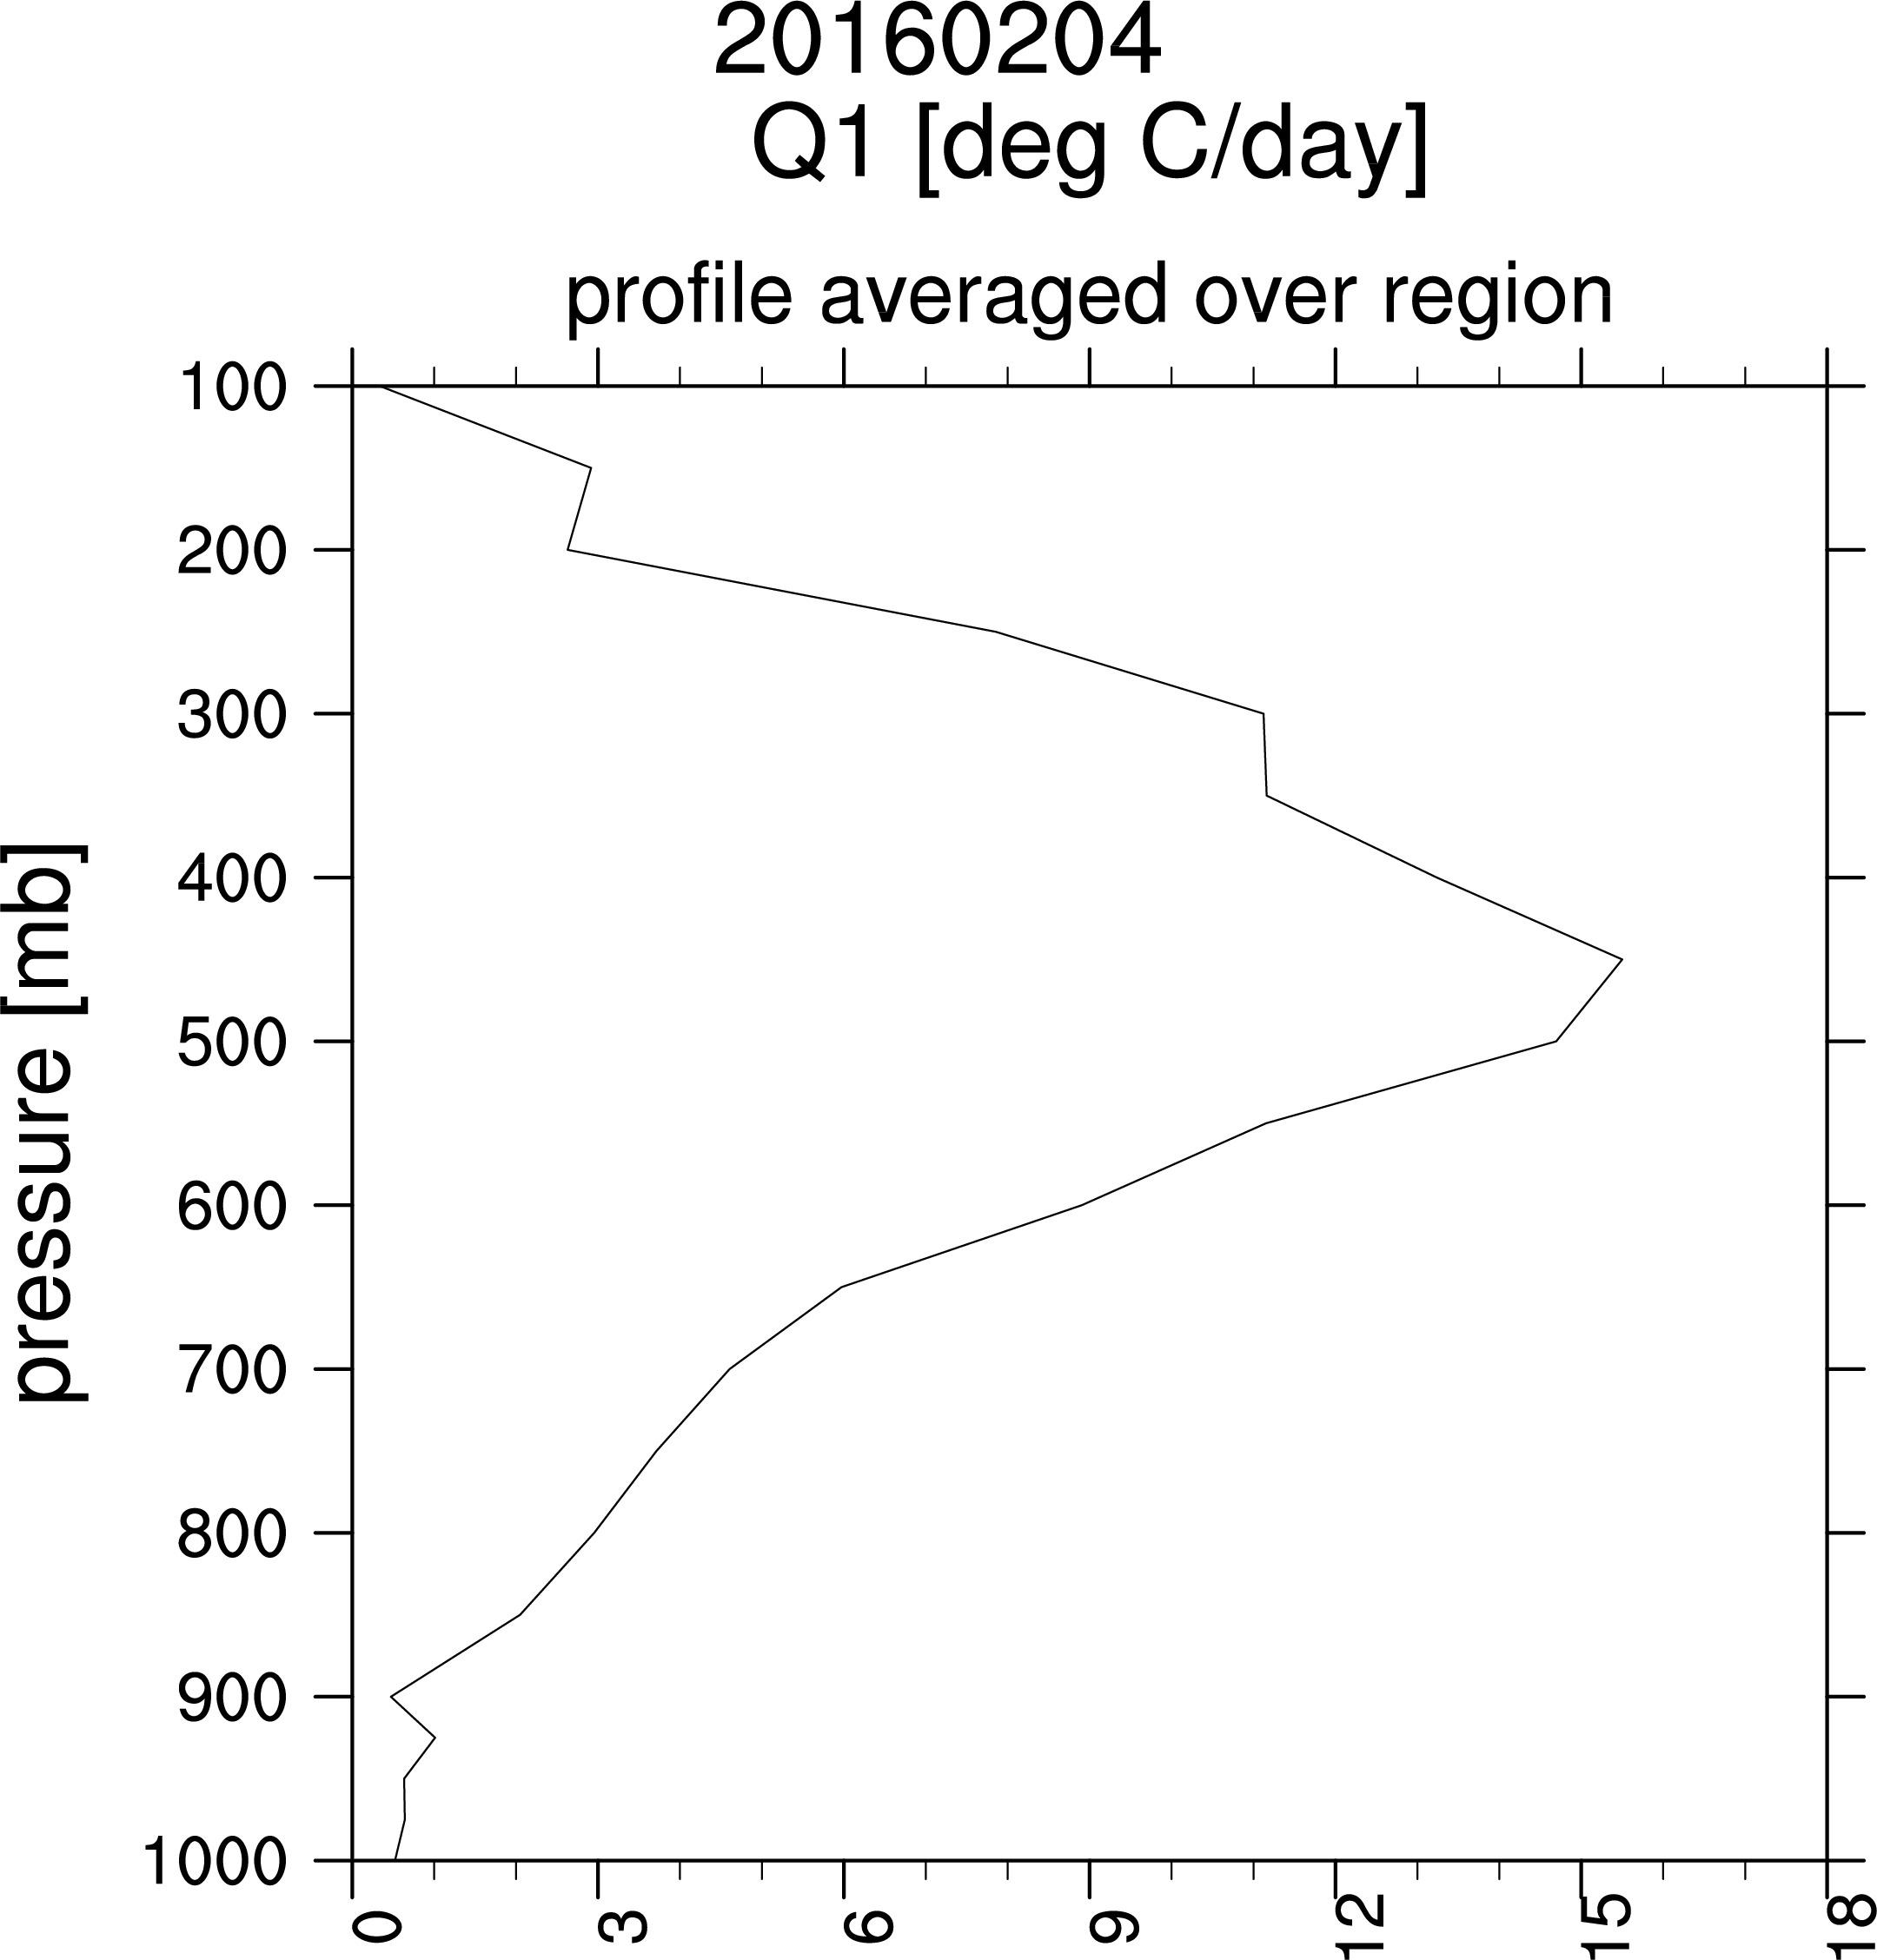
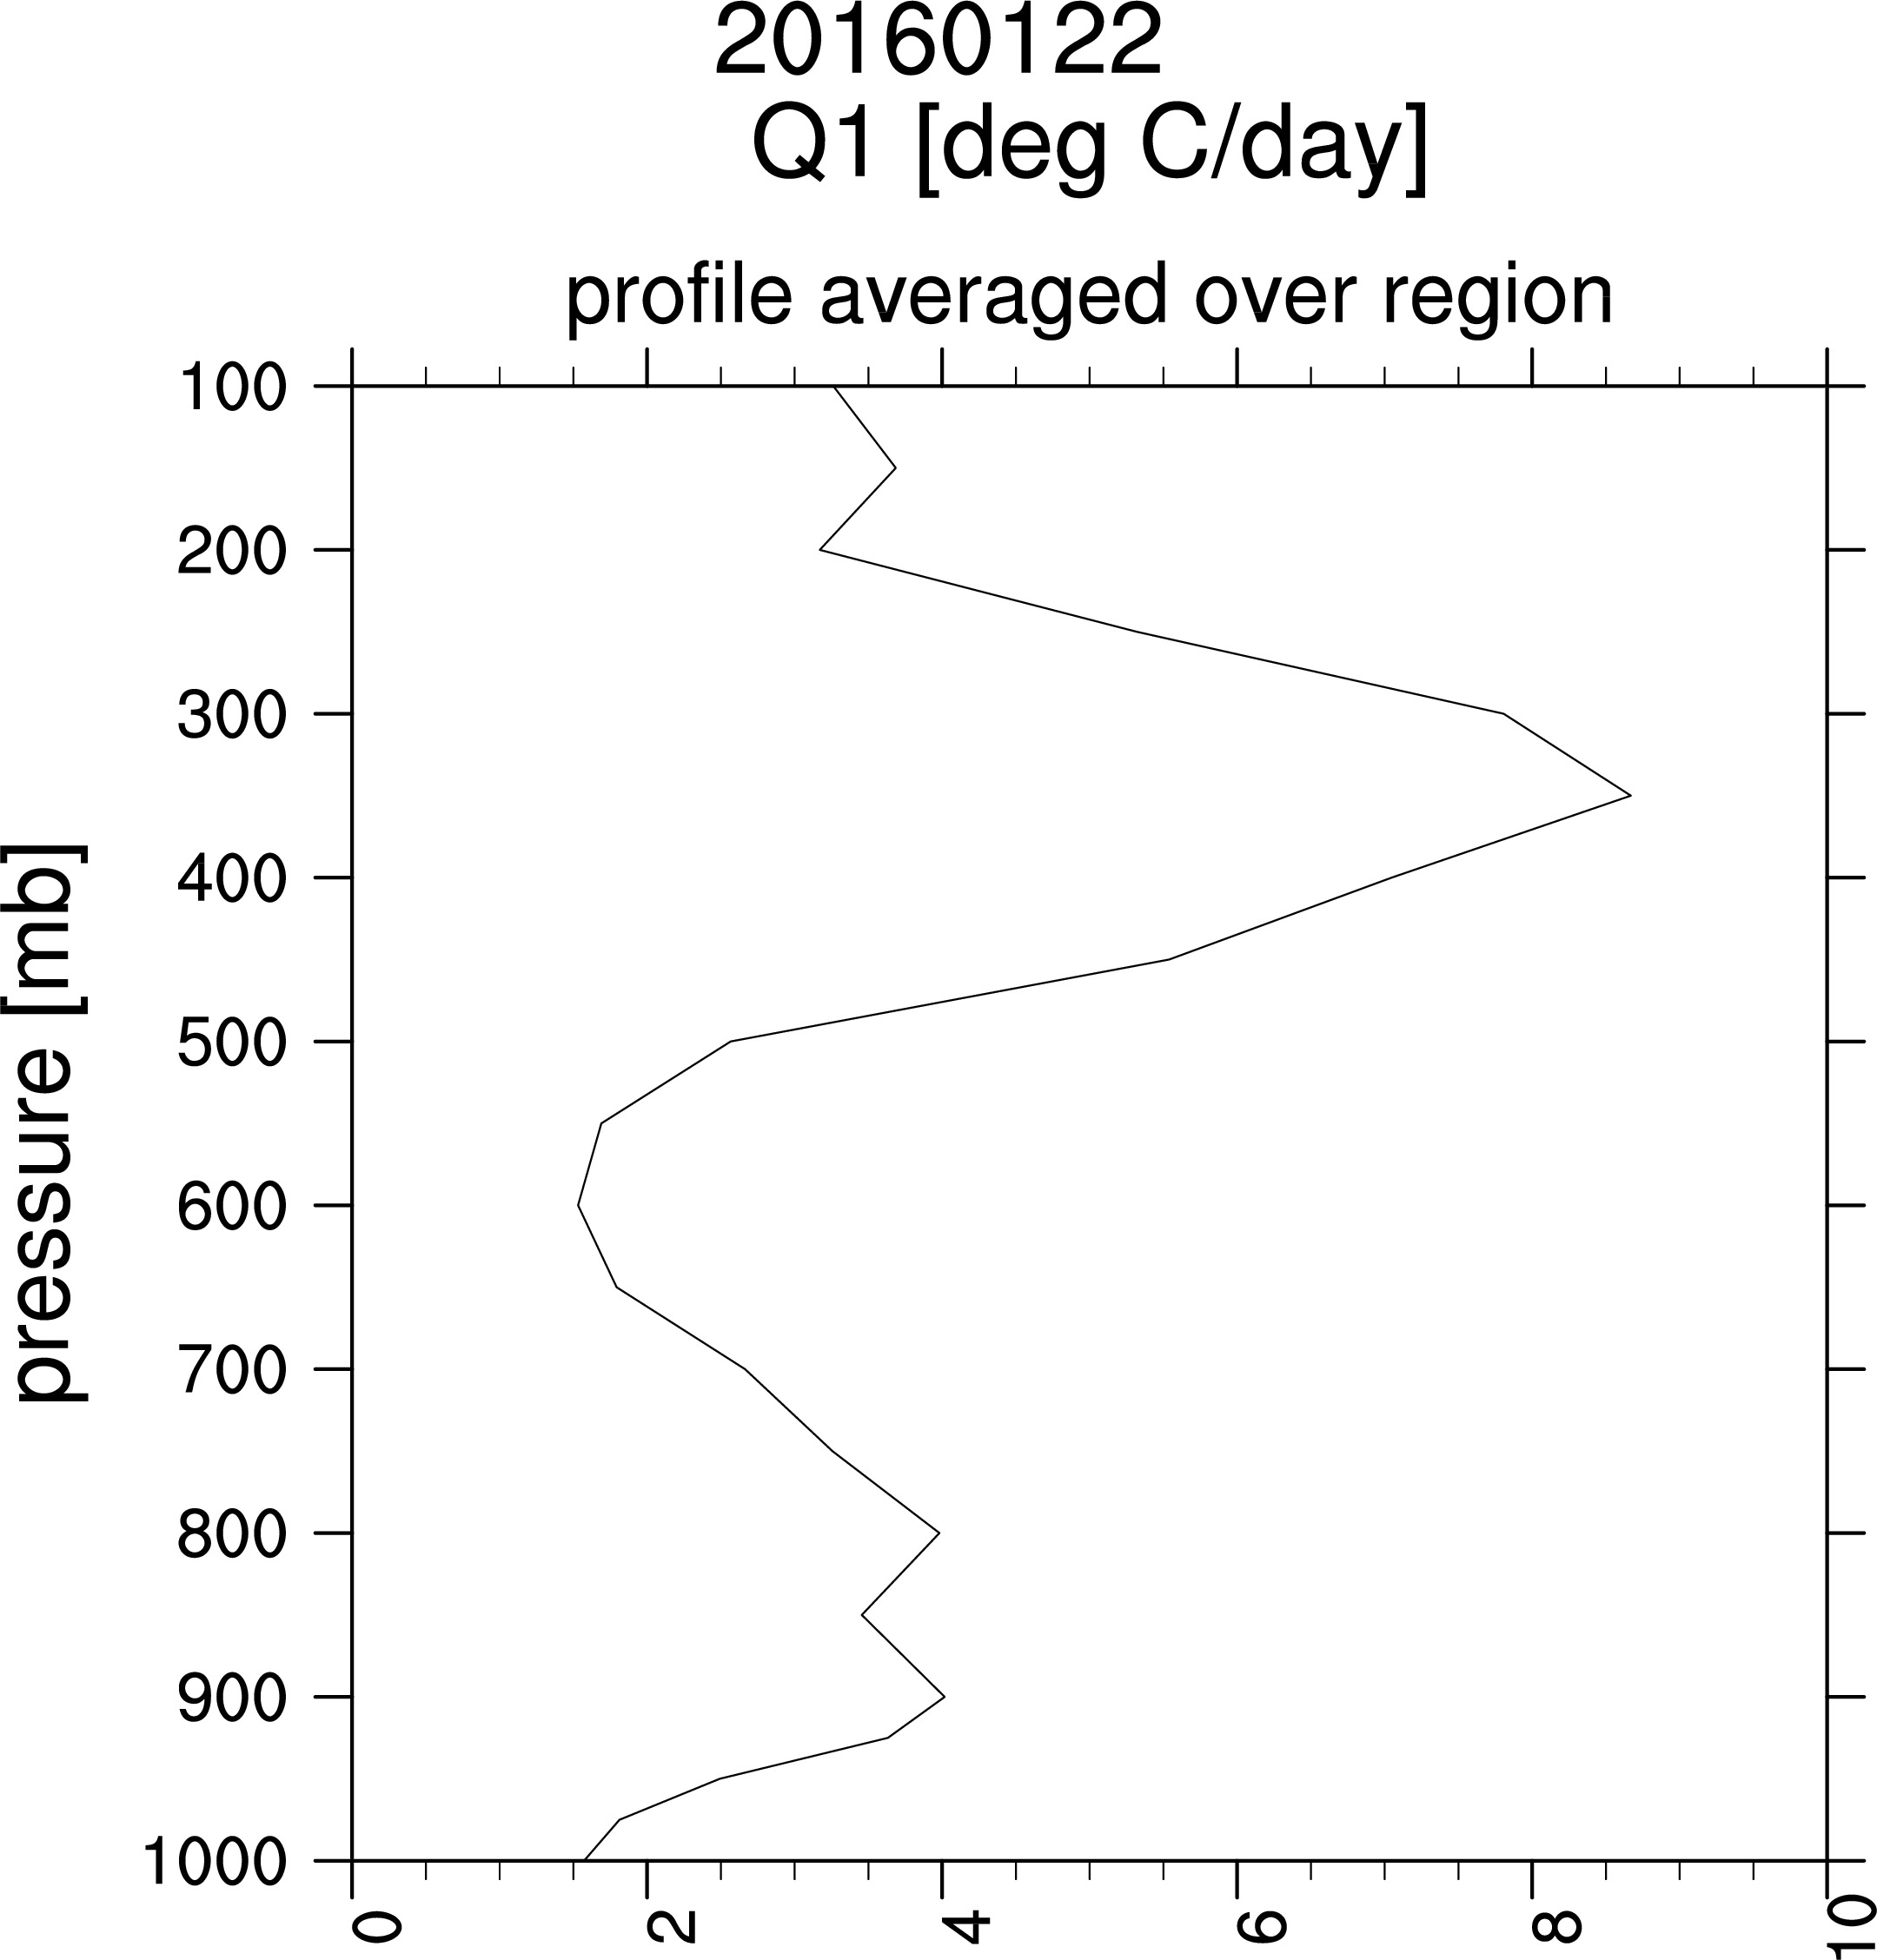
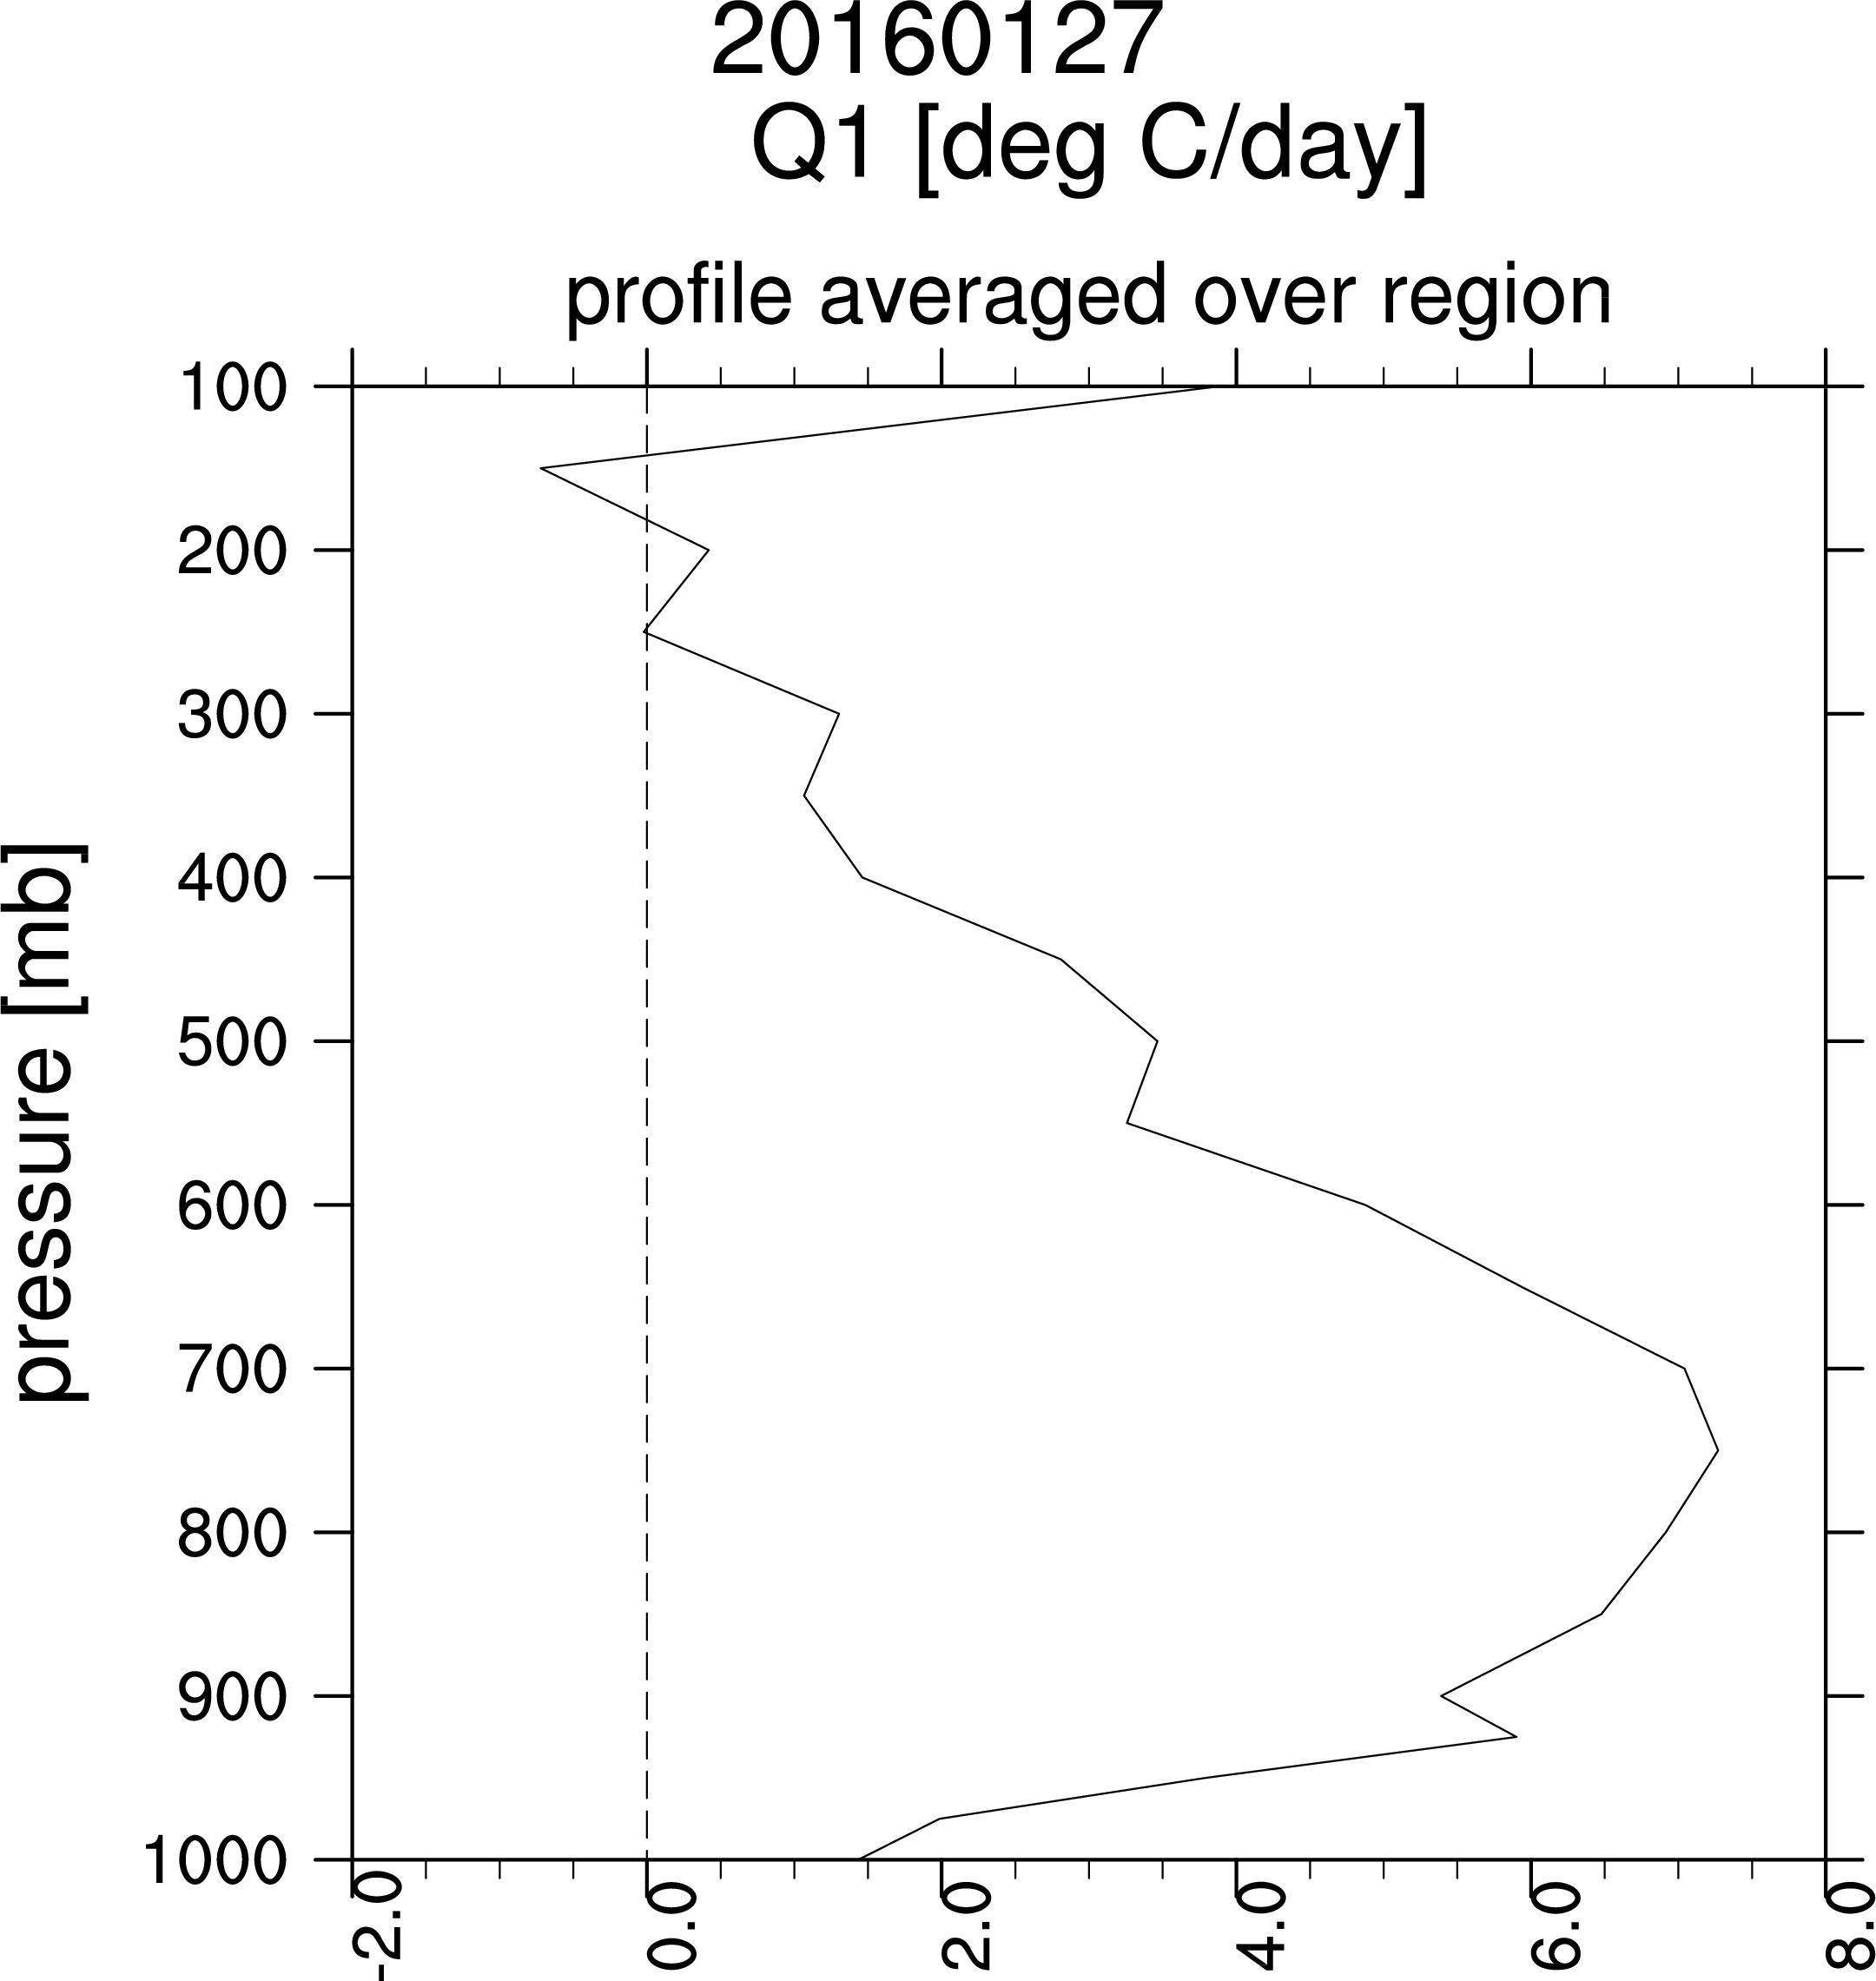
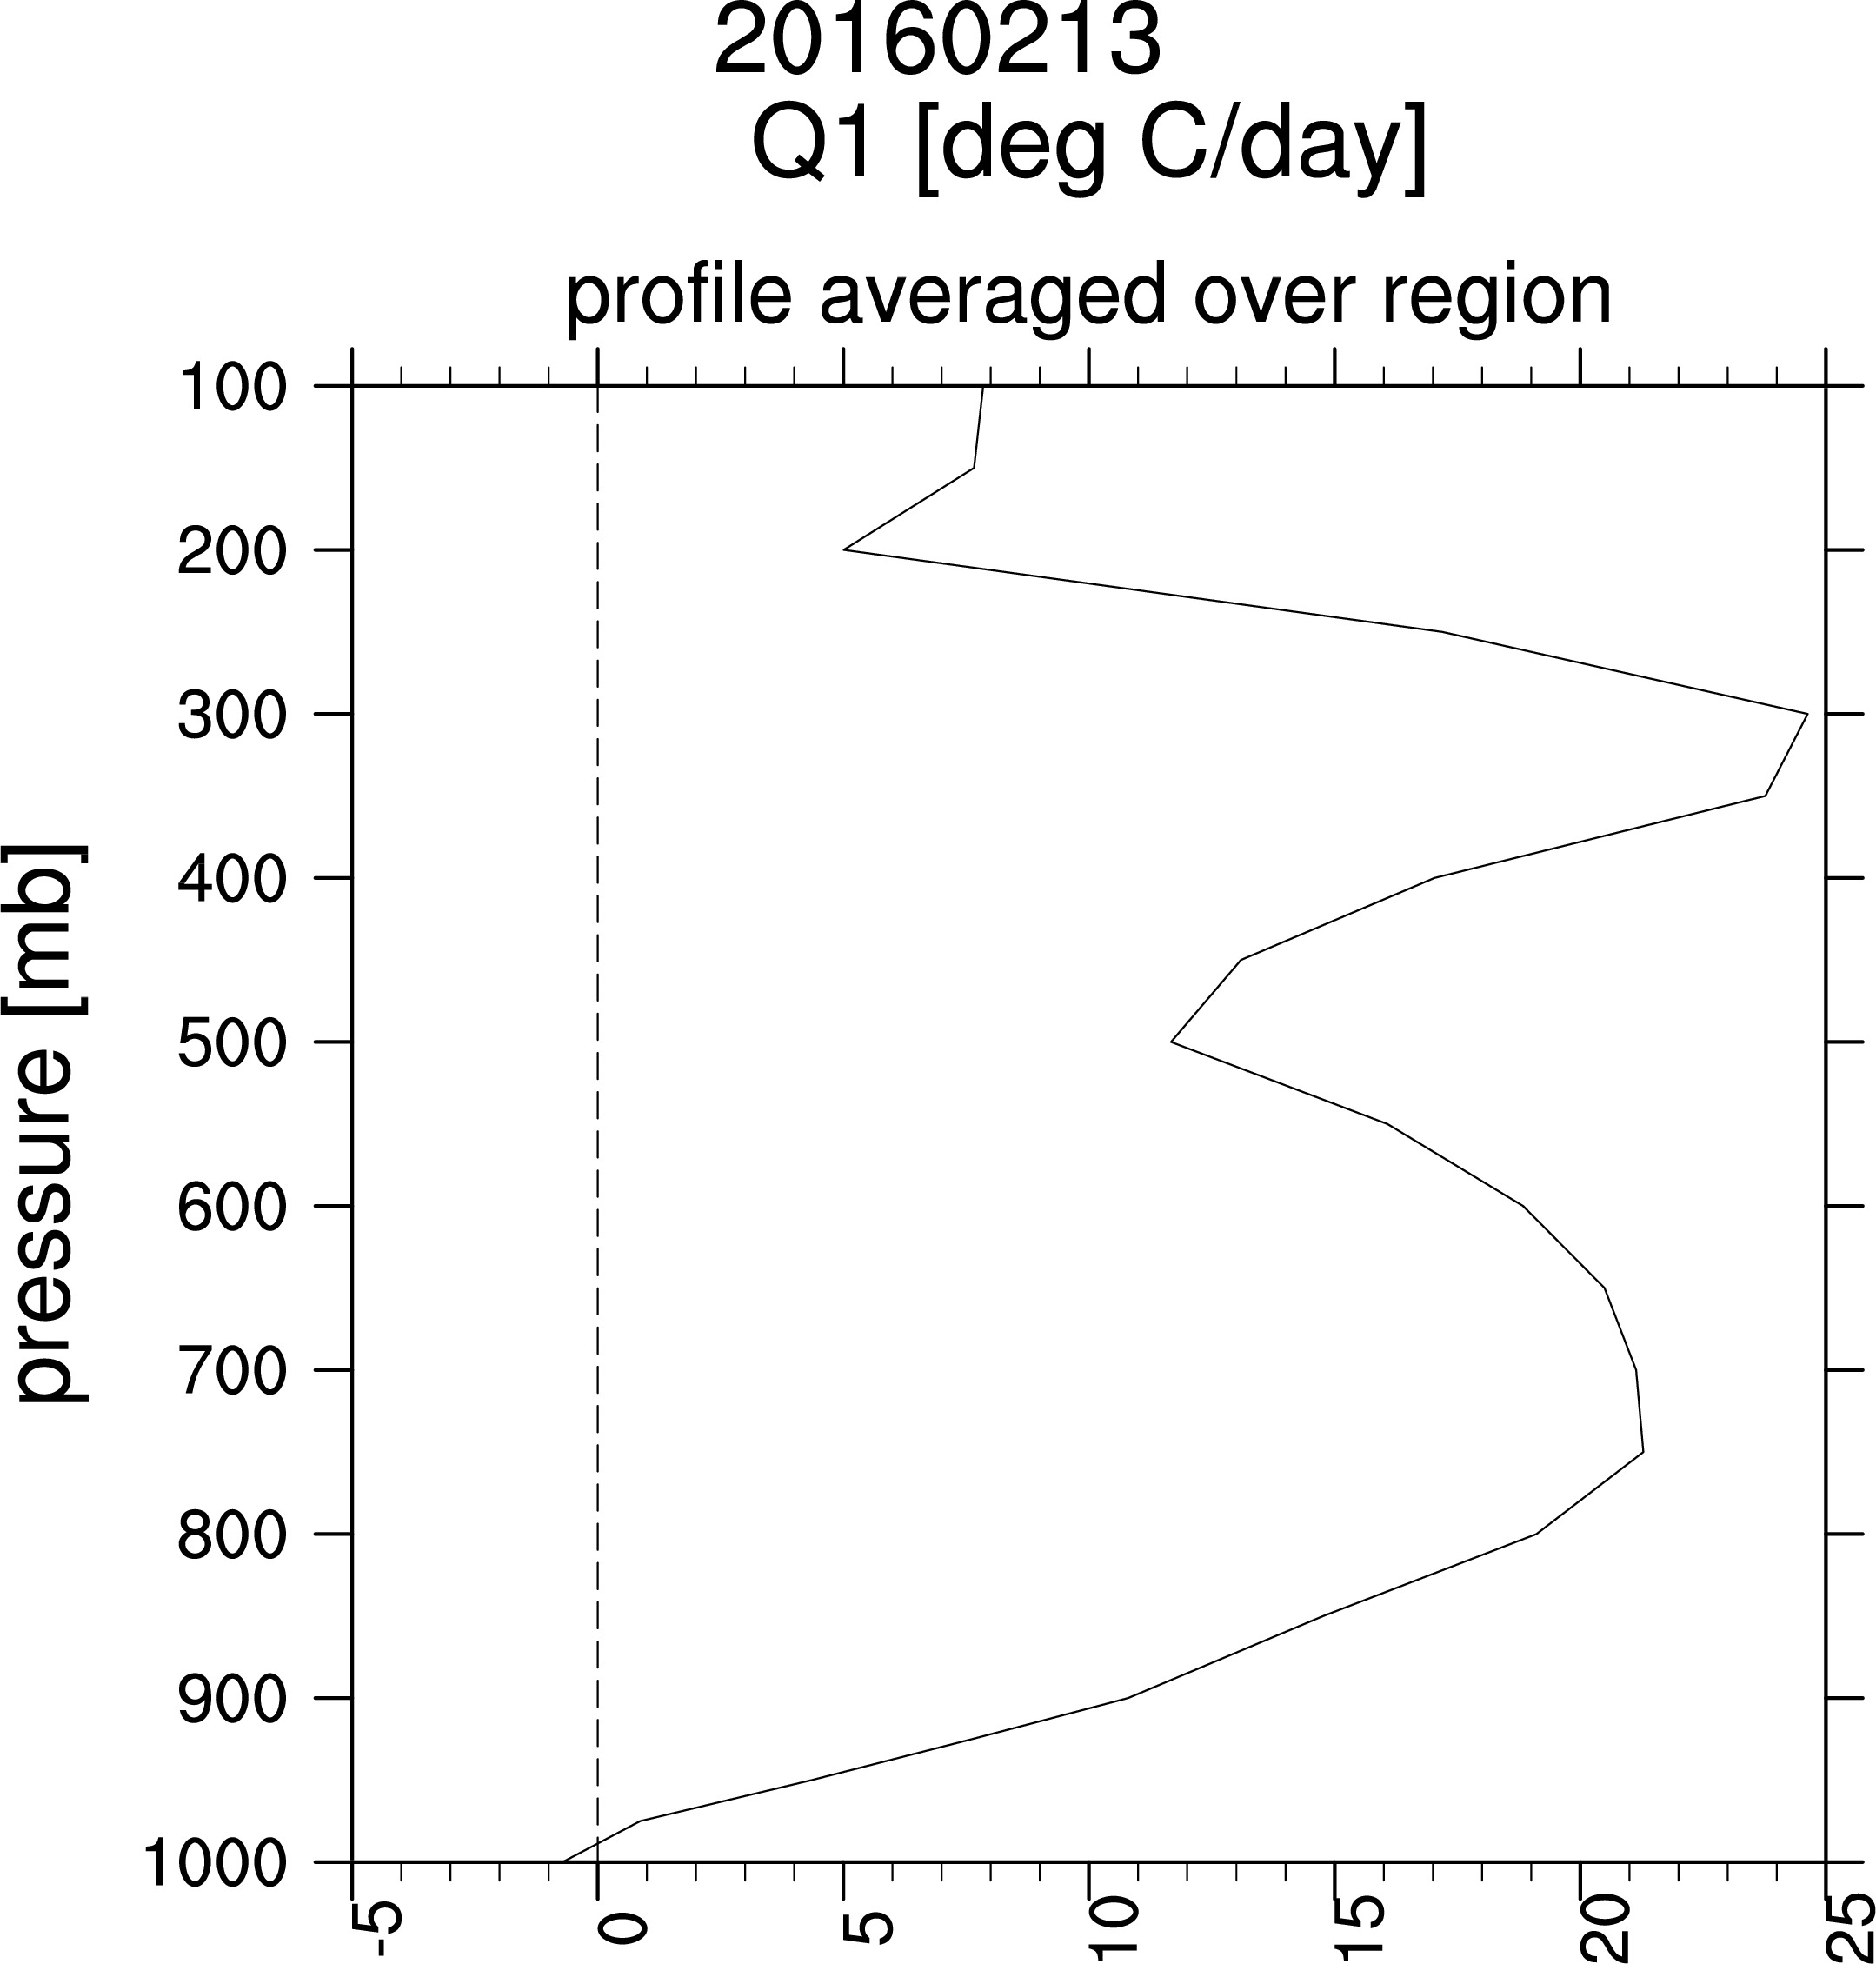
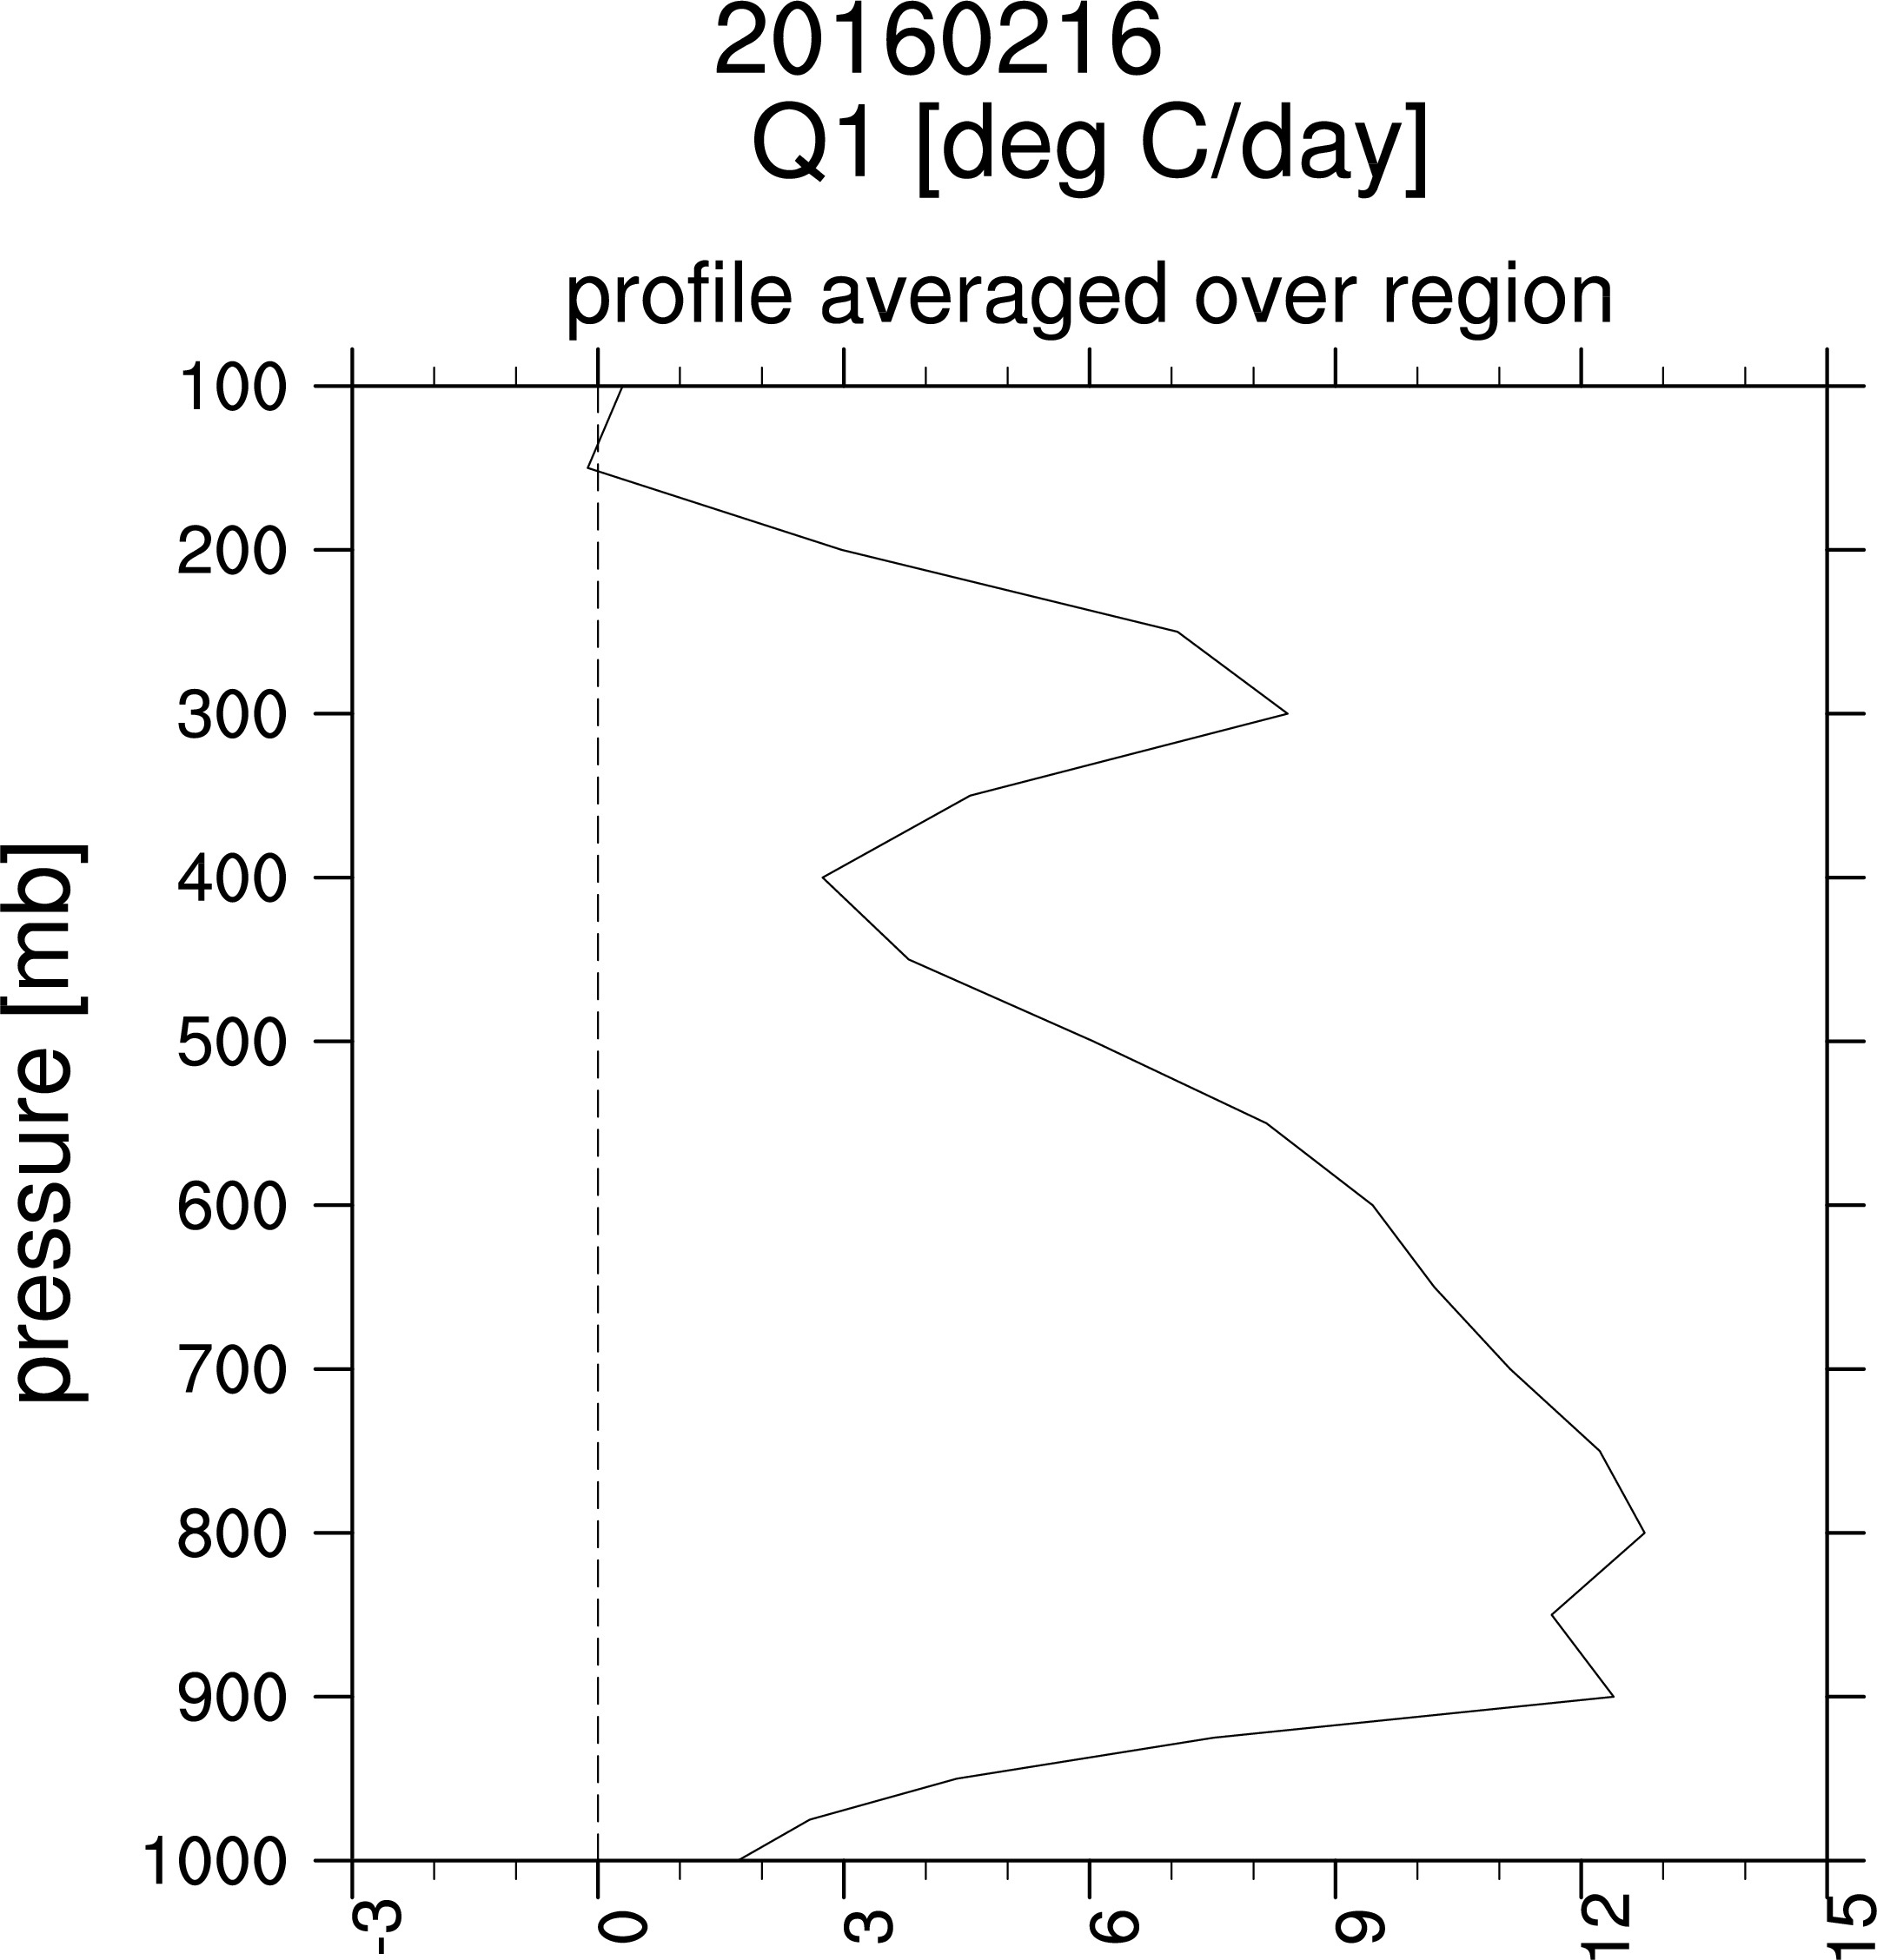
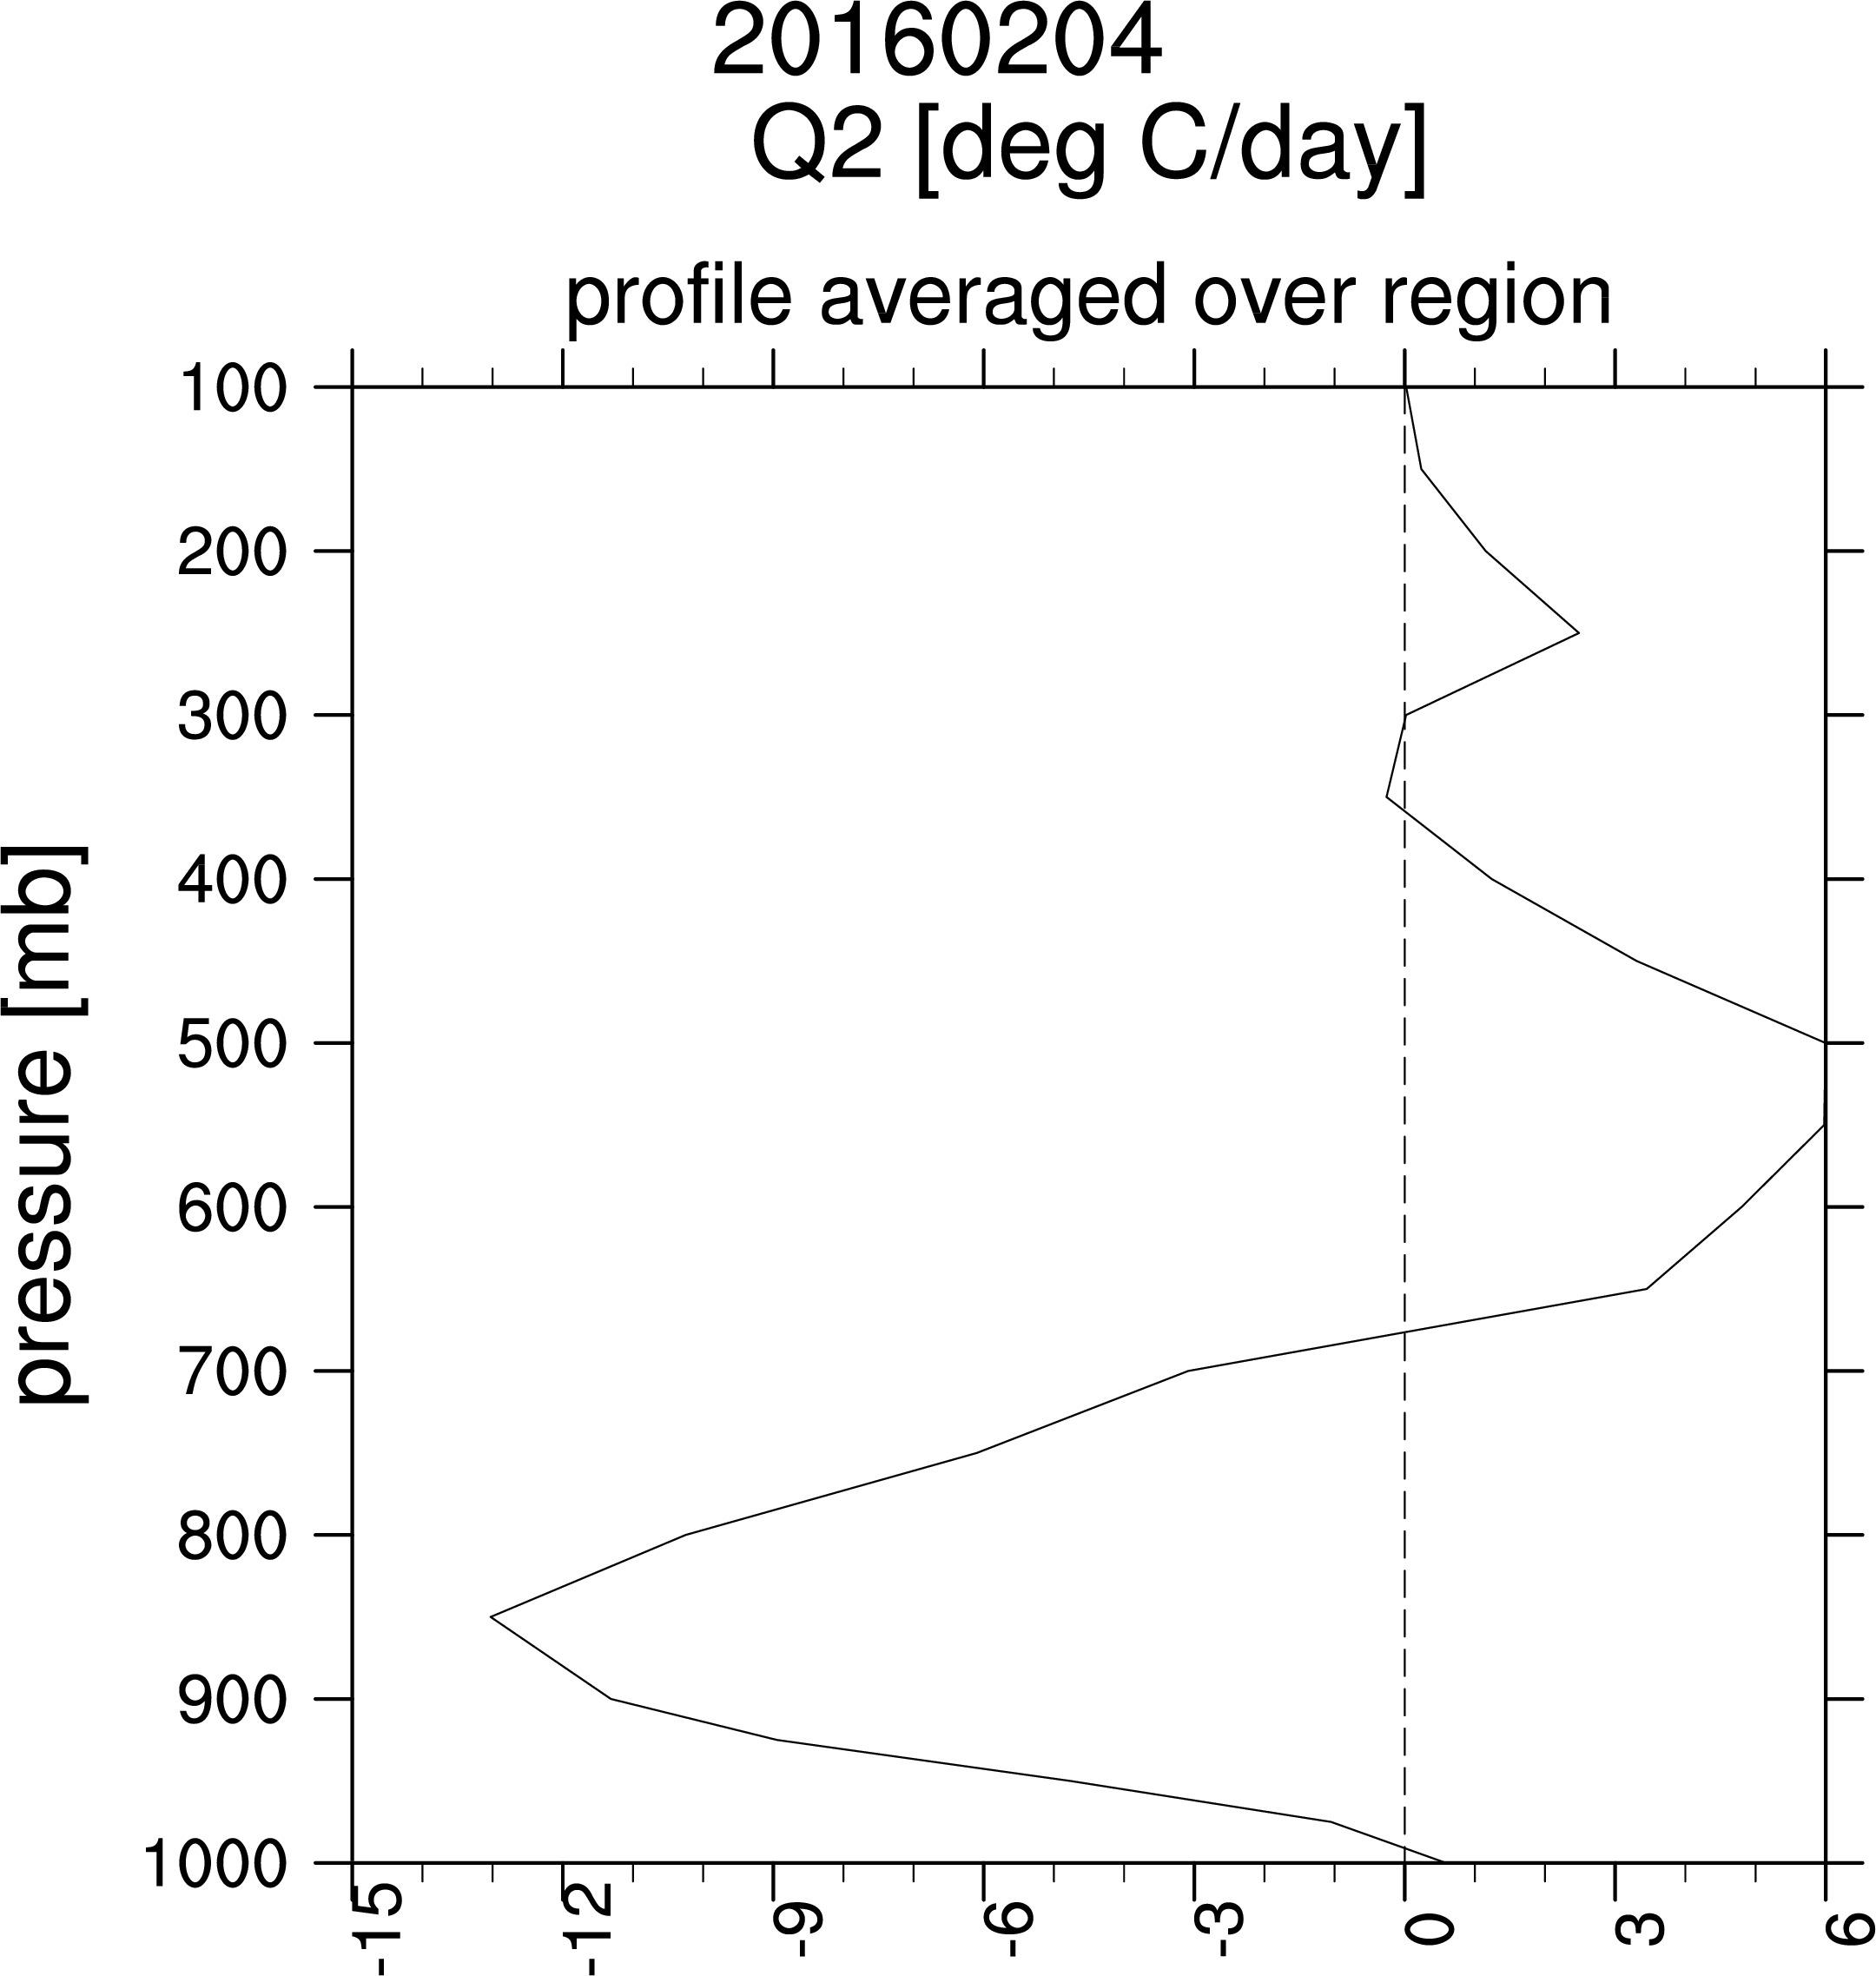
Apparent Heat Source and Apparent Moisture Sinks
vertical integrations of Q1 and Q2:
Above plots created via Kim et al method, but averaging over flight path first
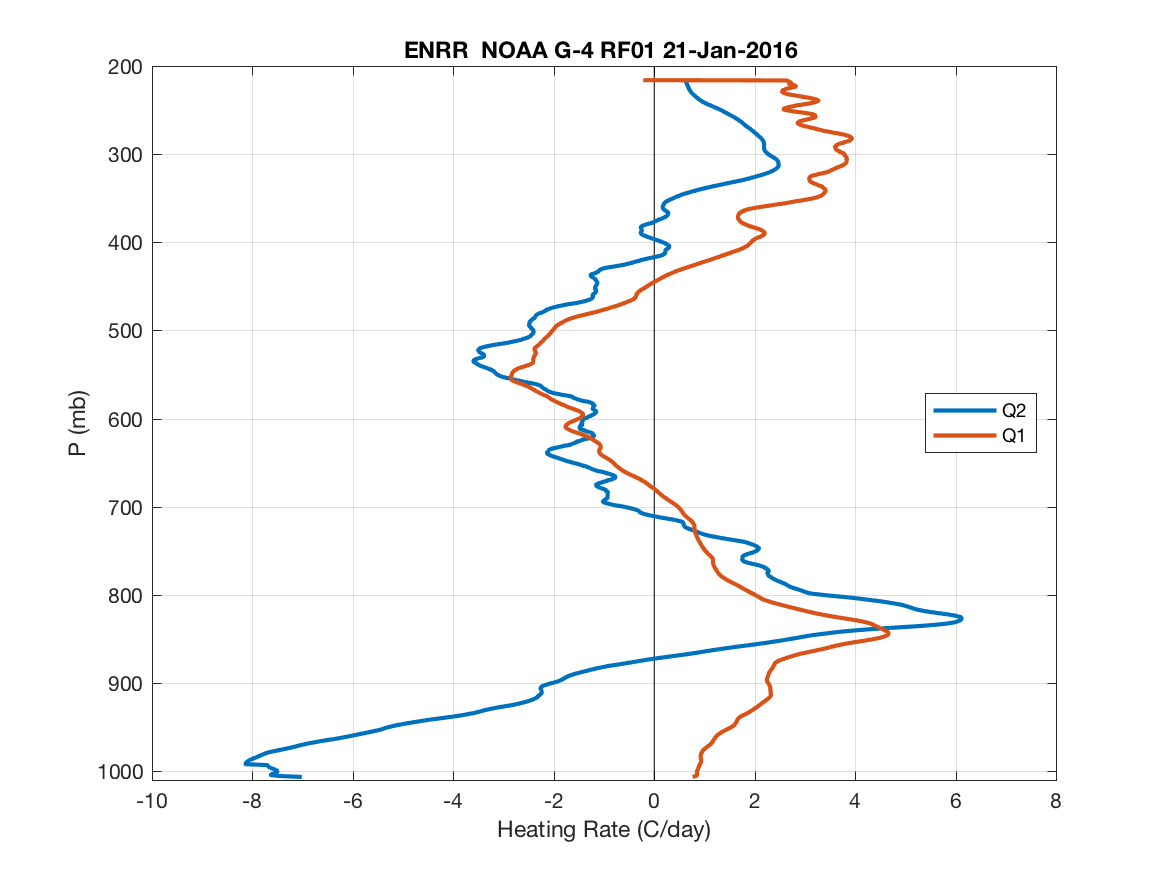
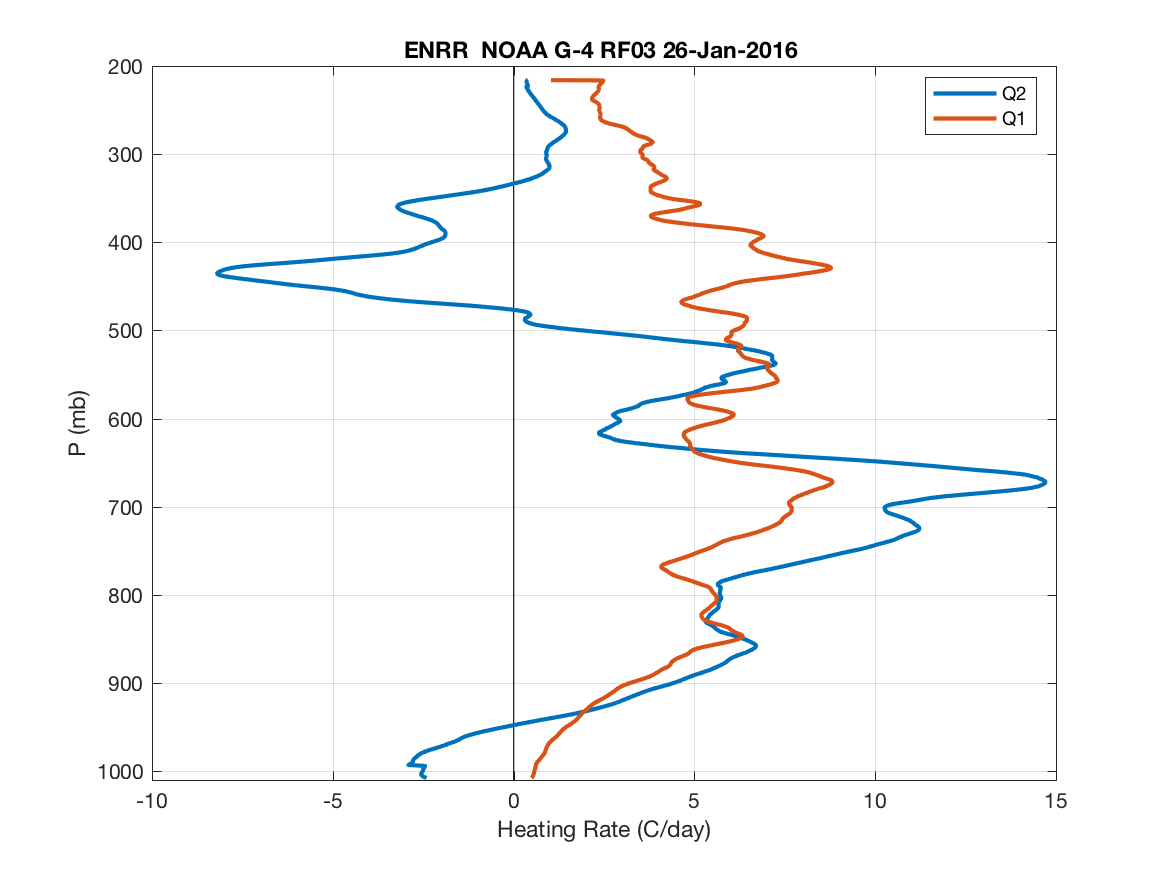
Above plots courtesy Byron Blomquist/Chris Fairall
Above plots created via Kim et al method
--------------------------------------------------------------------------------------------------------------------------------------------------------------------------
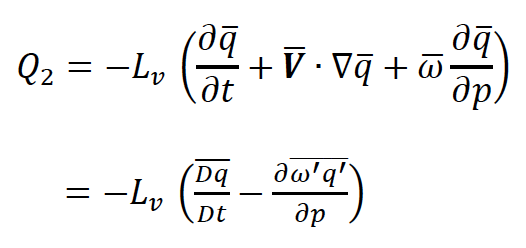
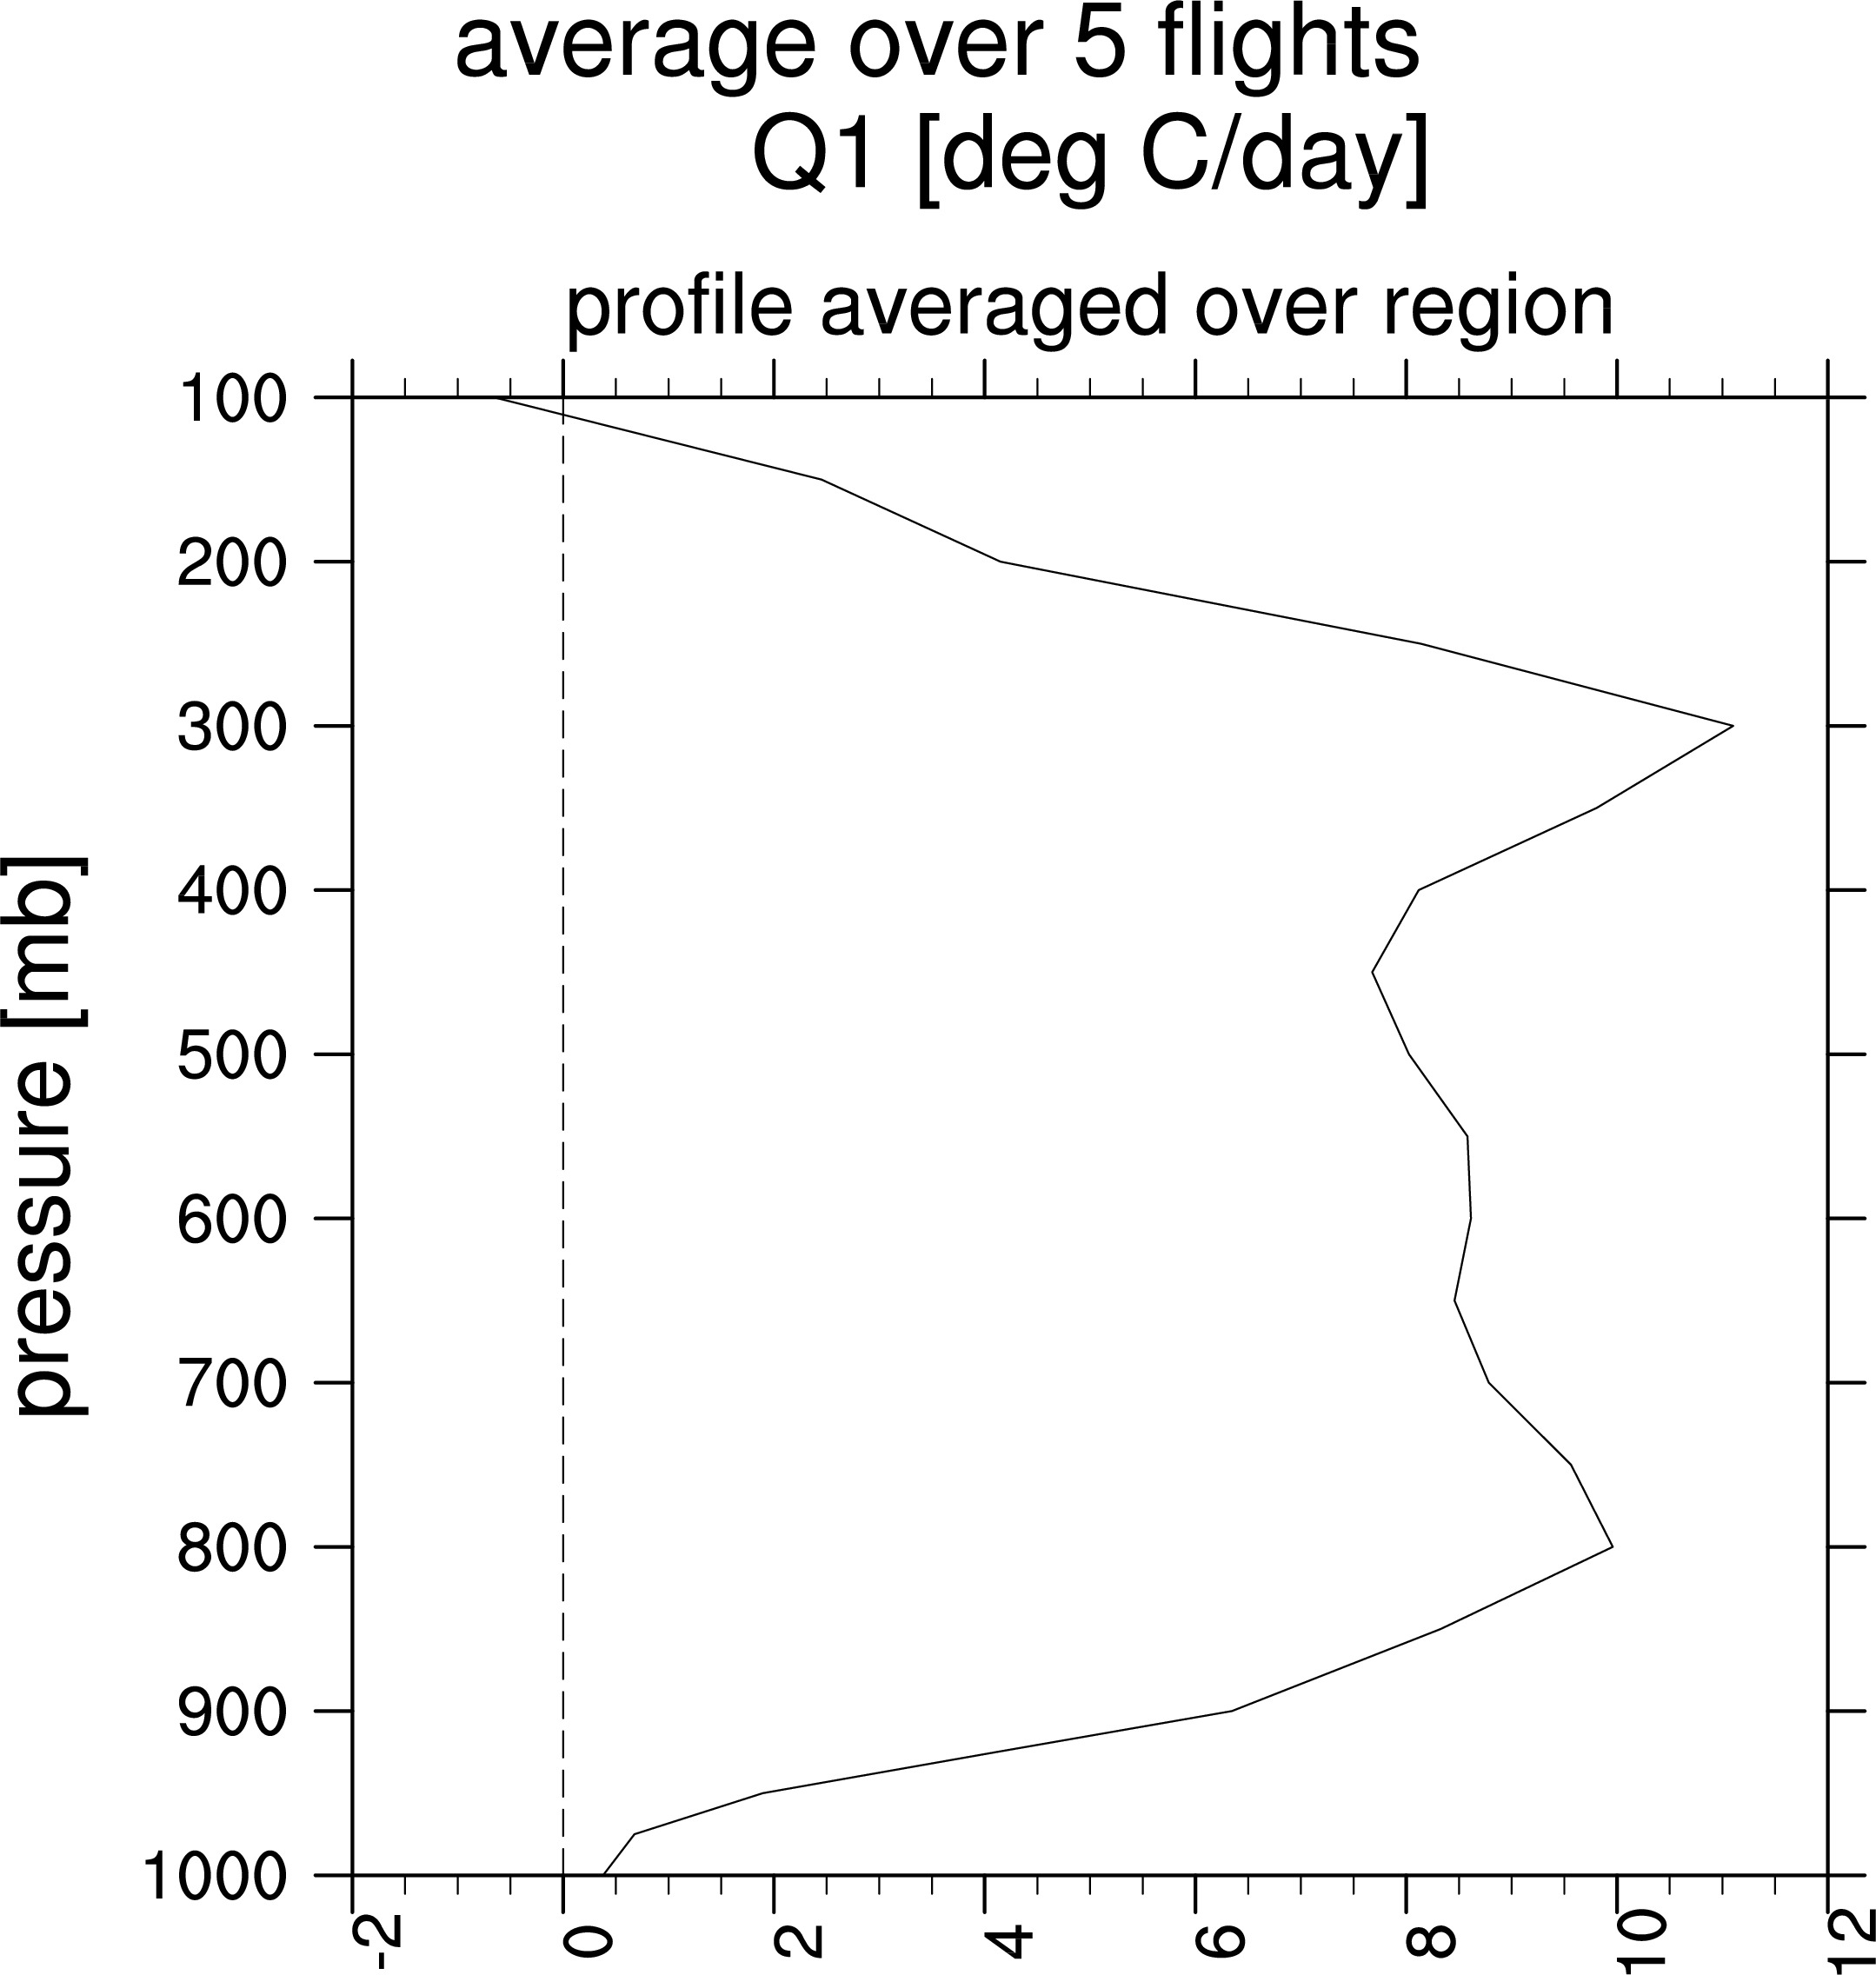
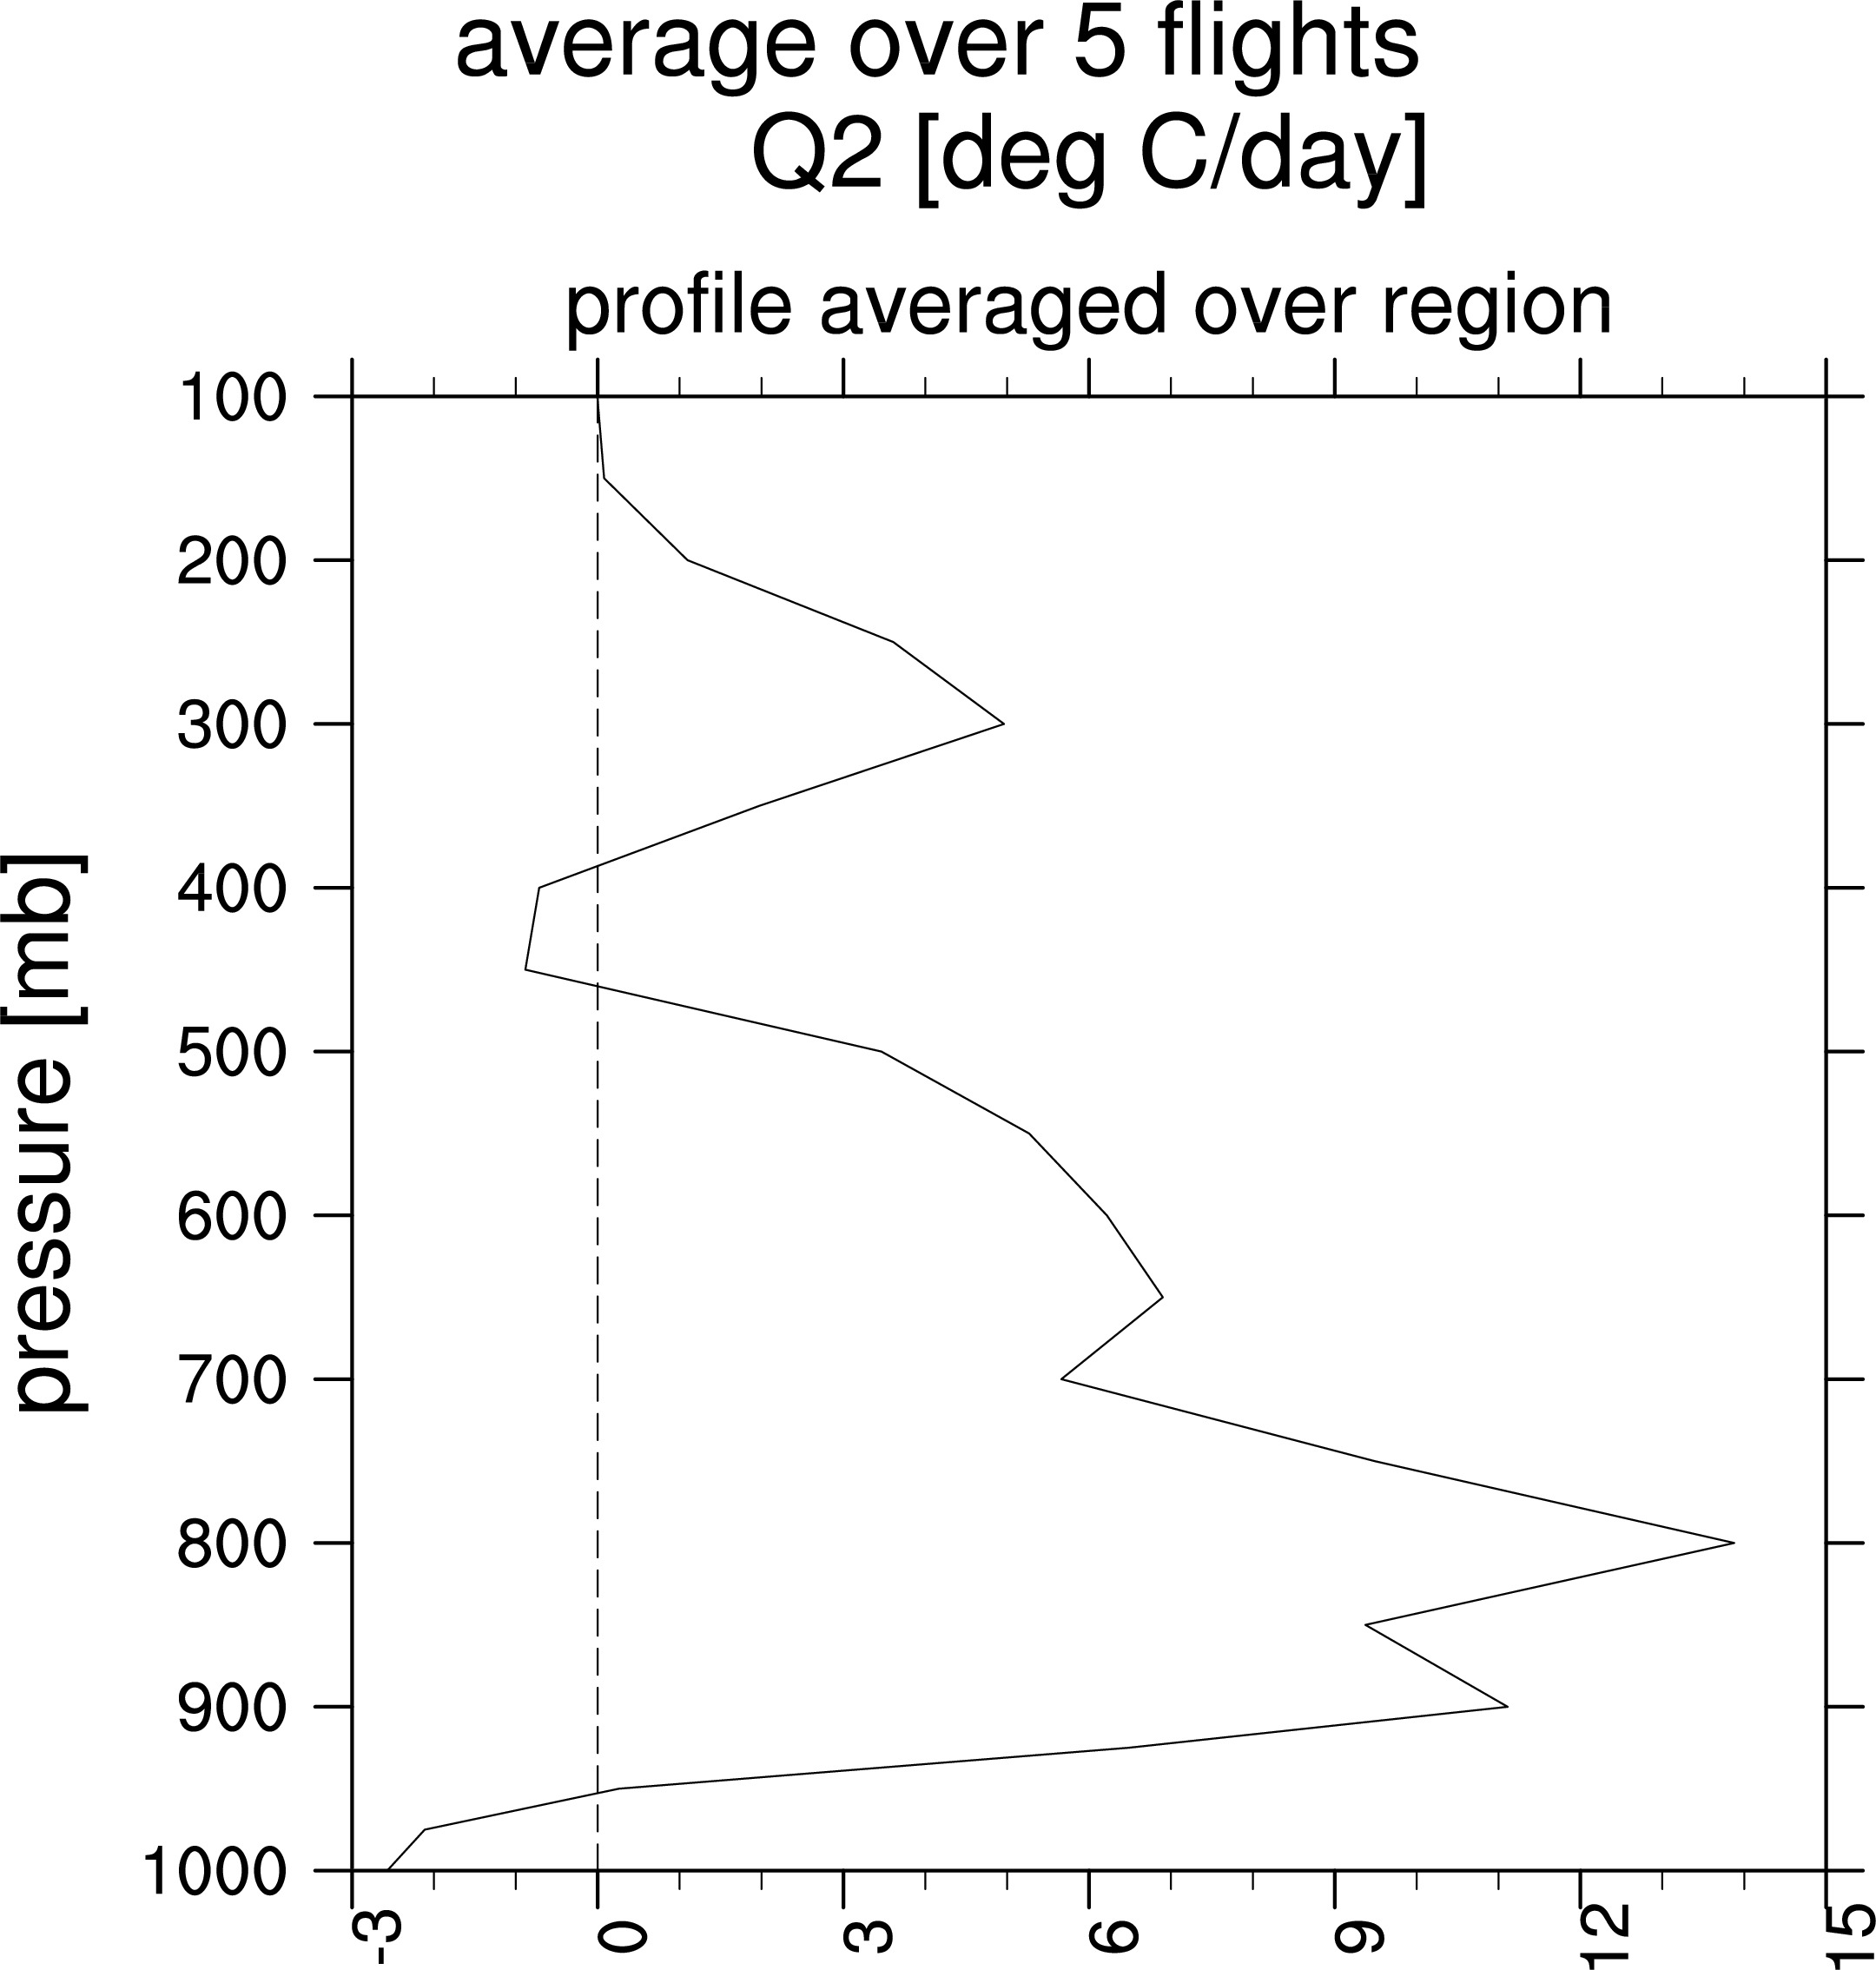
formulas used 'Kim et al Method' 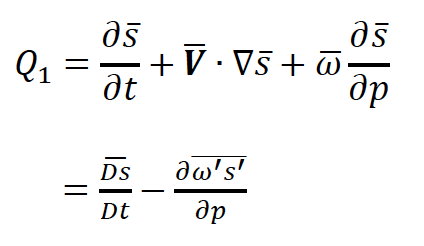
All fields averaged over the geographic flight region last
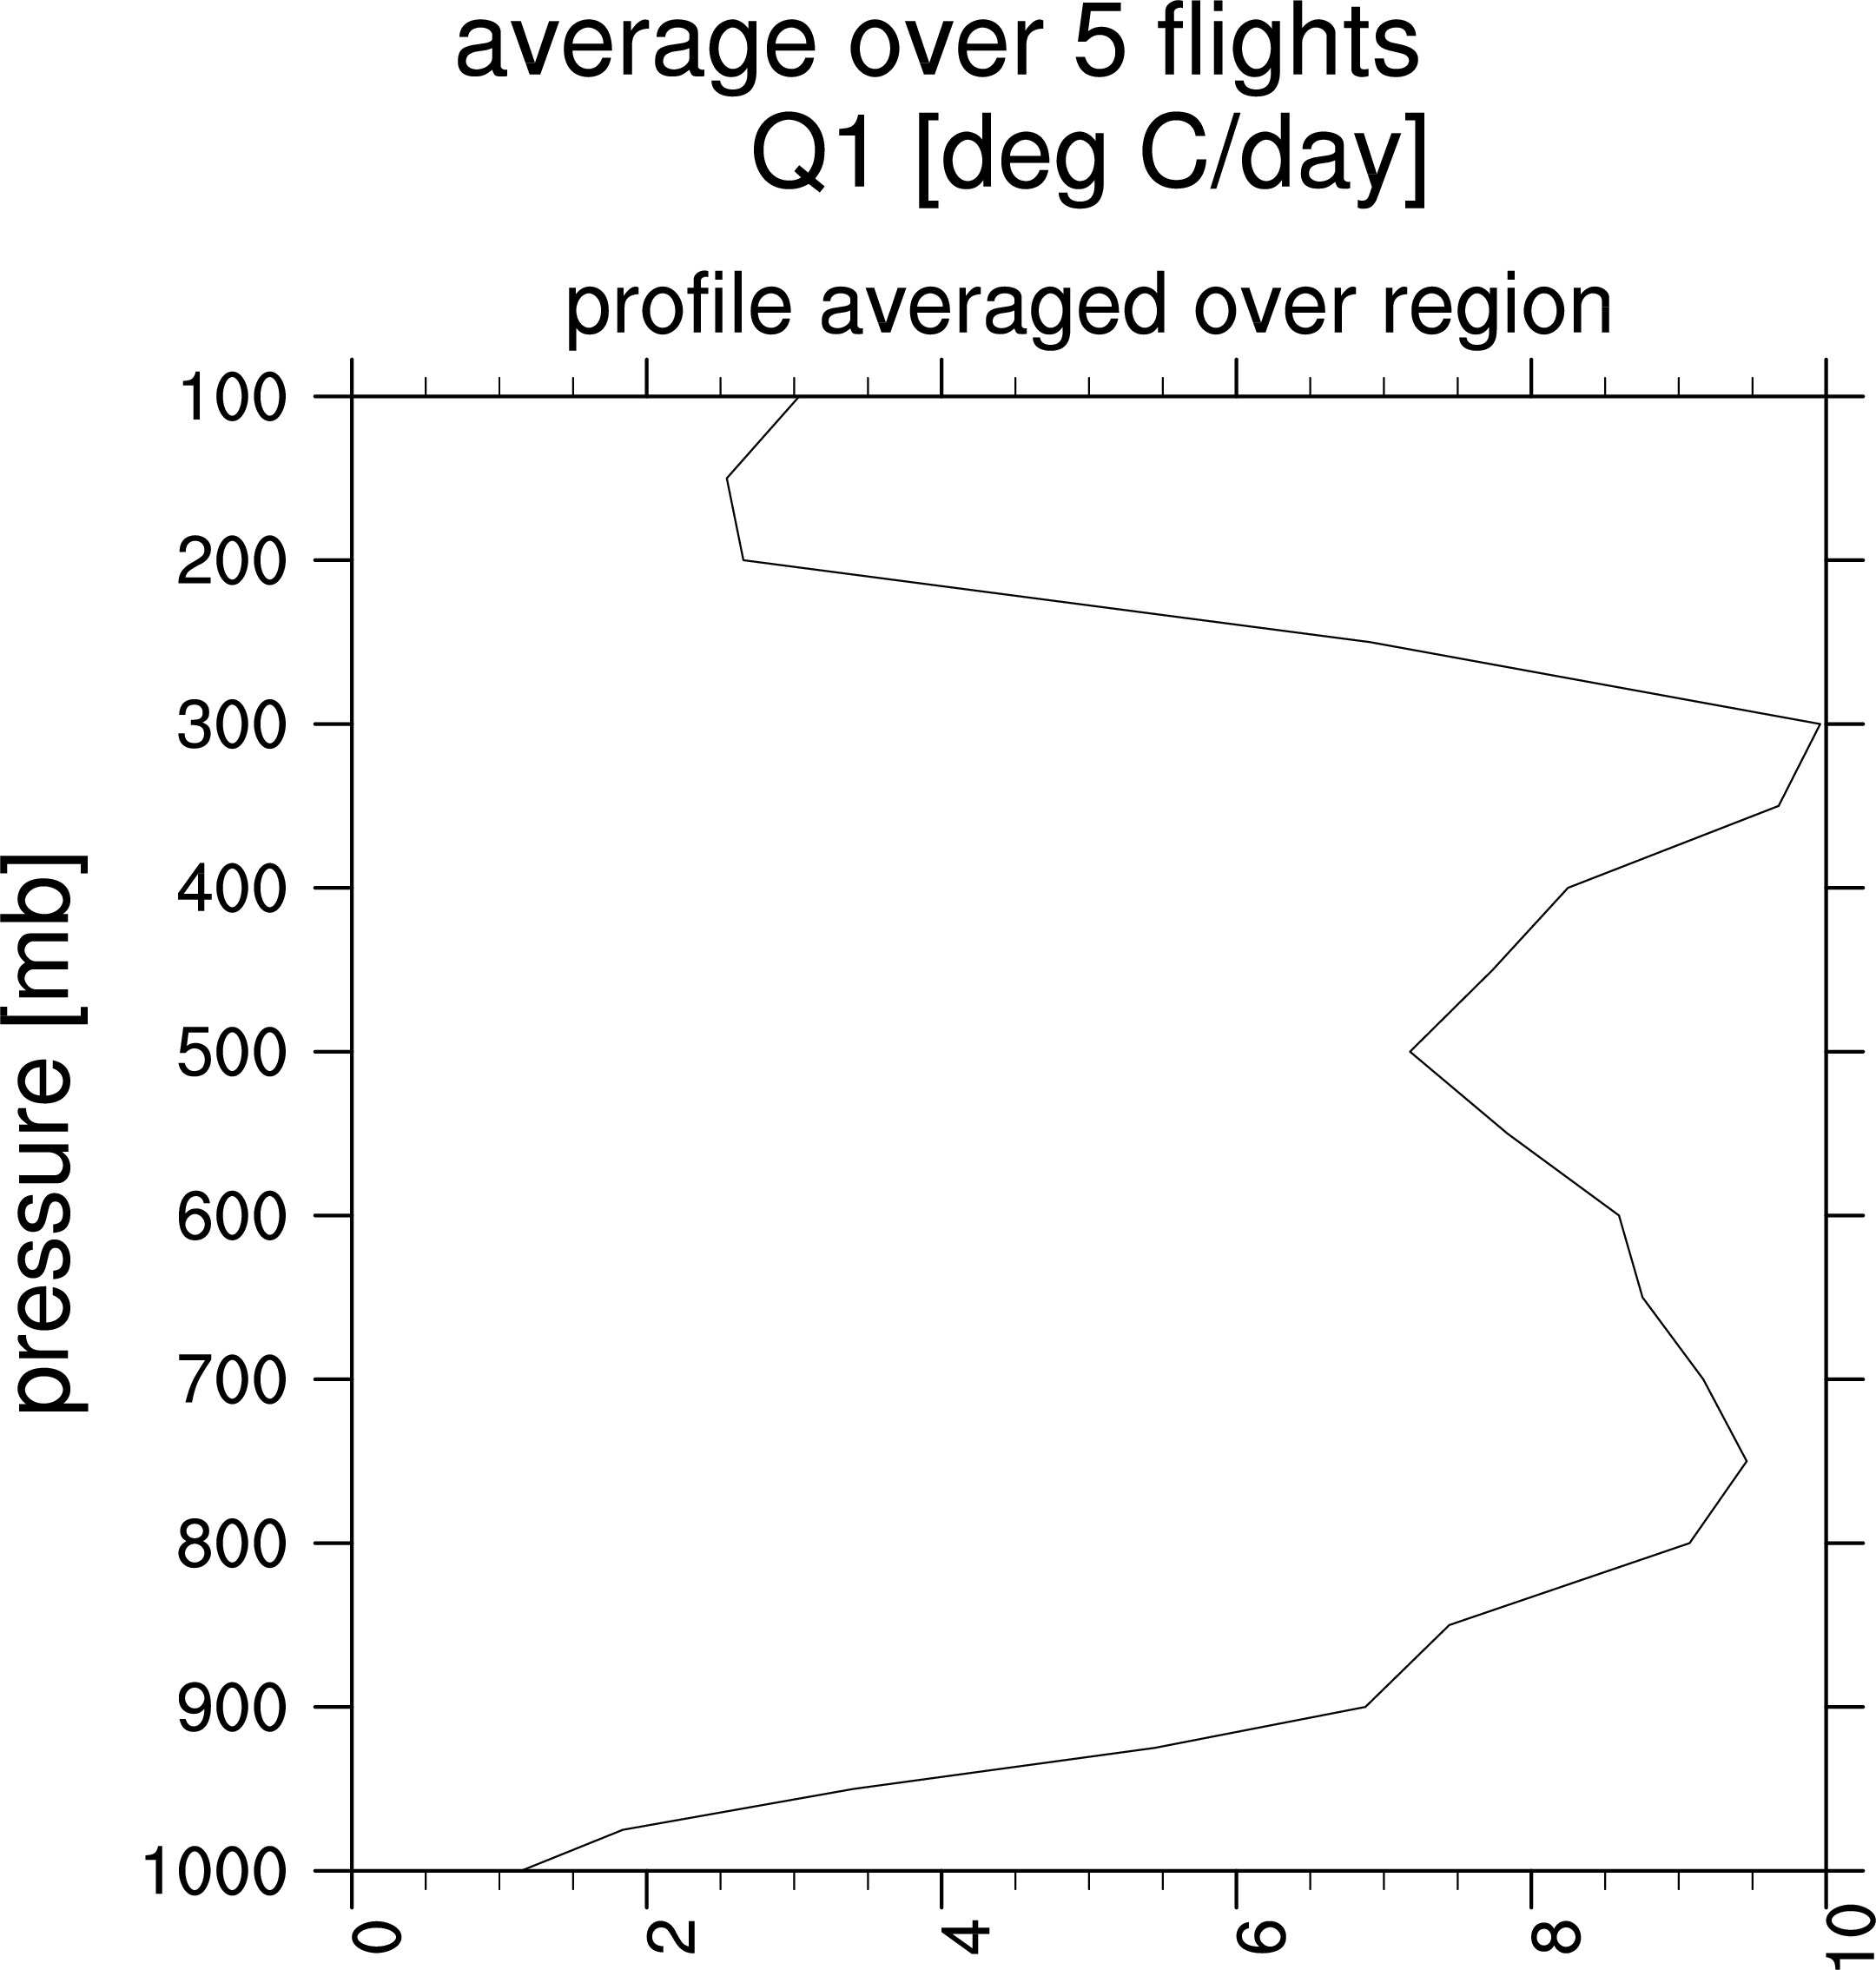
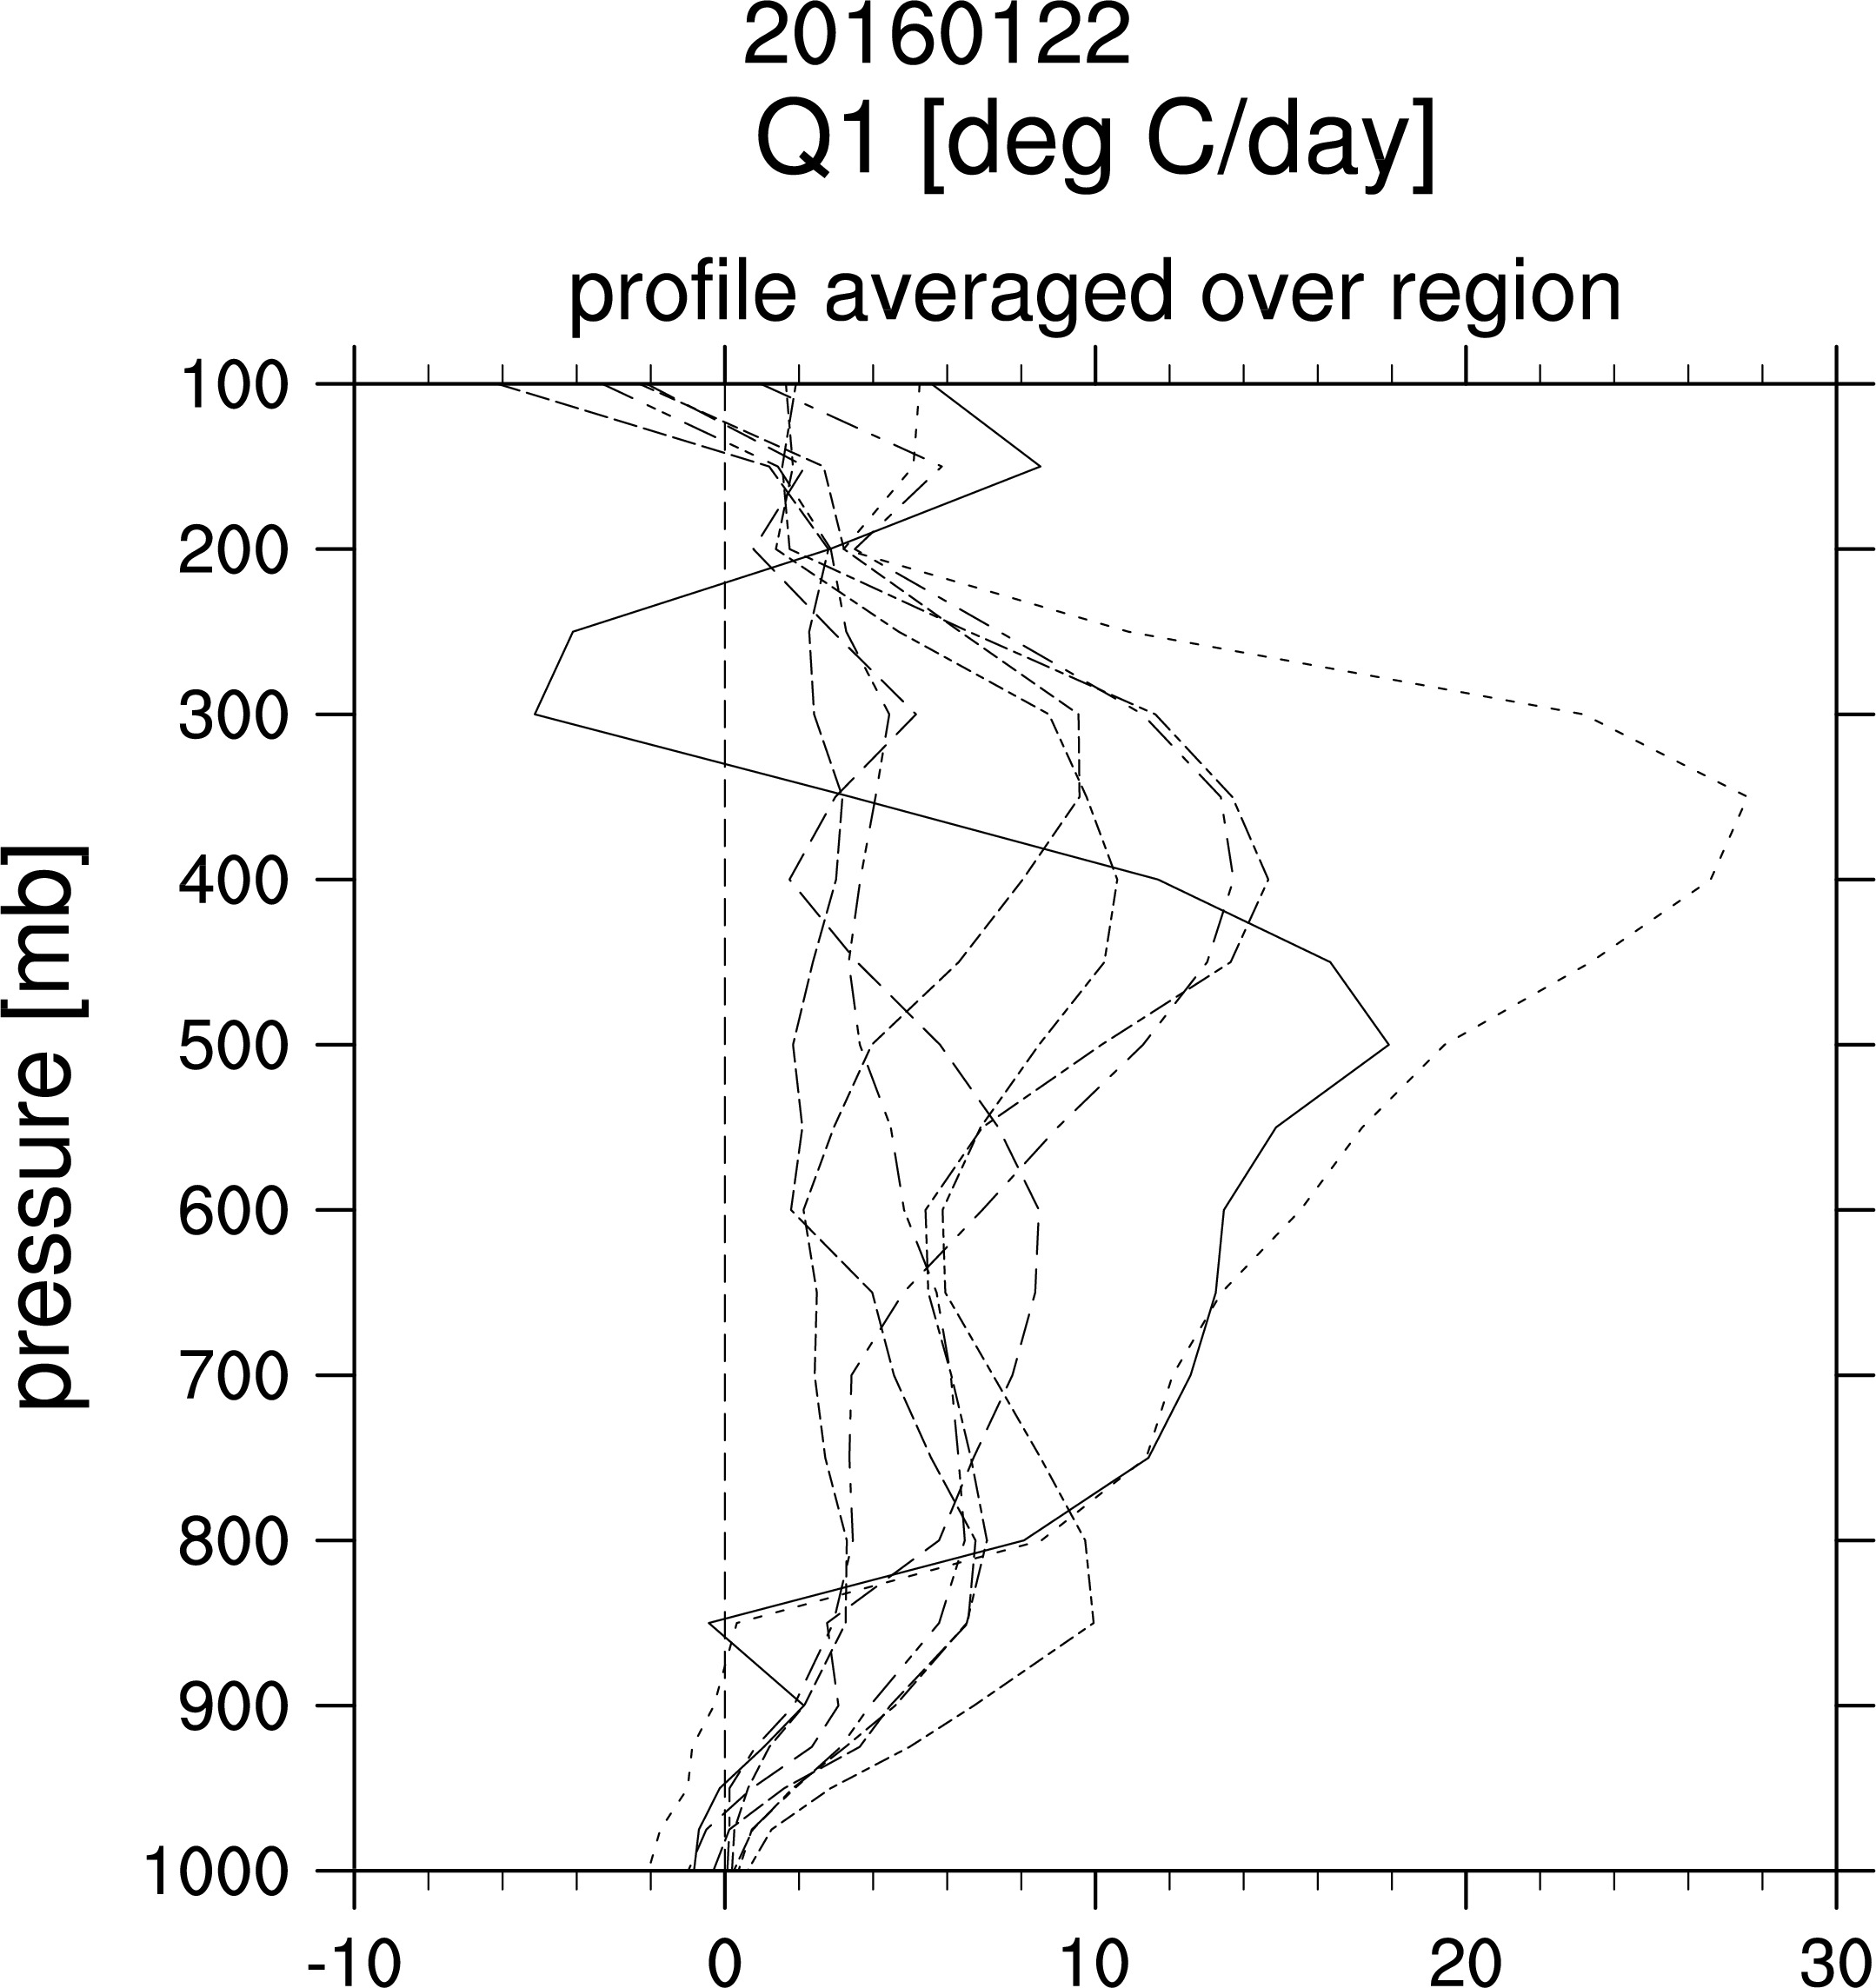
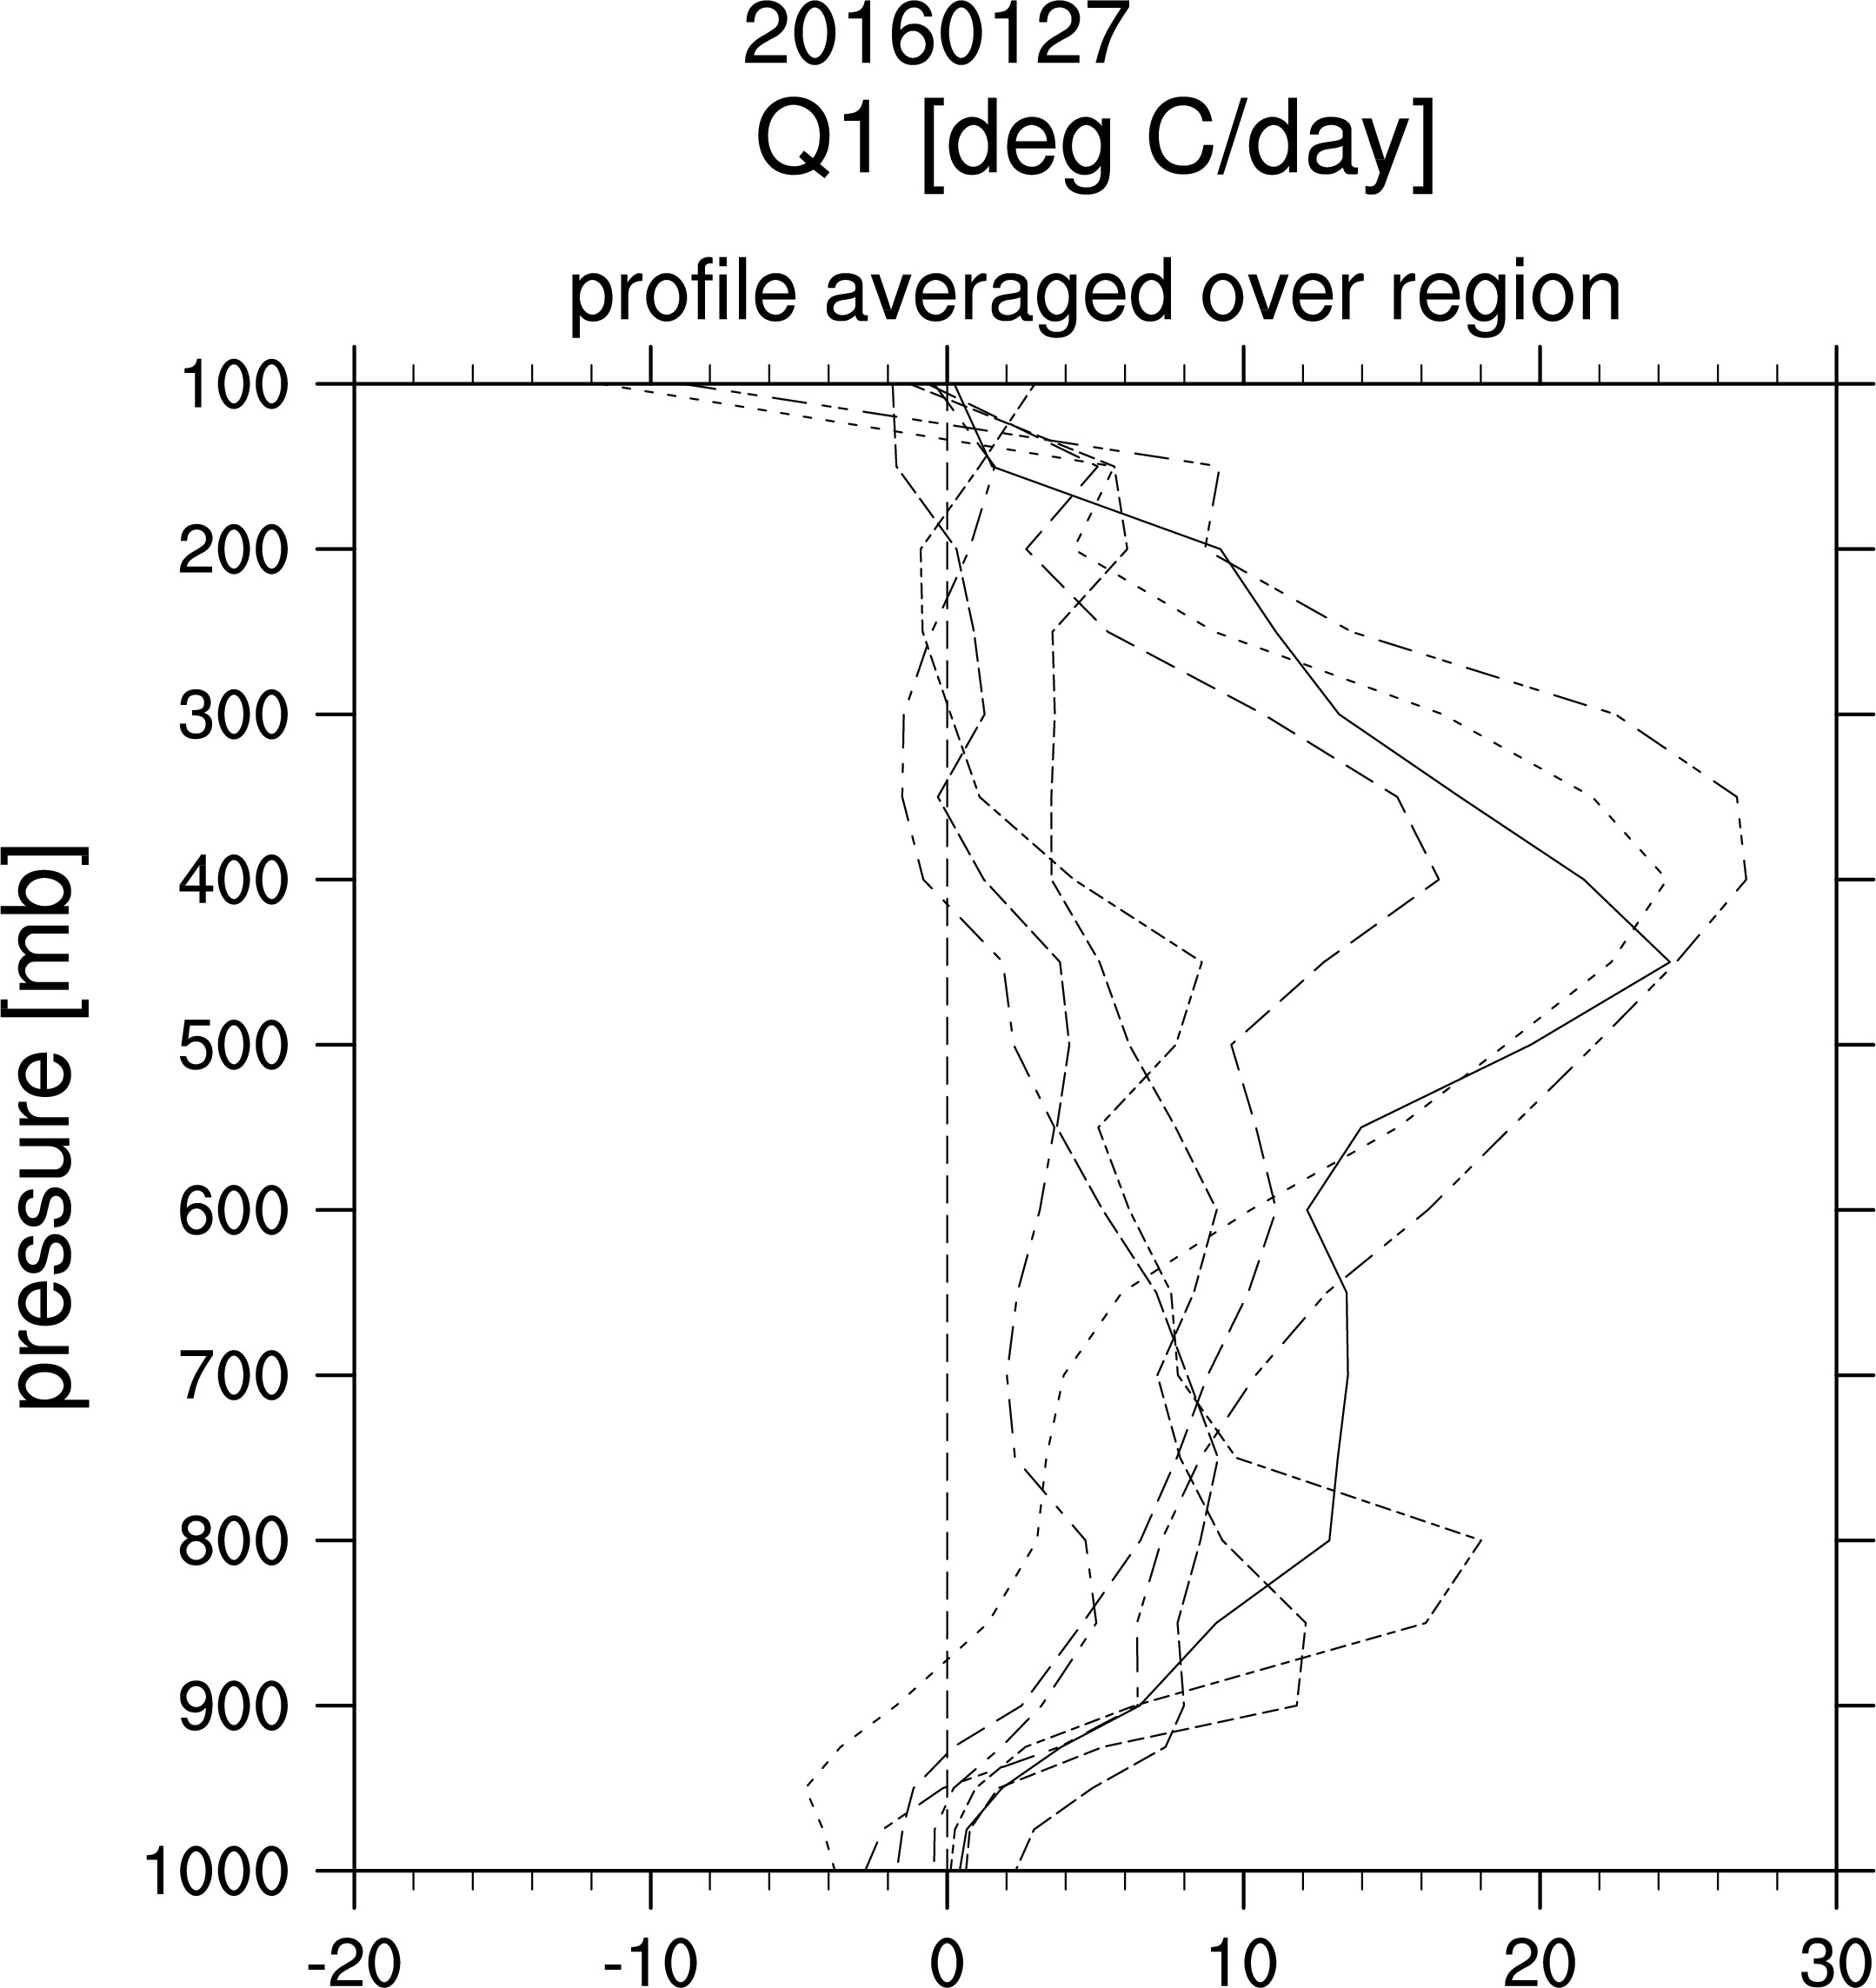
Re. Q1


Average over 5 flights:
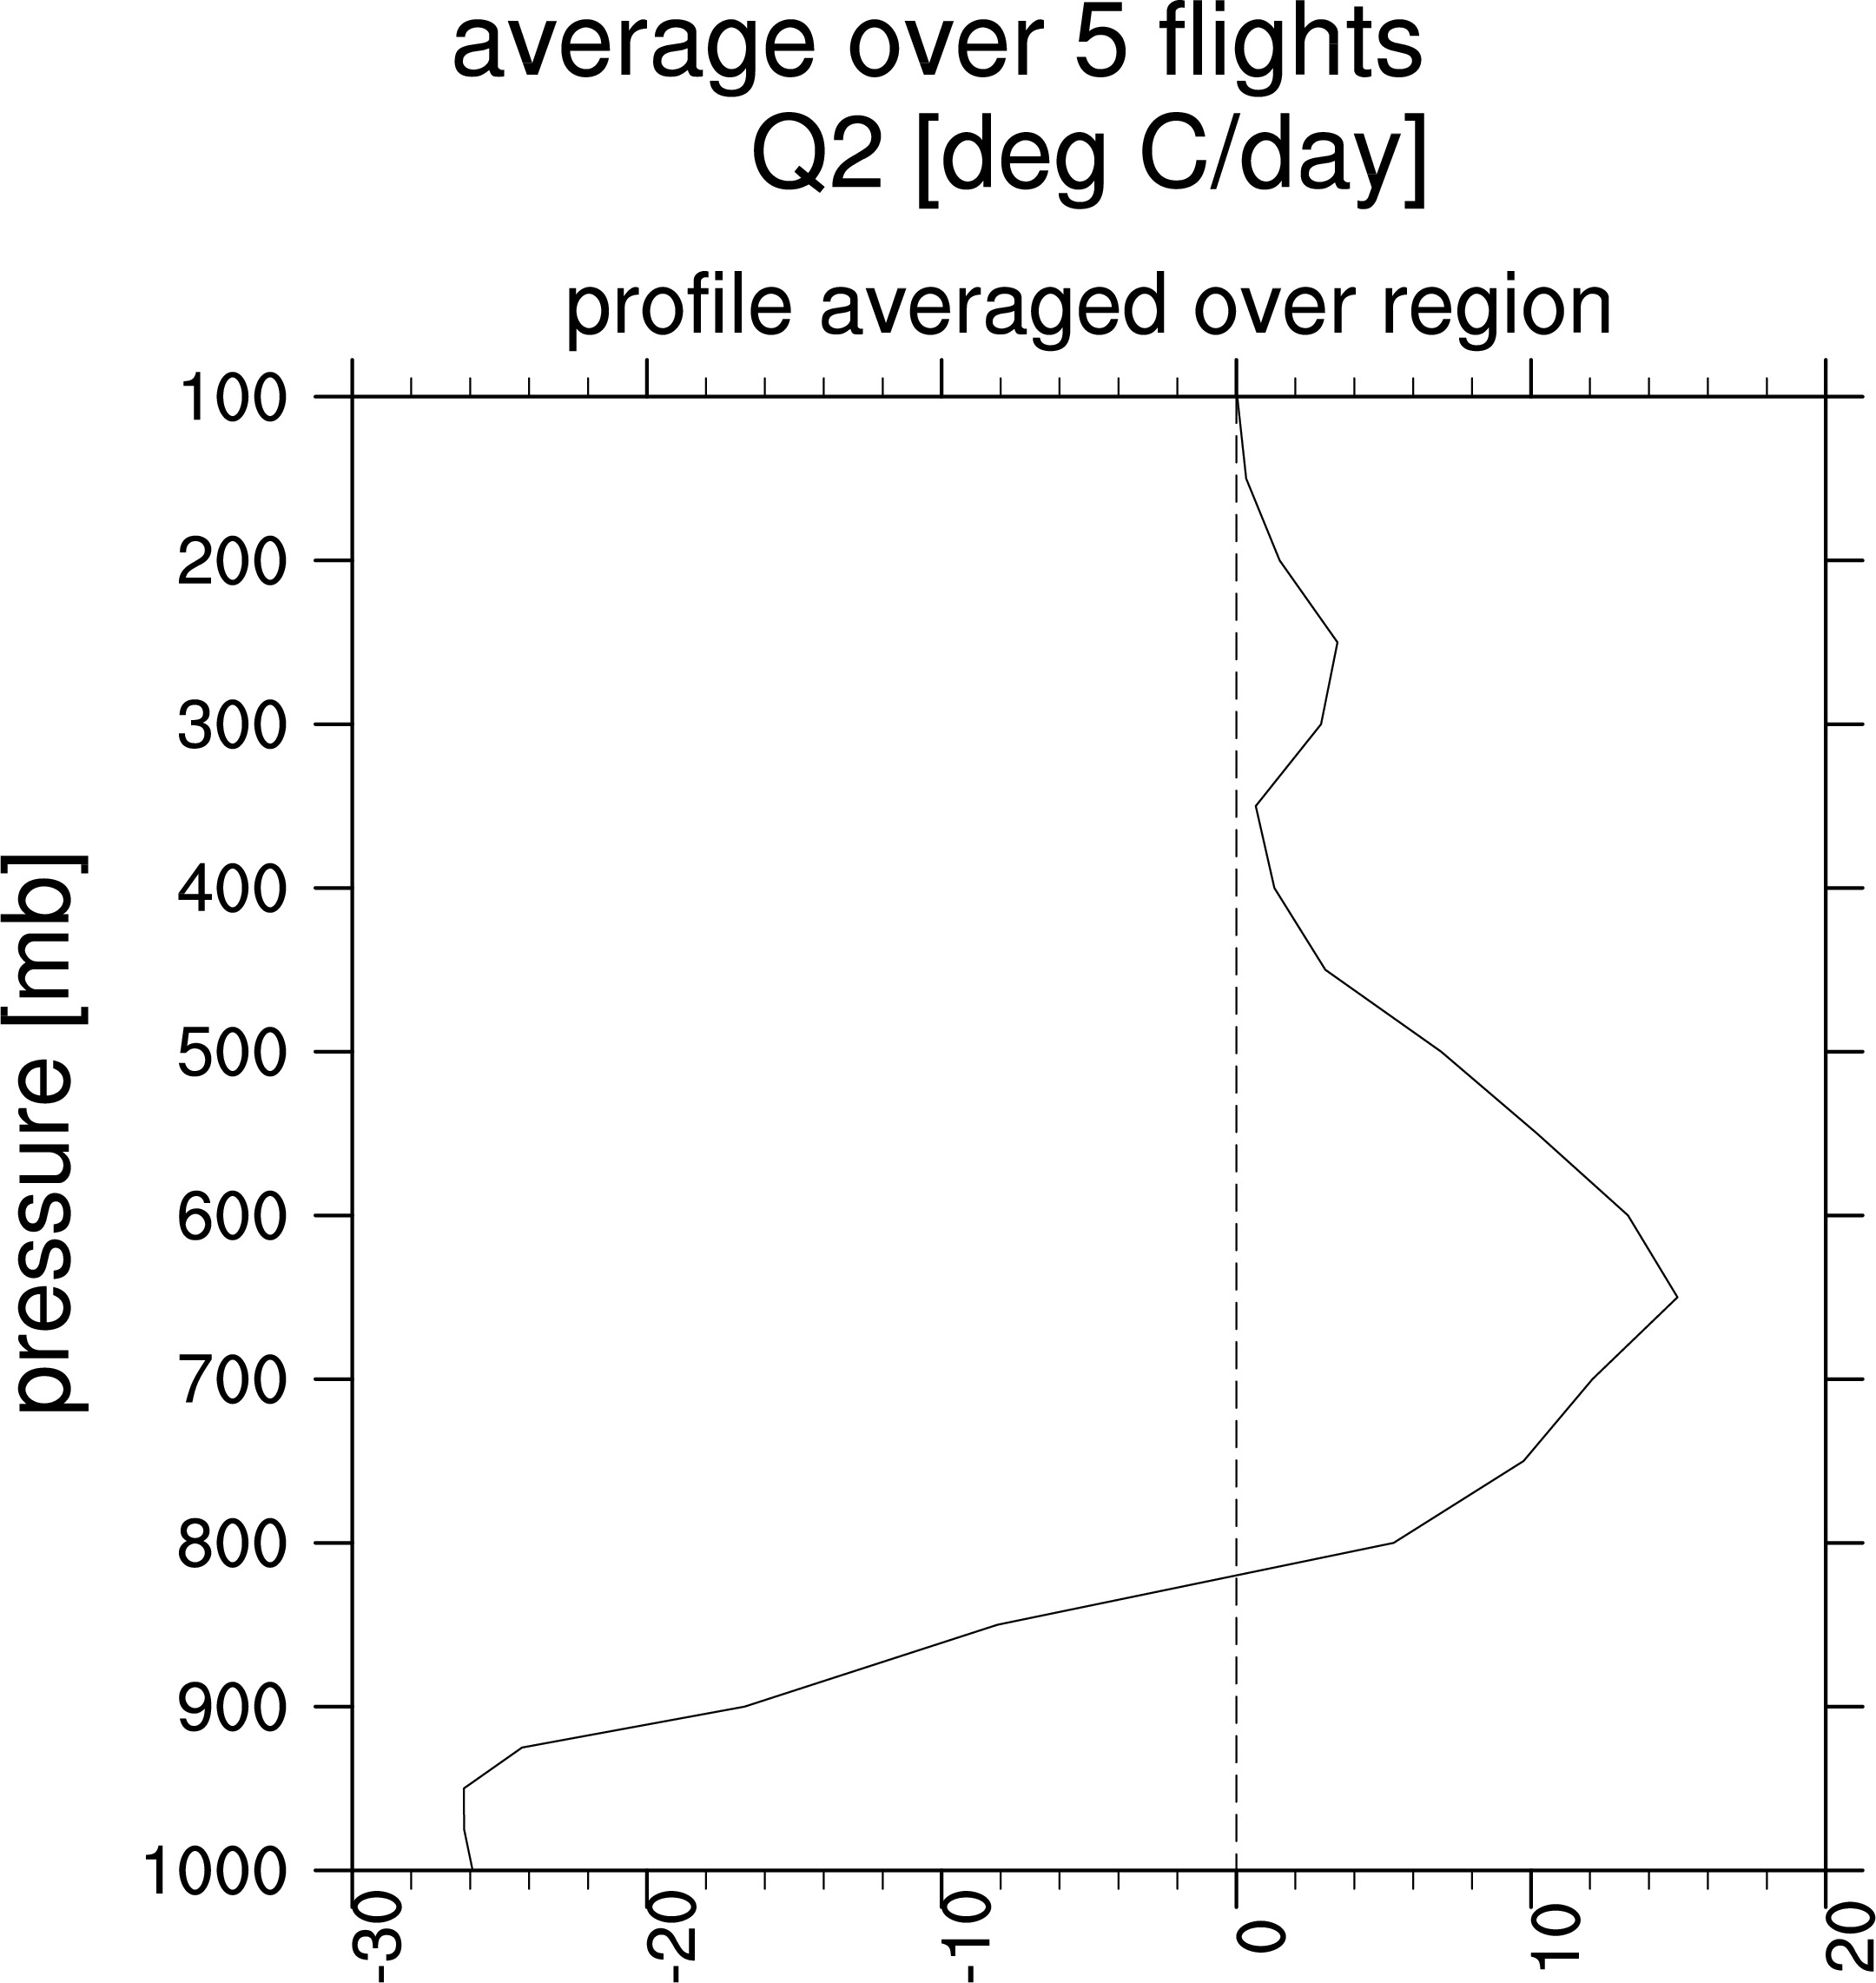
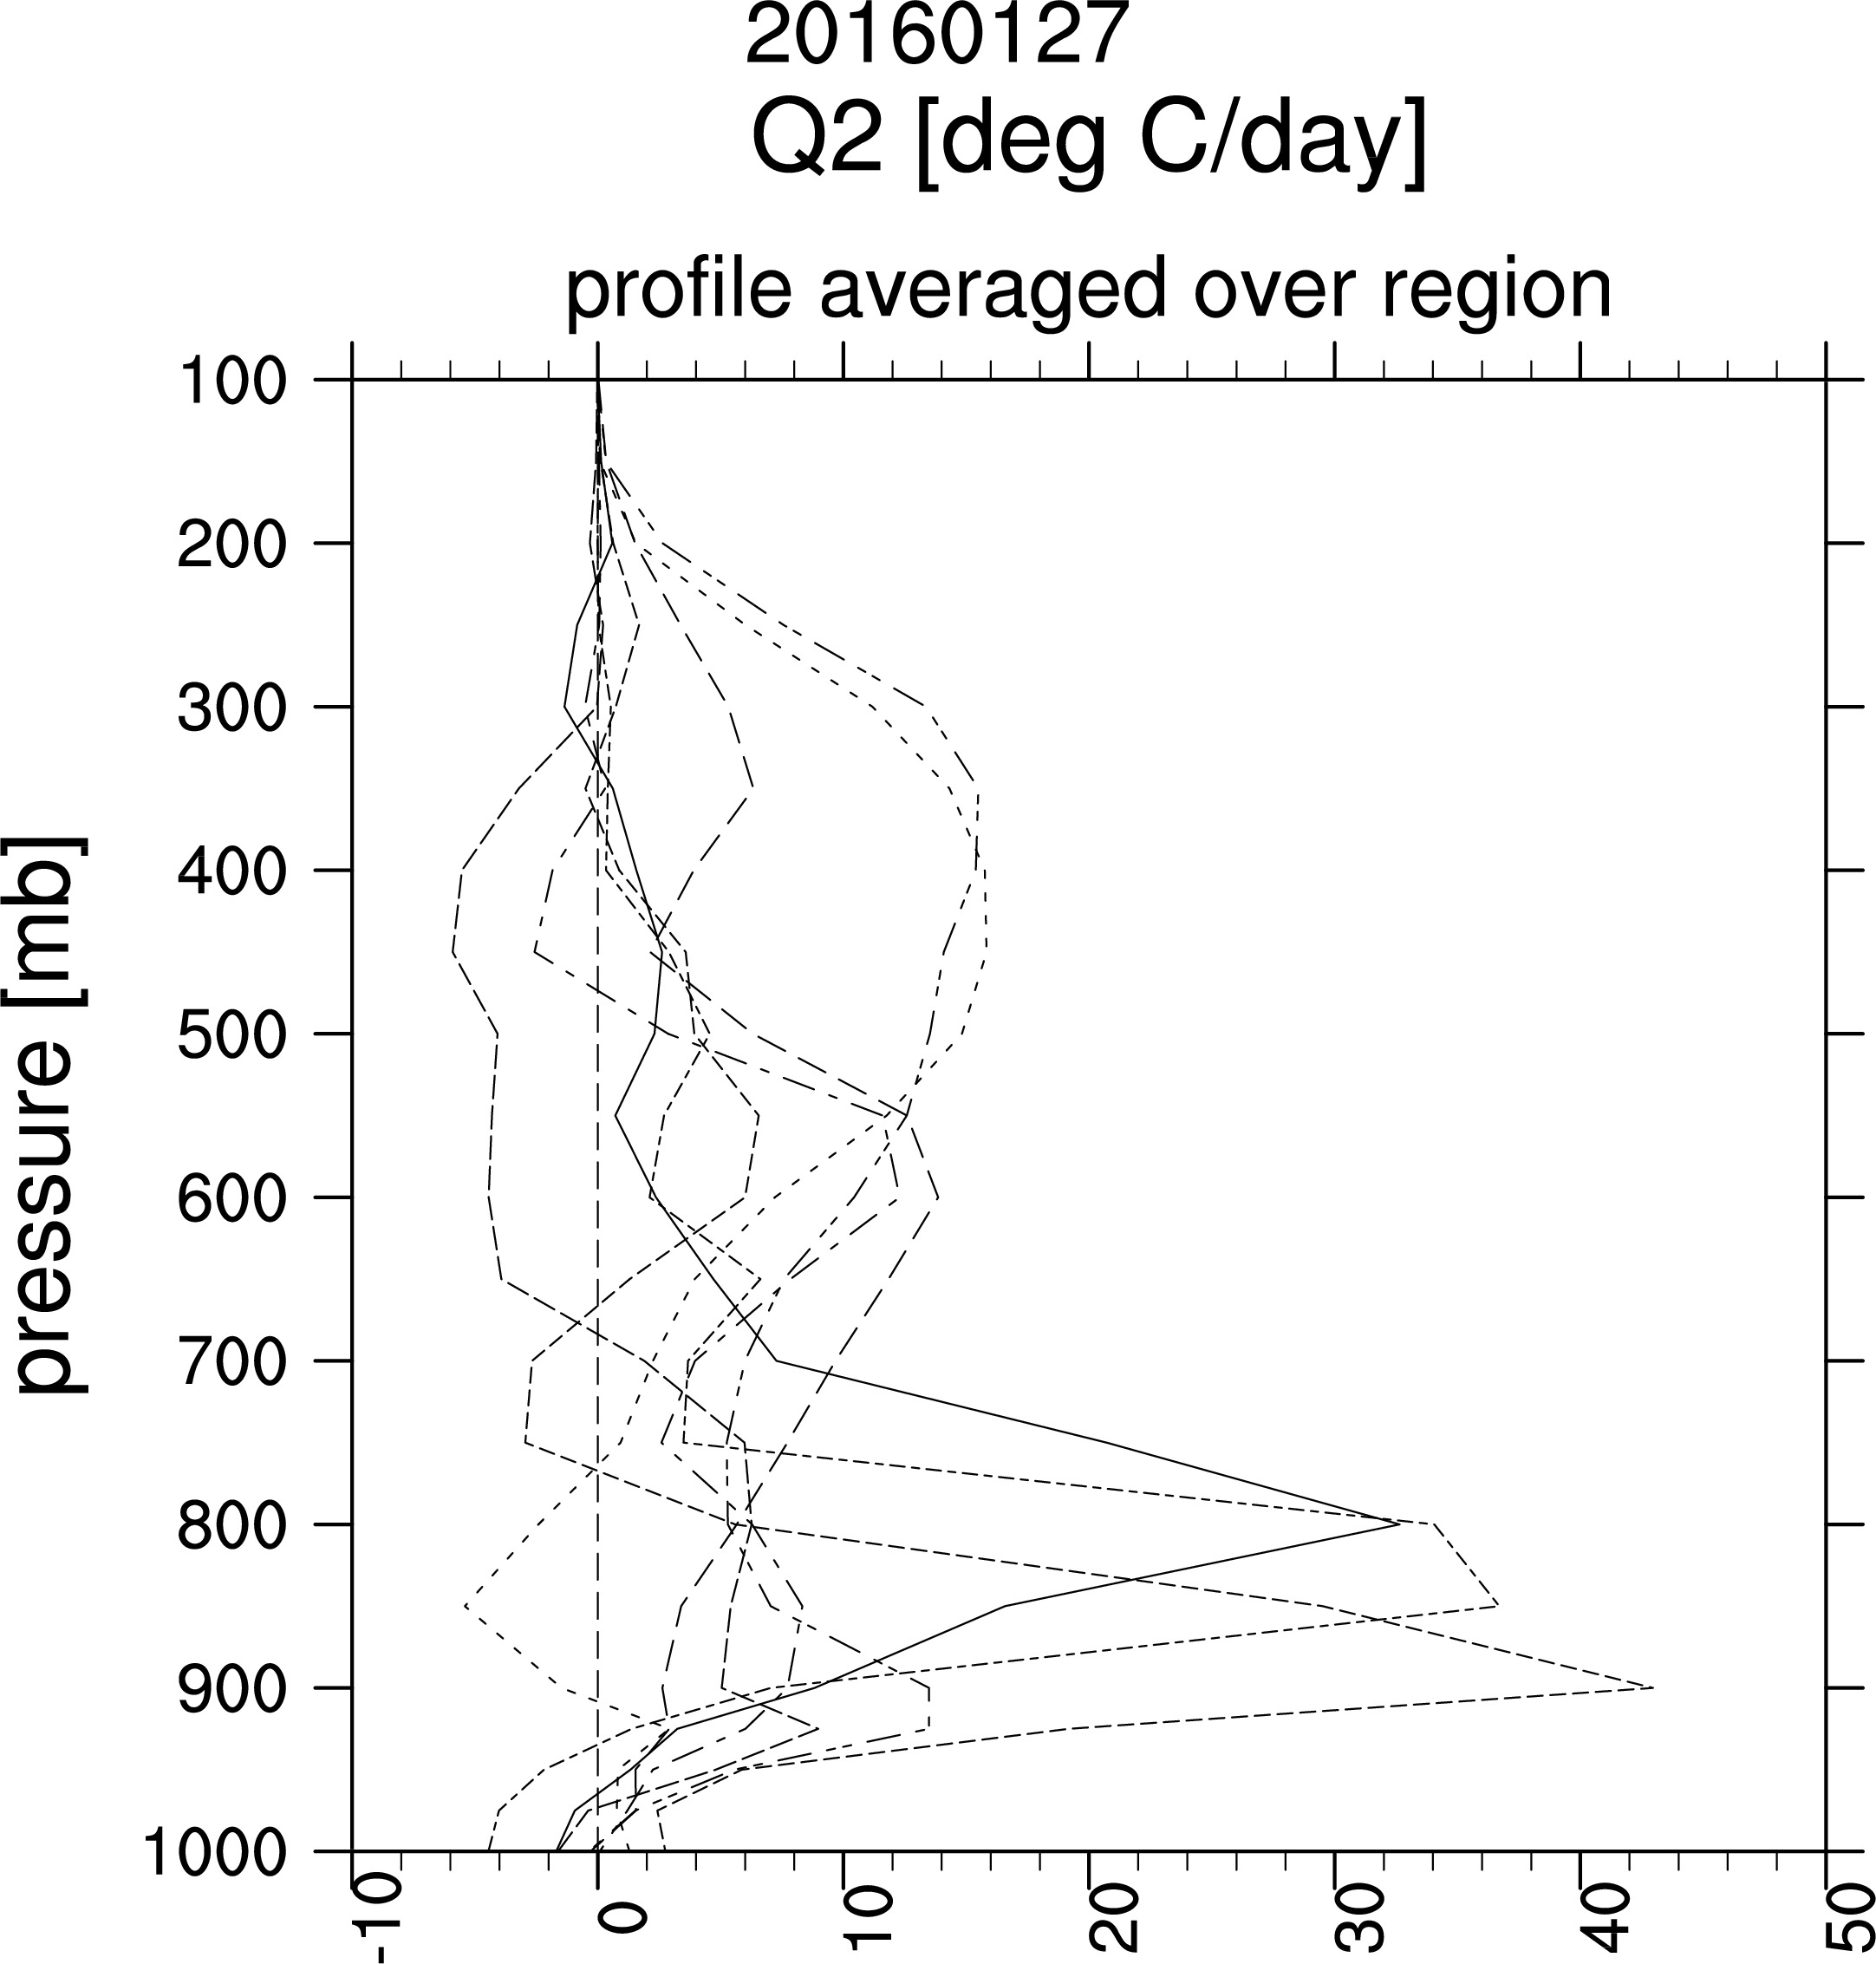
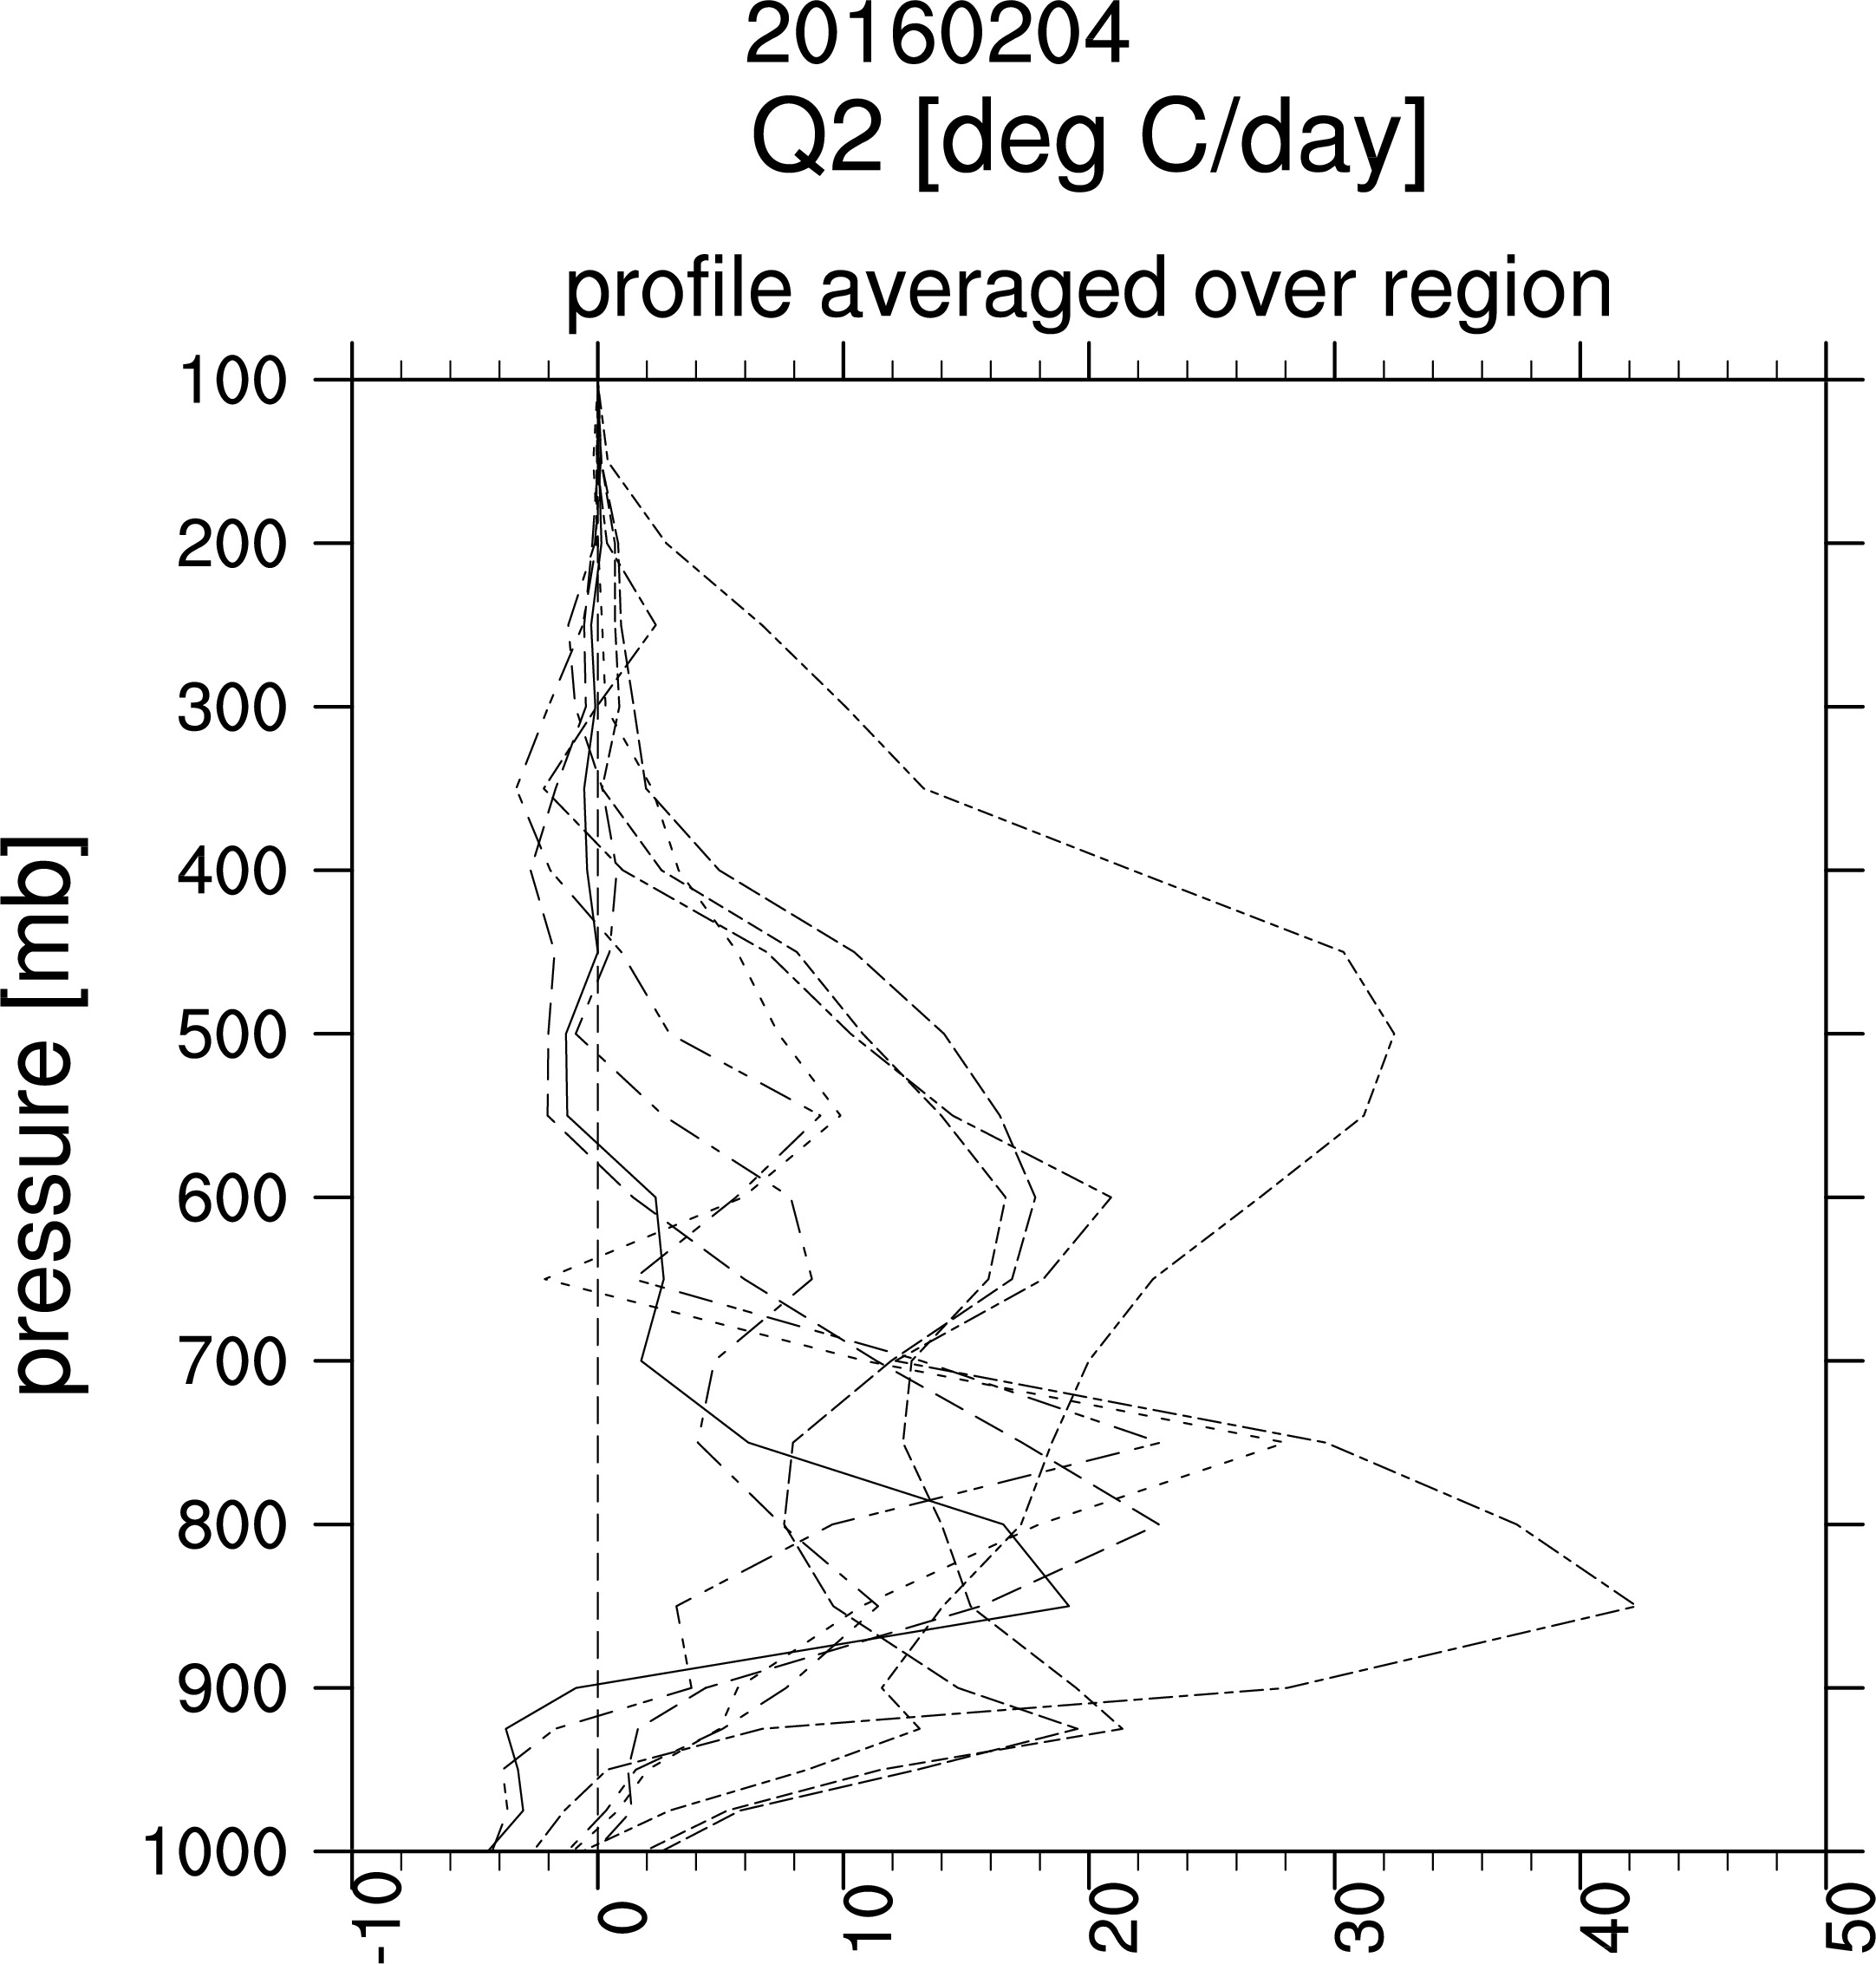
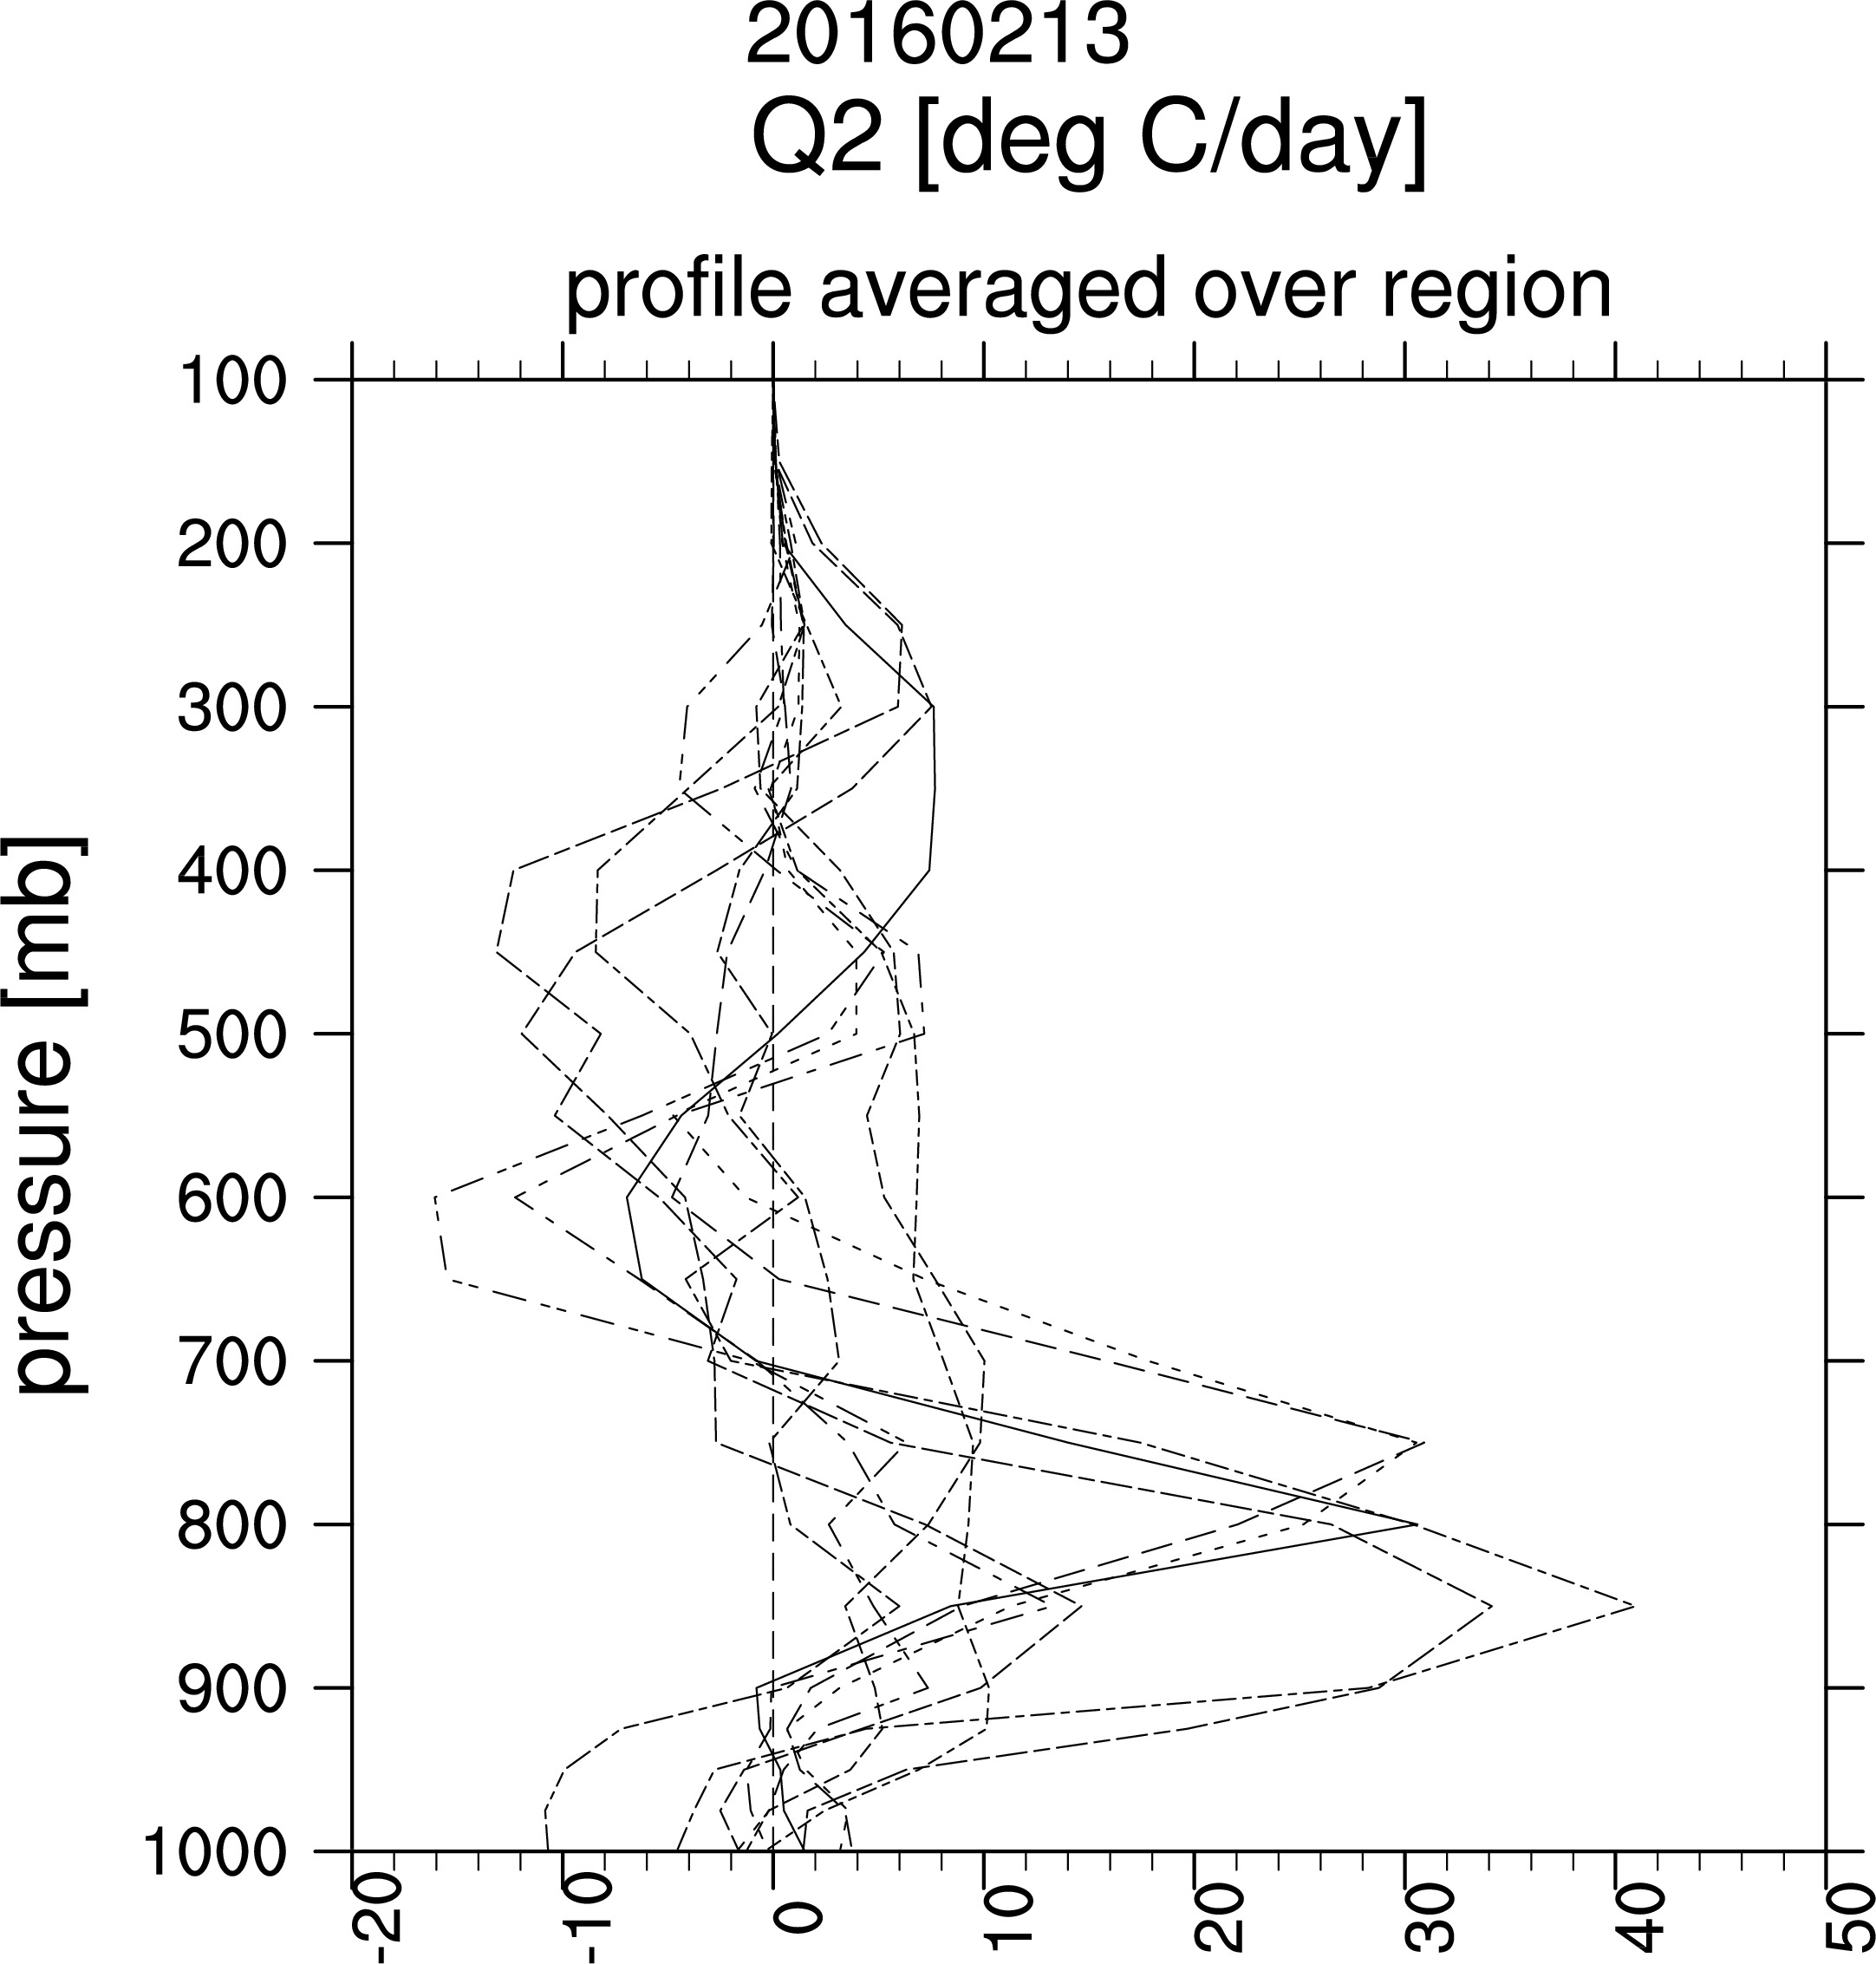
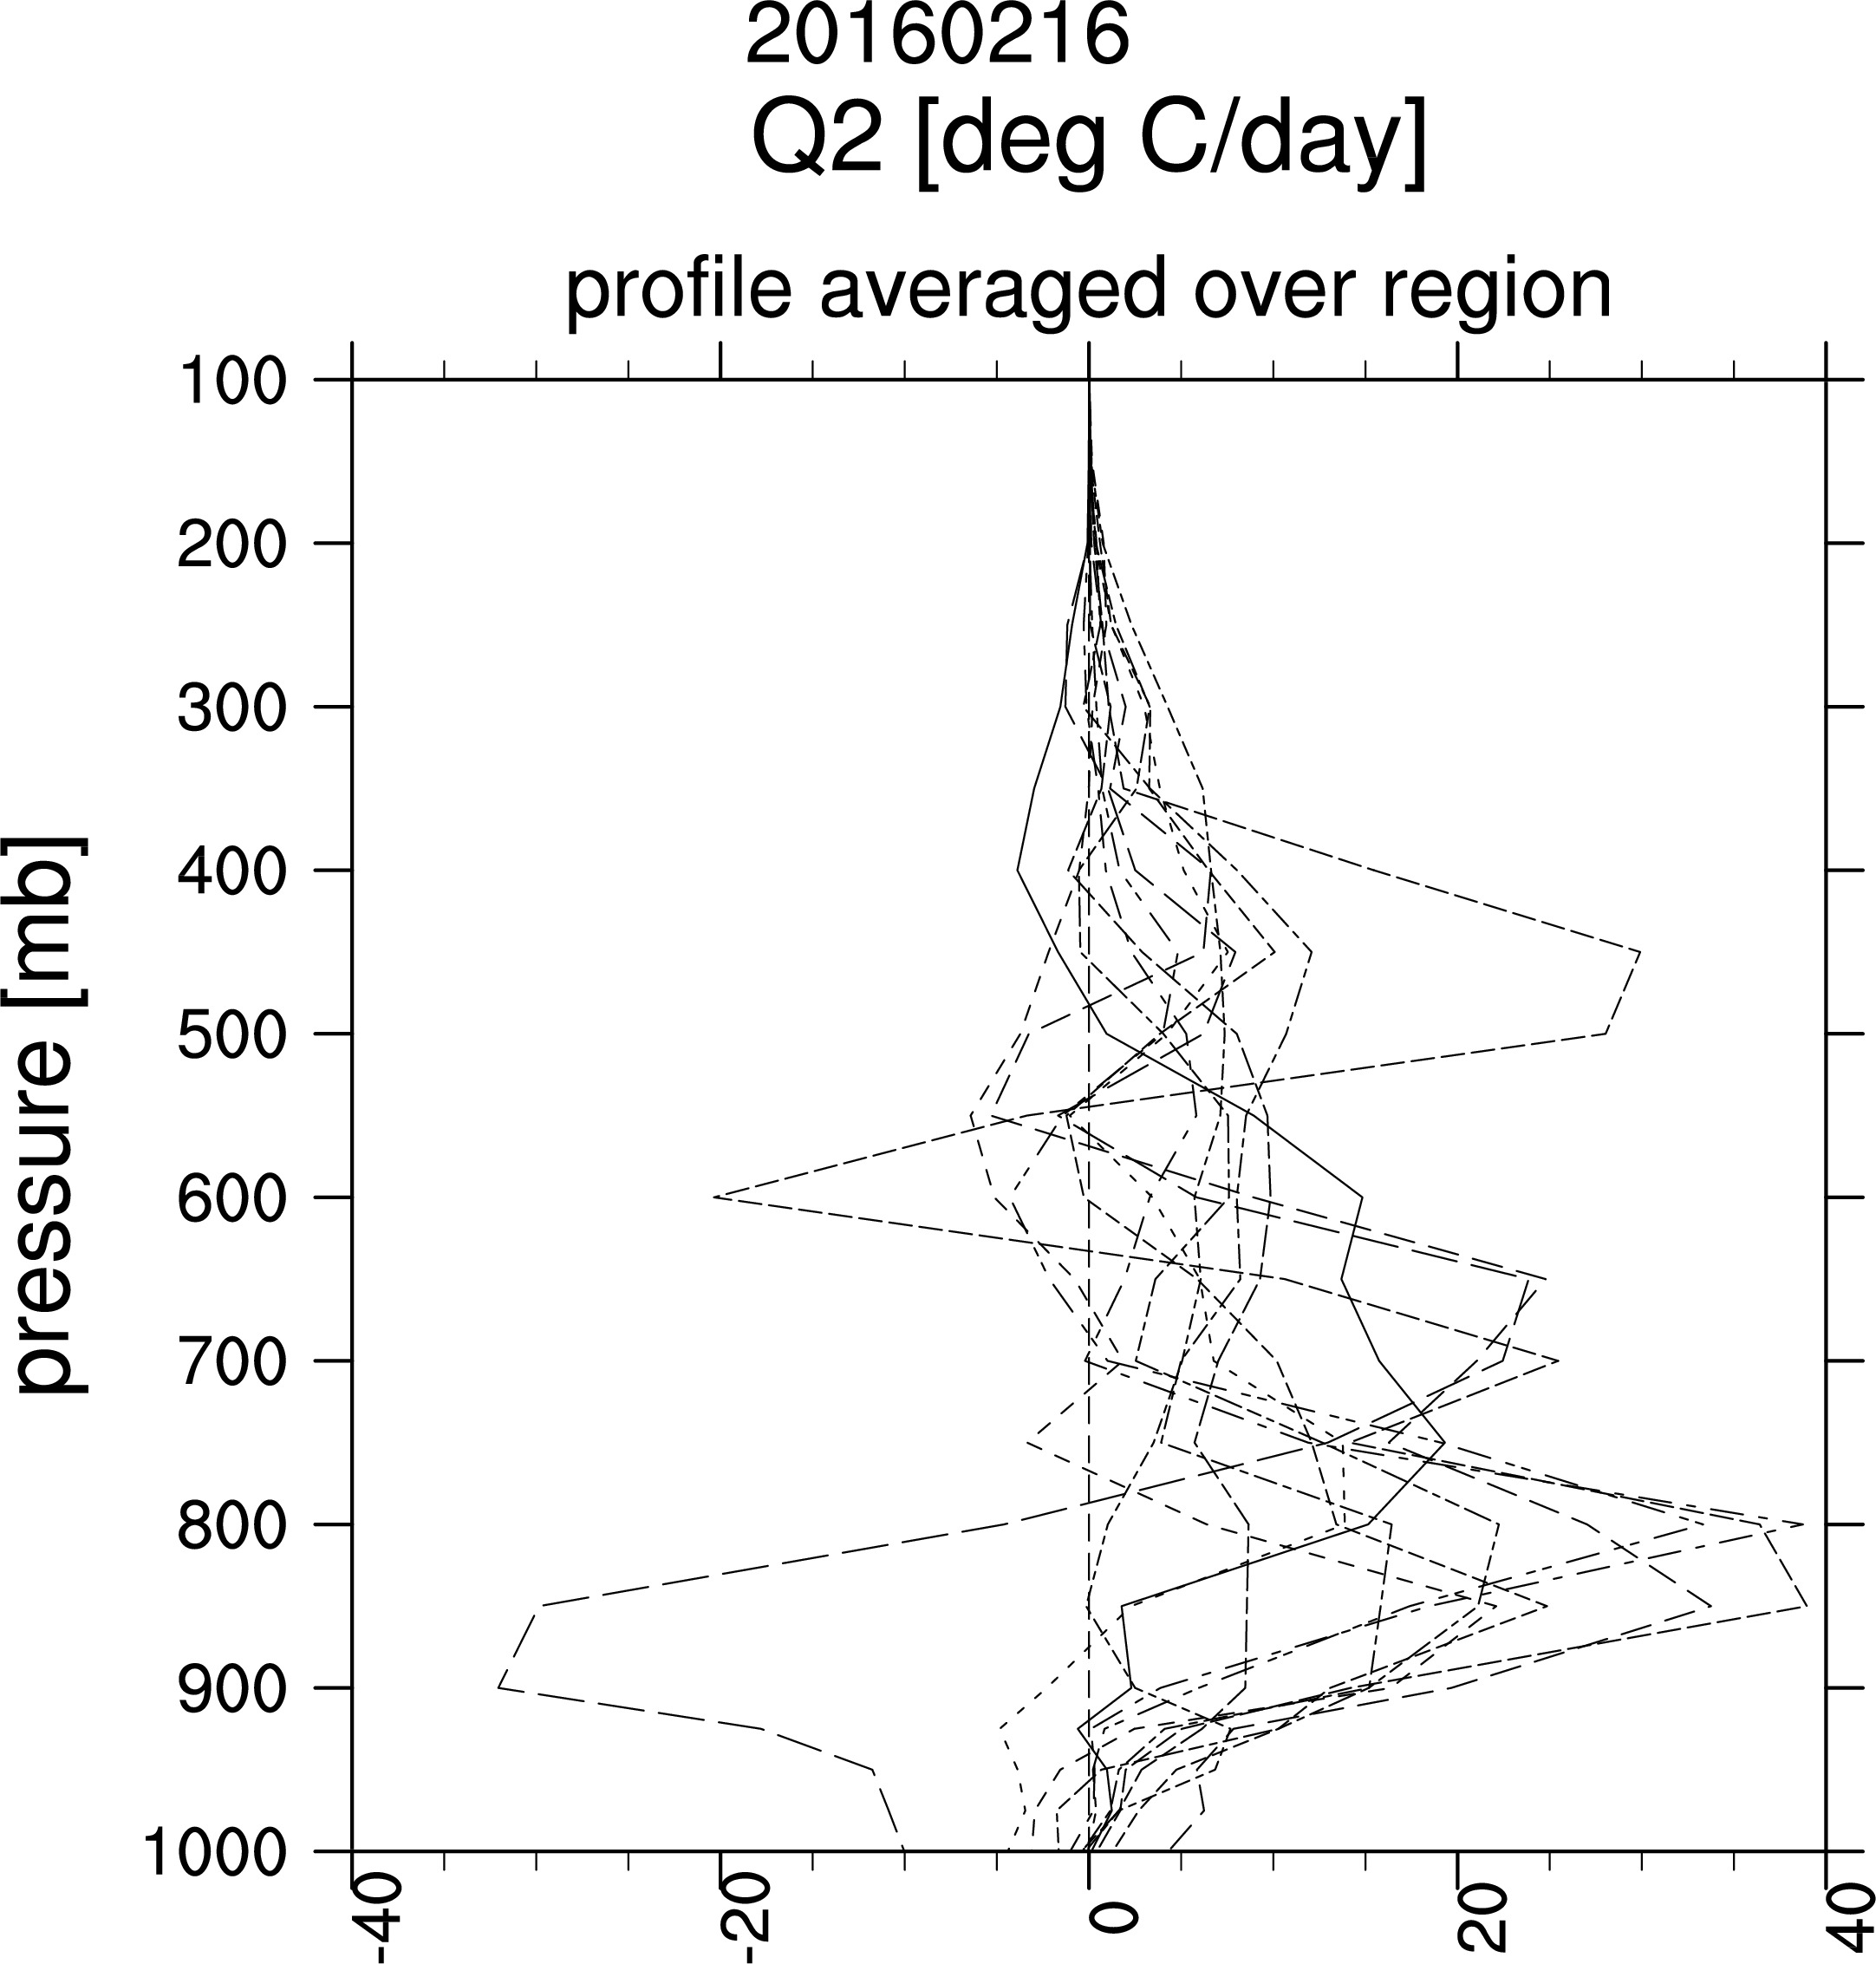
Re. Q2


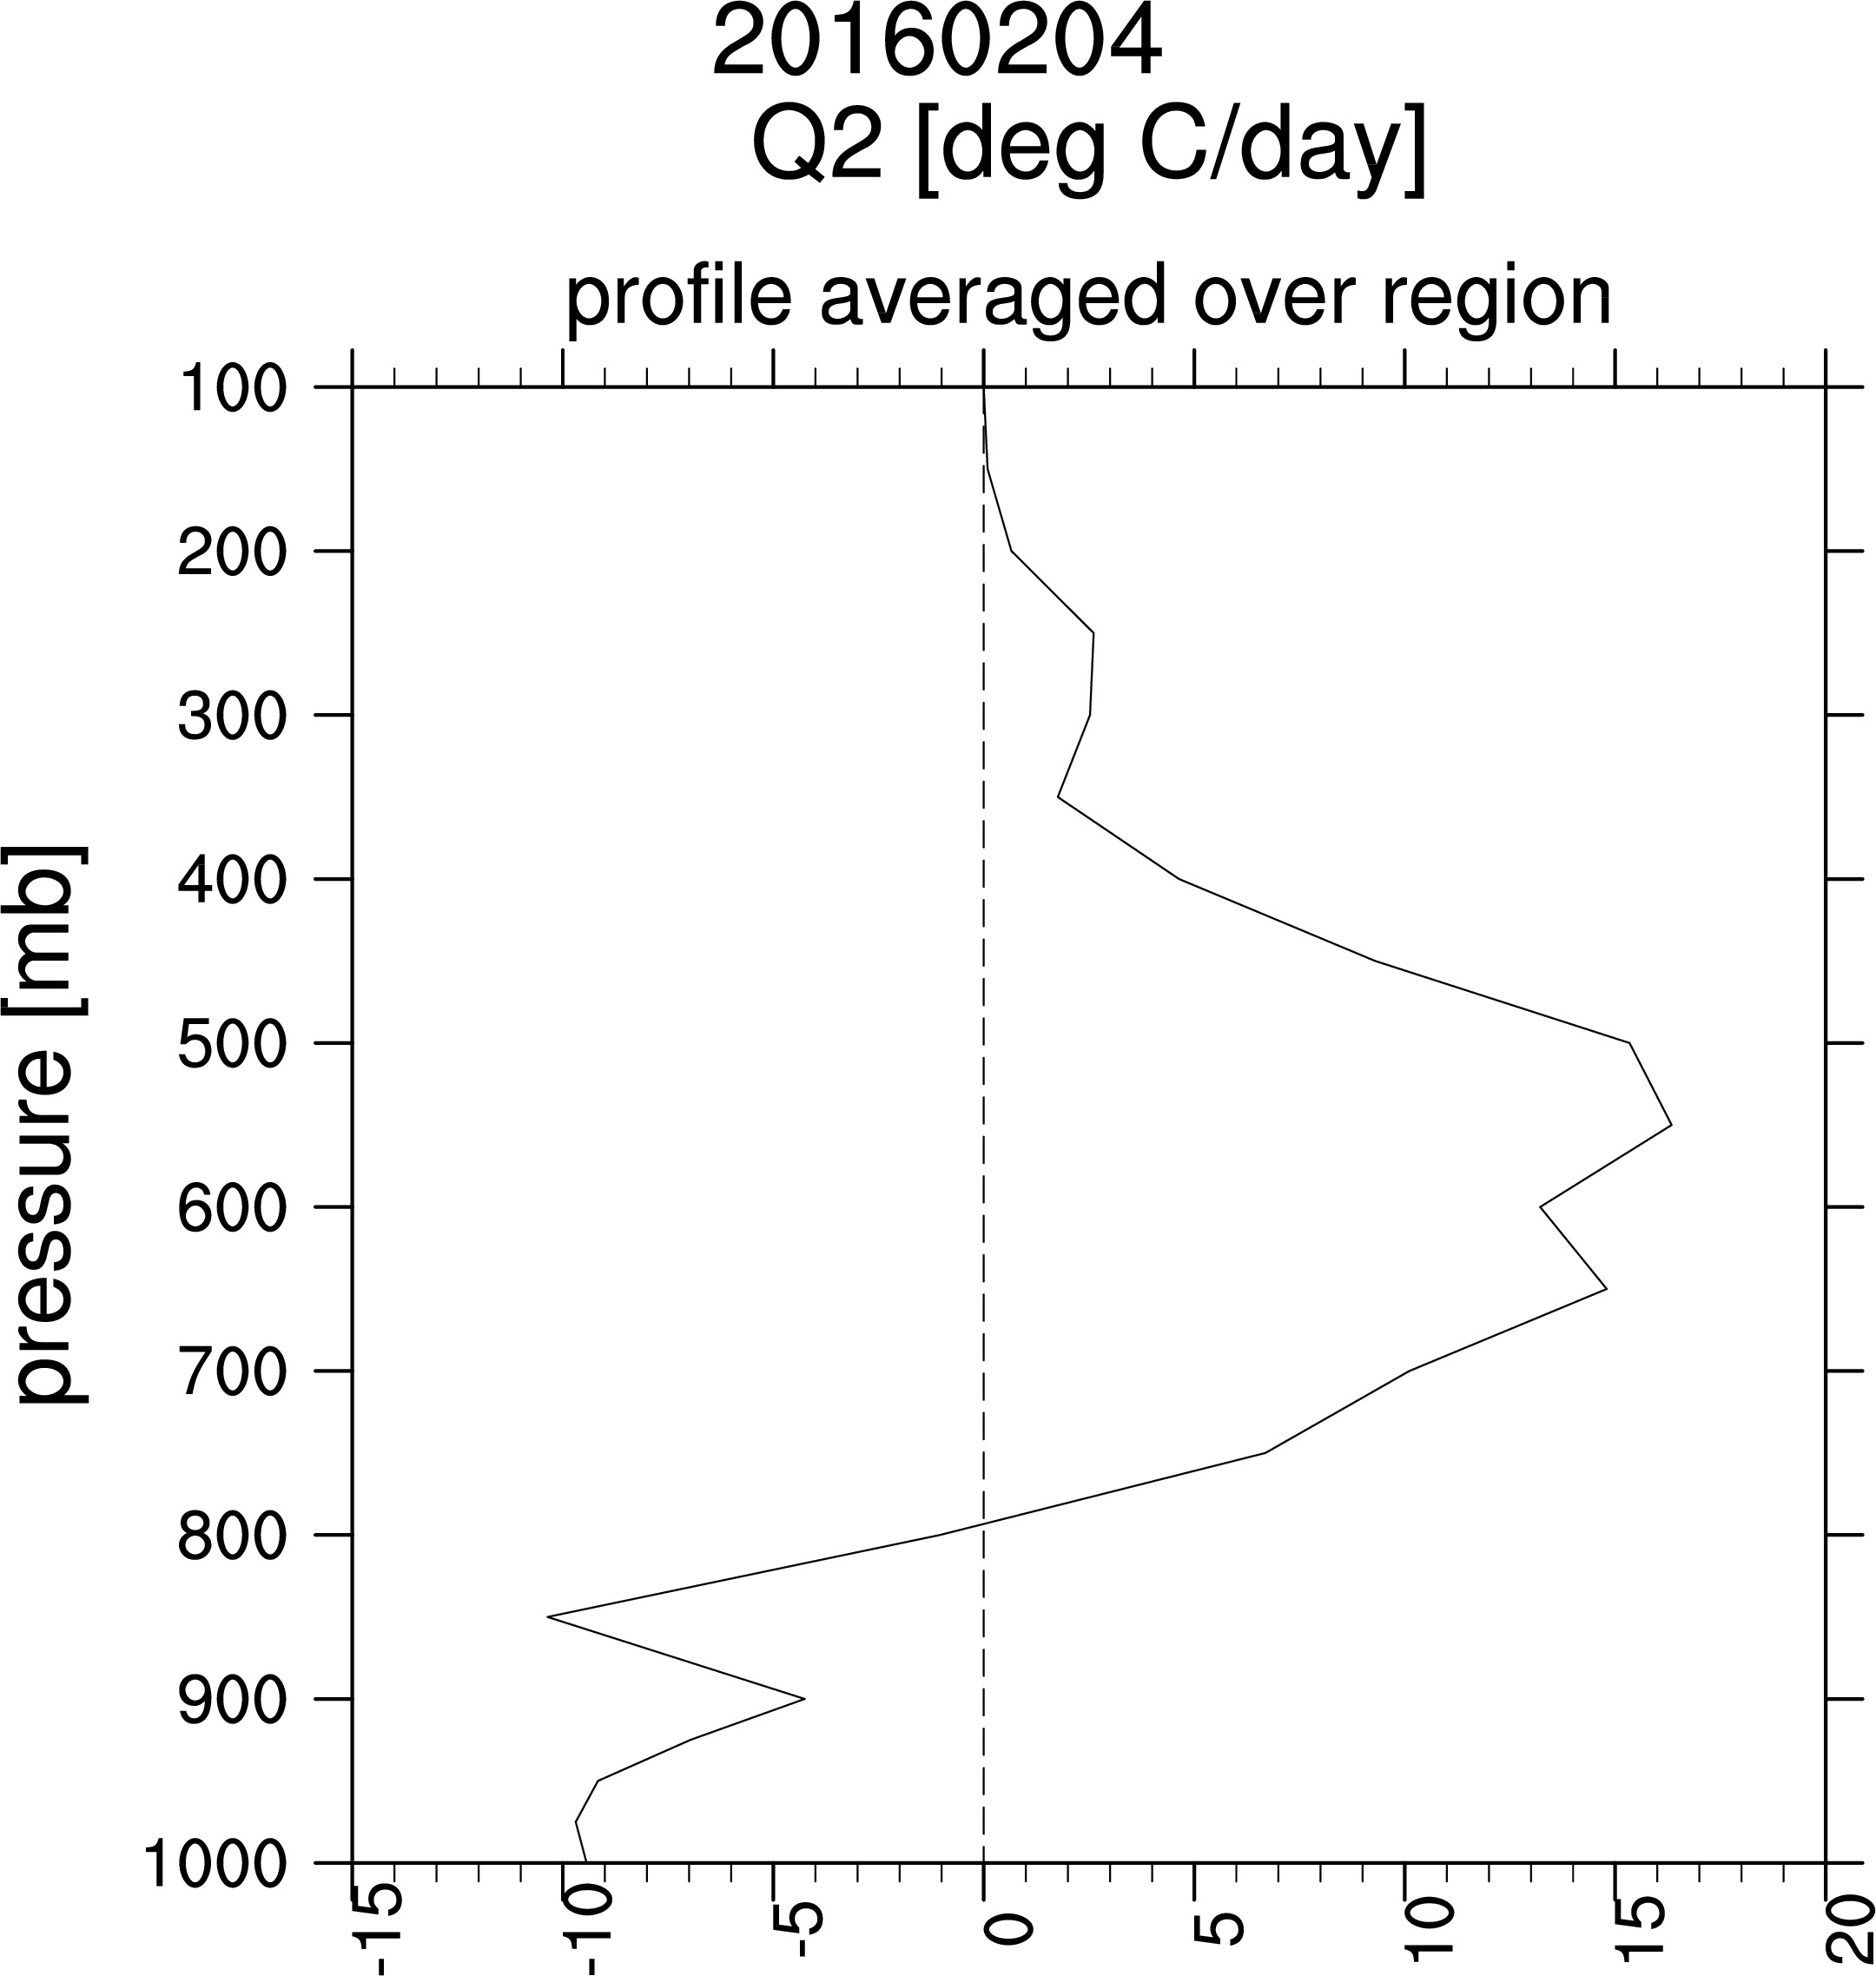


Average over 5 flights:
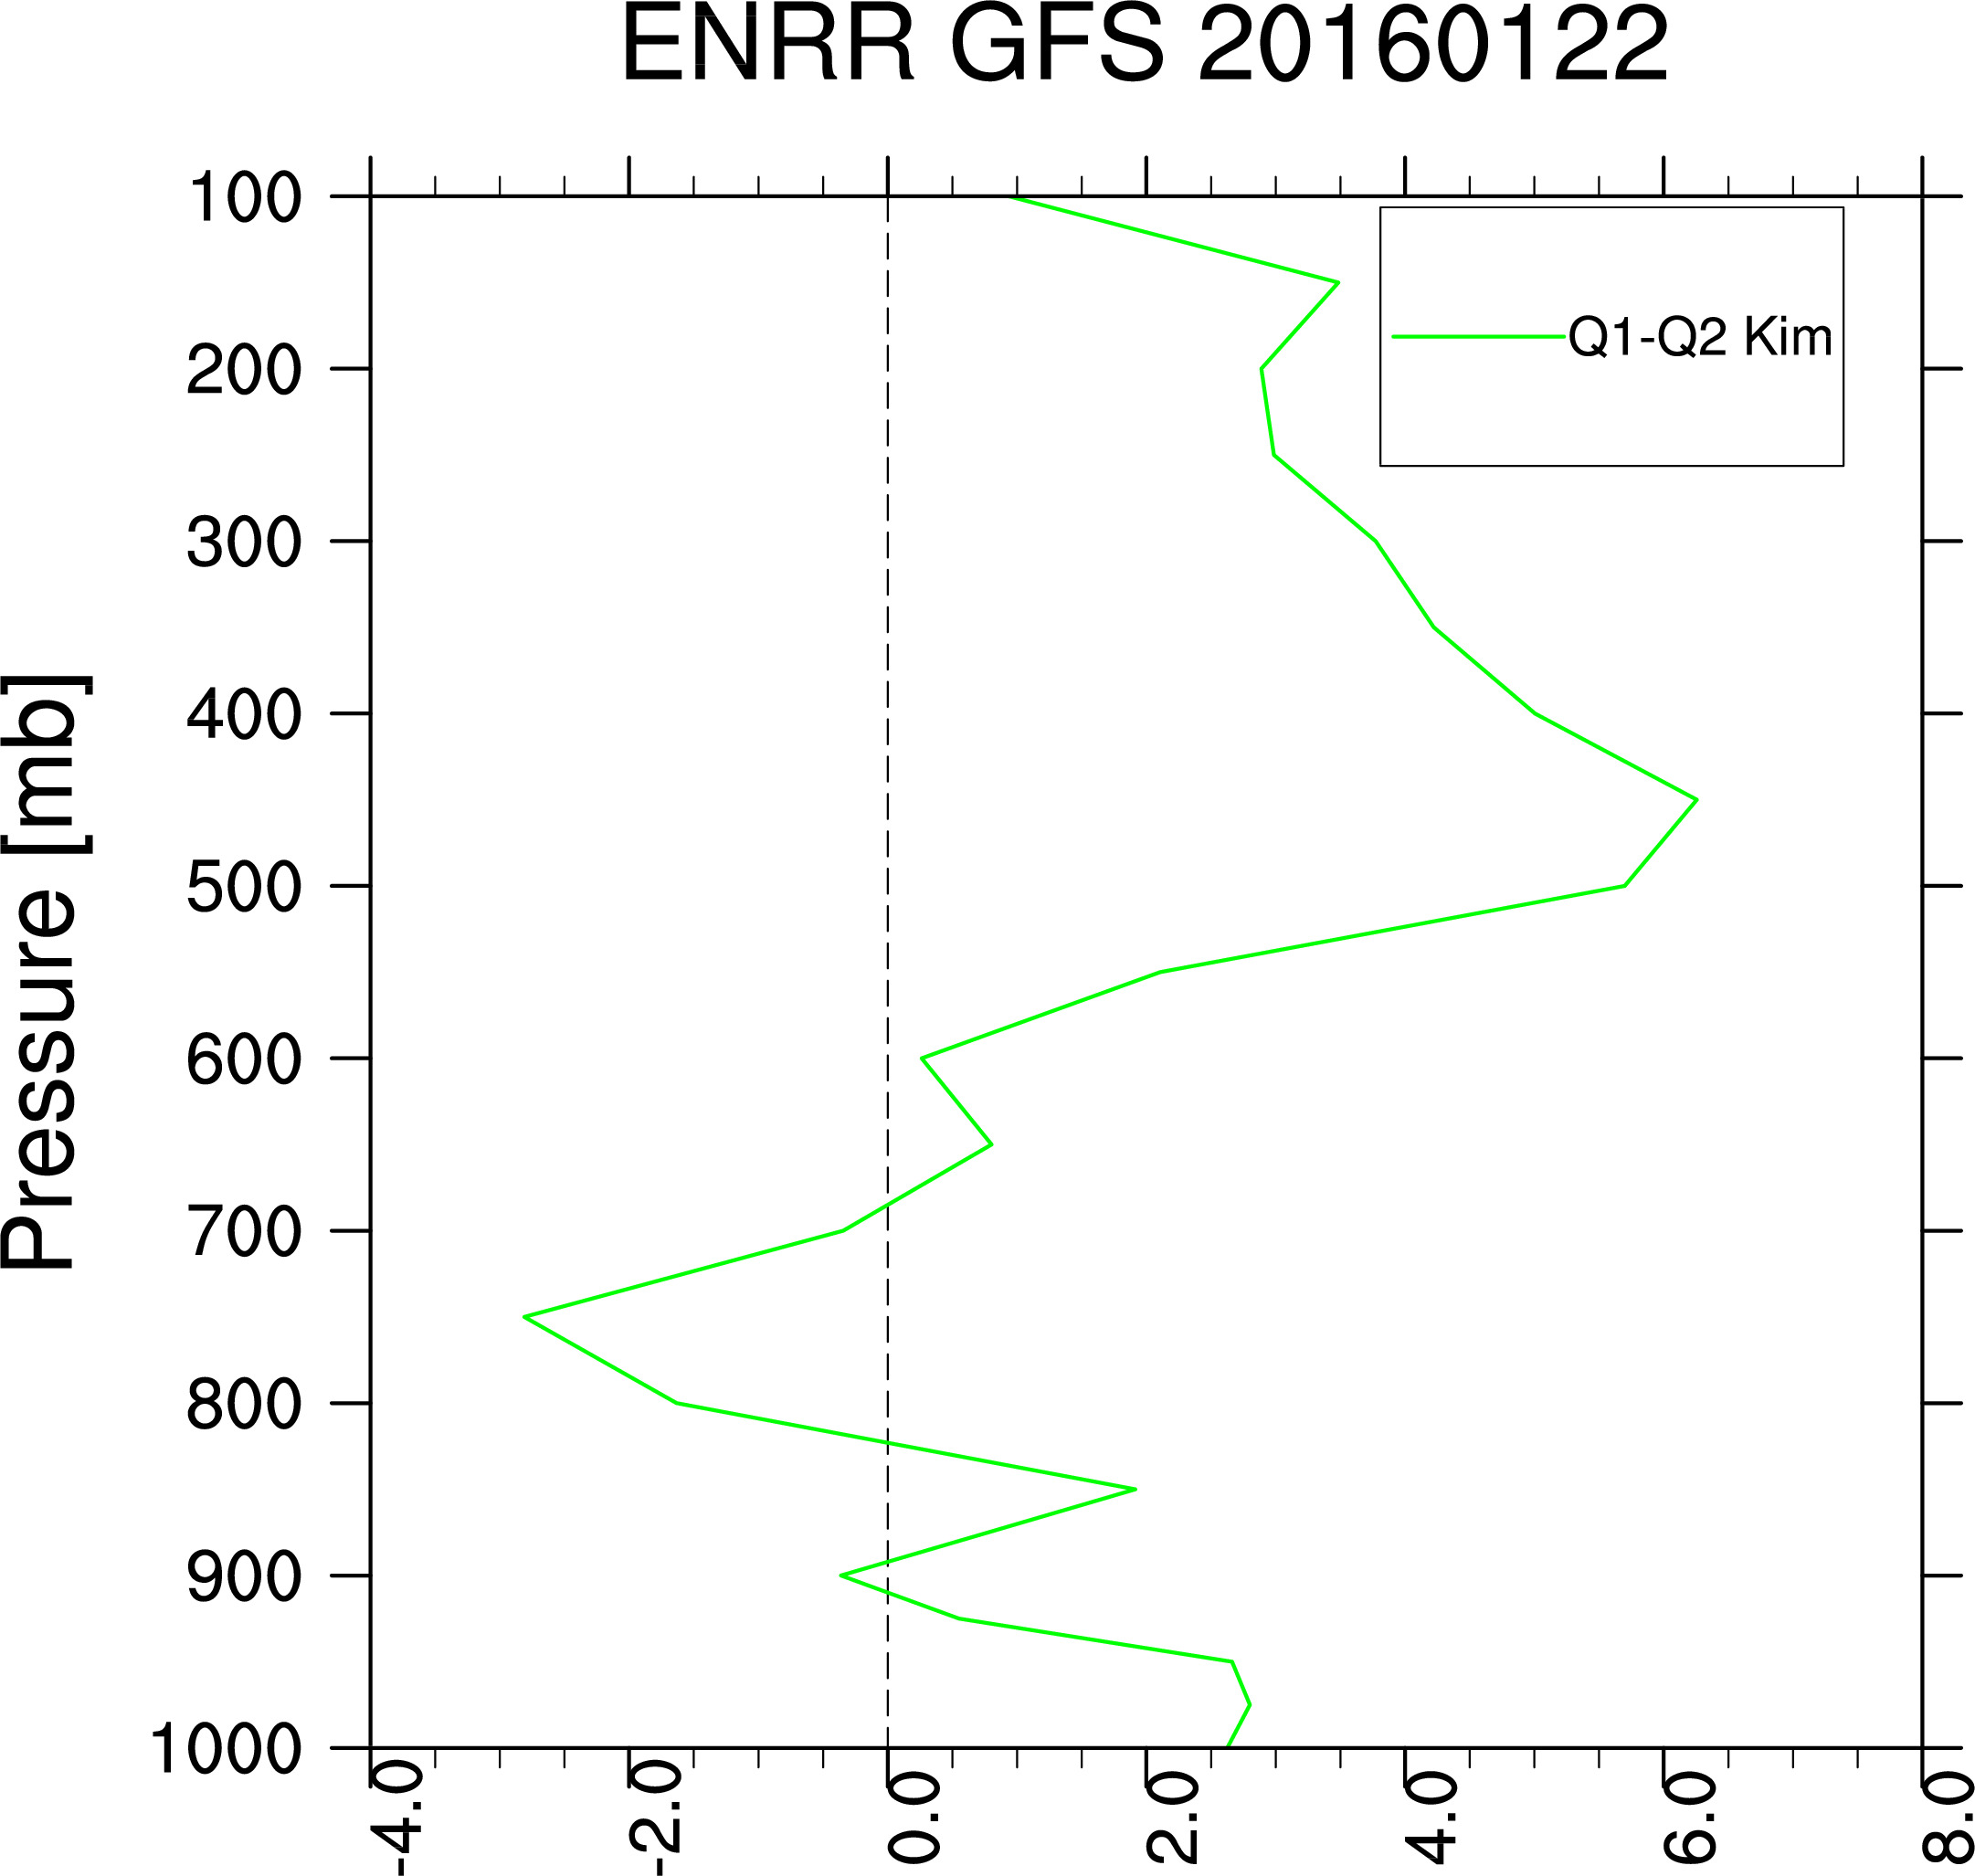
Differences Q1-Q2:
-------------------------------------------------------------------------------------------------------------------------------------------------------------------------------
formulas used 'Yanai et al Method' 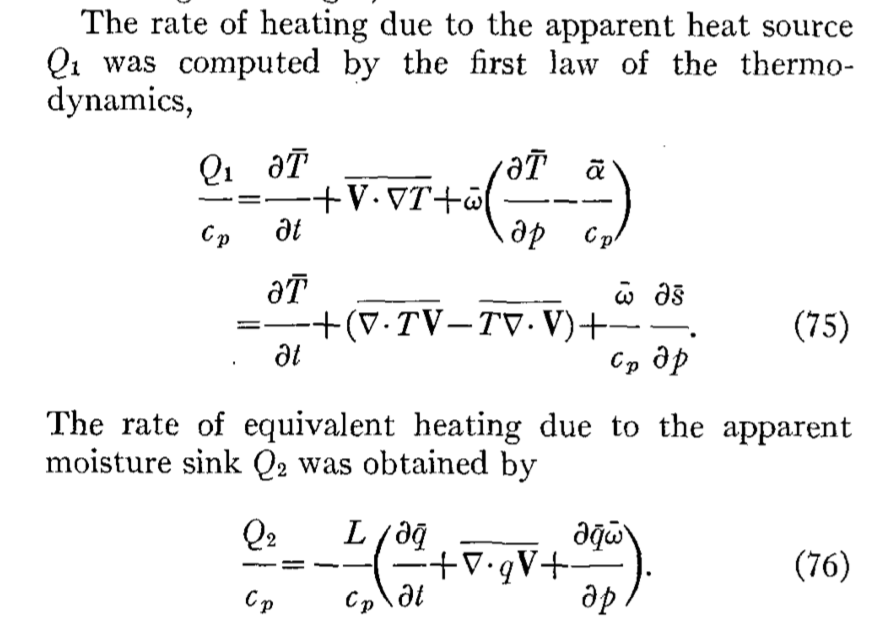
The following plots show Q1, Q2 computed at each grid point and averaged over the flight region last
Average over 5 flights:
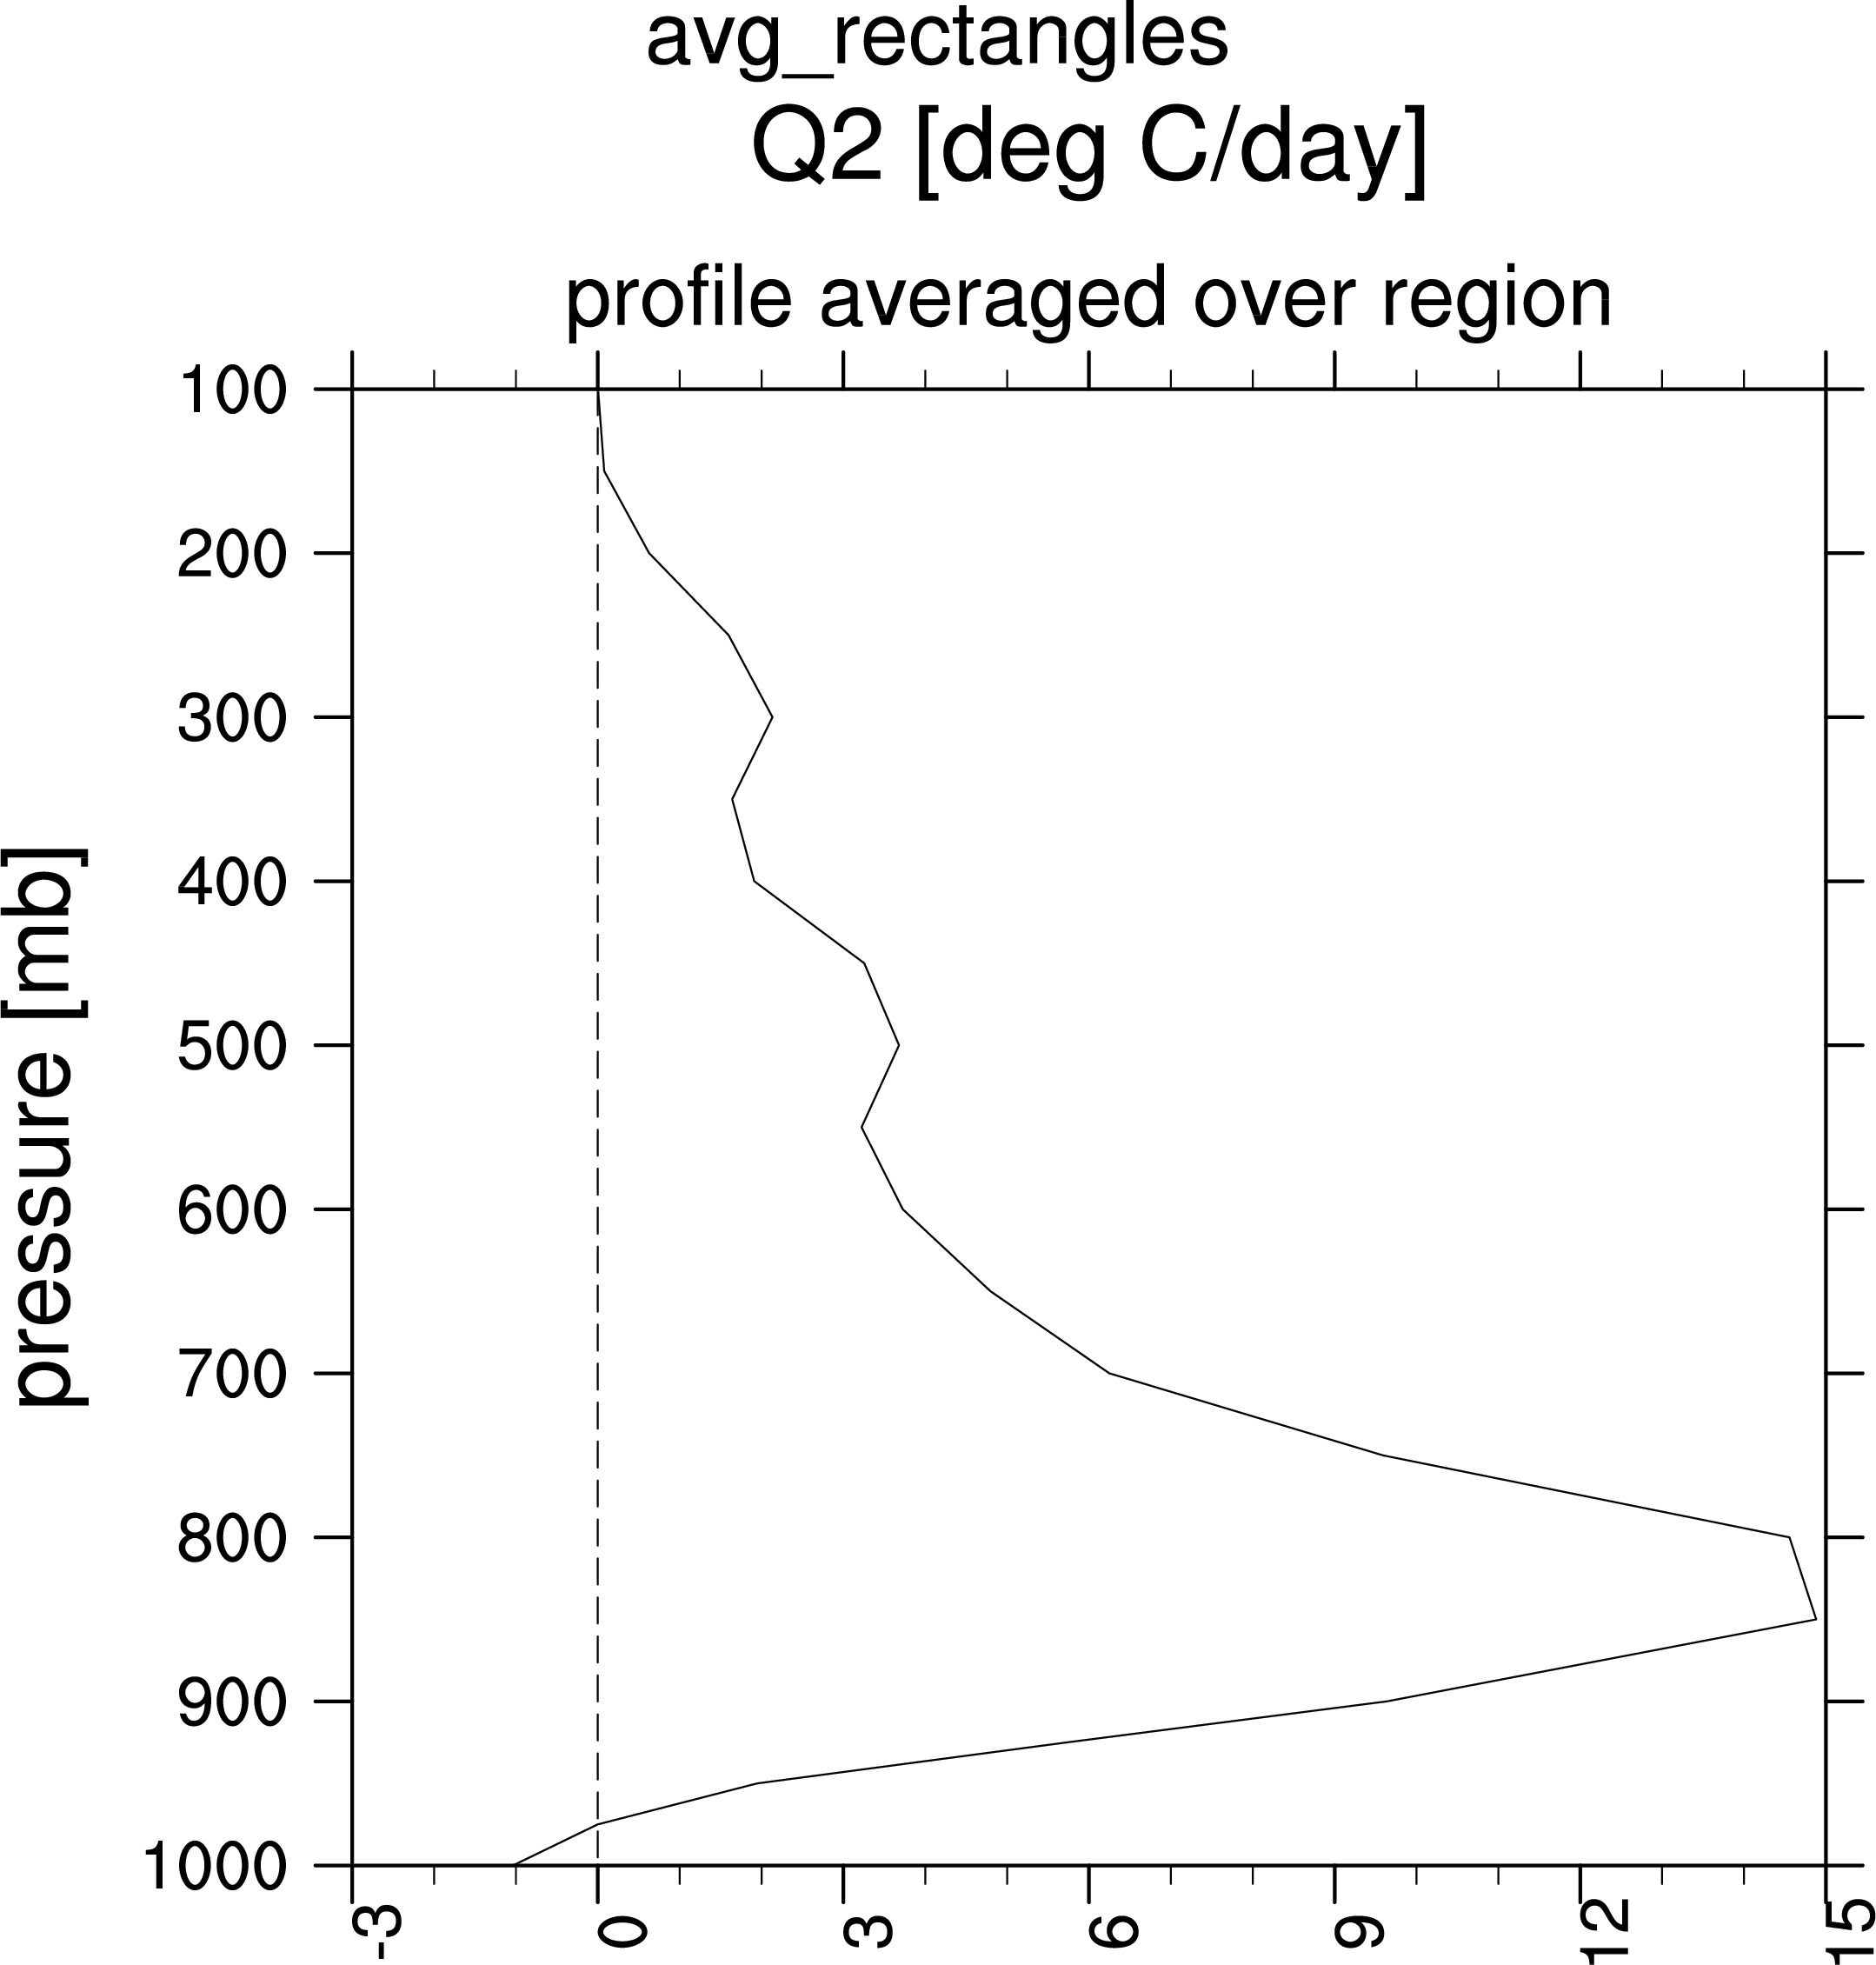
Re. Q2


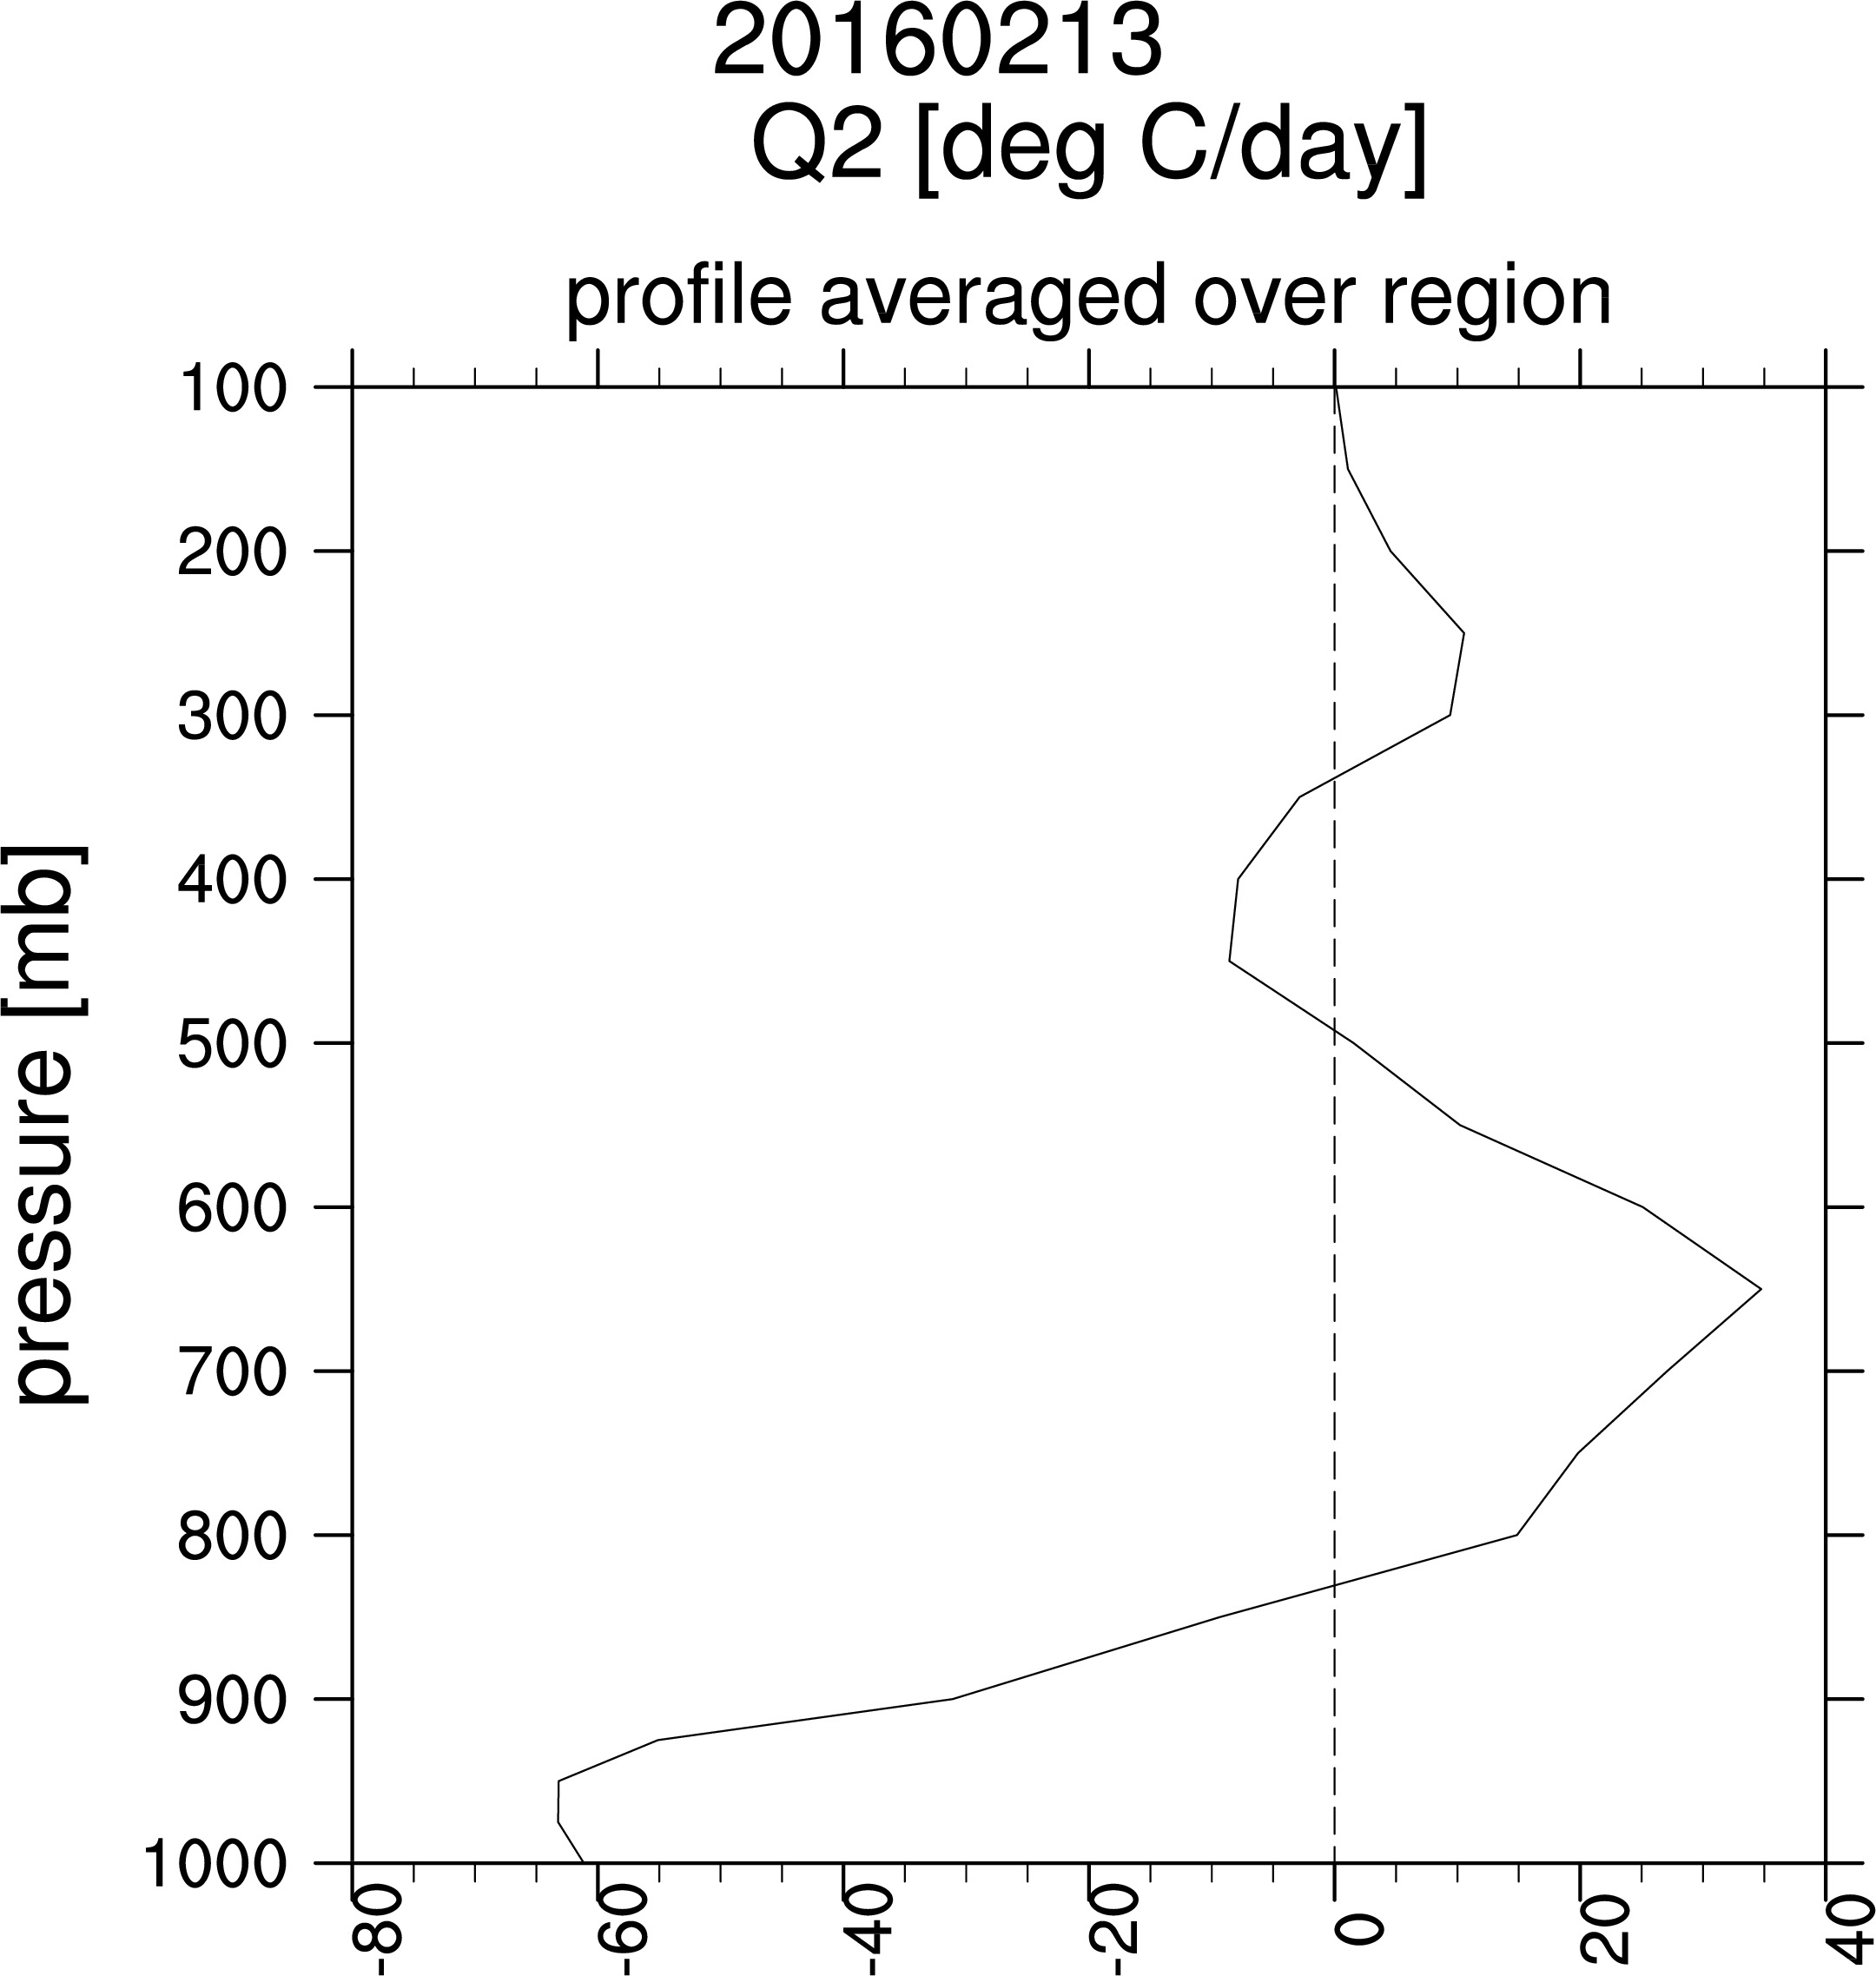

Average over 5 flights:
-----------------------------------------------------------------------------------------------------------------------------------------
Re. 2017 rectangles:


----------------------------------------------------------
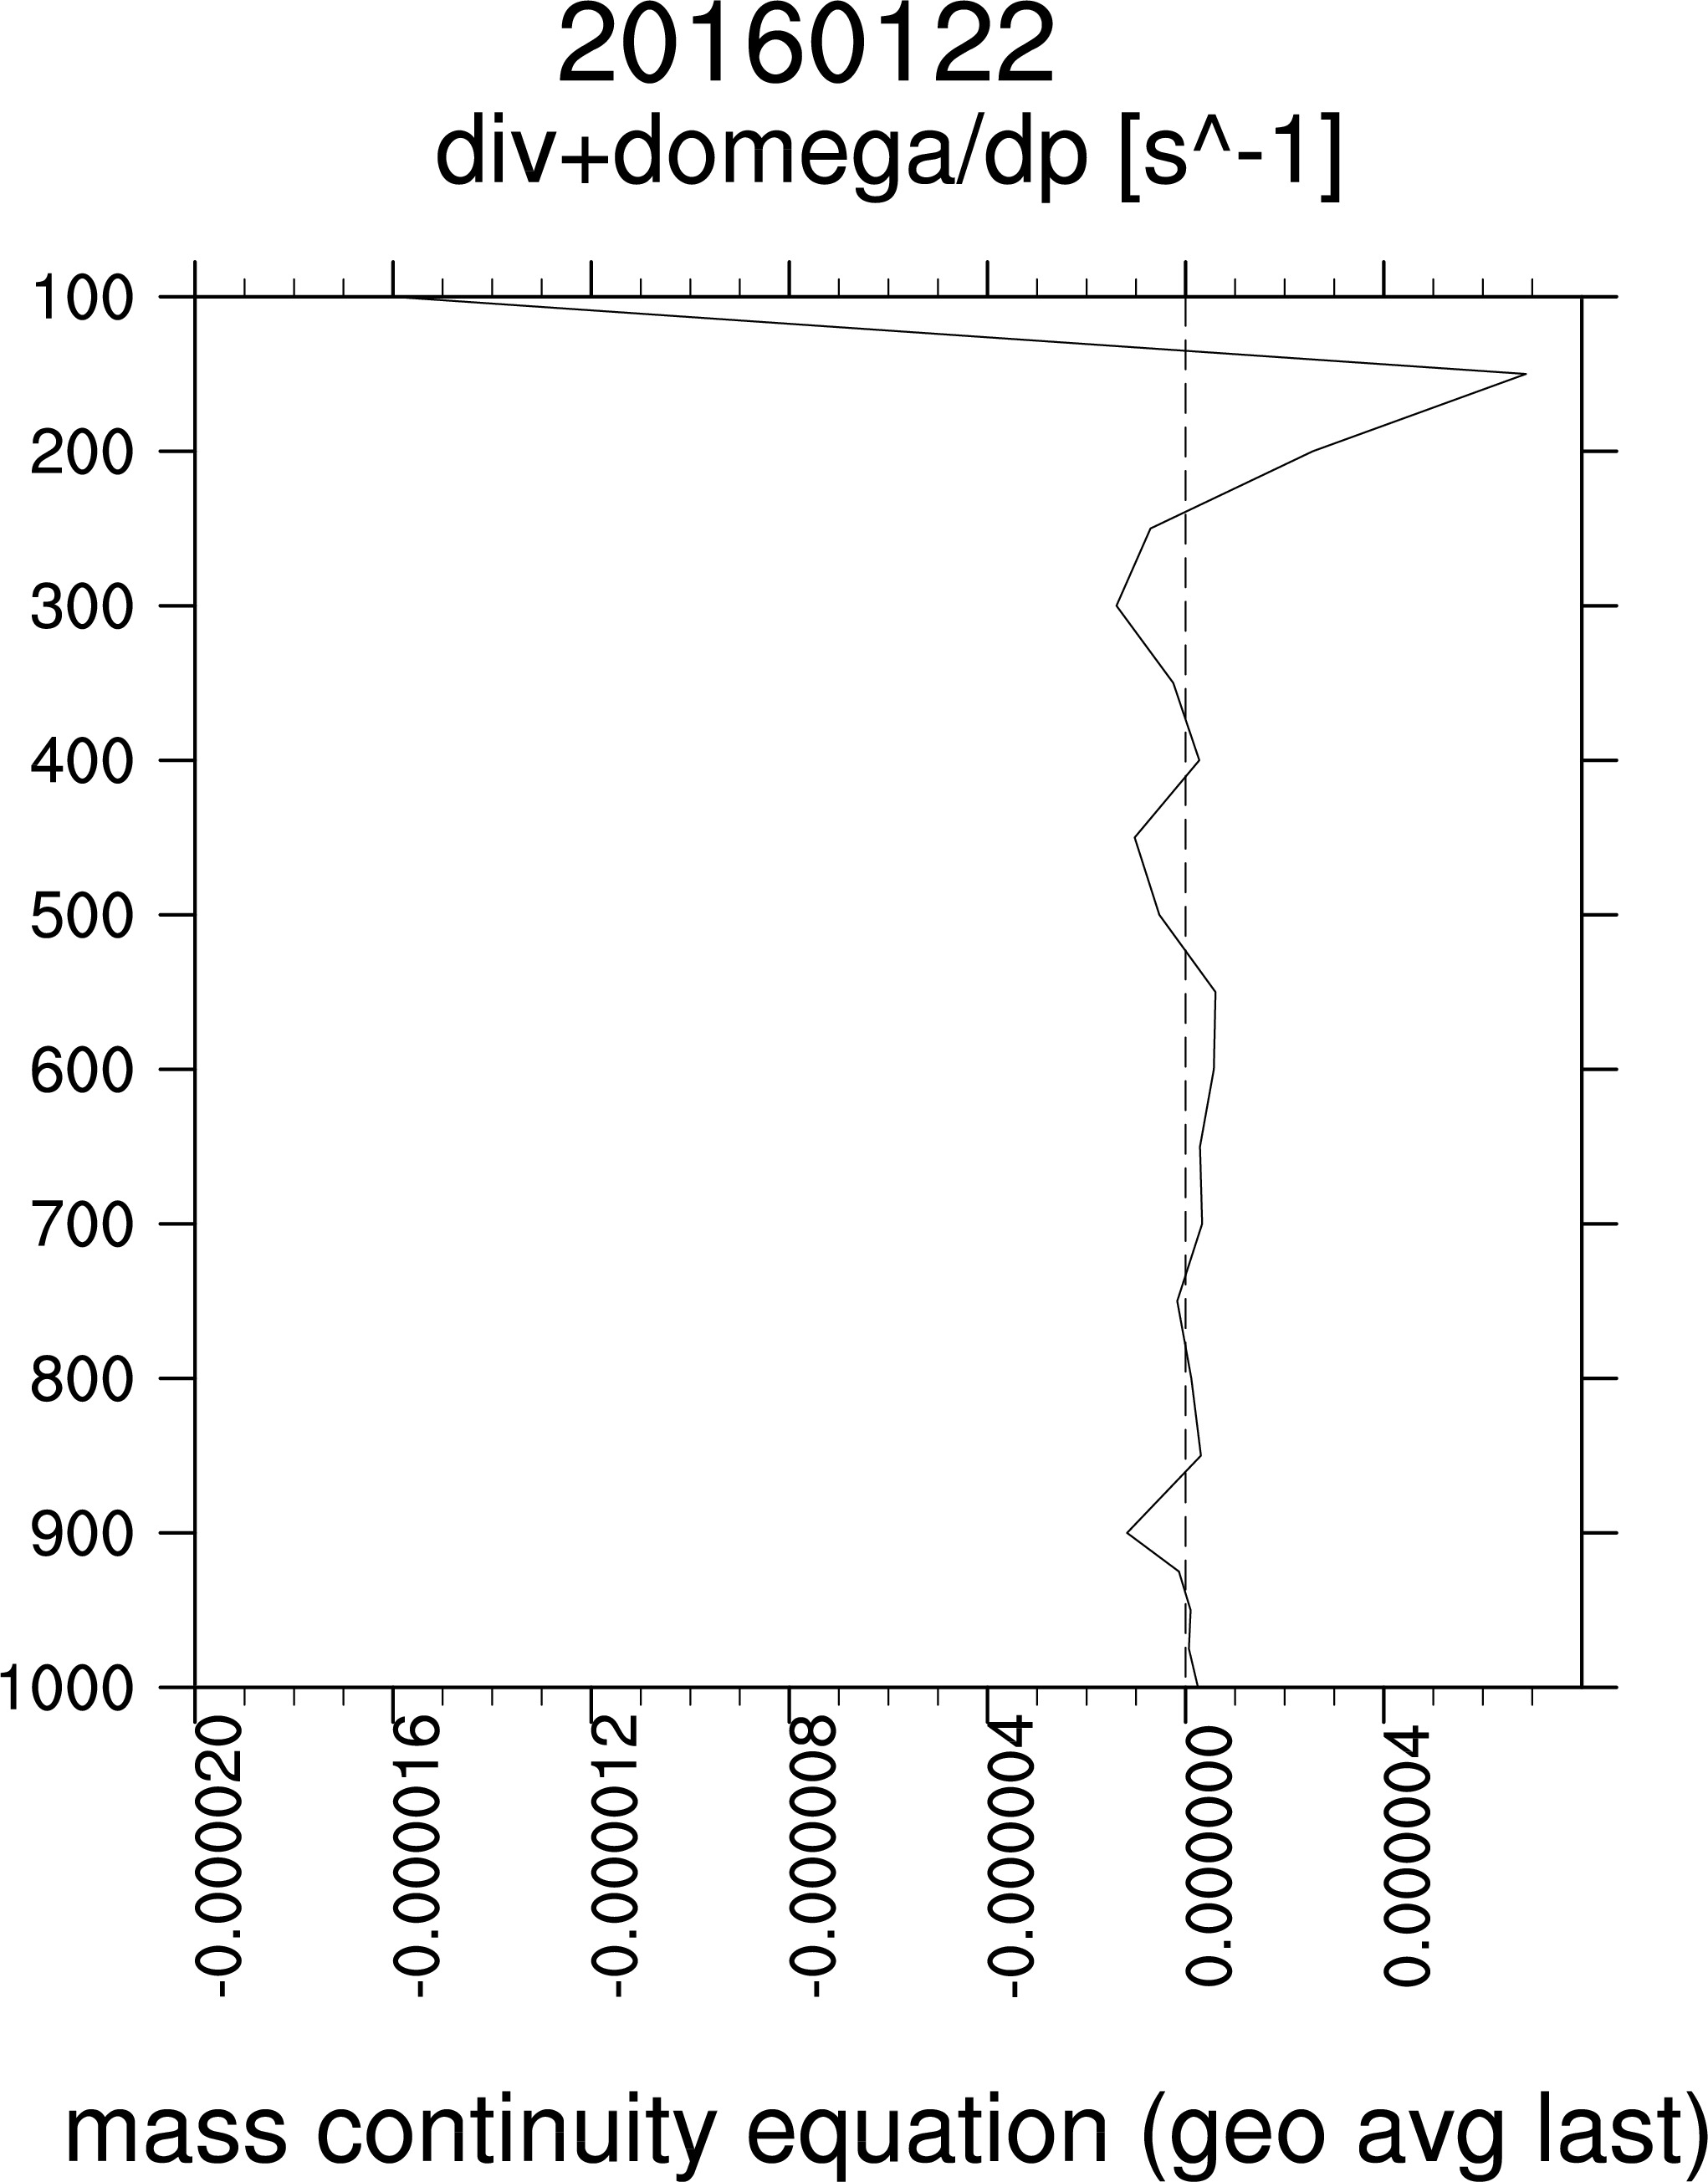
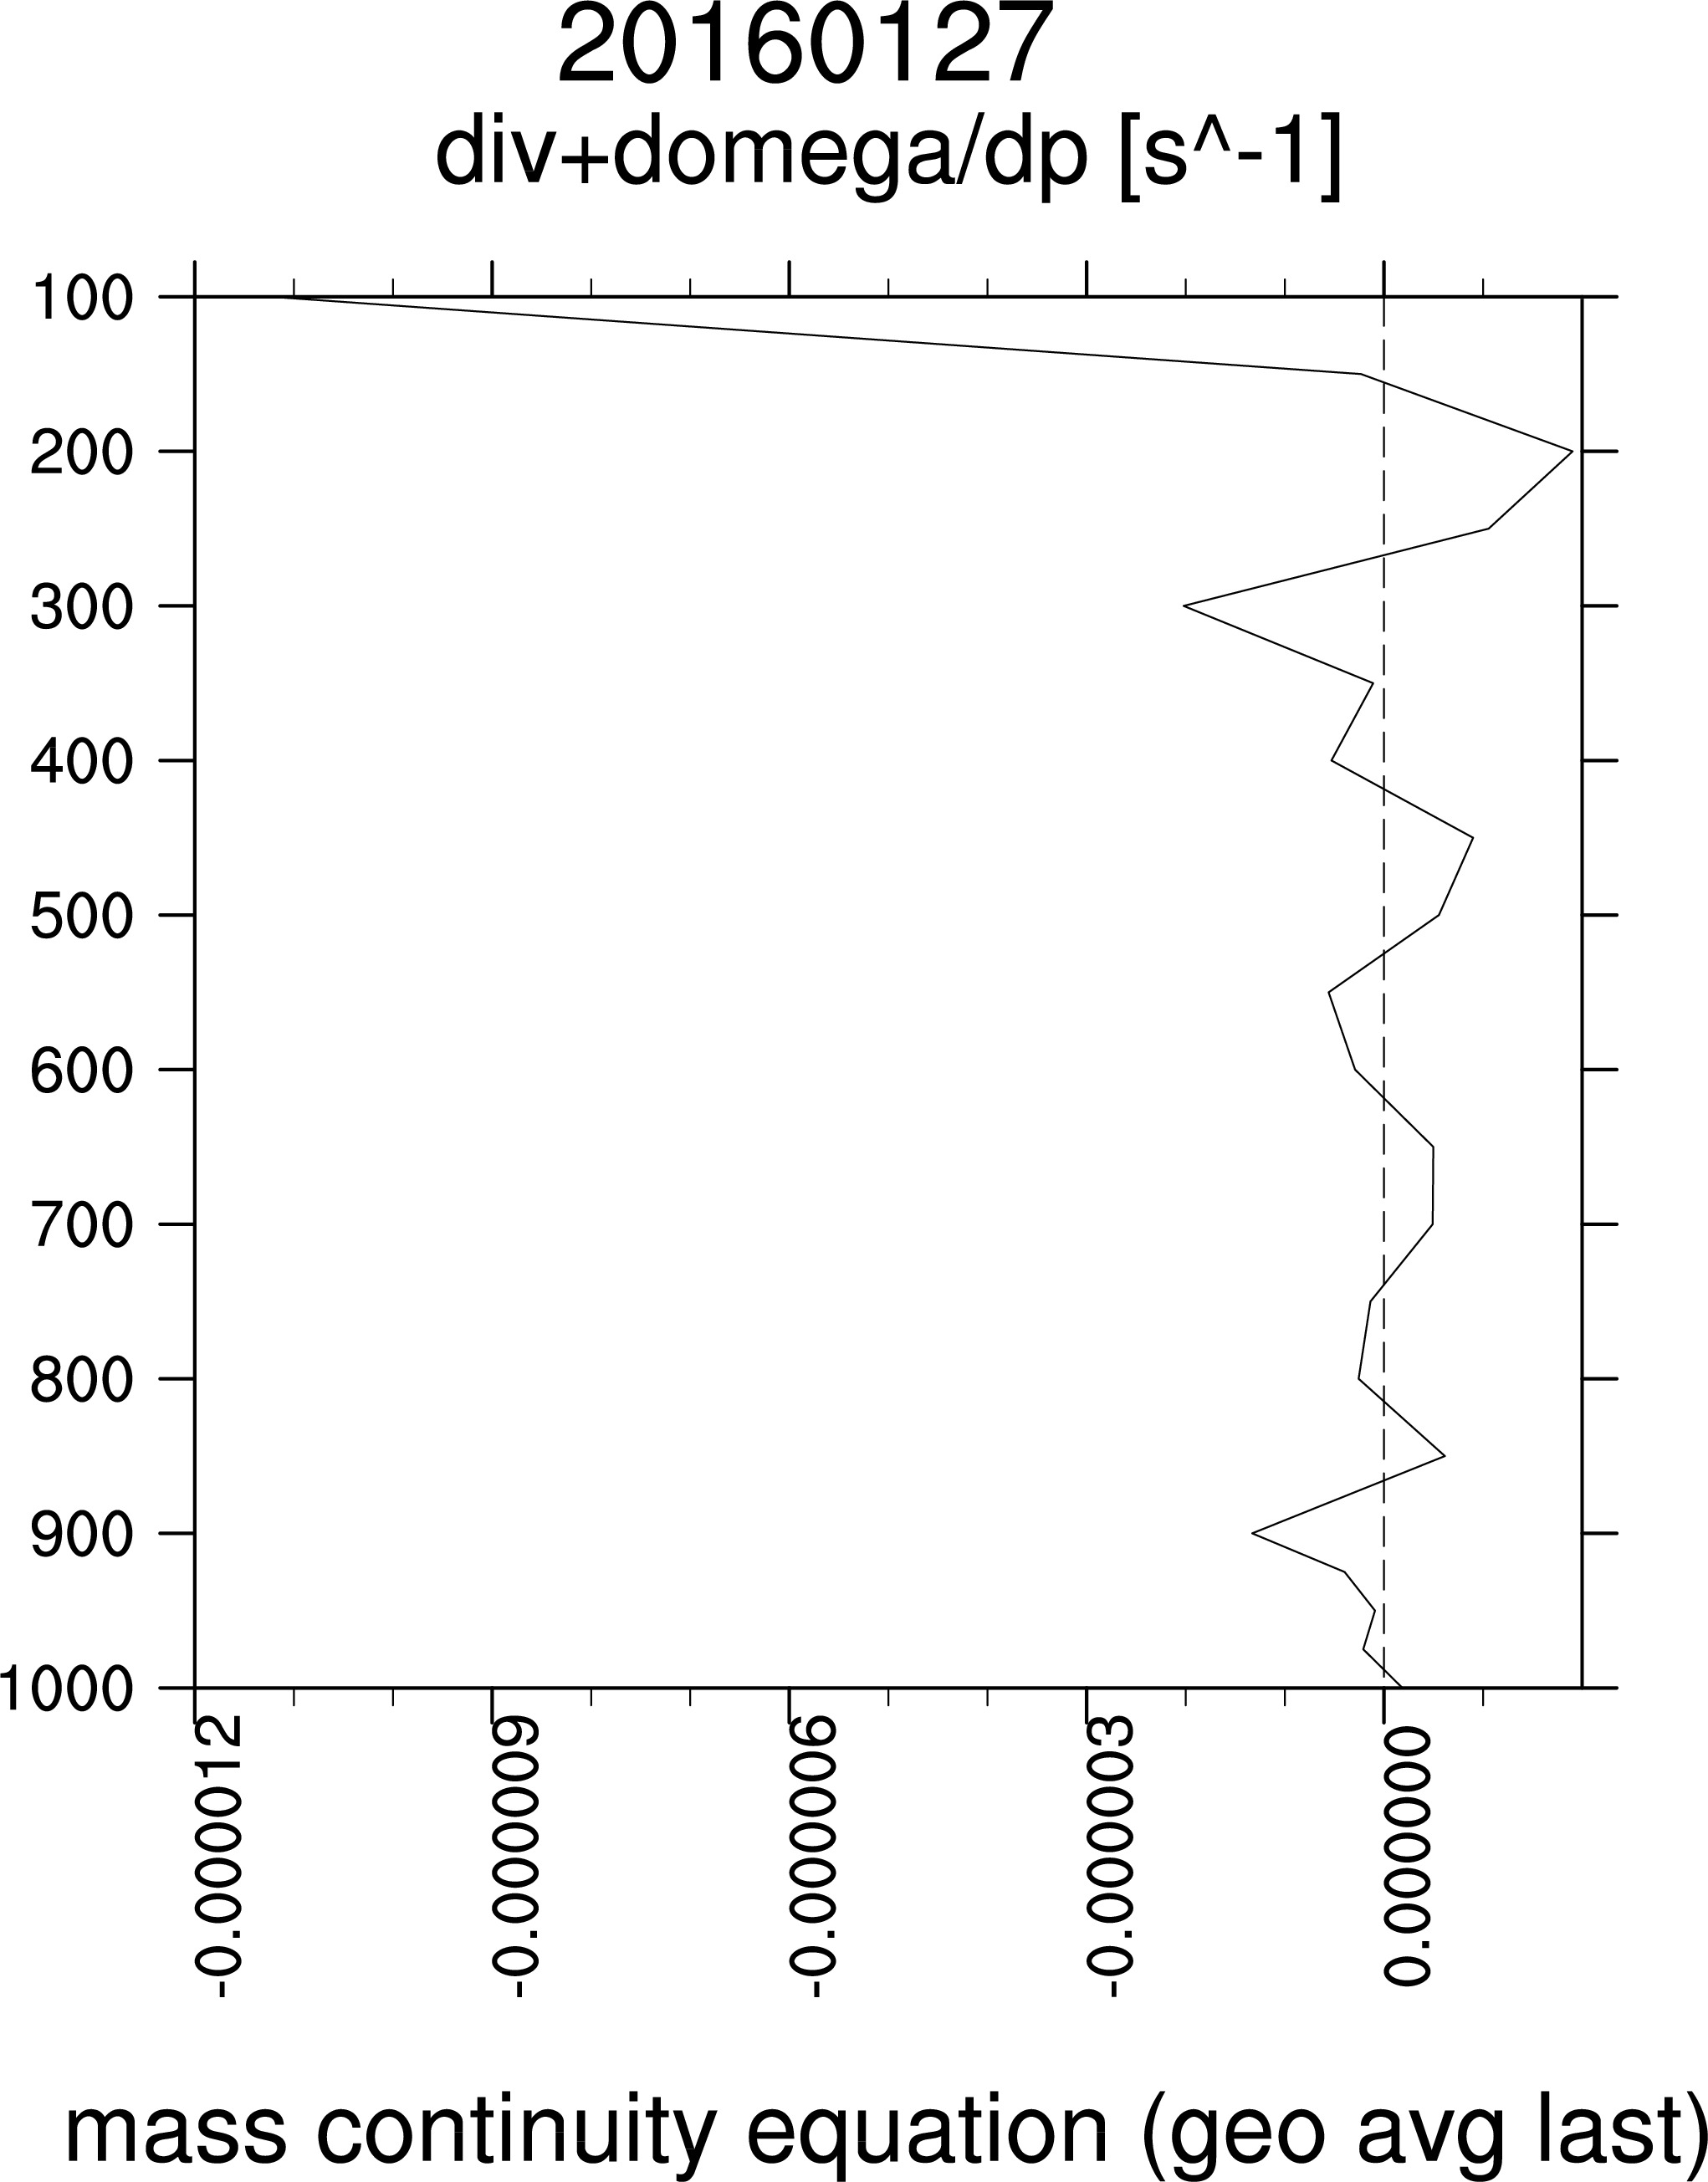
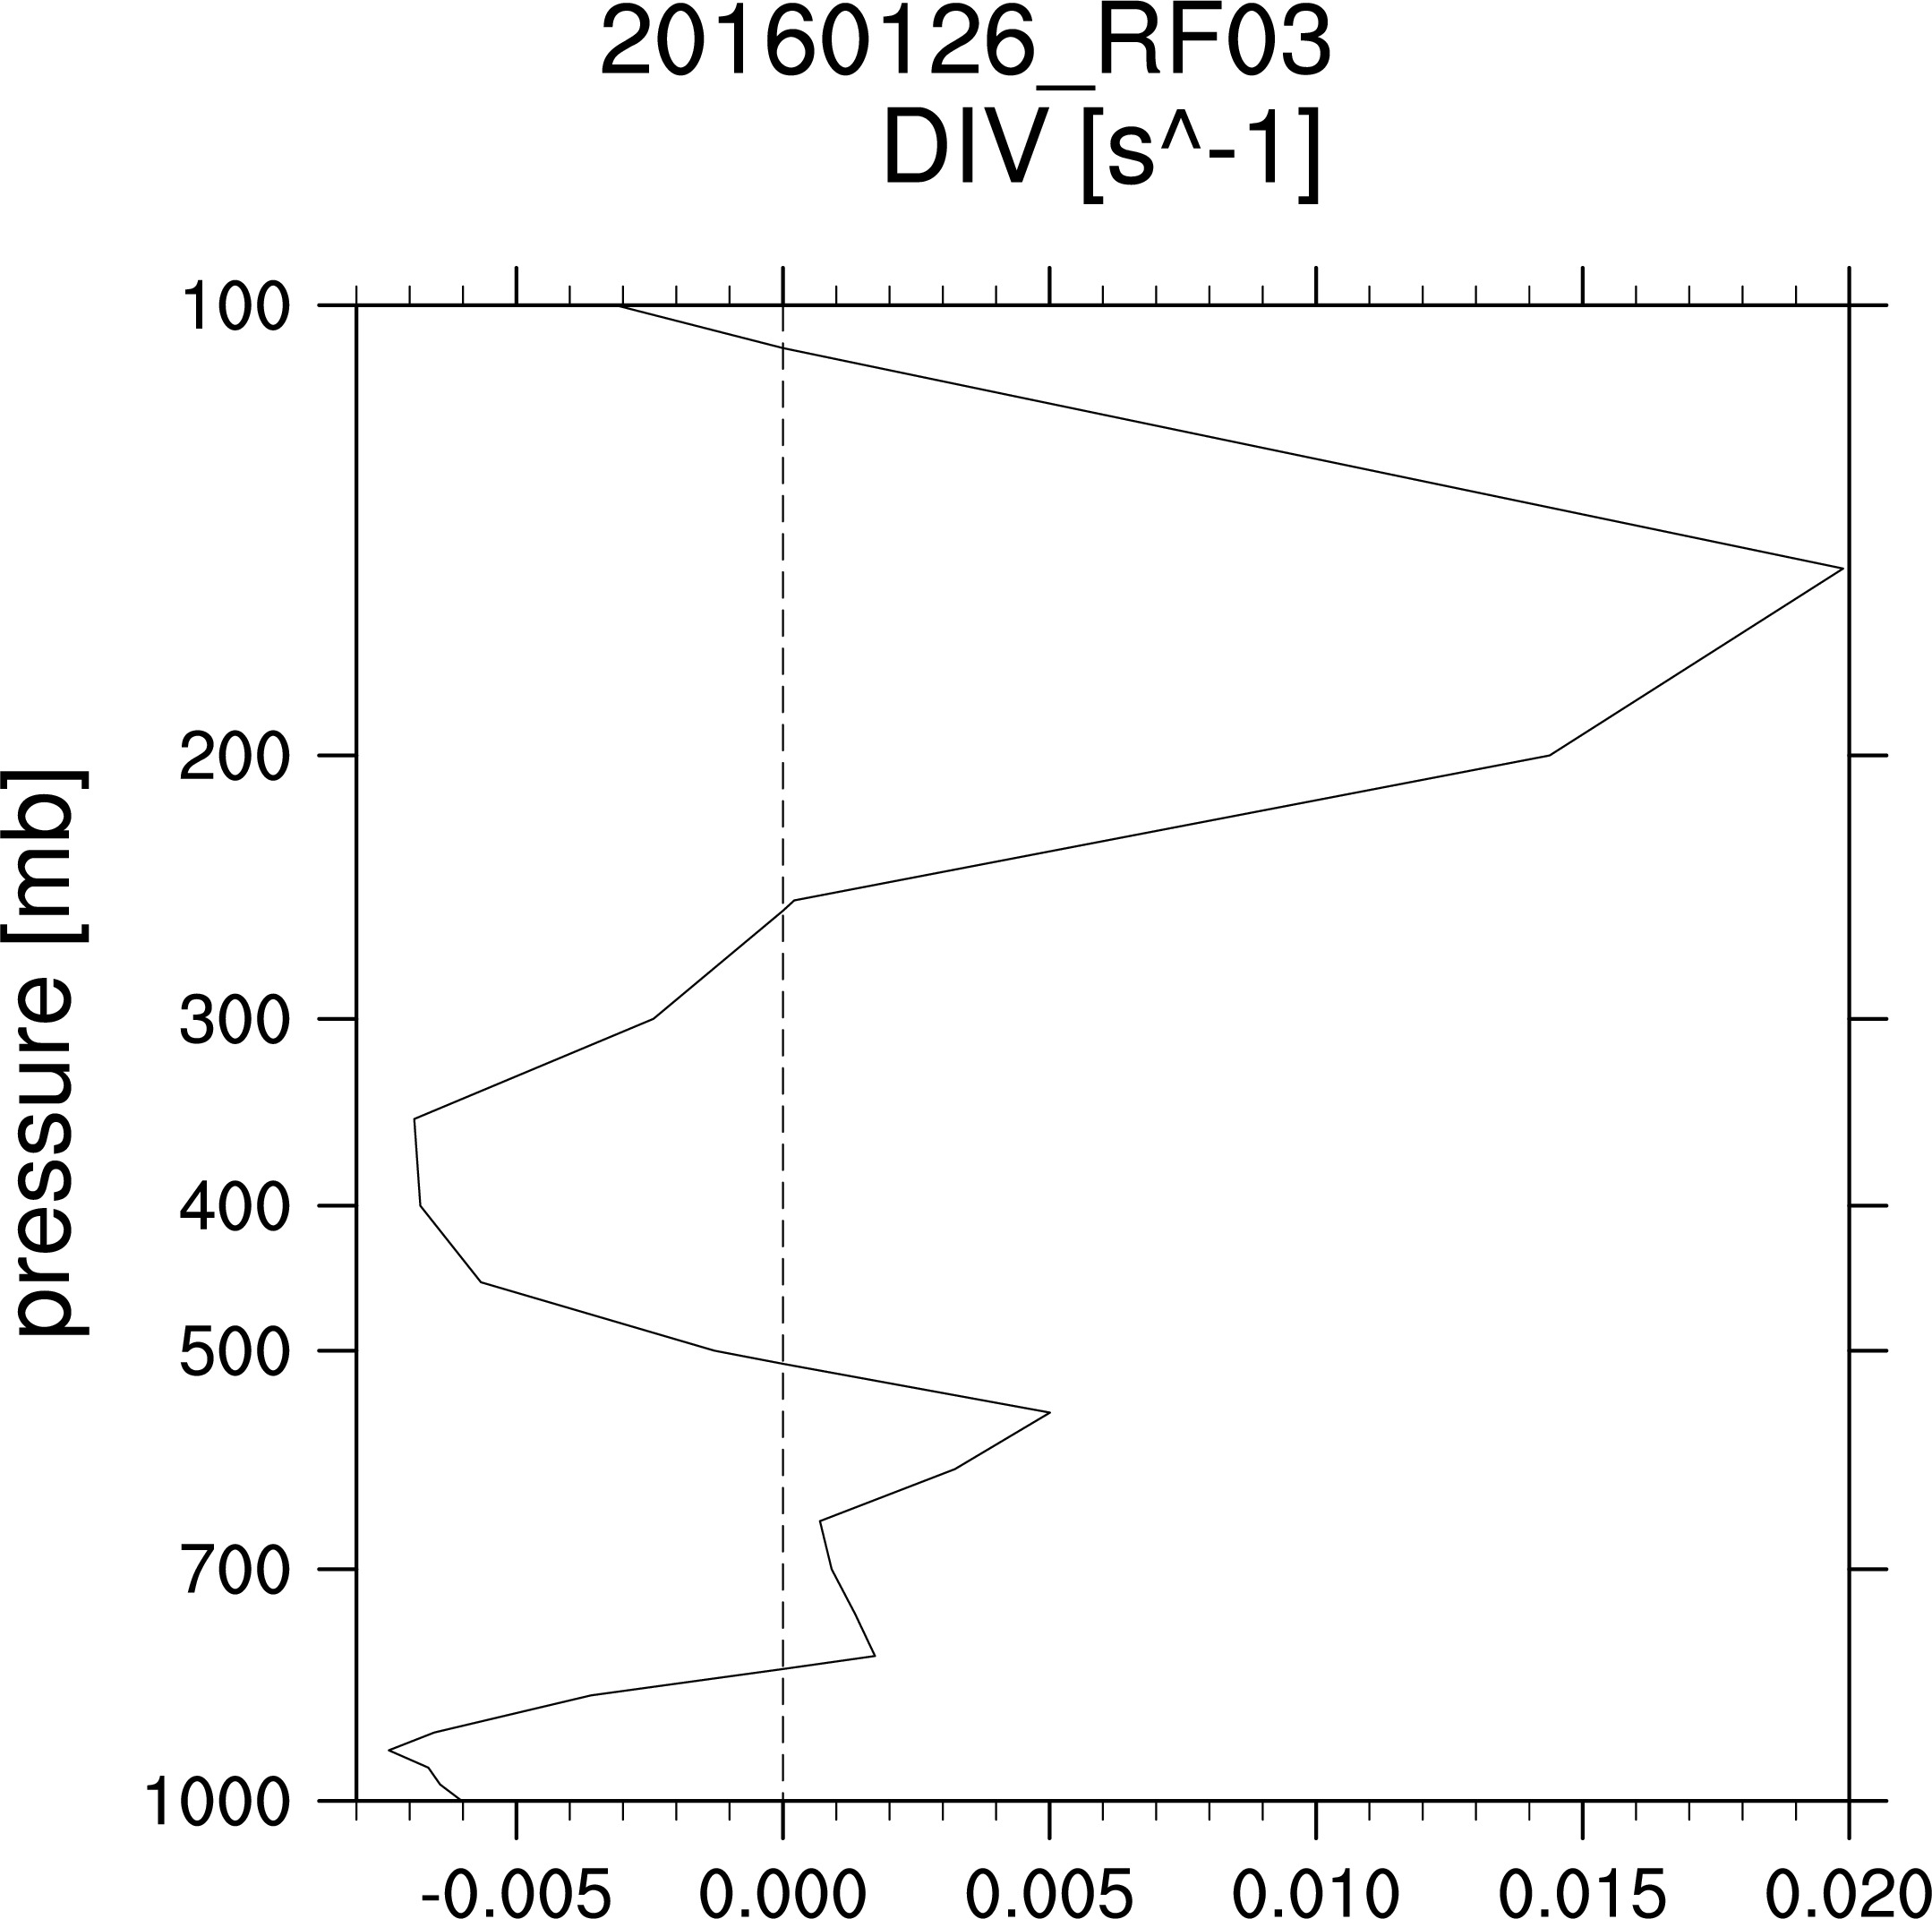
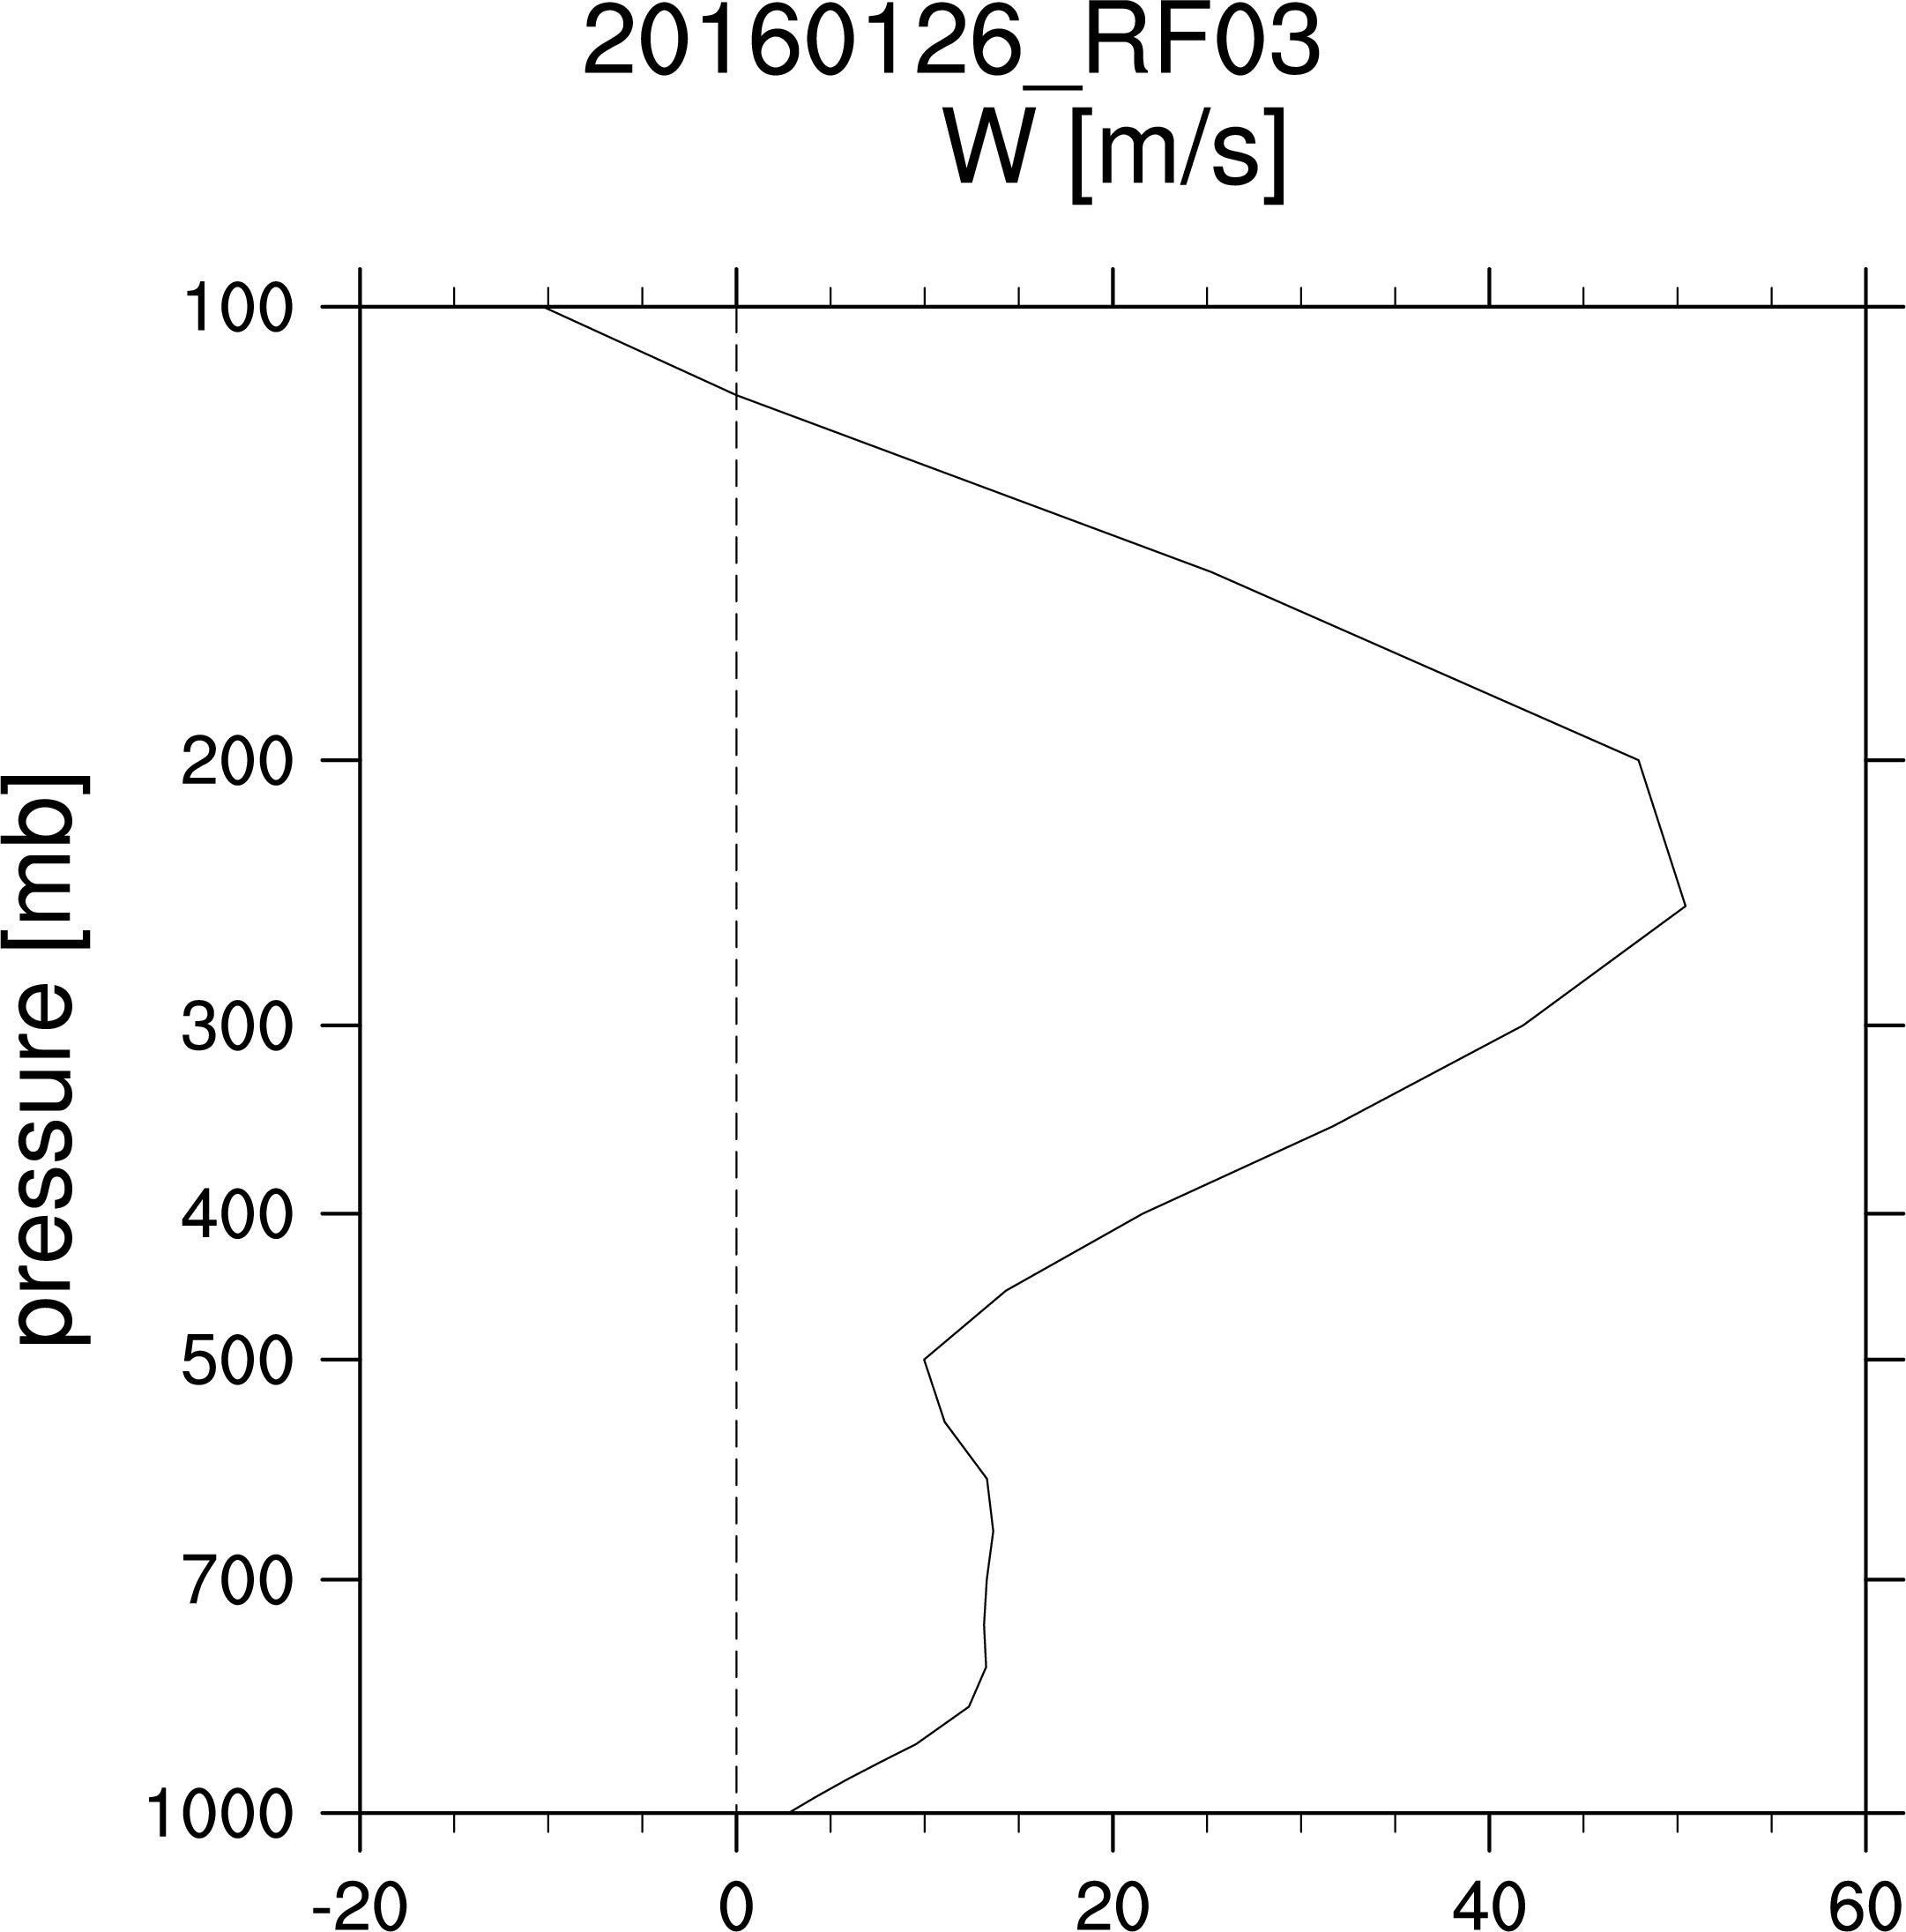
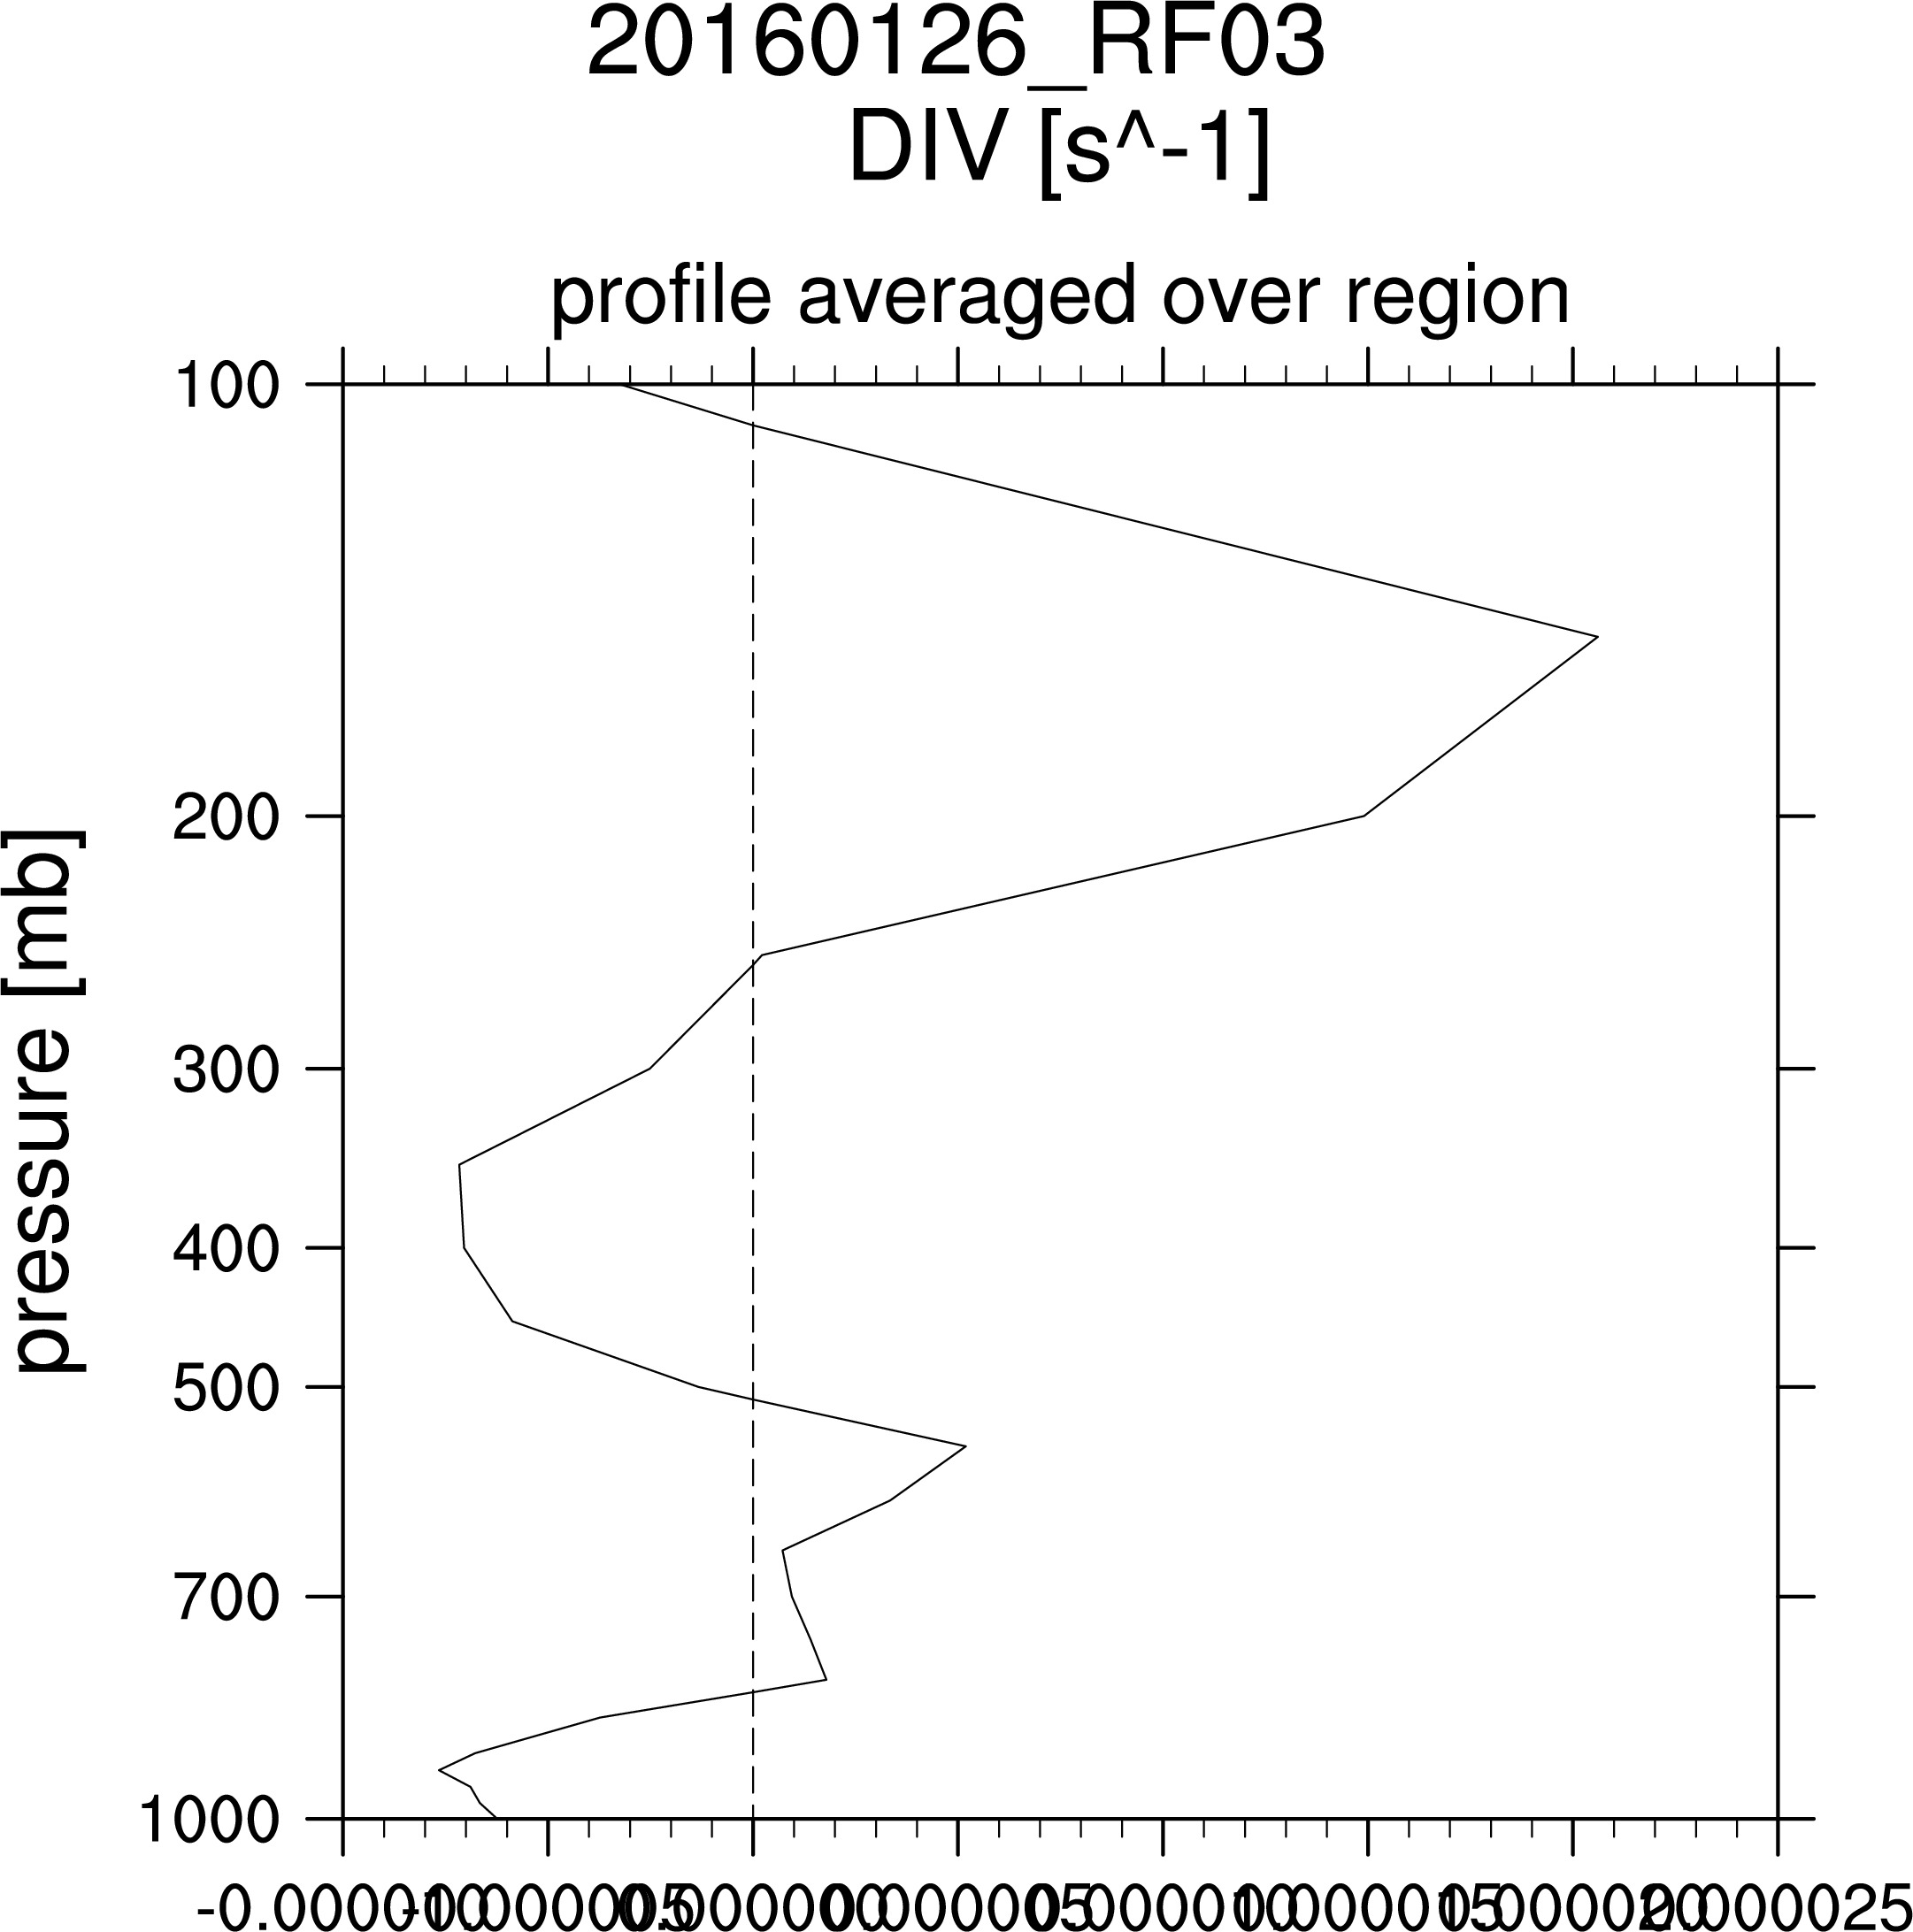
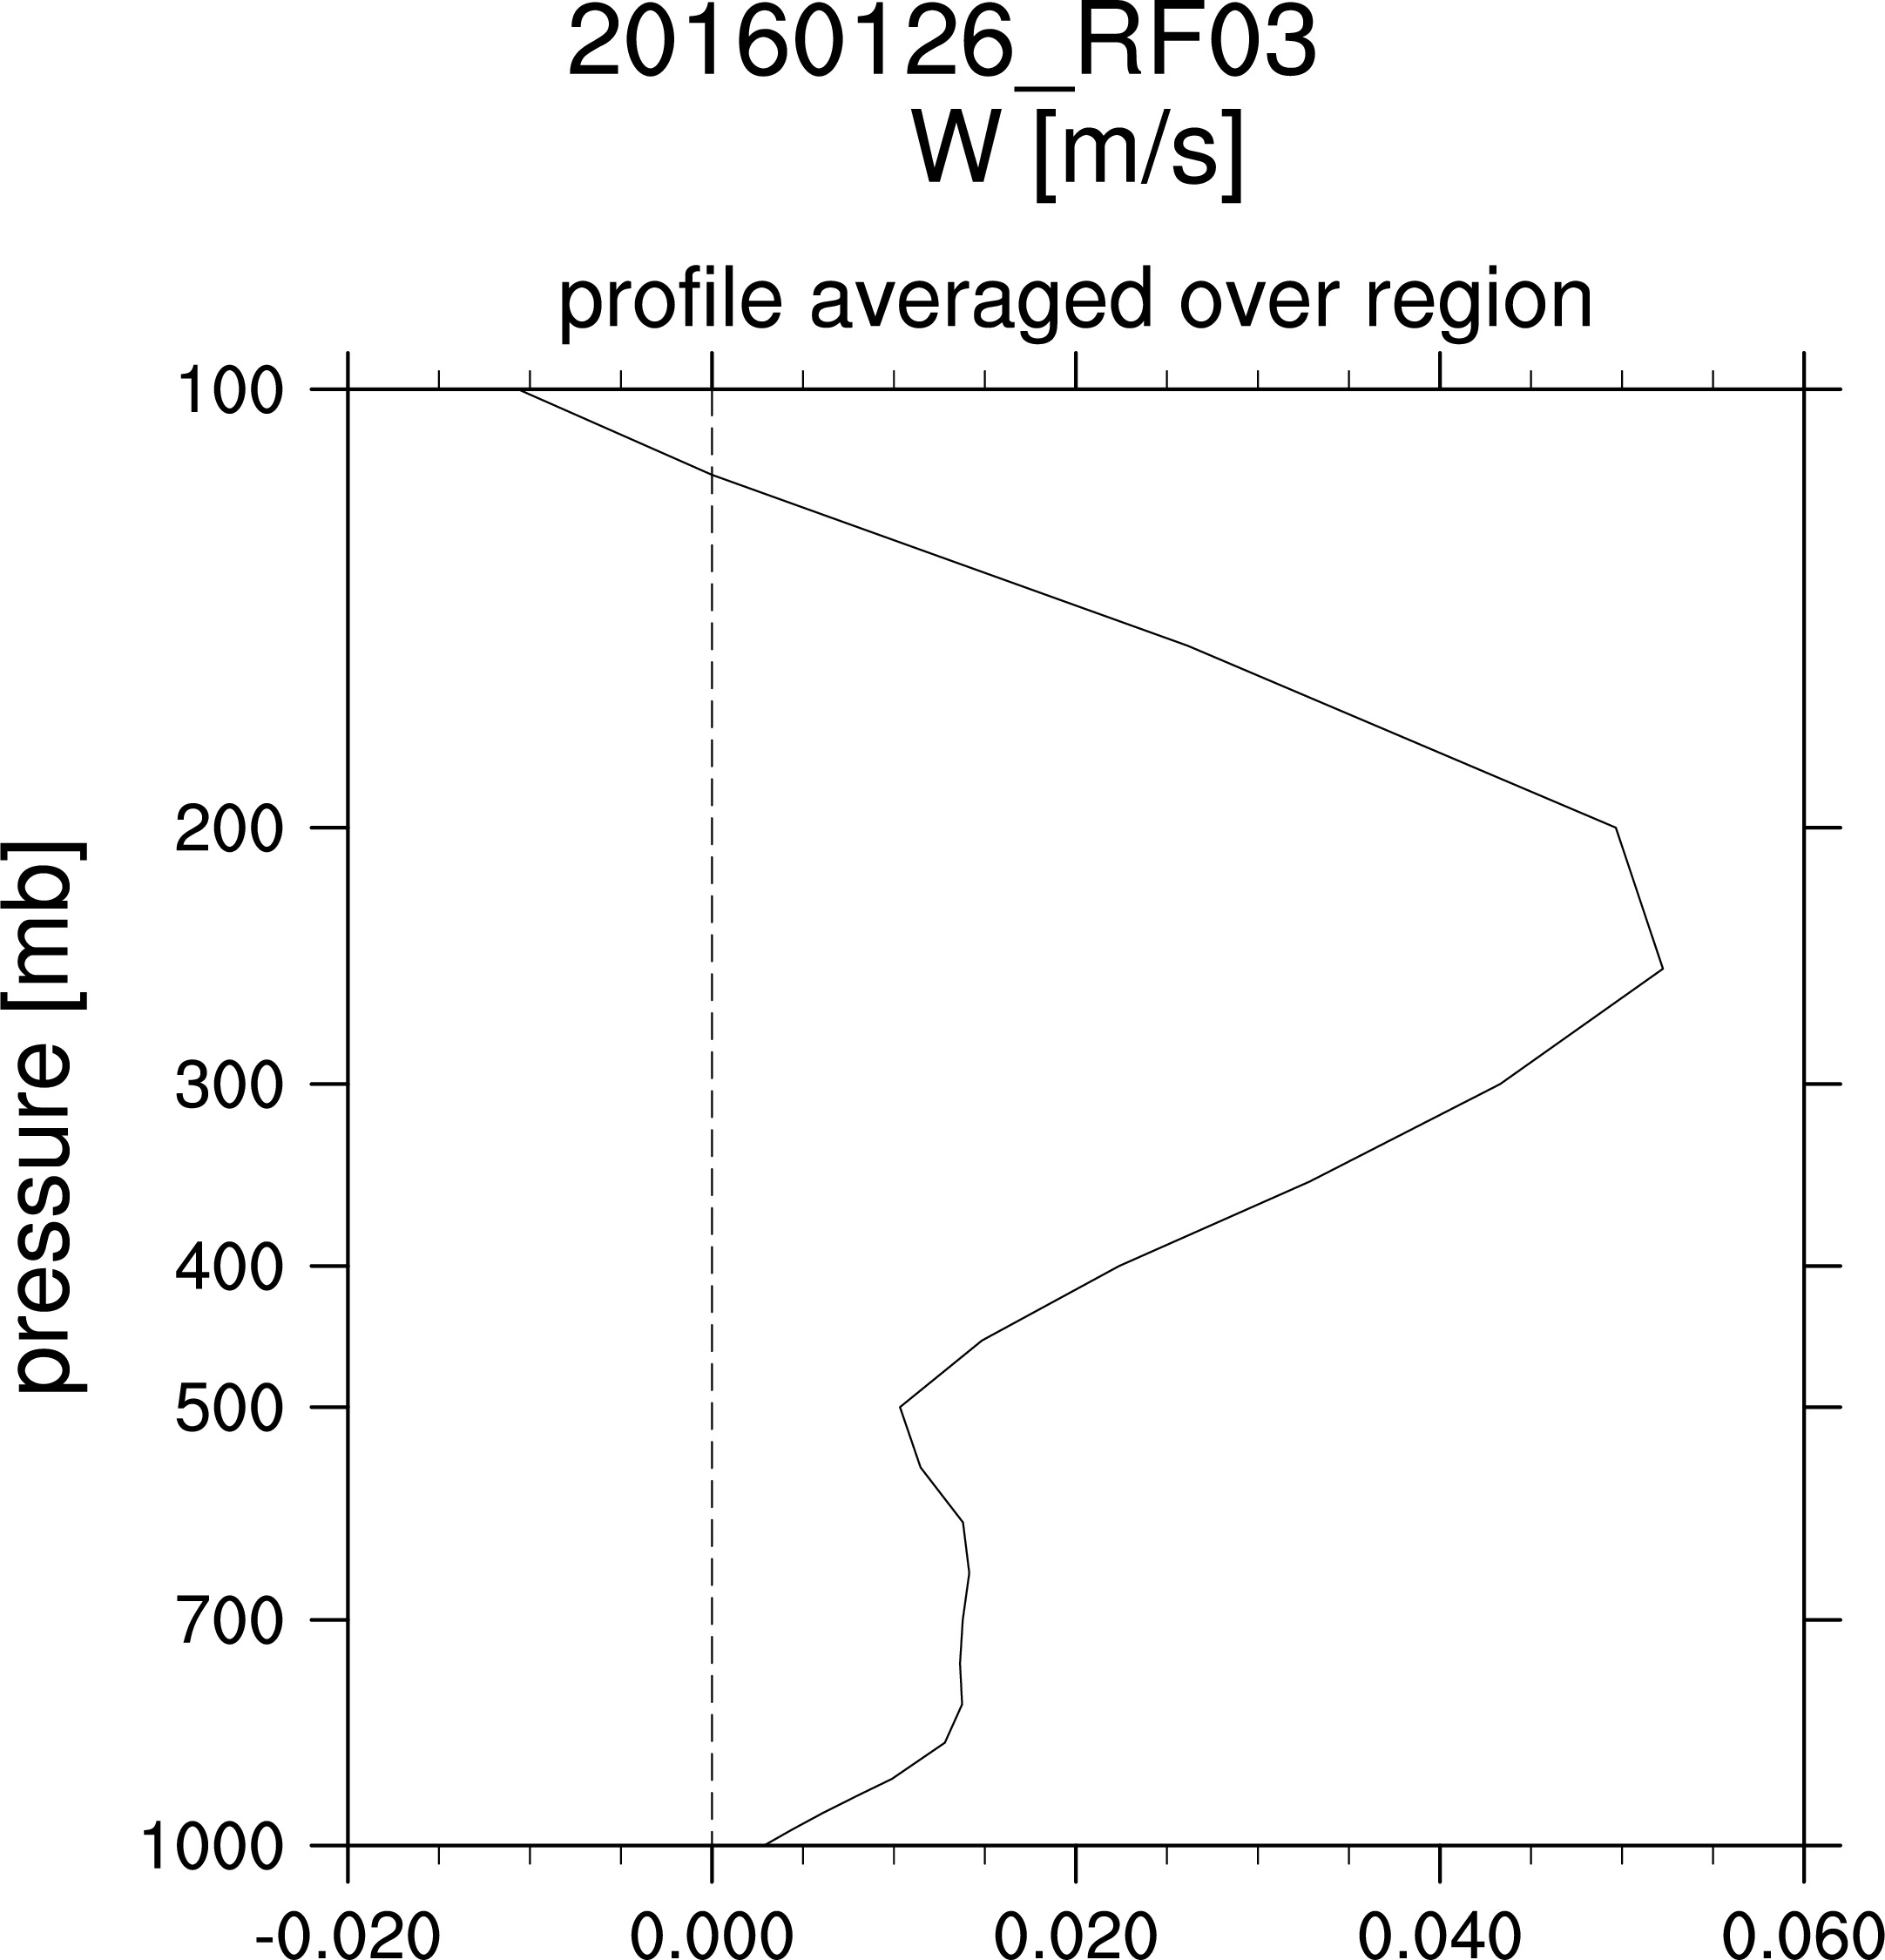
Tests of continuity equation (Kim et al. method):
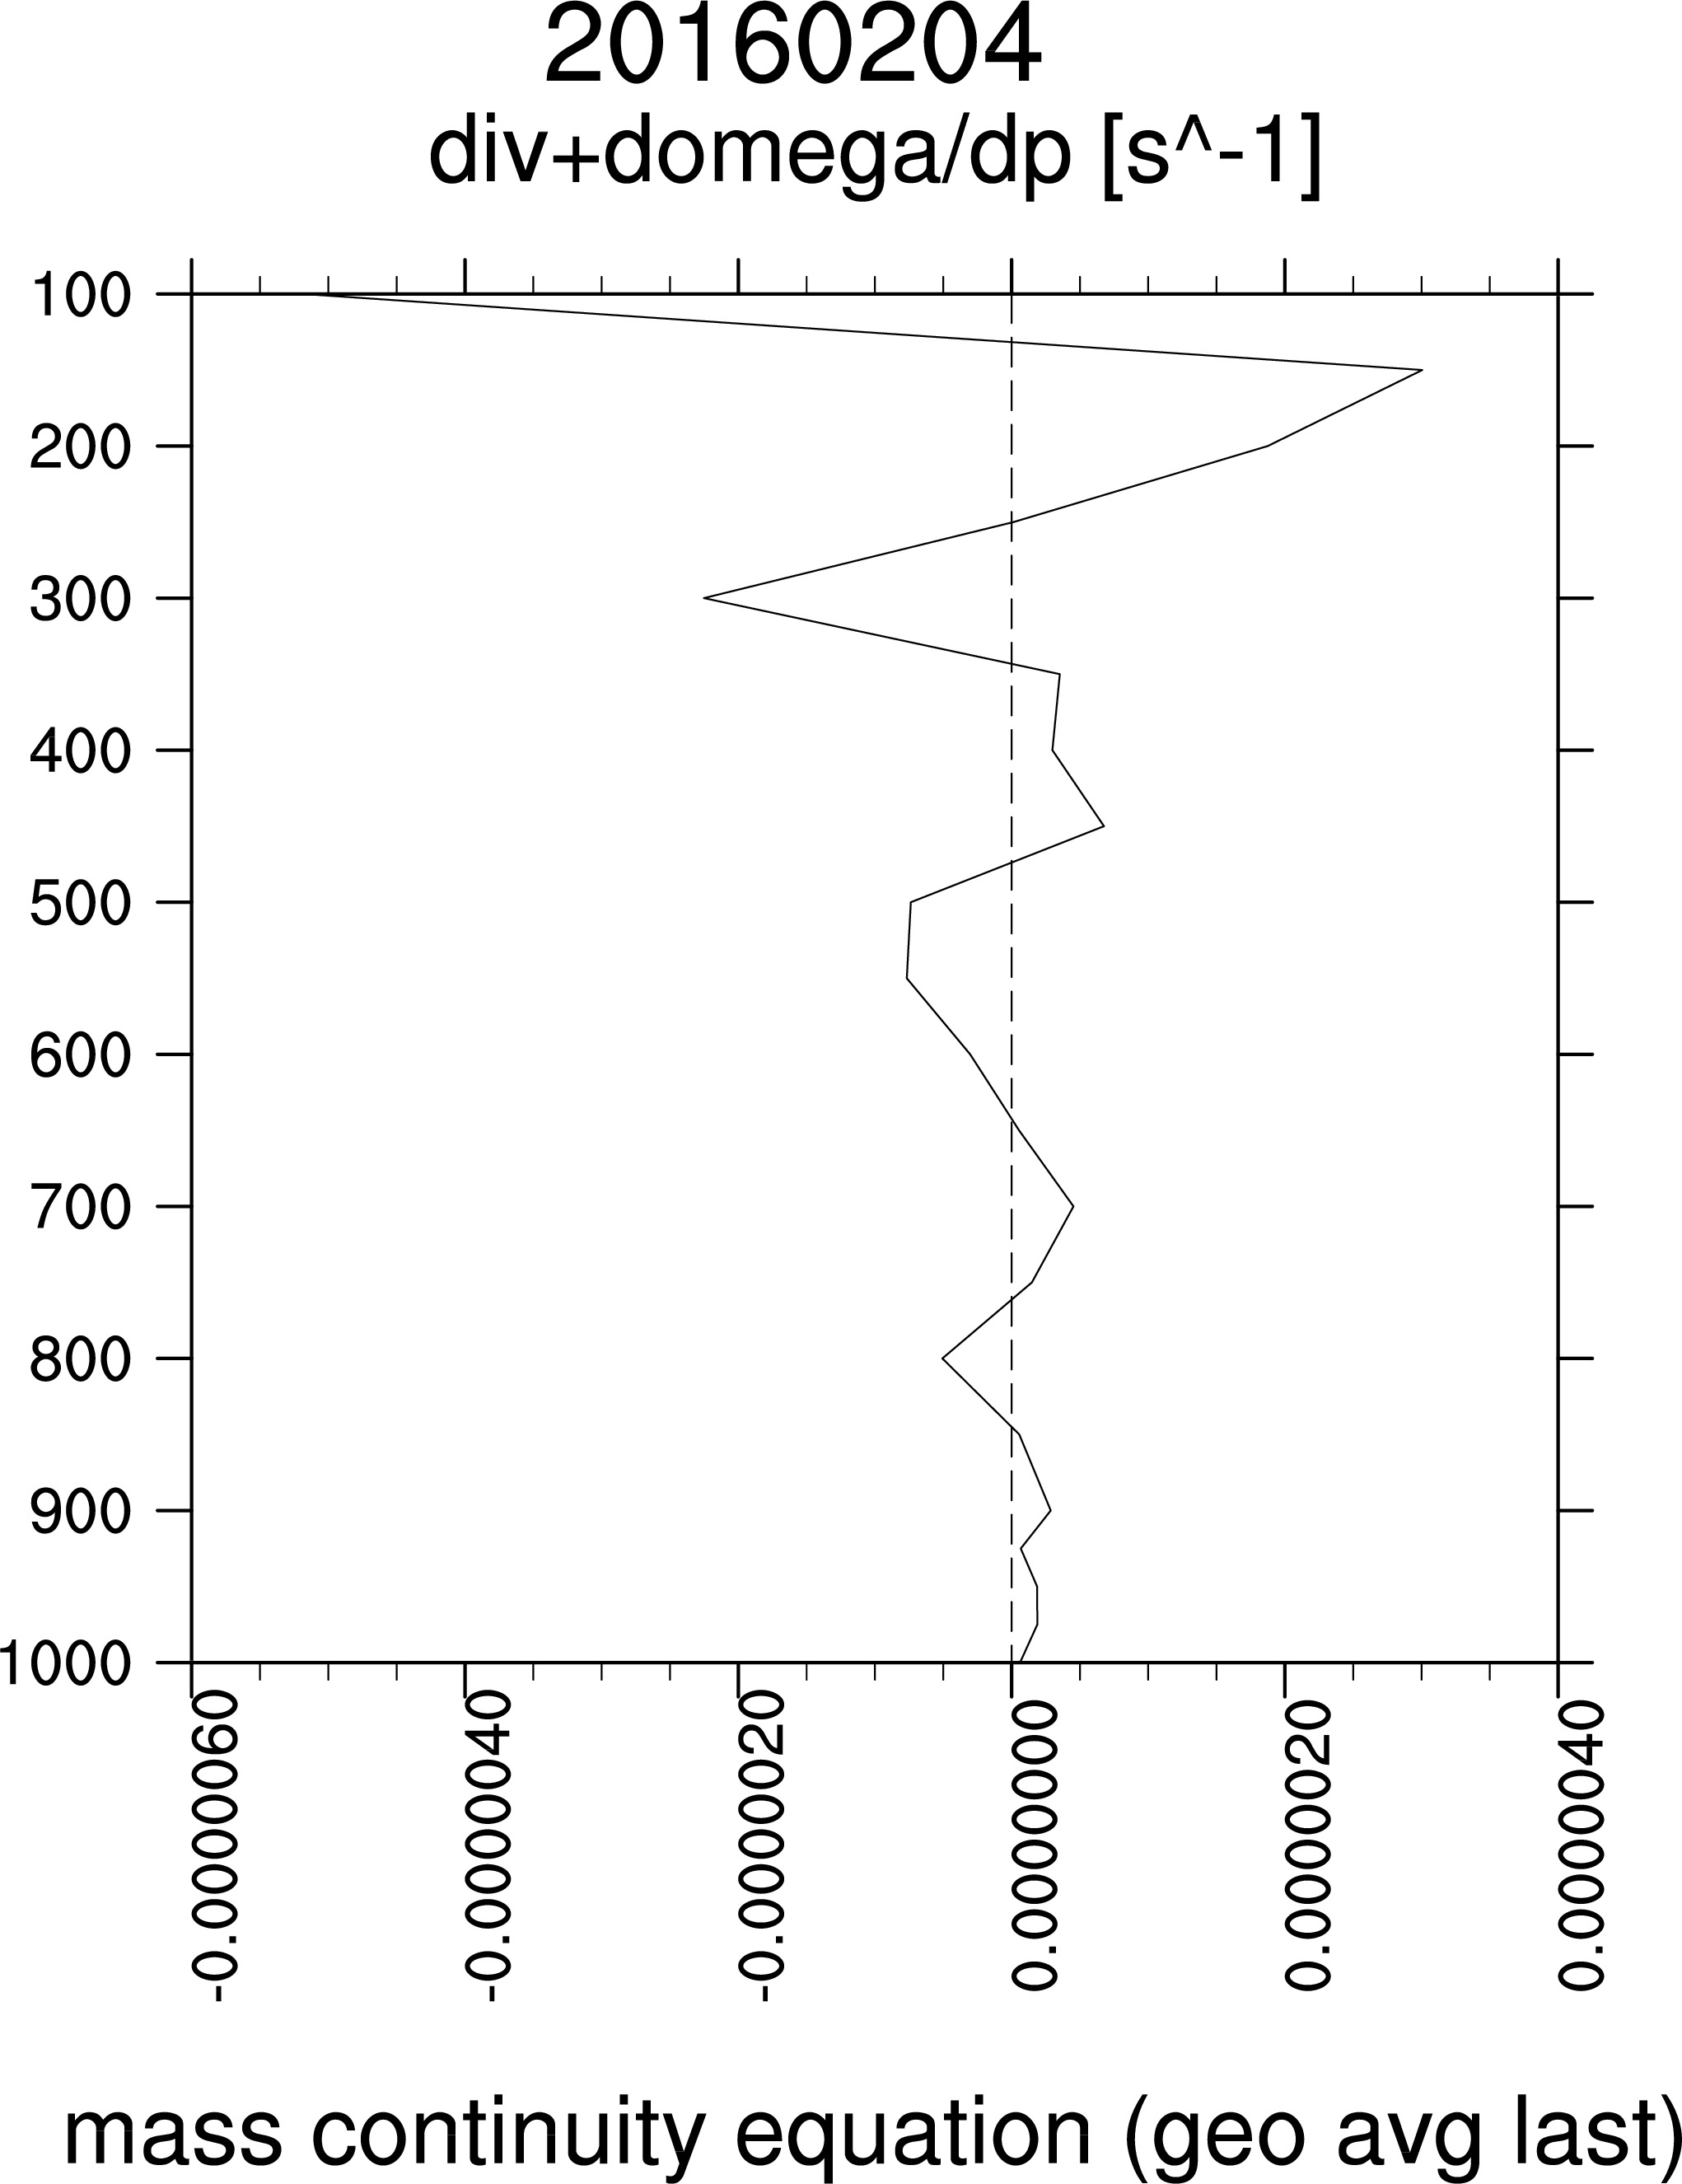
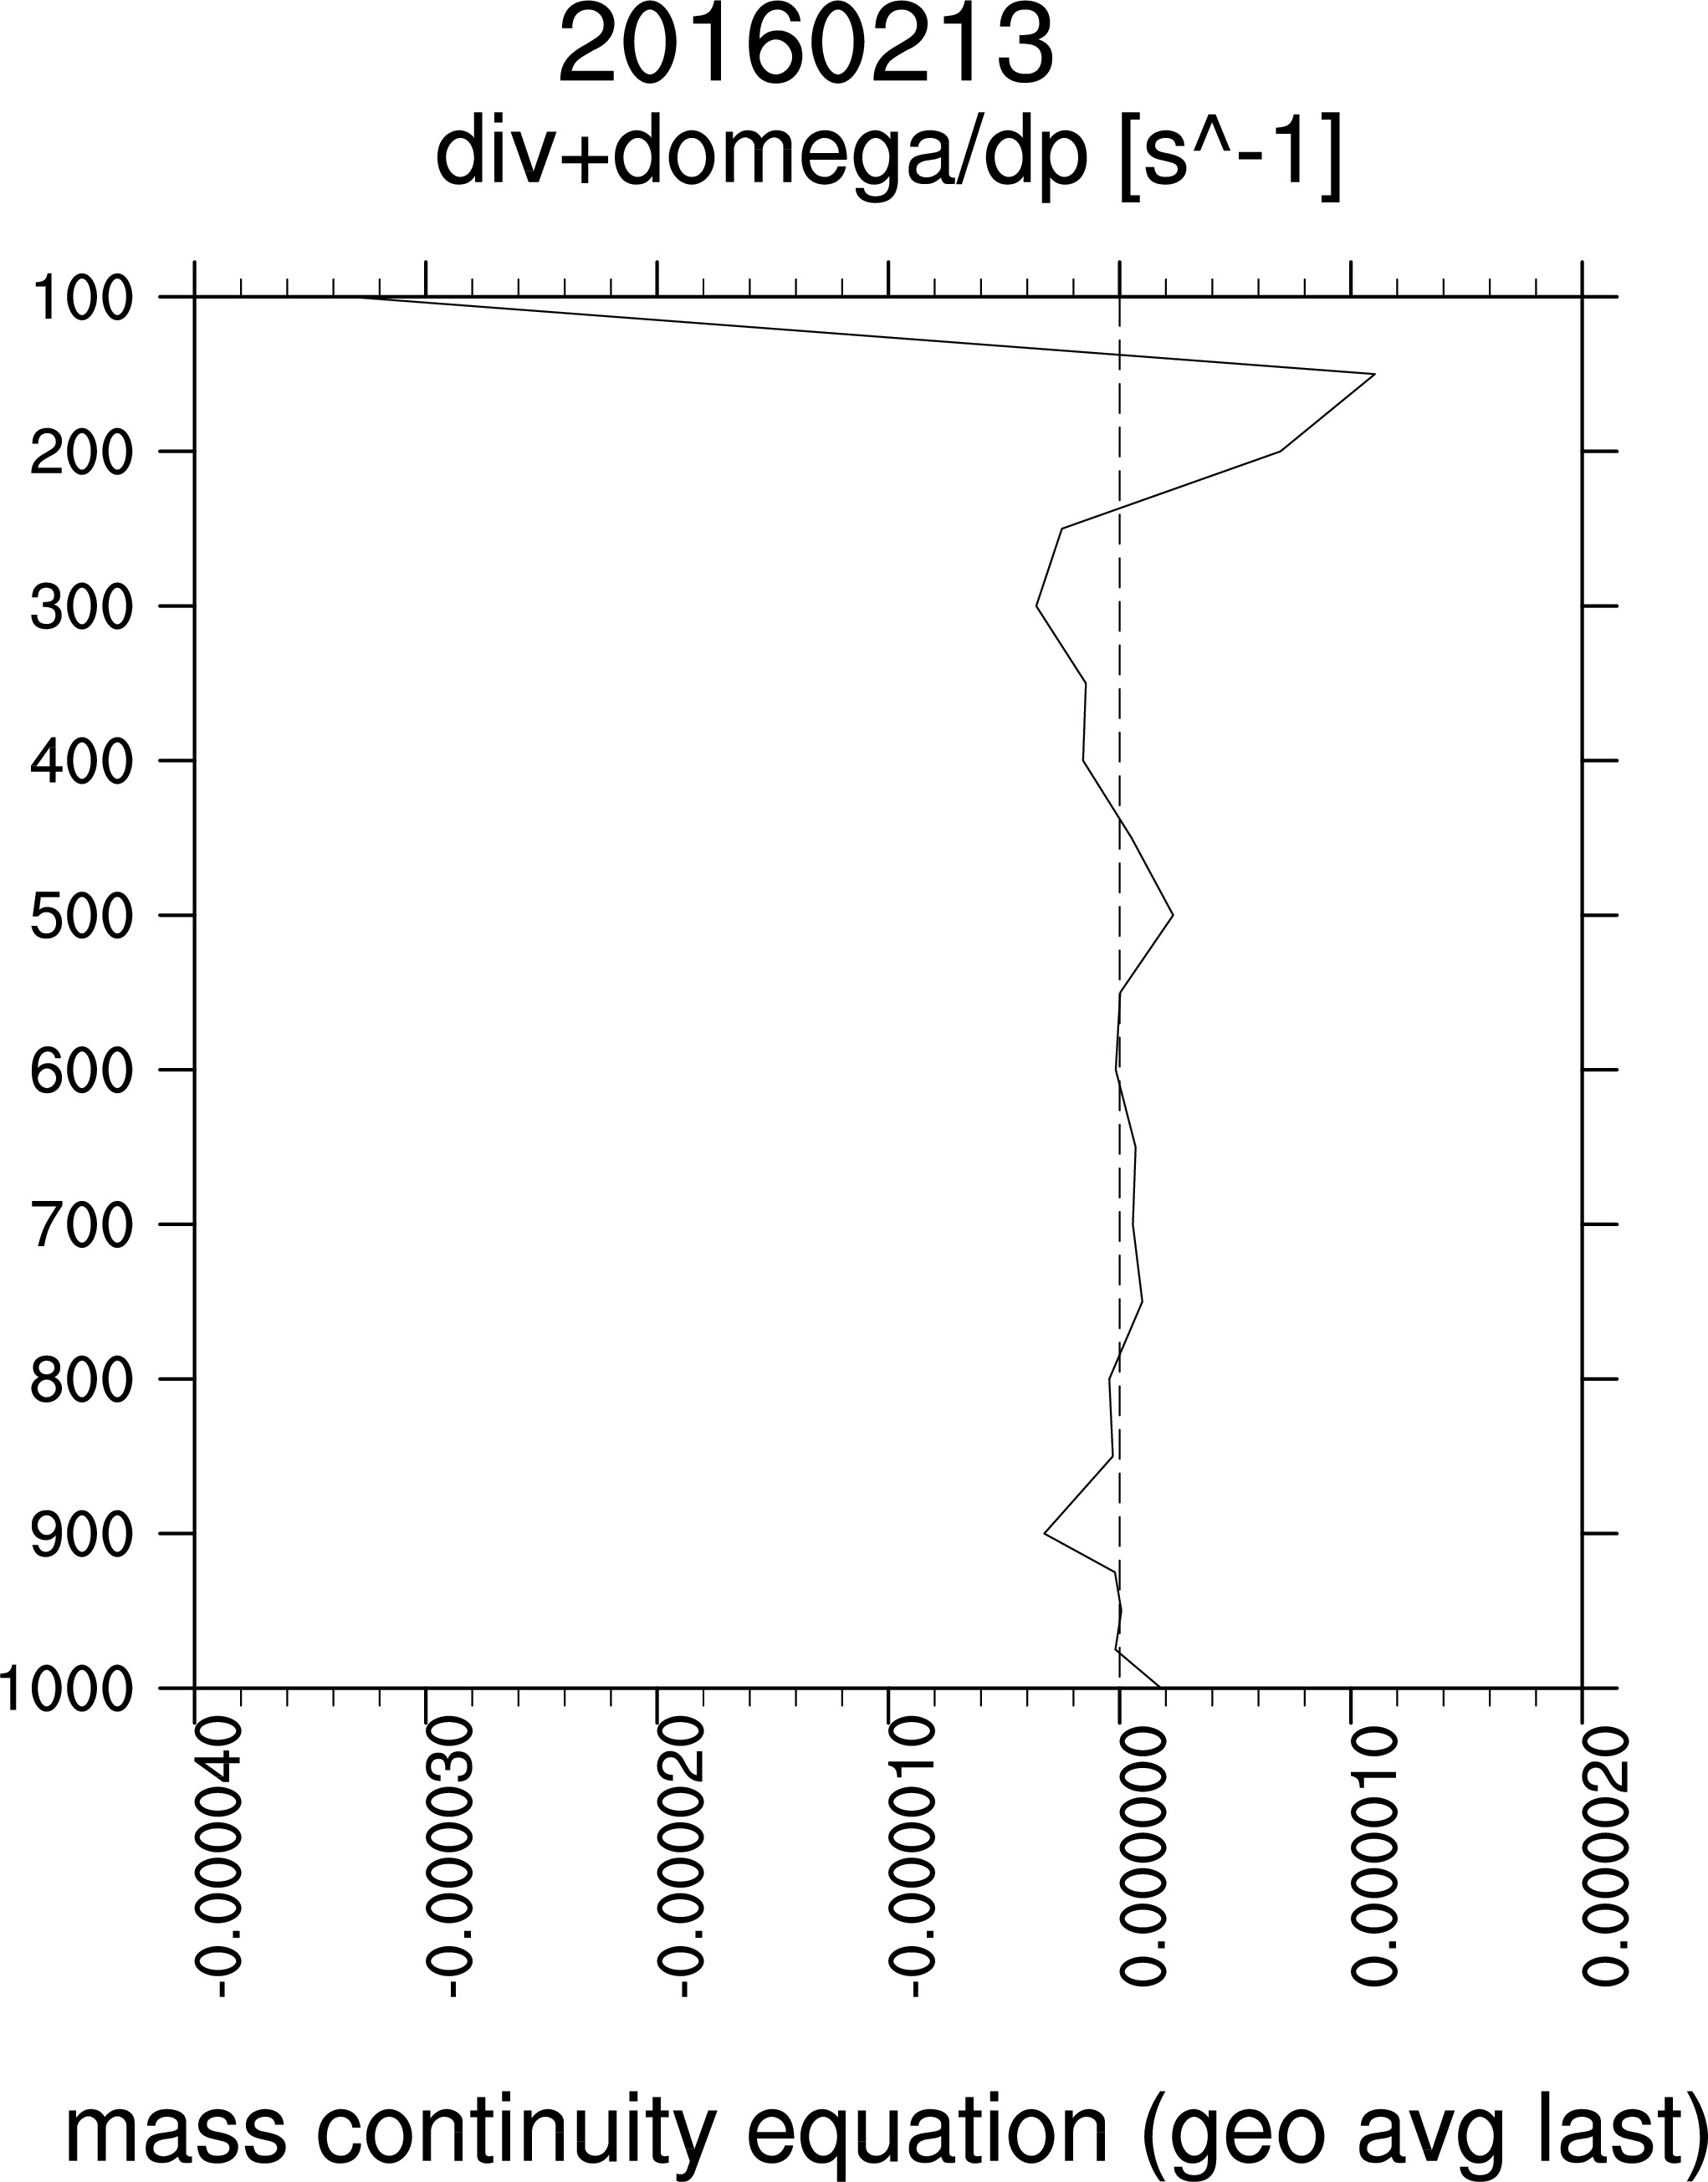
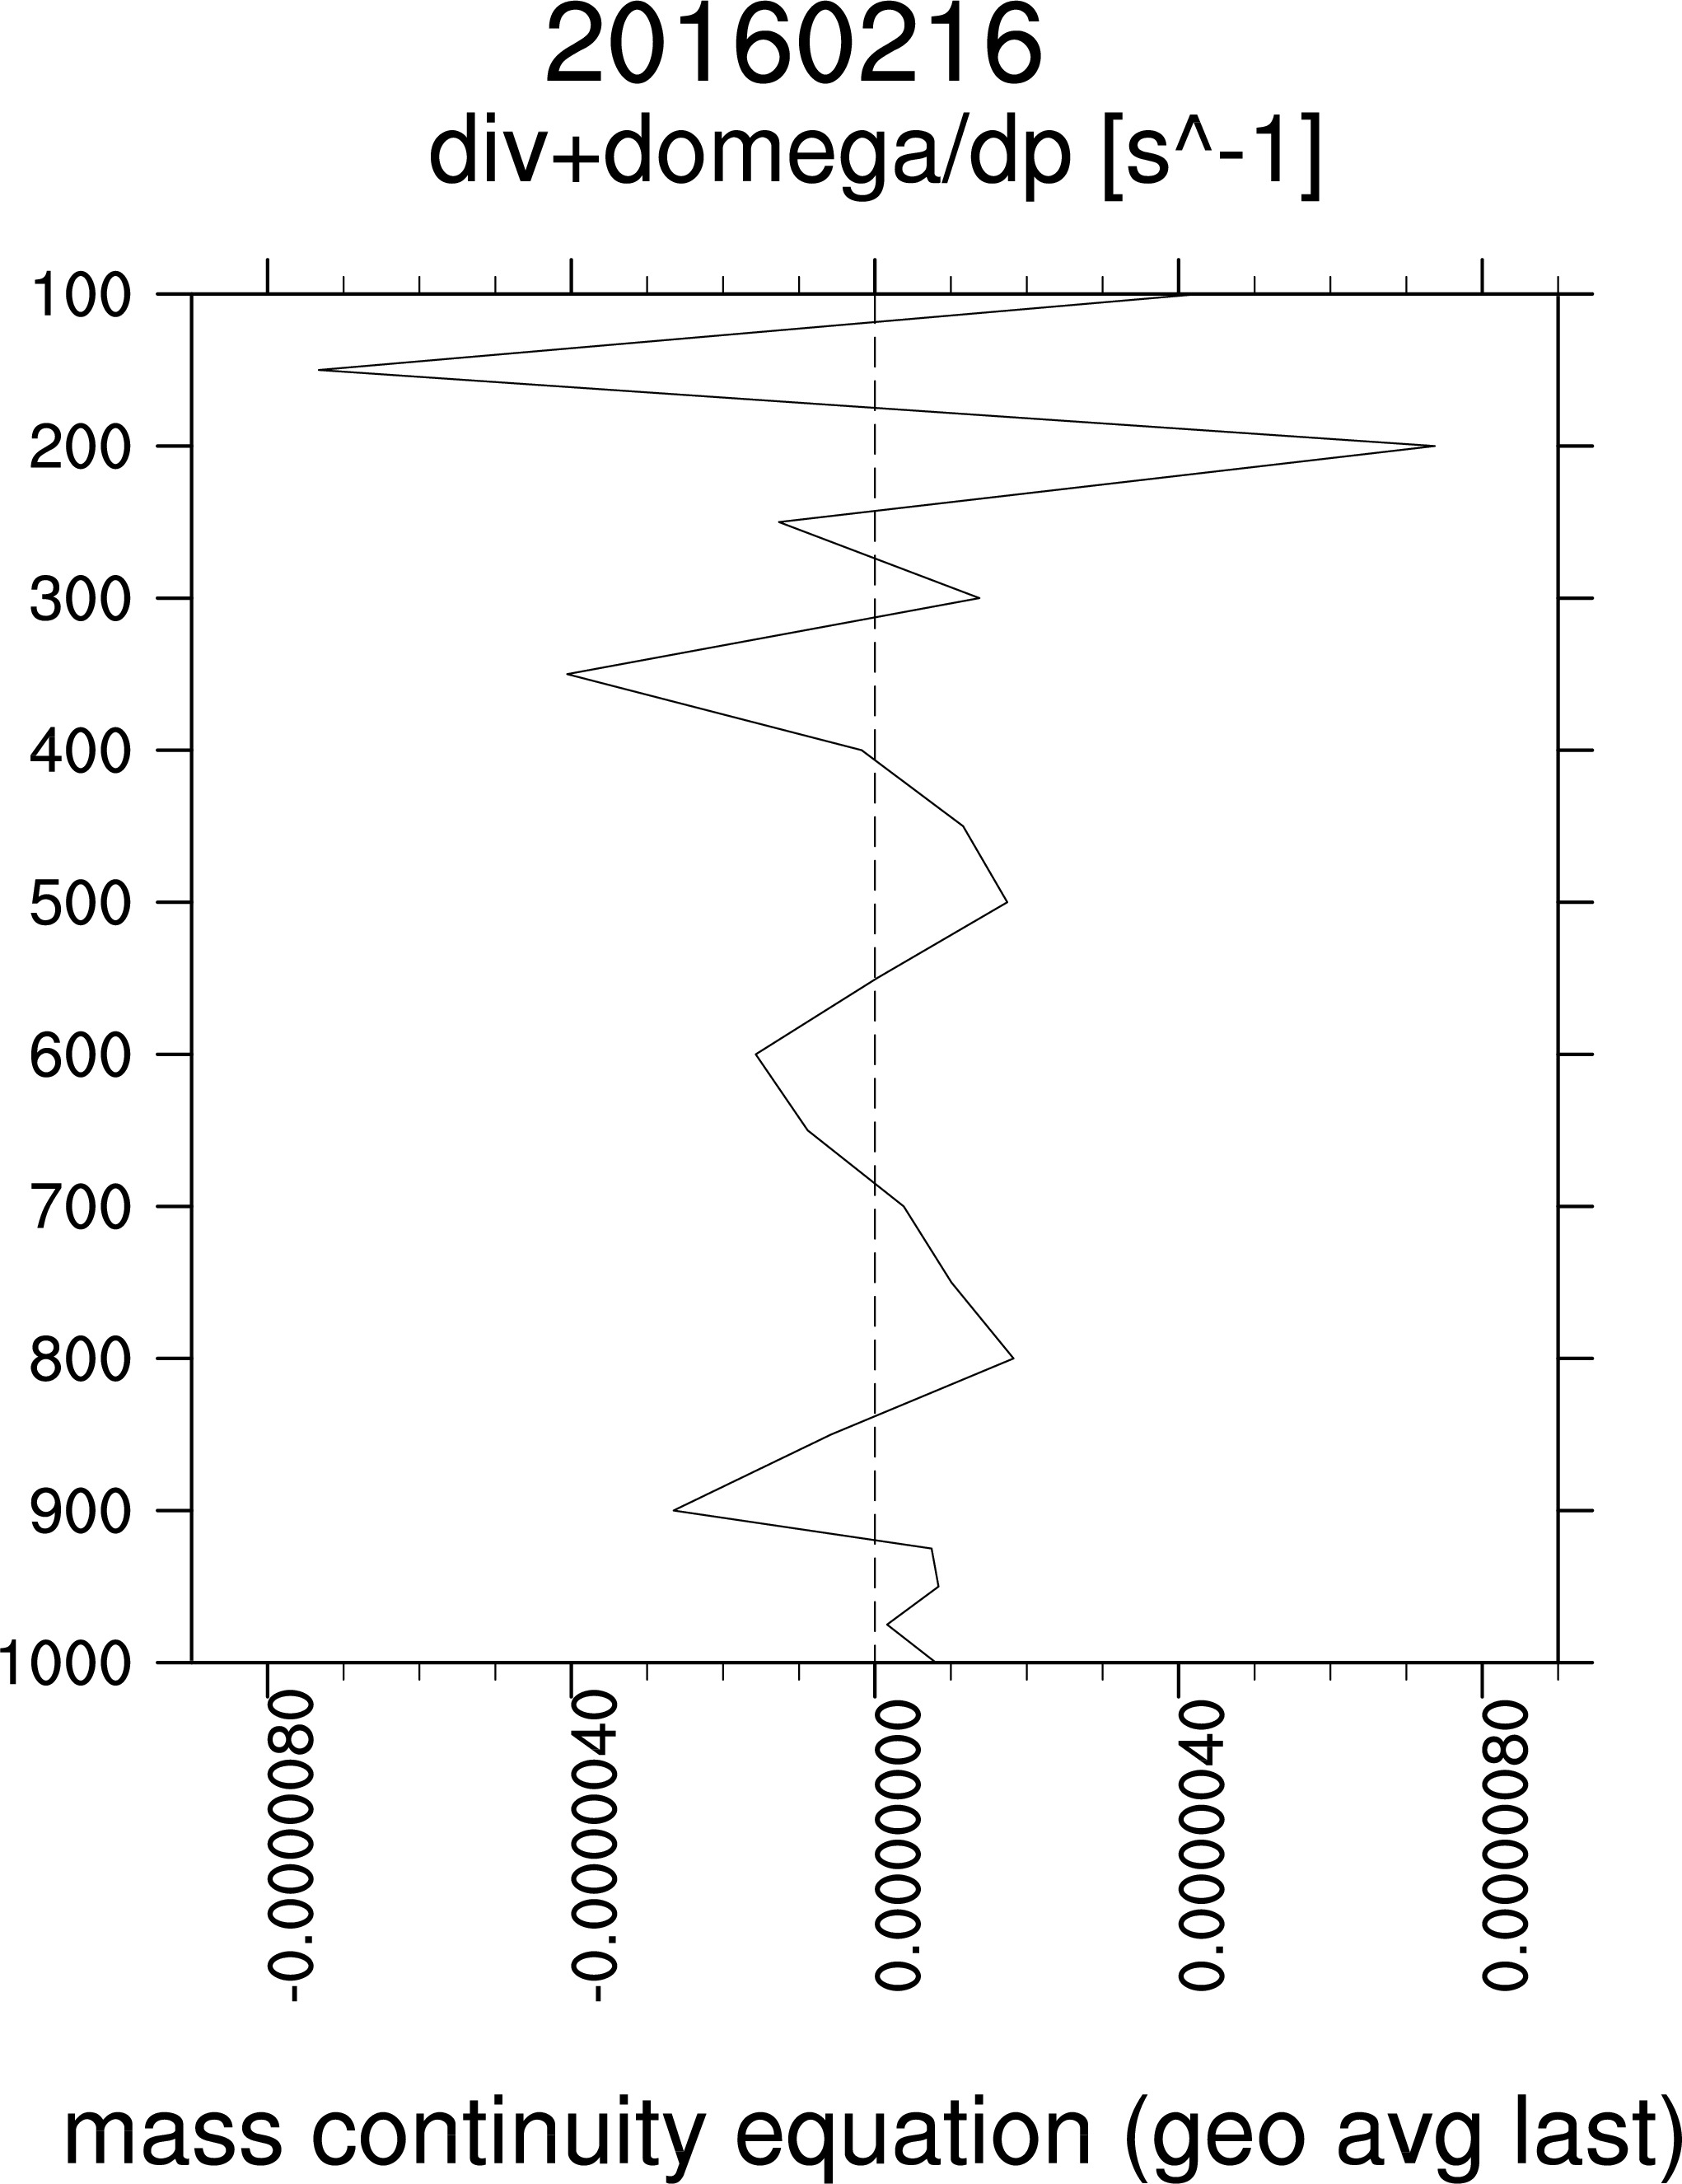
------------------------------------------------------------------------------------------------------------------------------------------------------------------------------------------------------------
ENRRR Analysis 2017
Skinny Wrap/Coat Hanger flights here
Wrap flights
Data files:
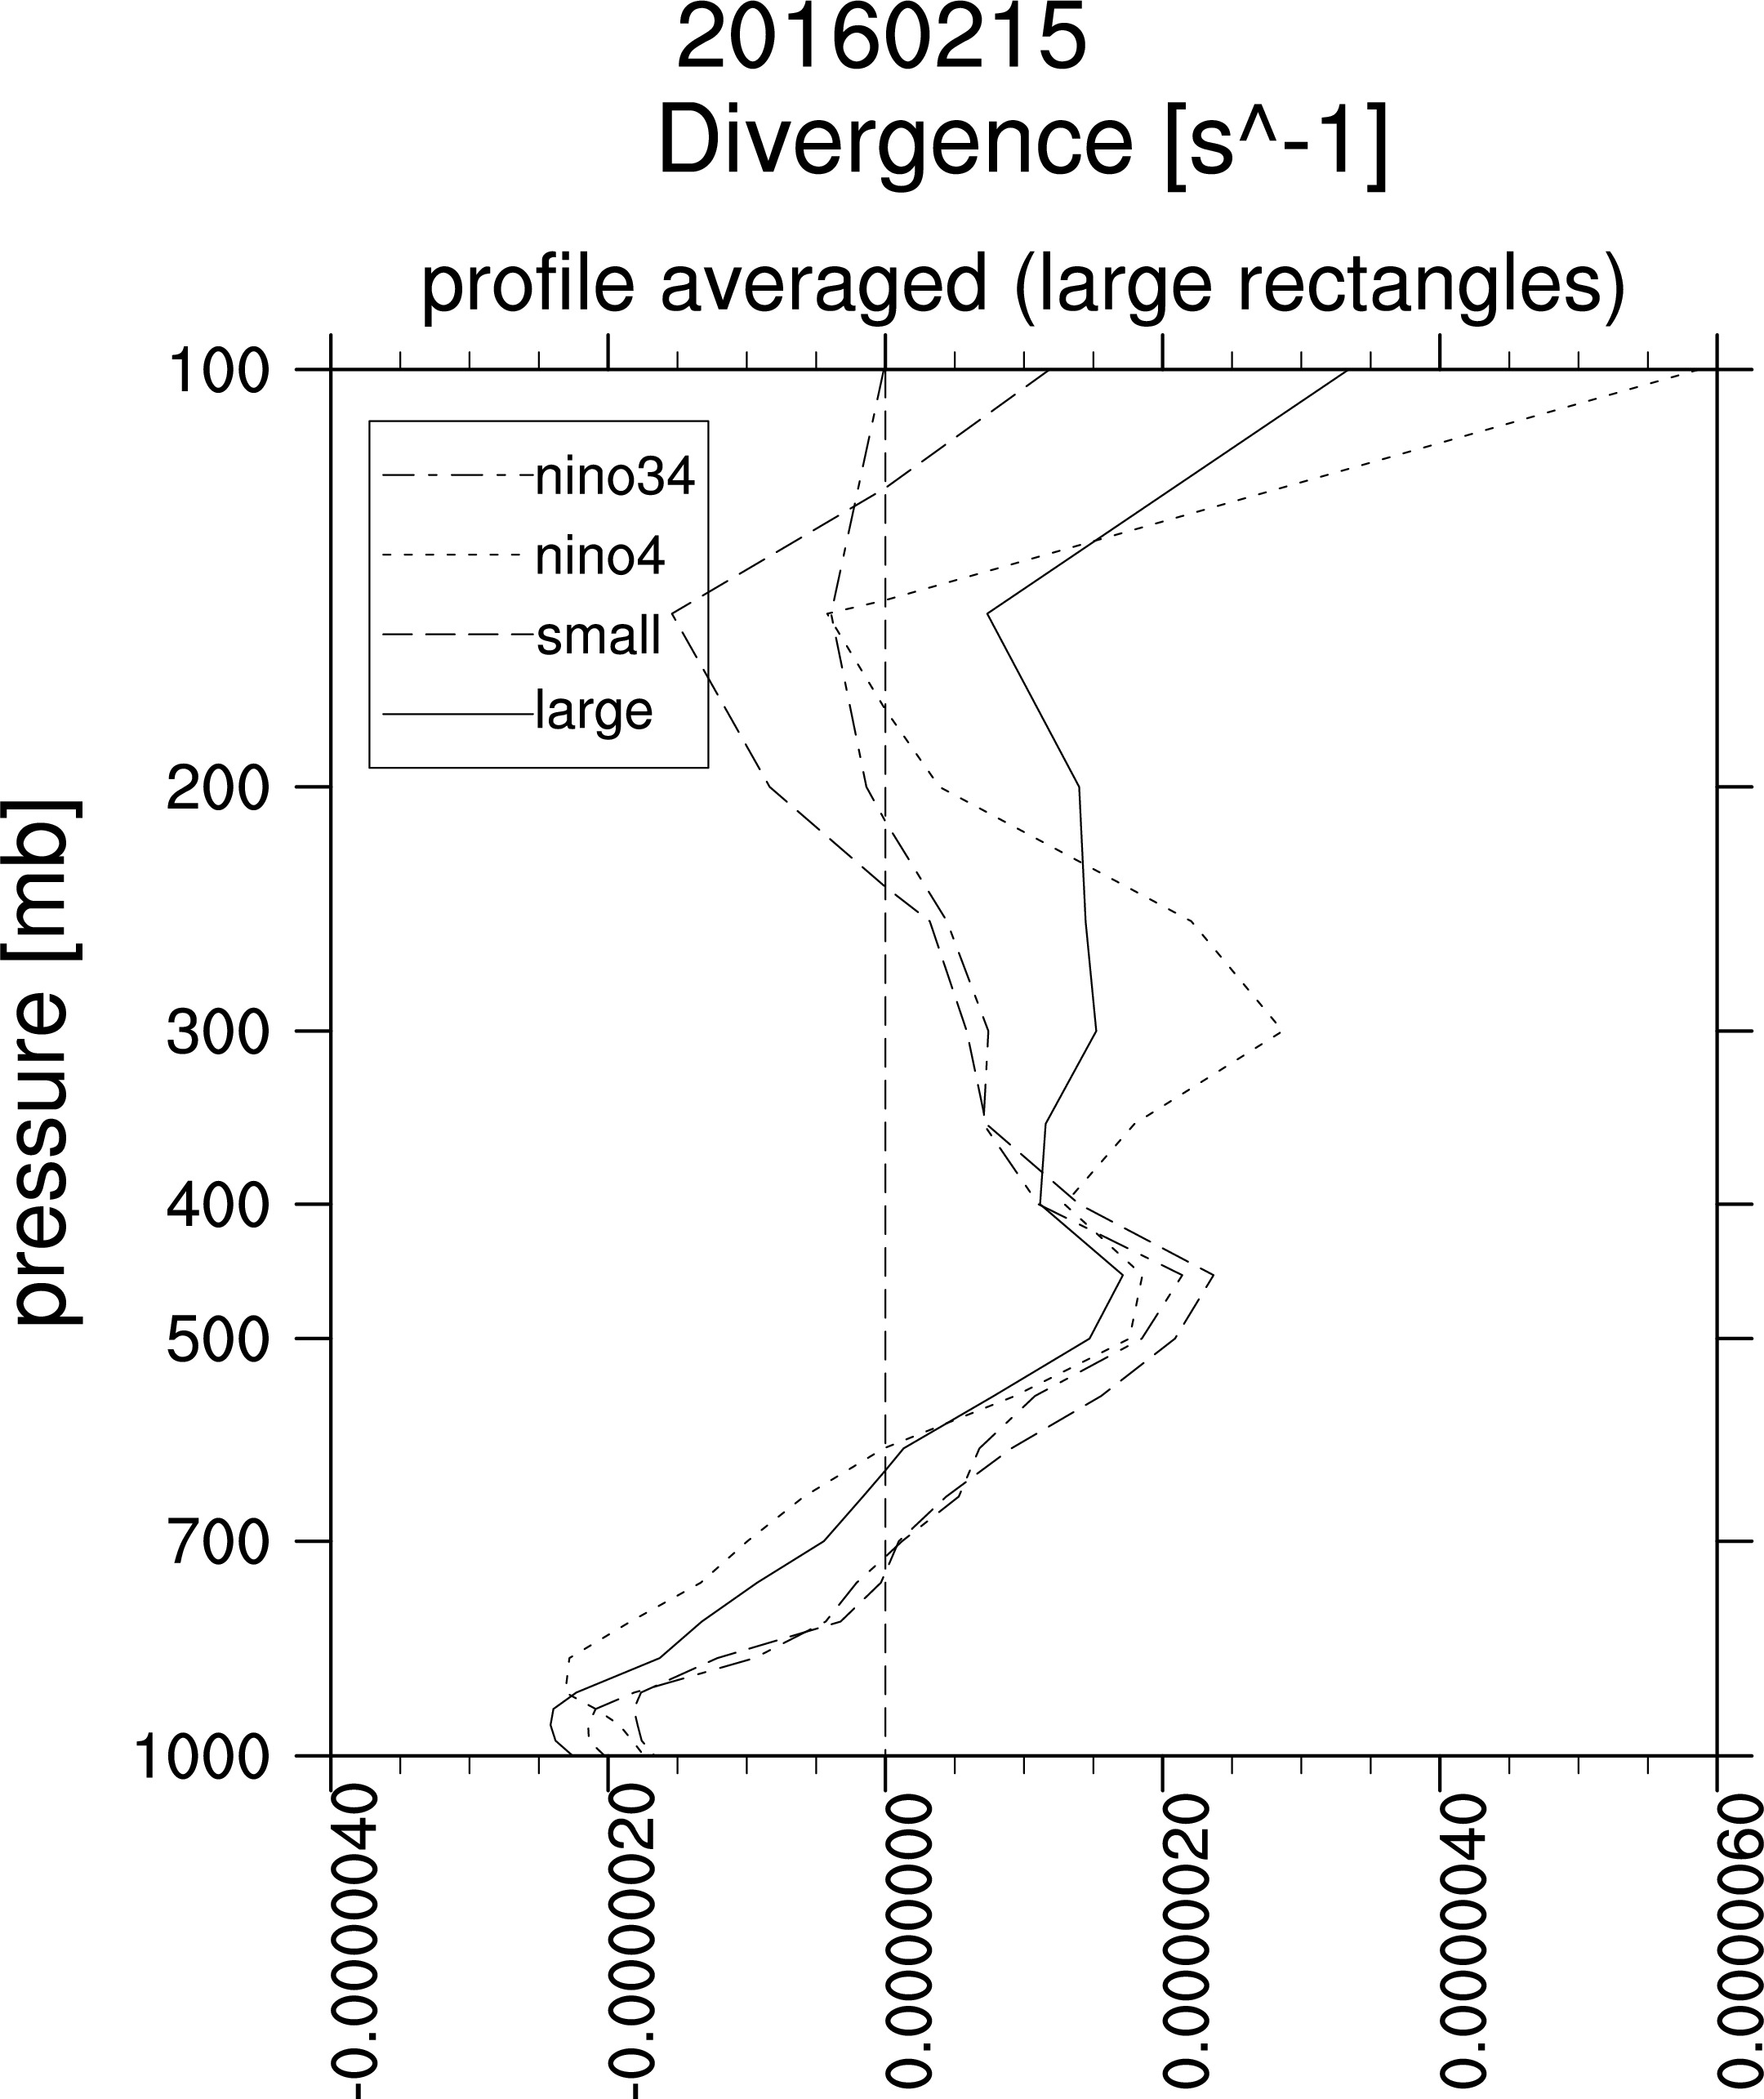
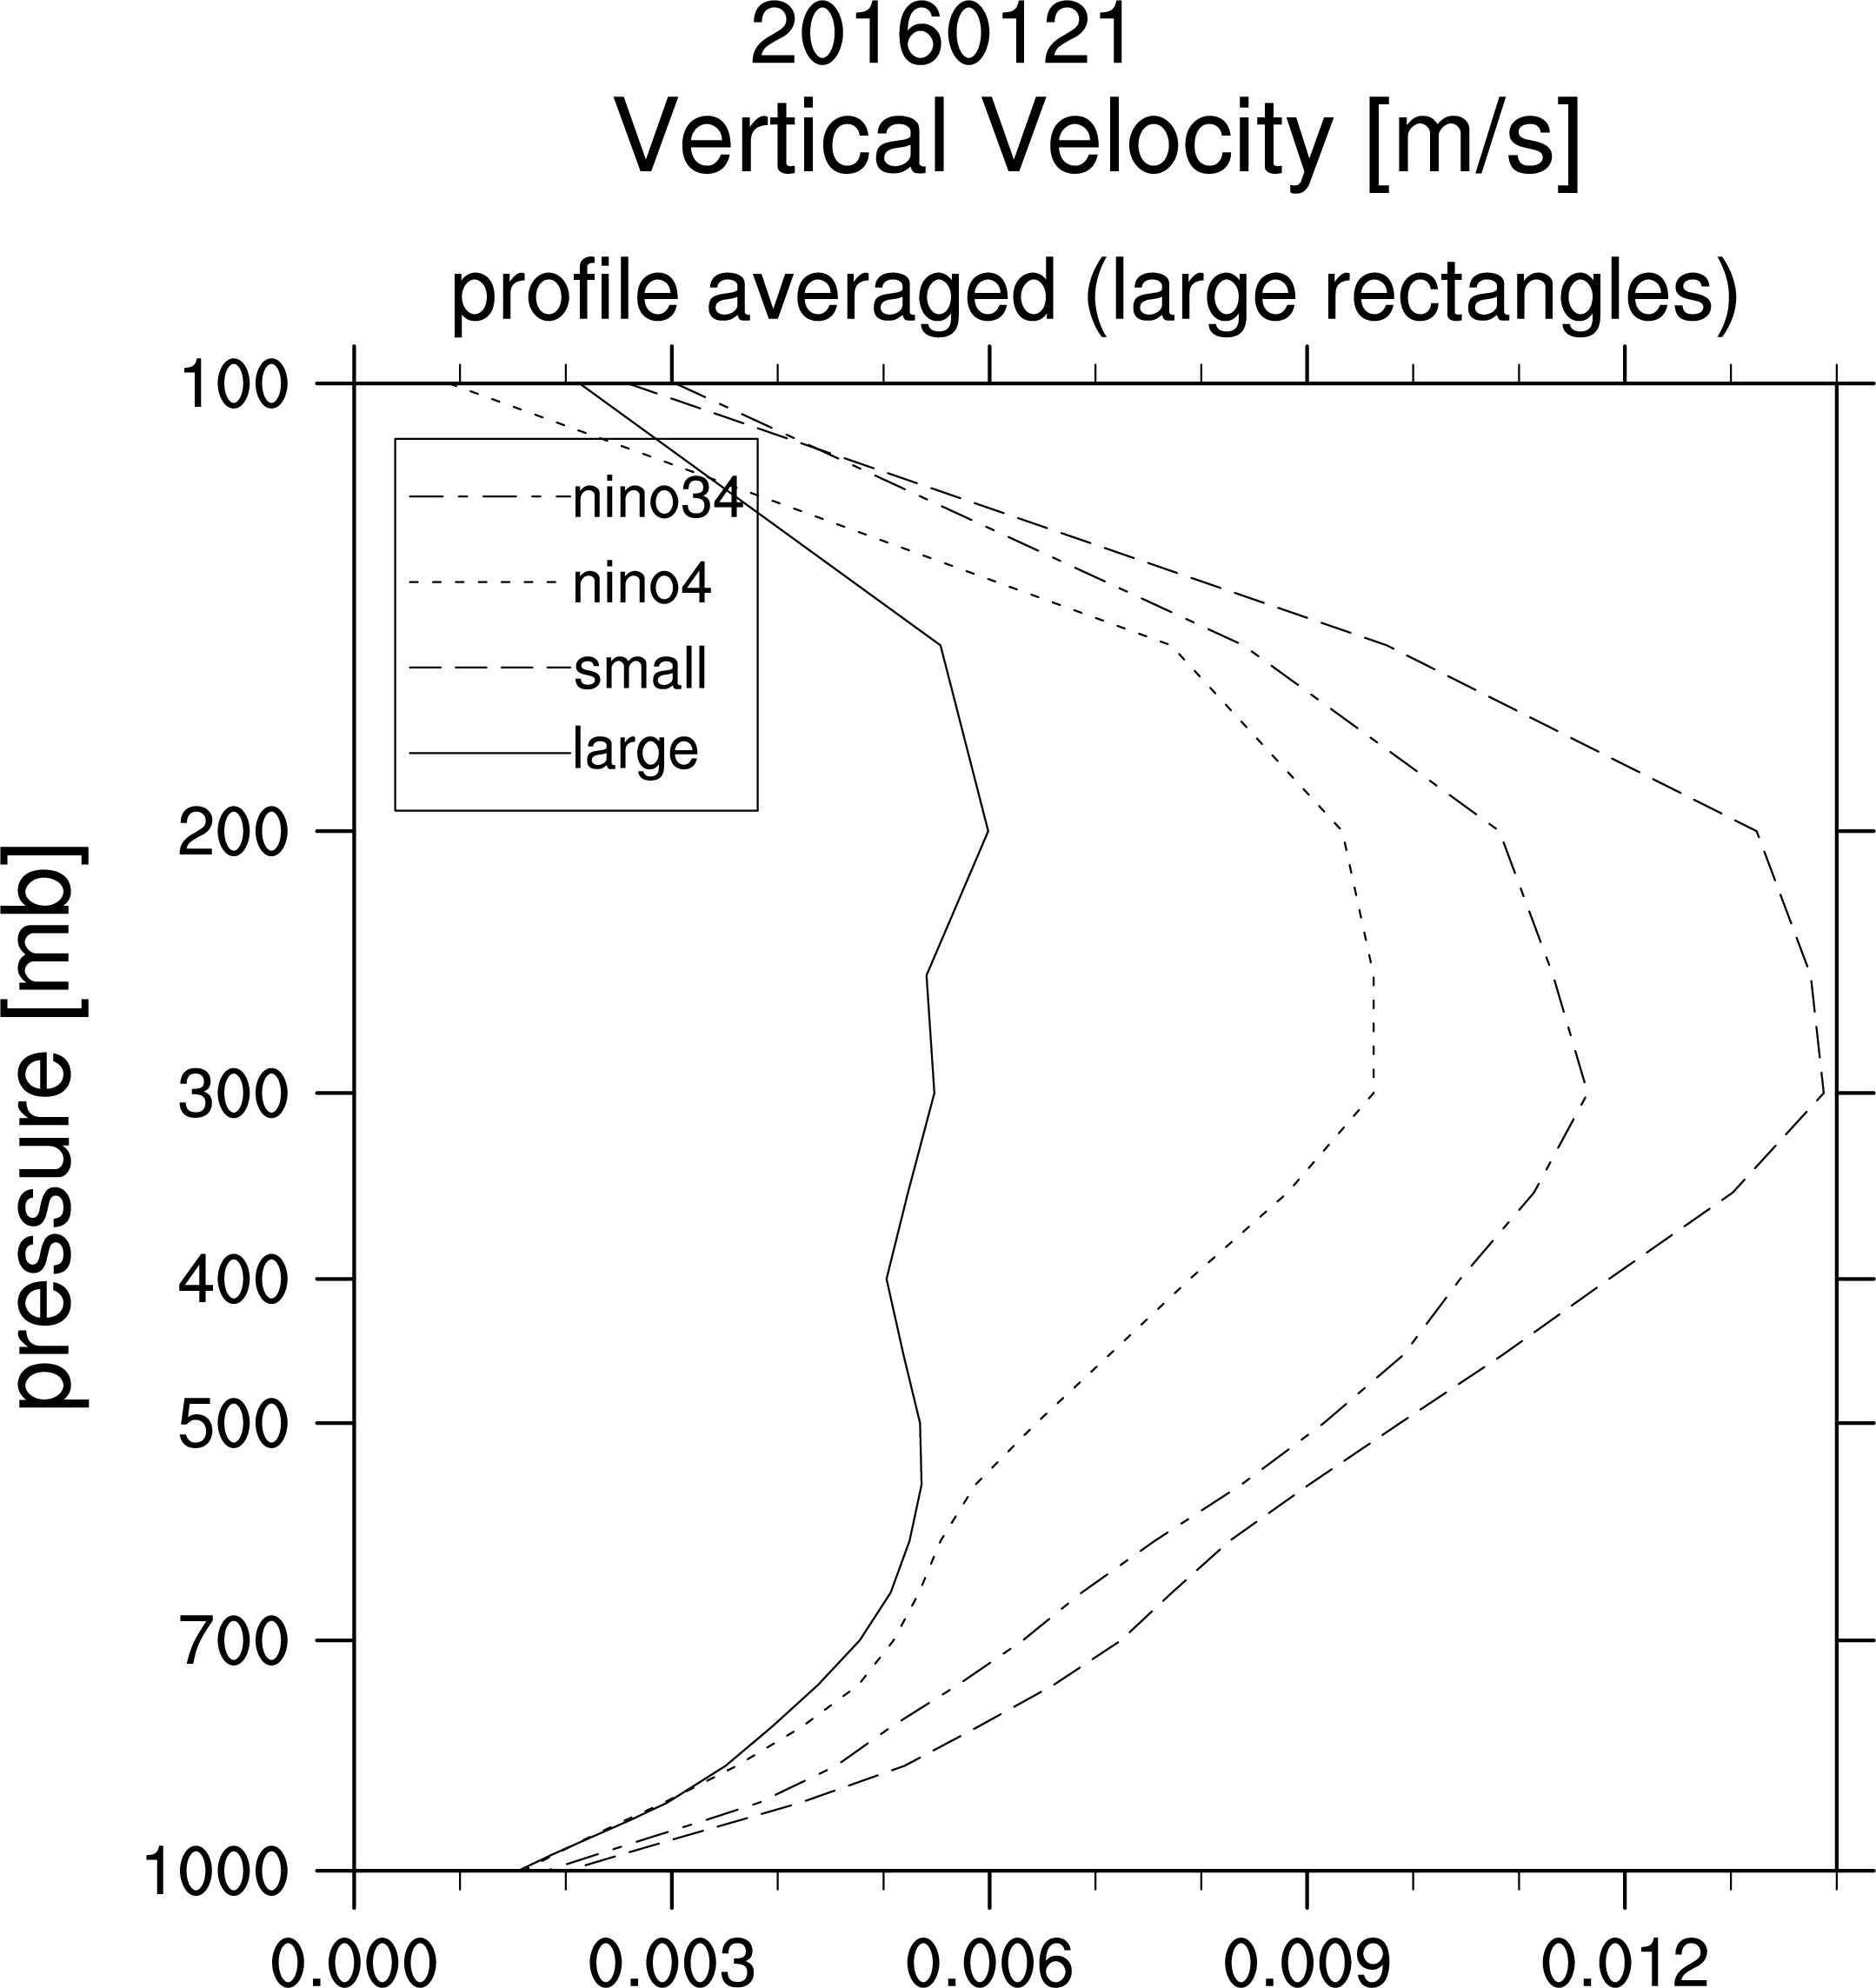
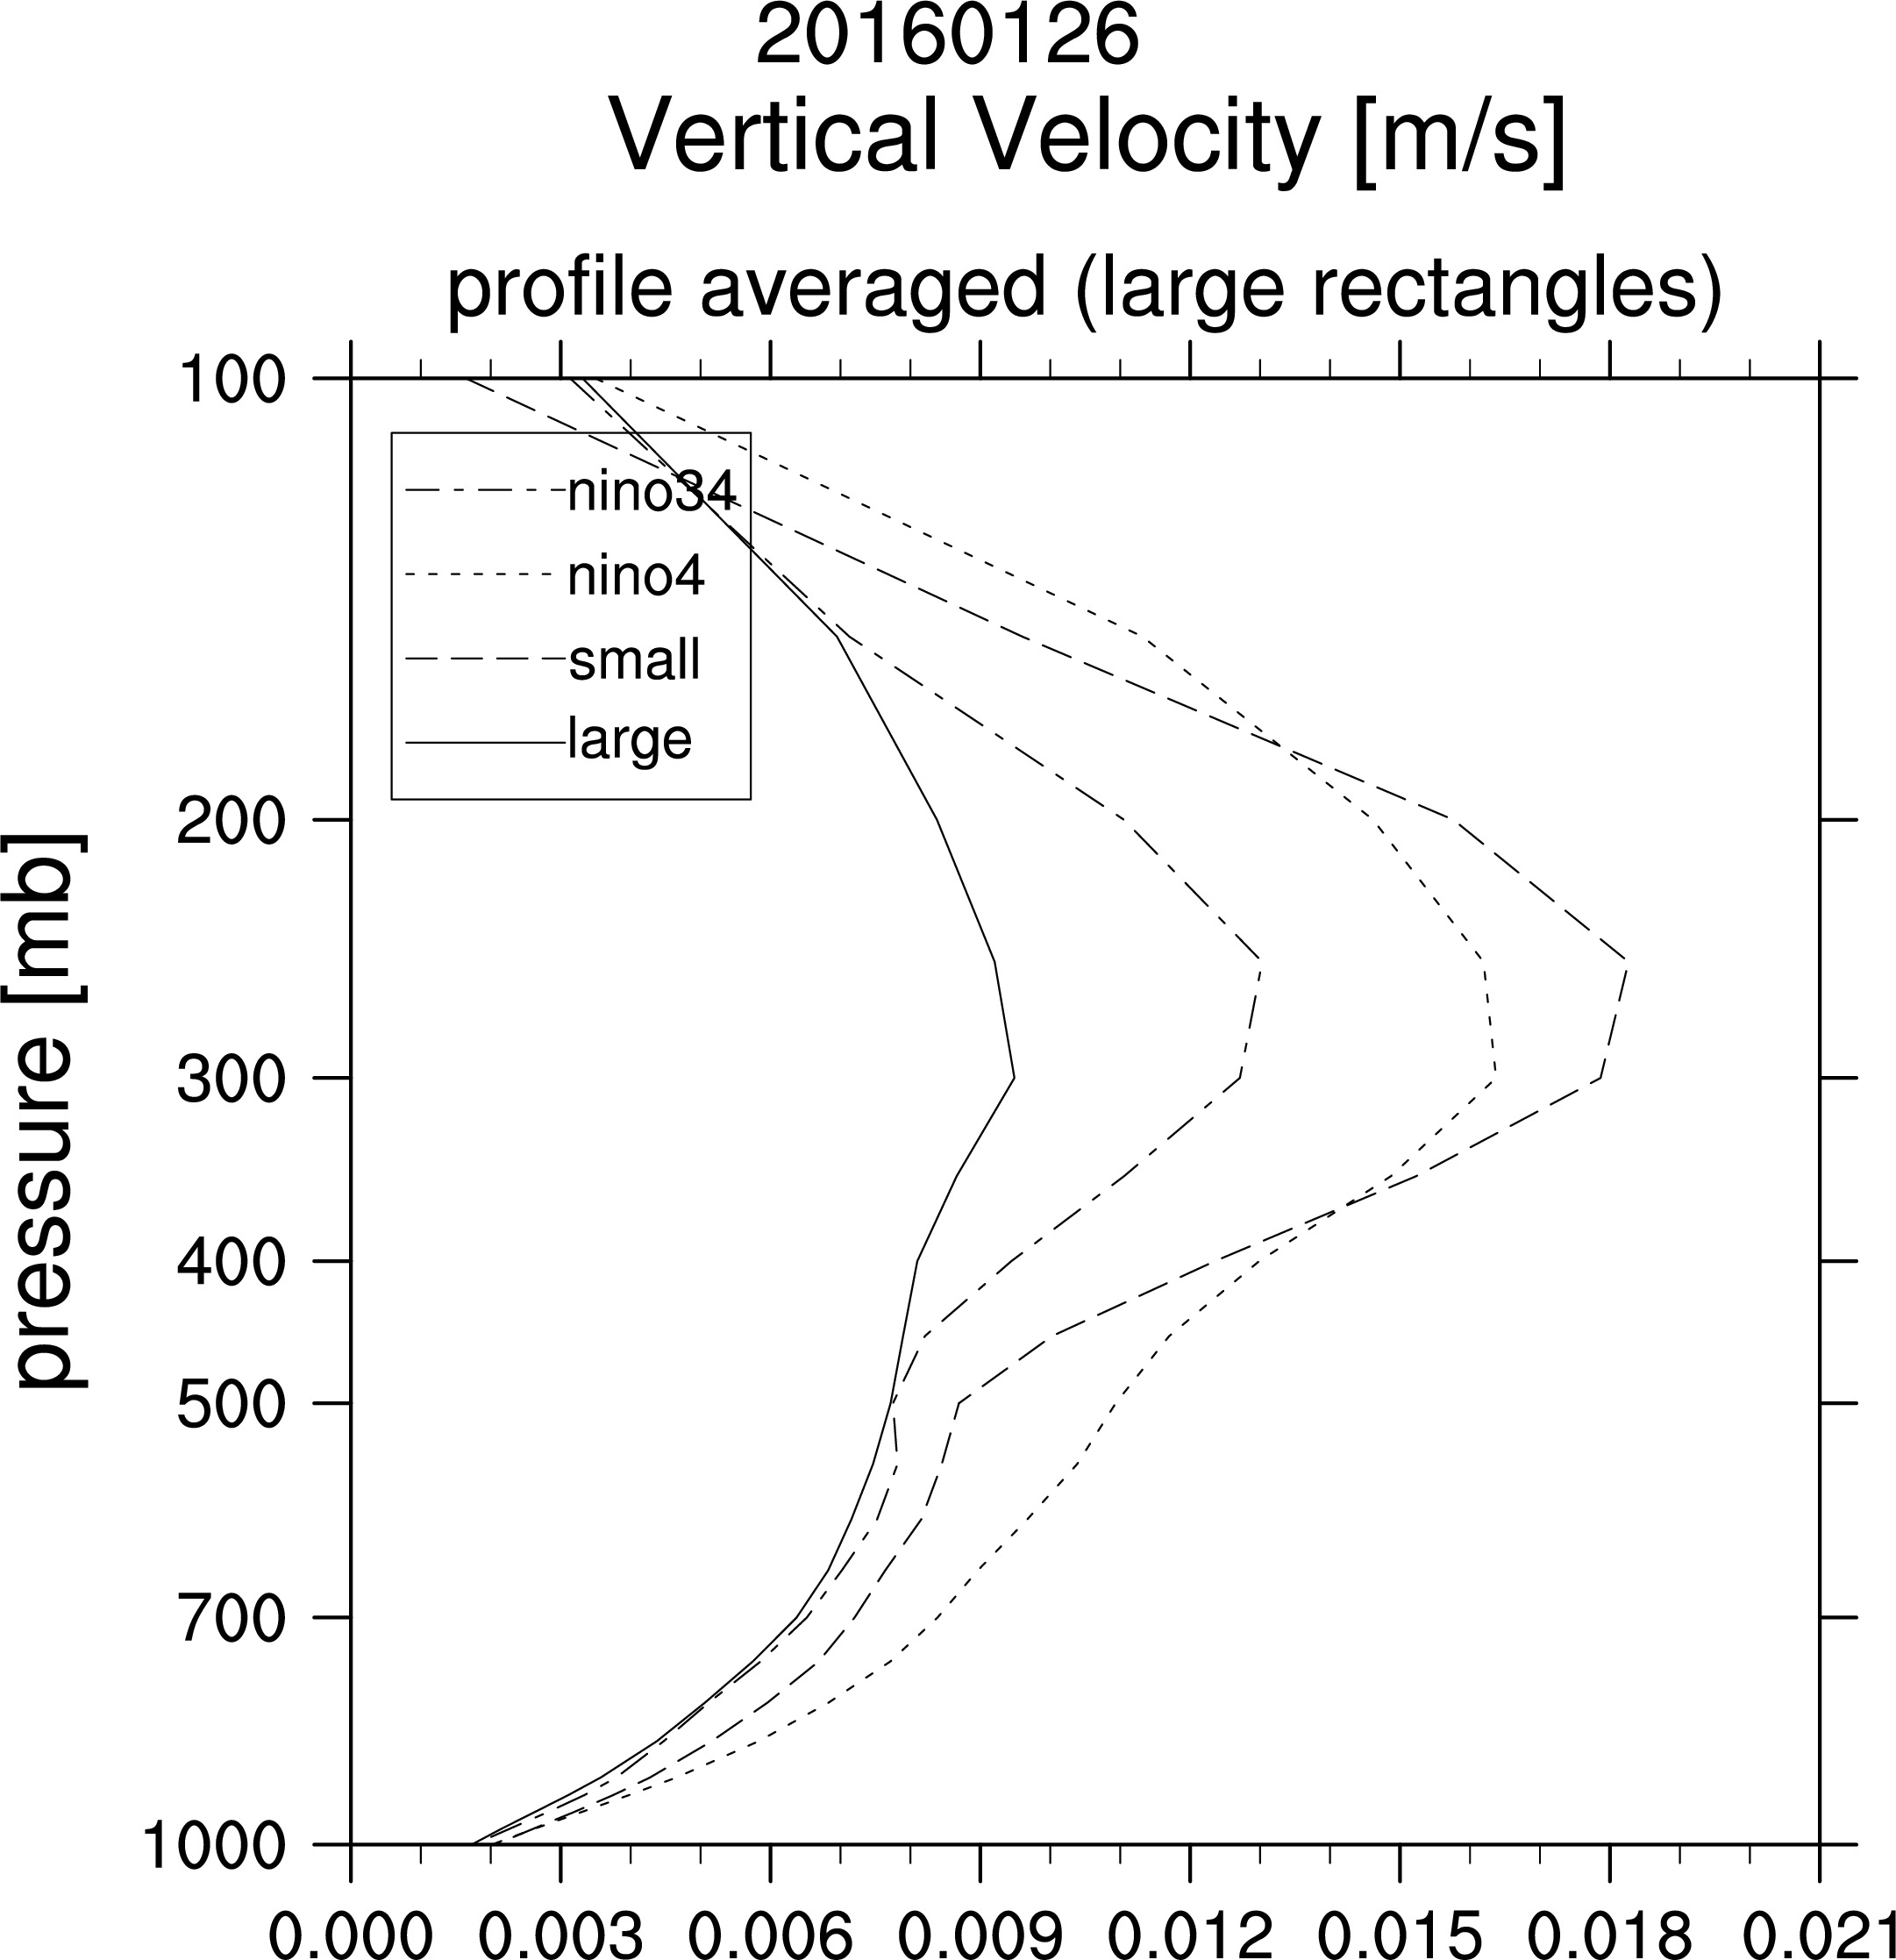
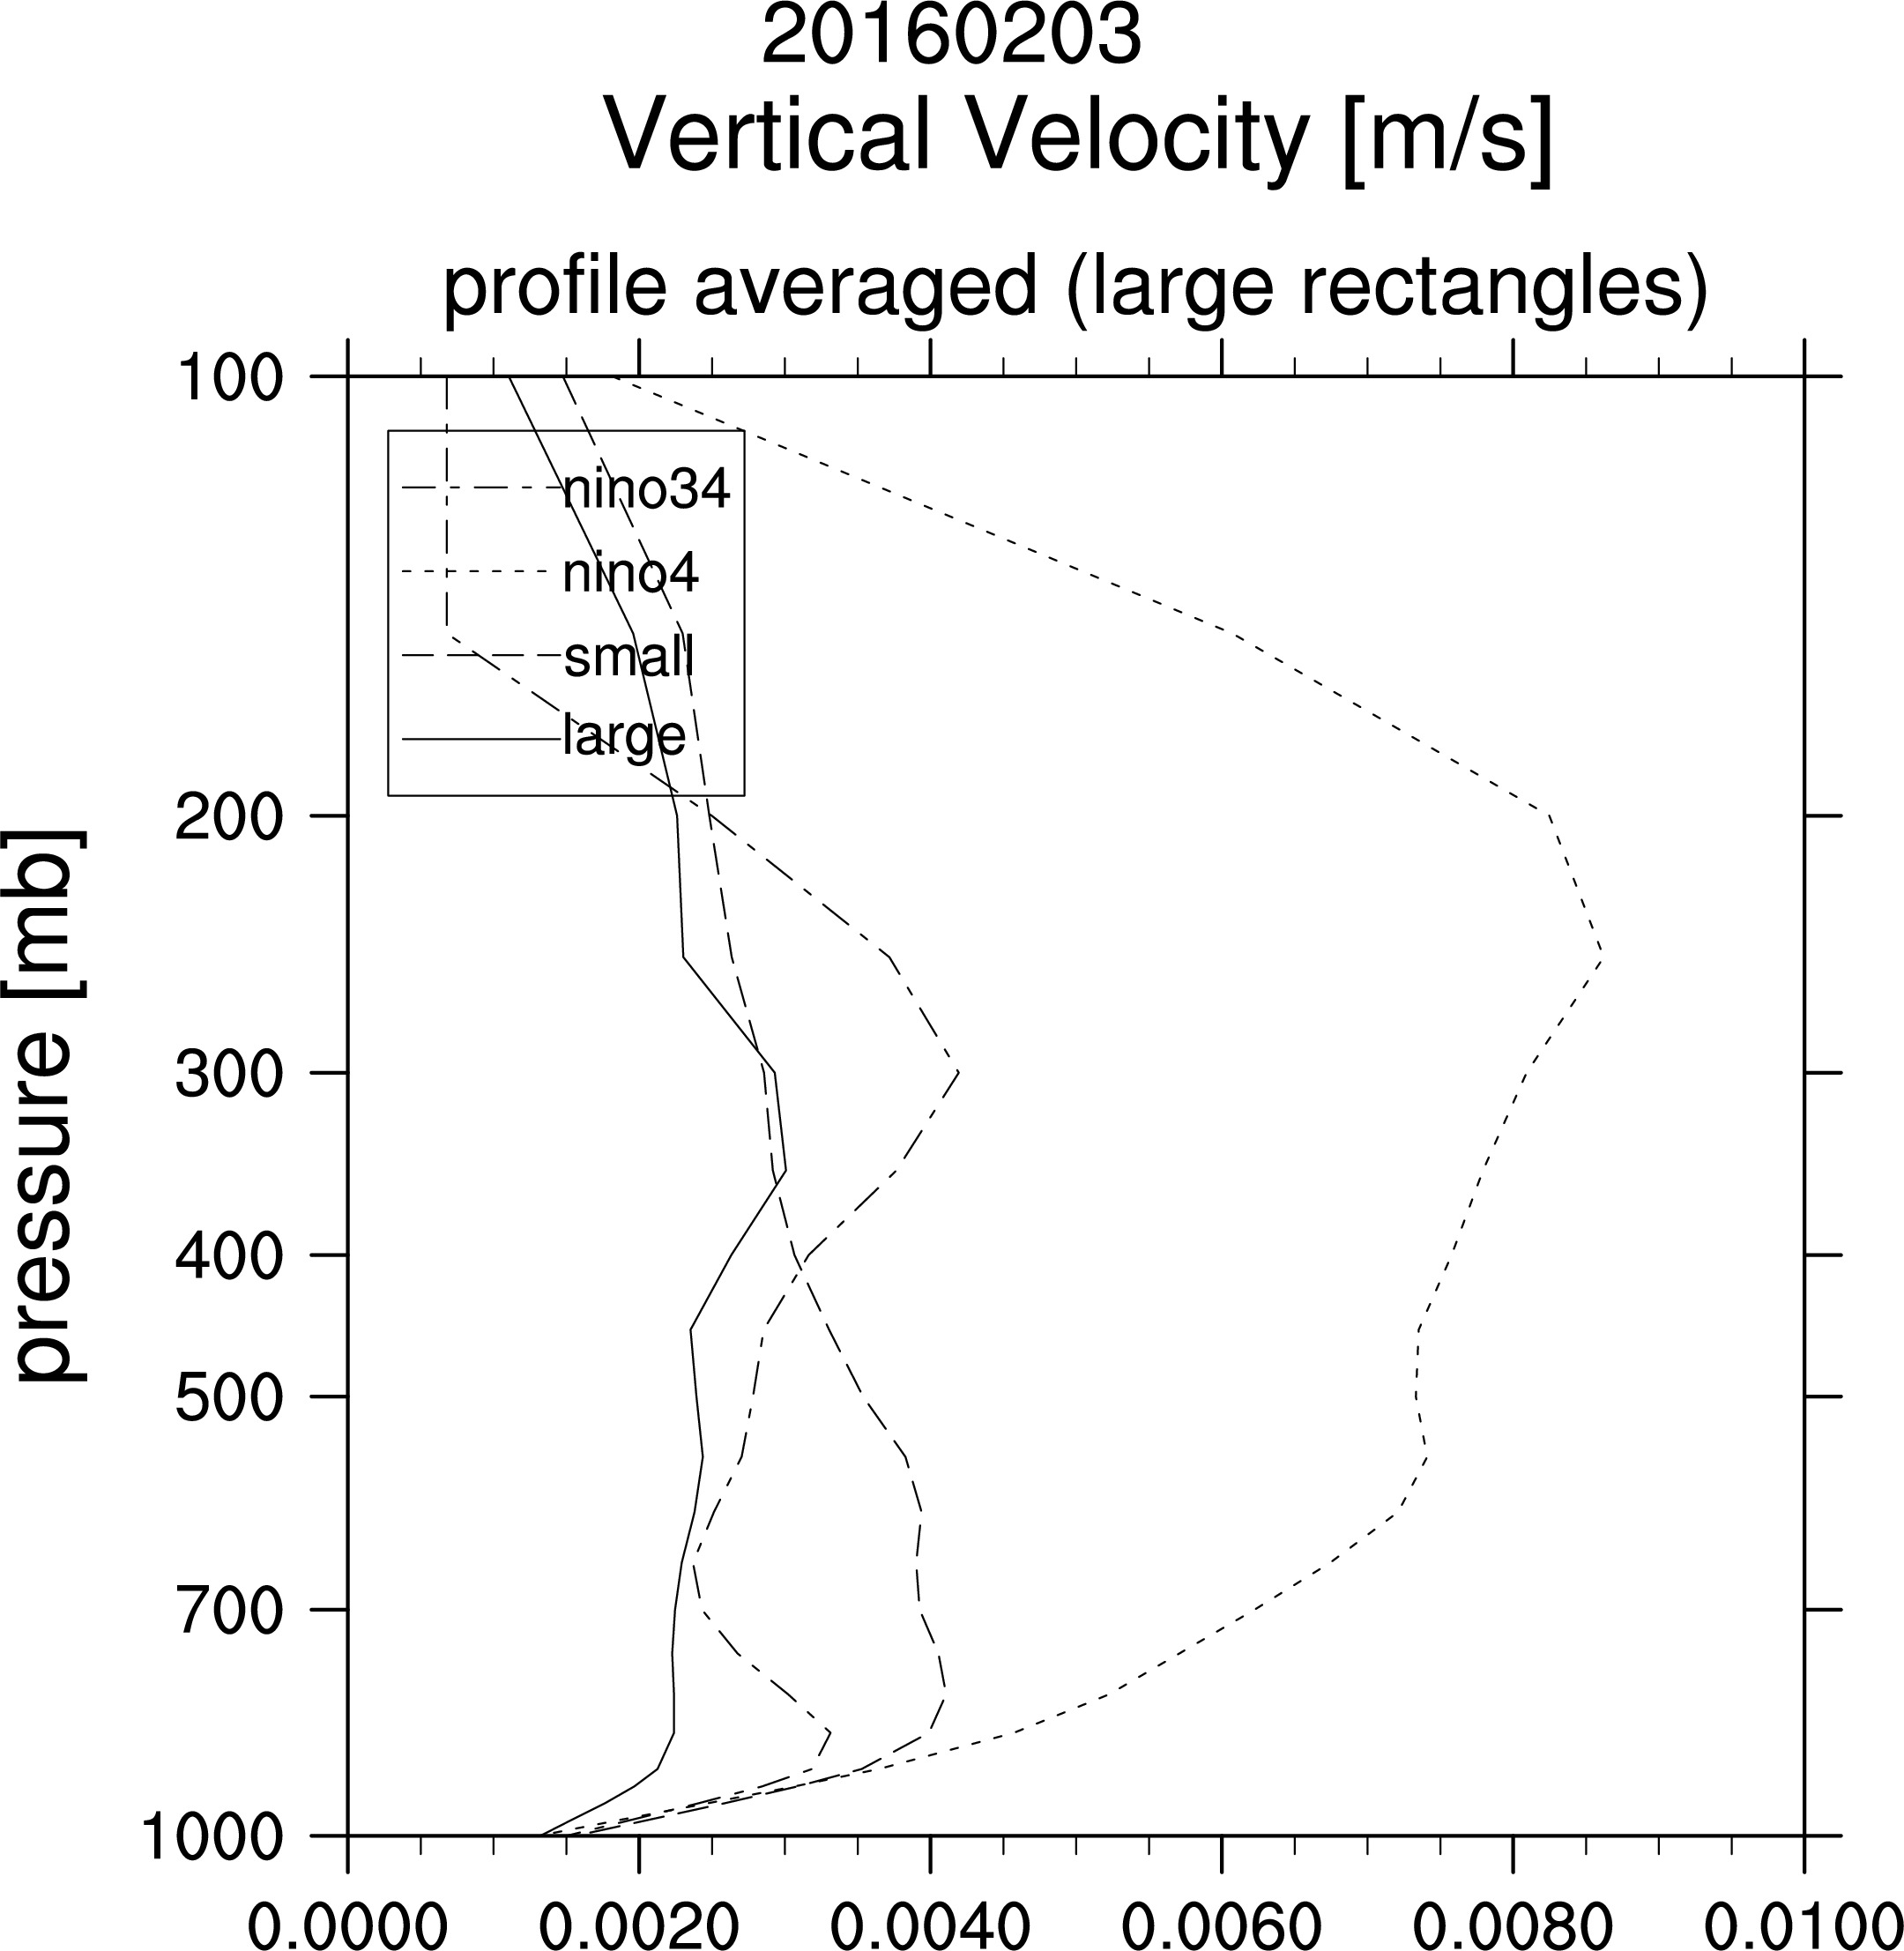
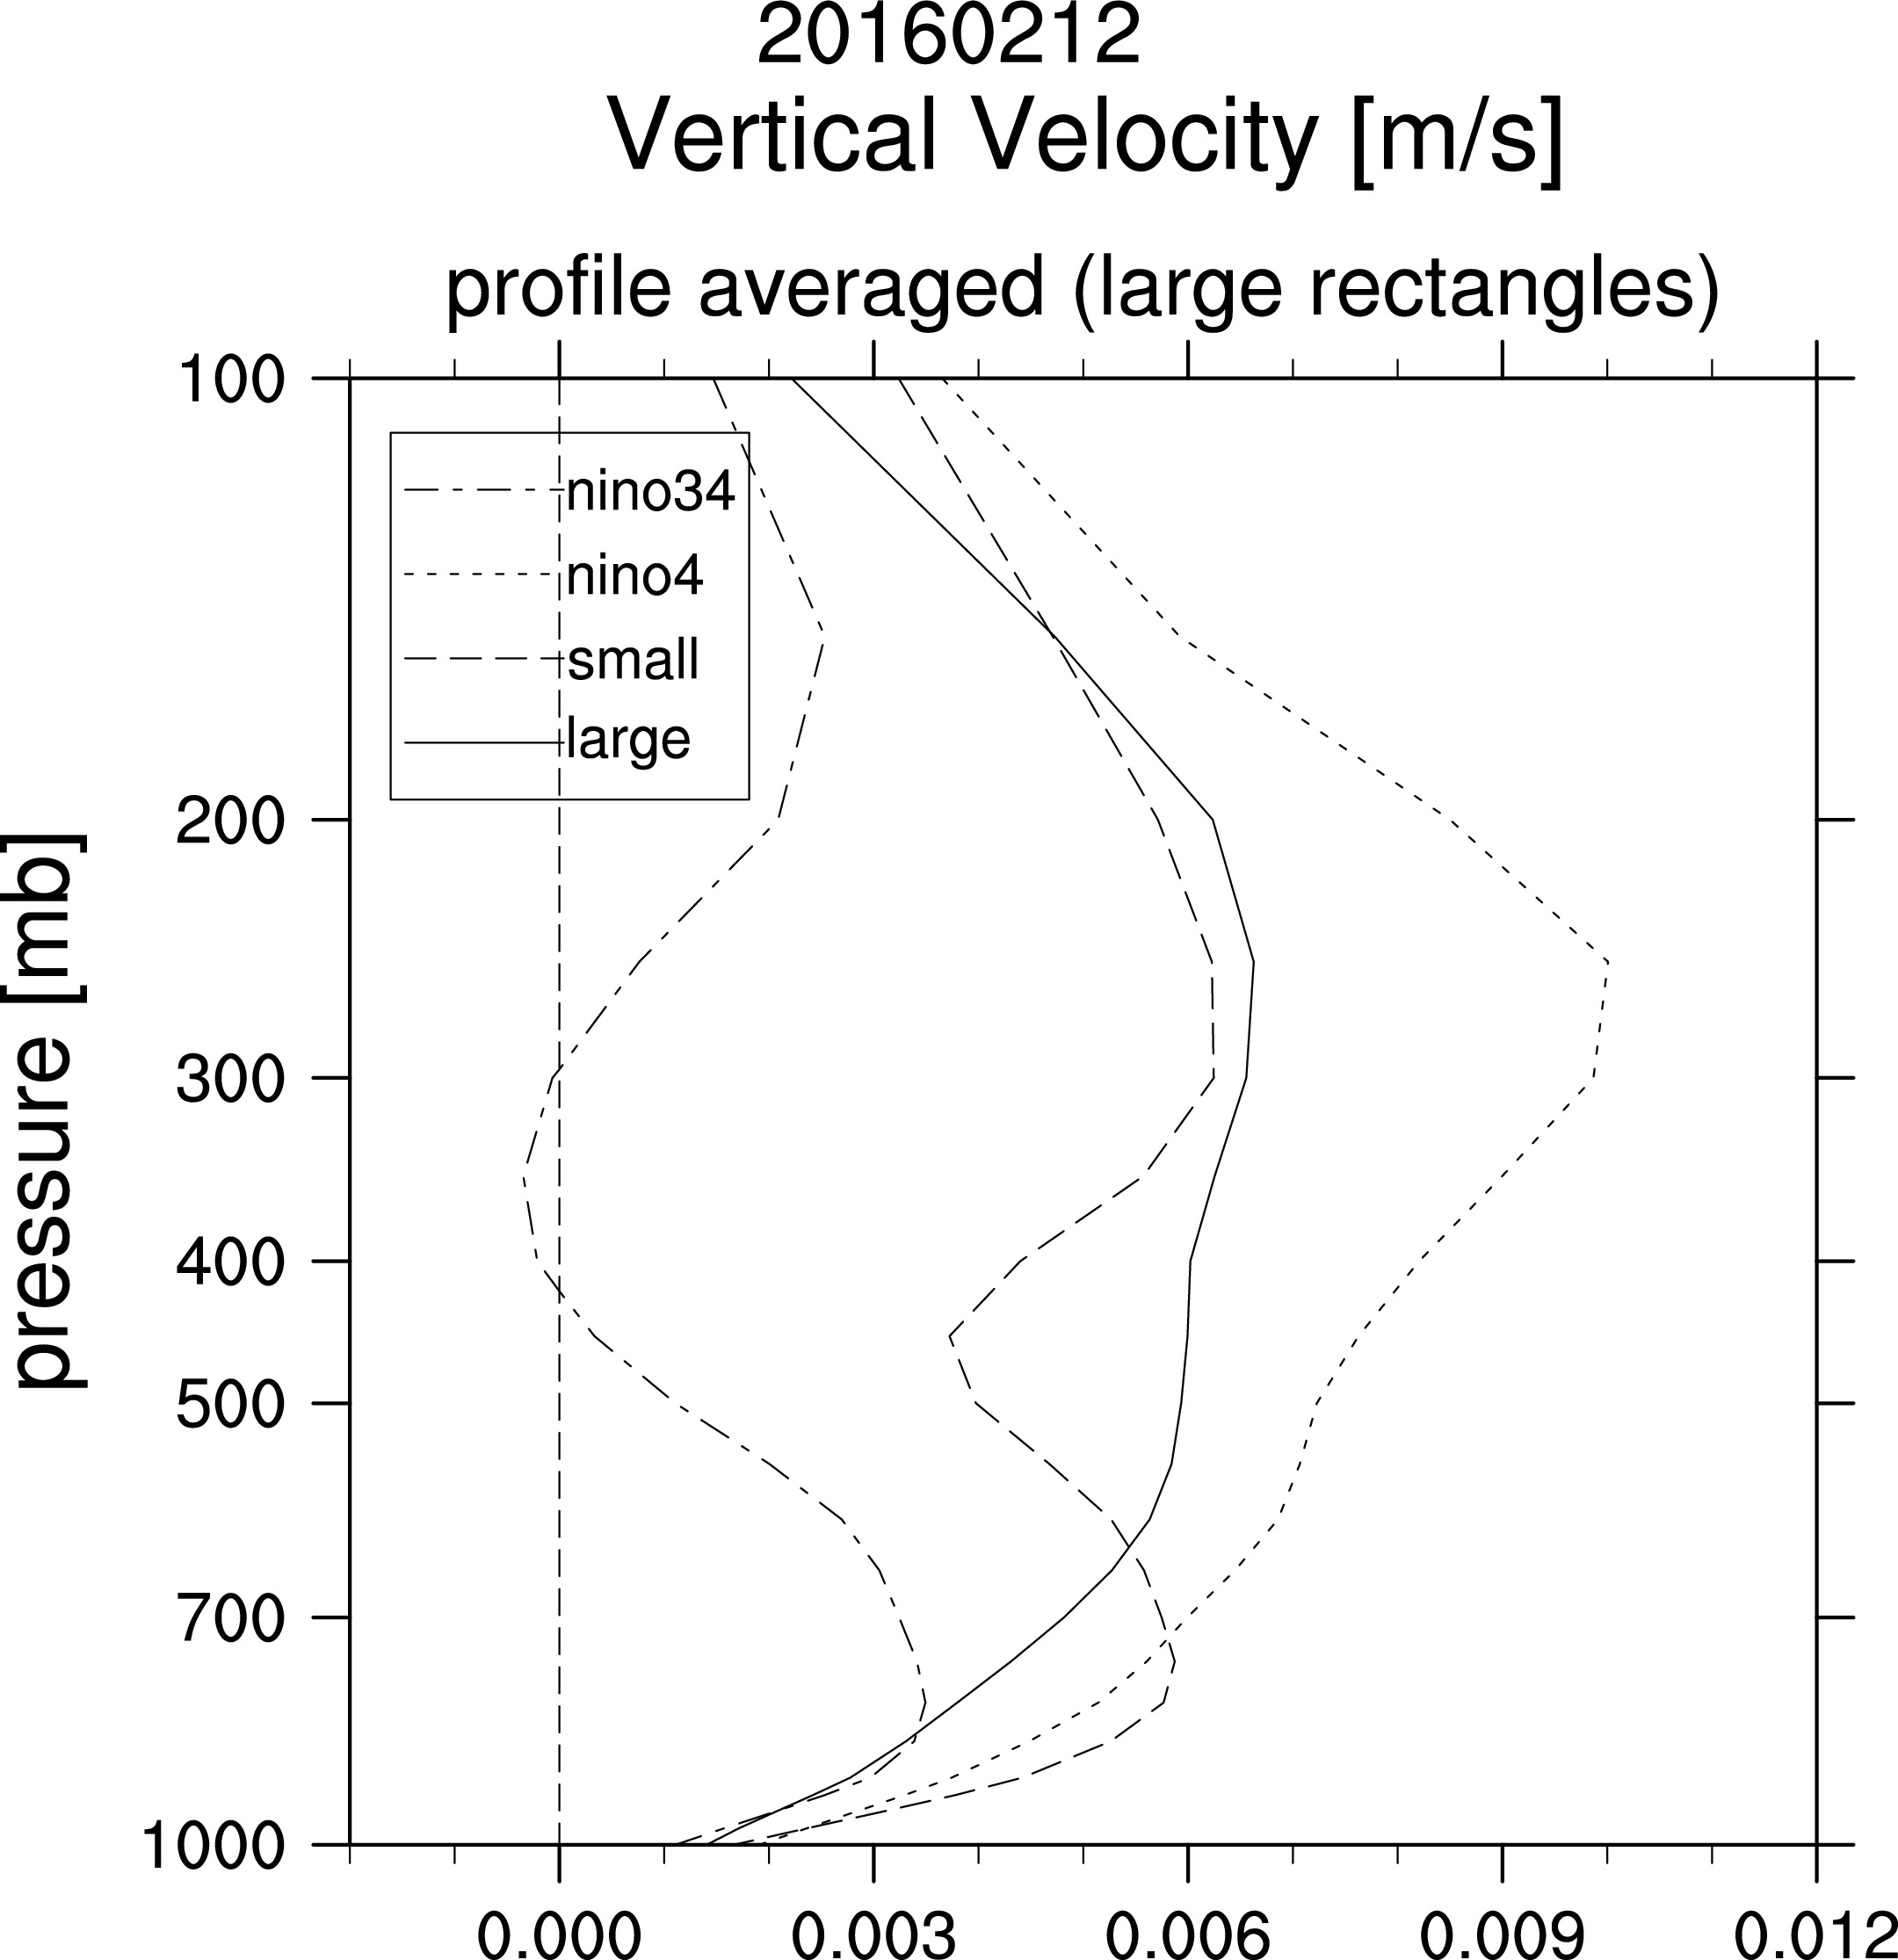
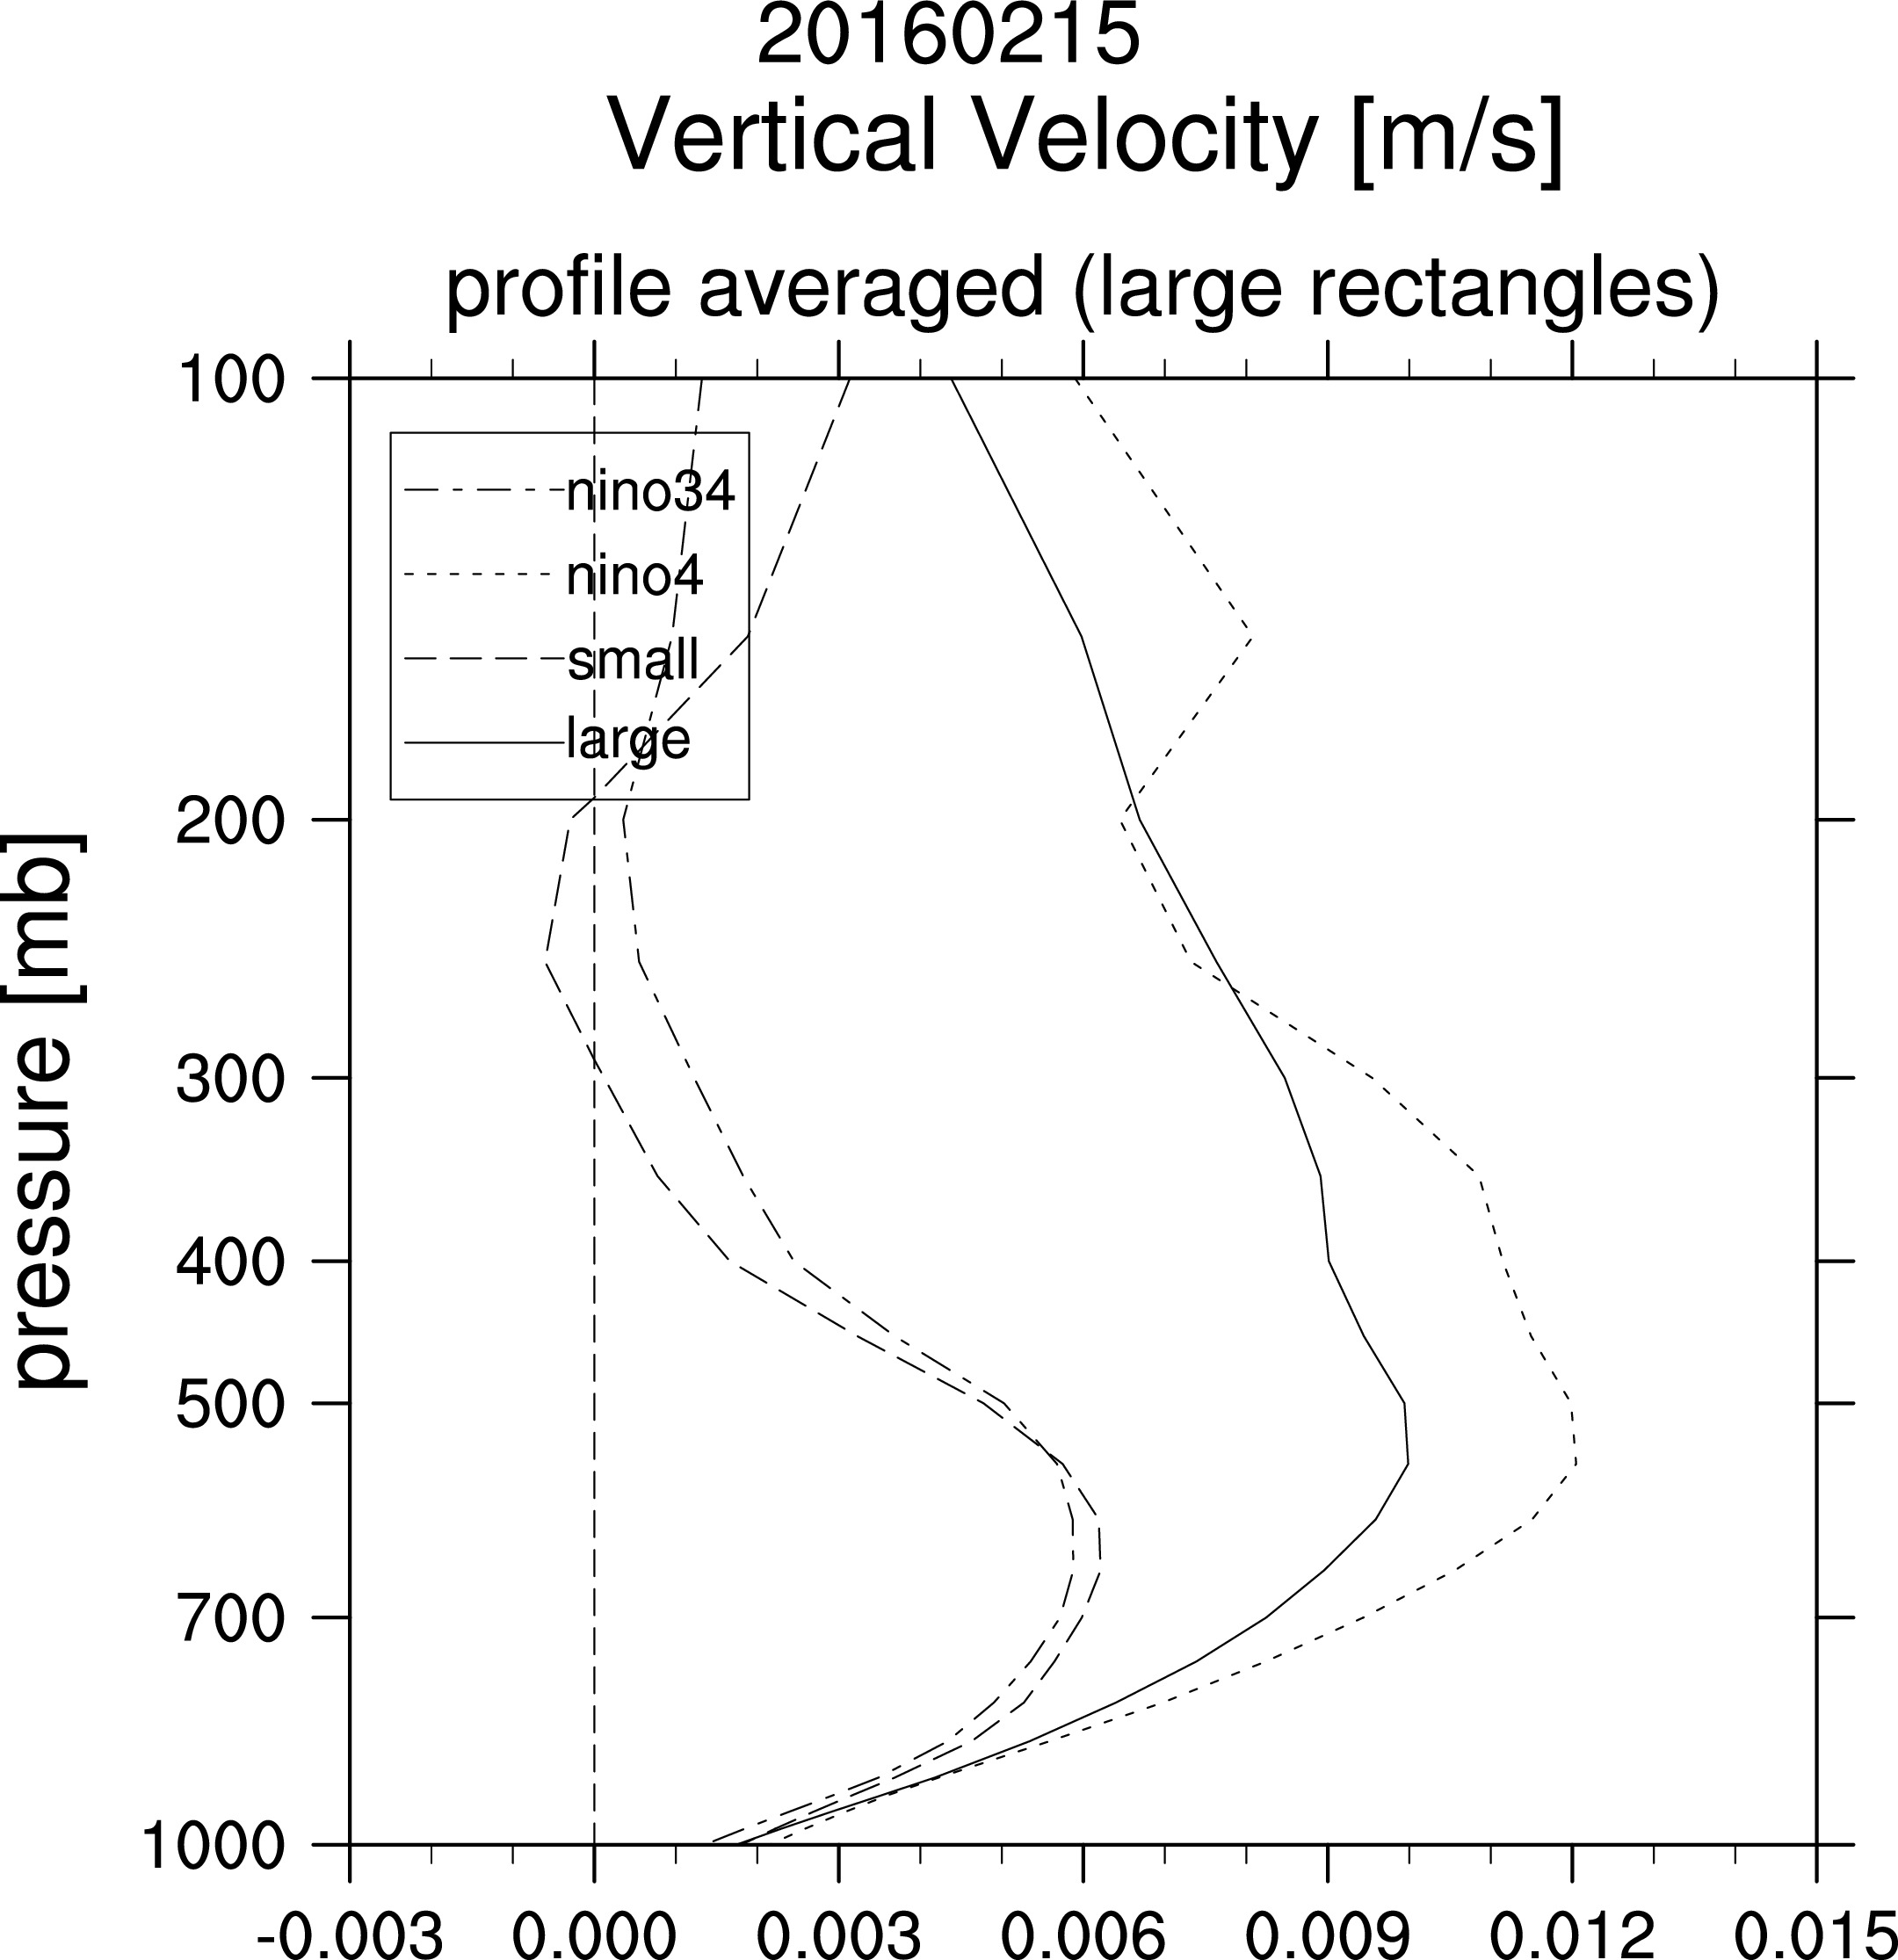
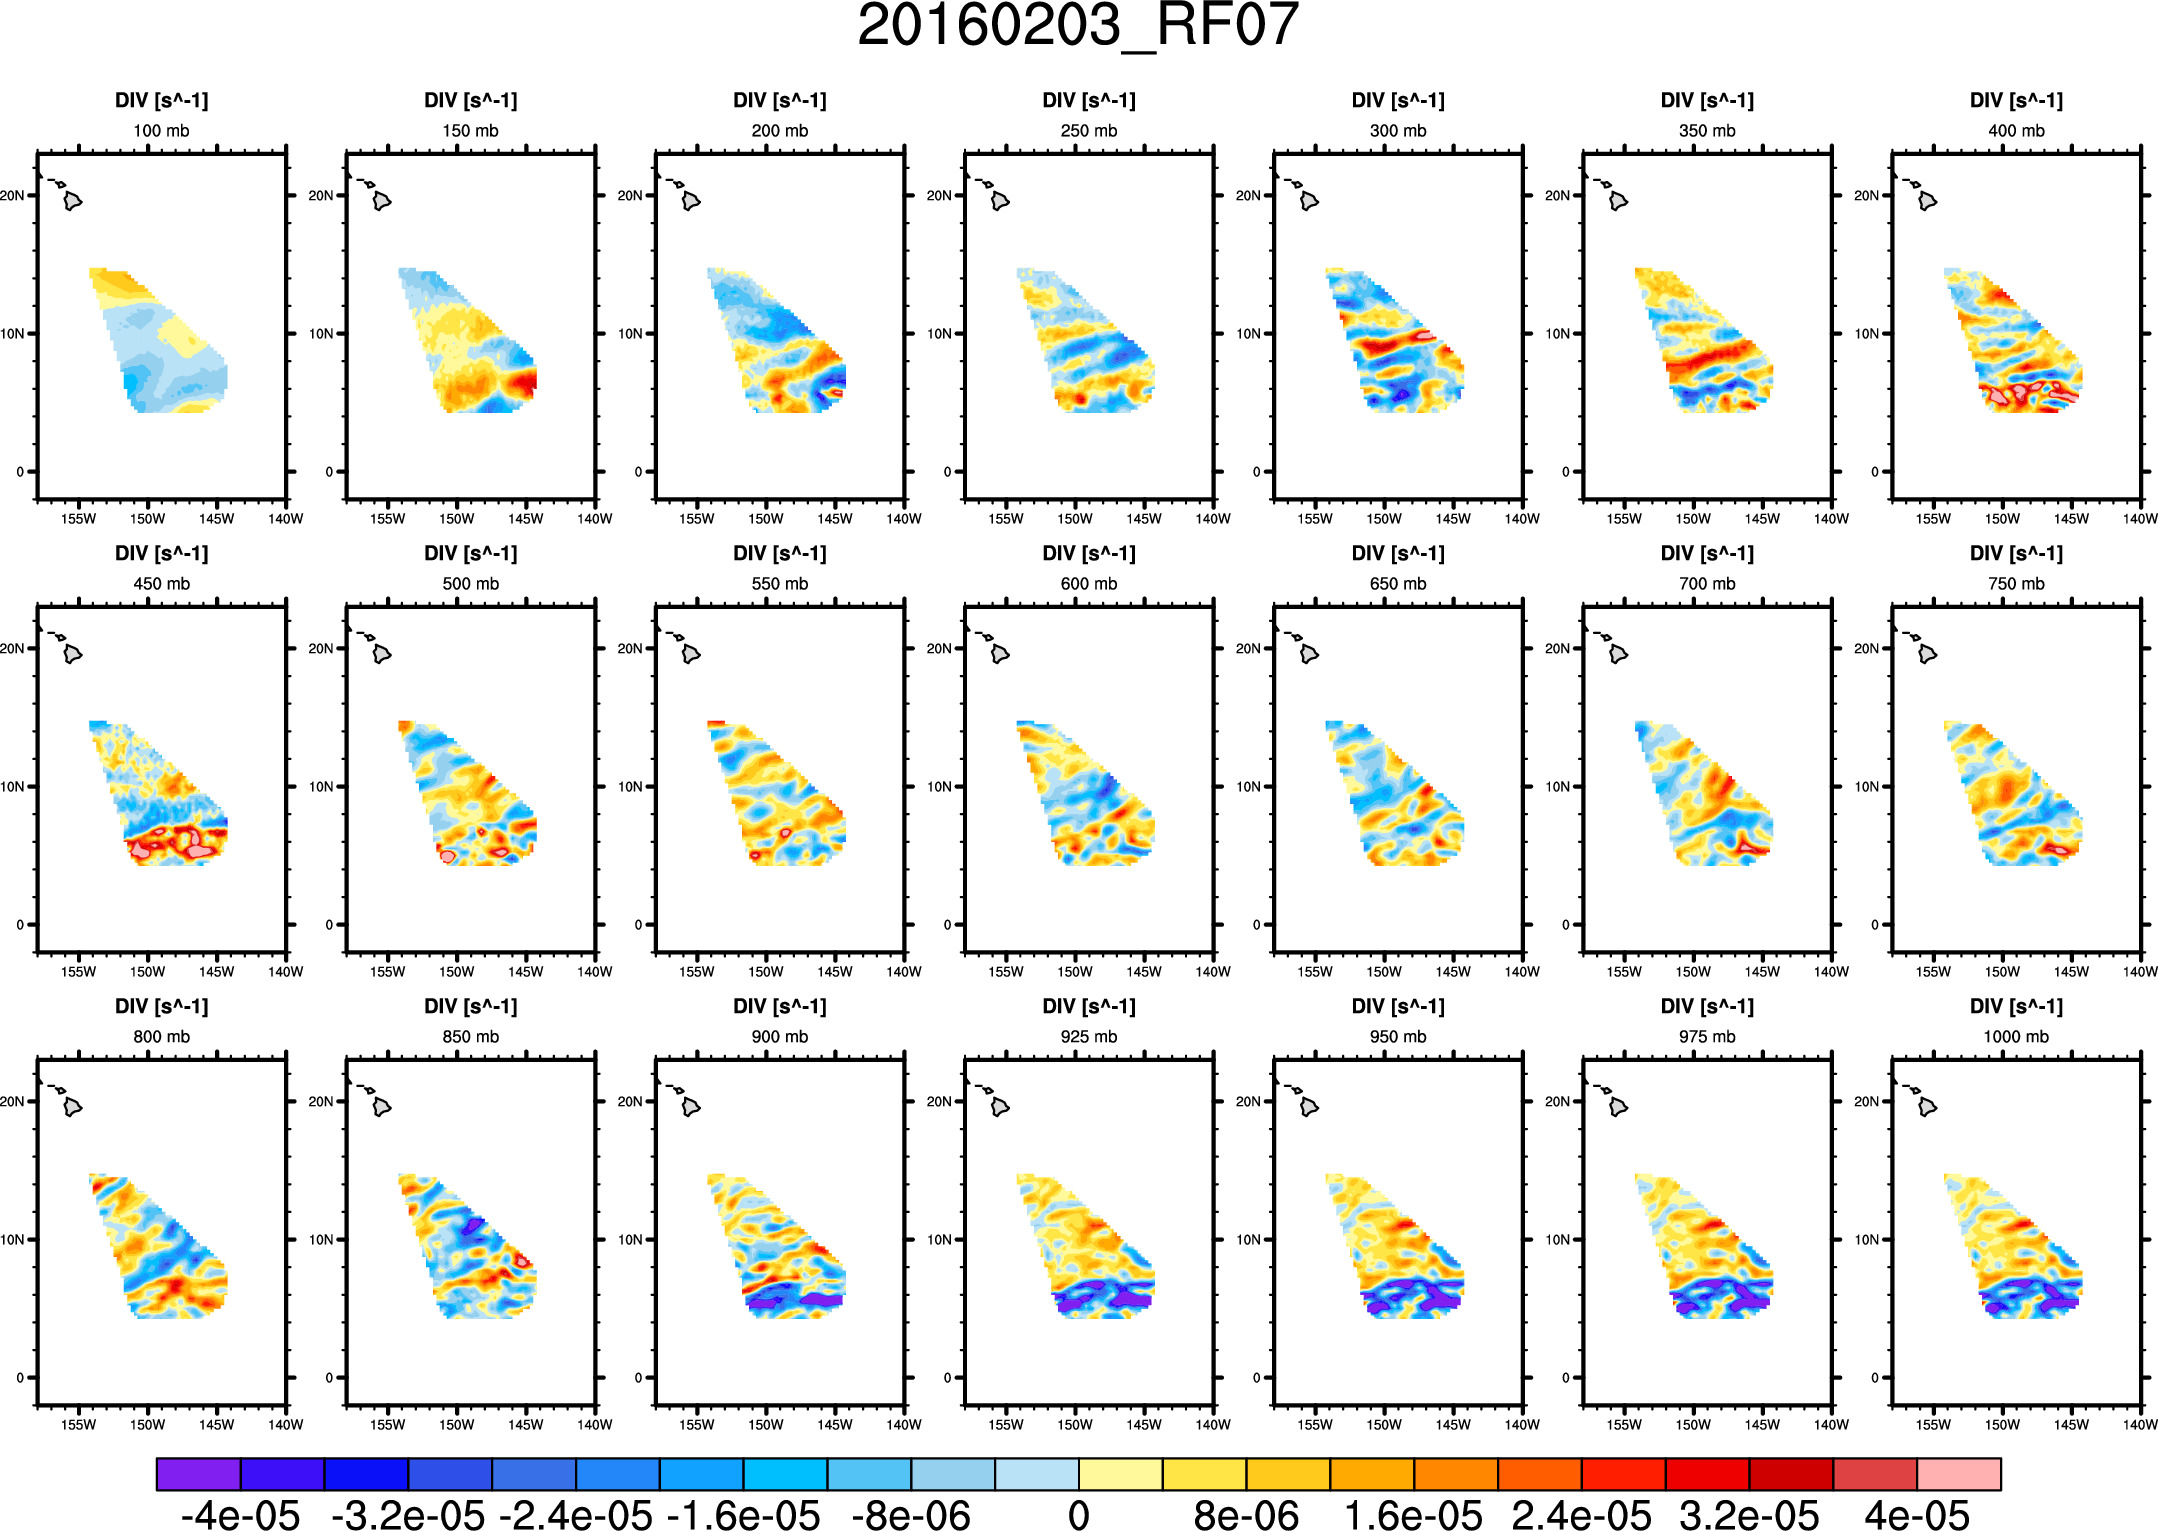
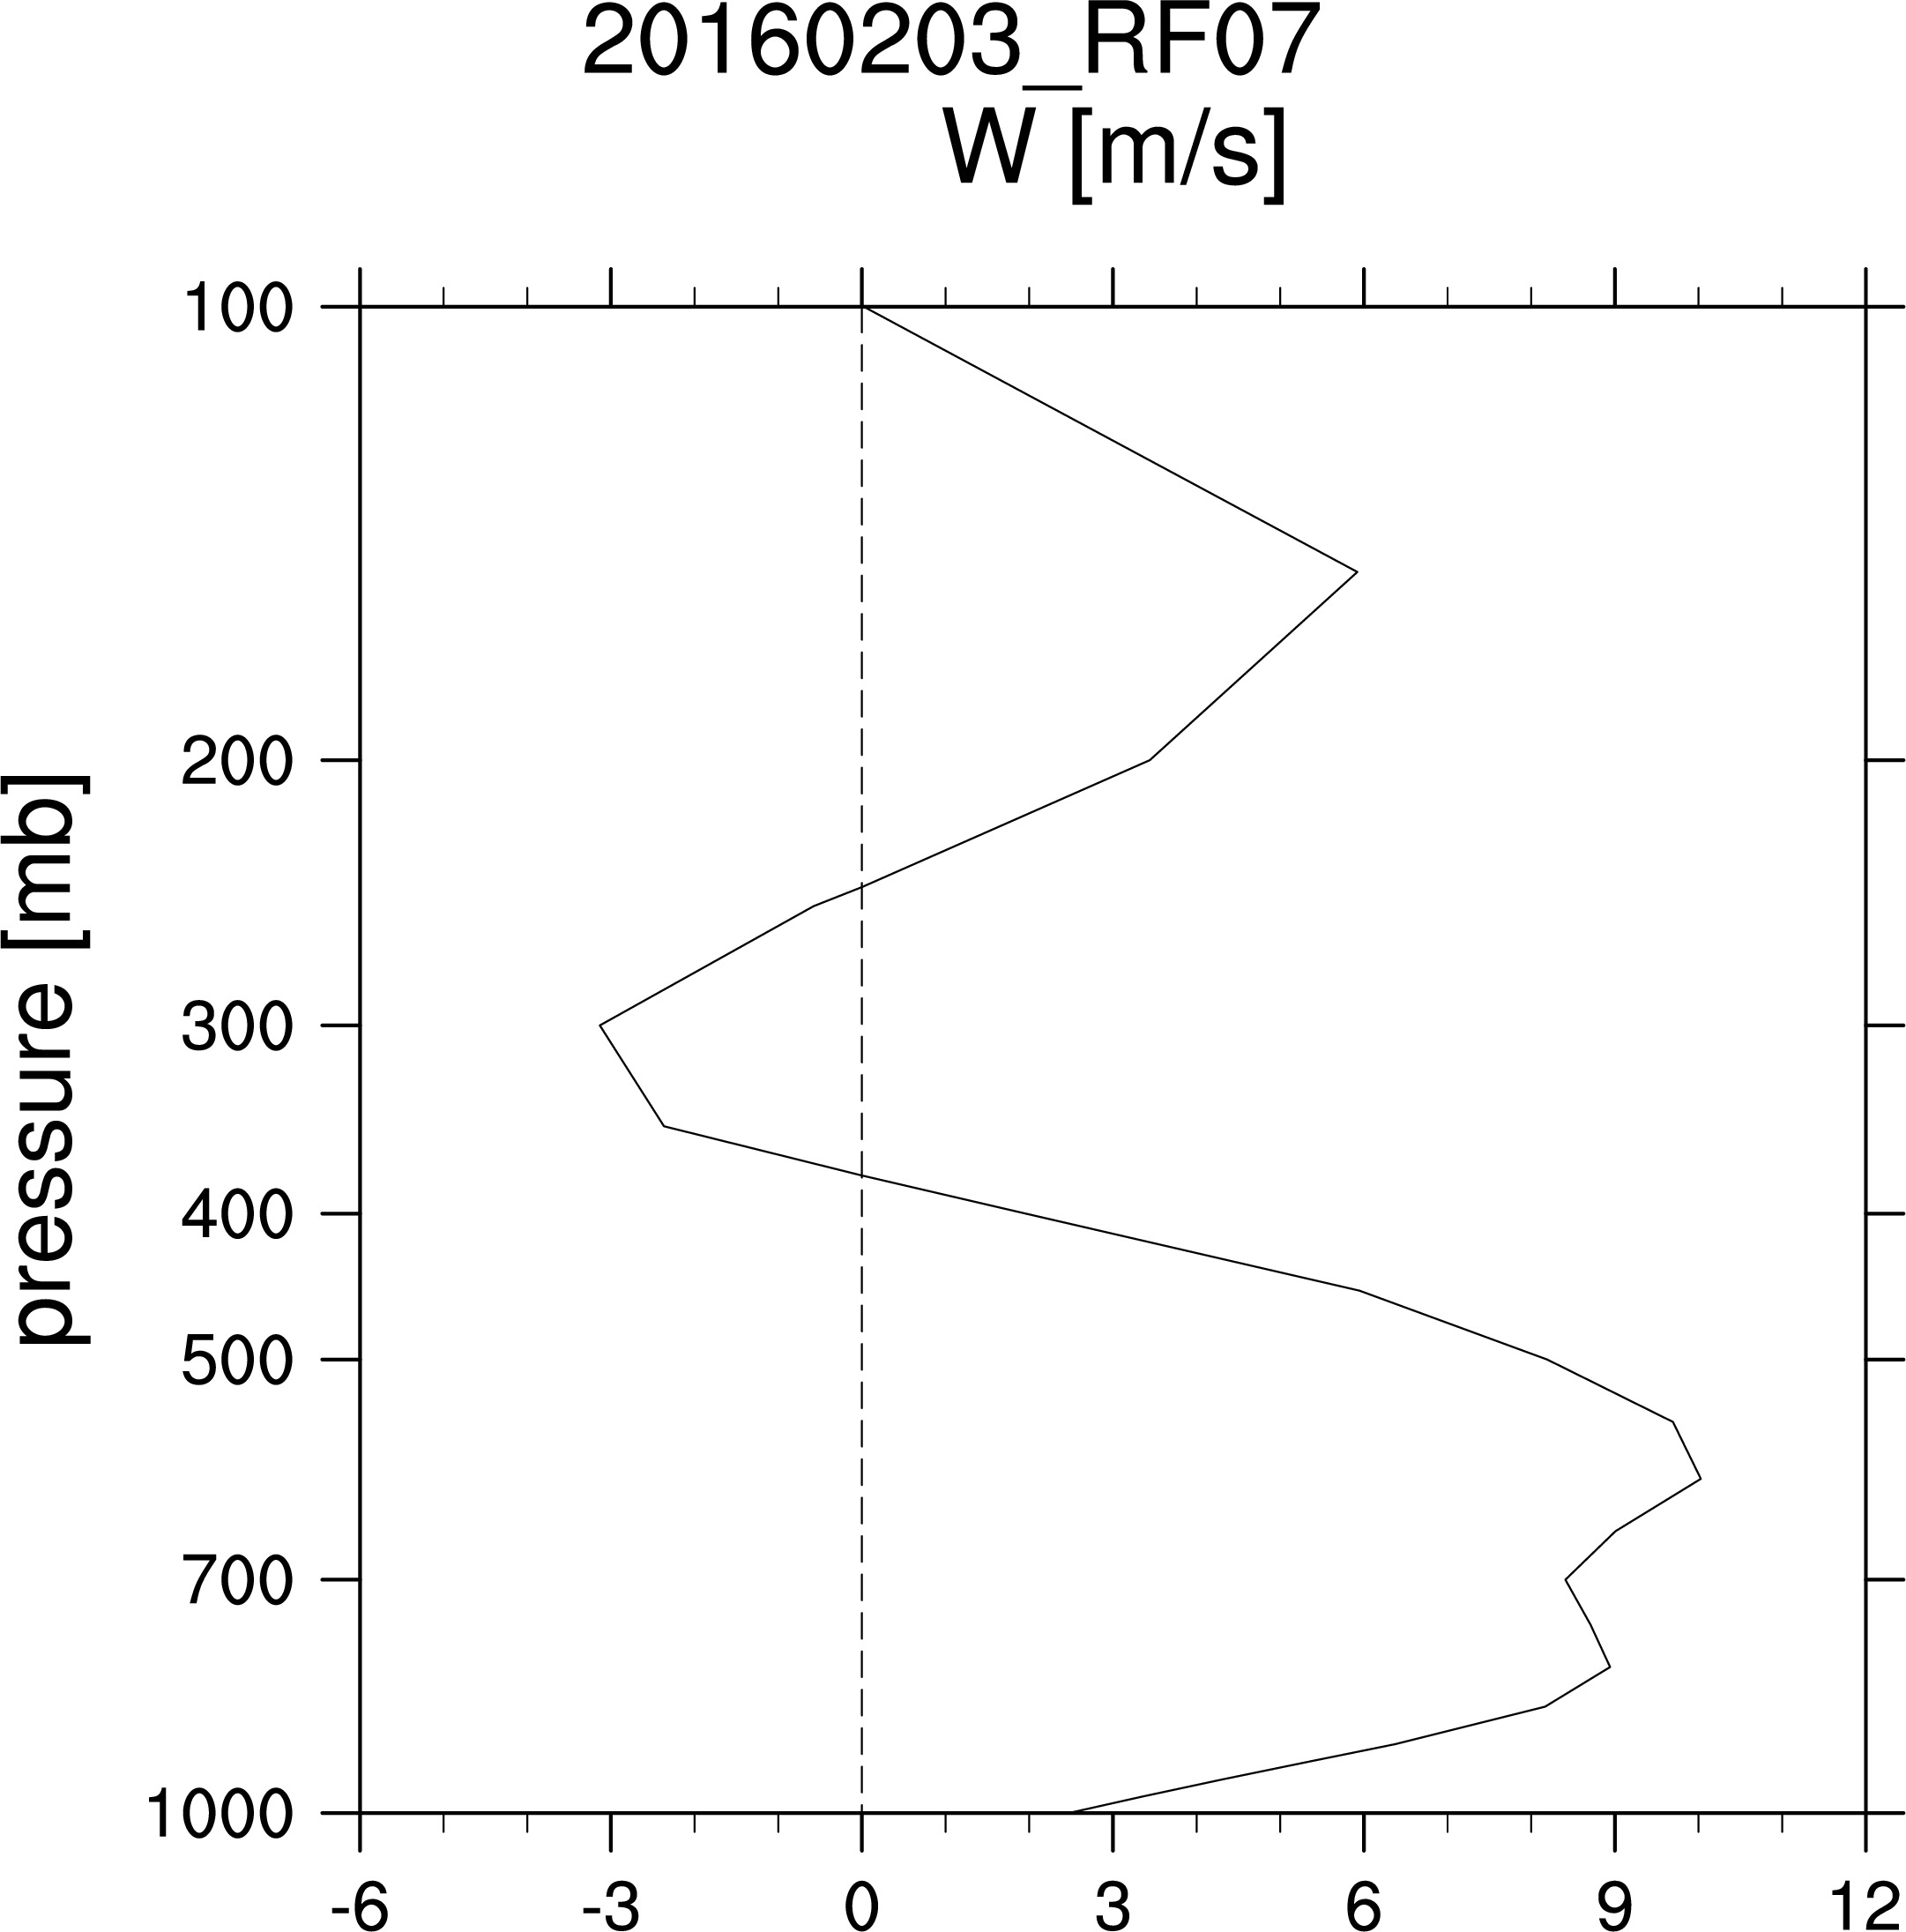
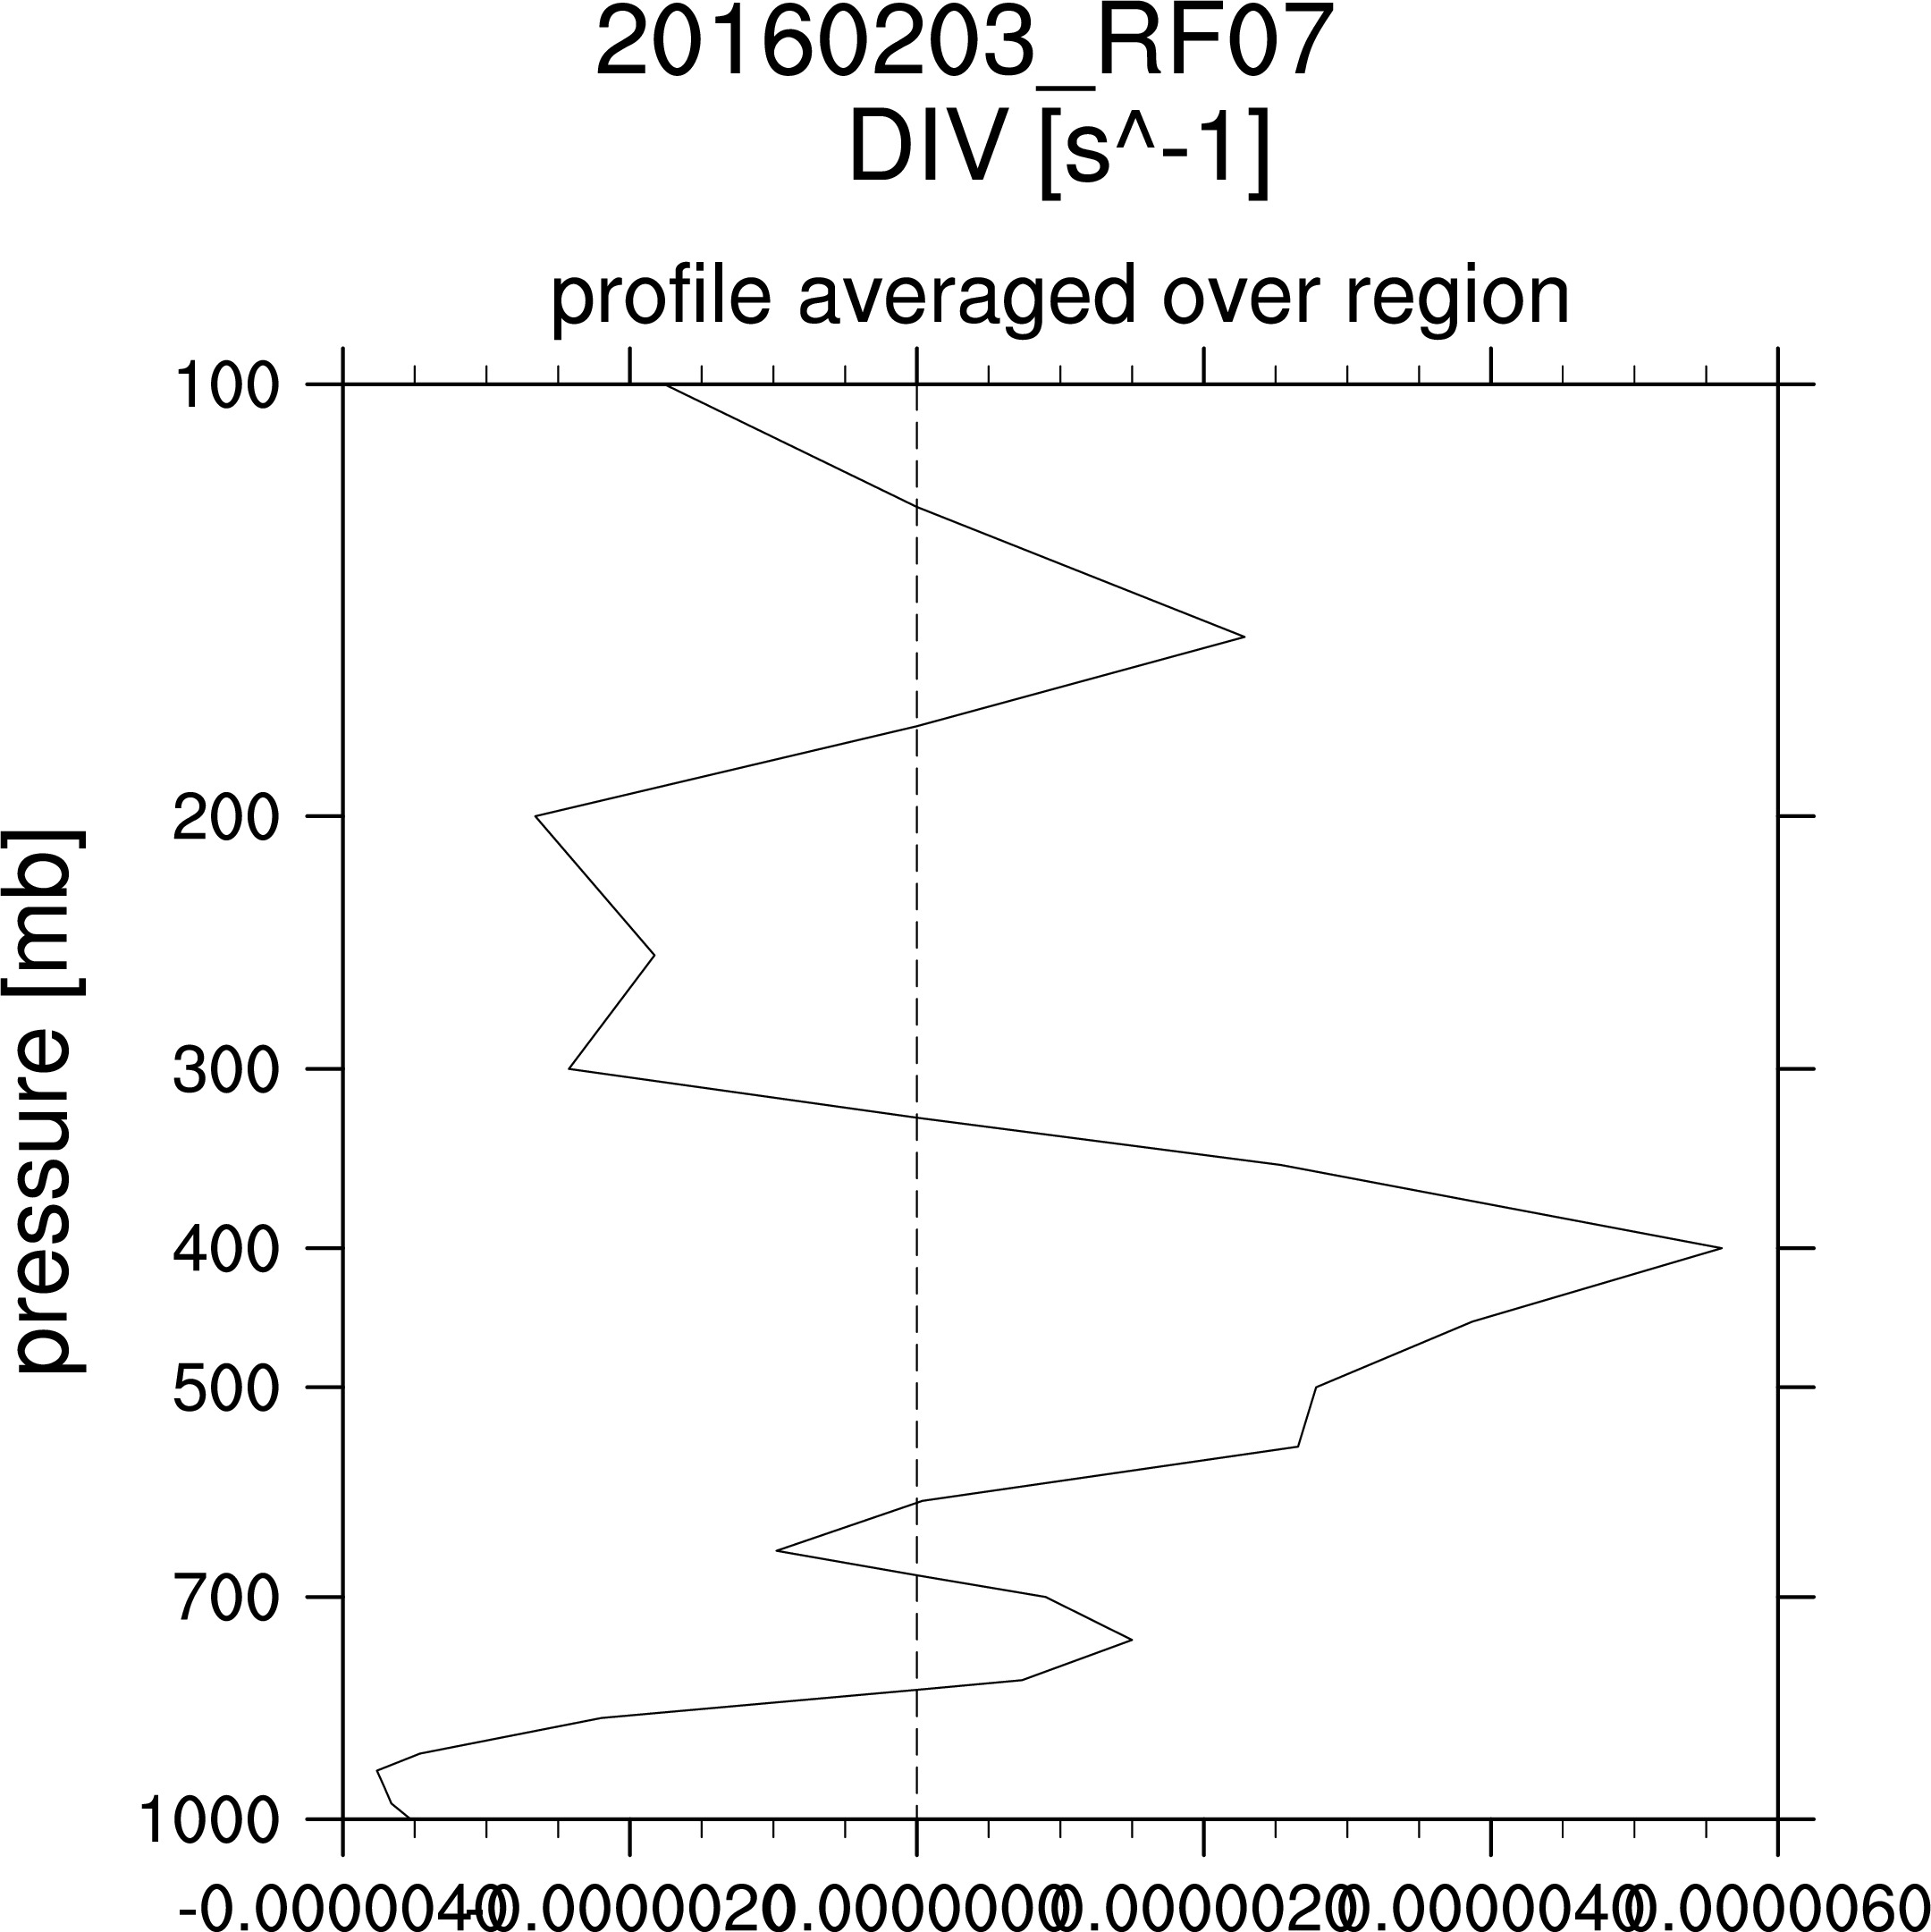
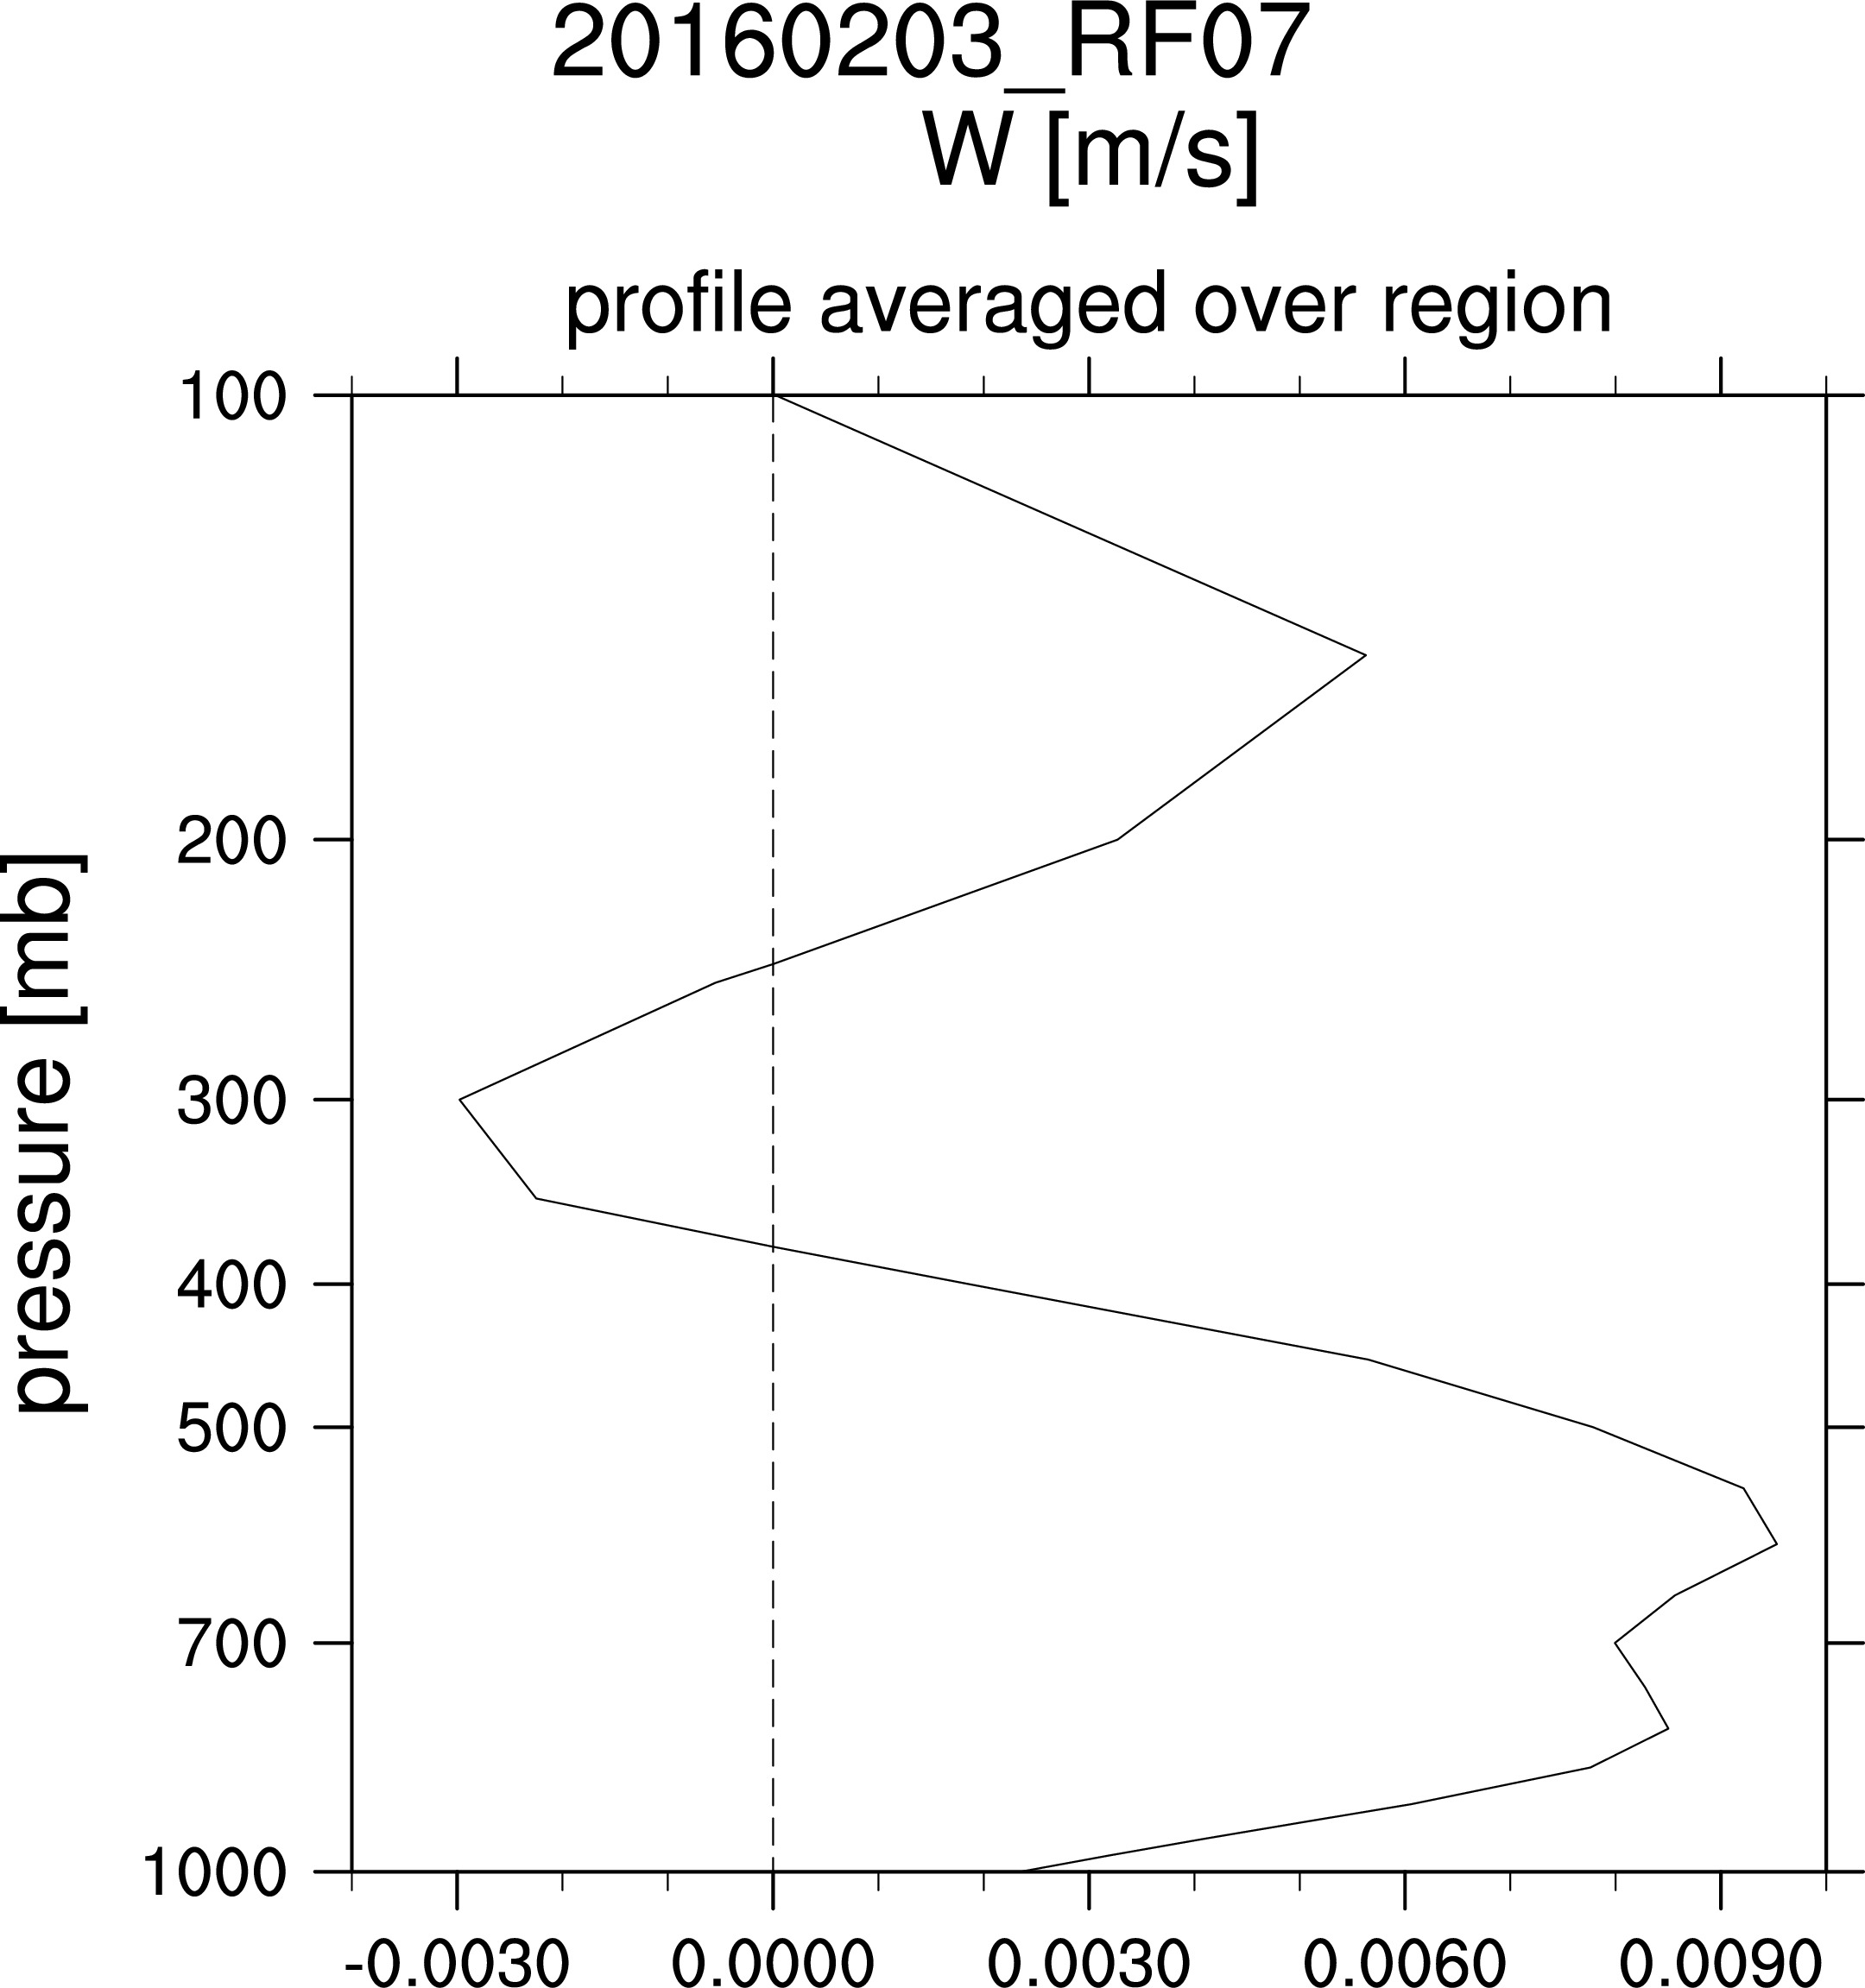
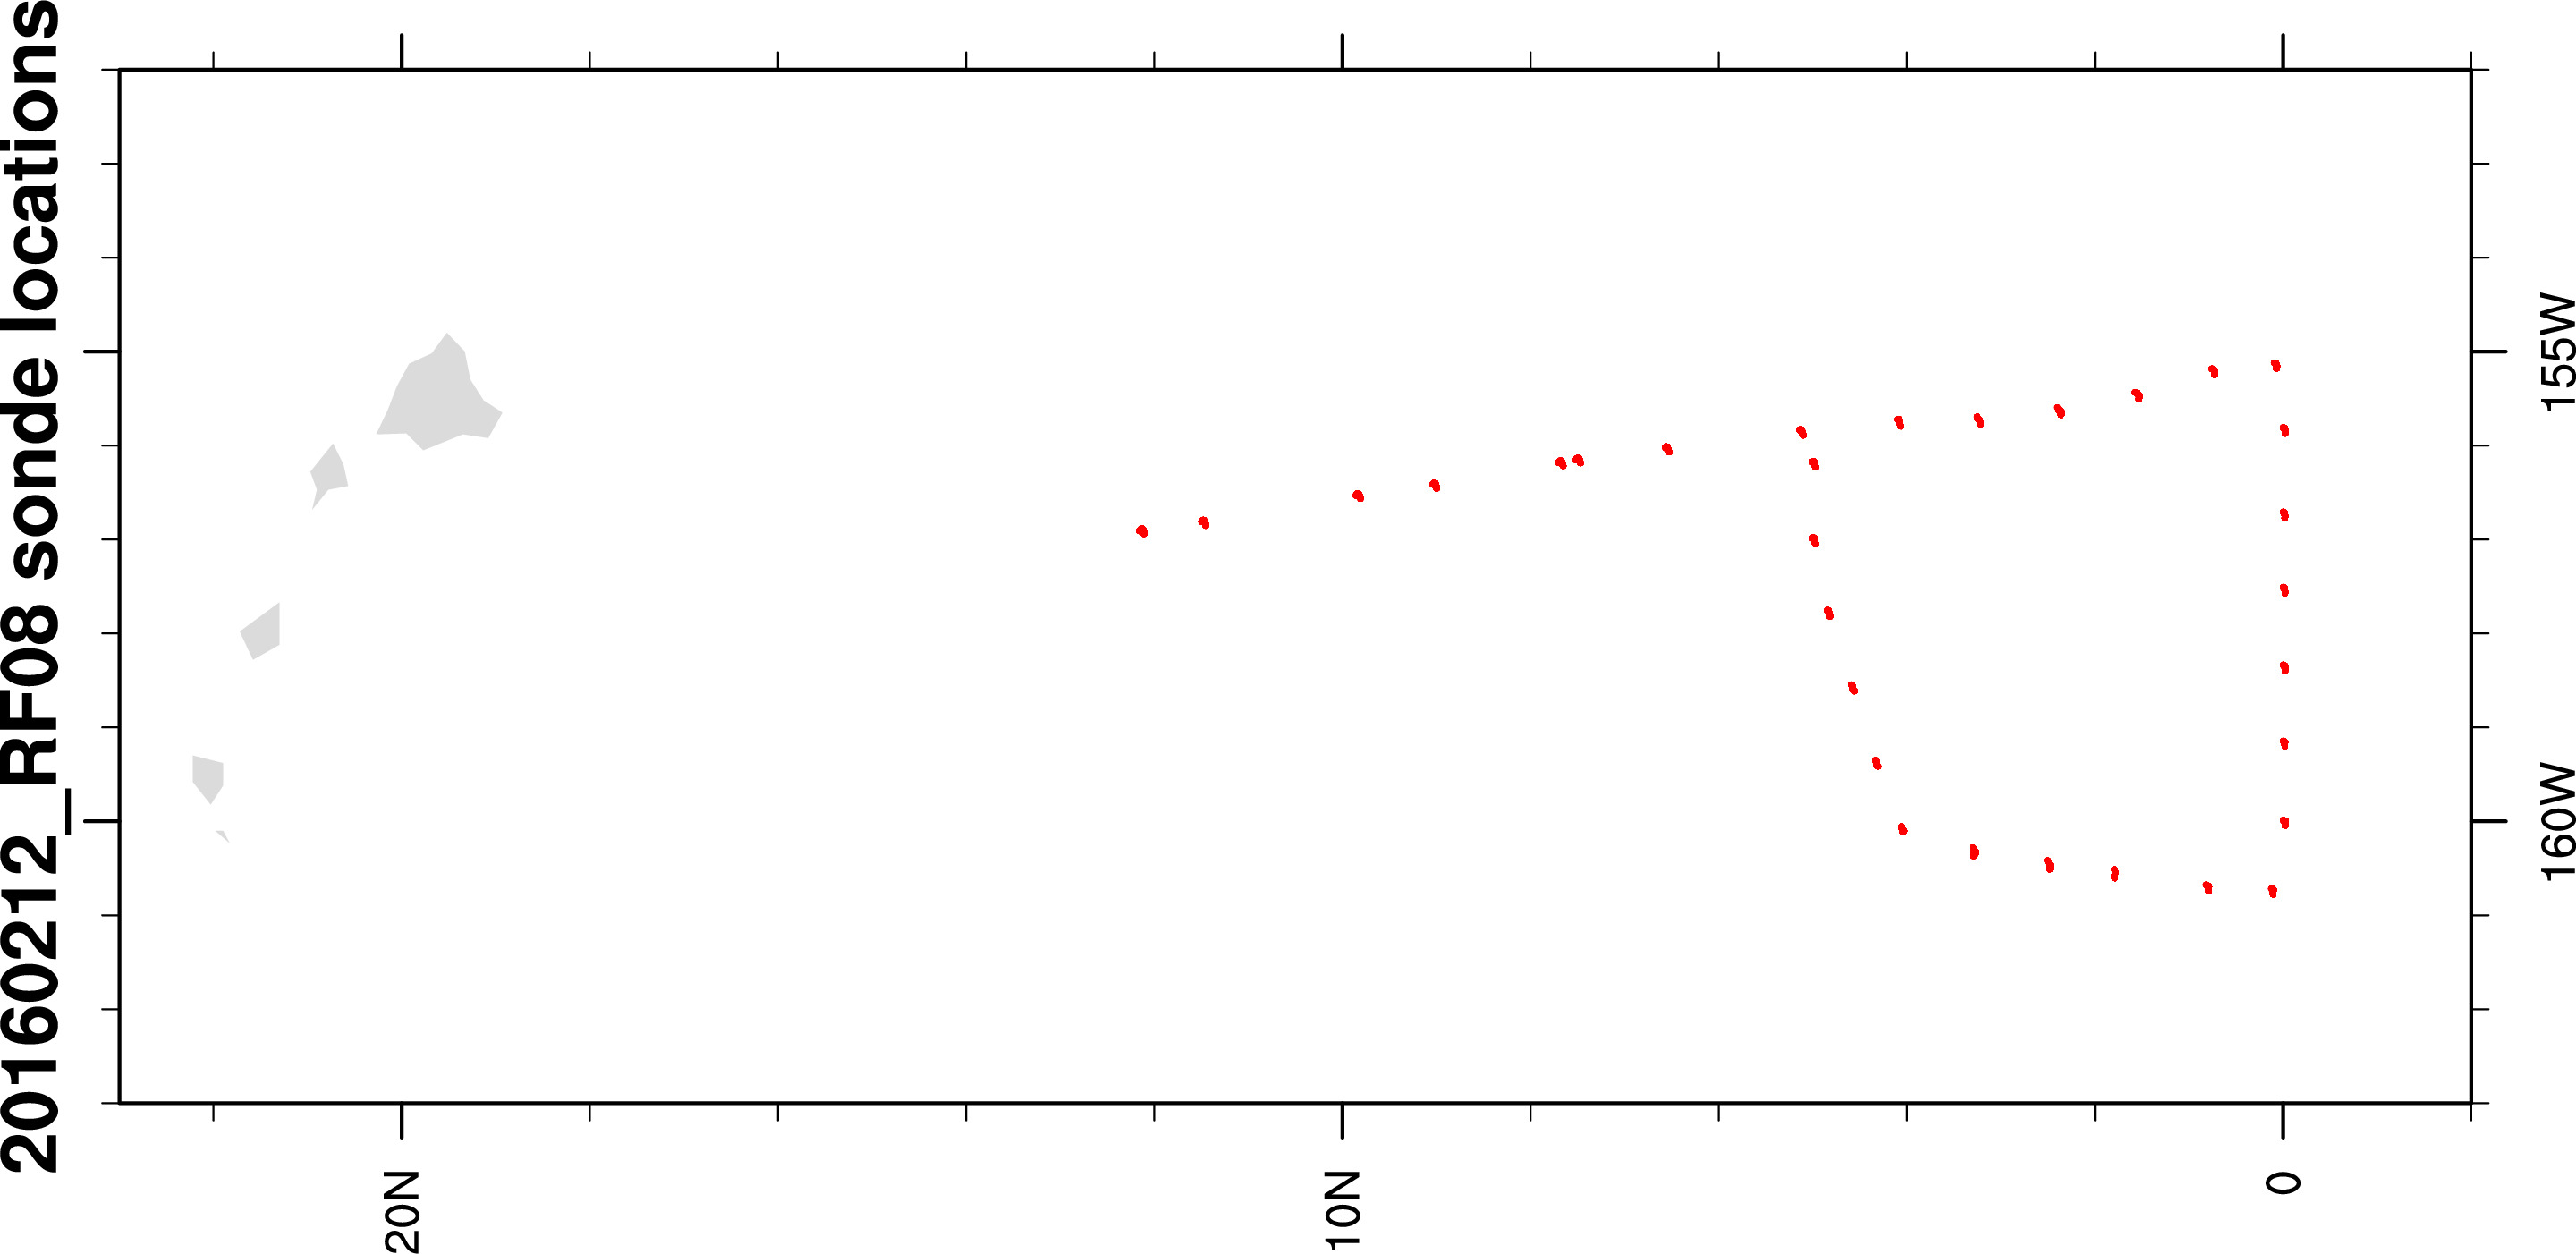
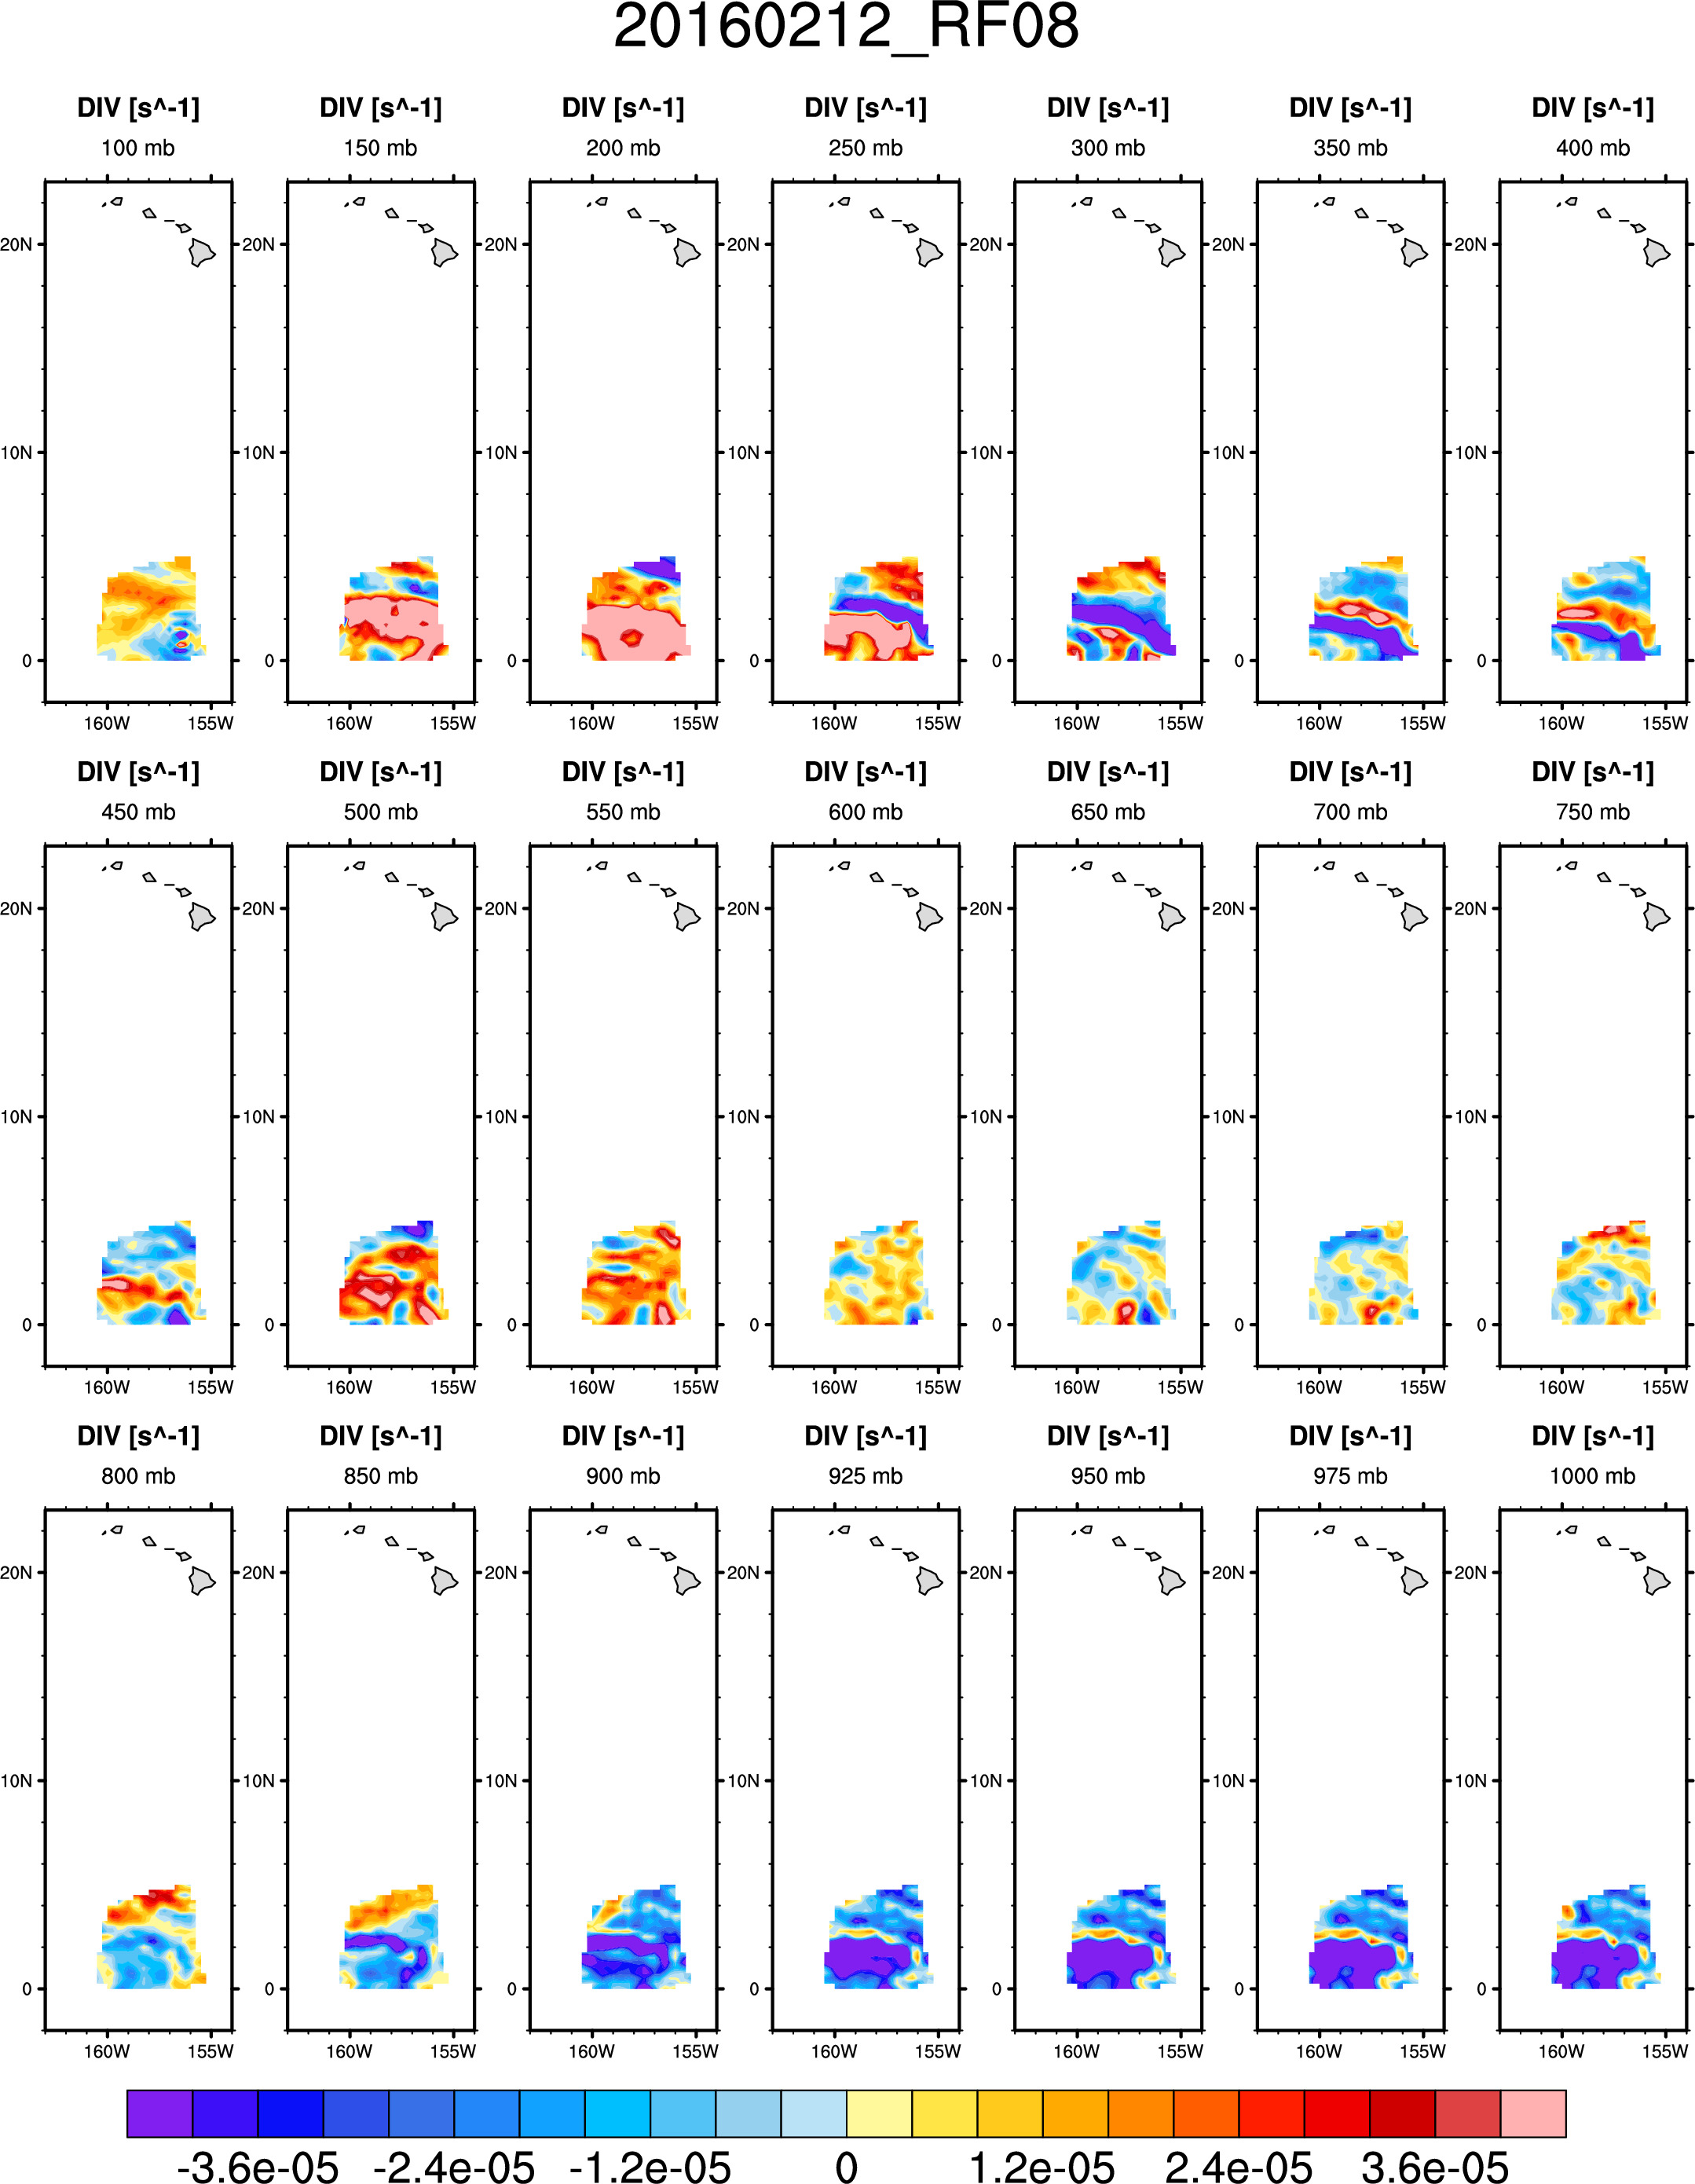
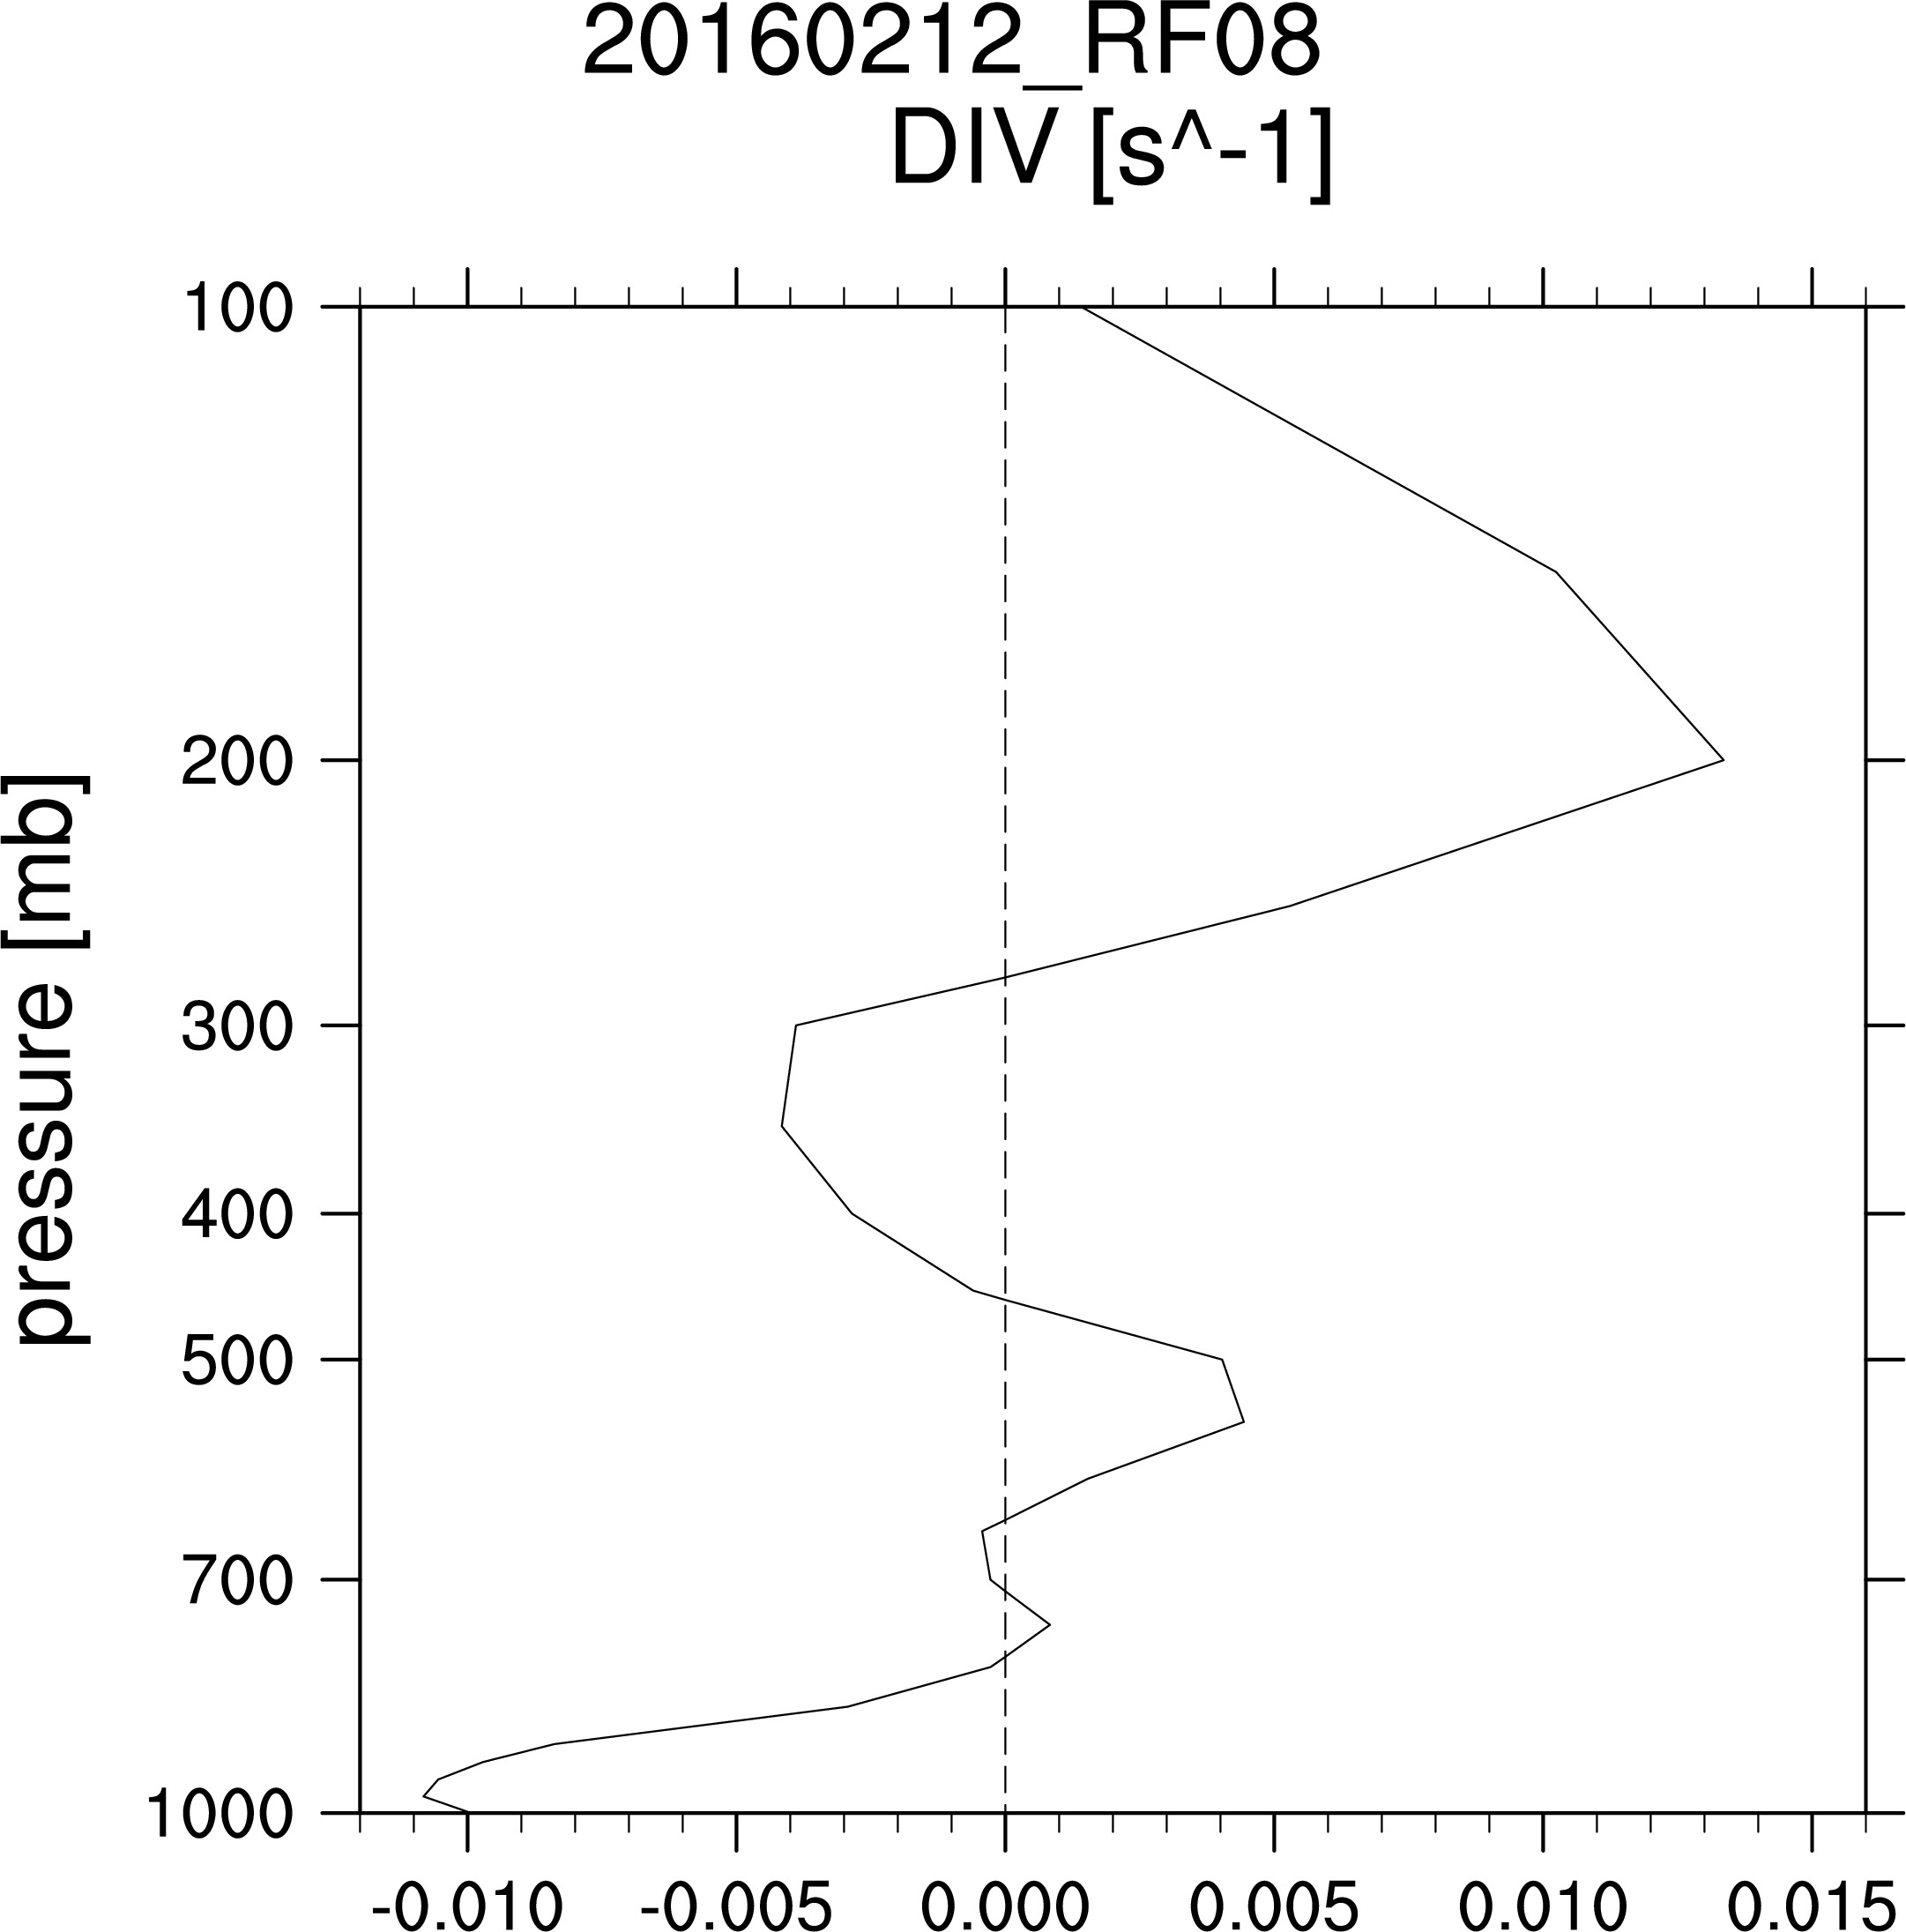
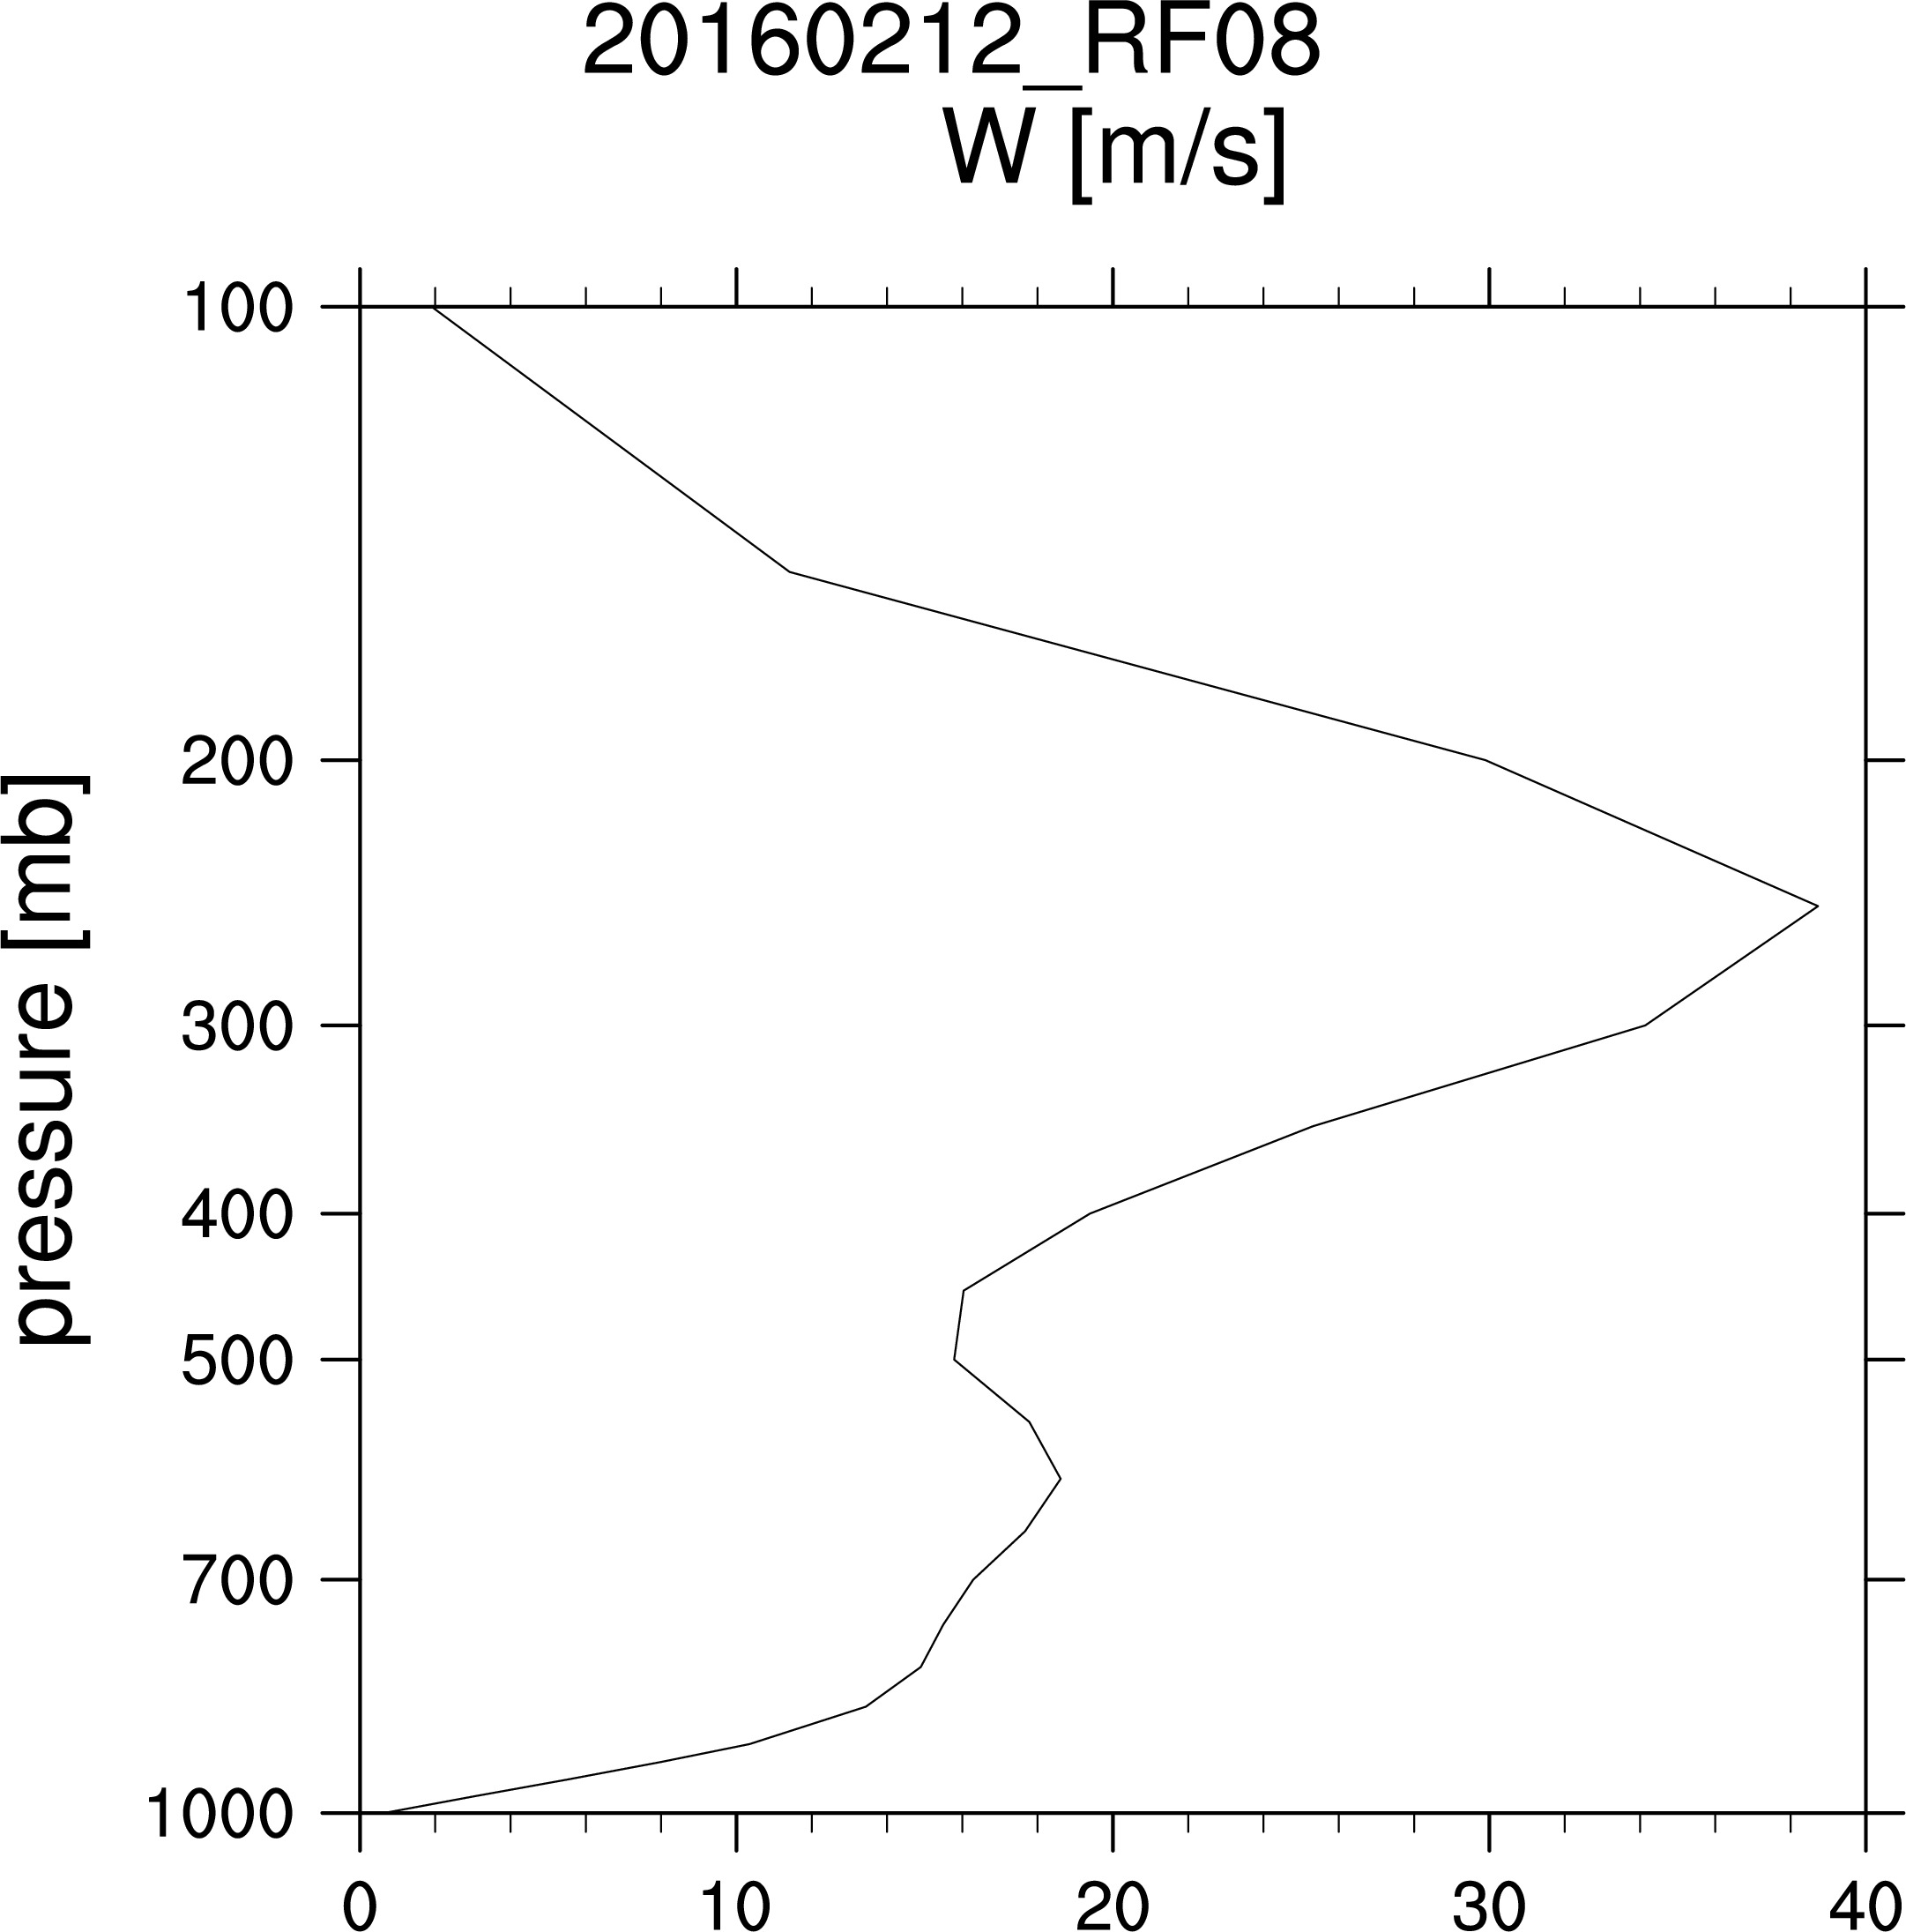
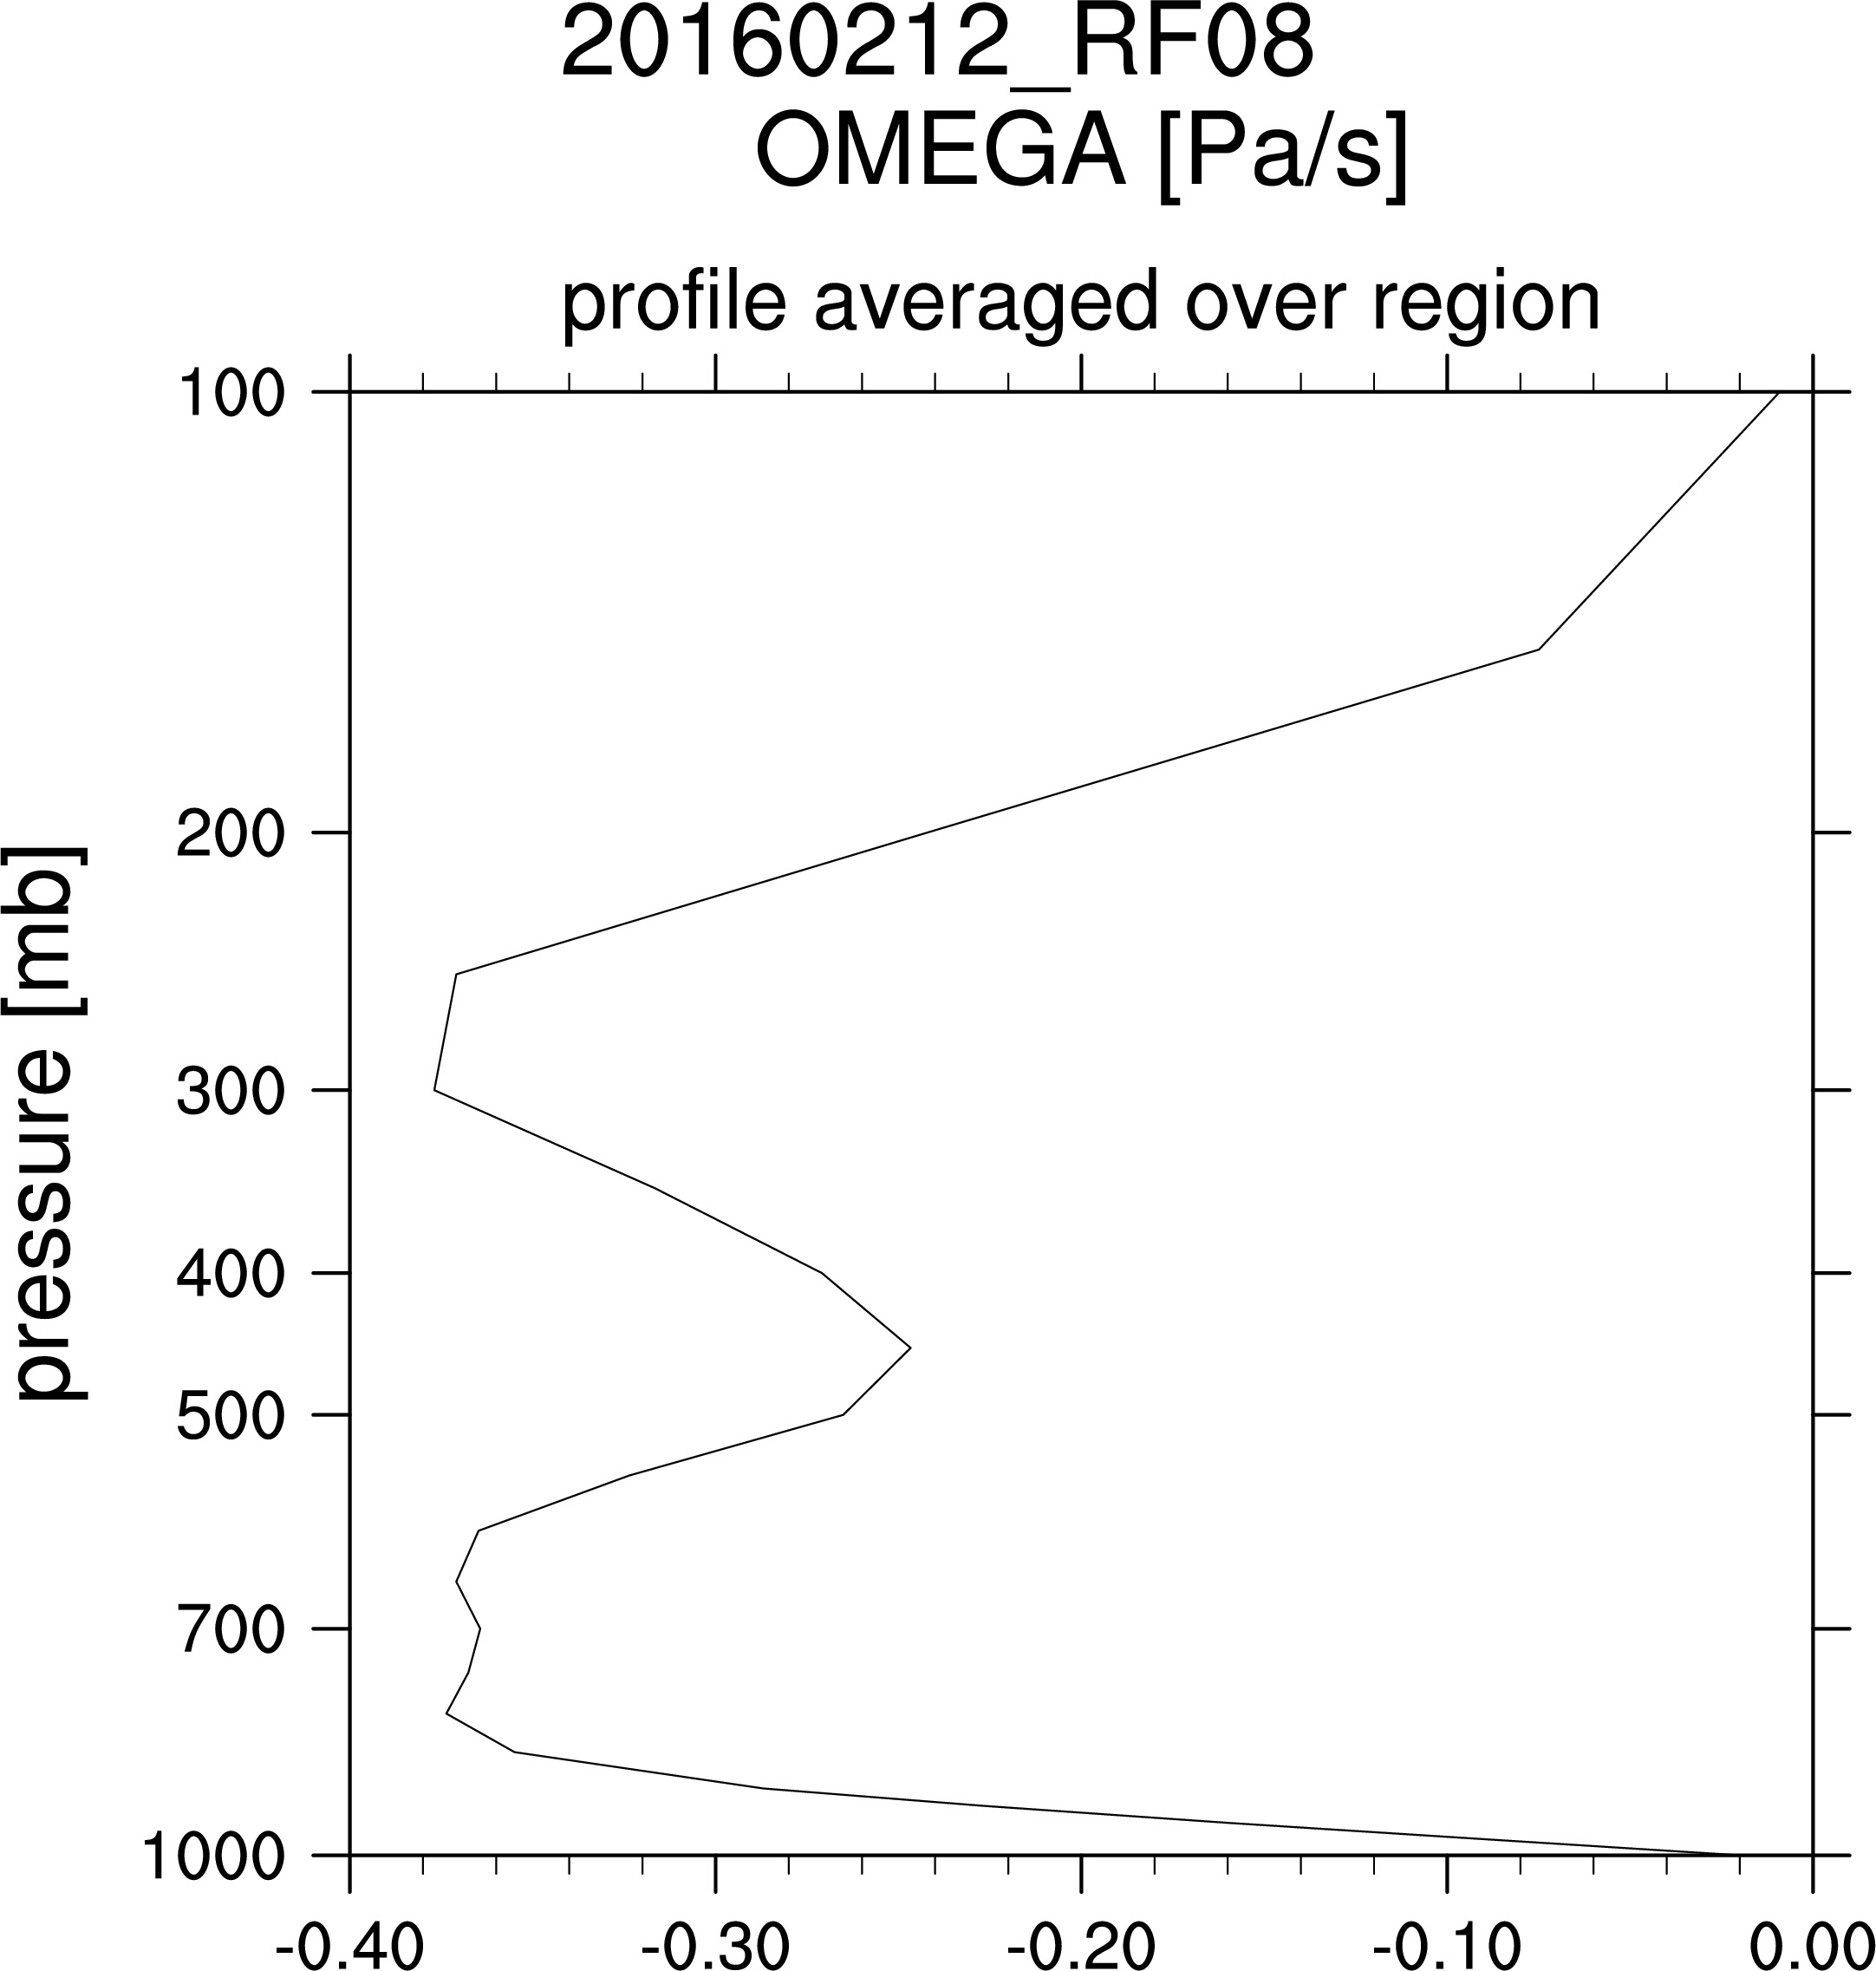
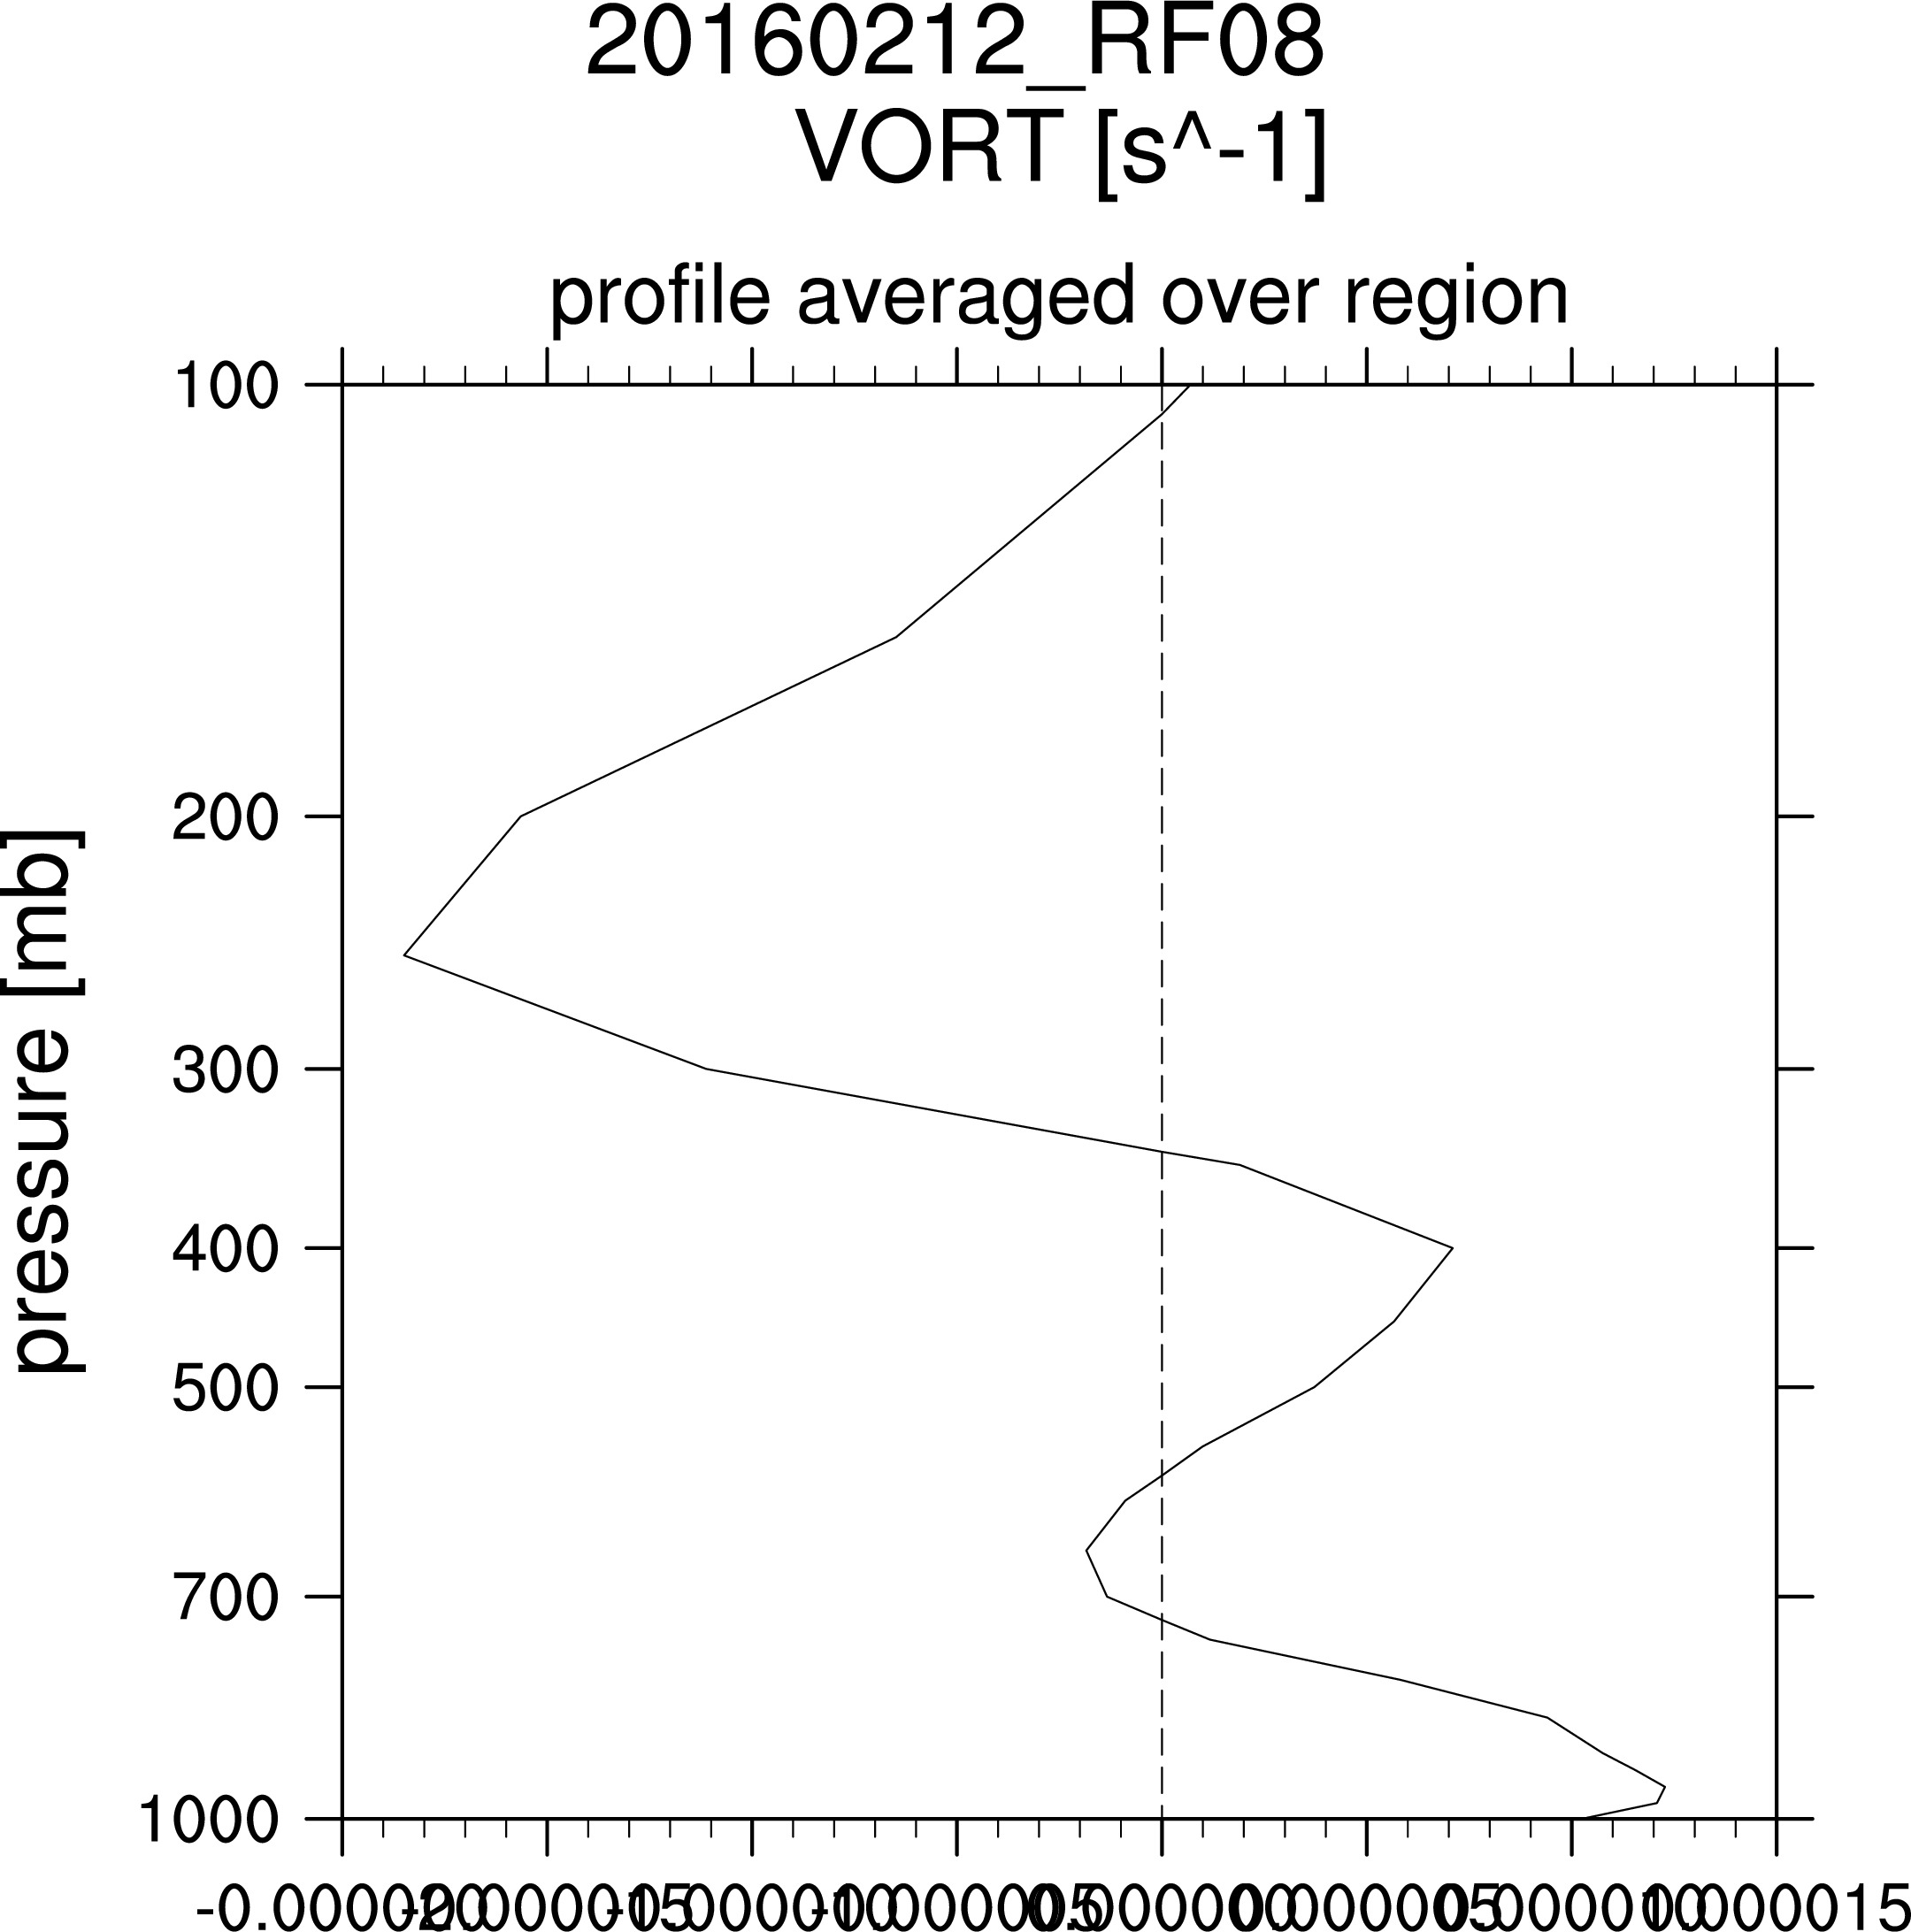
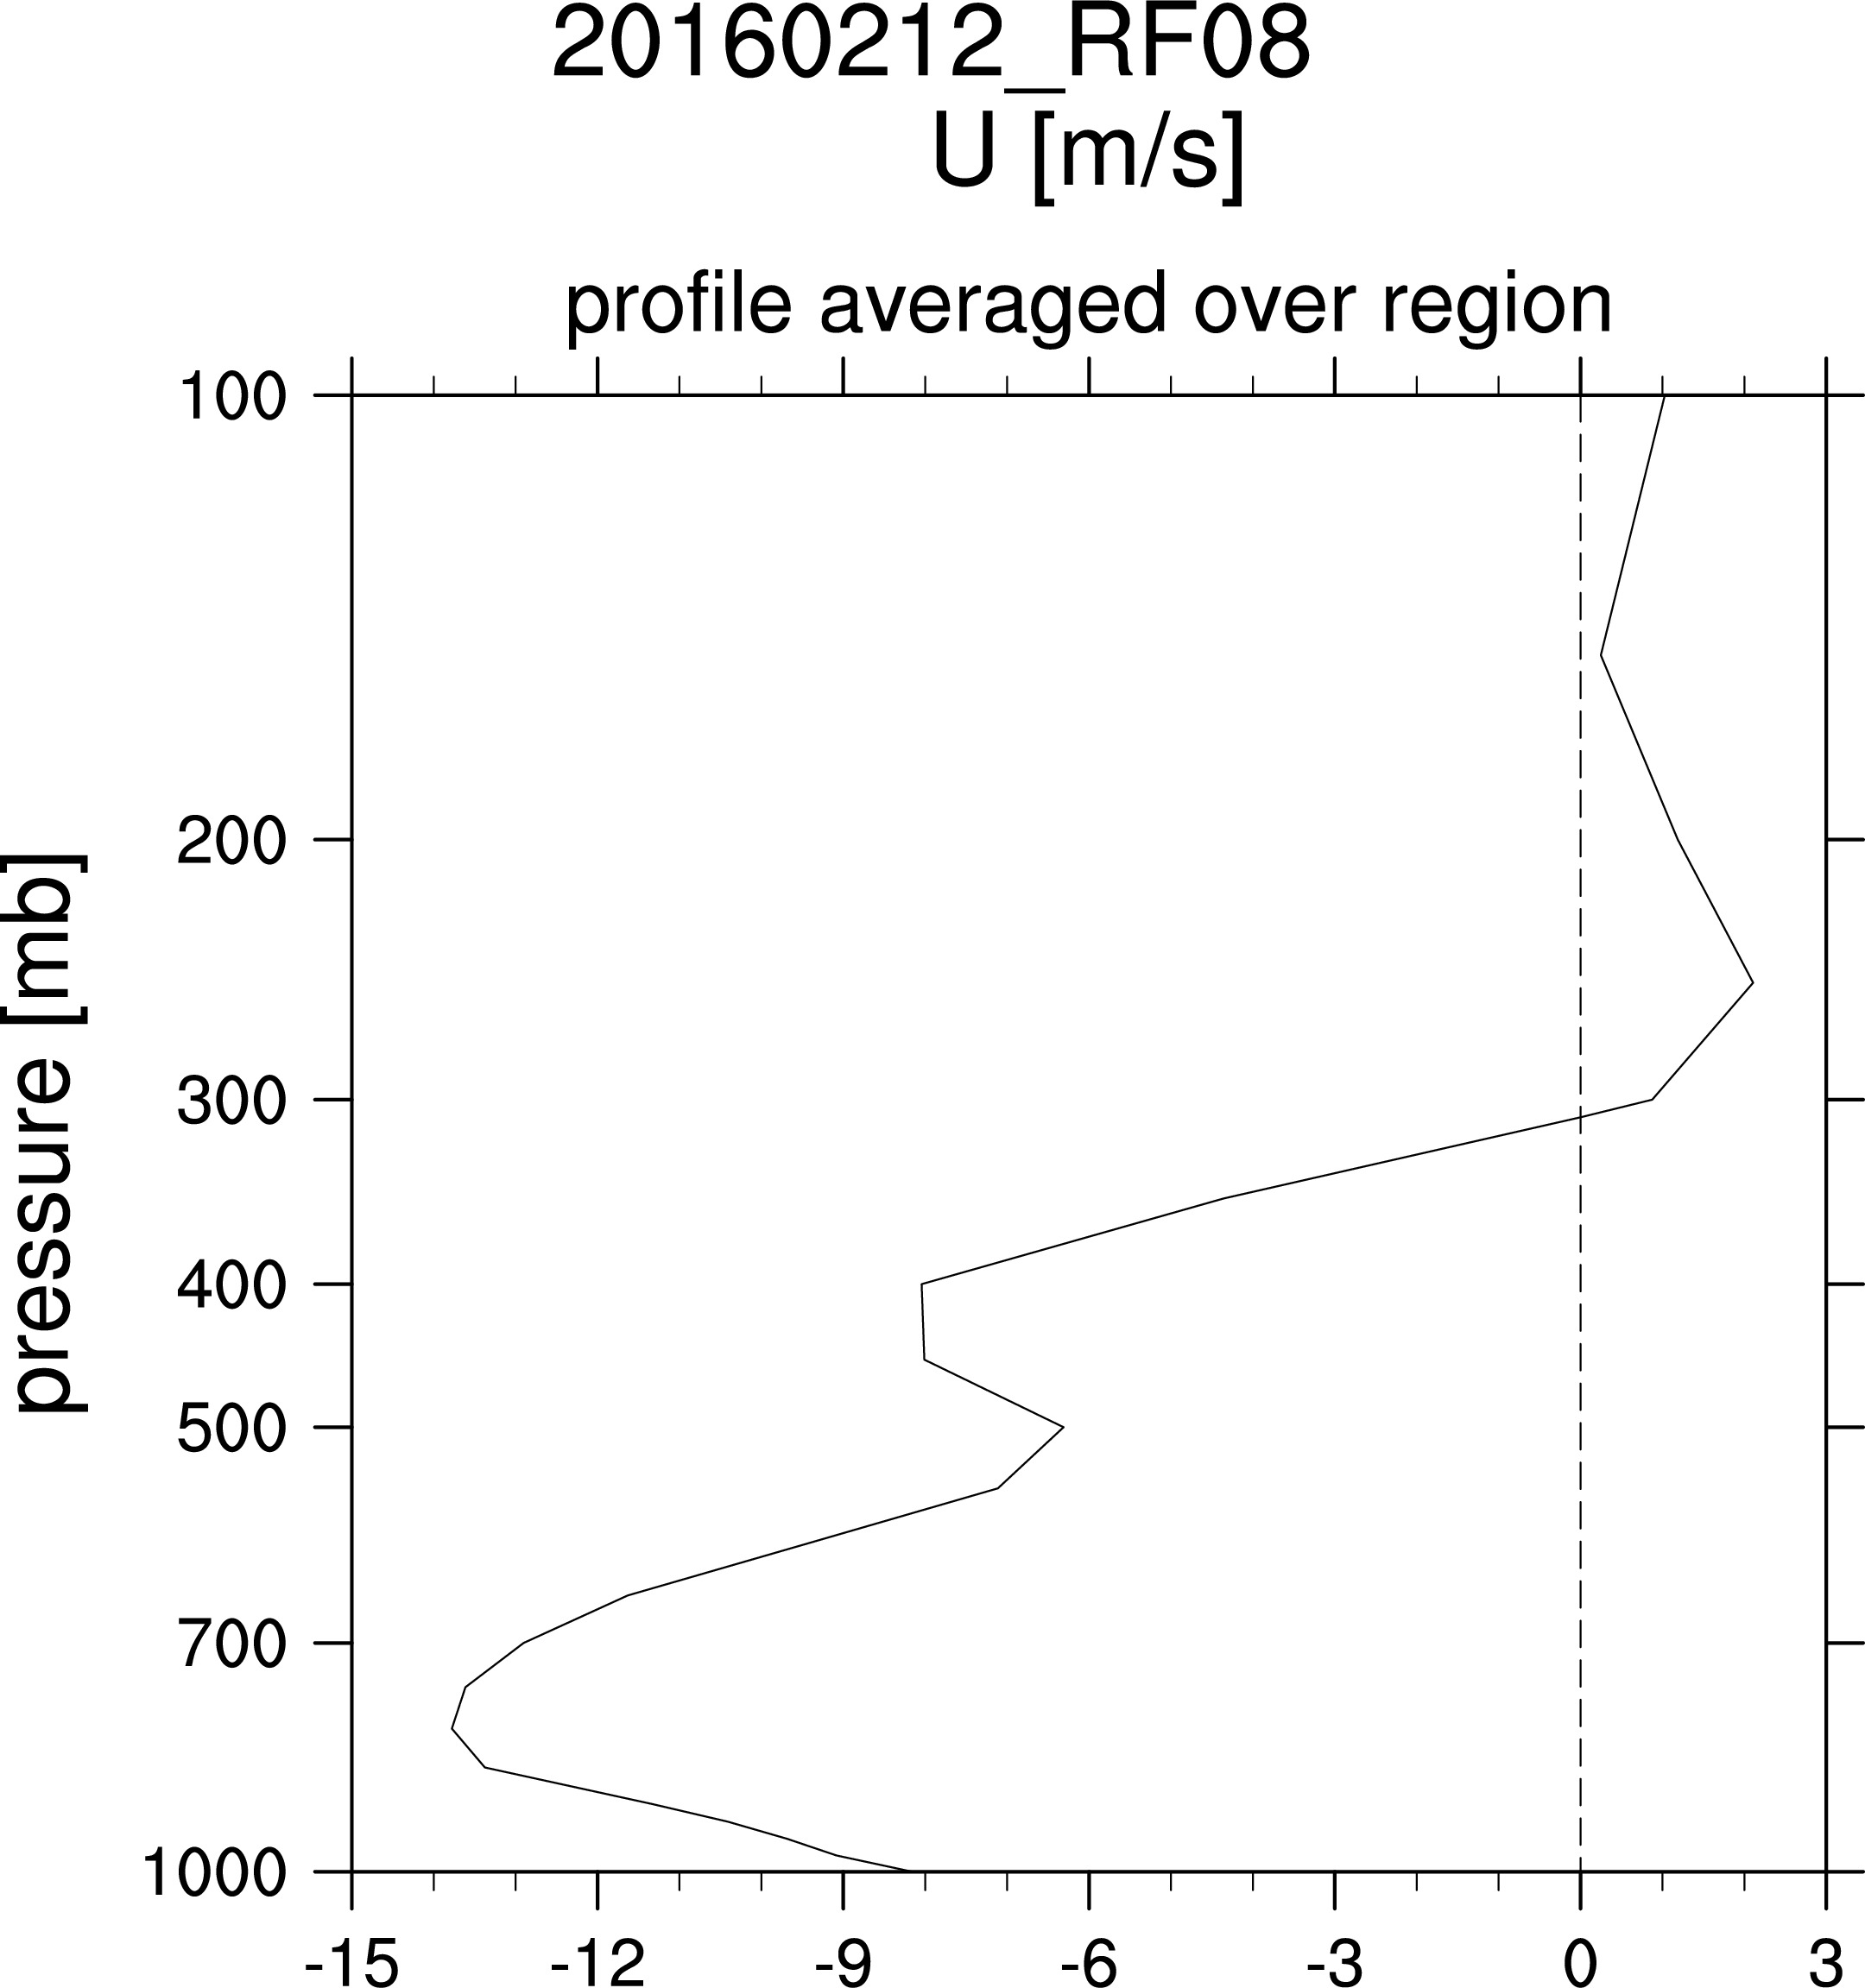
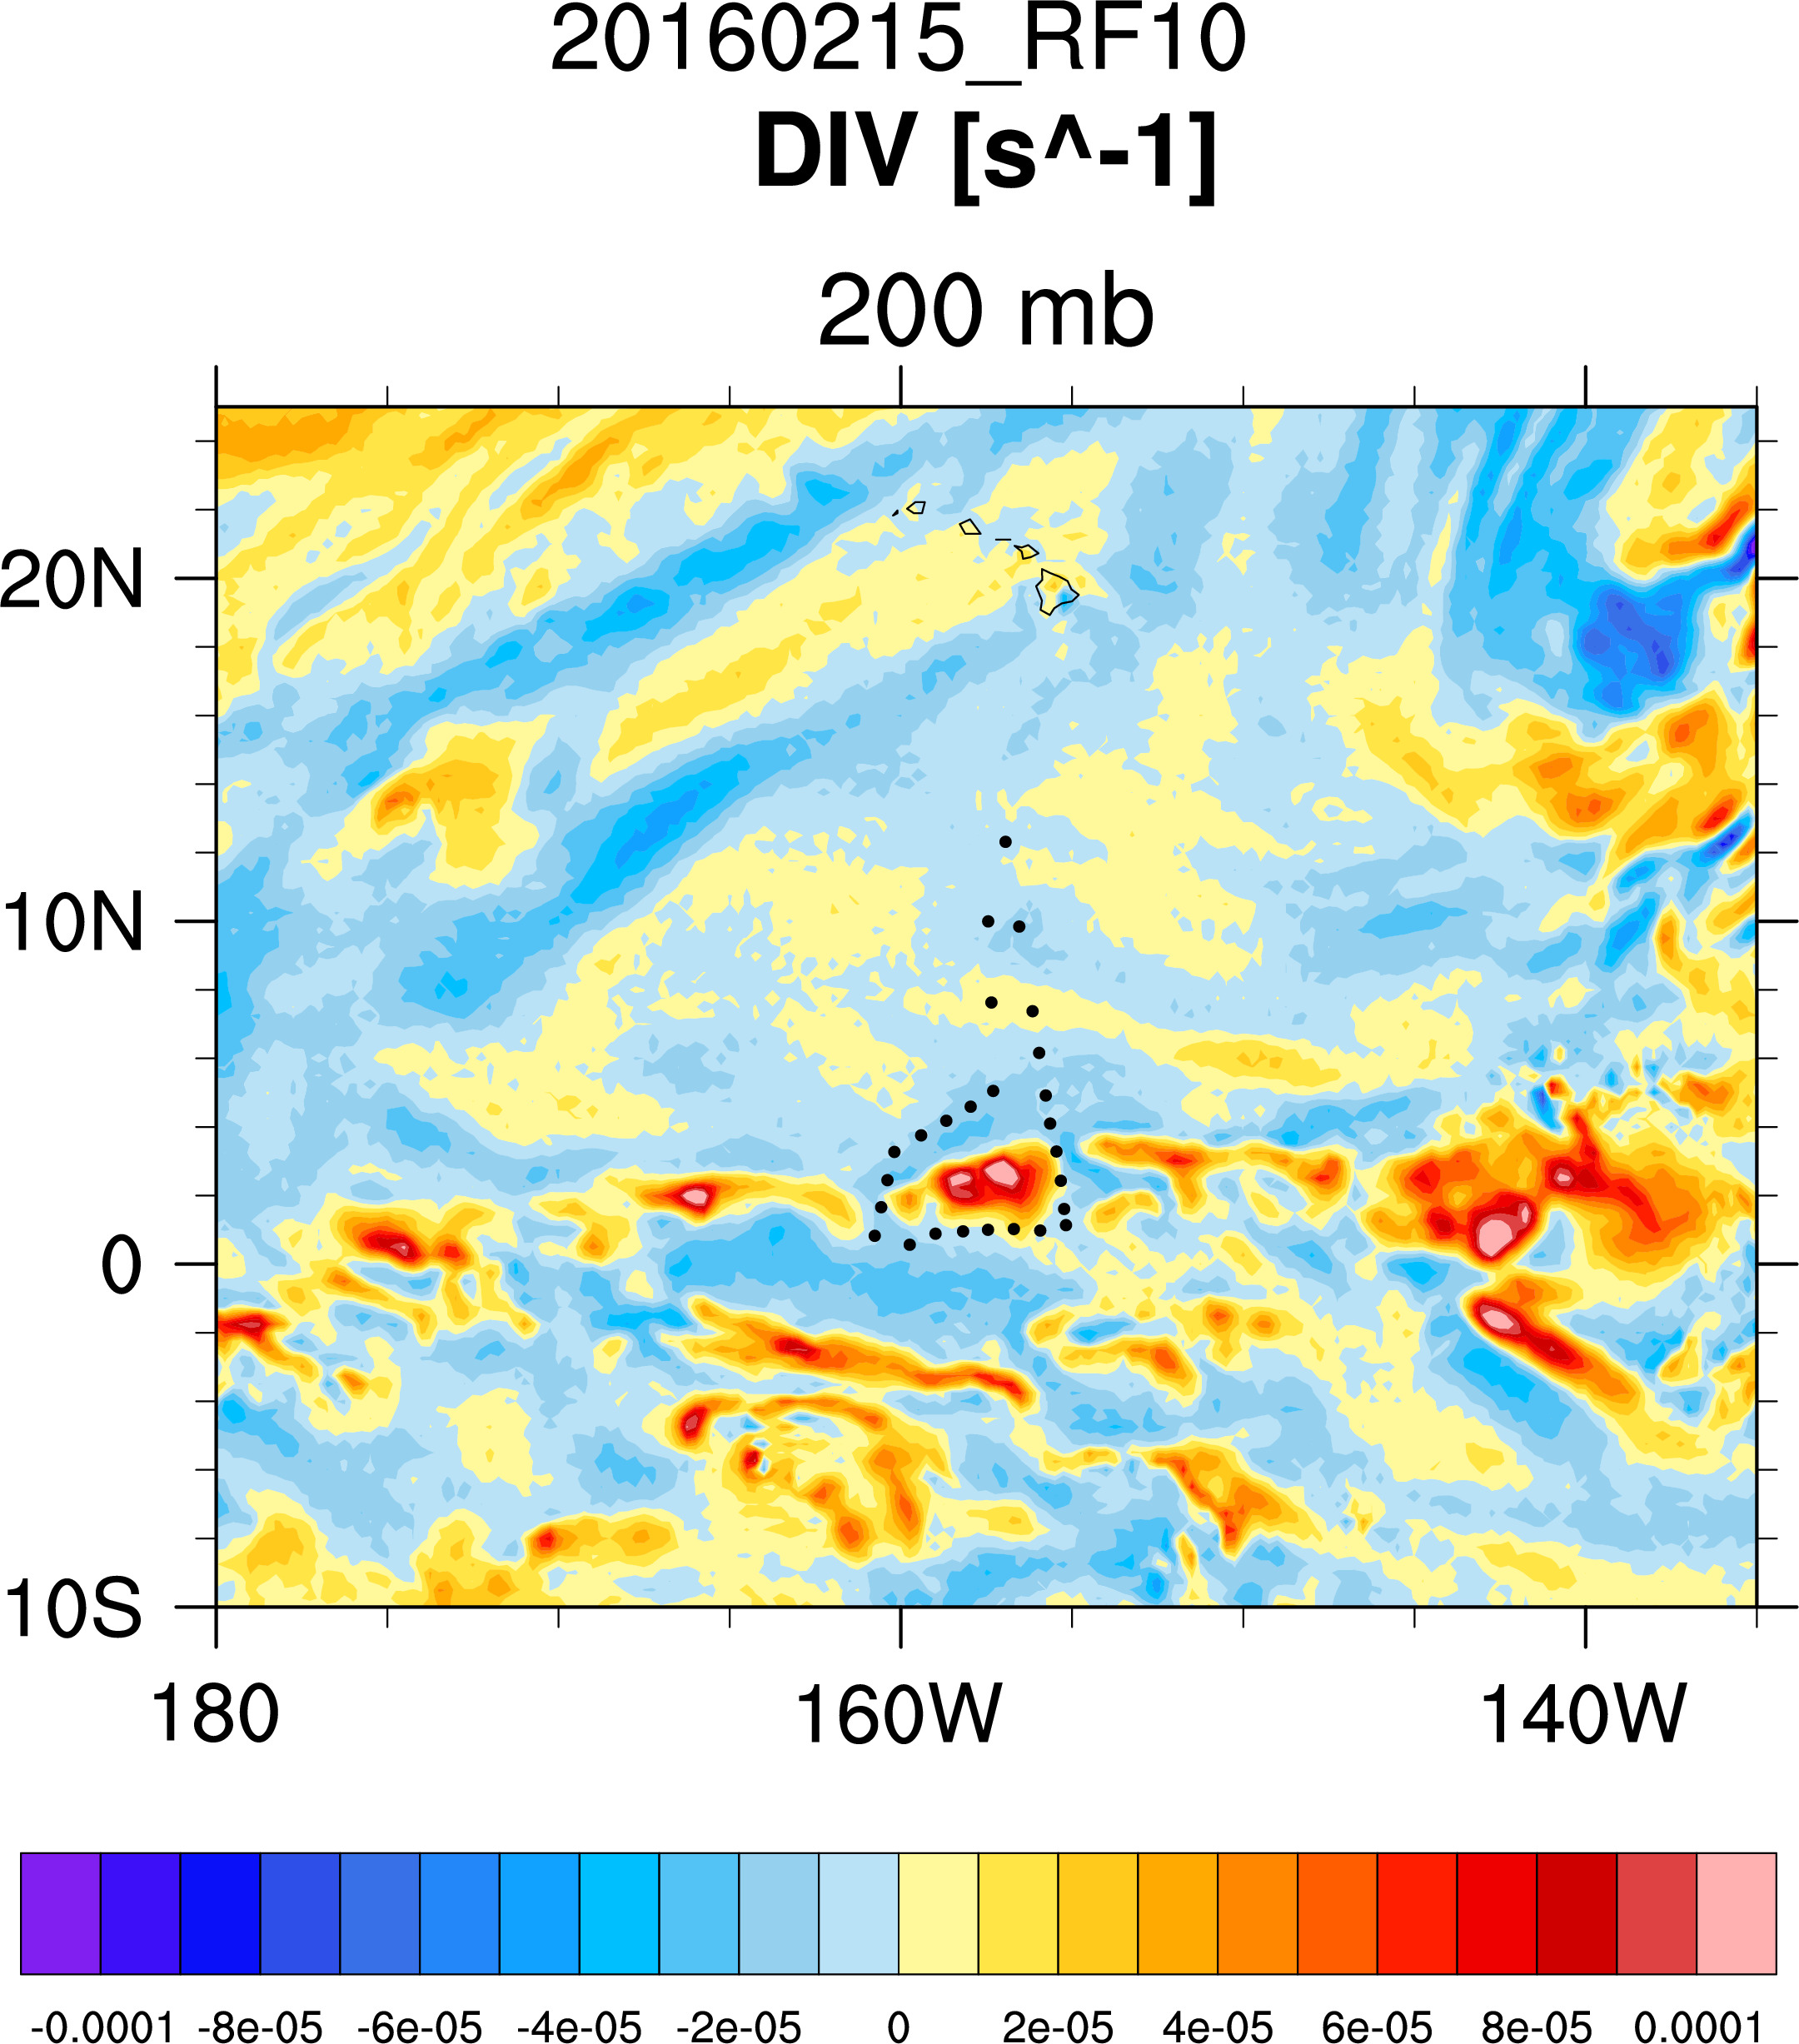
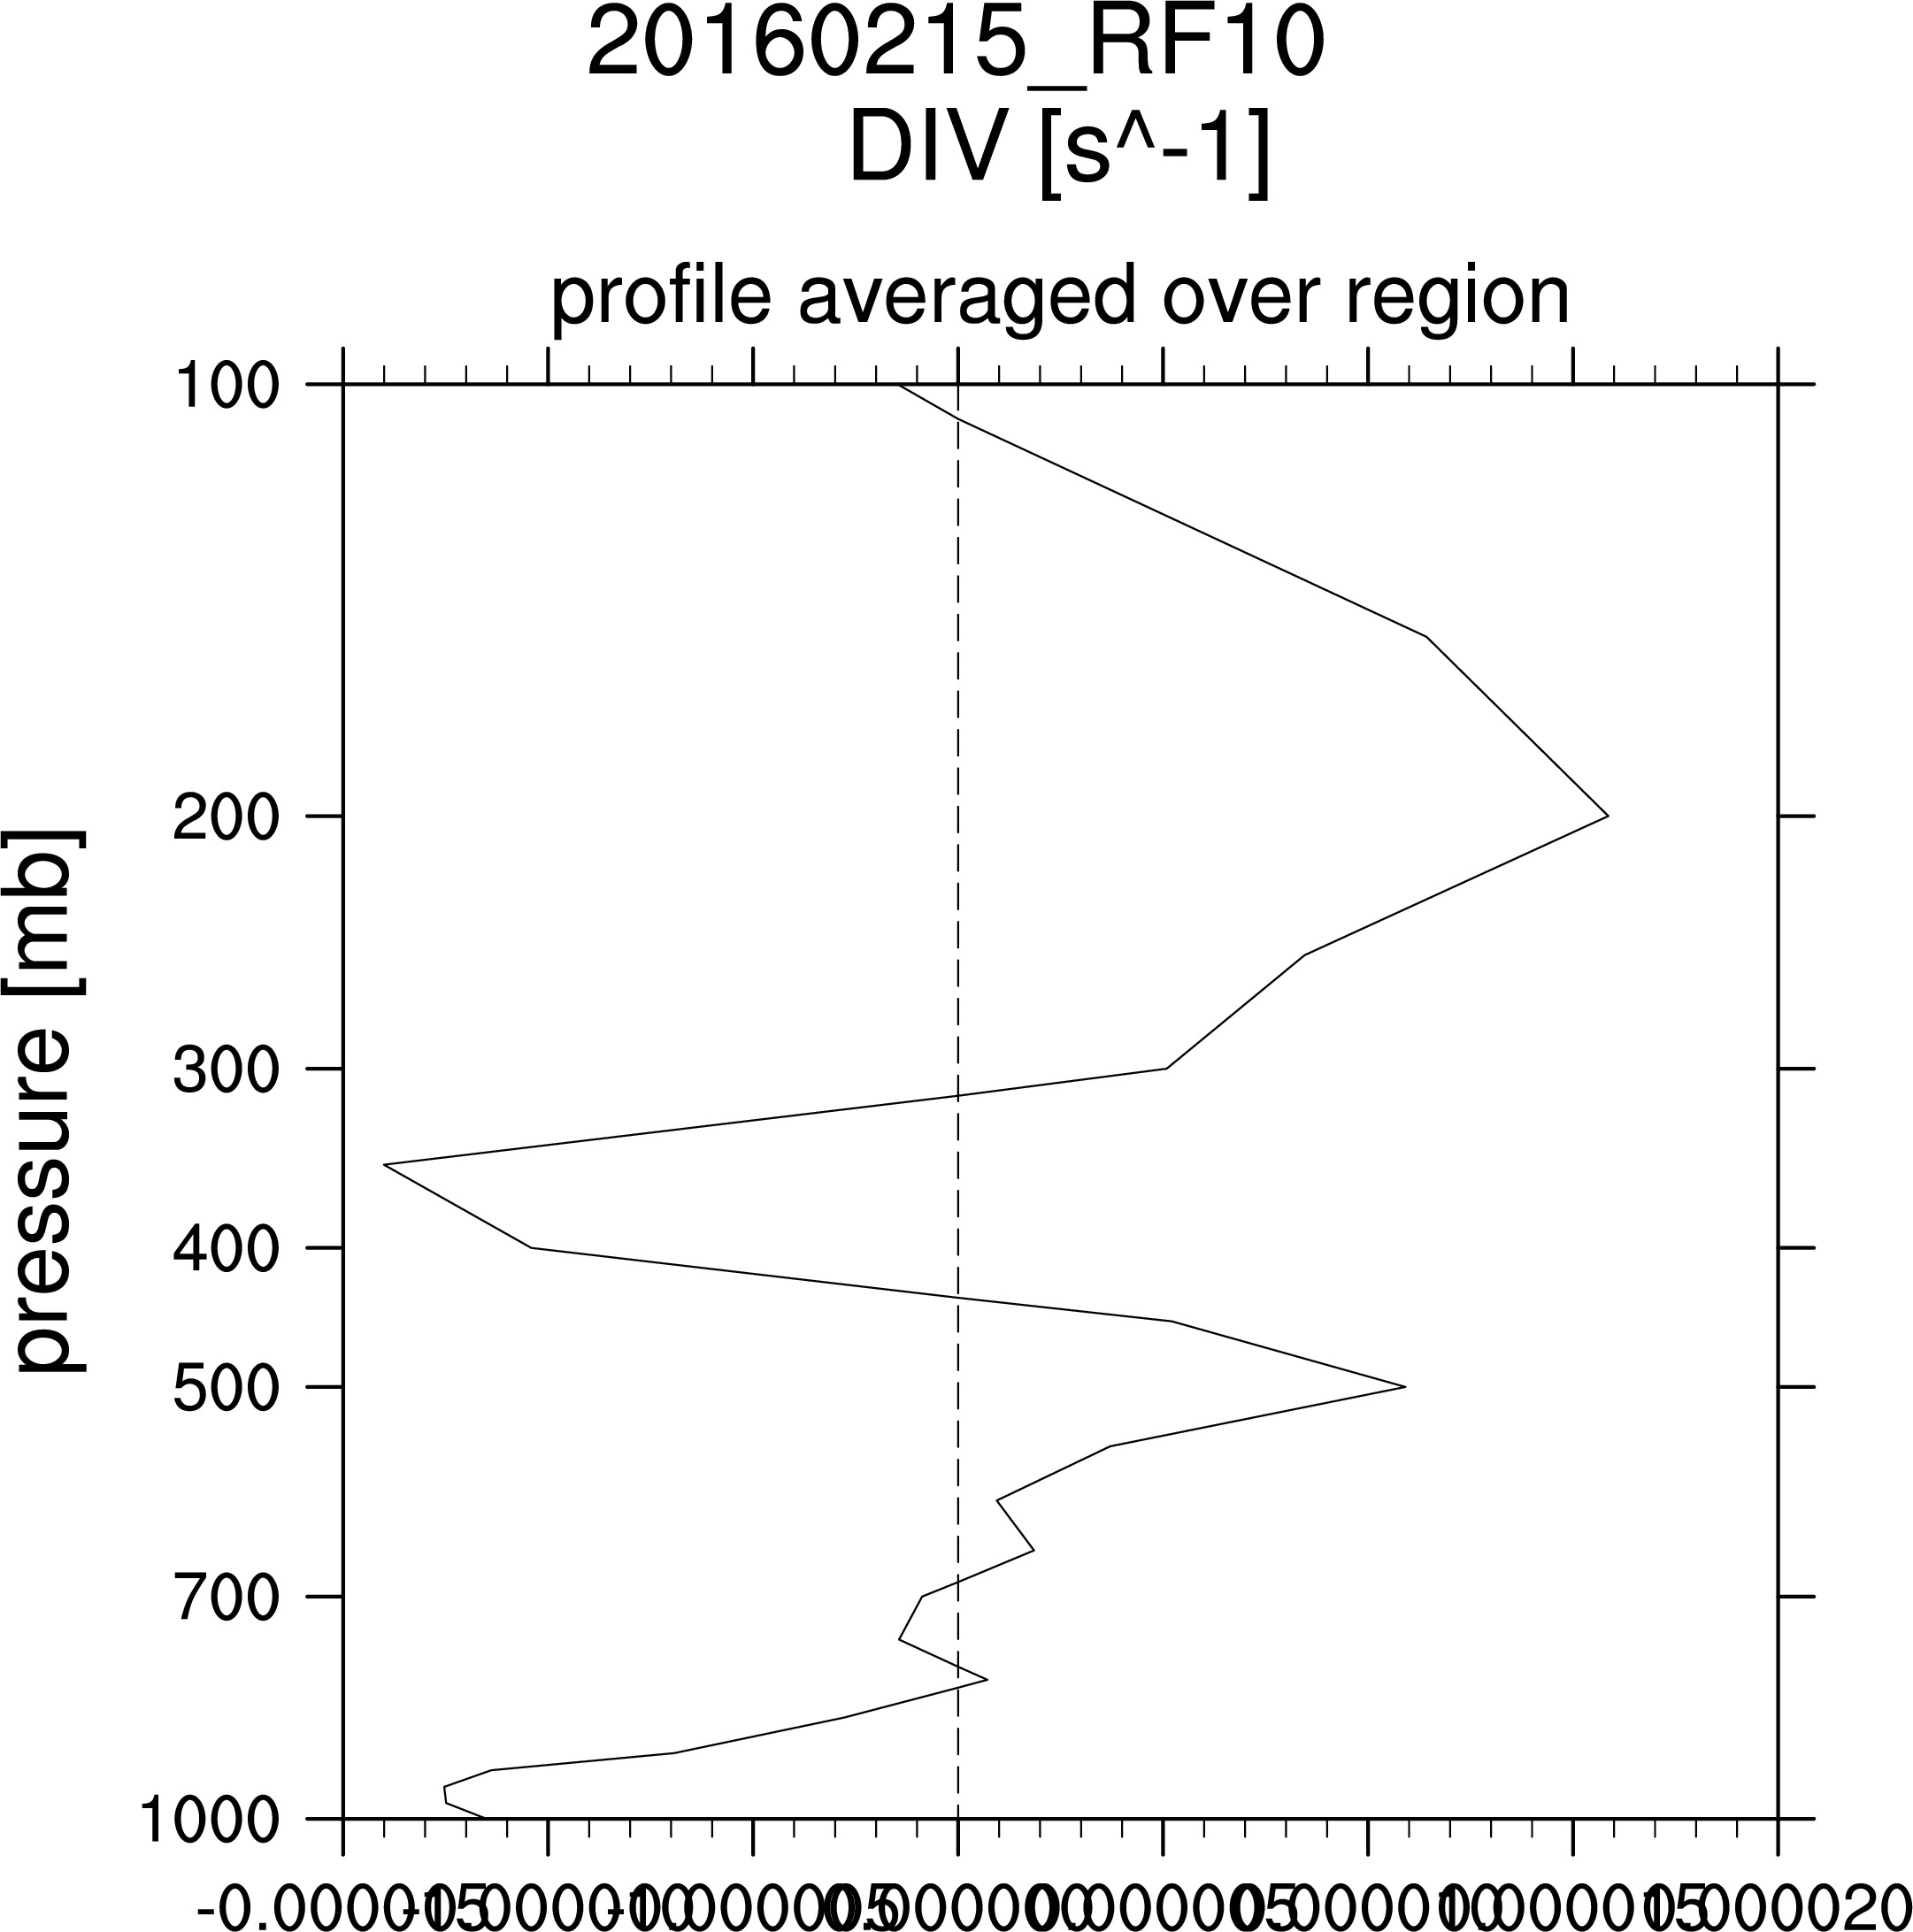
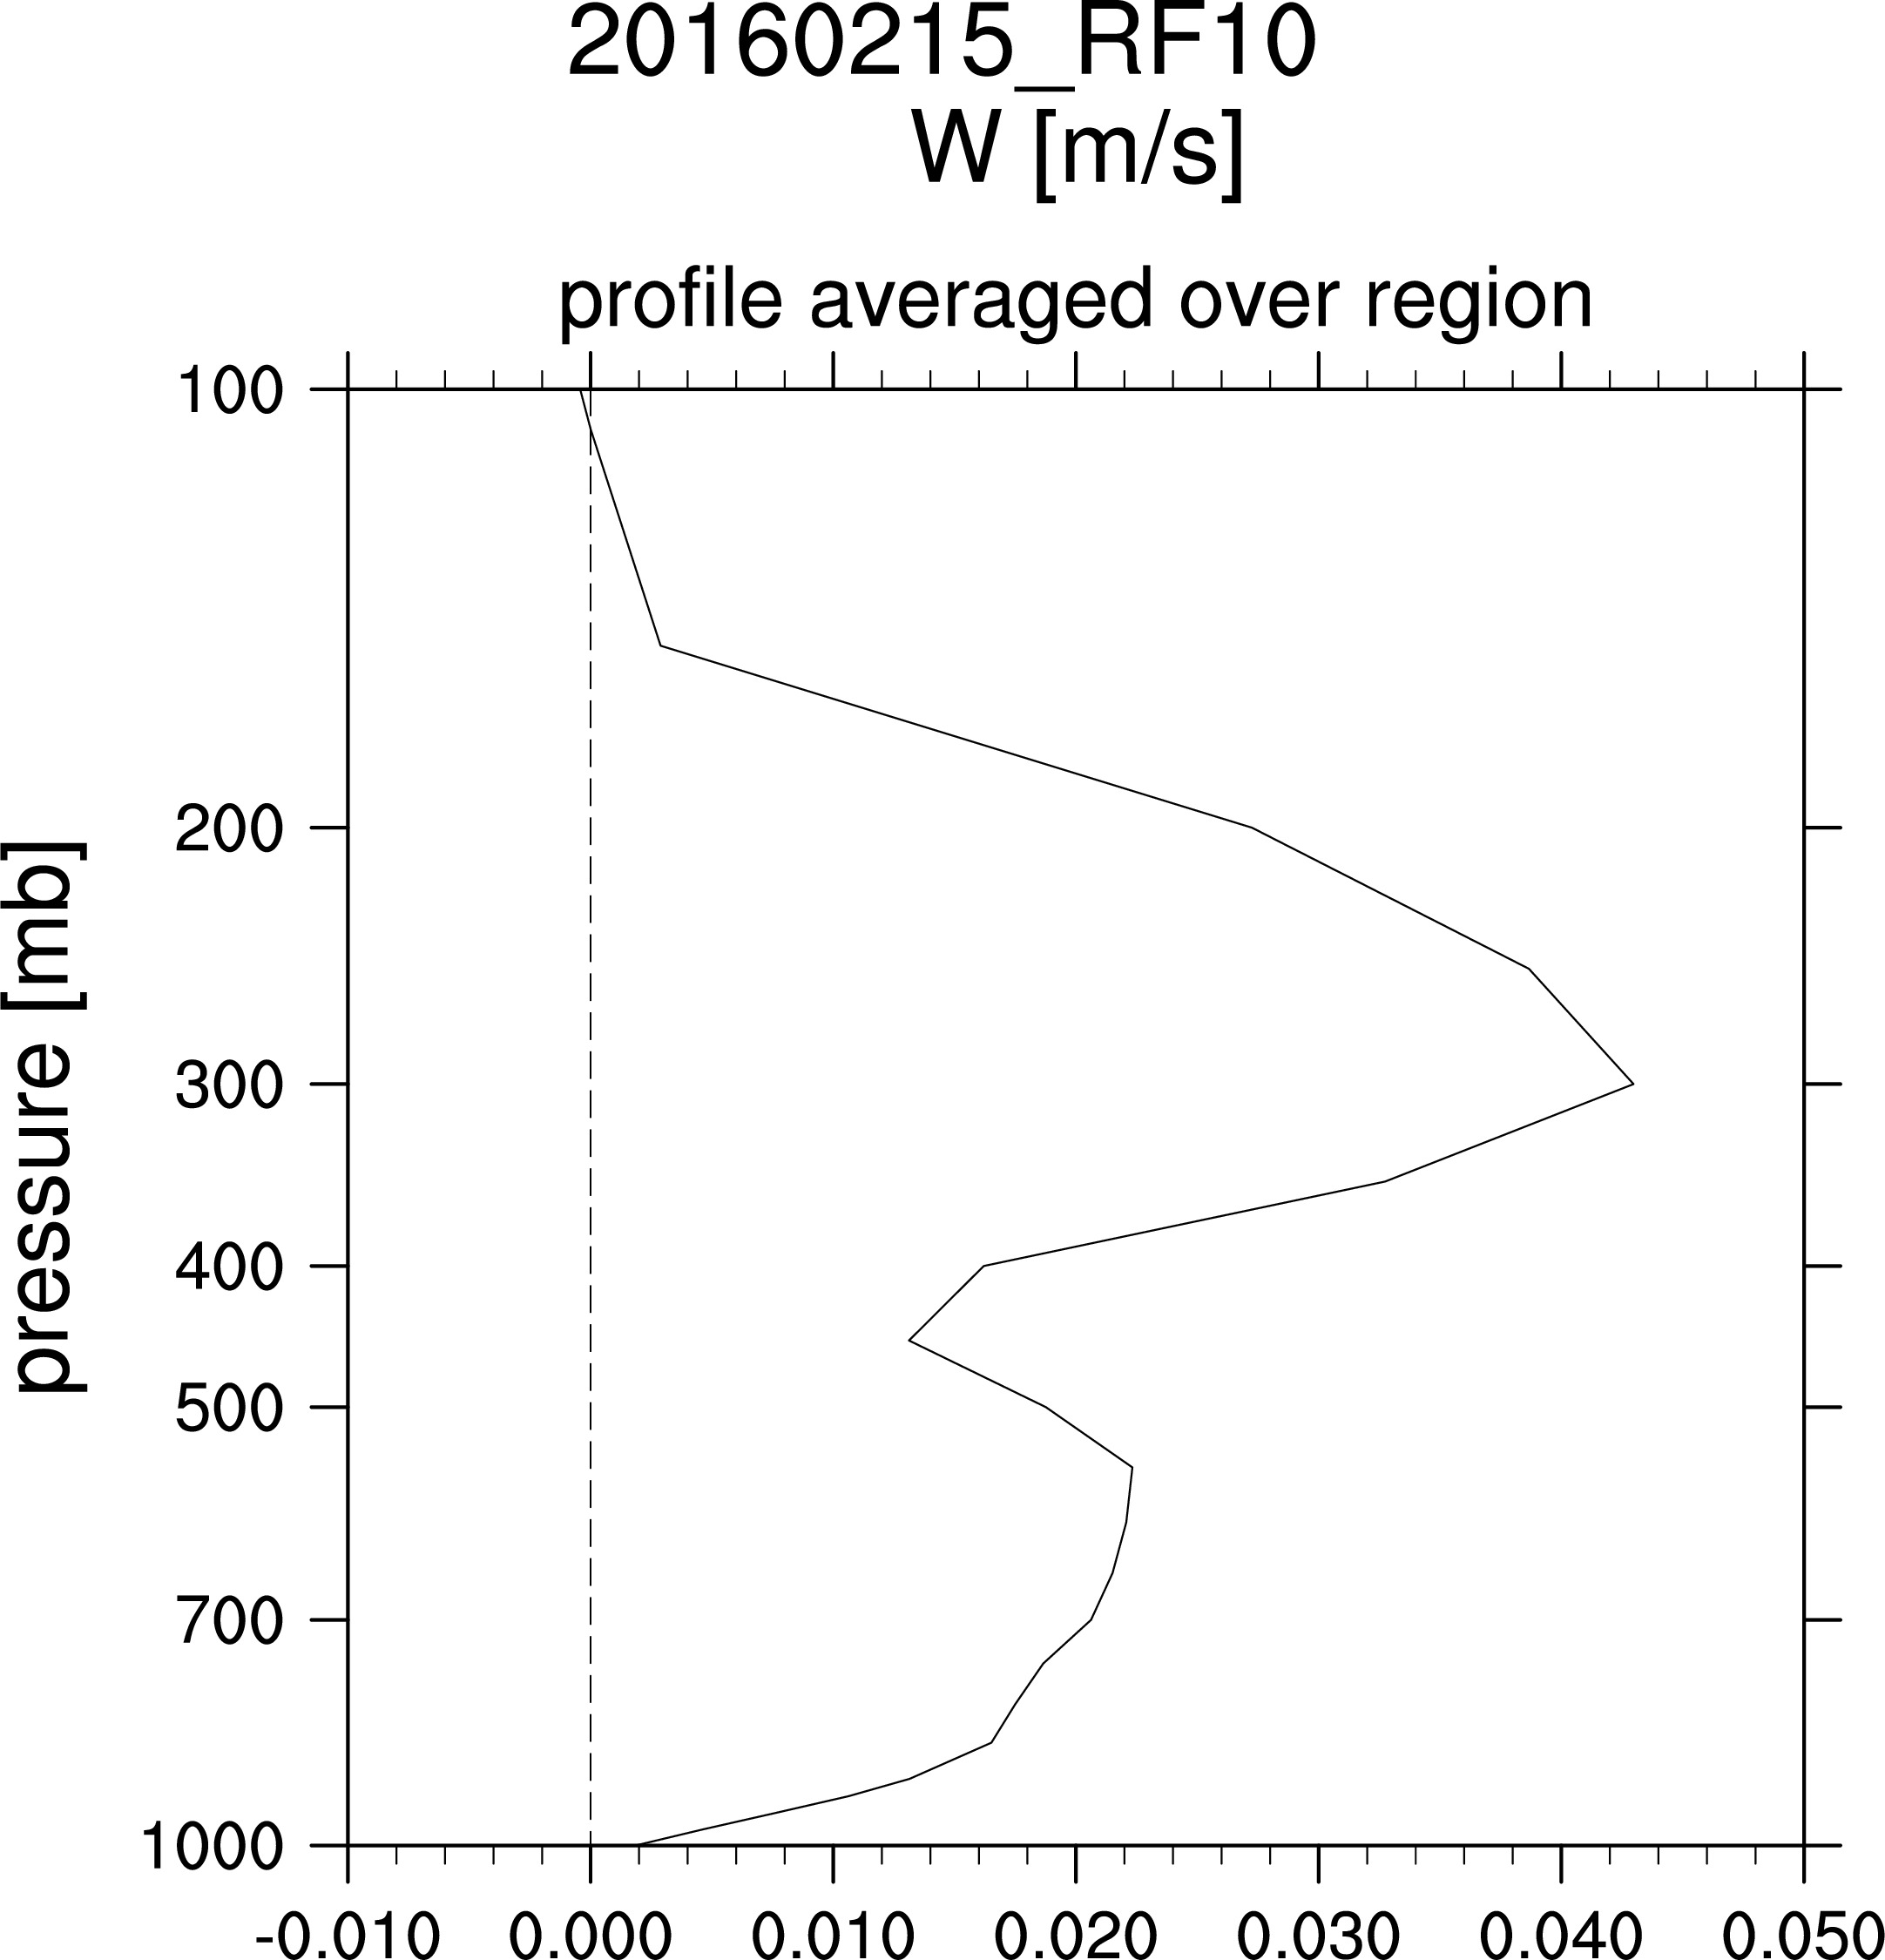
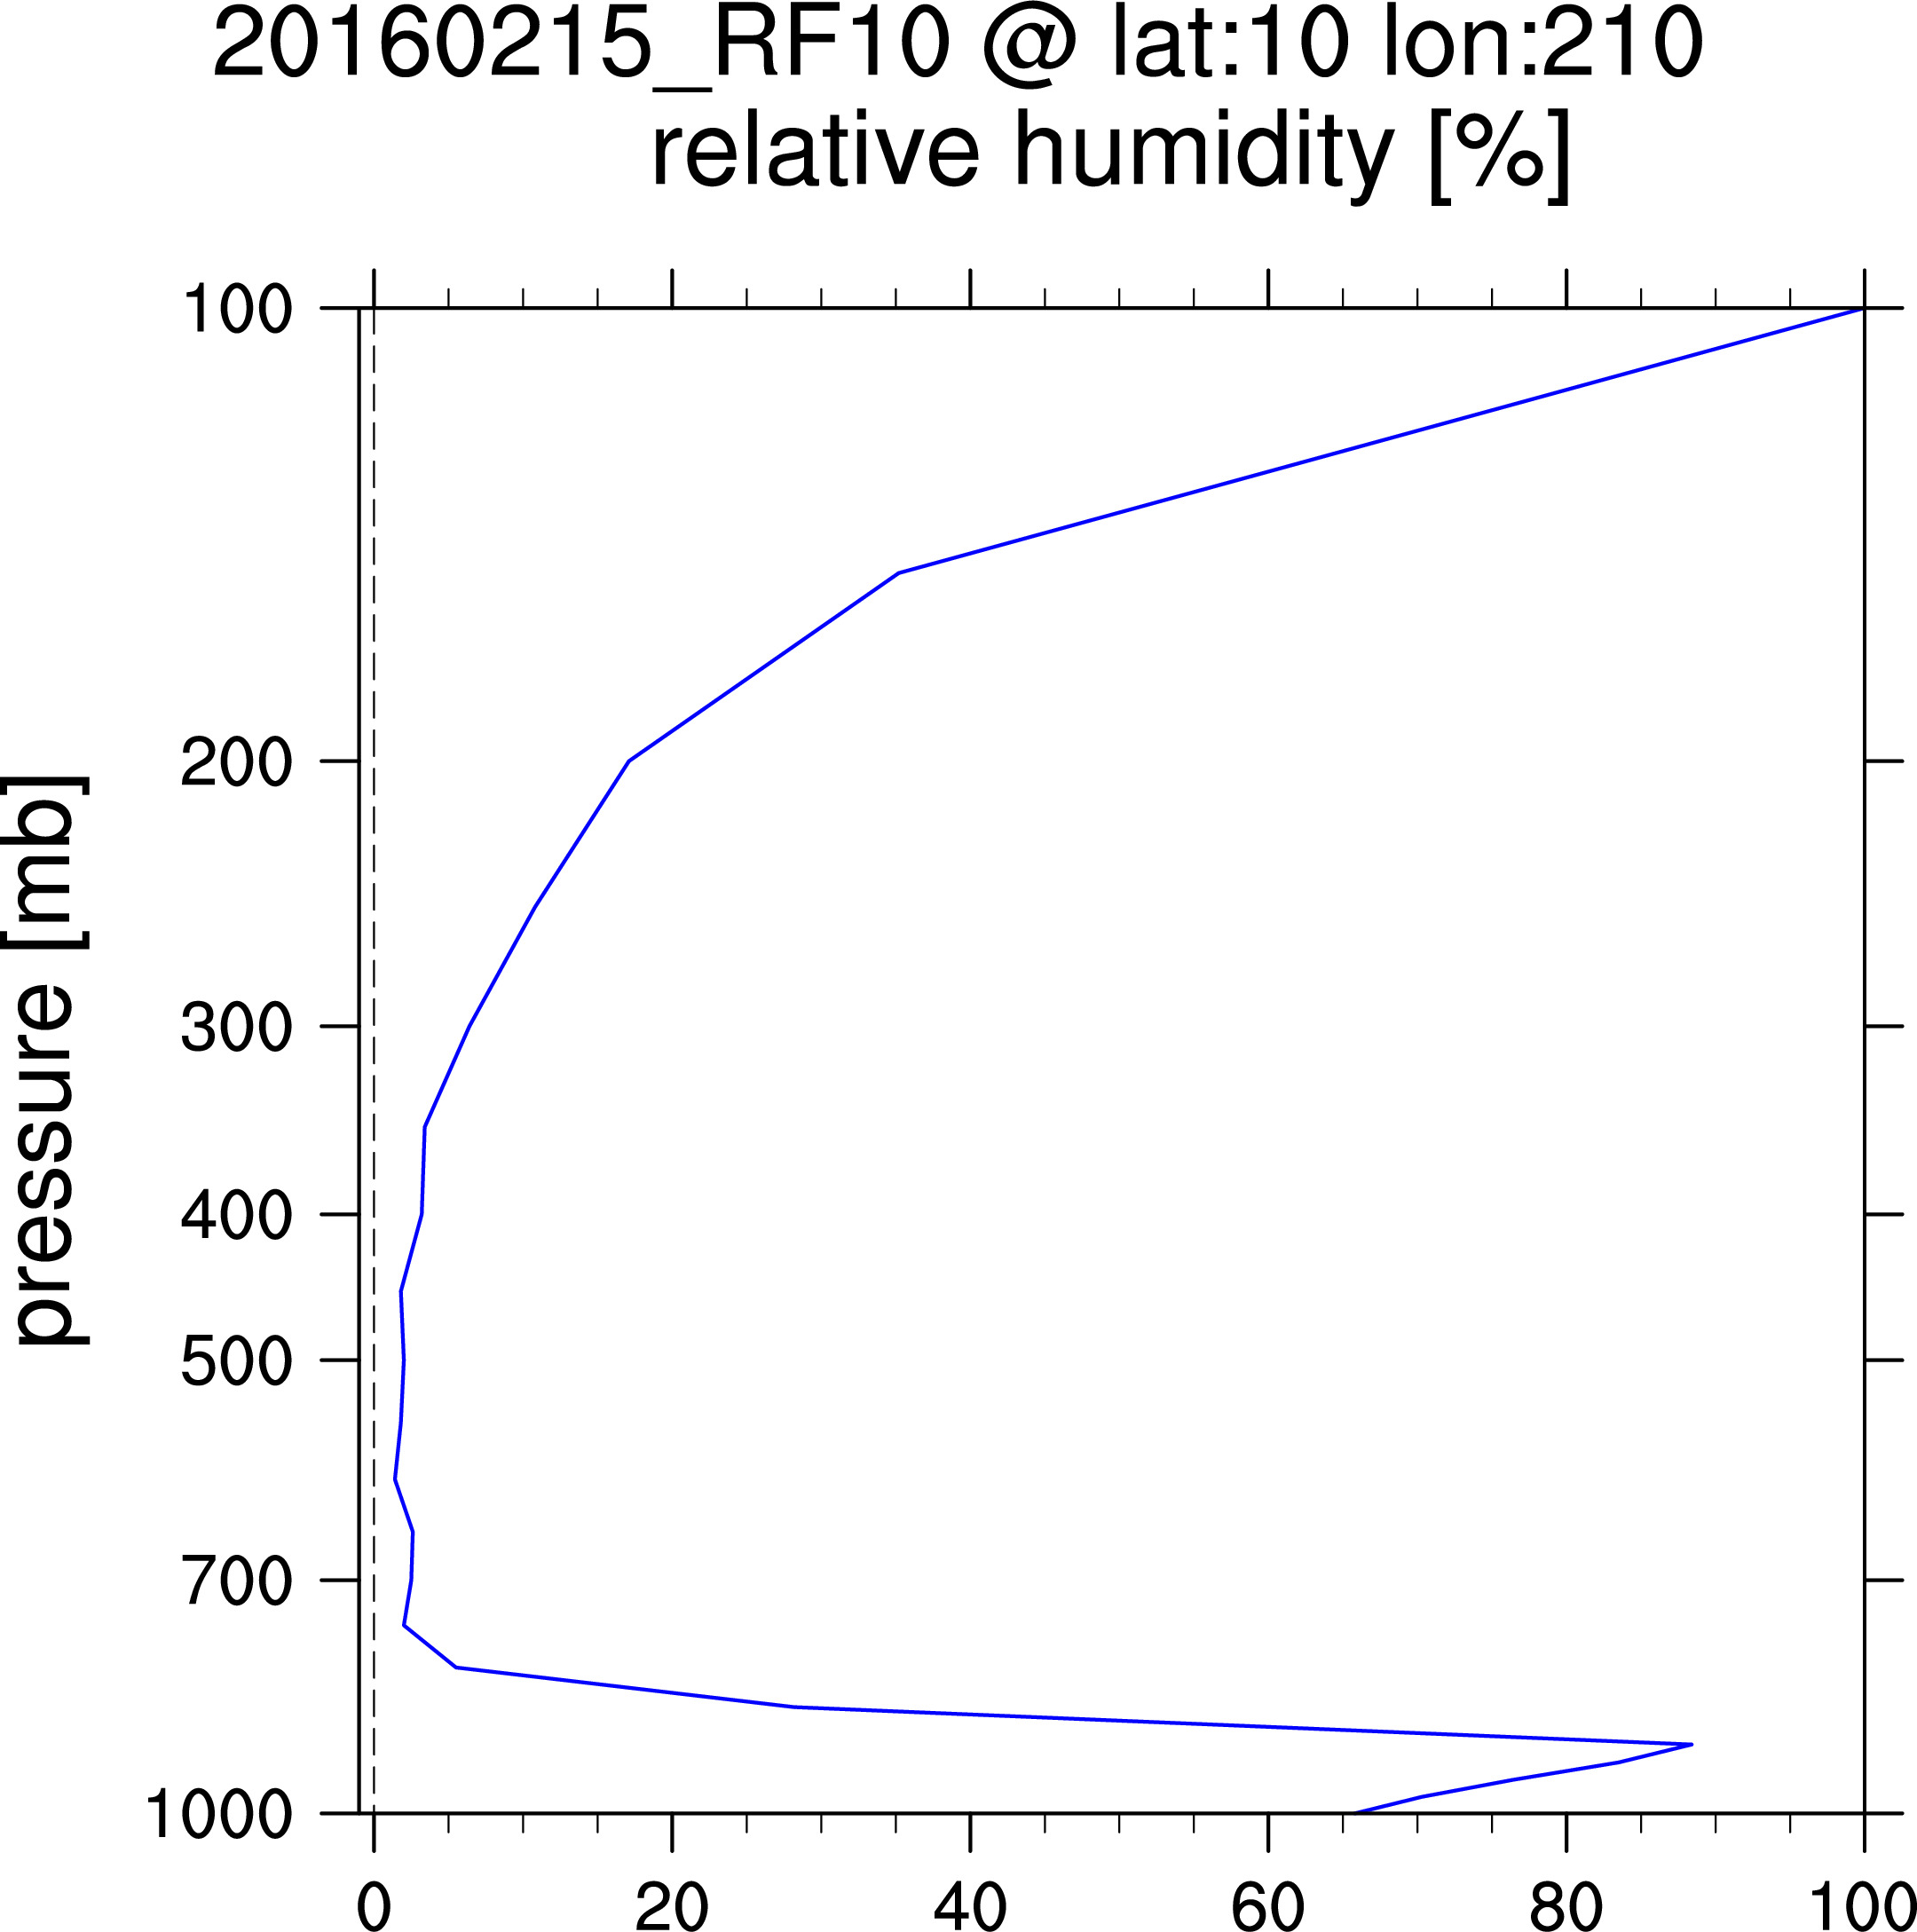
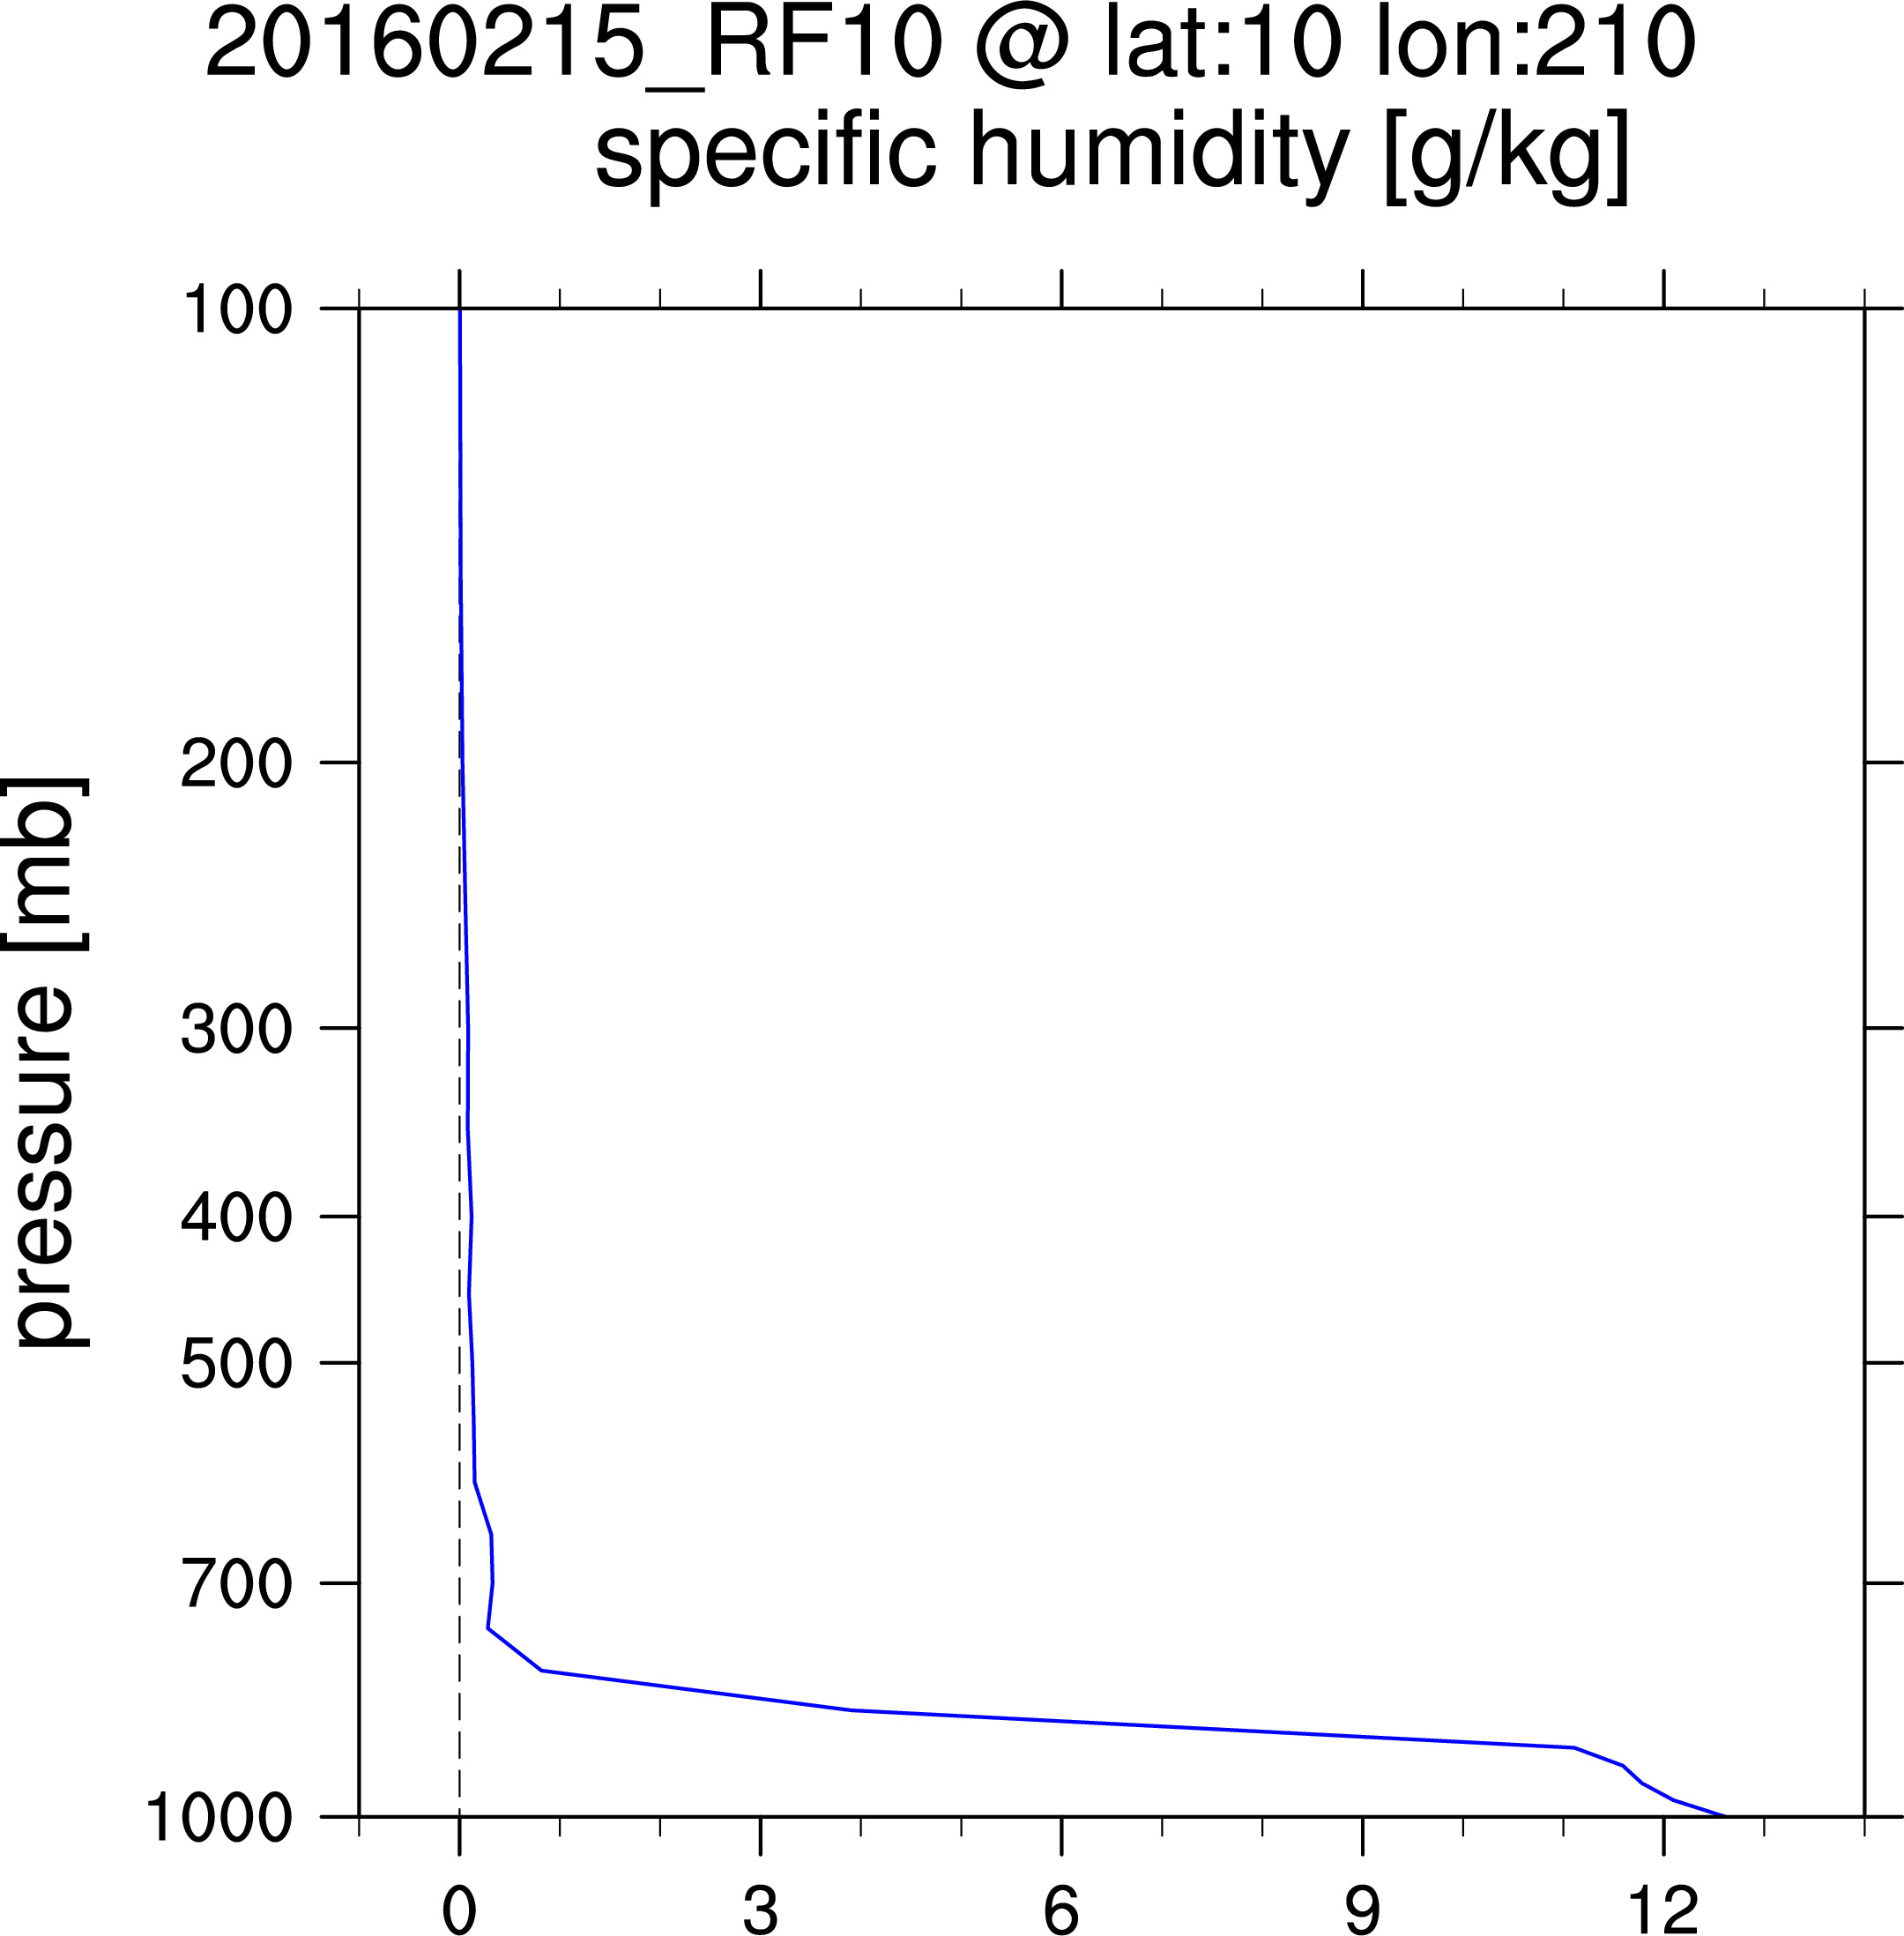
latlon_D20160121_RF01.nc latlon_20160126_RF03.nc latlon_20160203_RF07.nc latlon_20160212_RF08.nc latlon_20160215_RF10.nc
profile.avg.rectangles.blobs.xlsx div.avgprofile.rects.wraps.nc vvelms.avgprofile.rects.wraps.nc
profile.avg.largerects.blobs.xlsx div.avgprofile.bigrects.wraps.nc vvelms.avgprofile.bigrects.wraps.nc
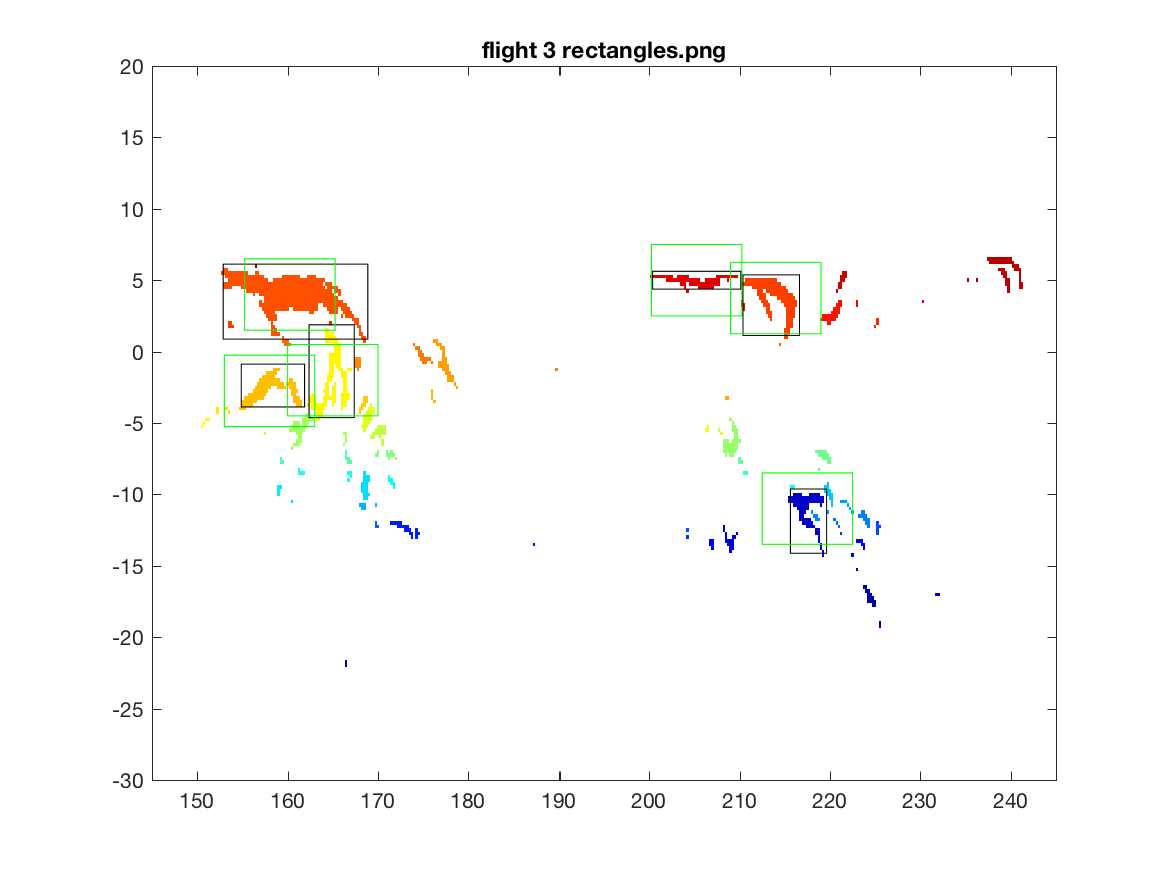
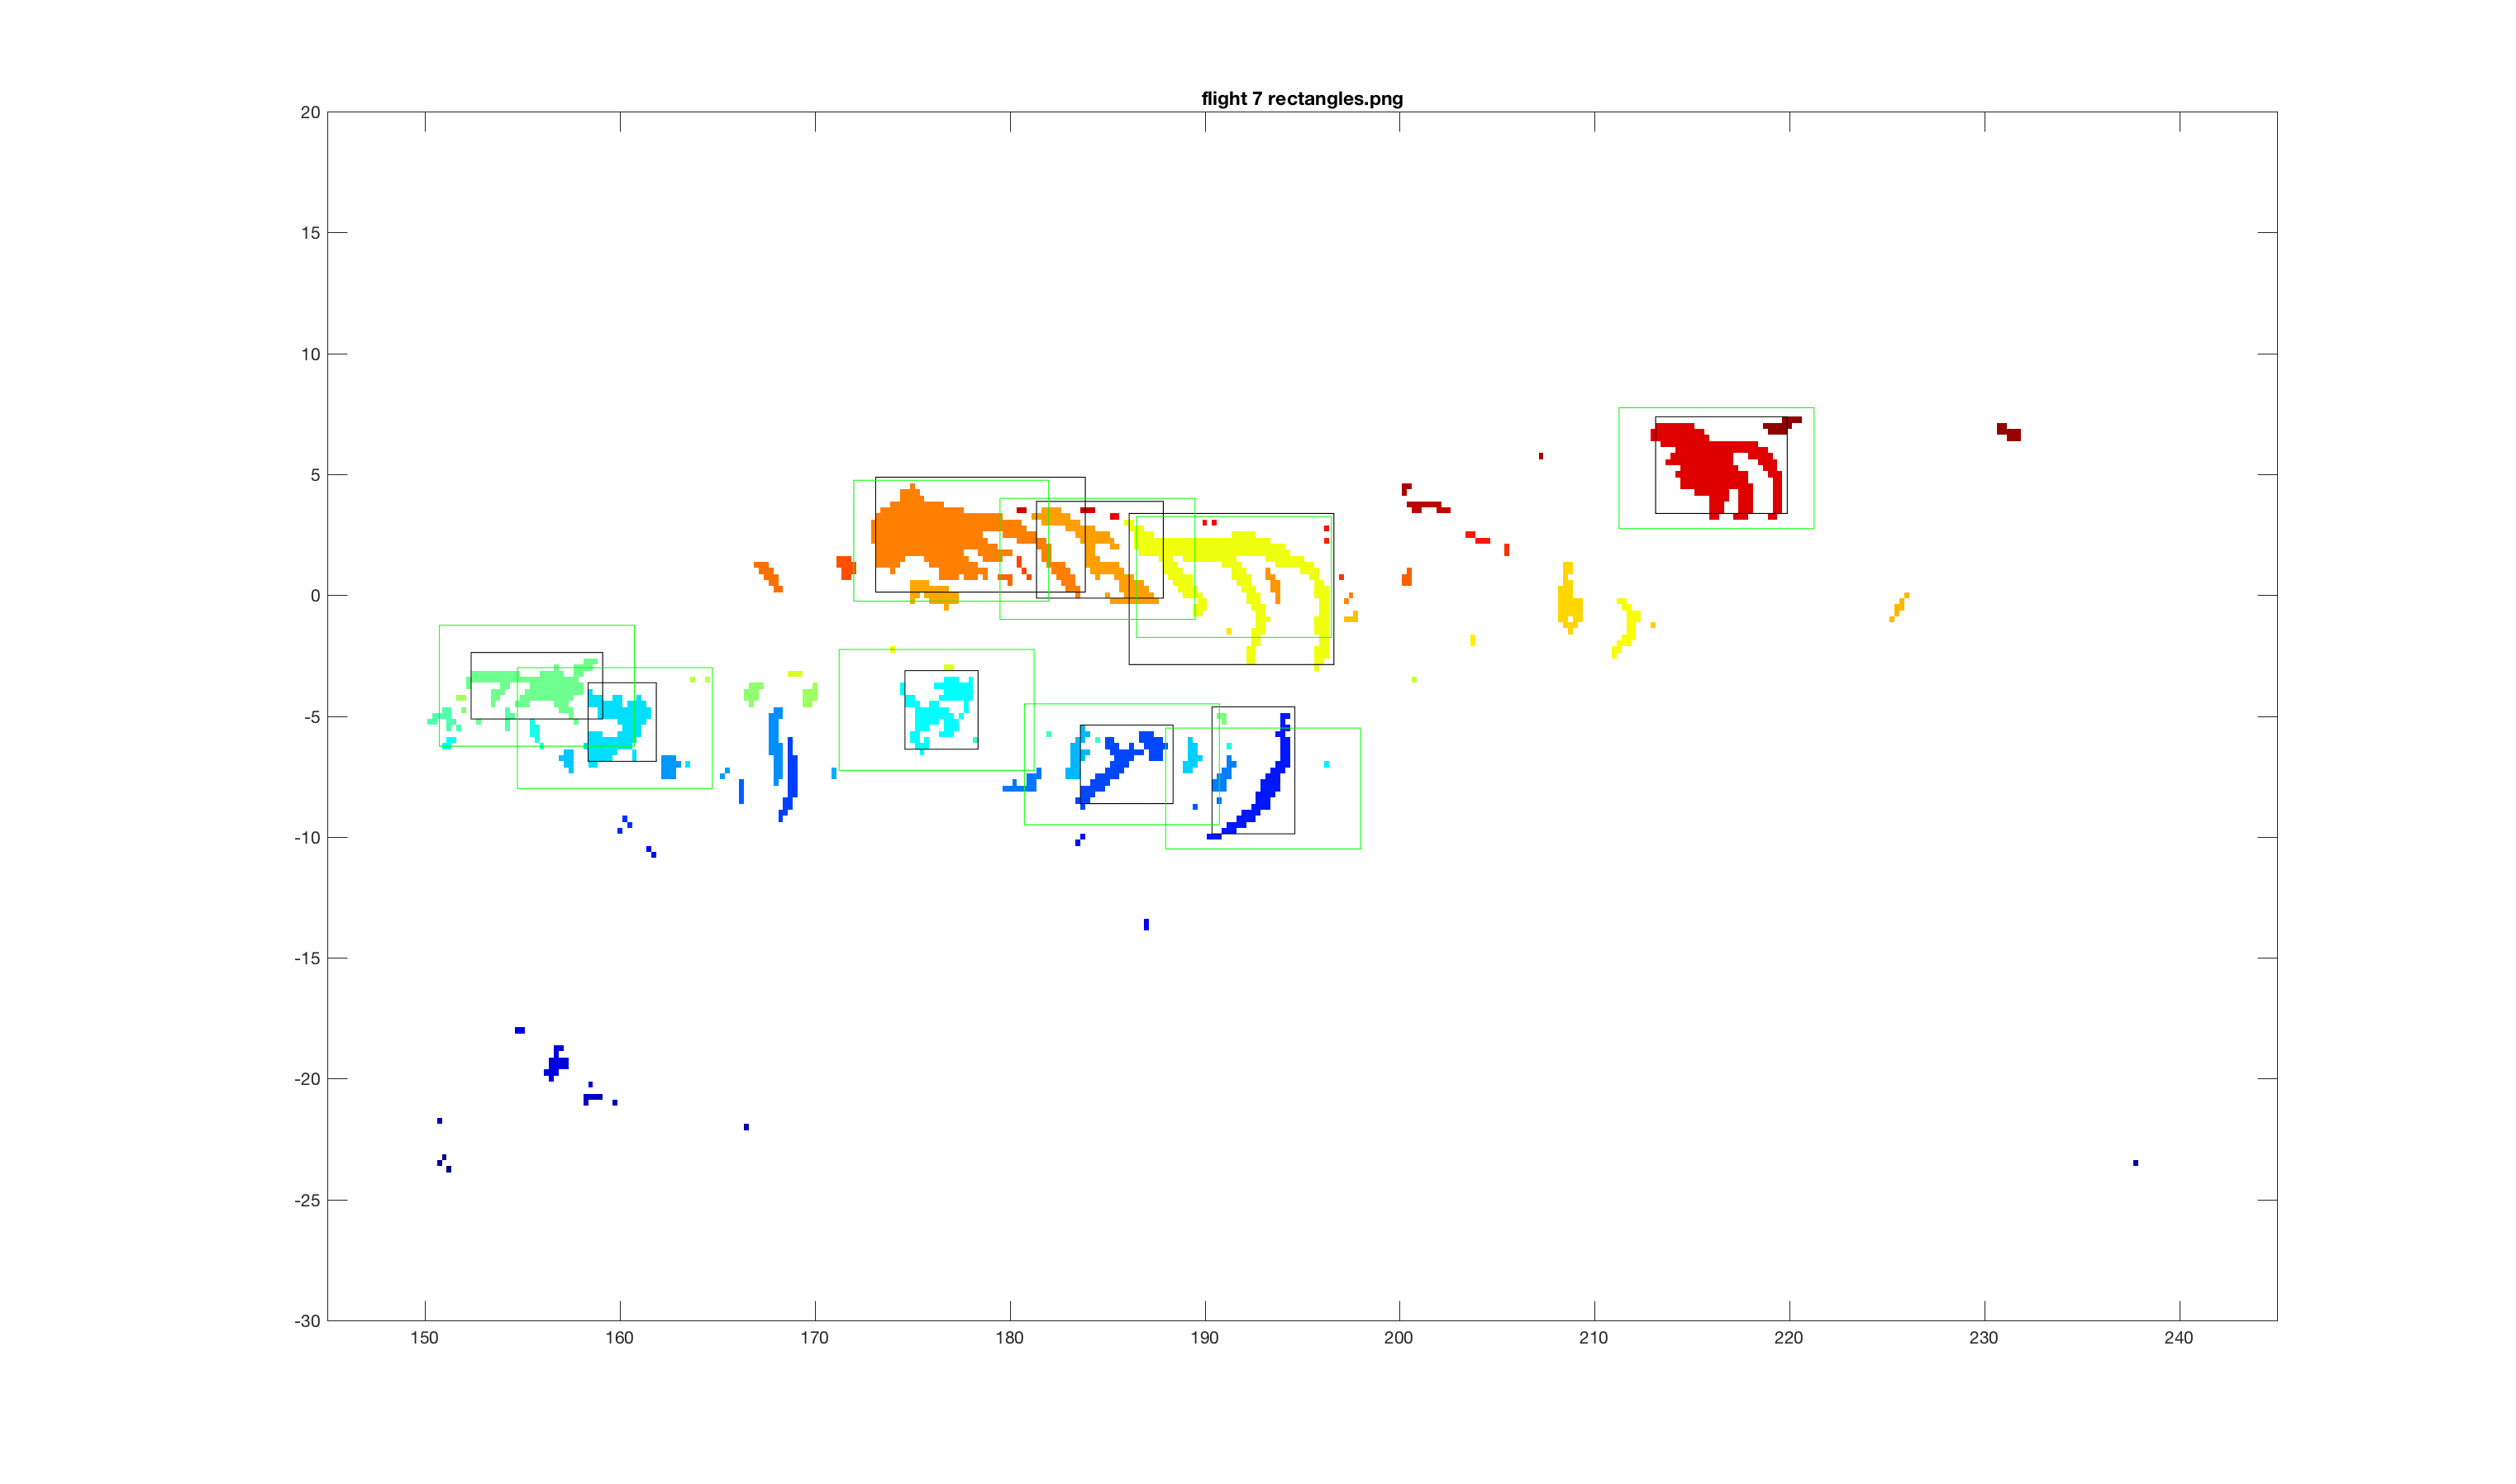
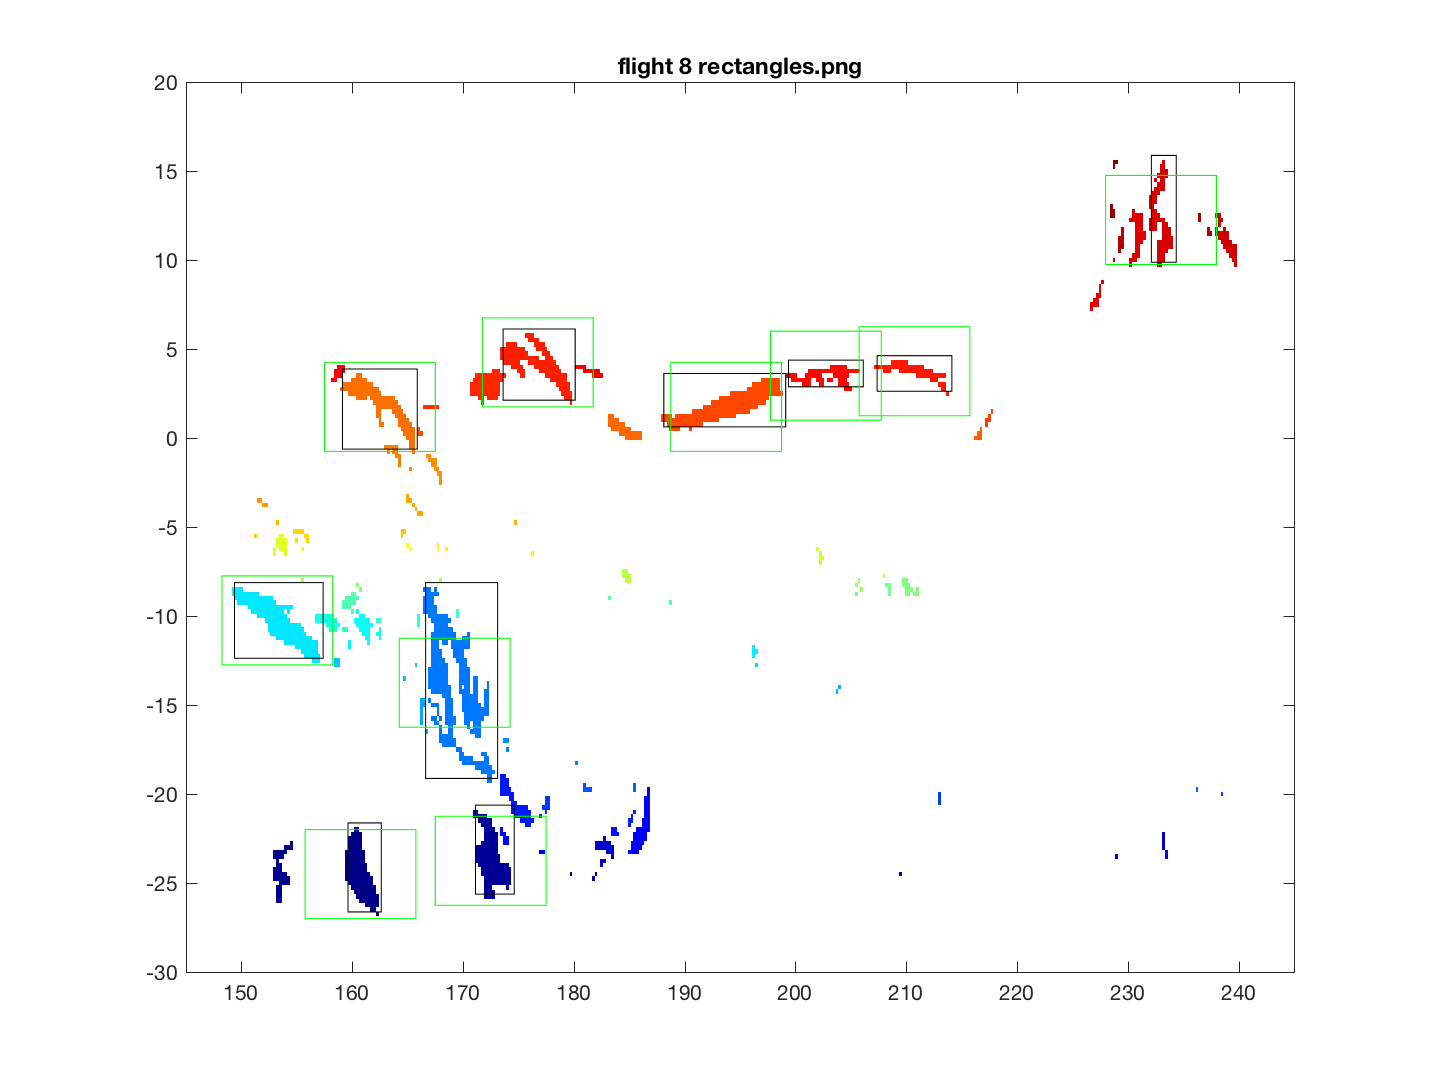

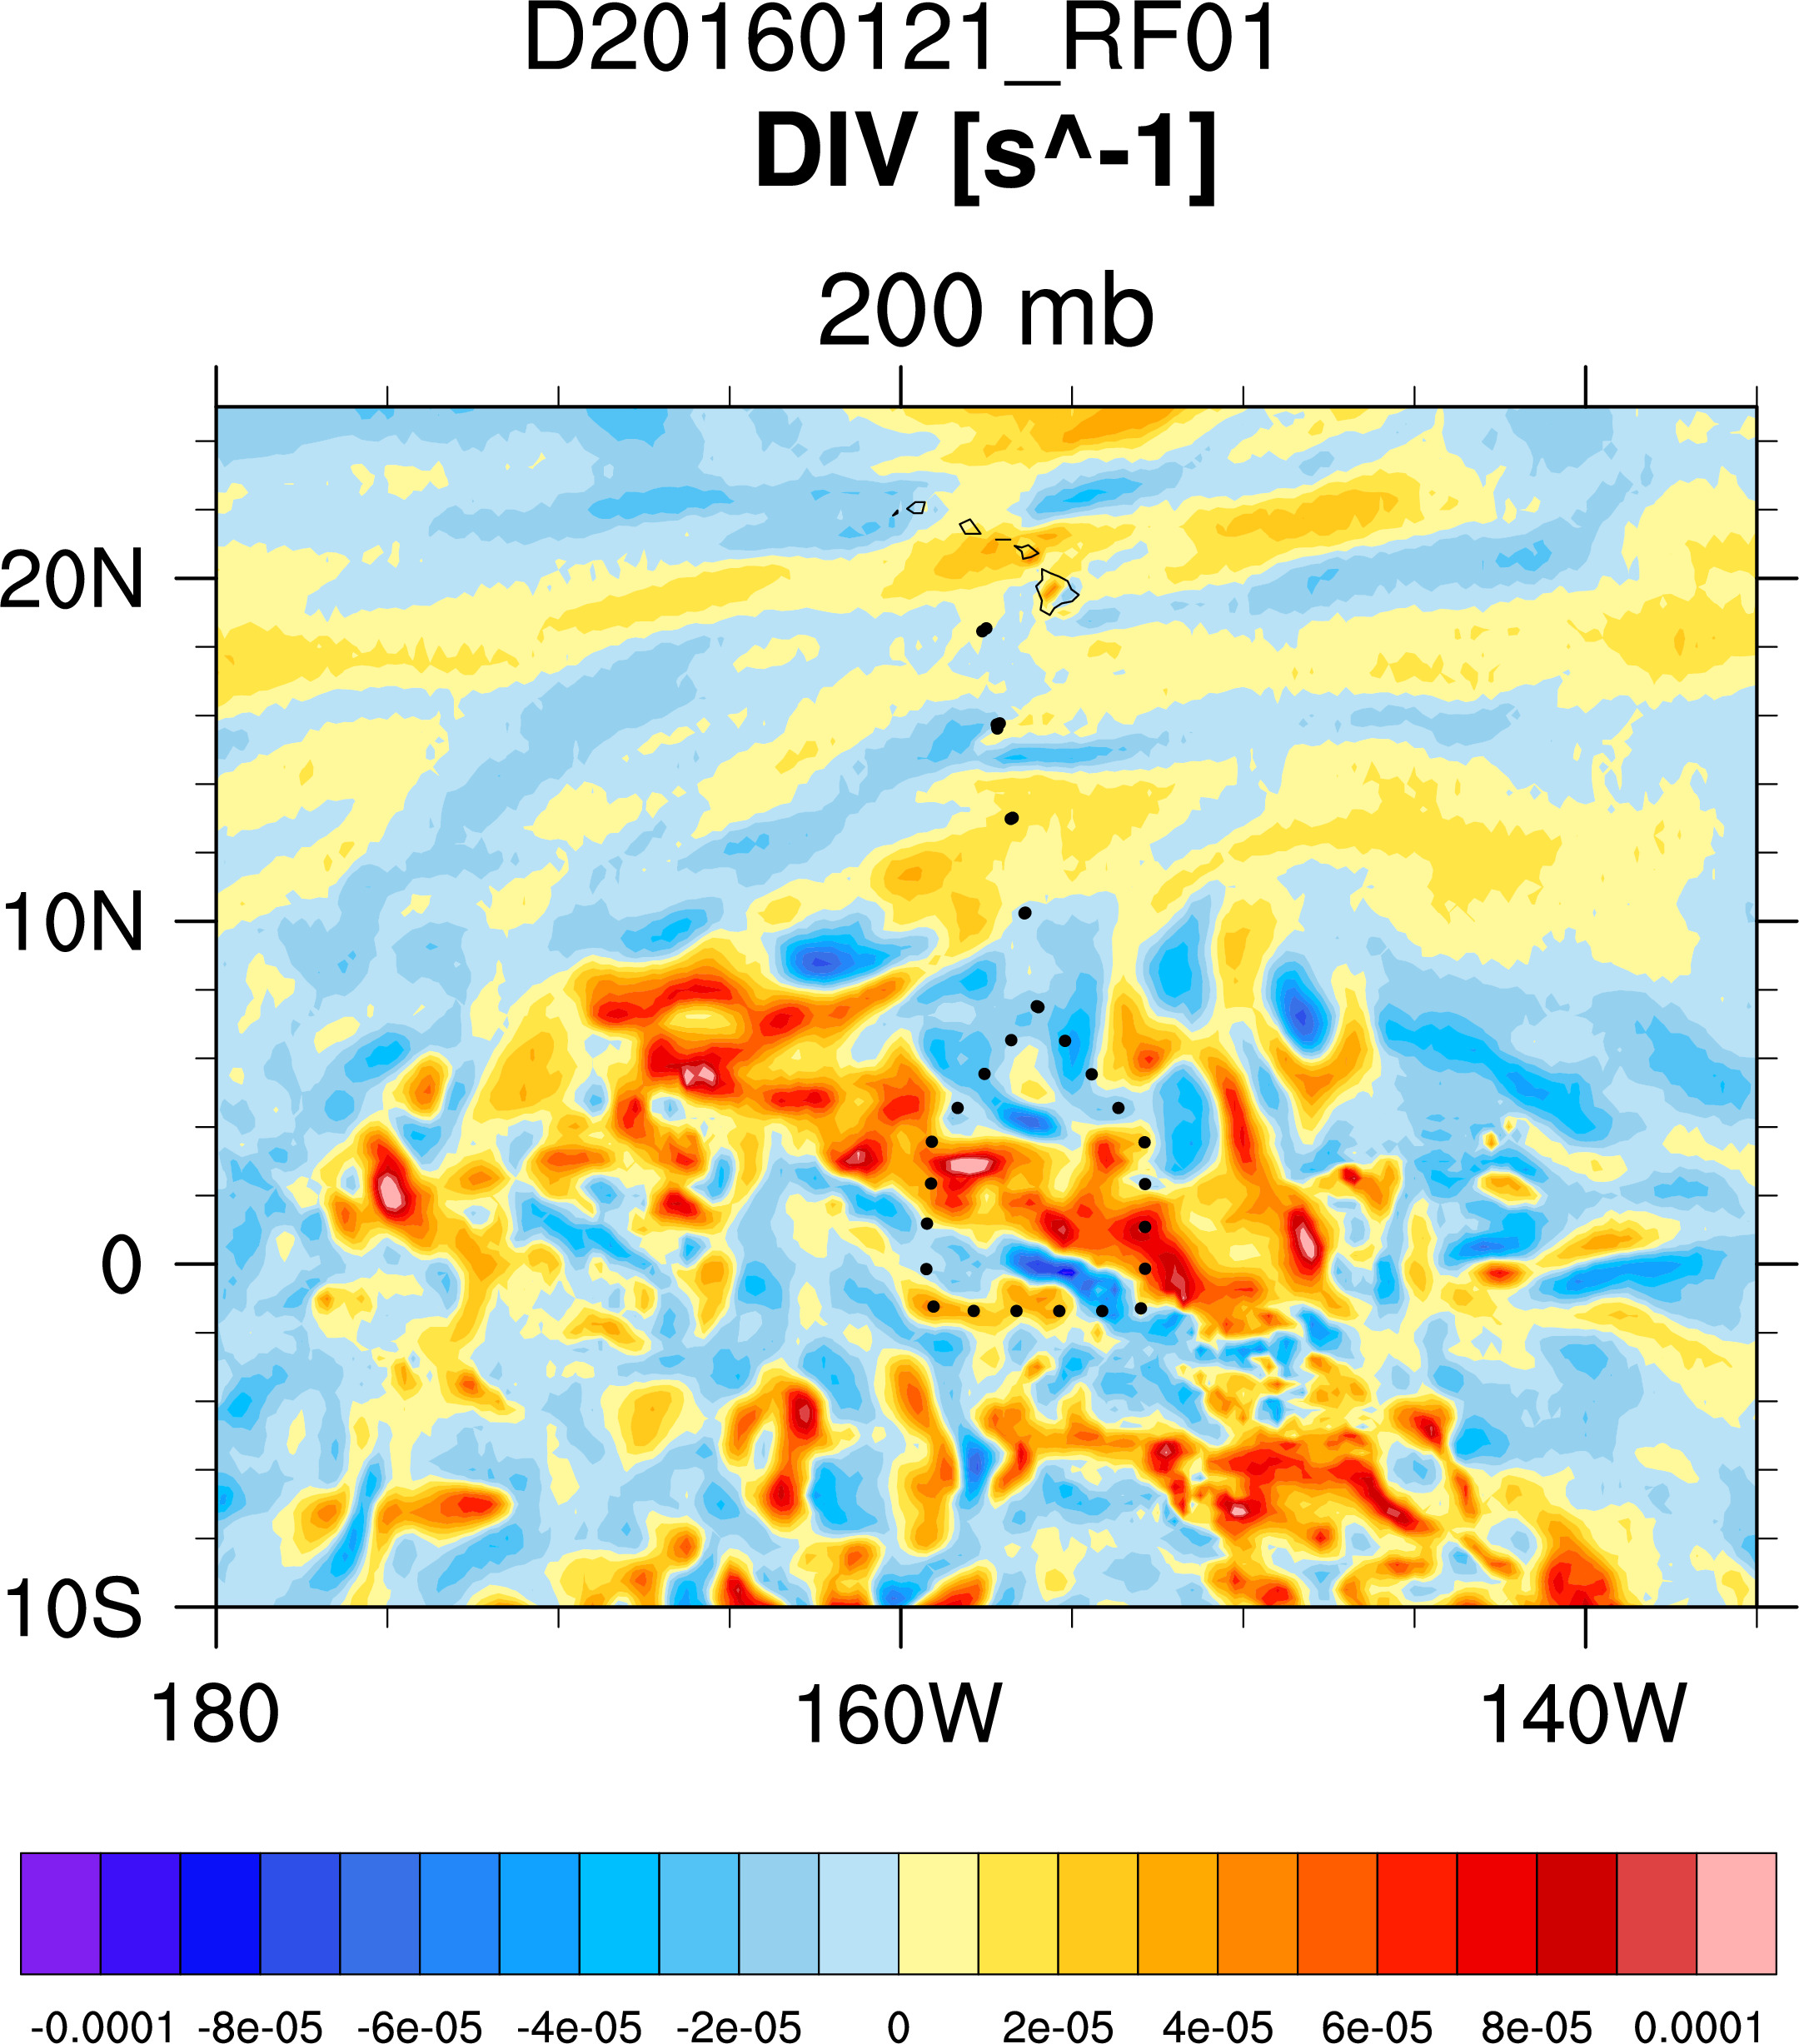
Above rectangle images courtesy Joe Barsugli.

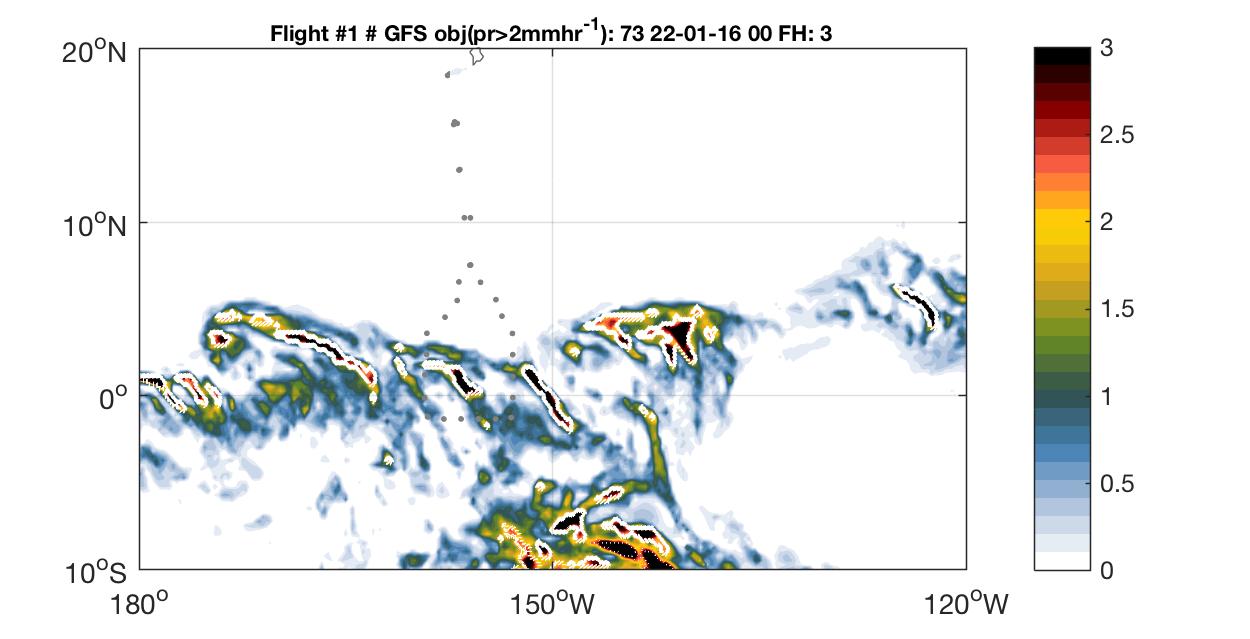
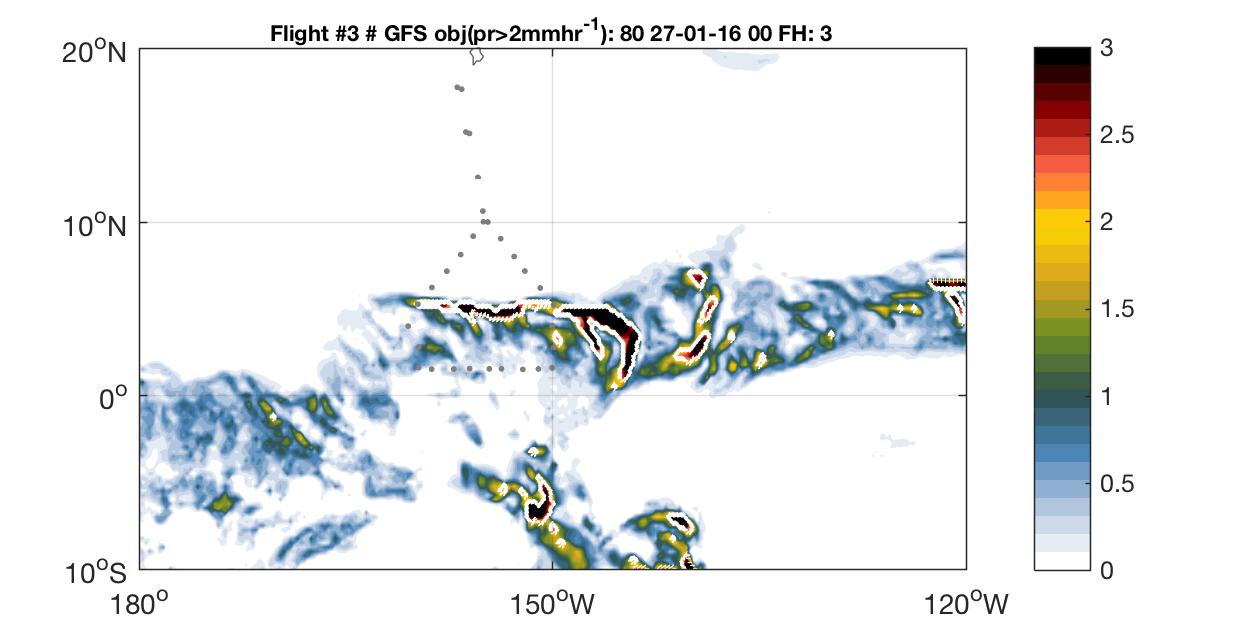
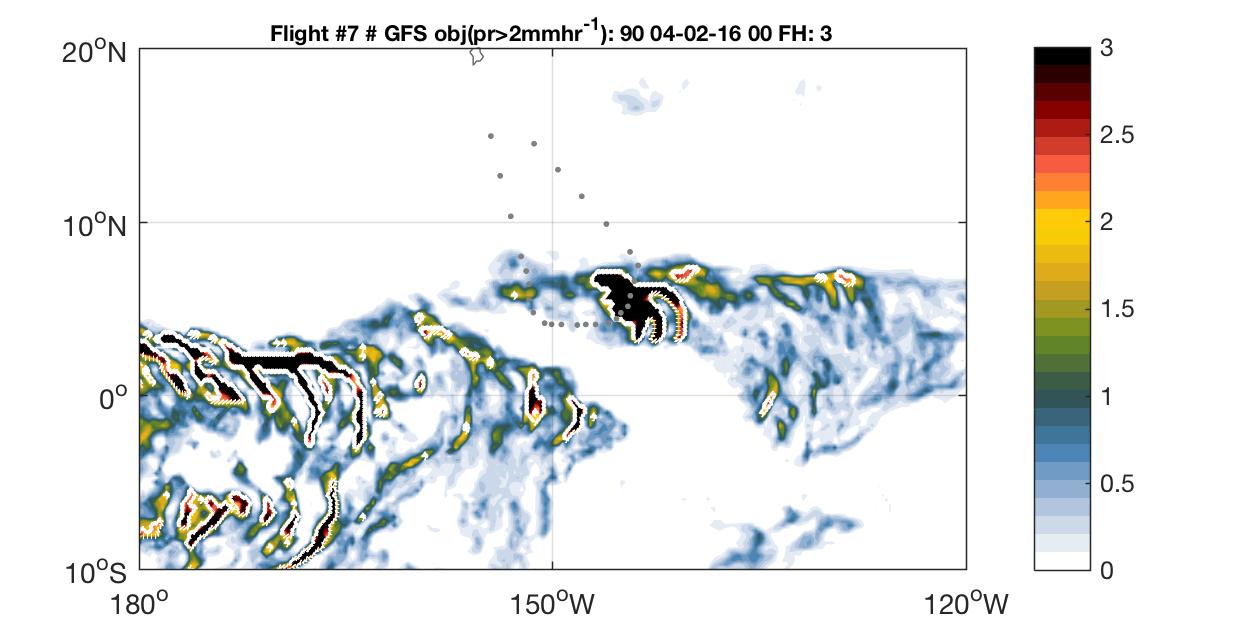
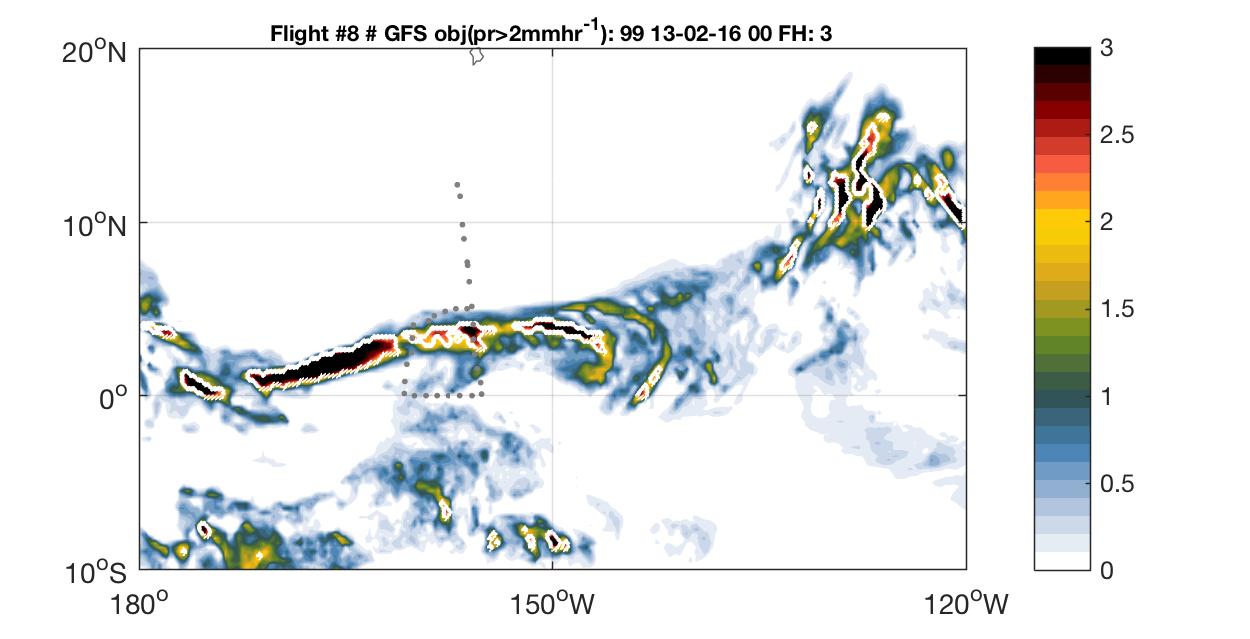
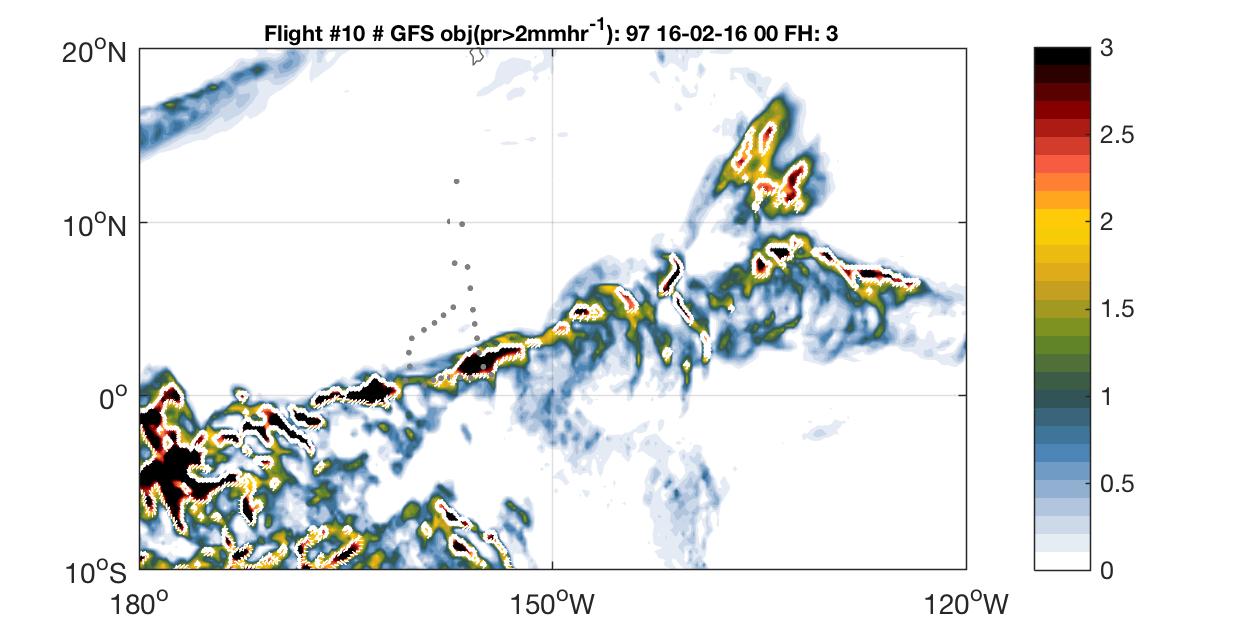
Above rain images courtesy Juliana Dias.
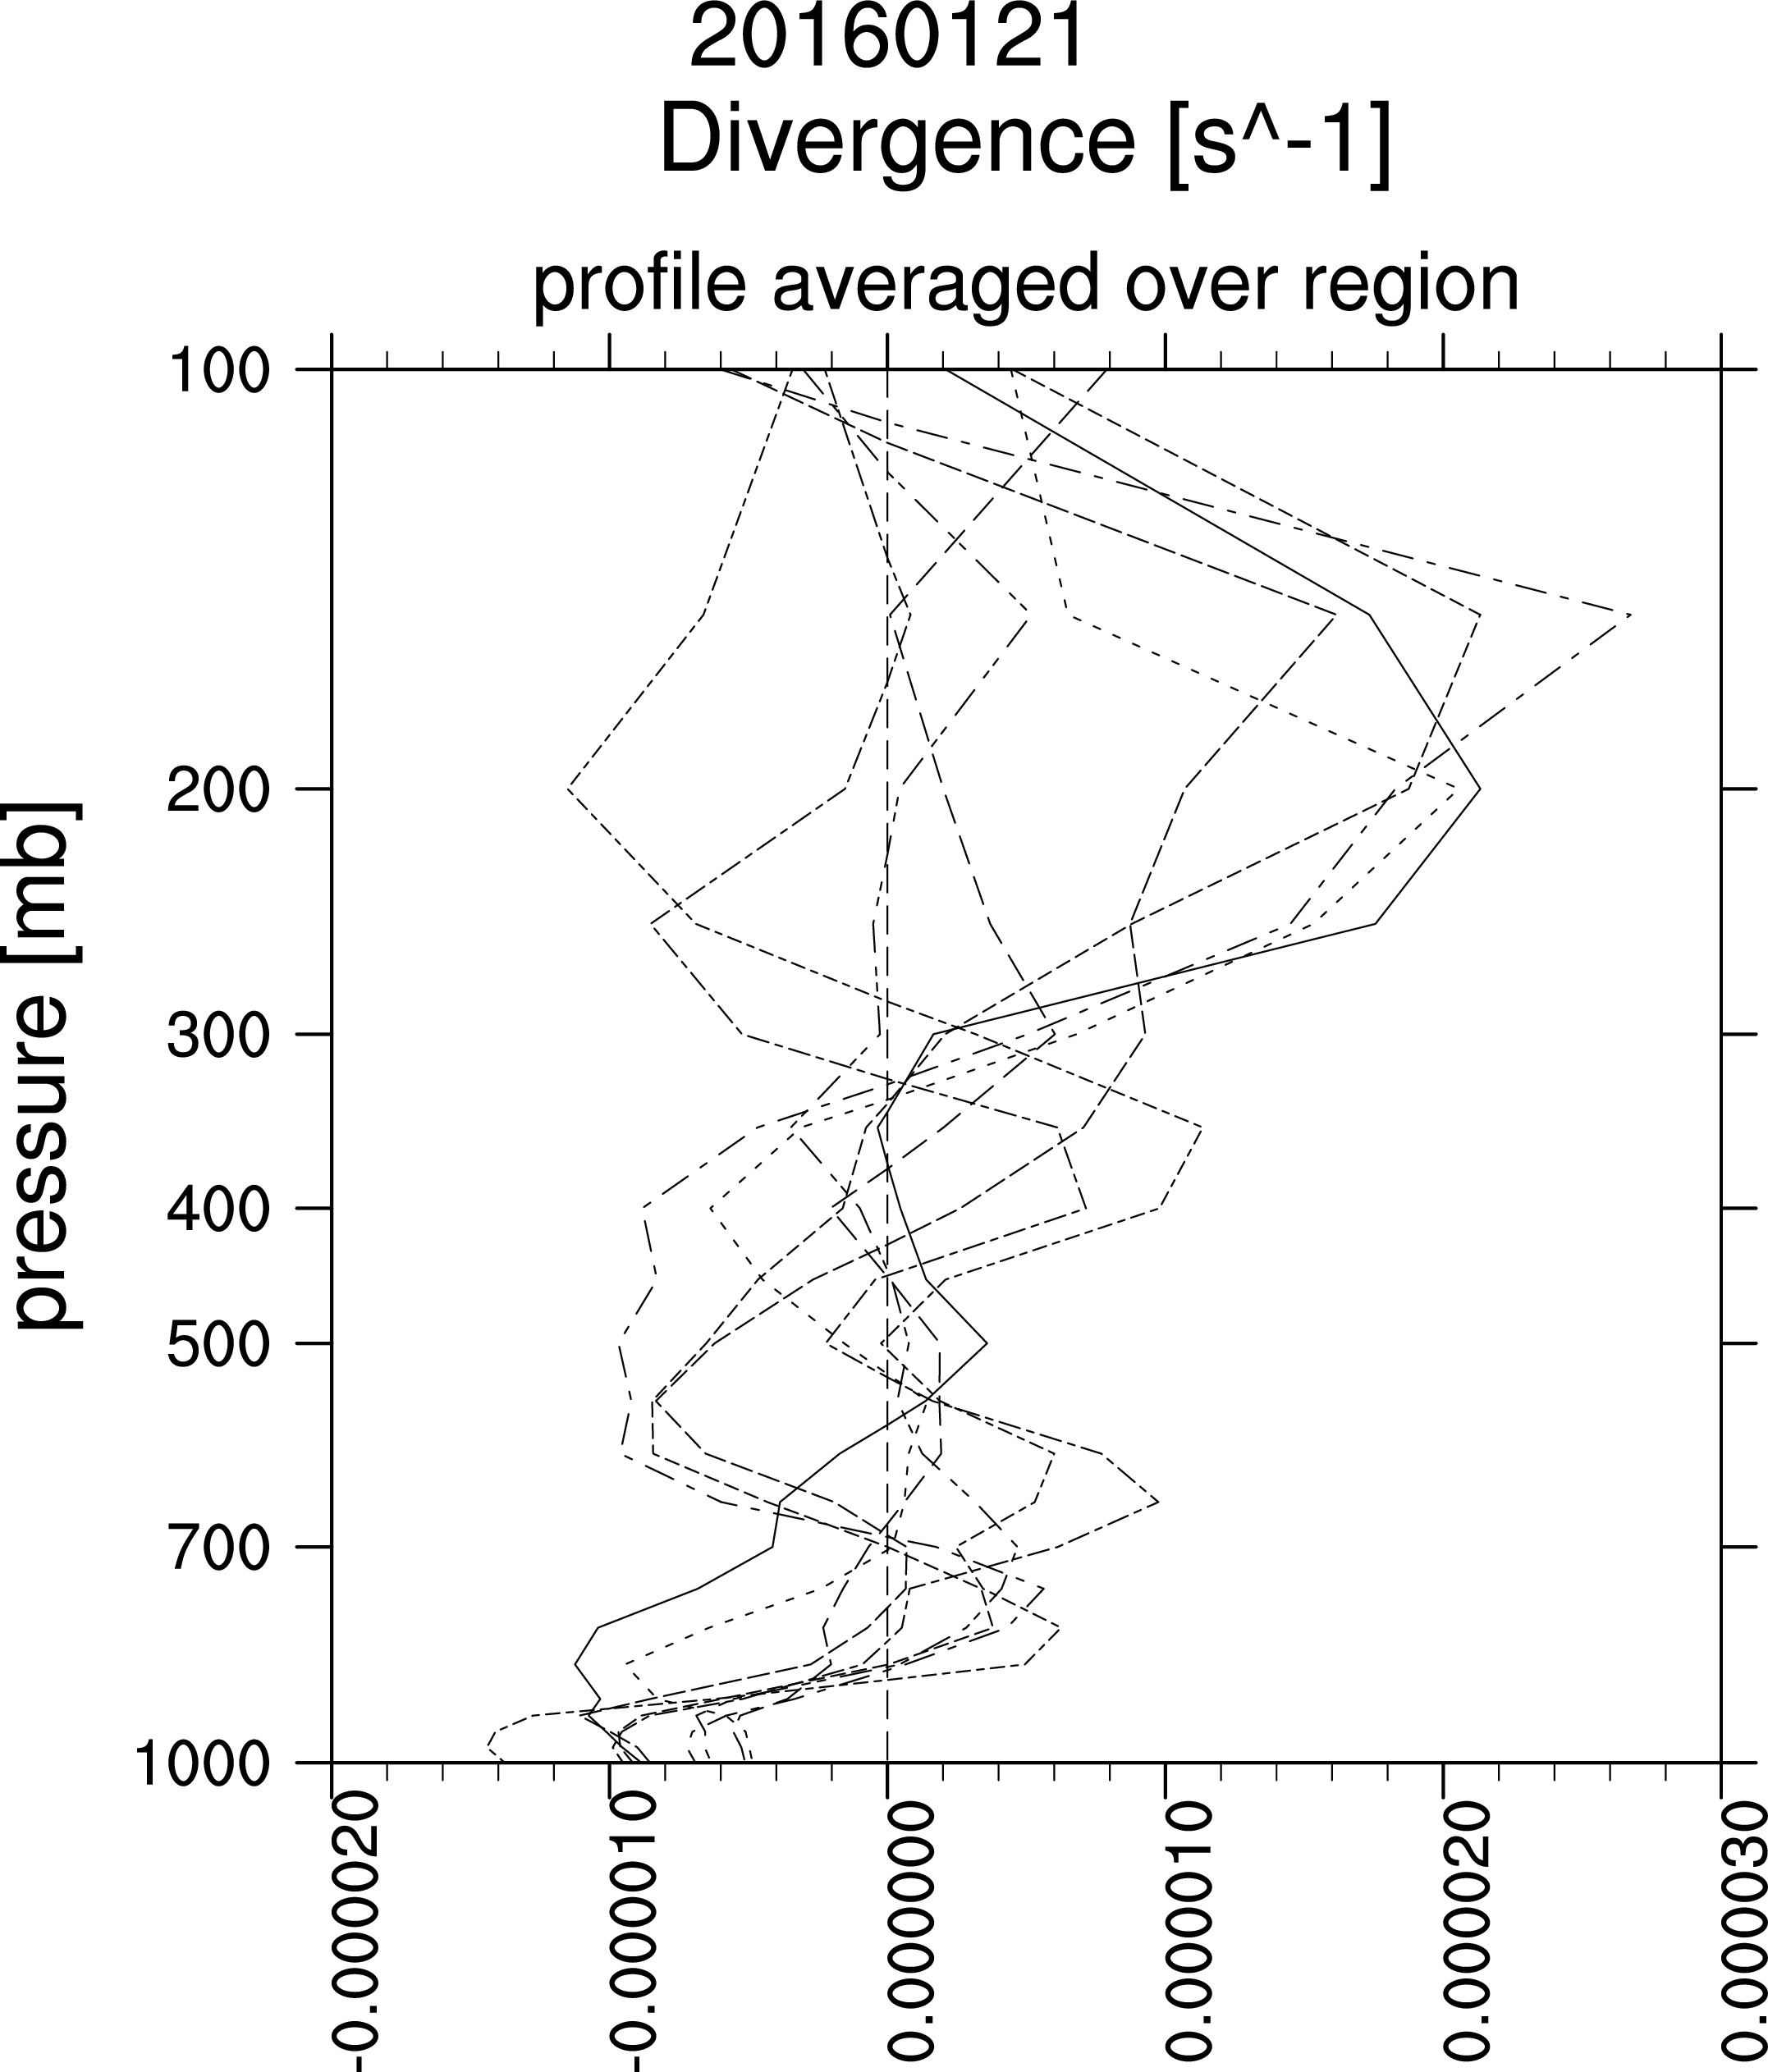
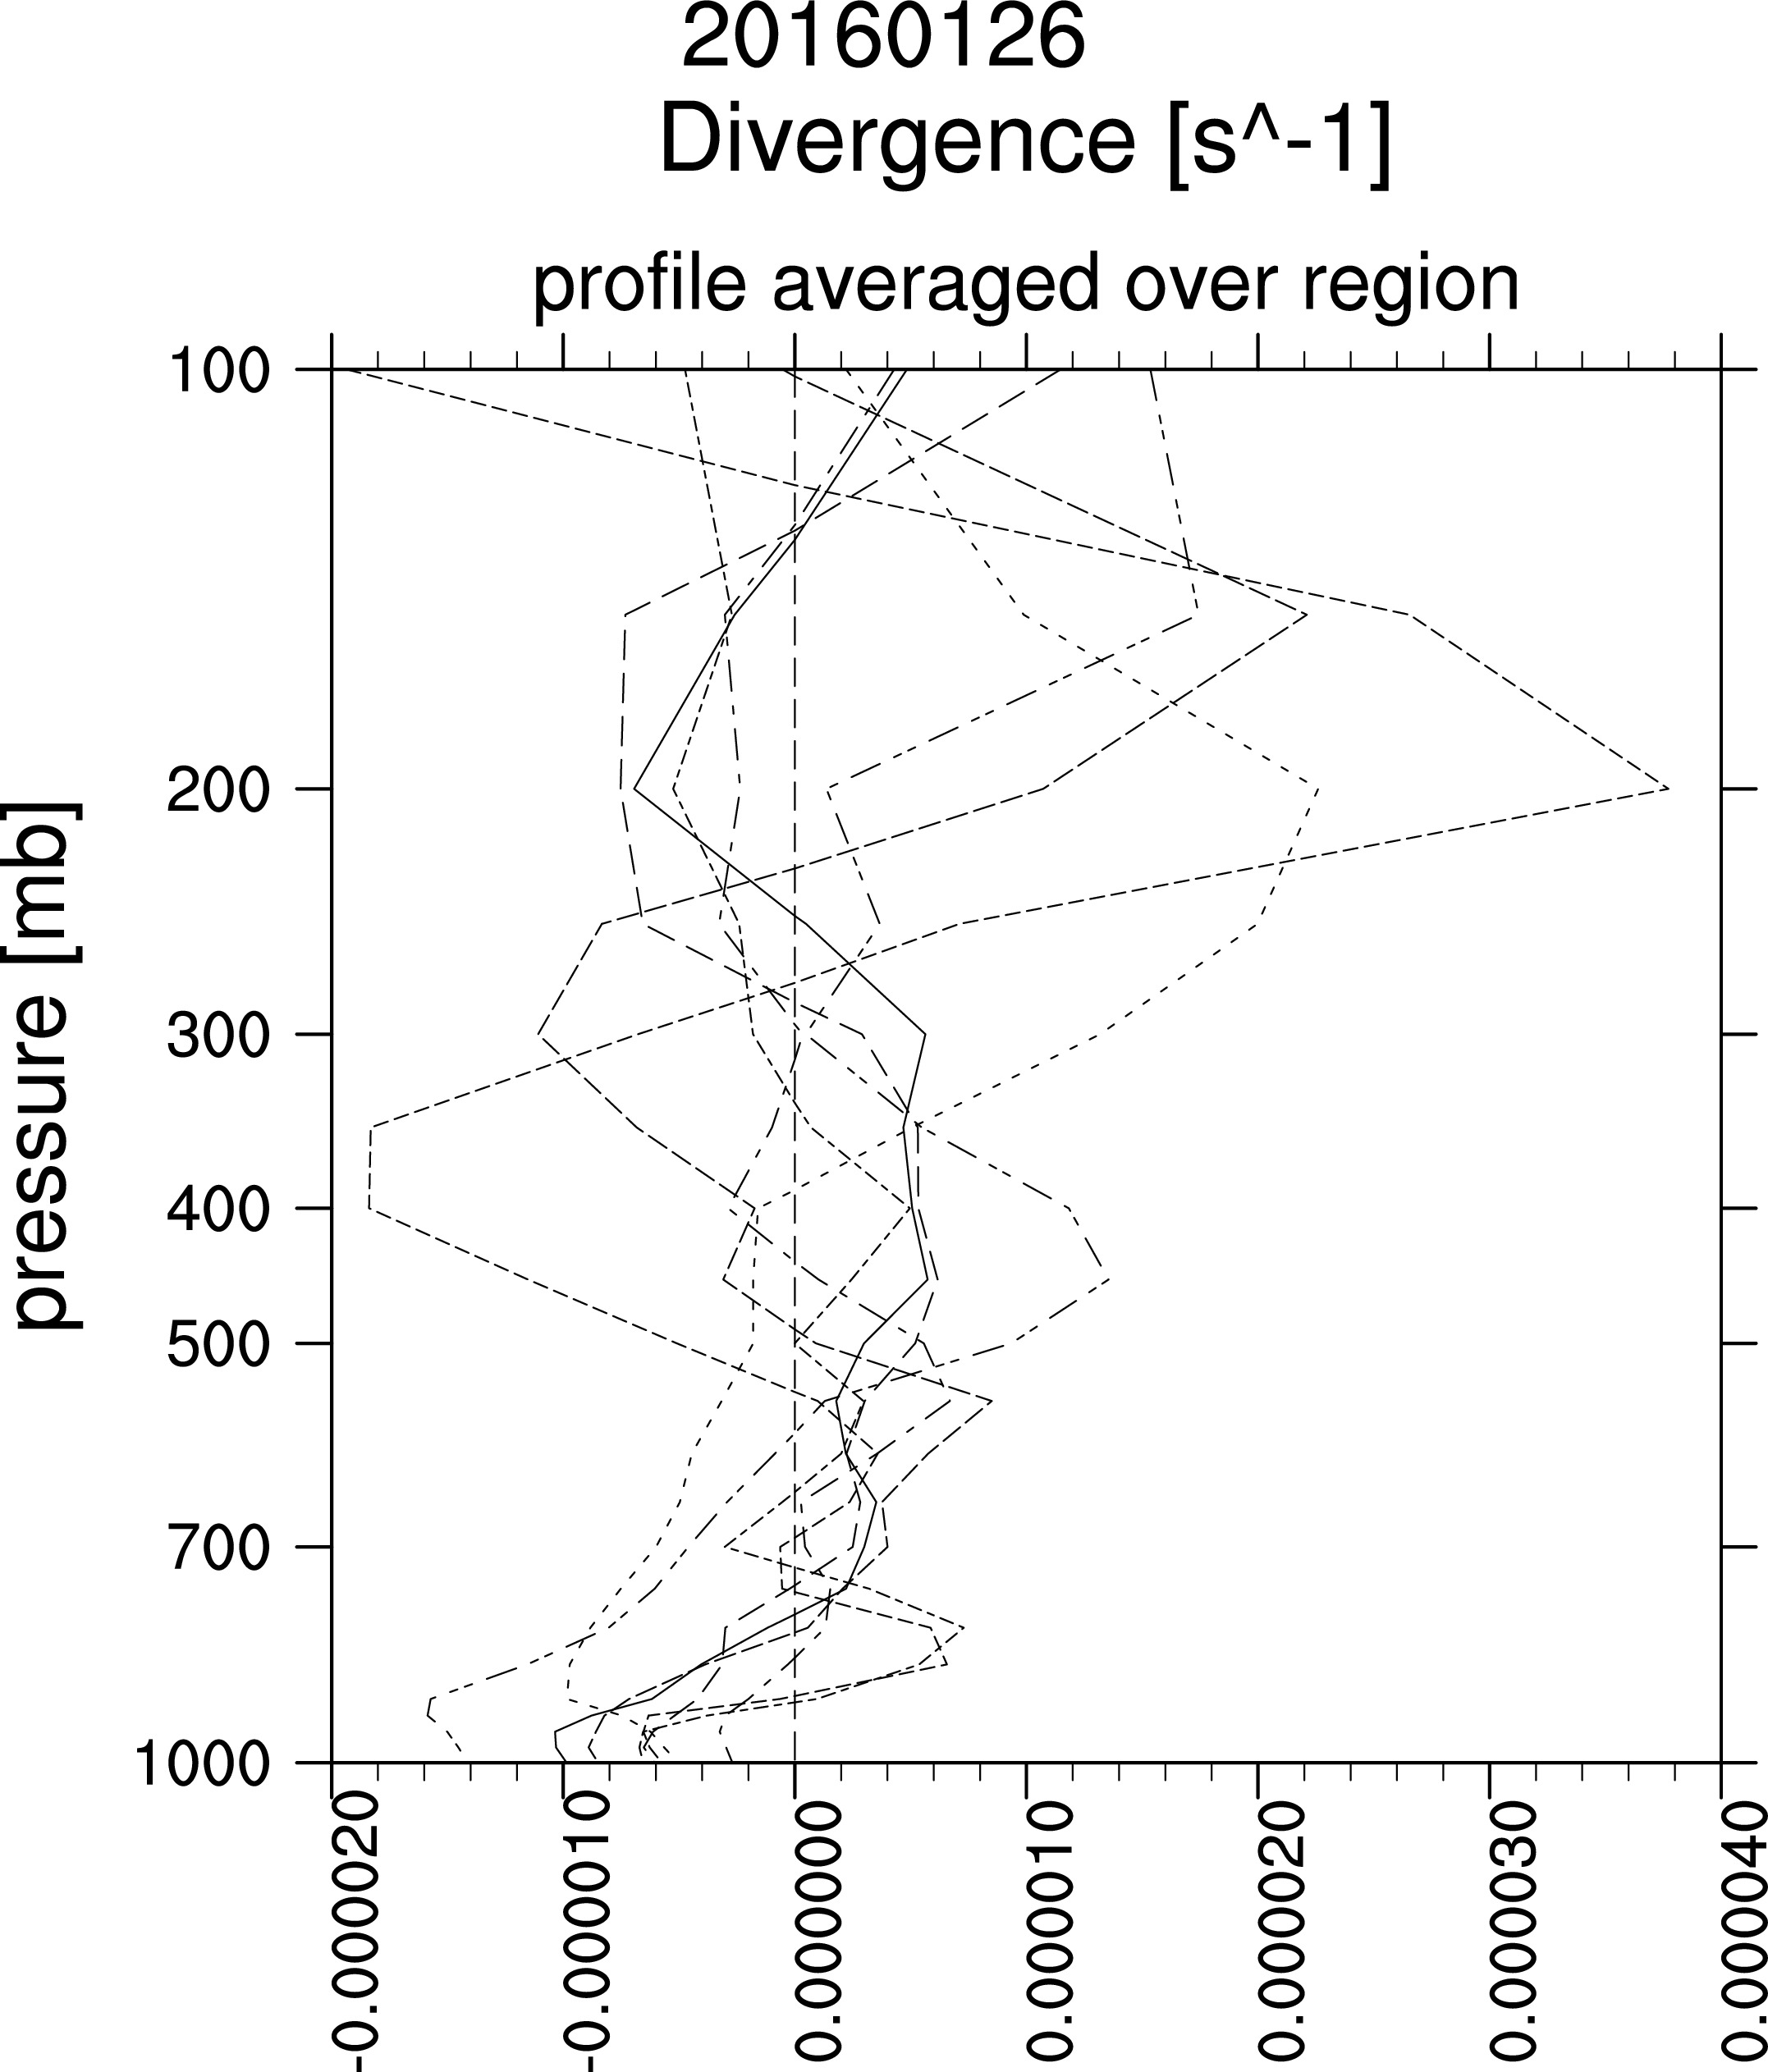
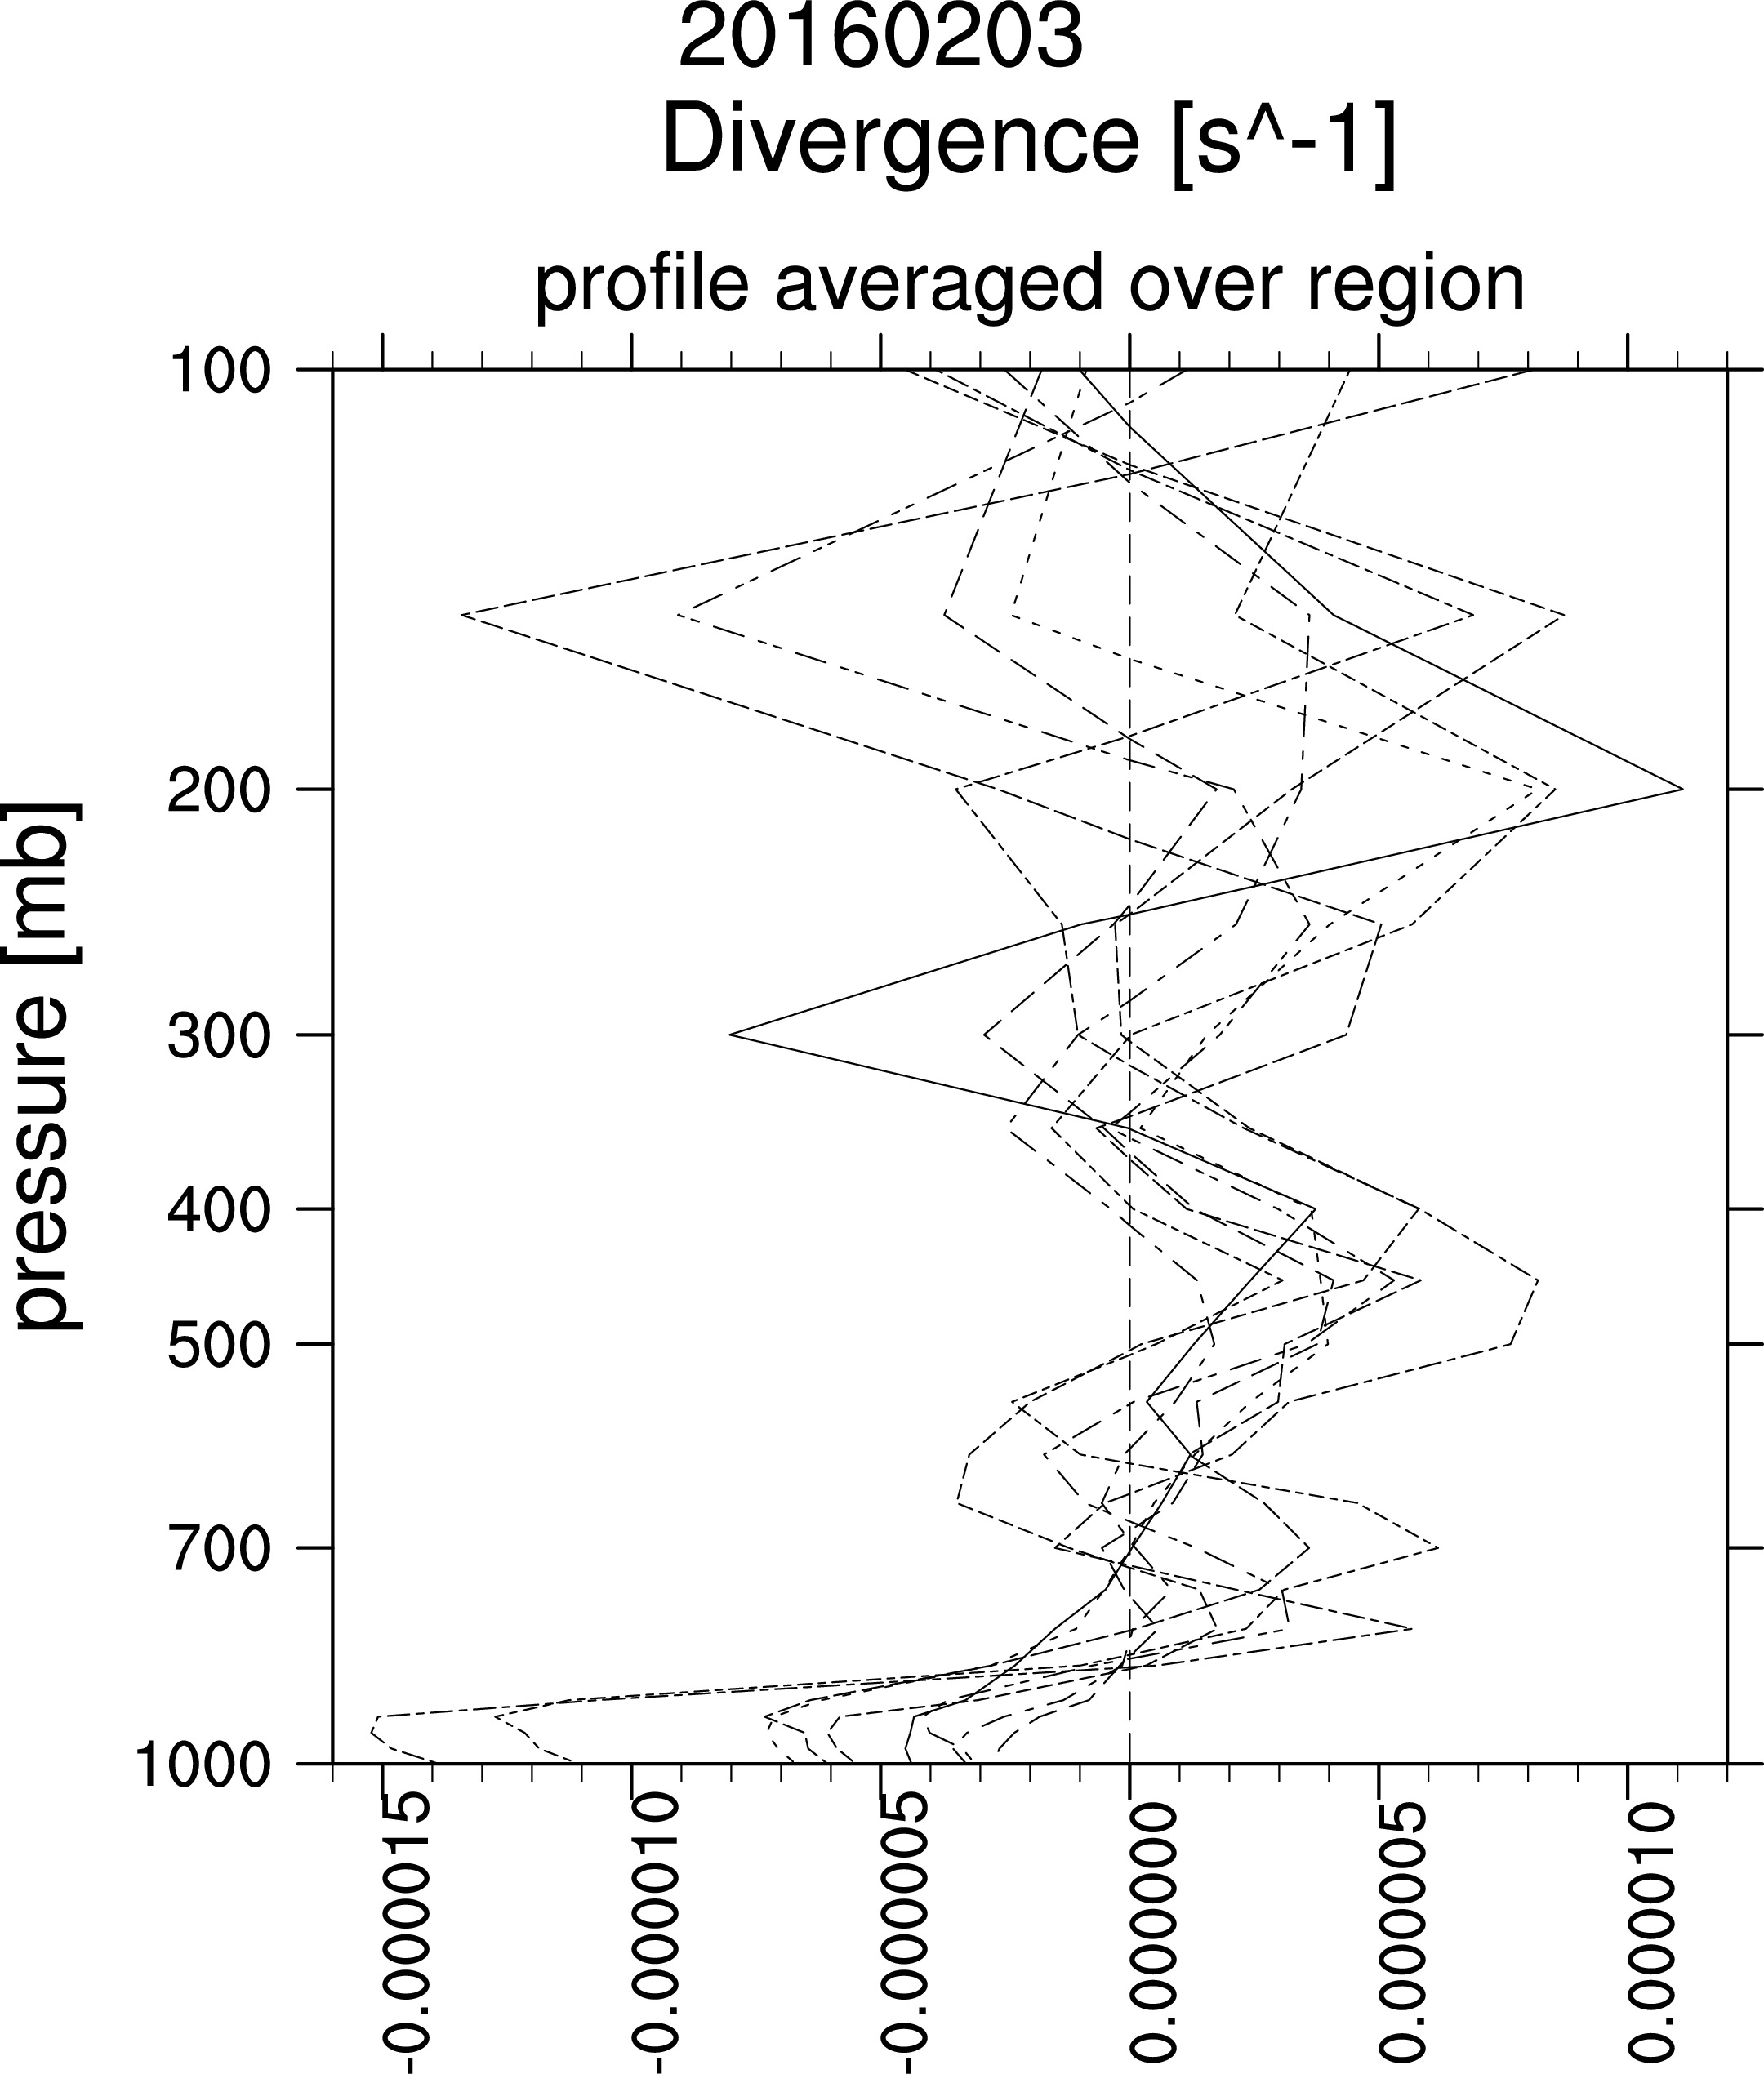
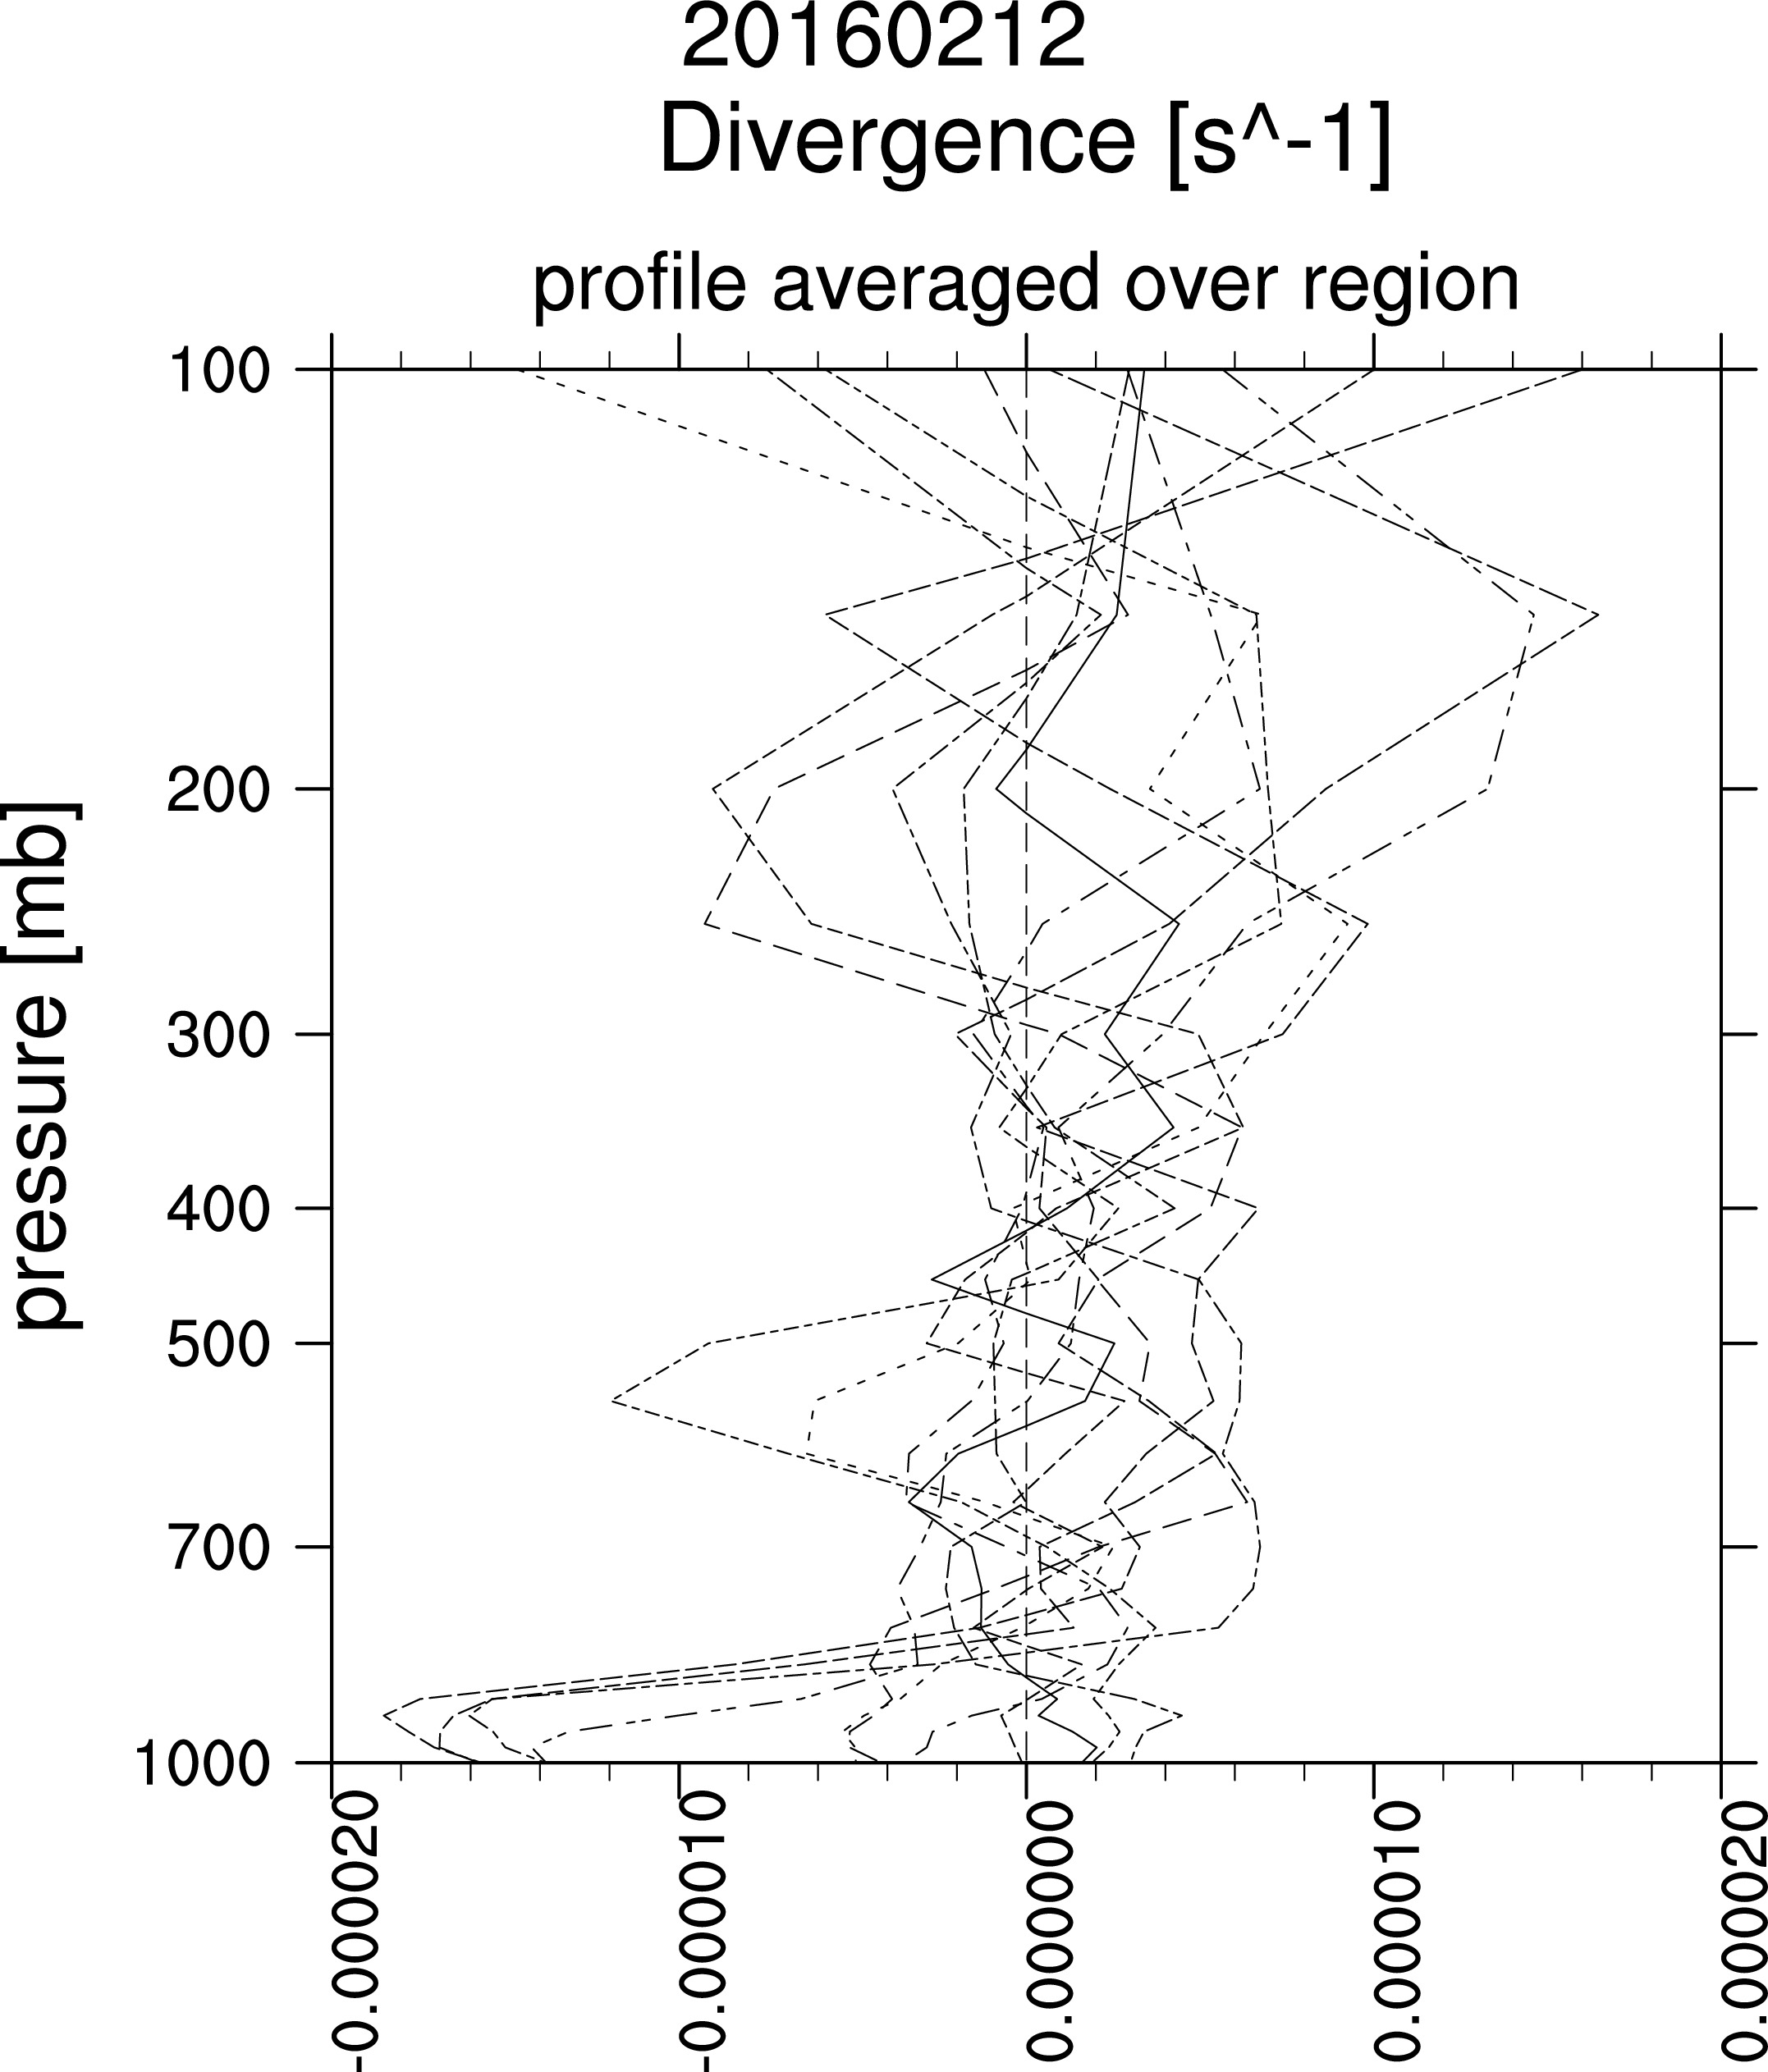
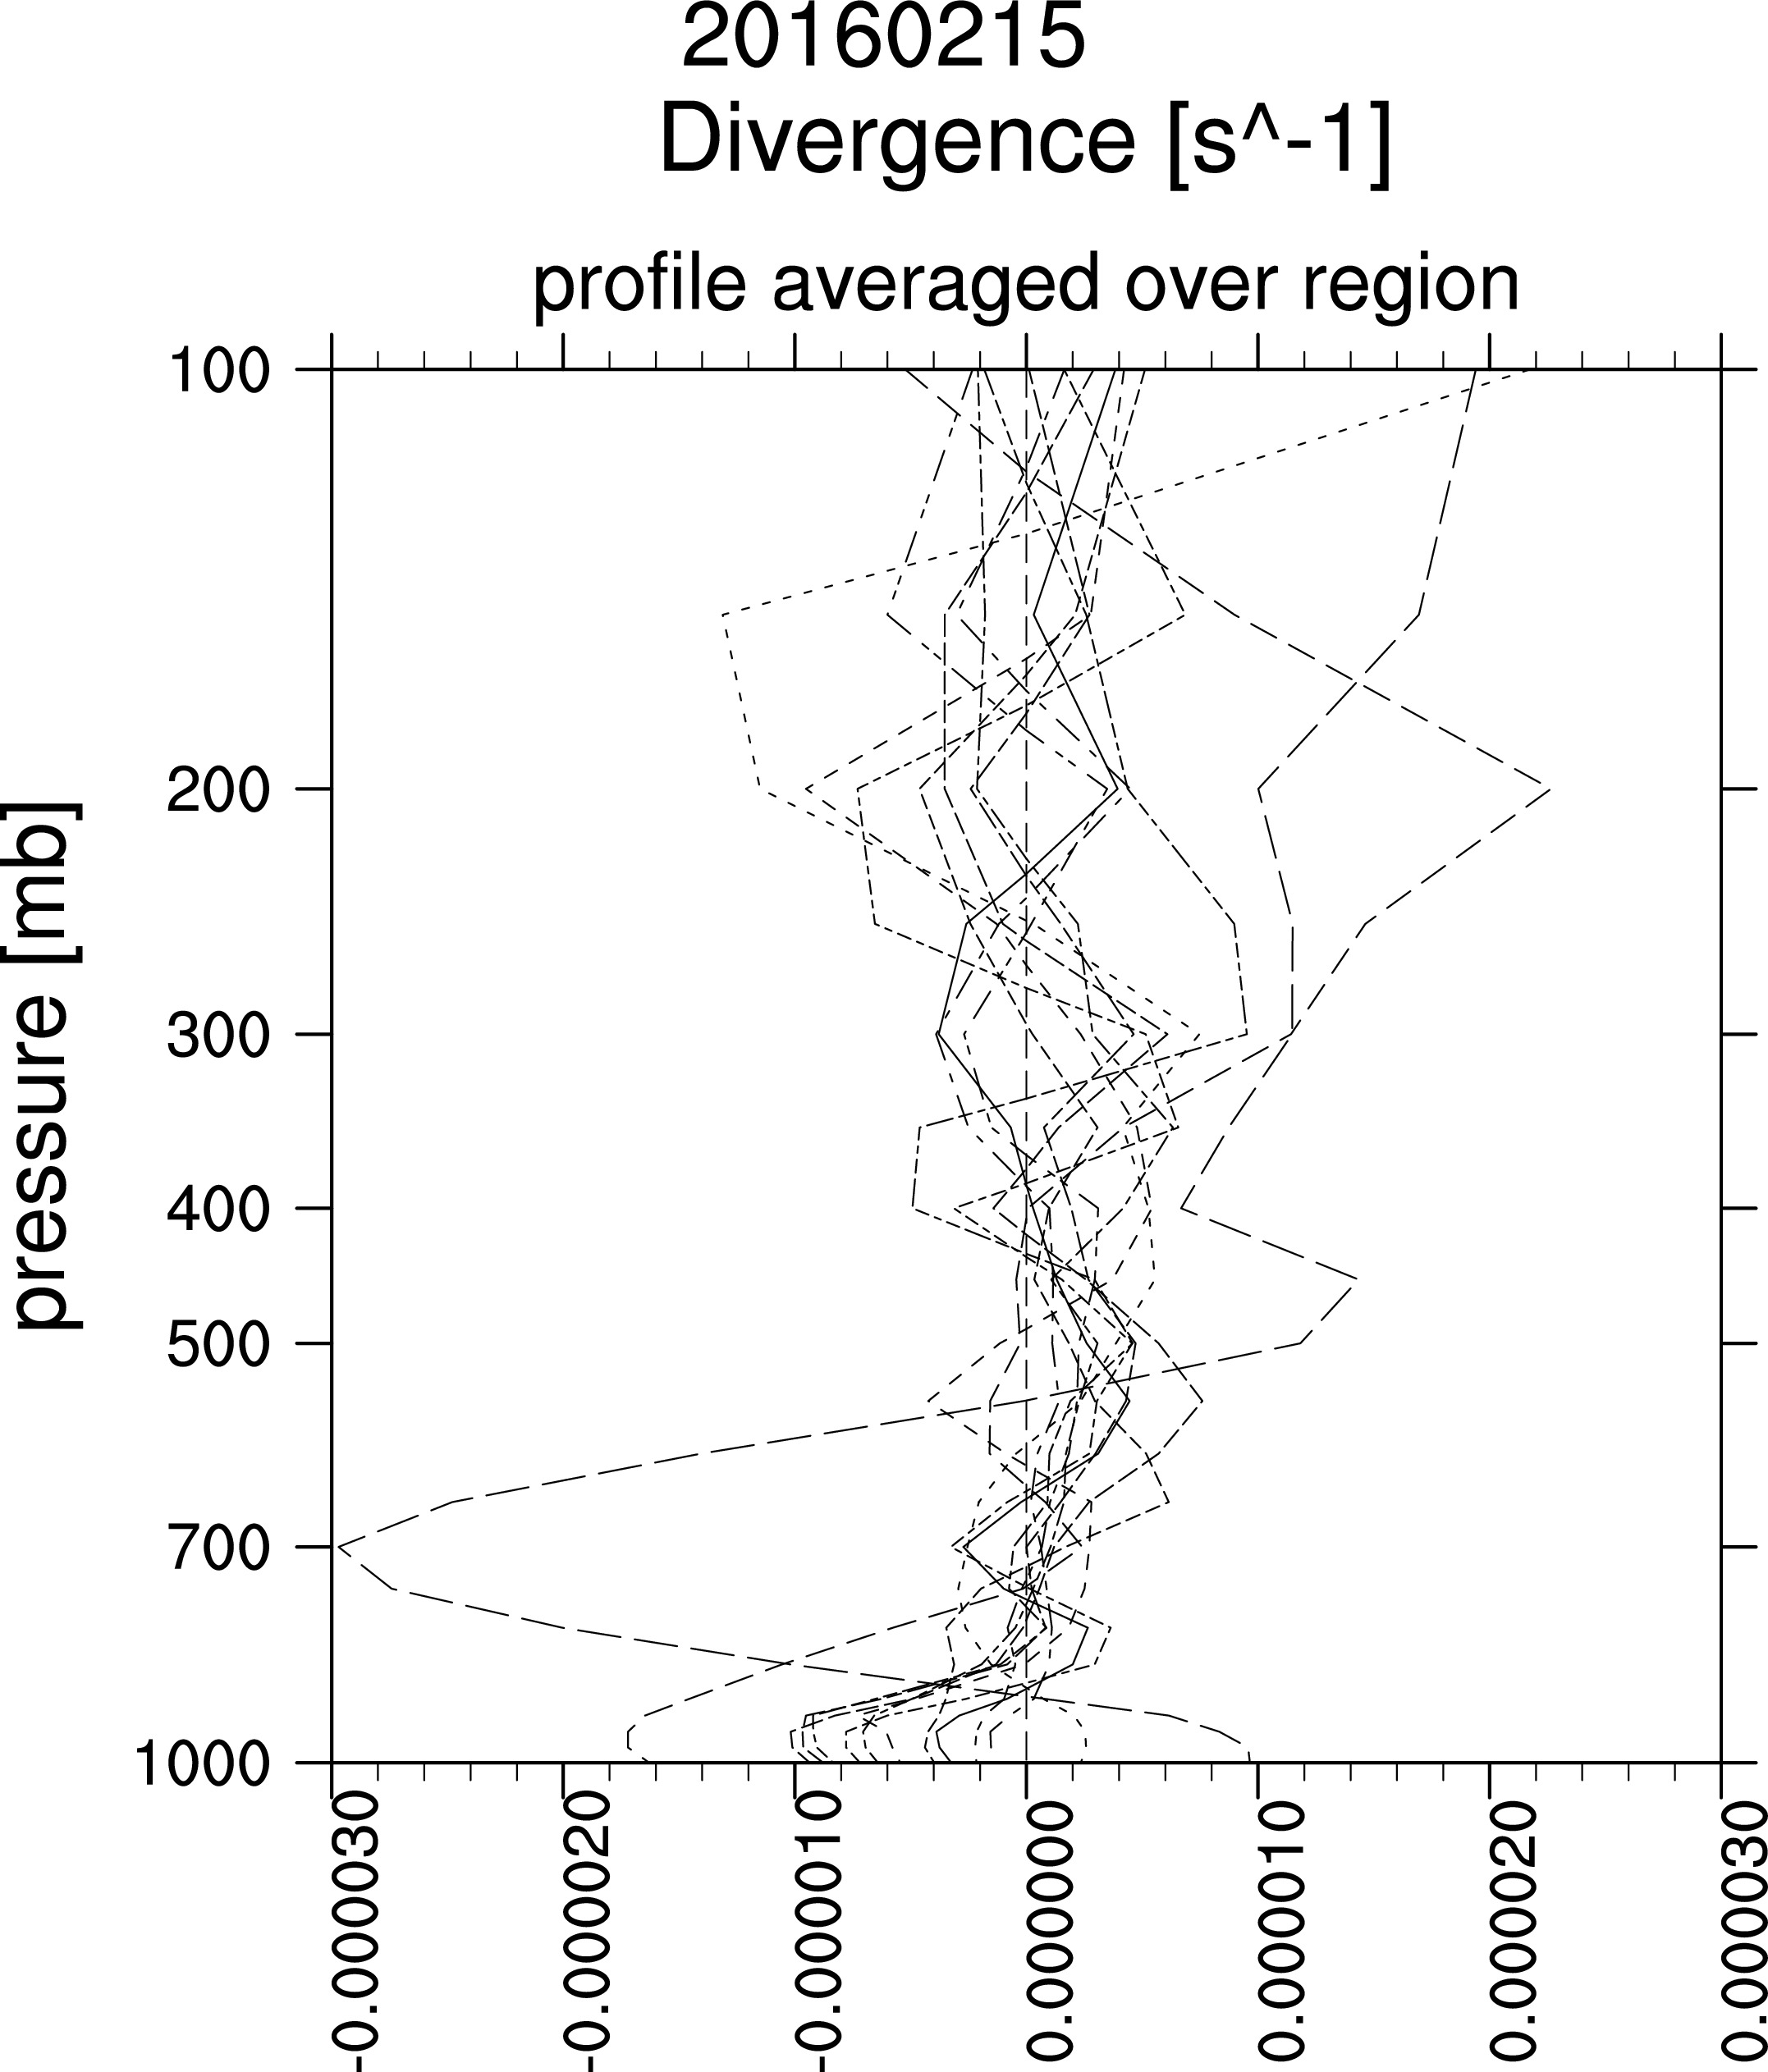
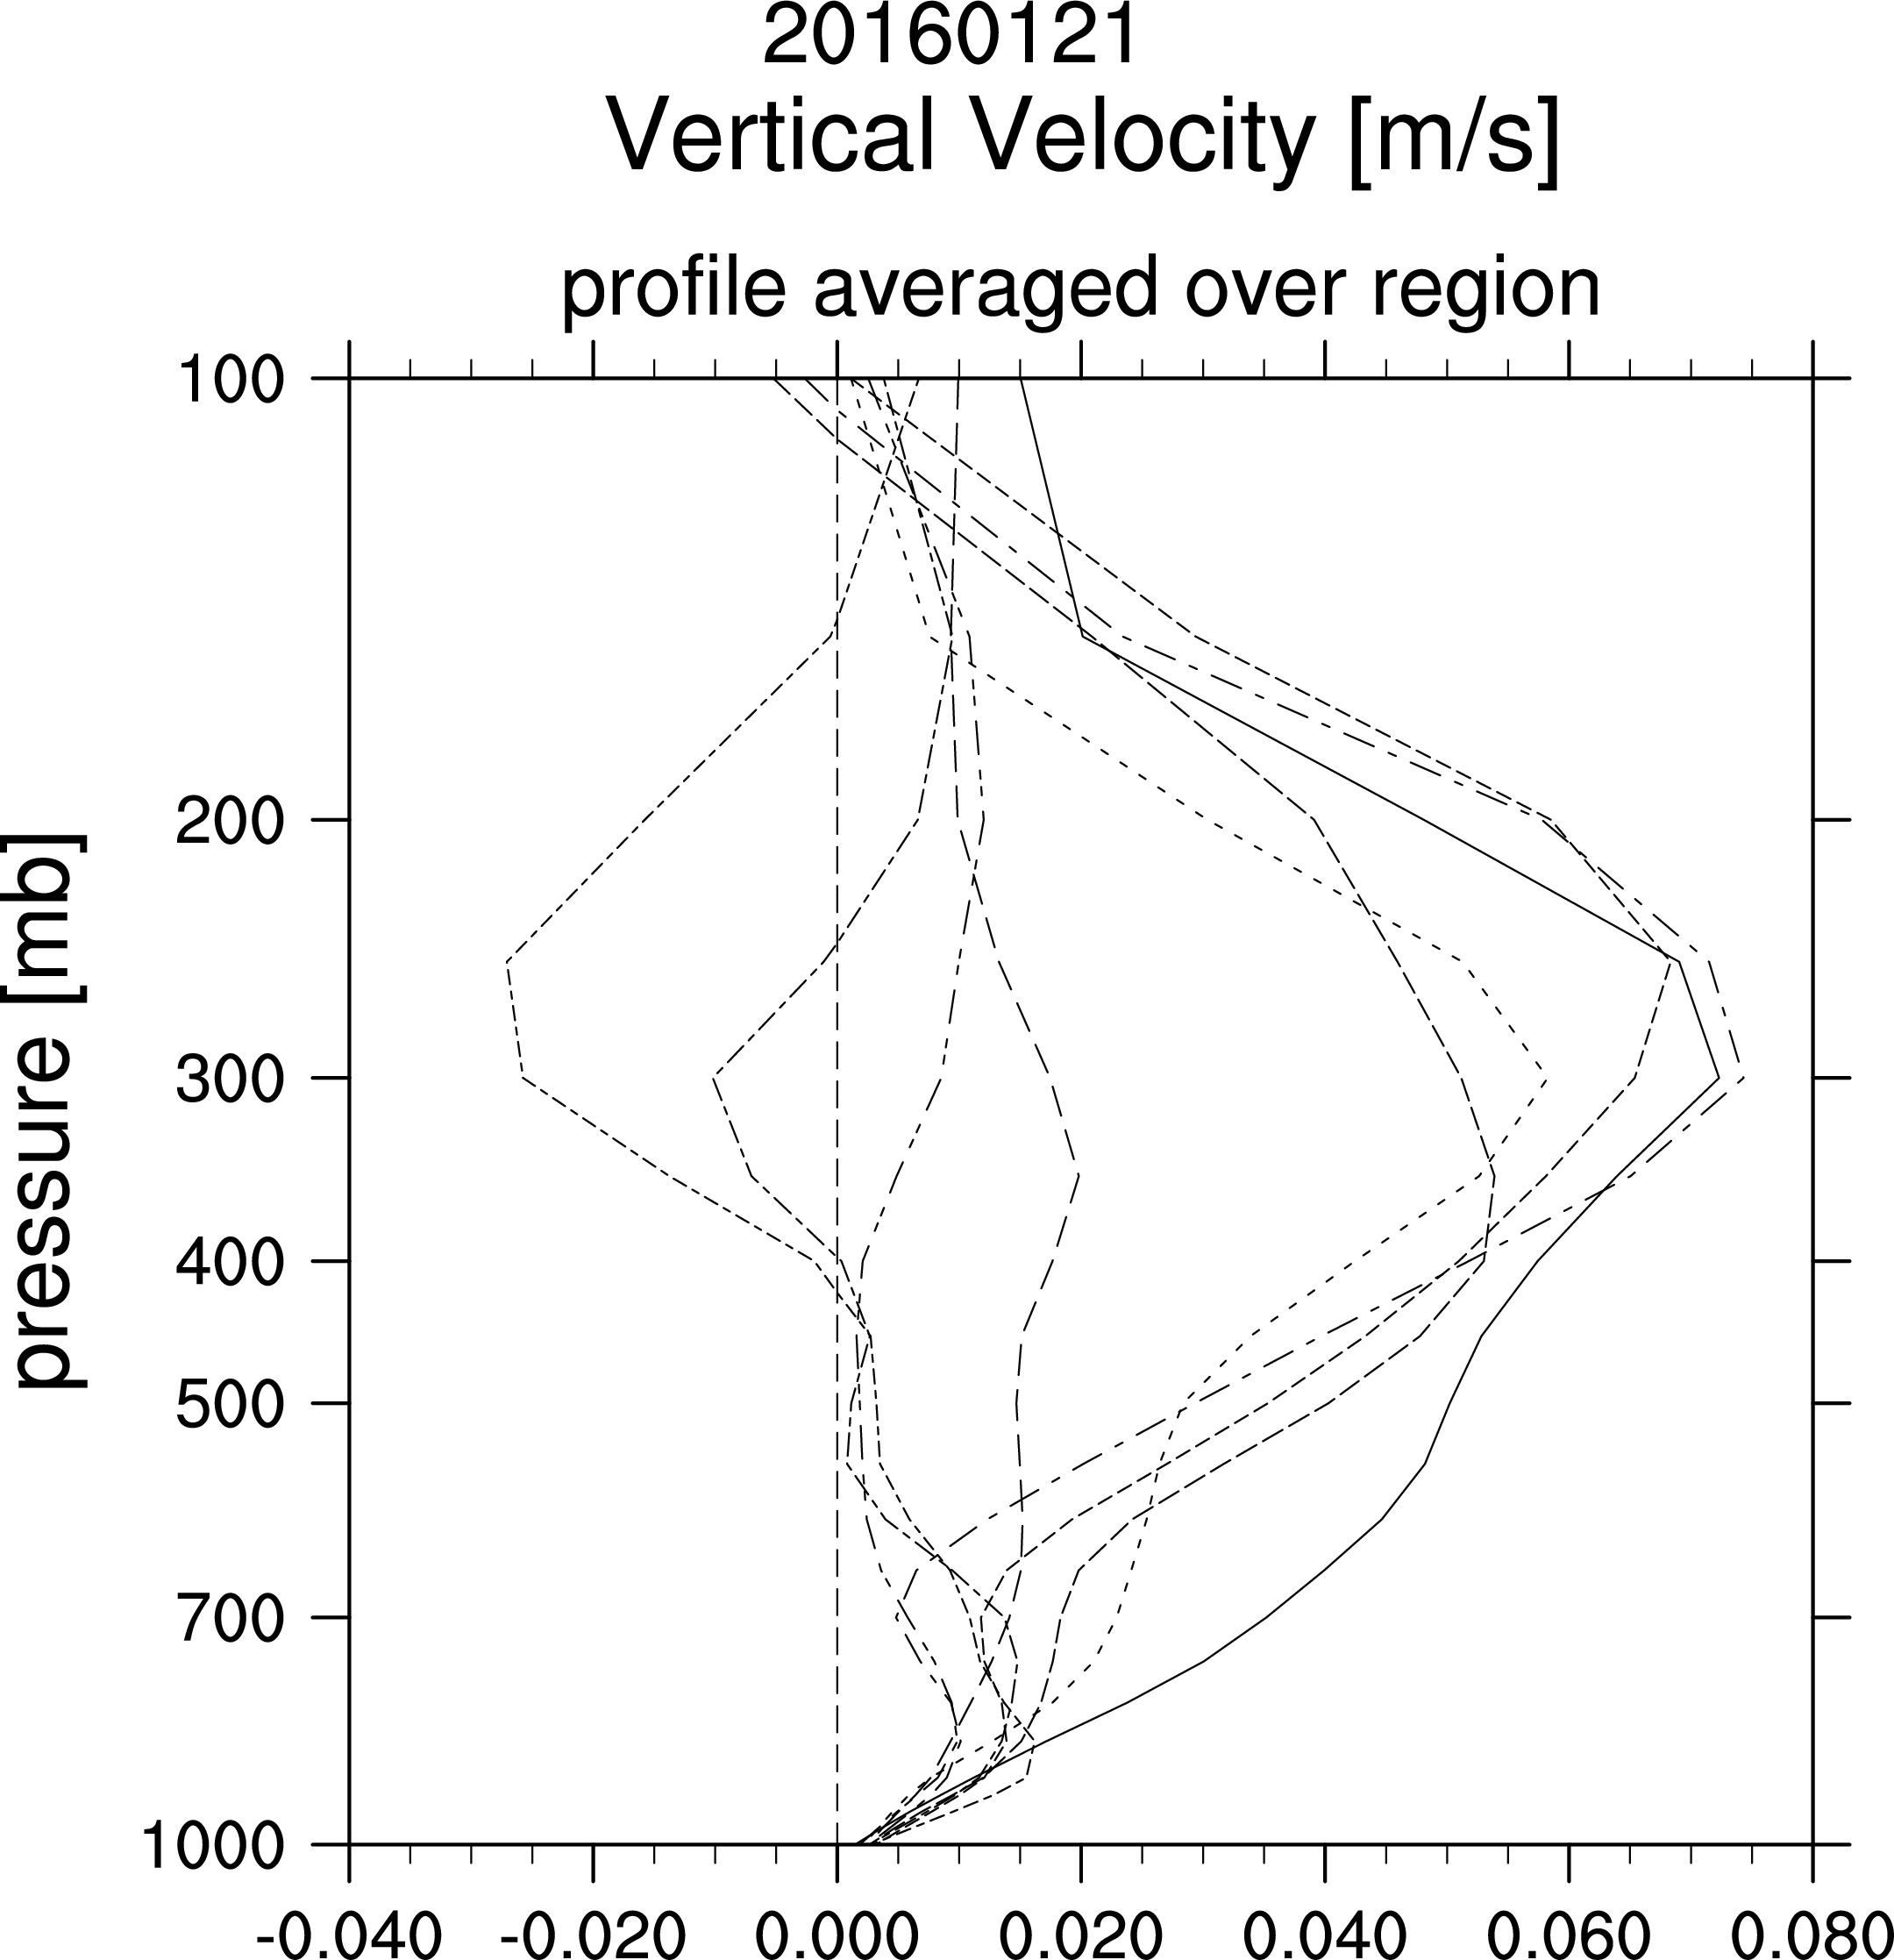
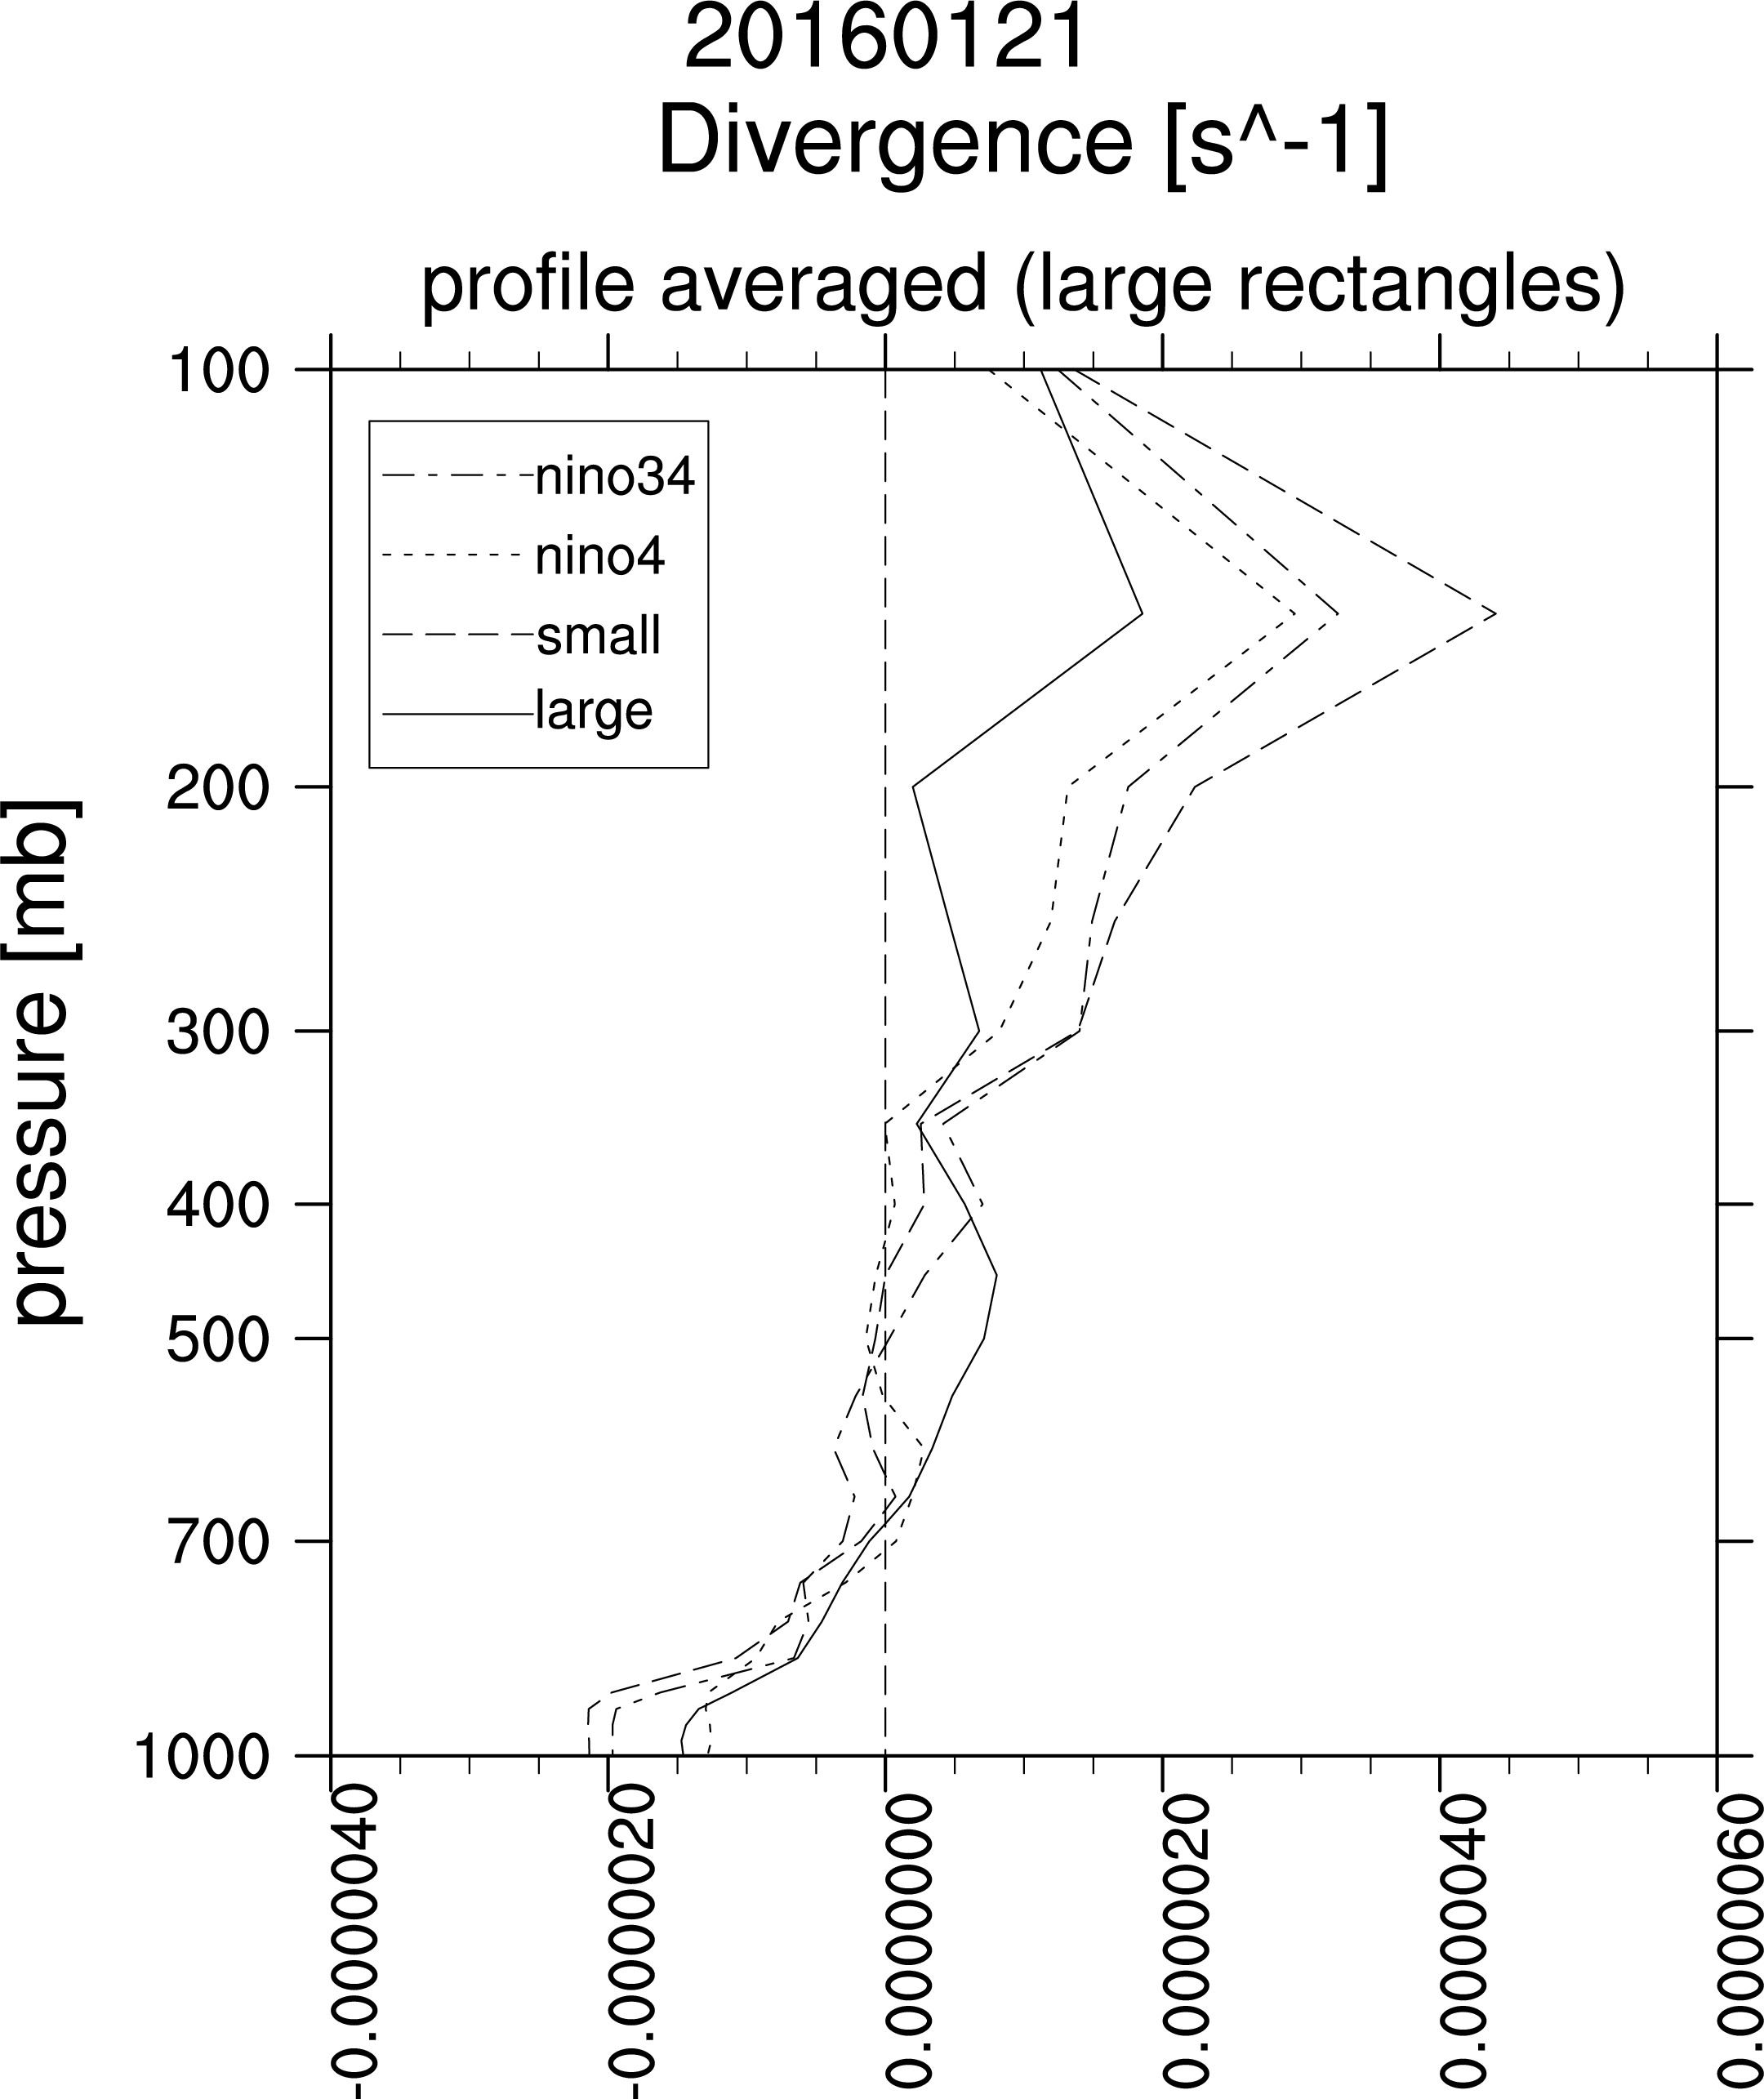
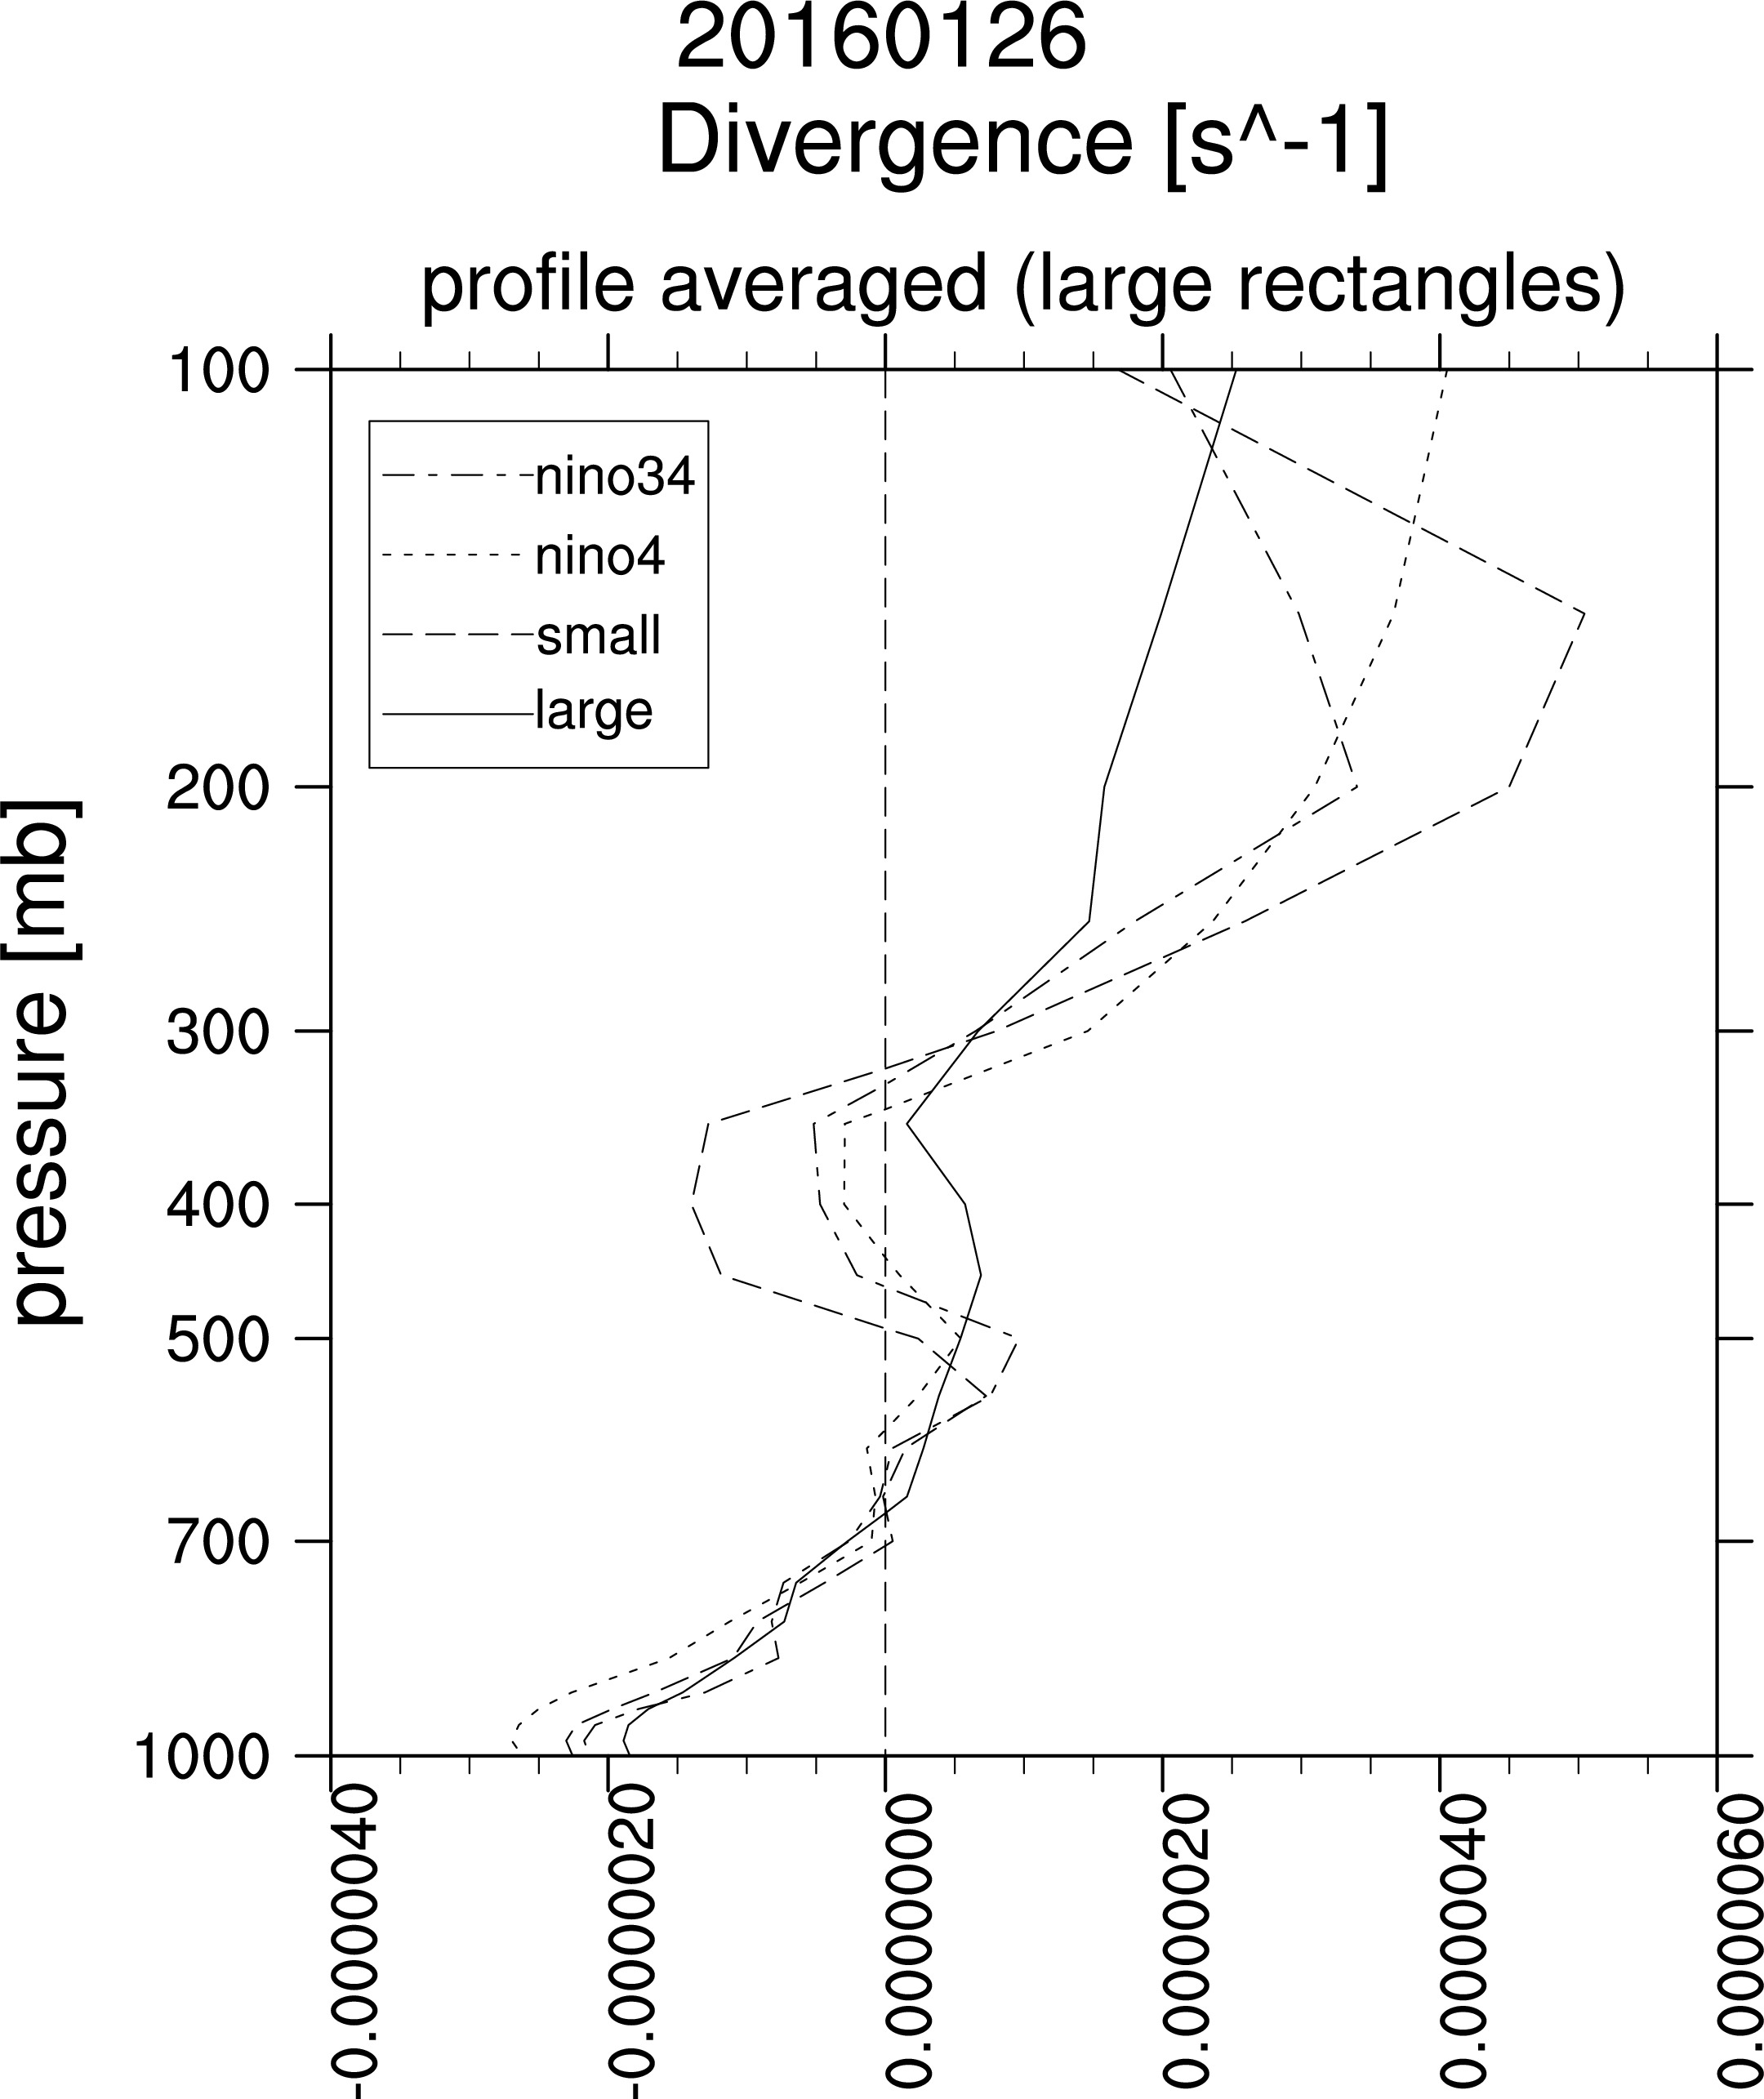
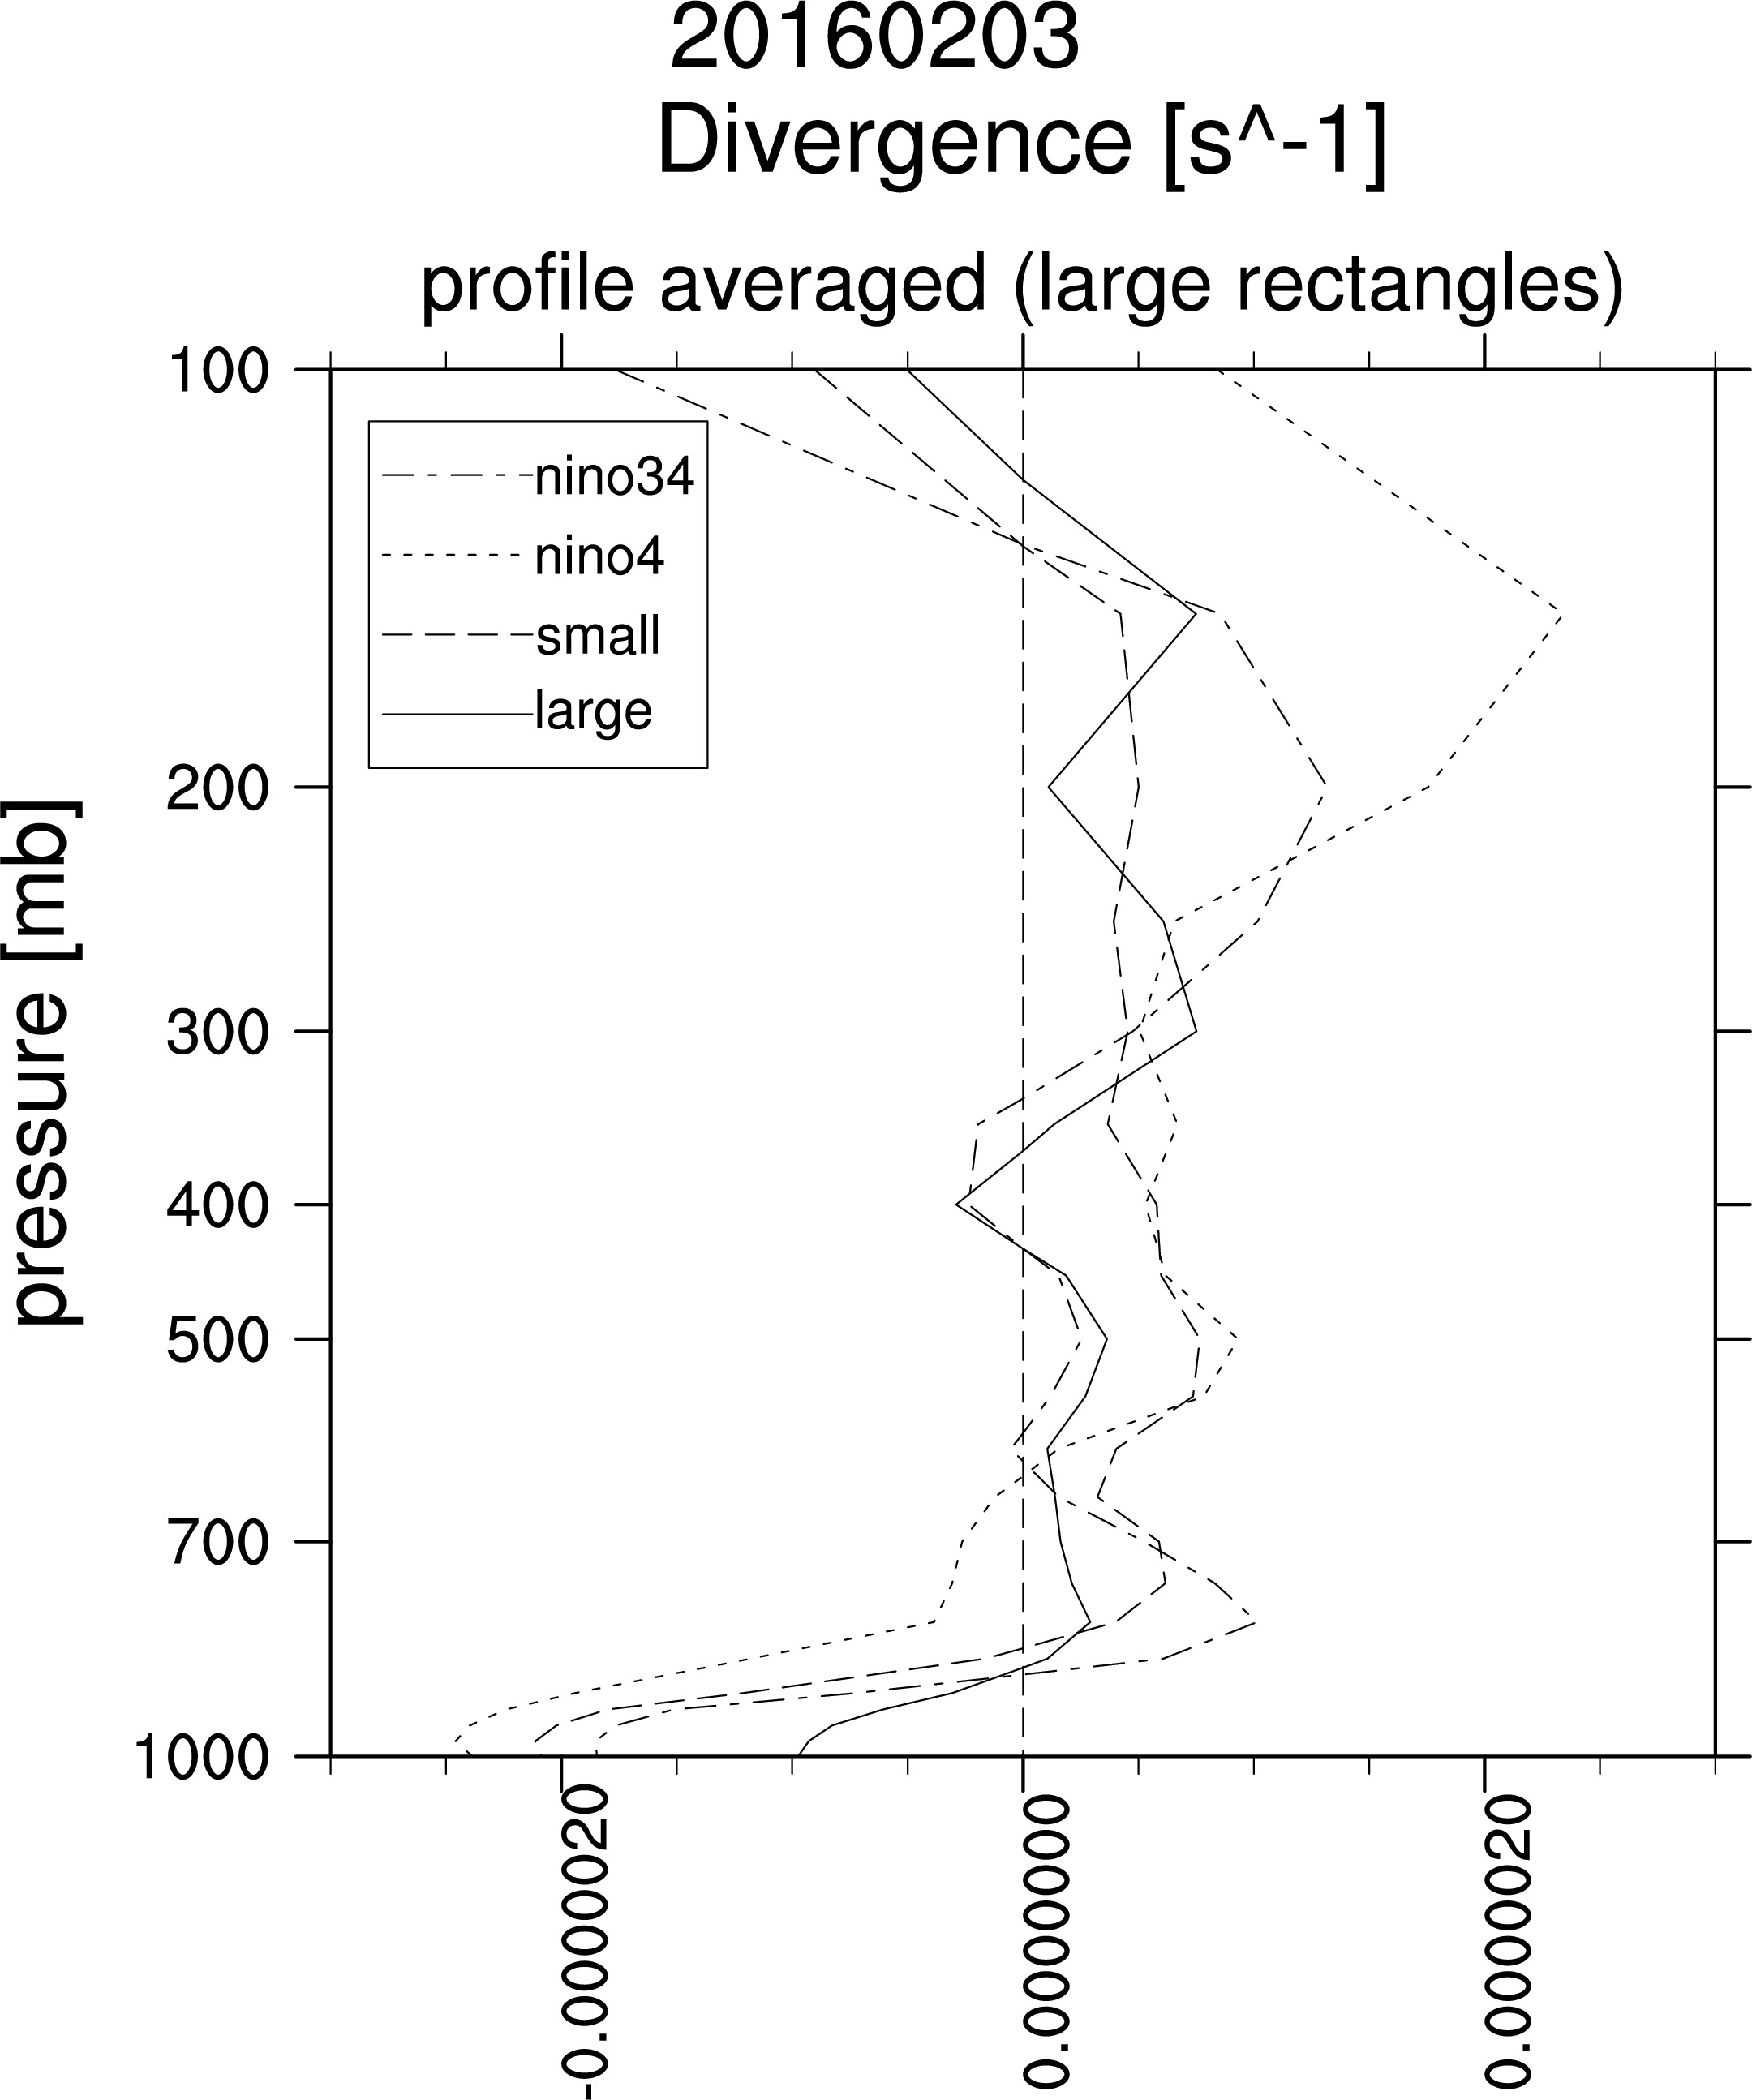
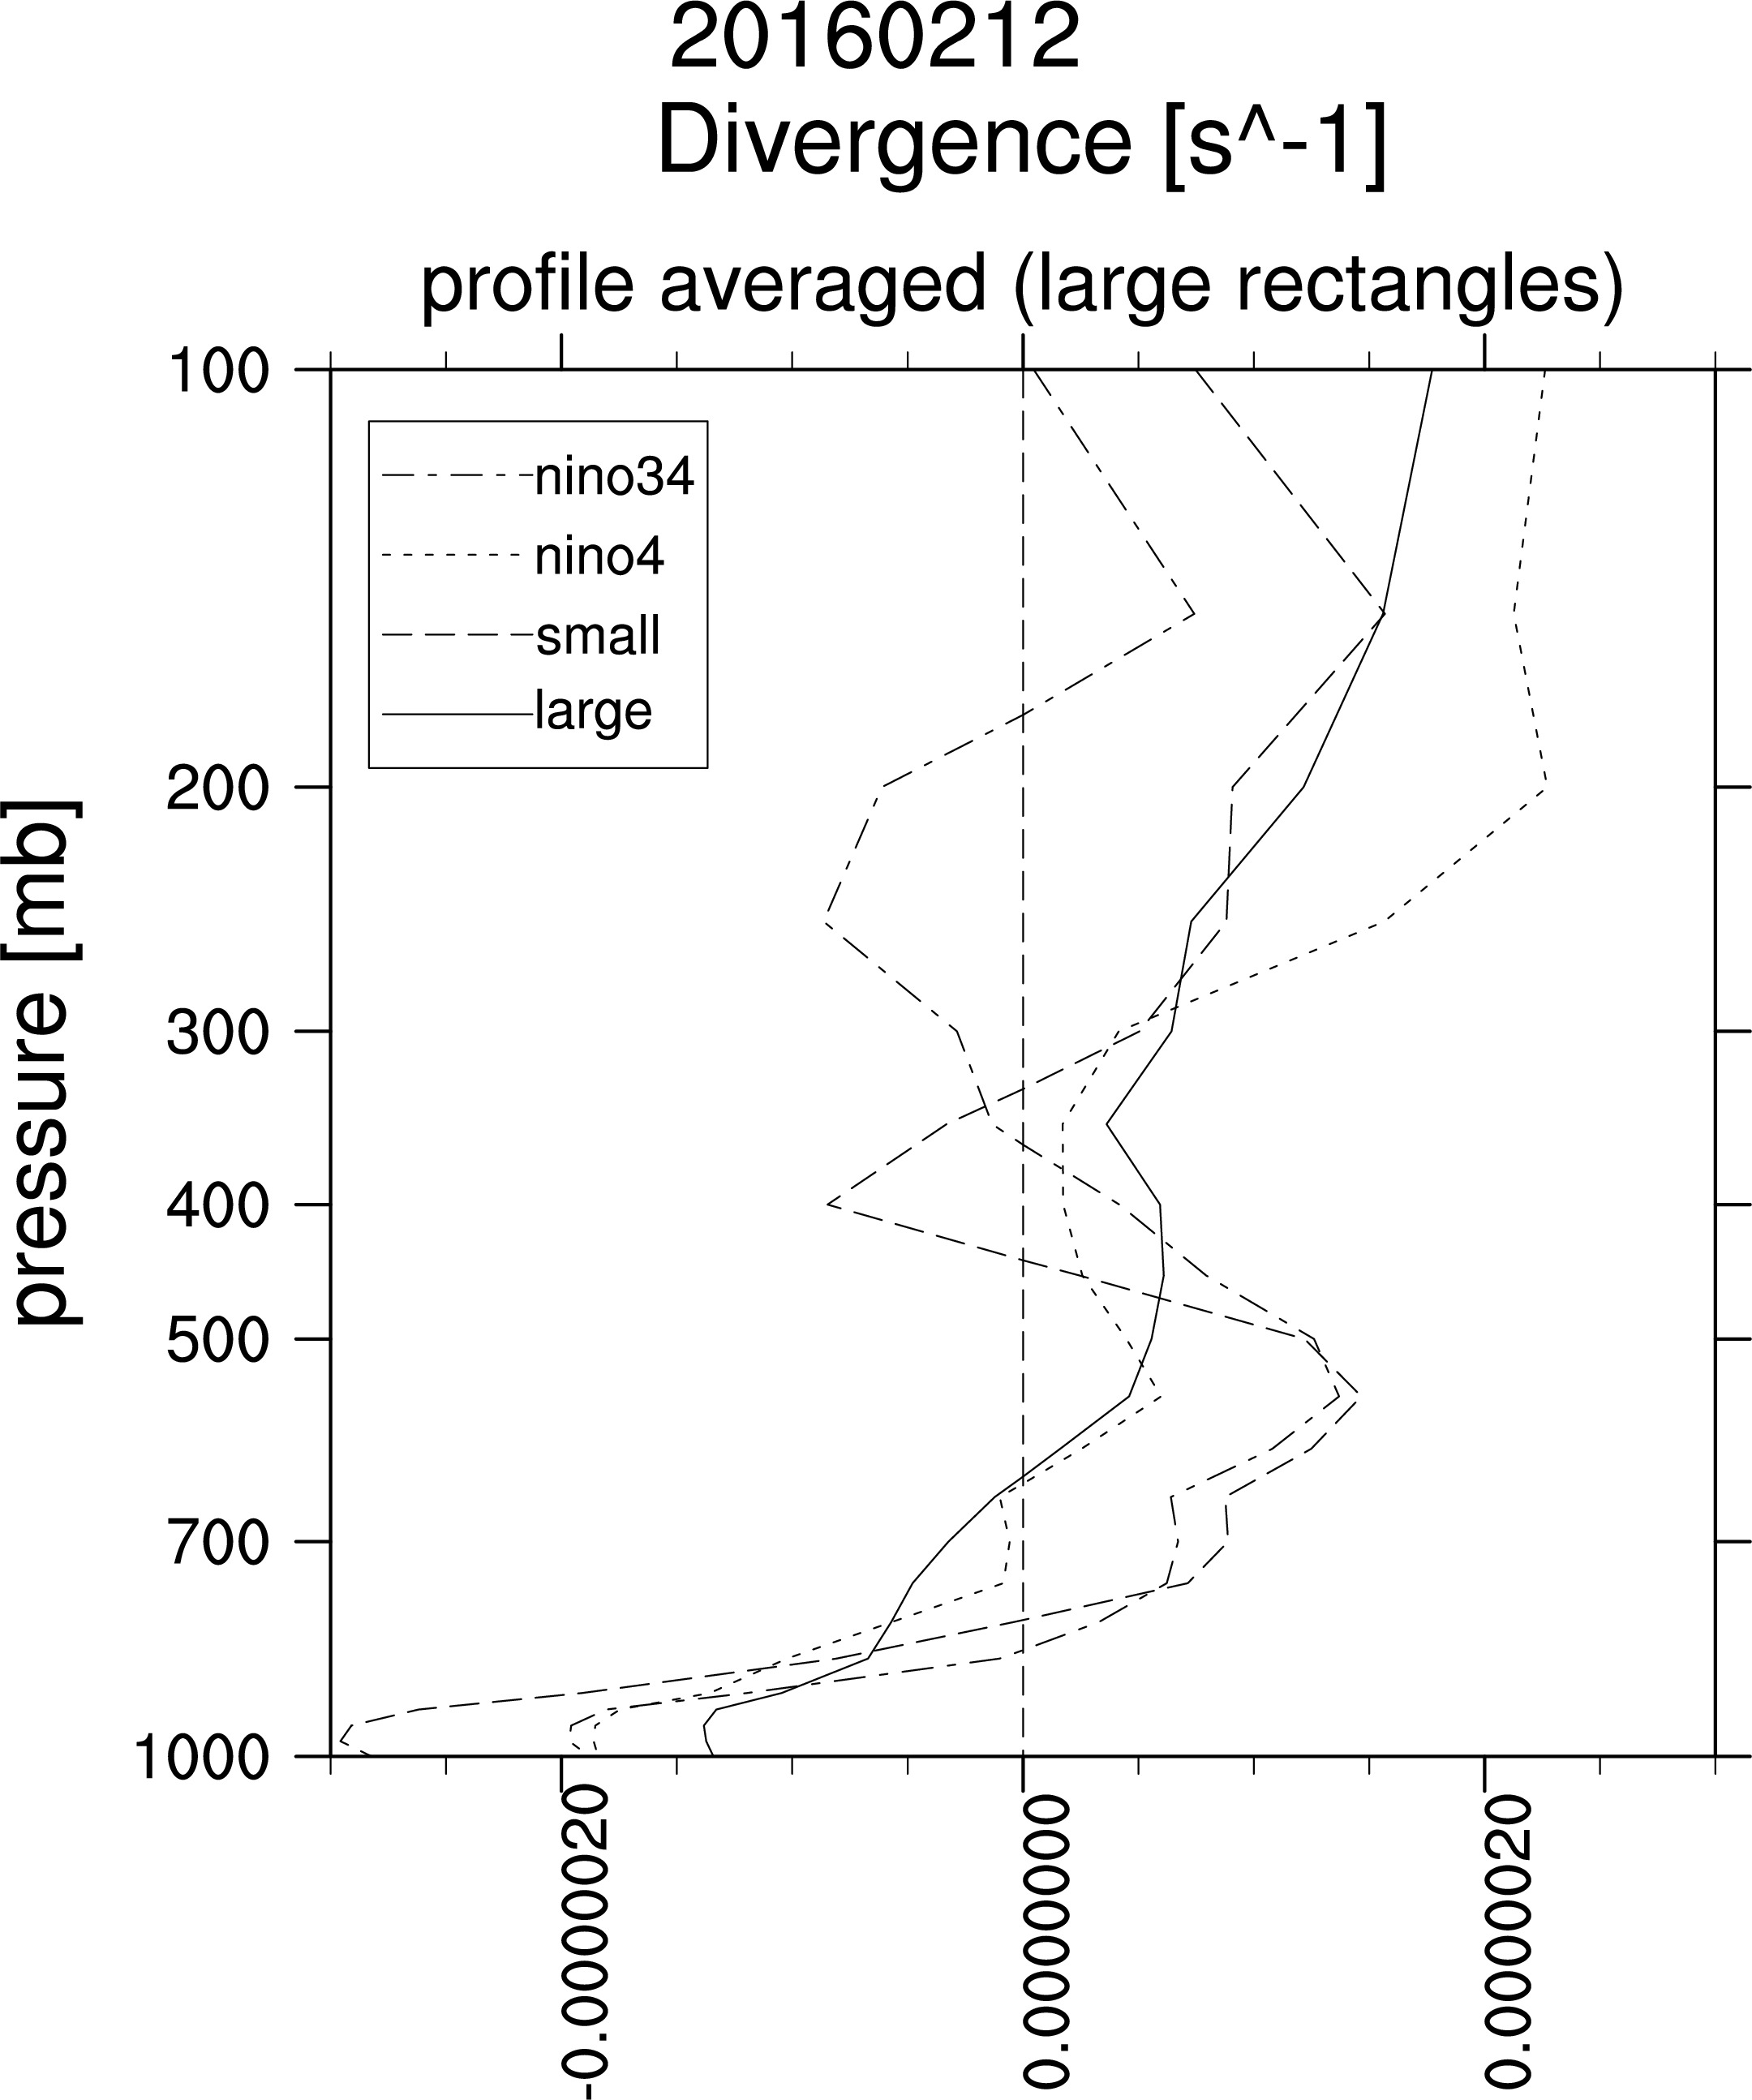
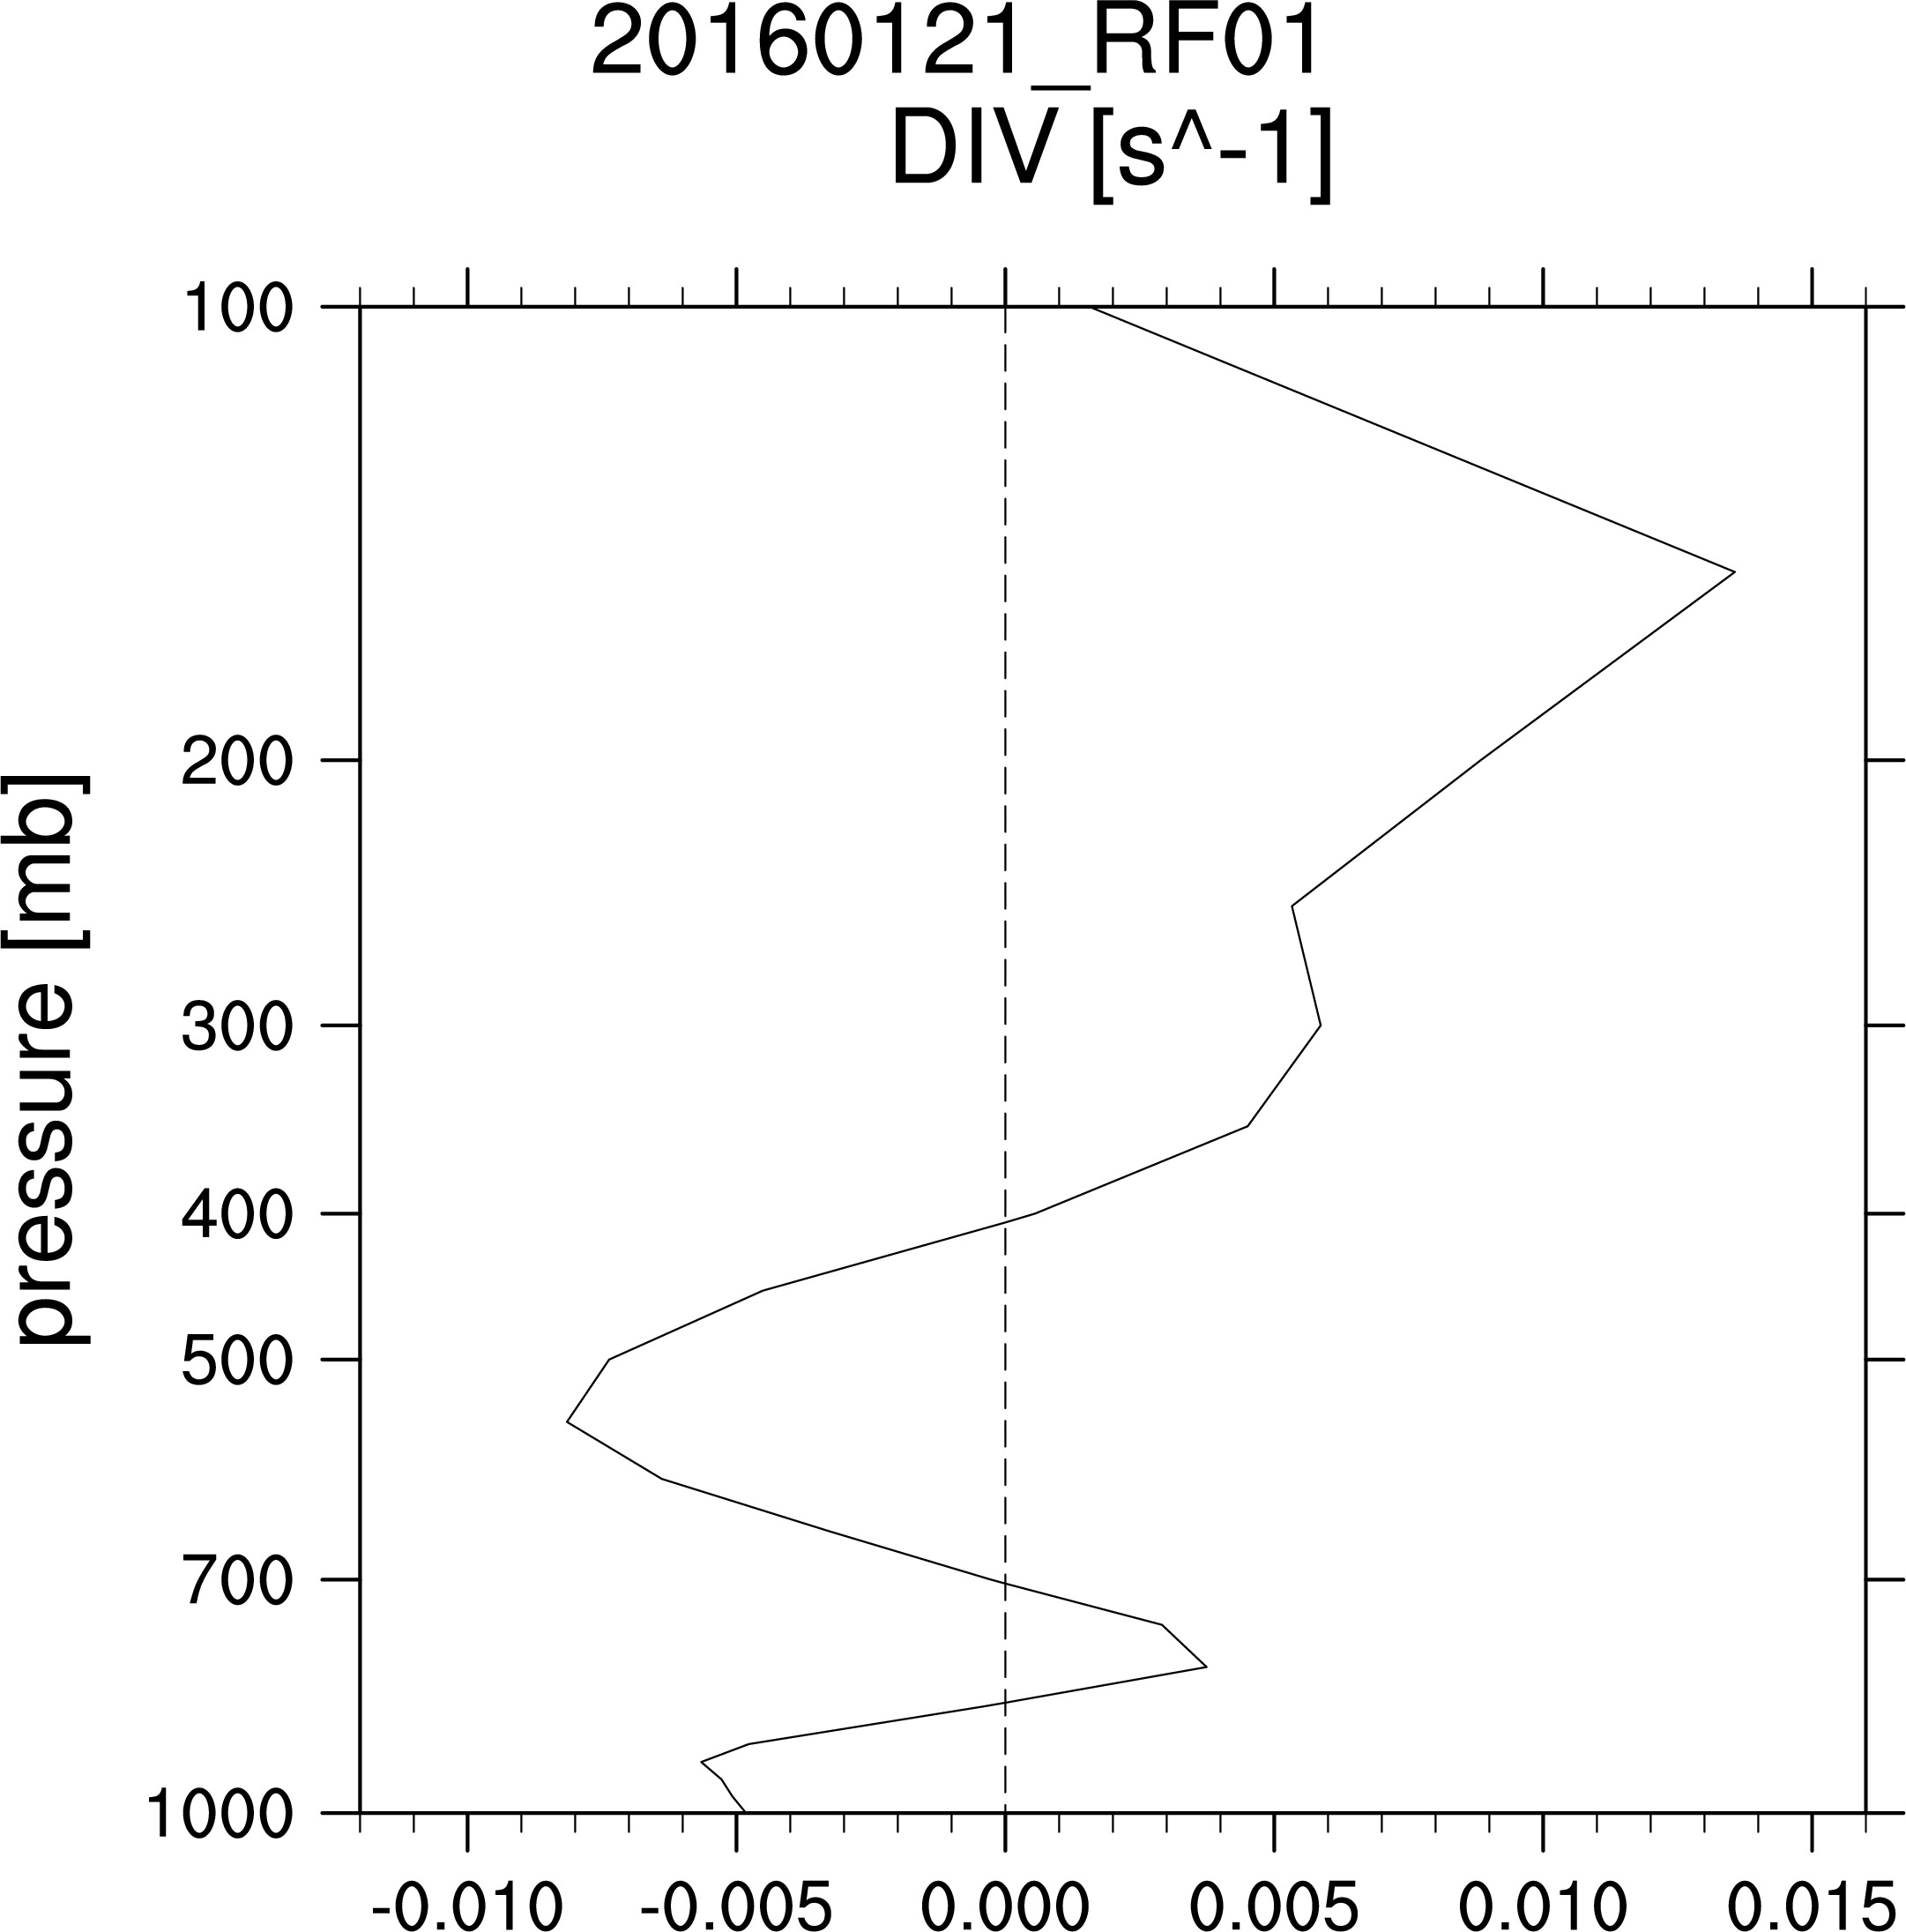
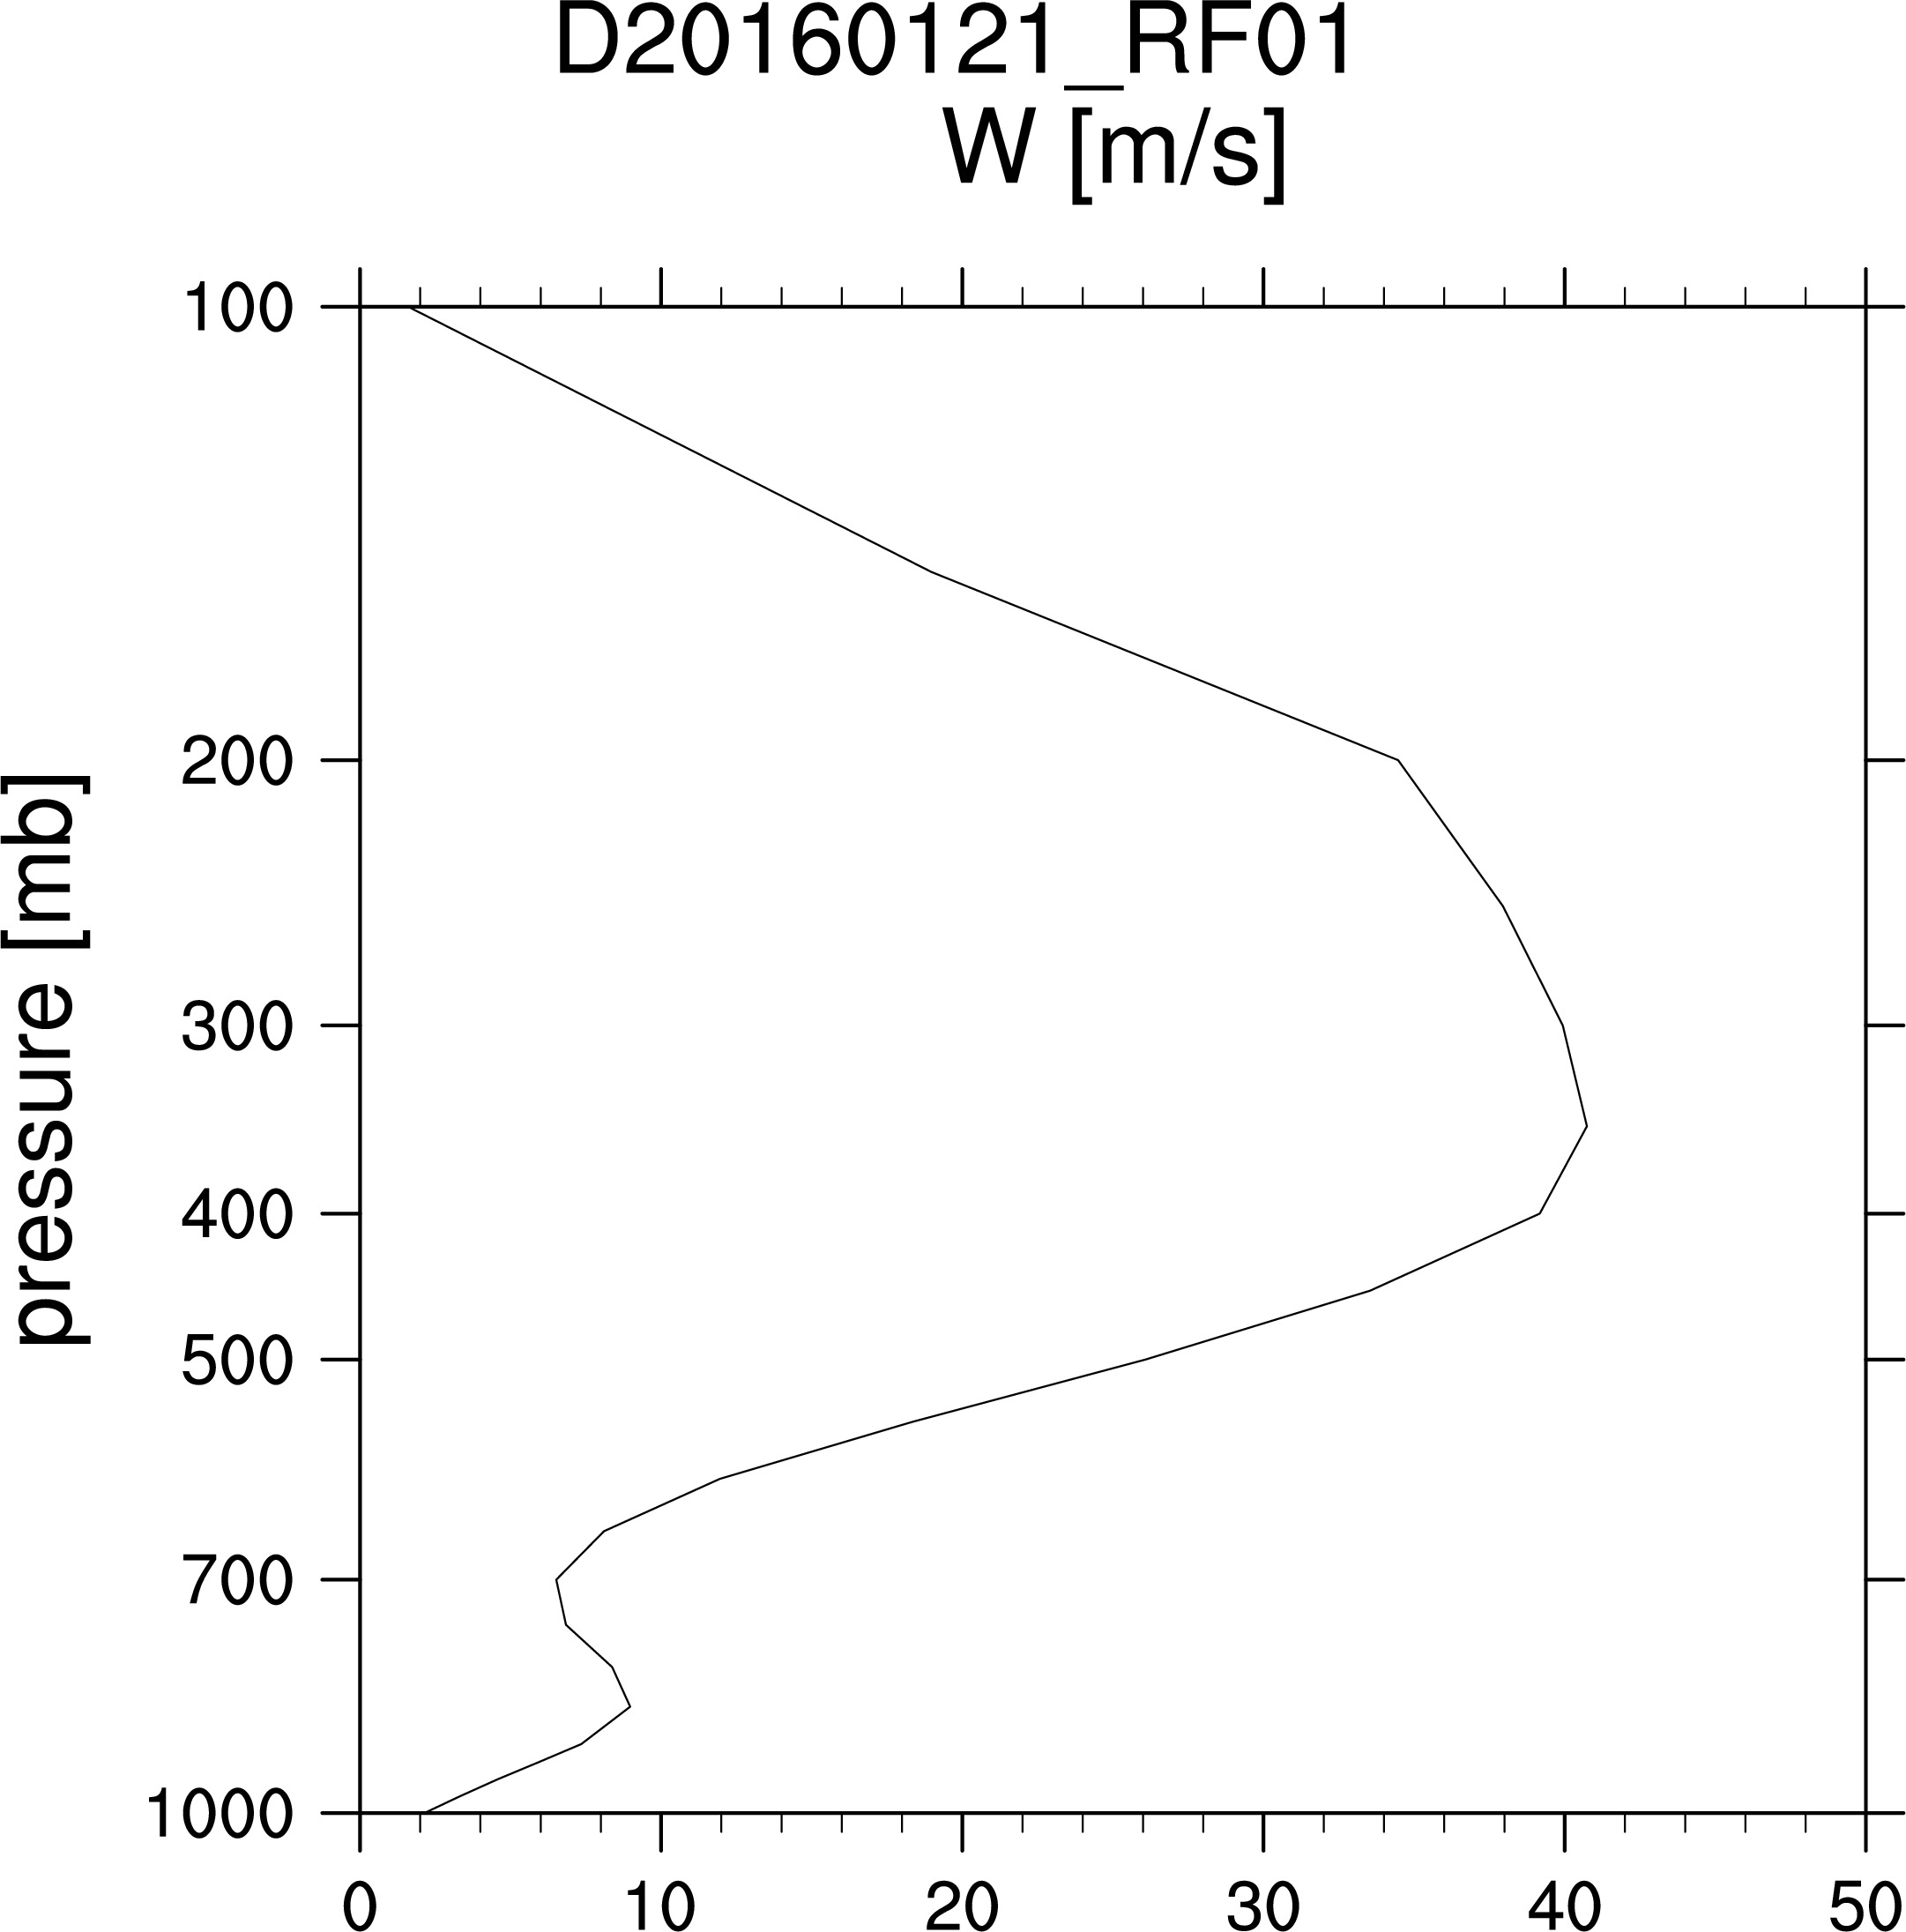
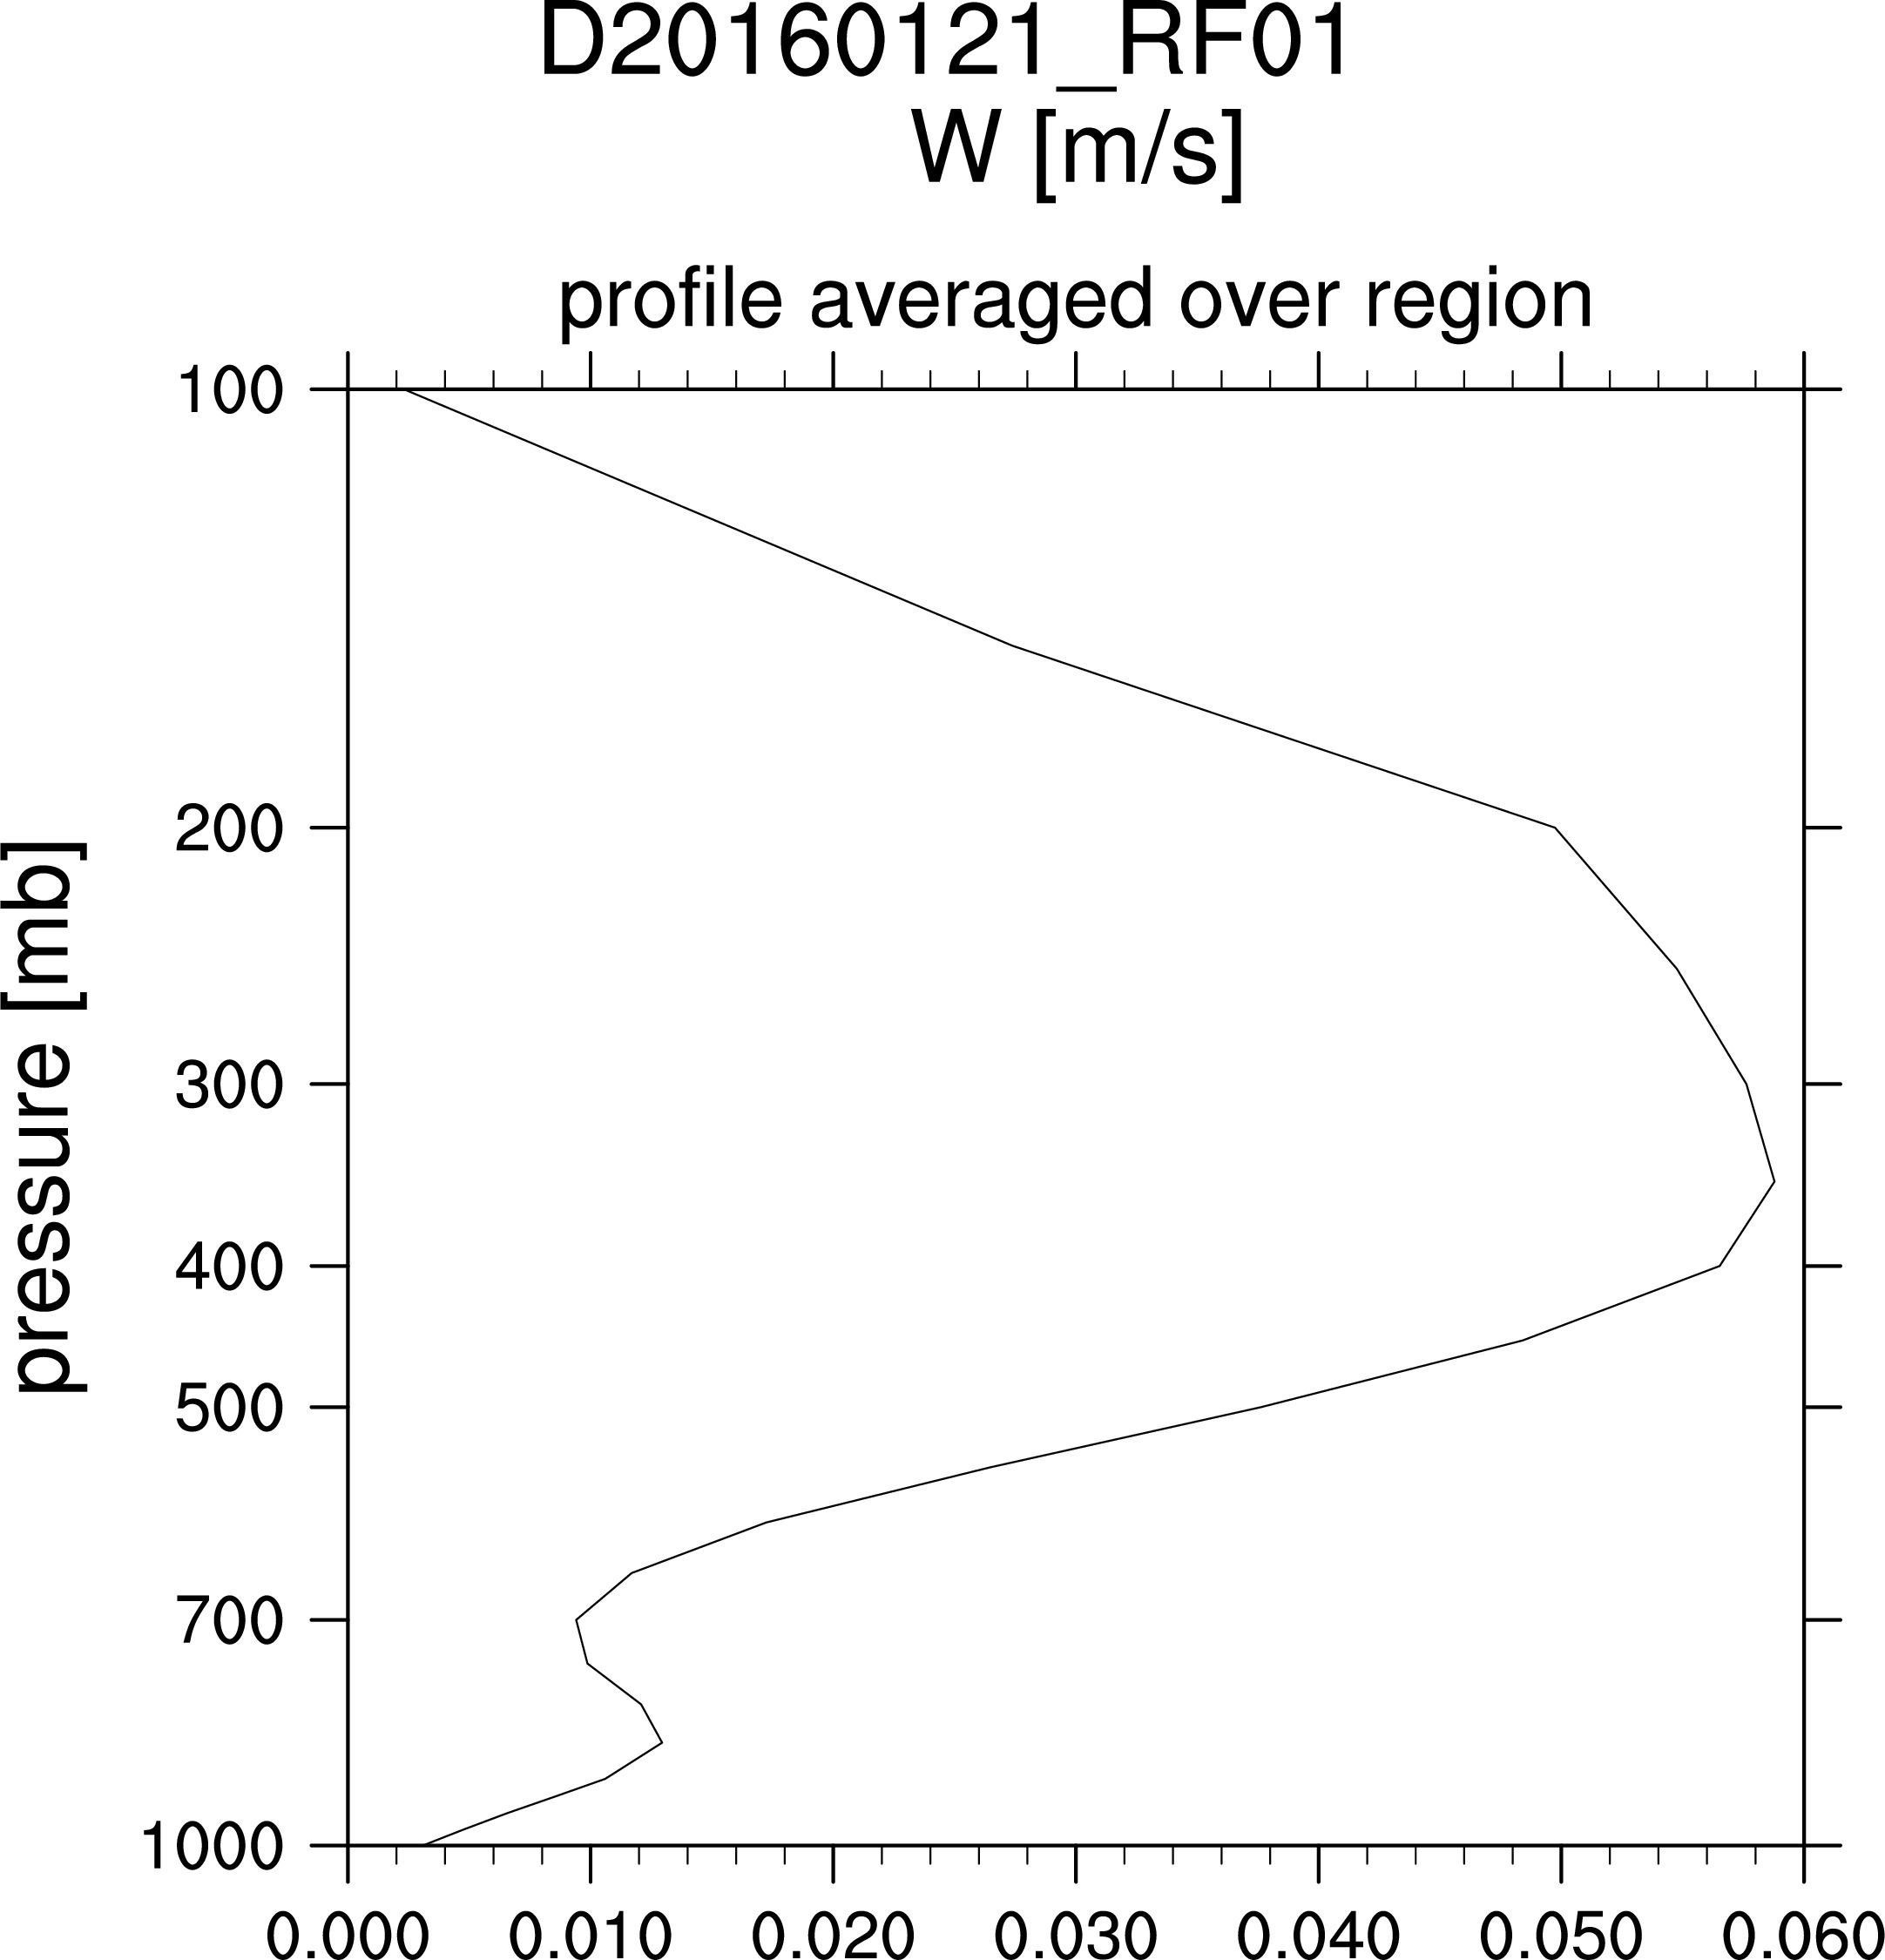
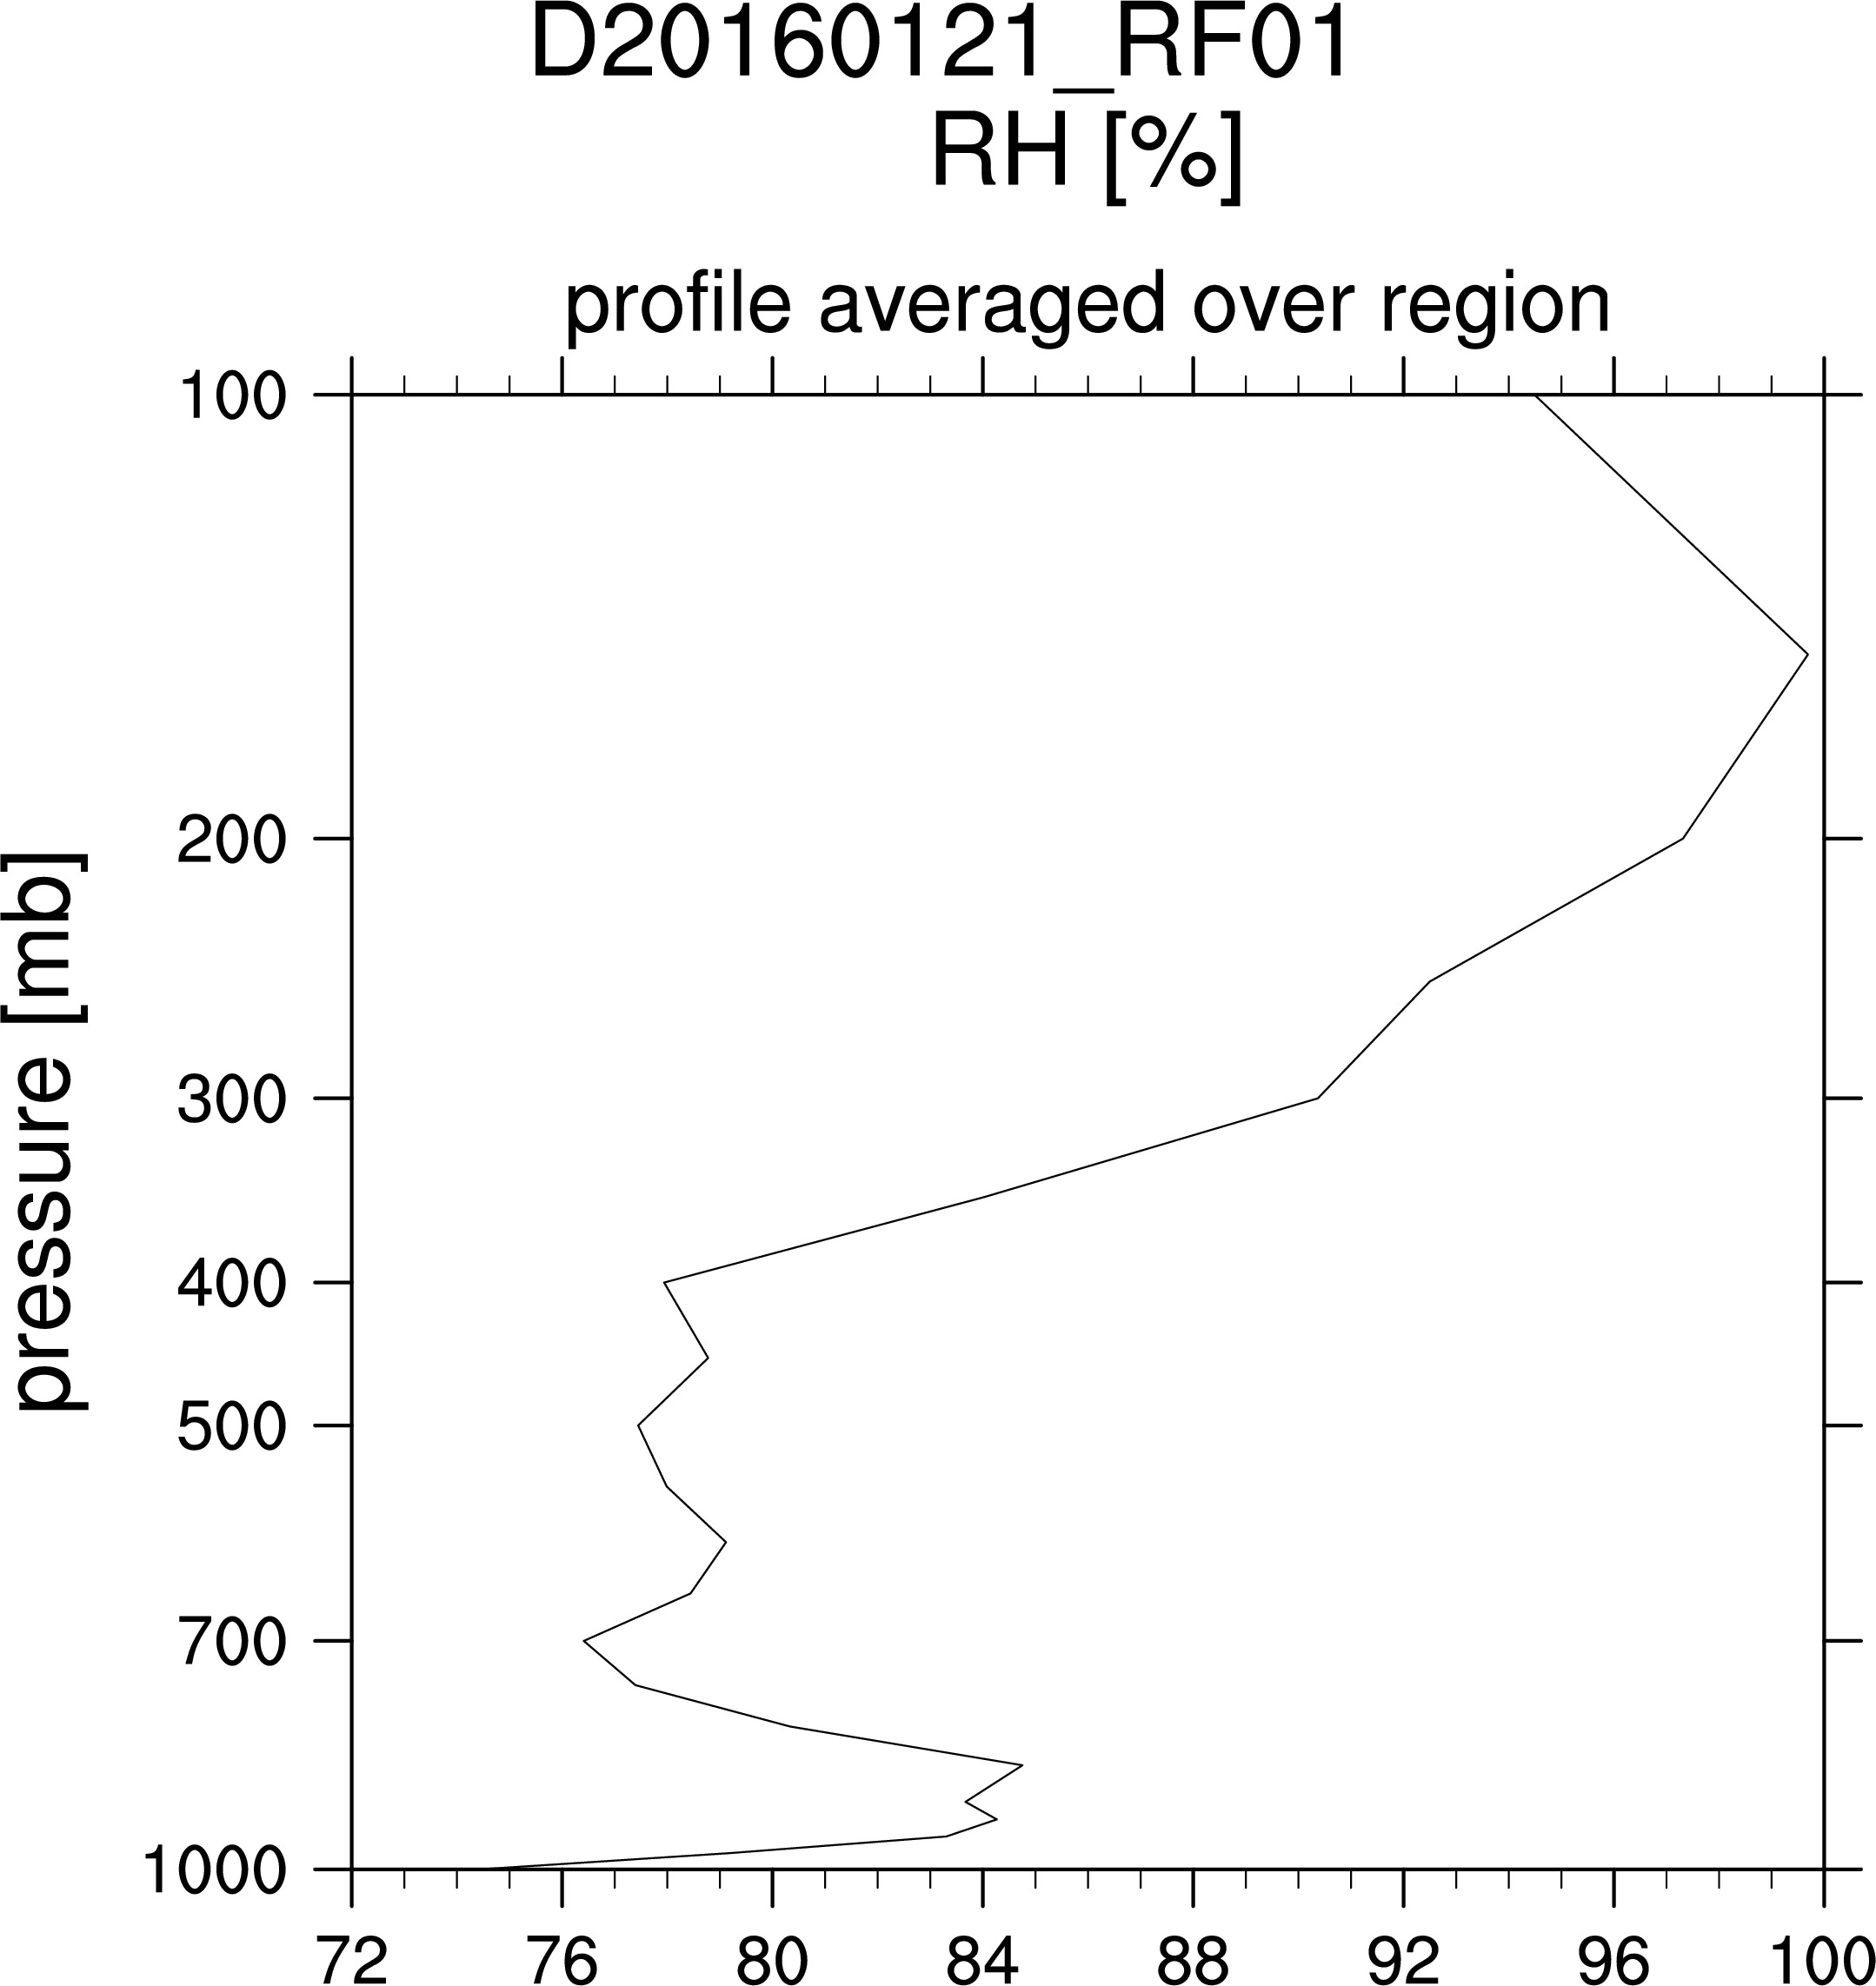
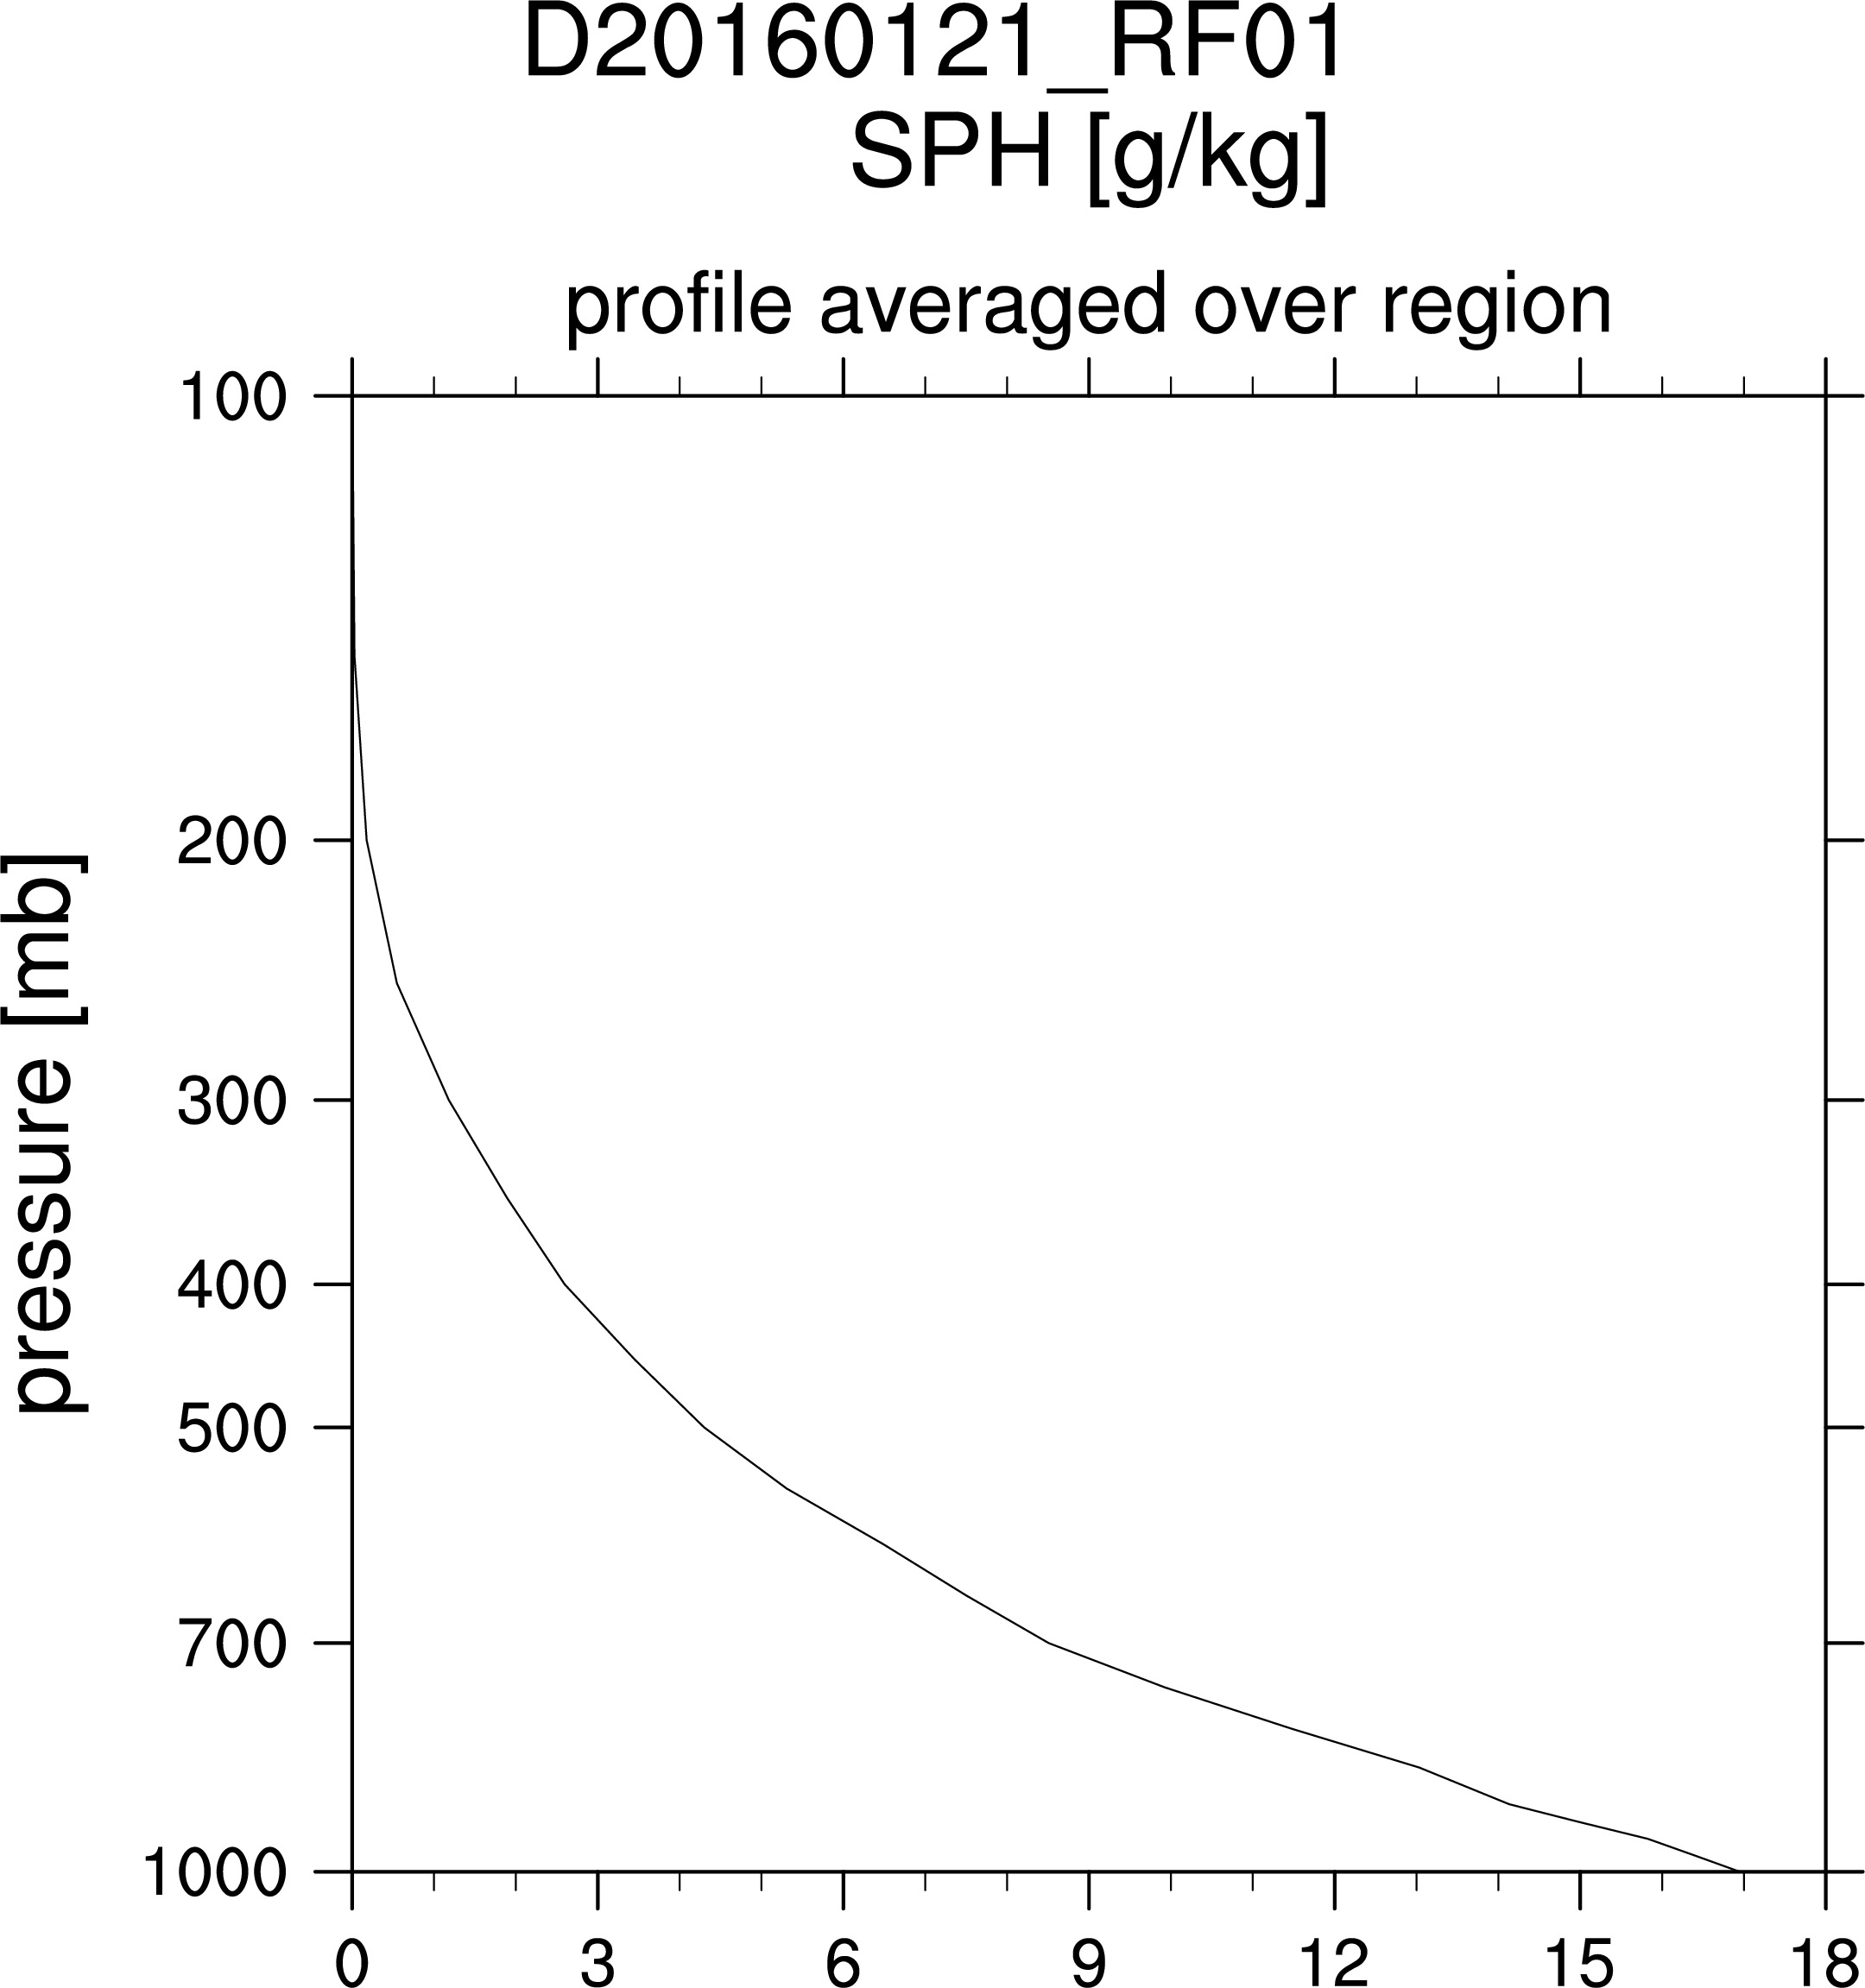
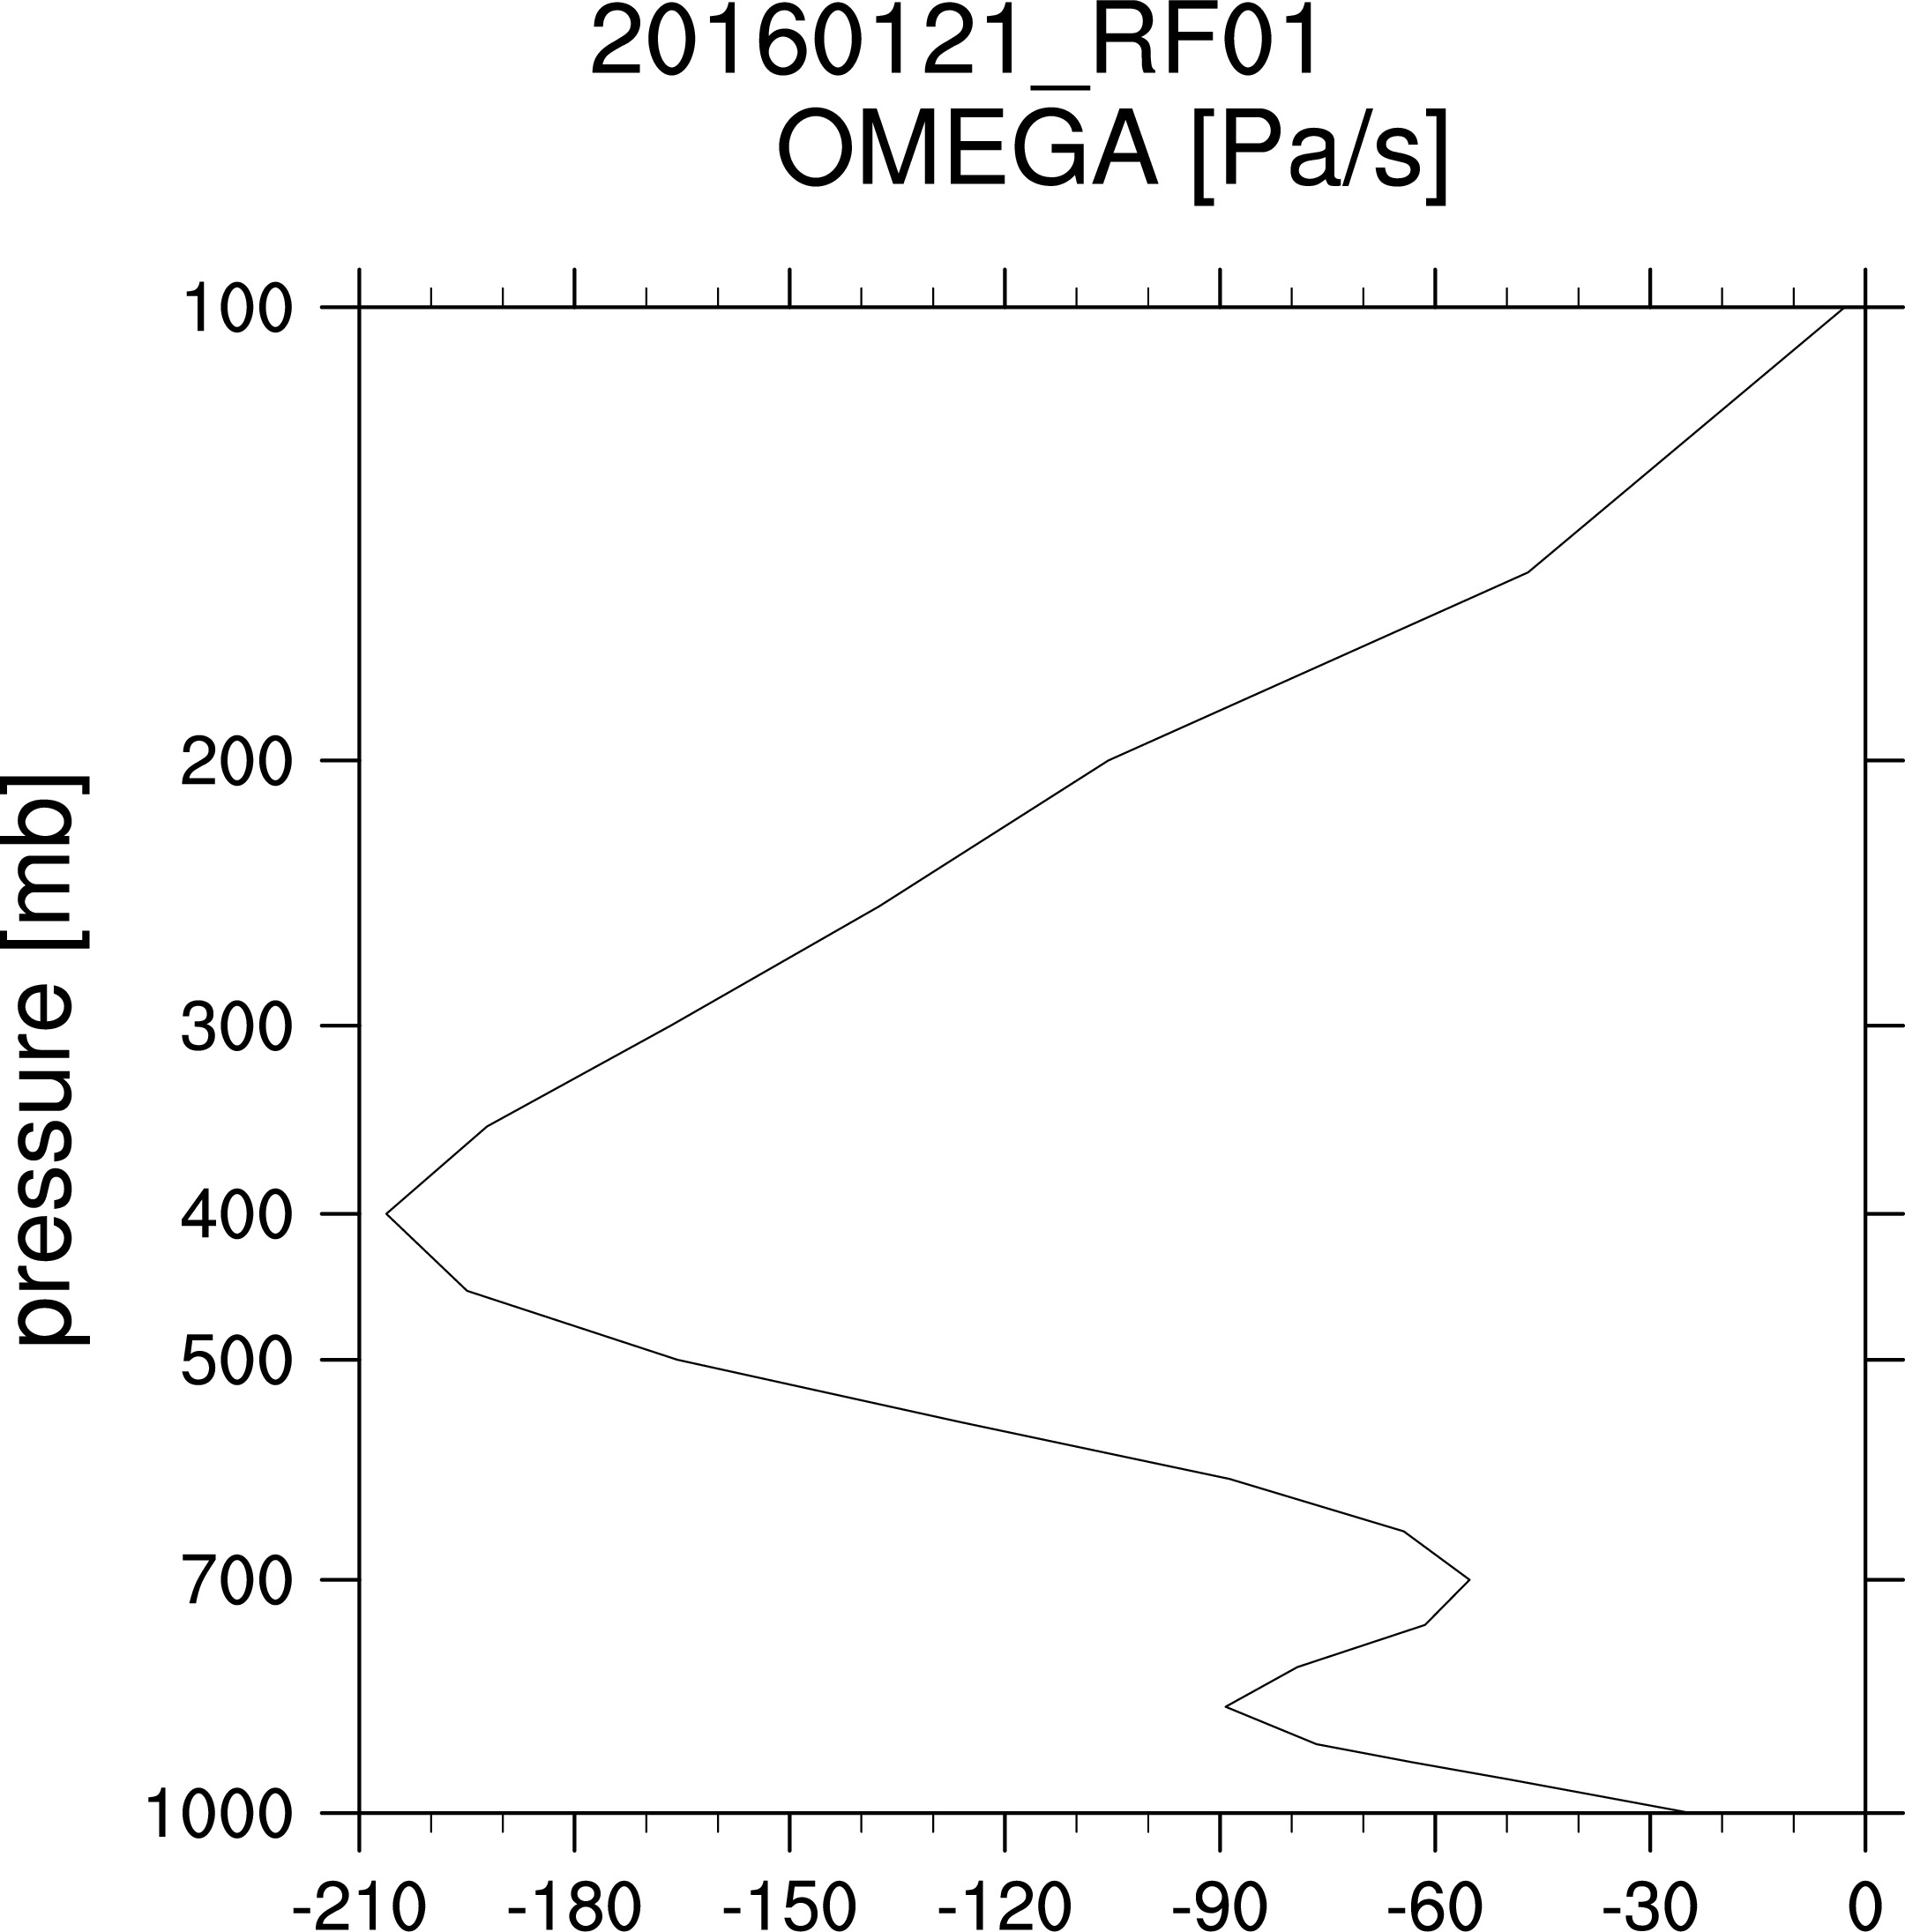
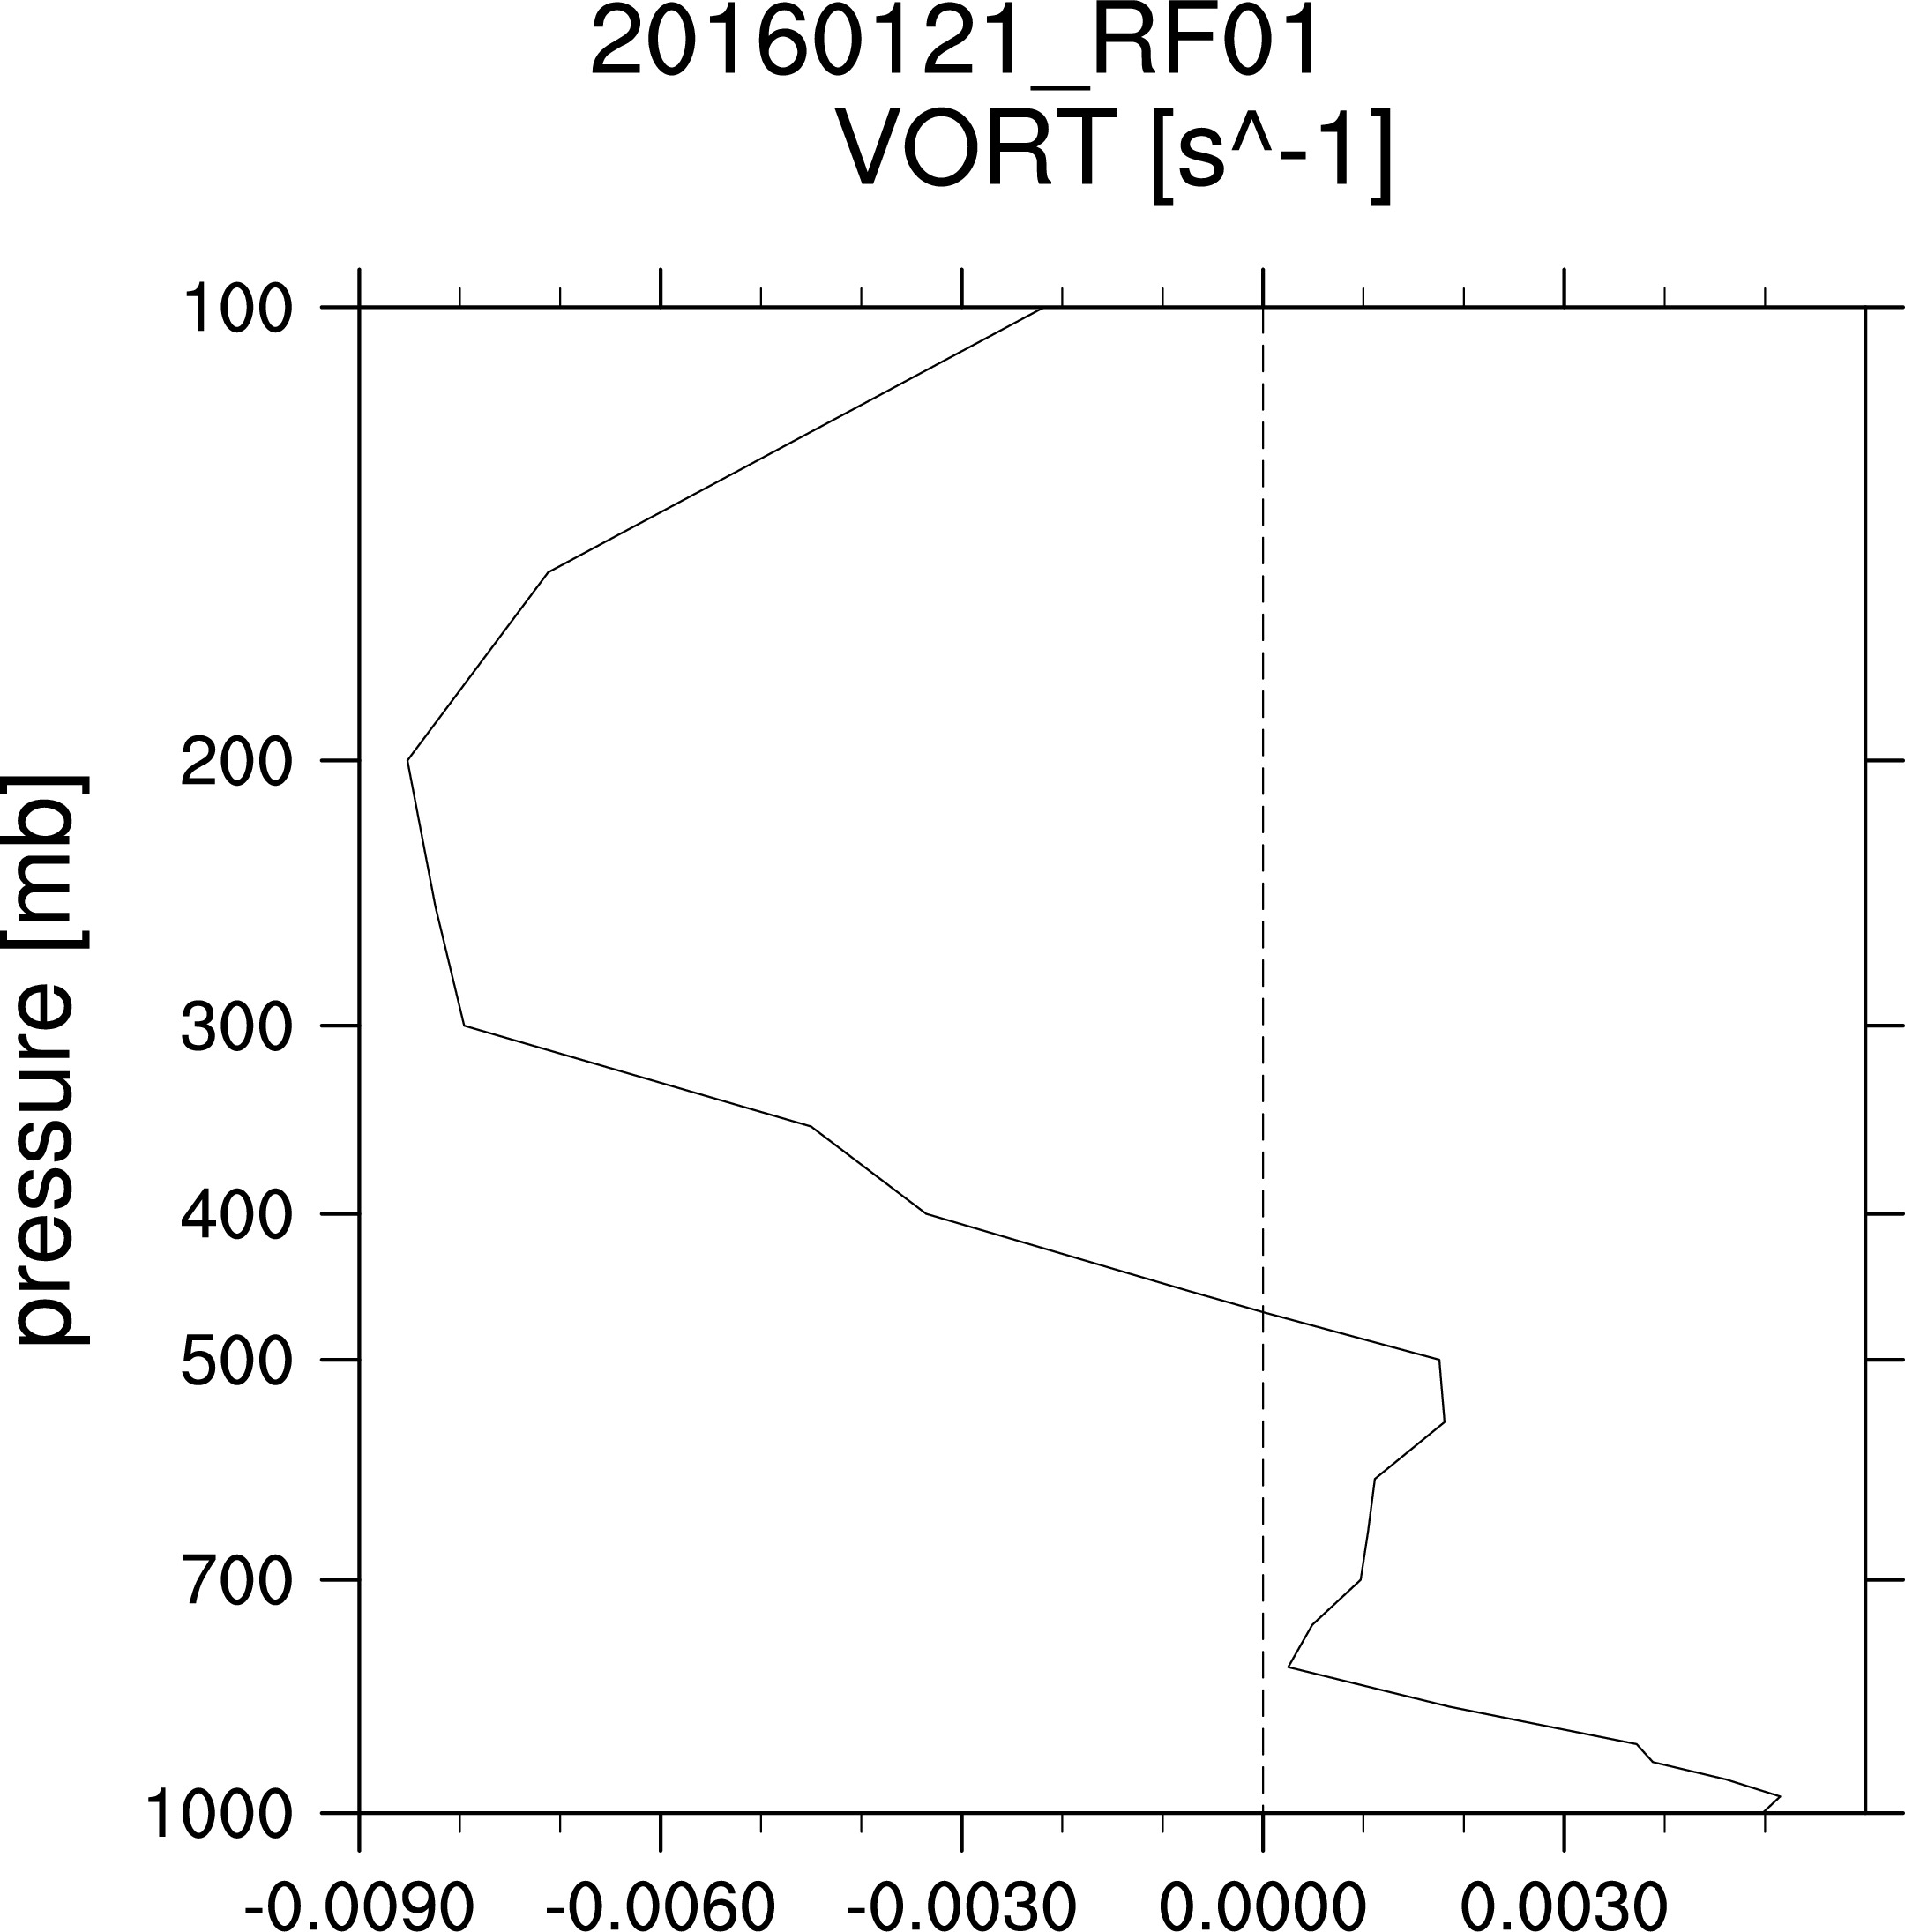
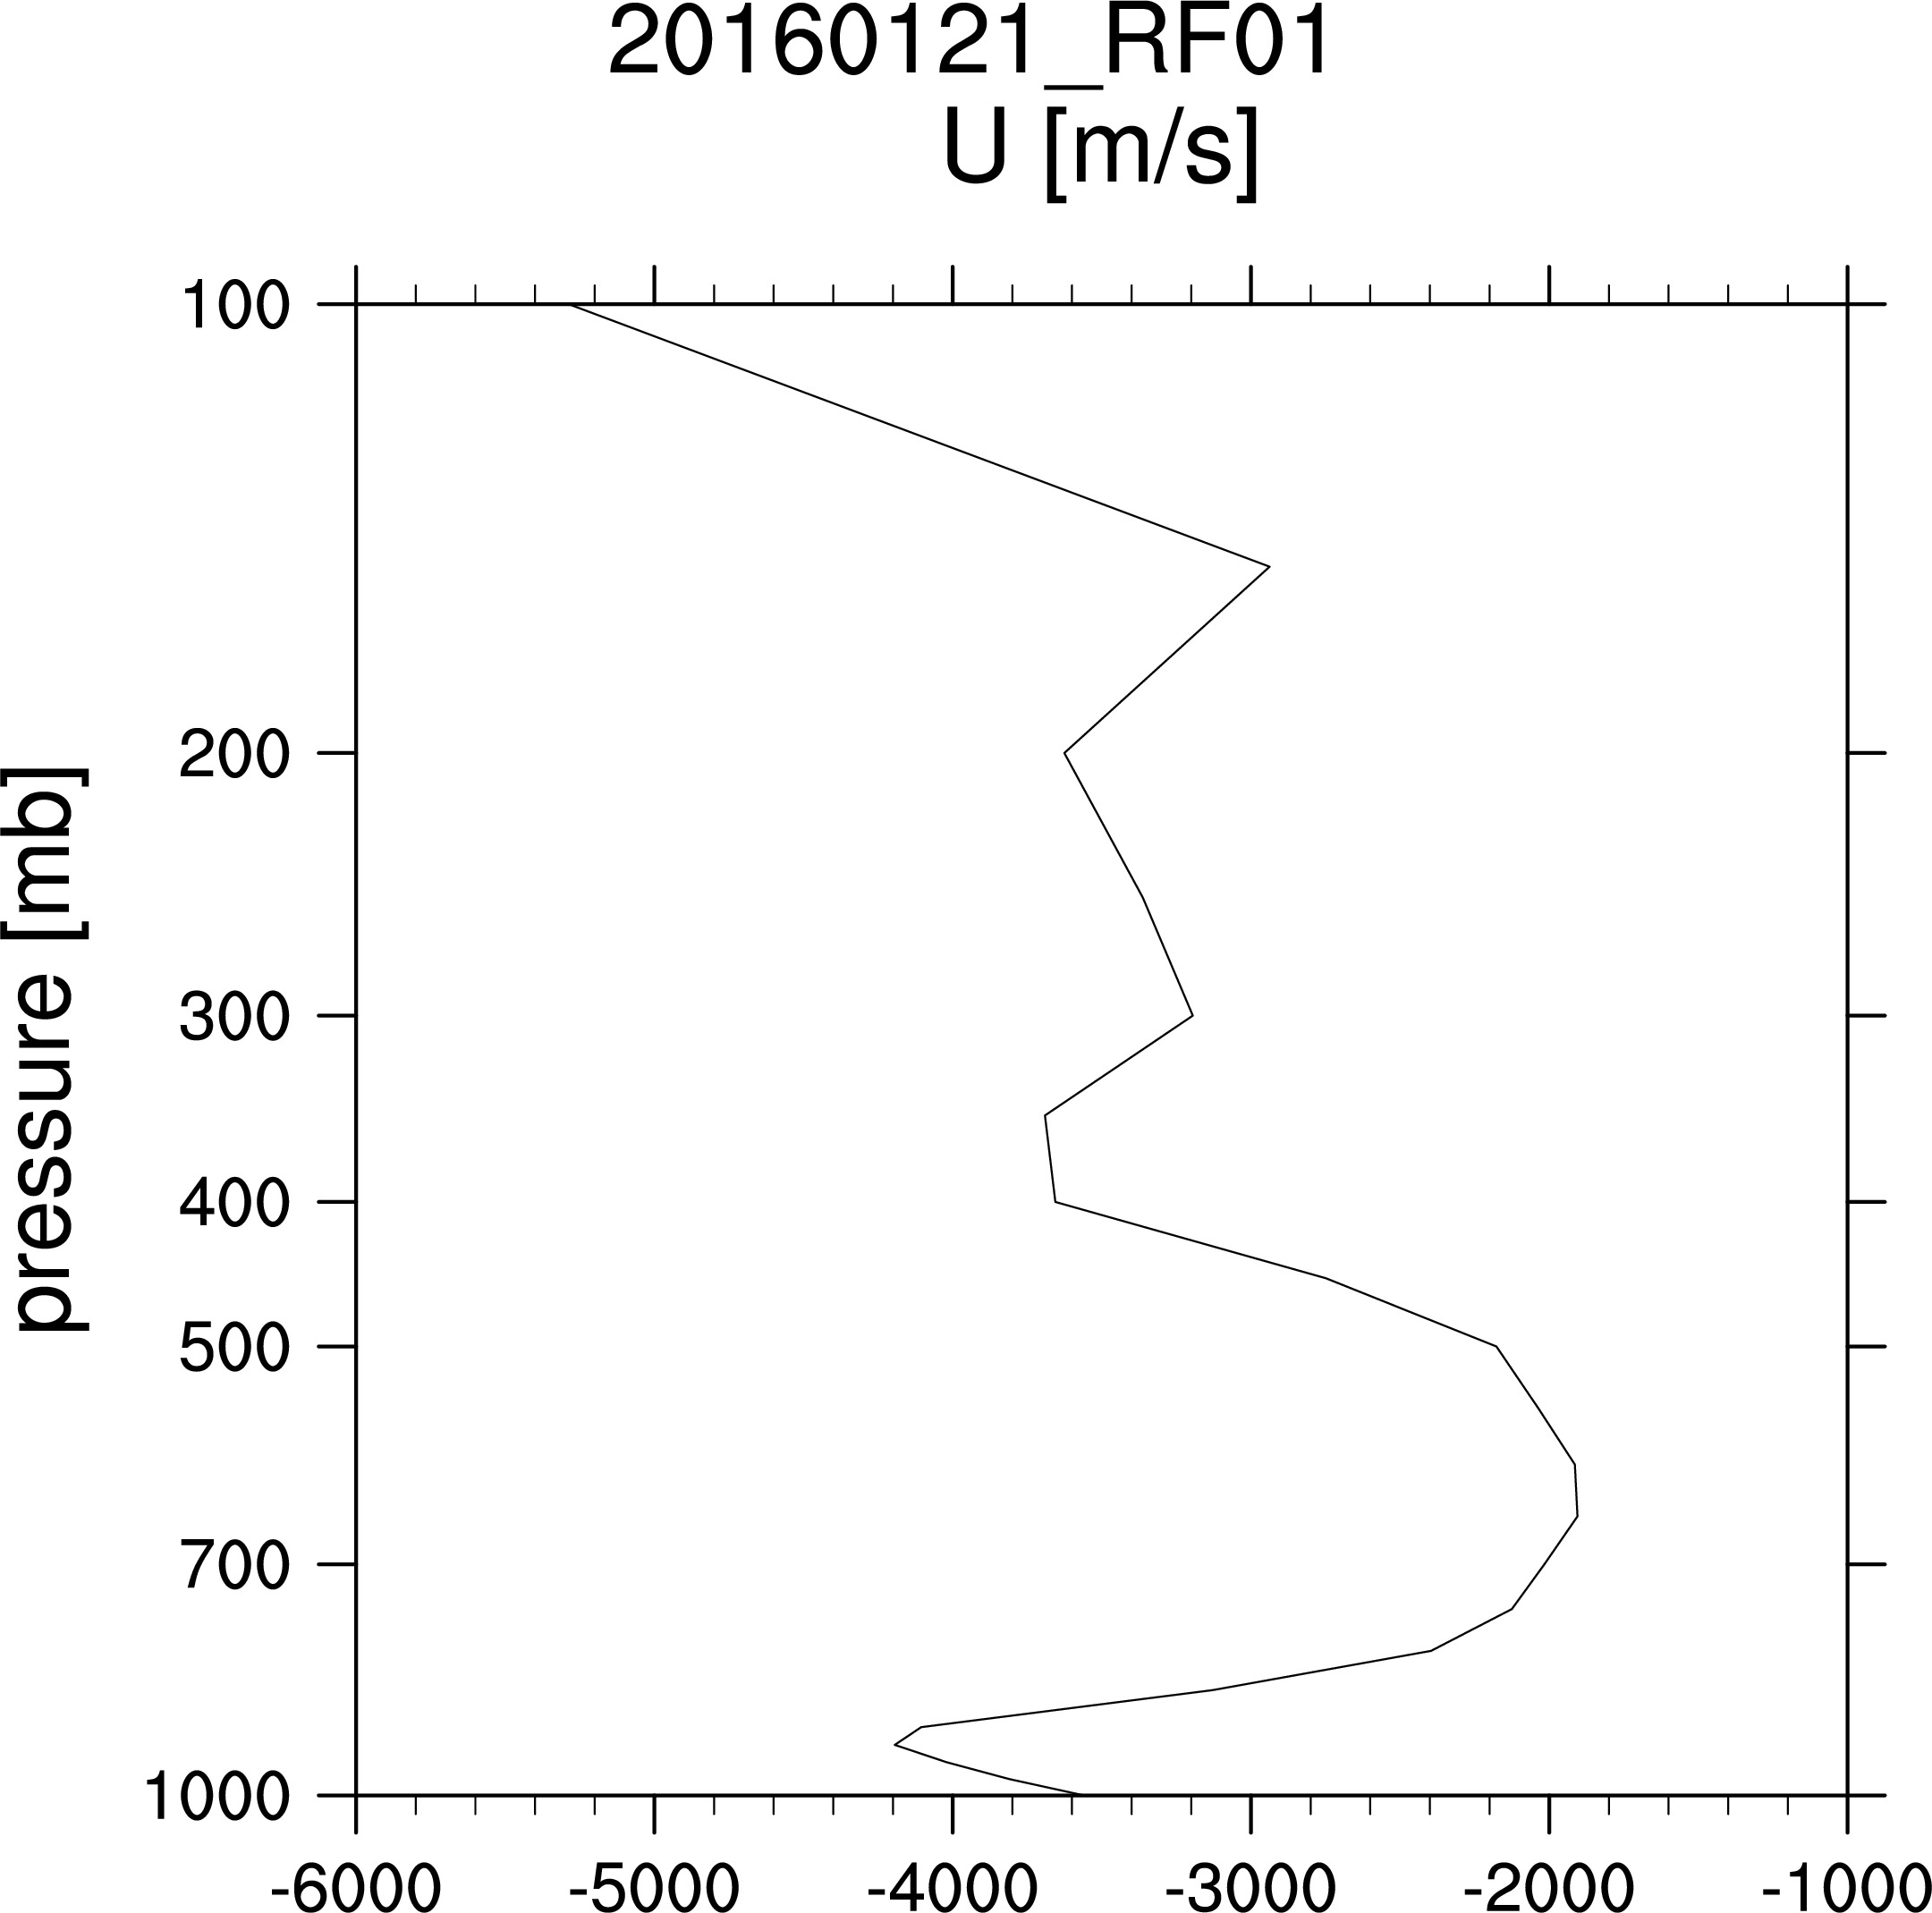
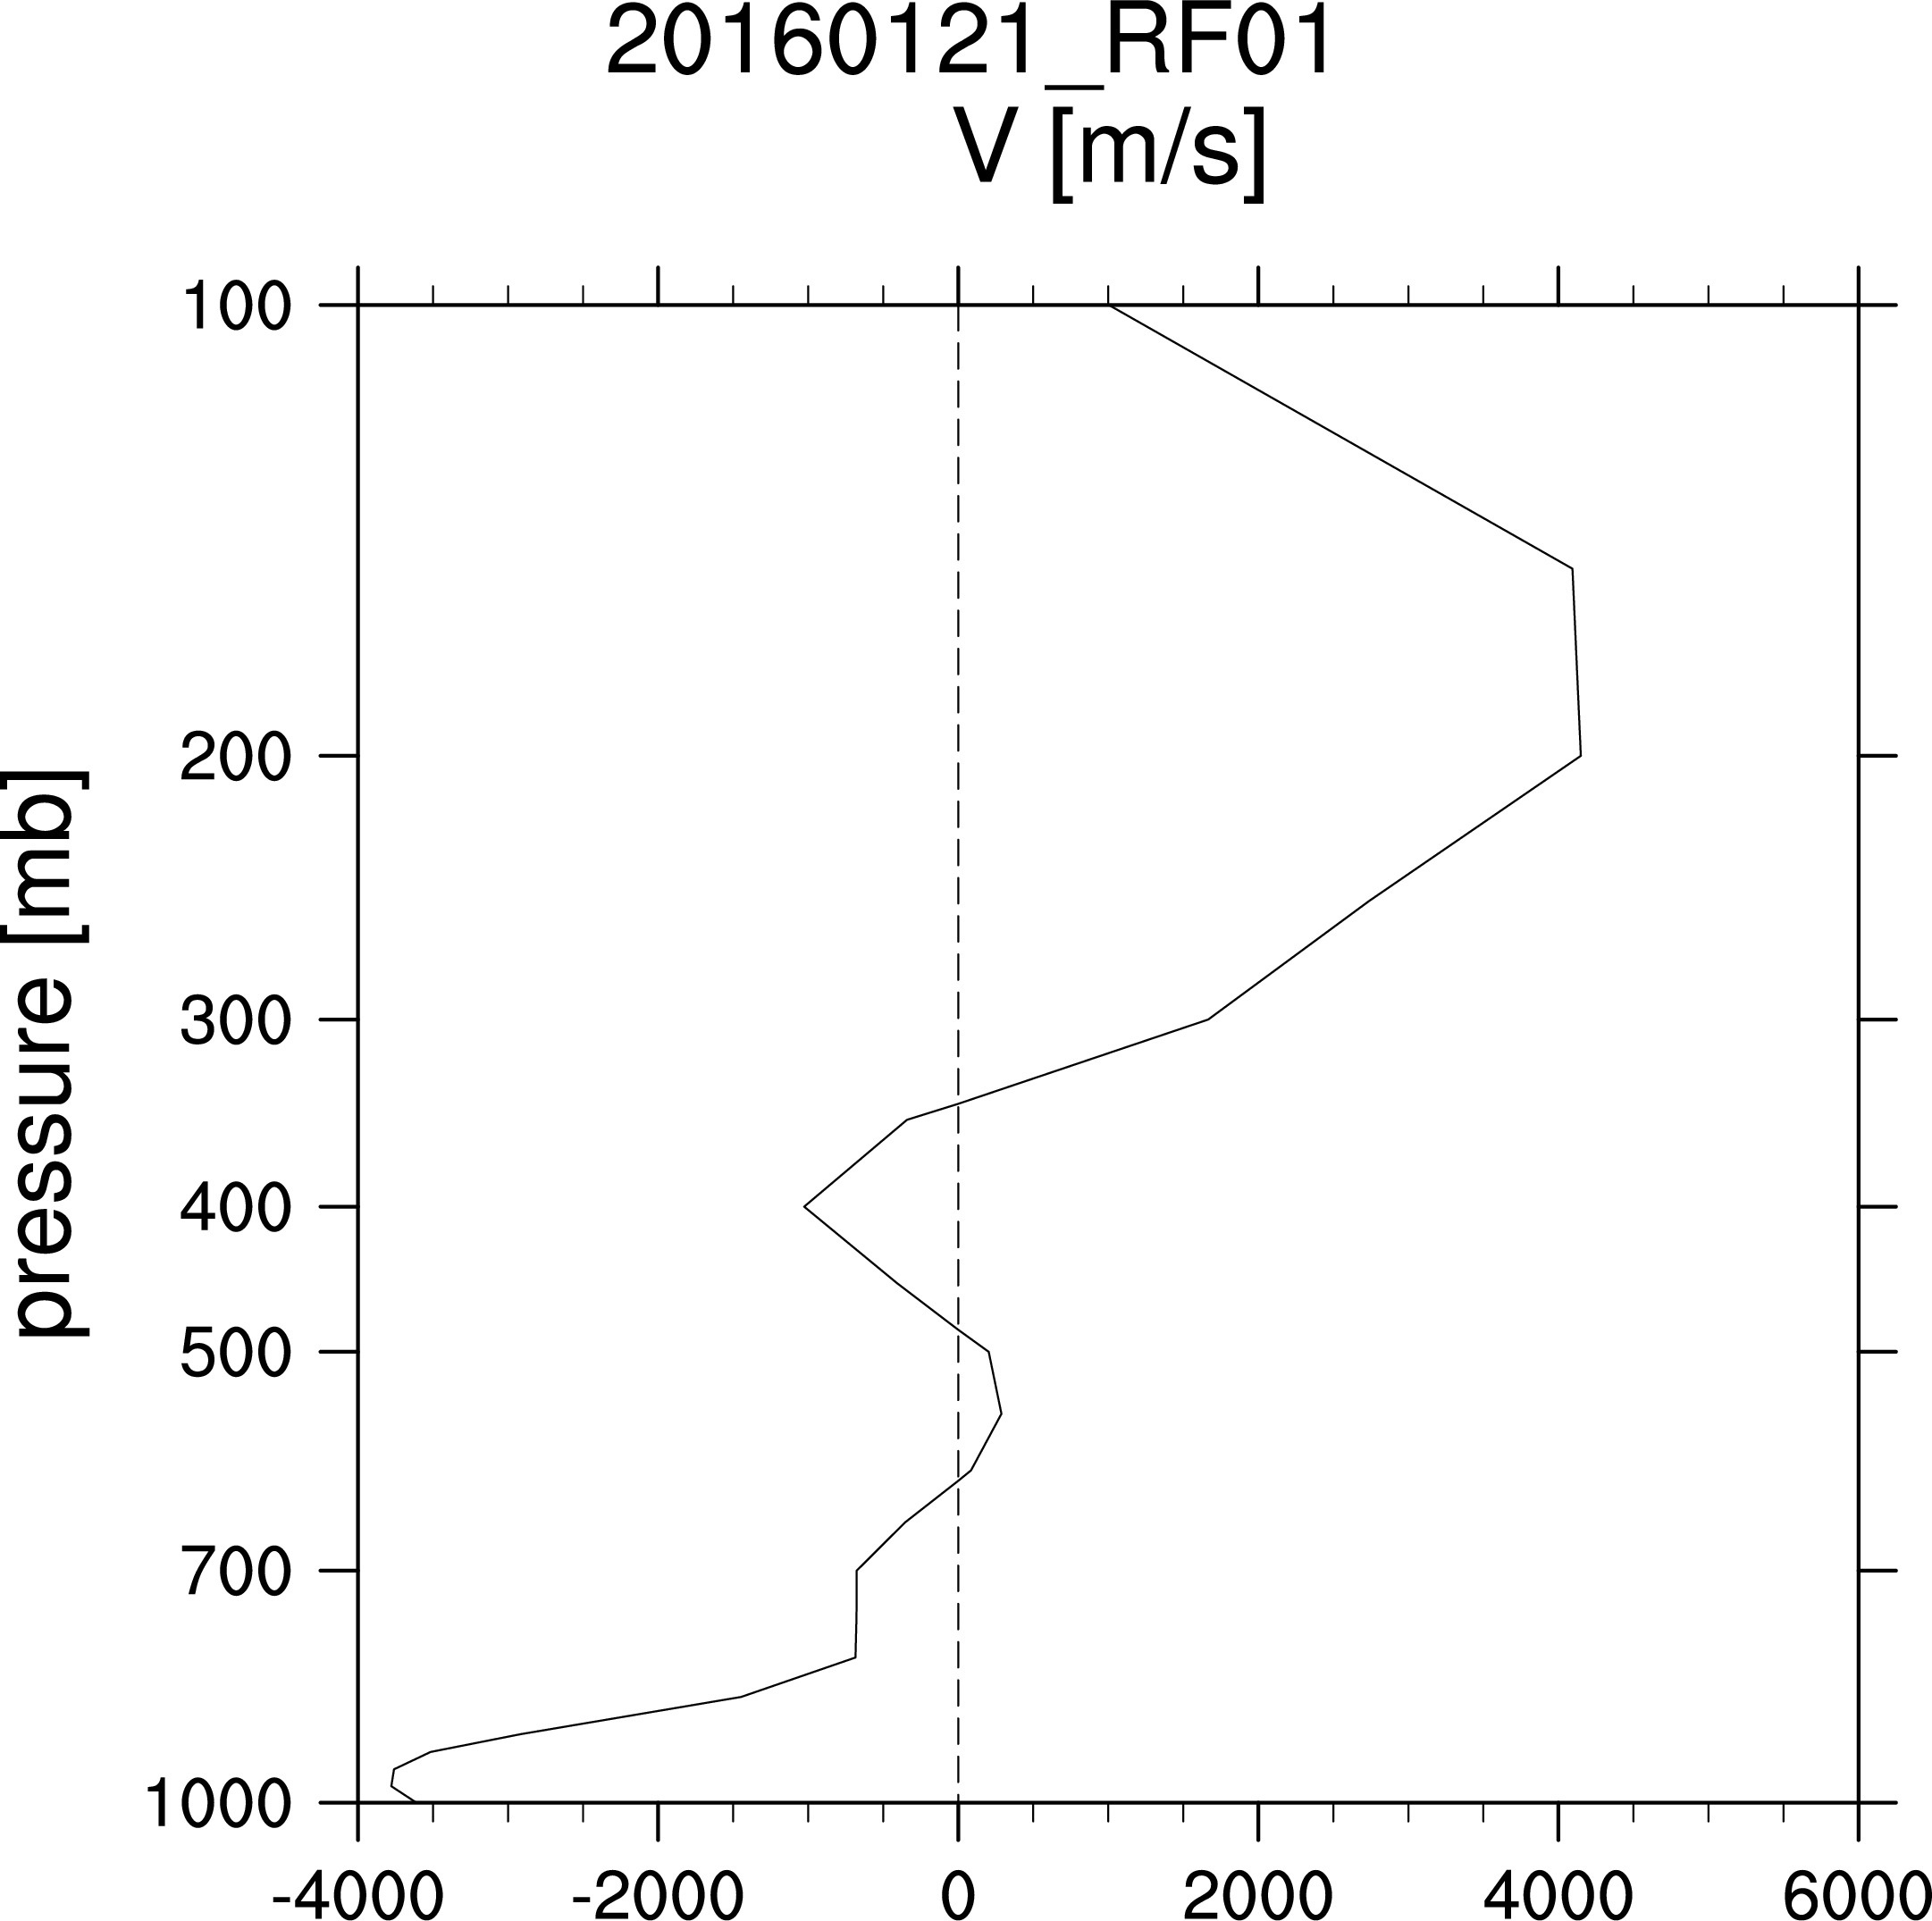
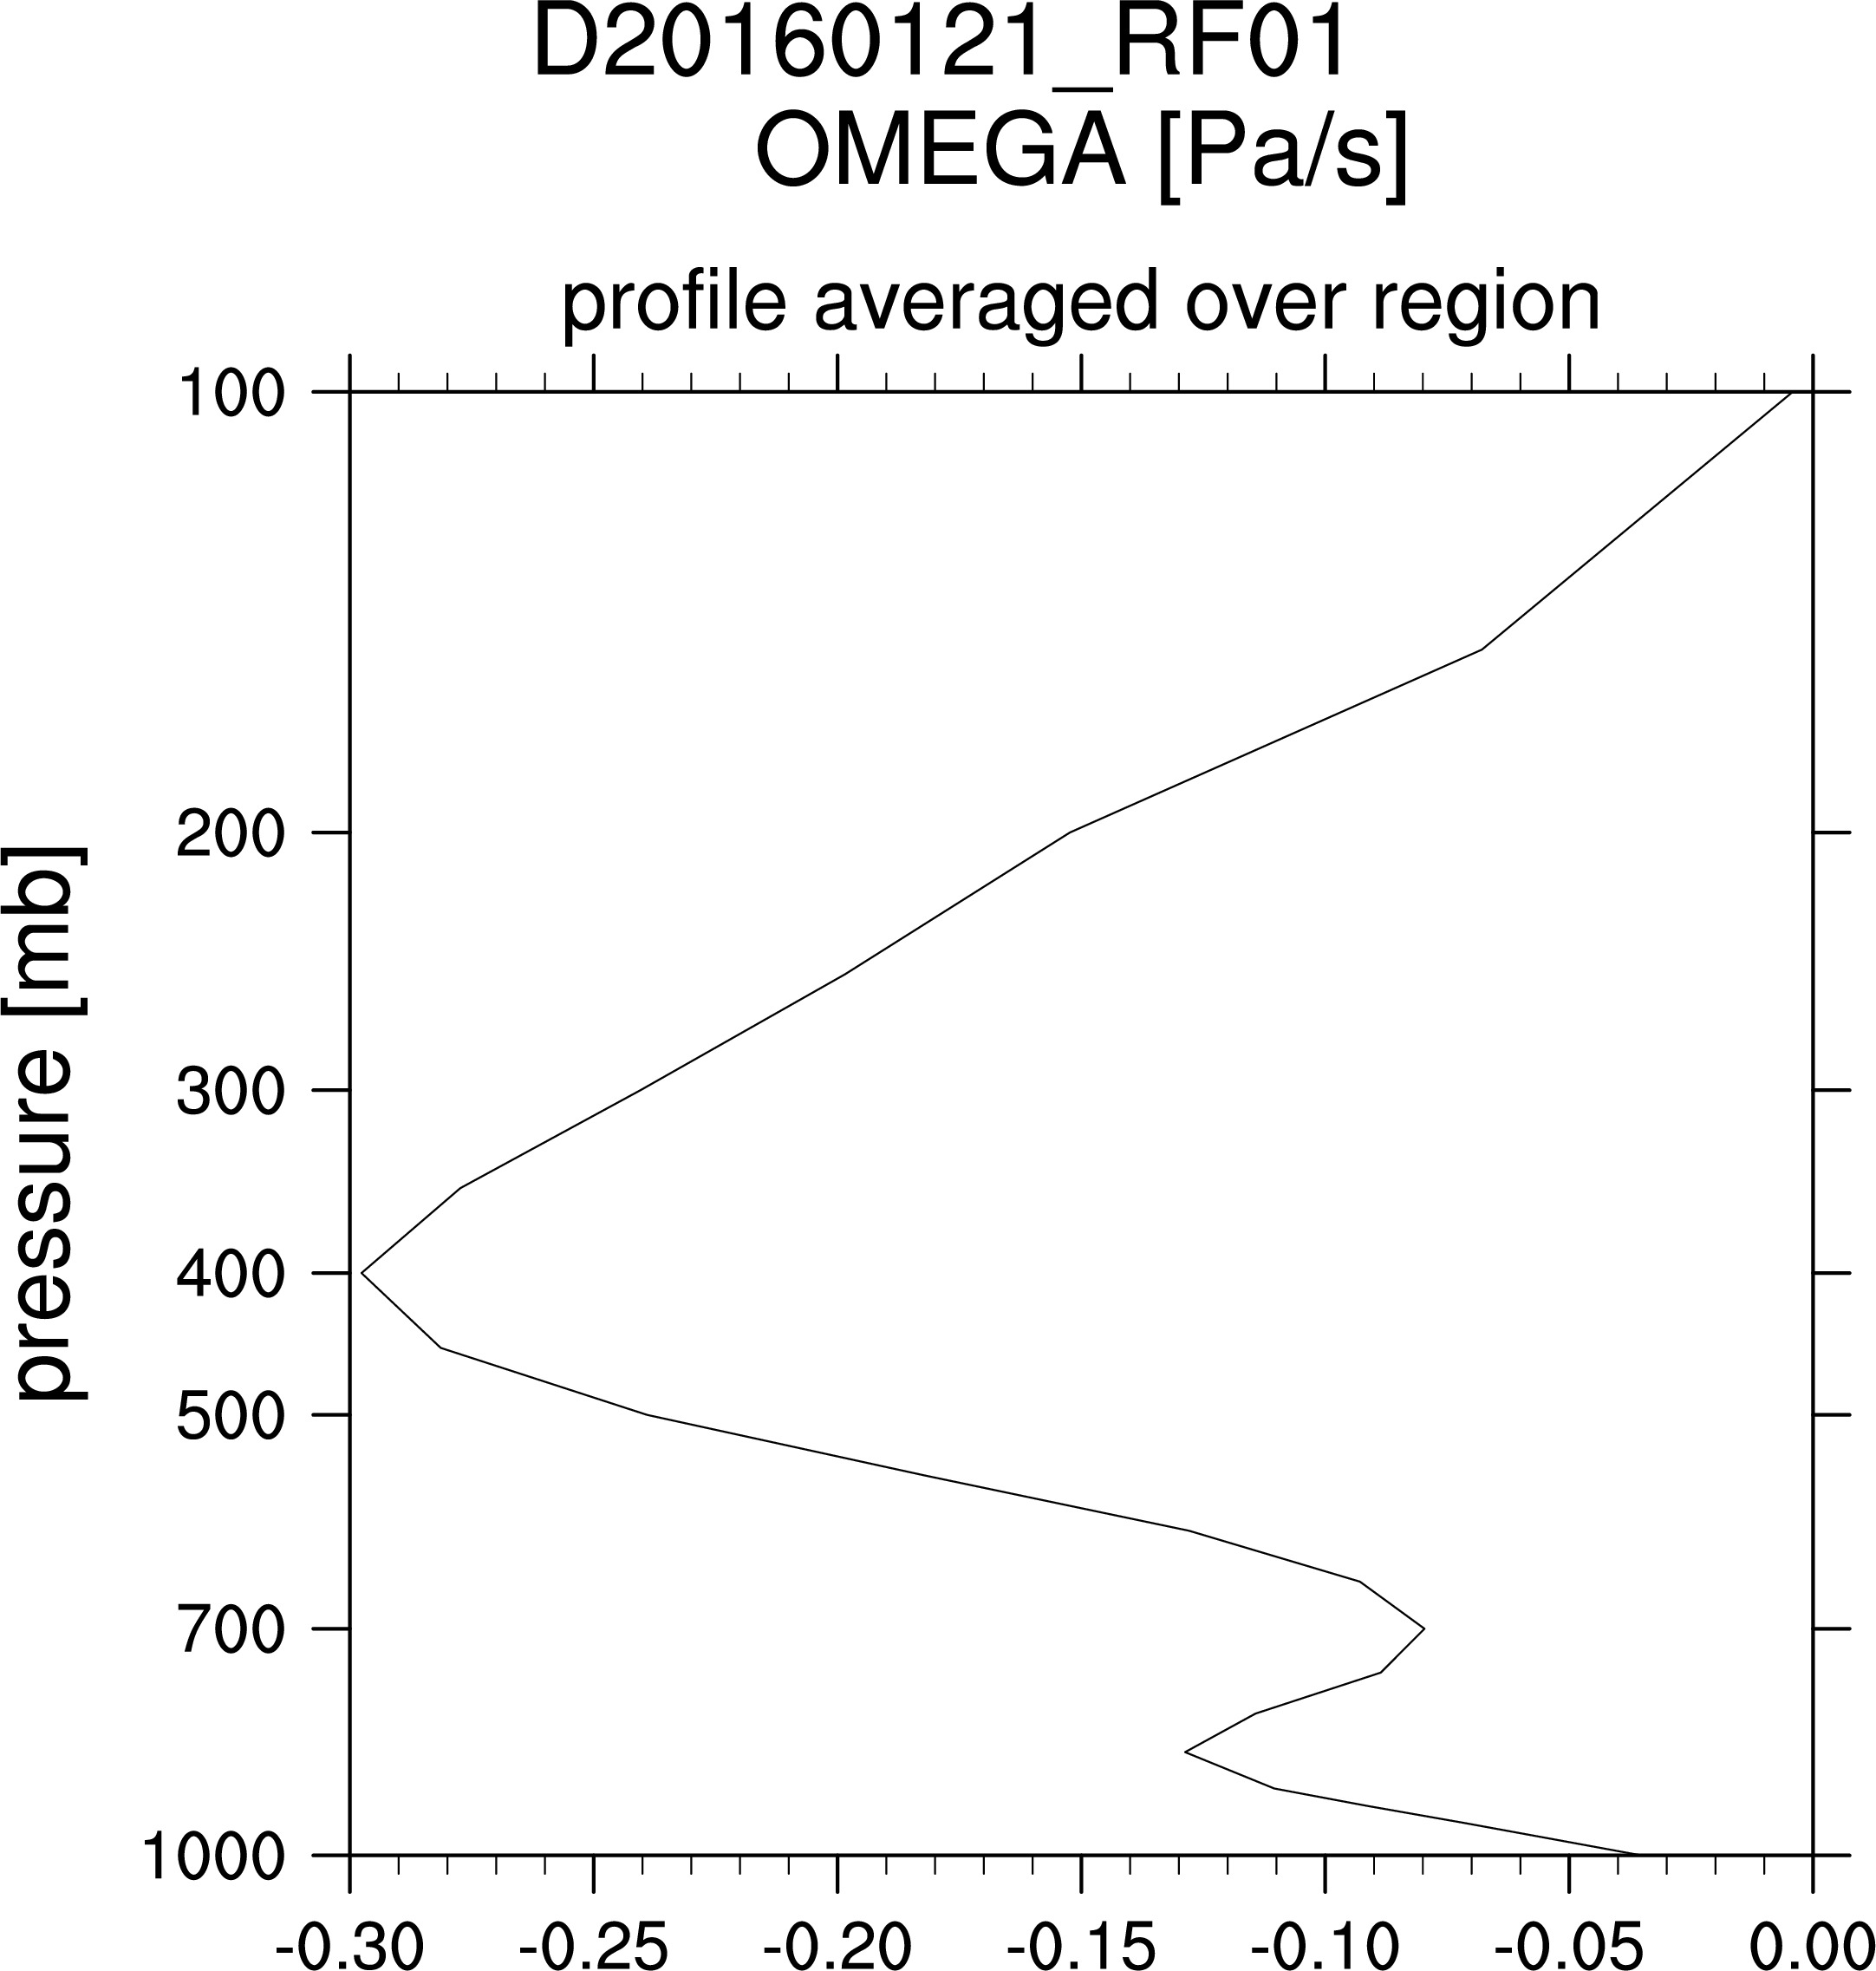
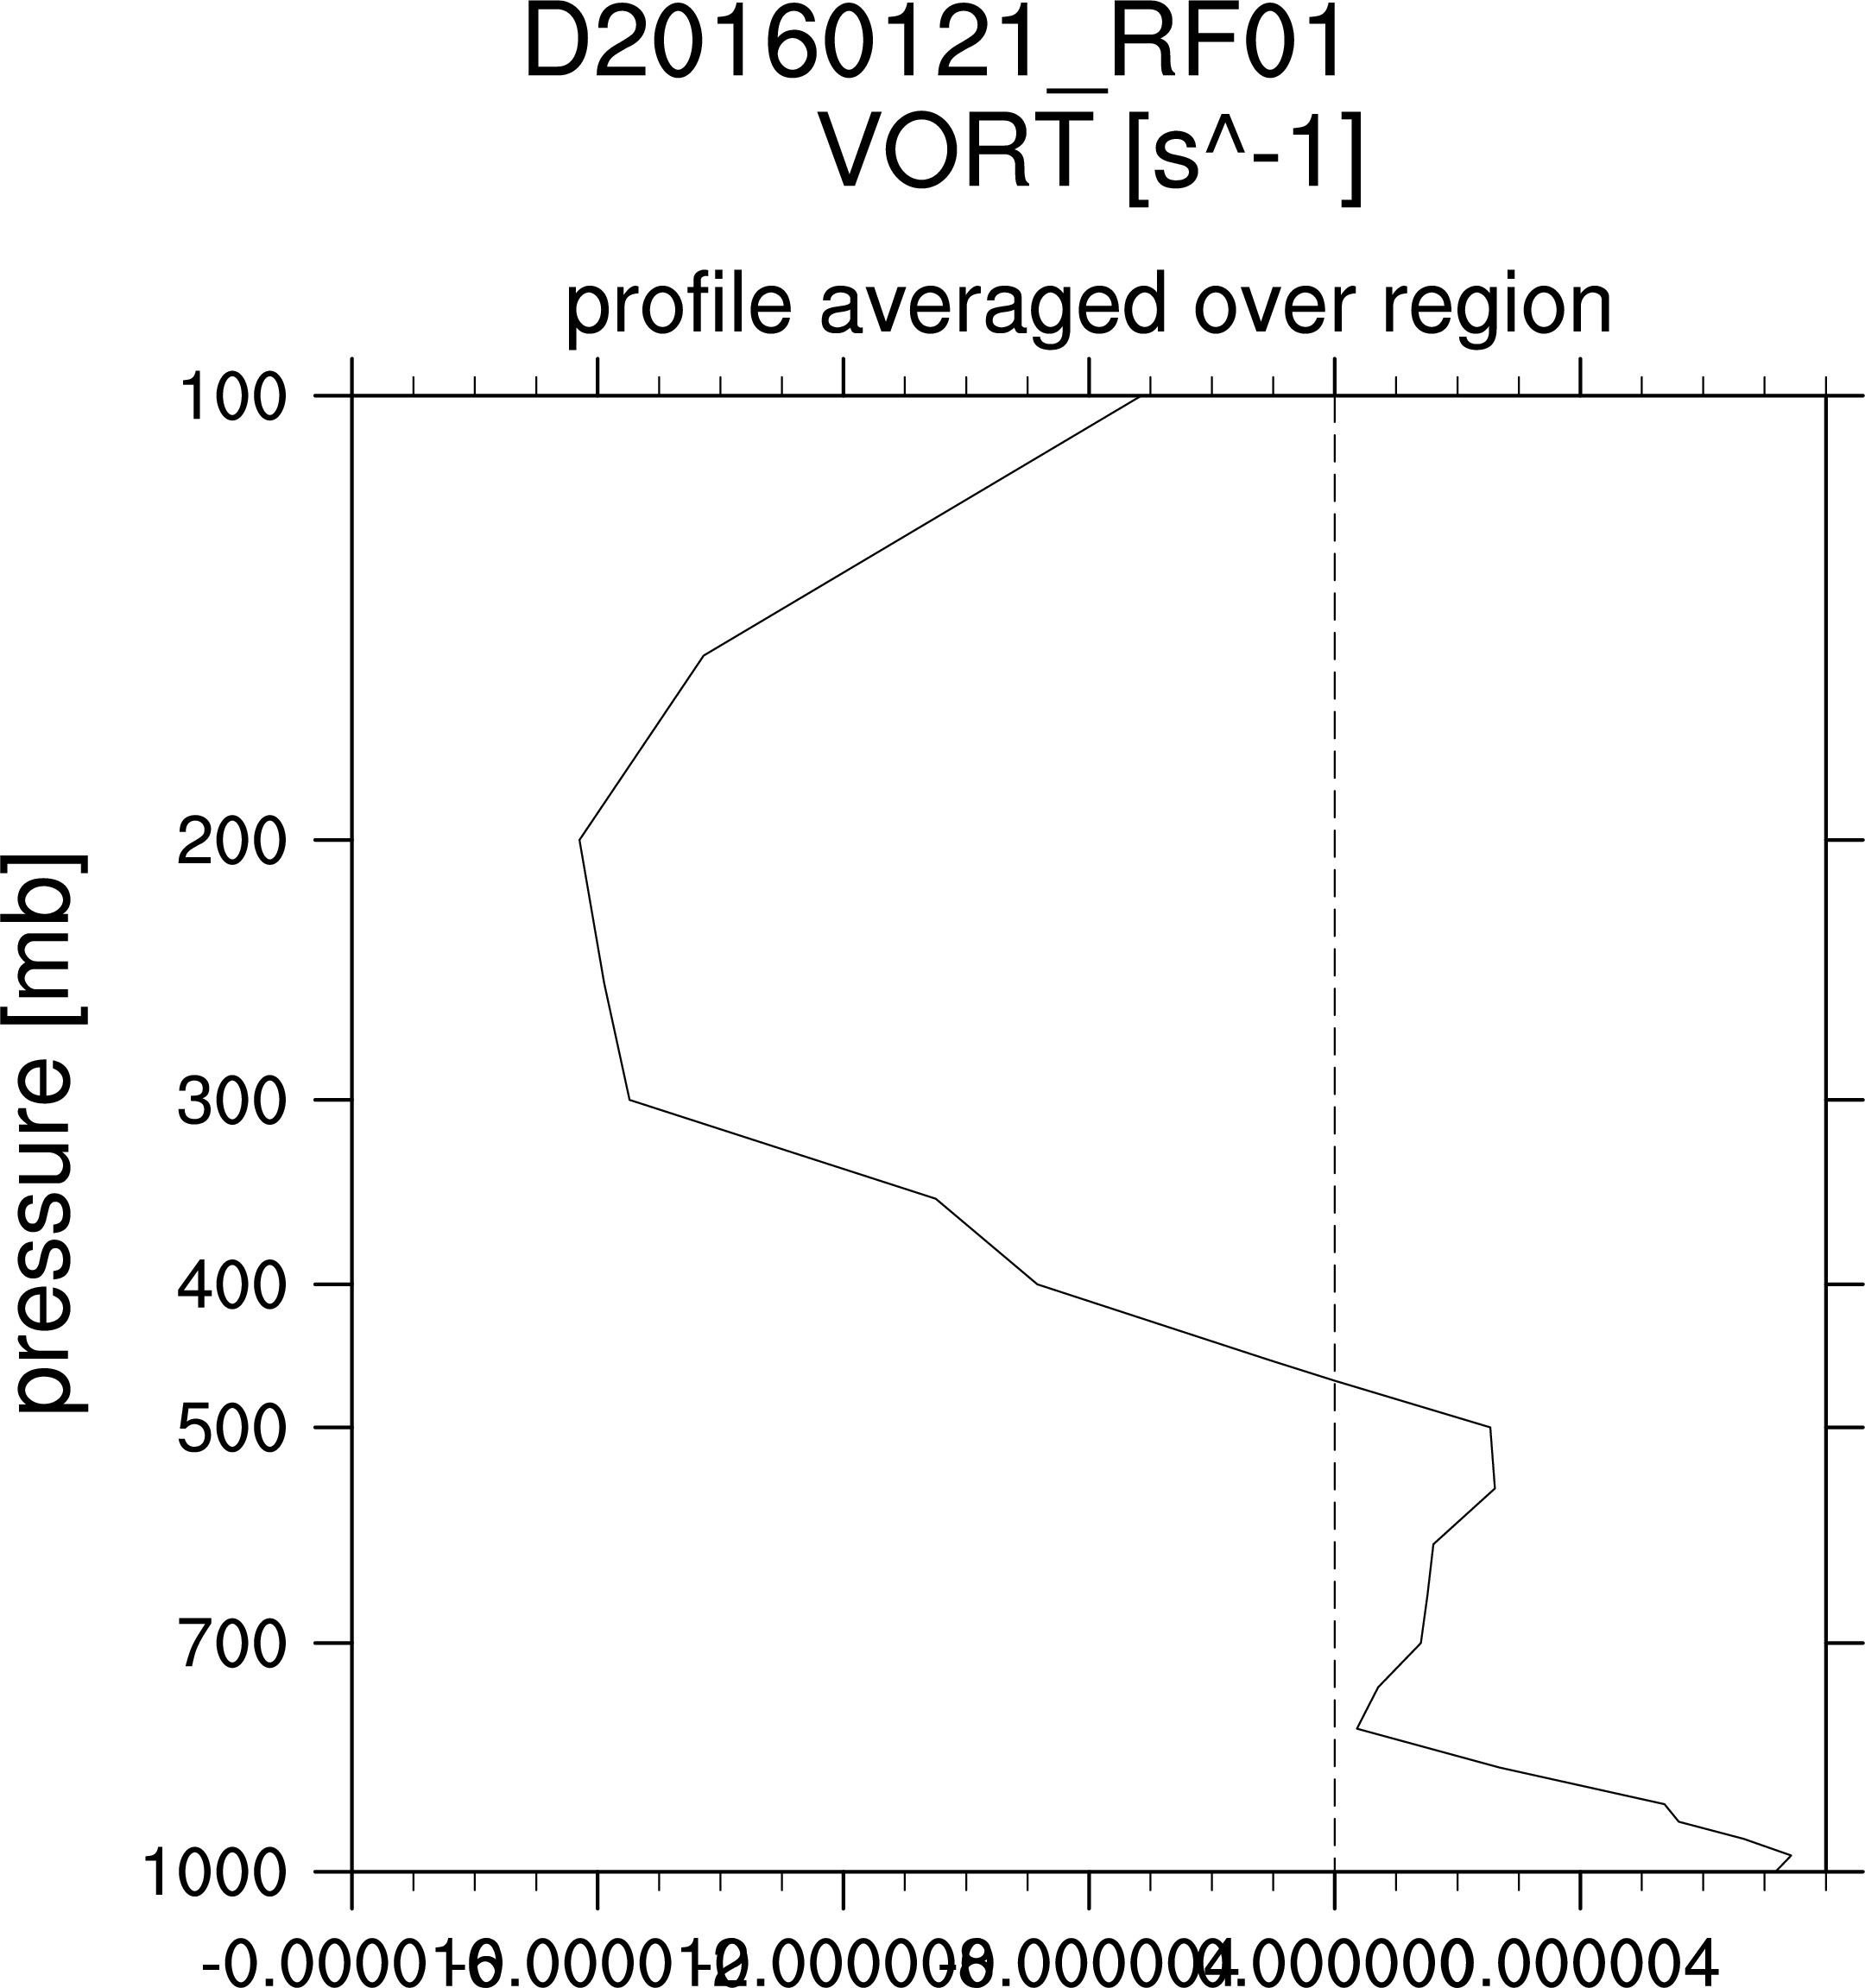
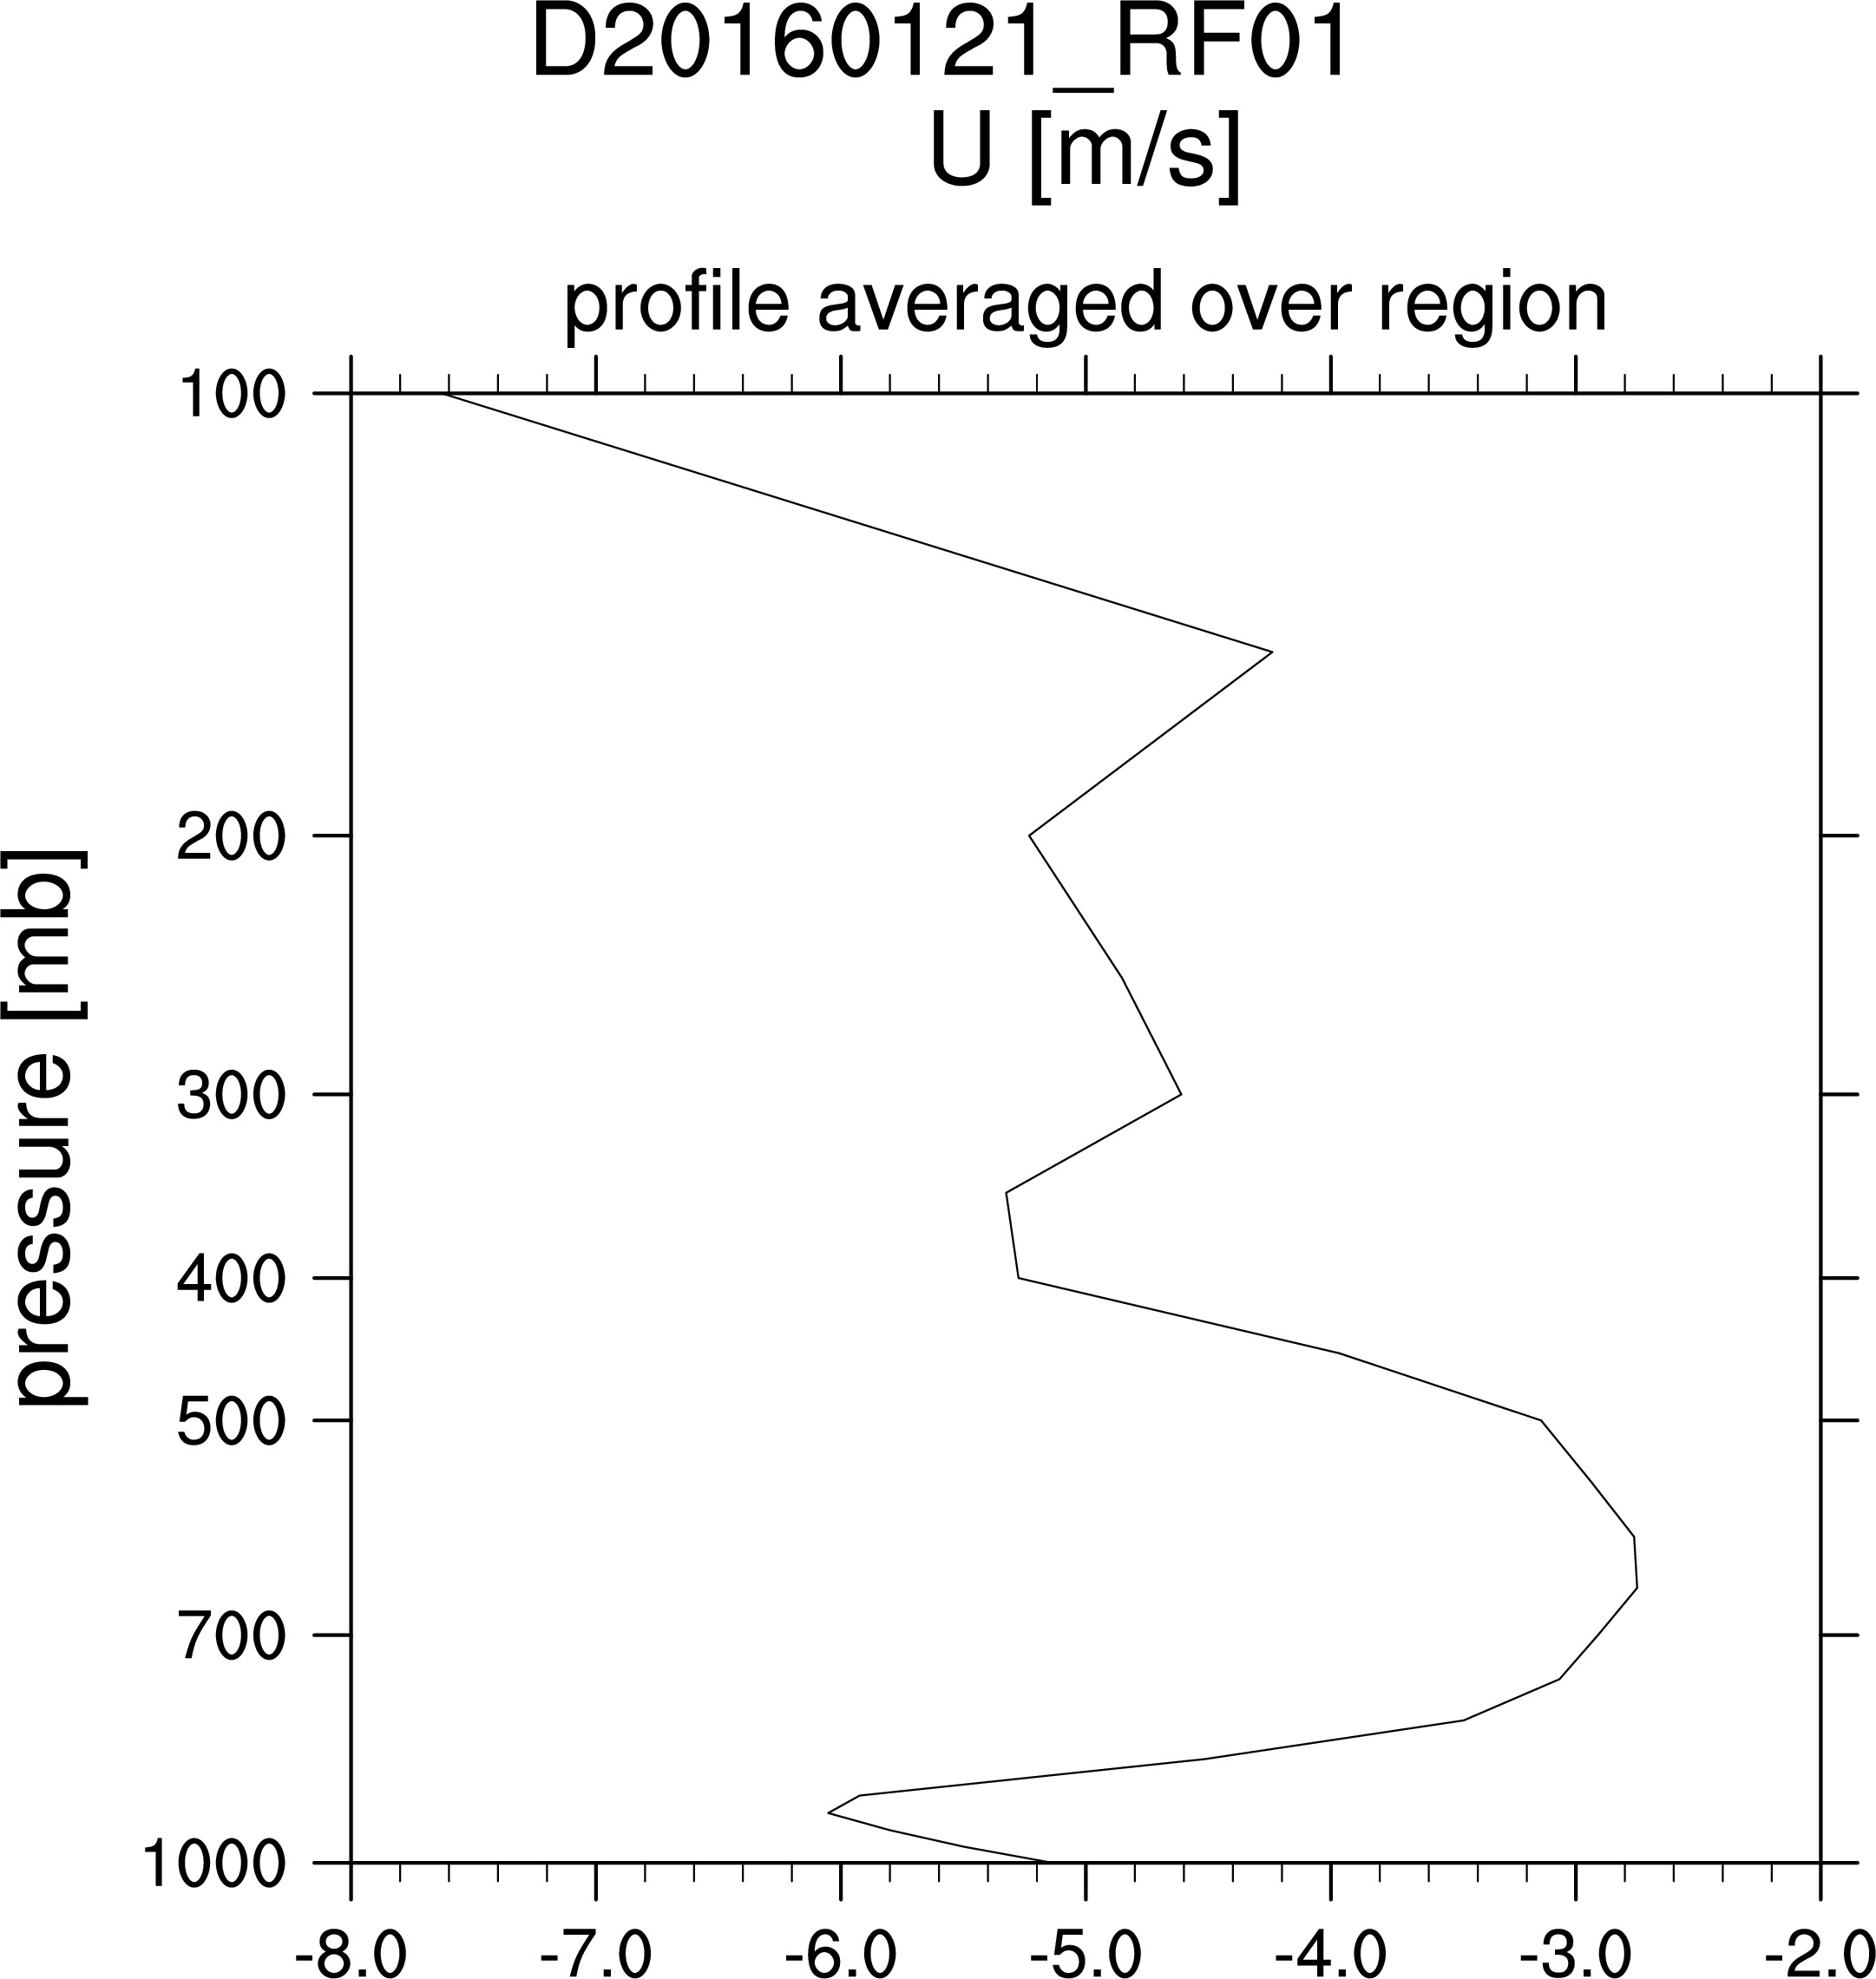
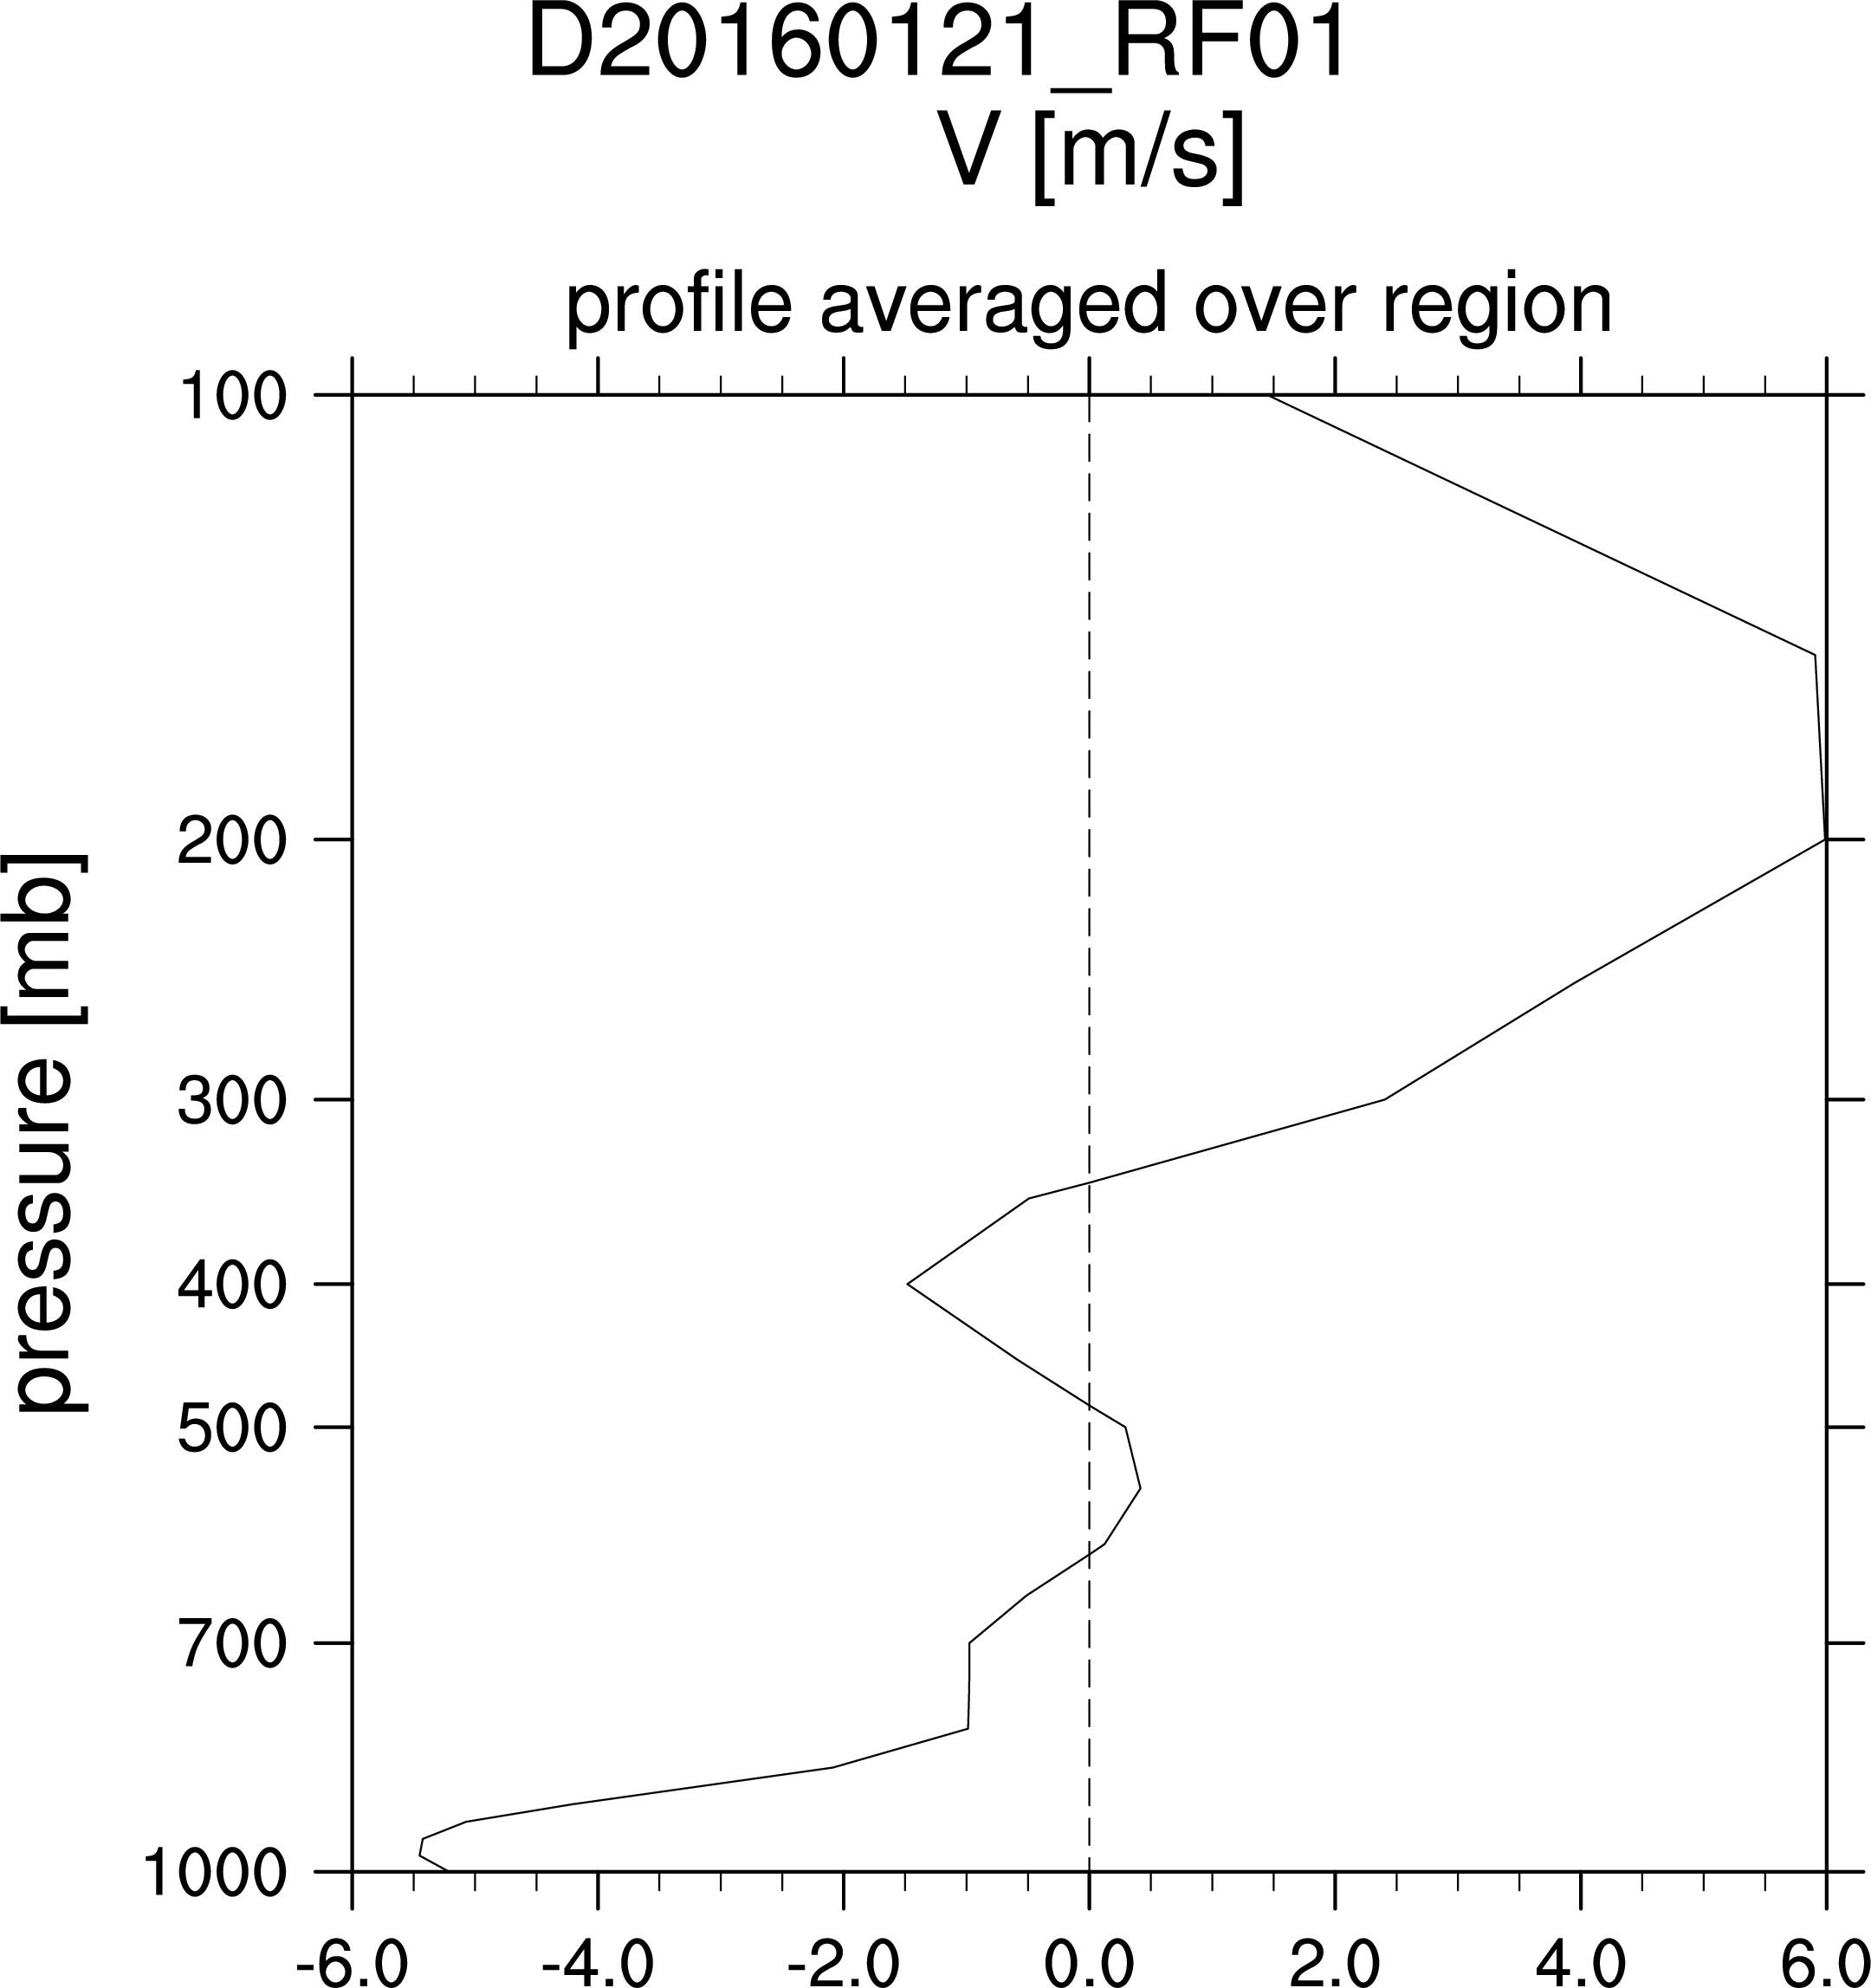
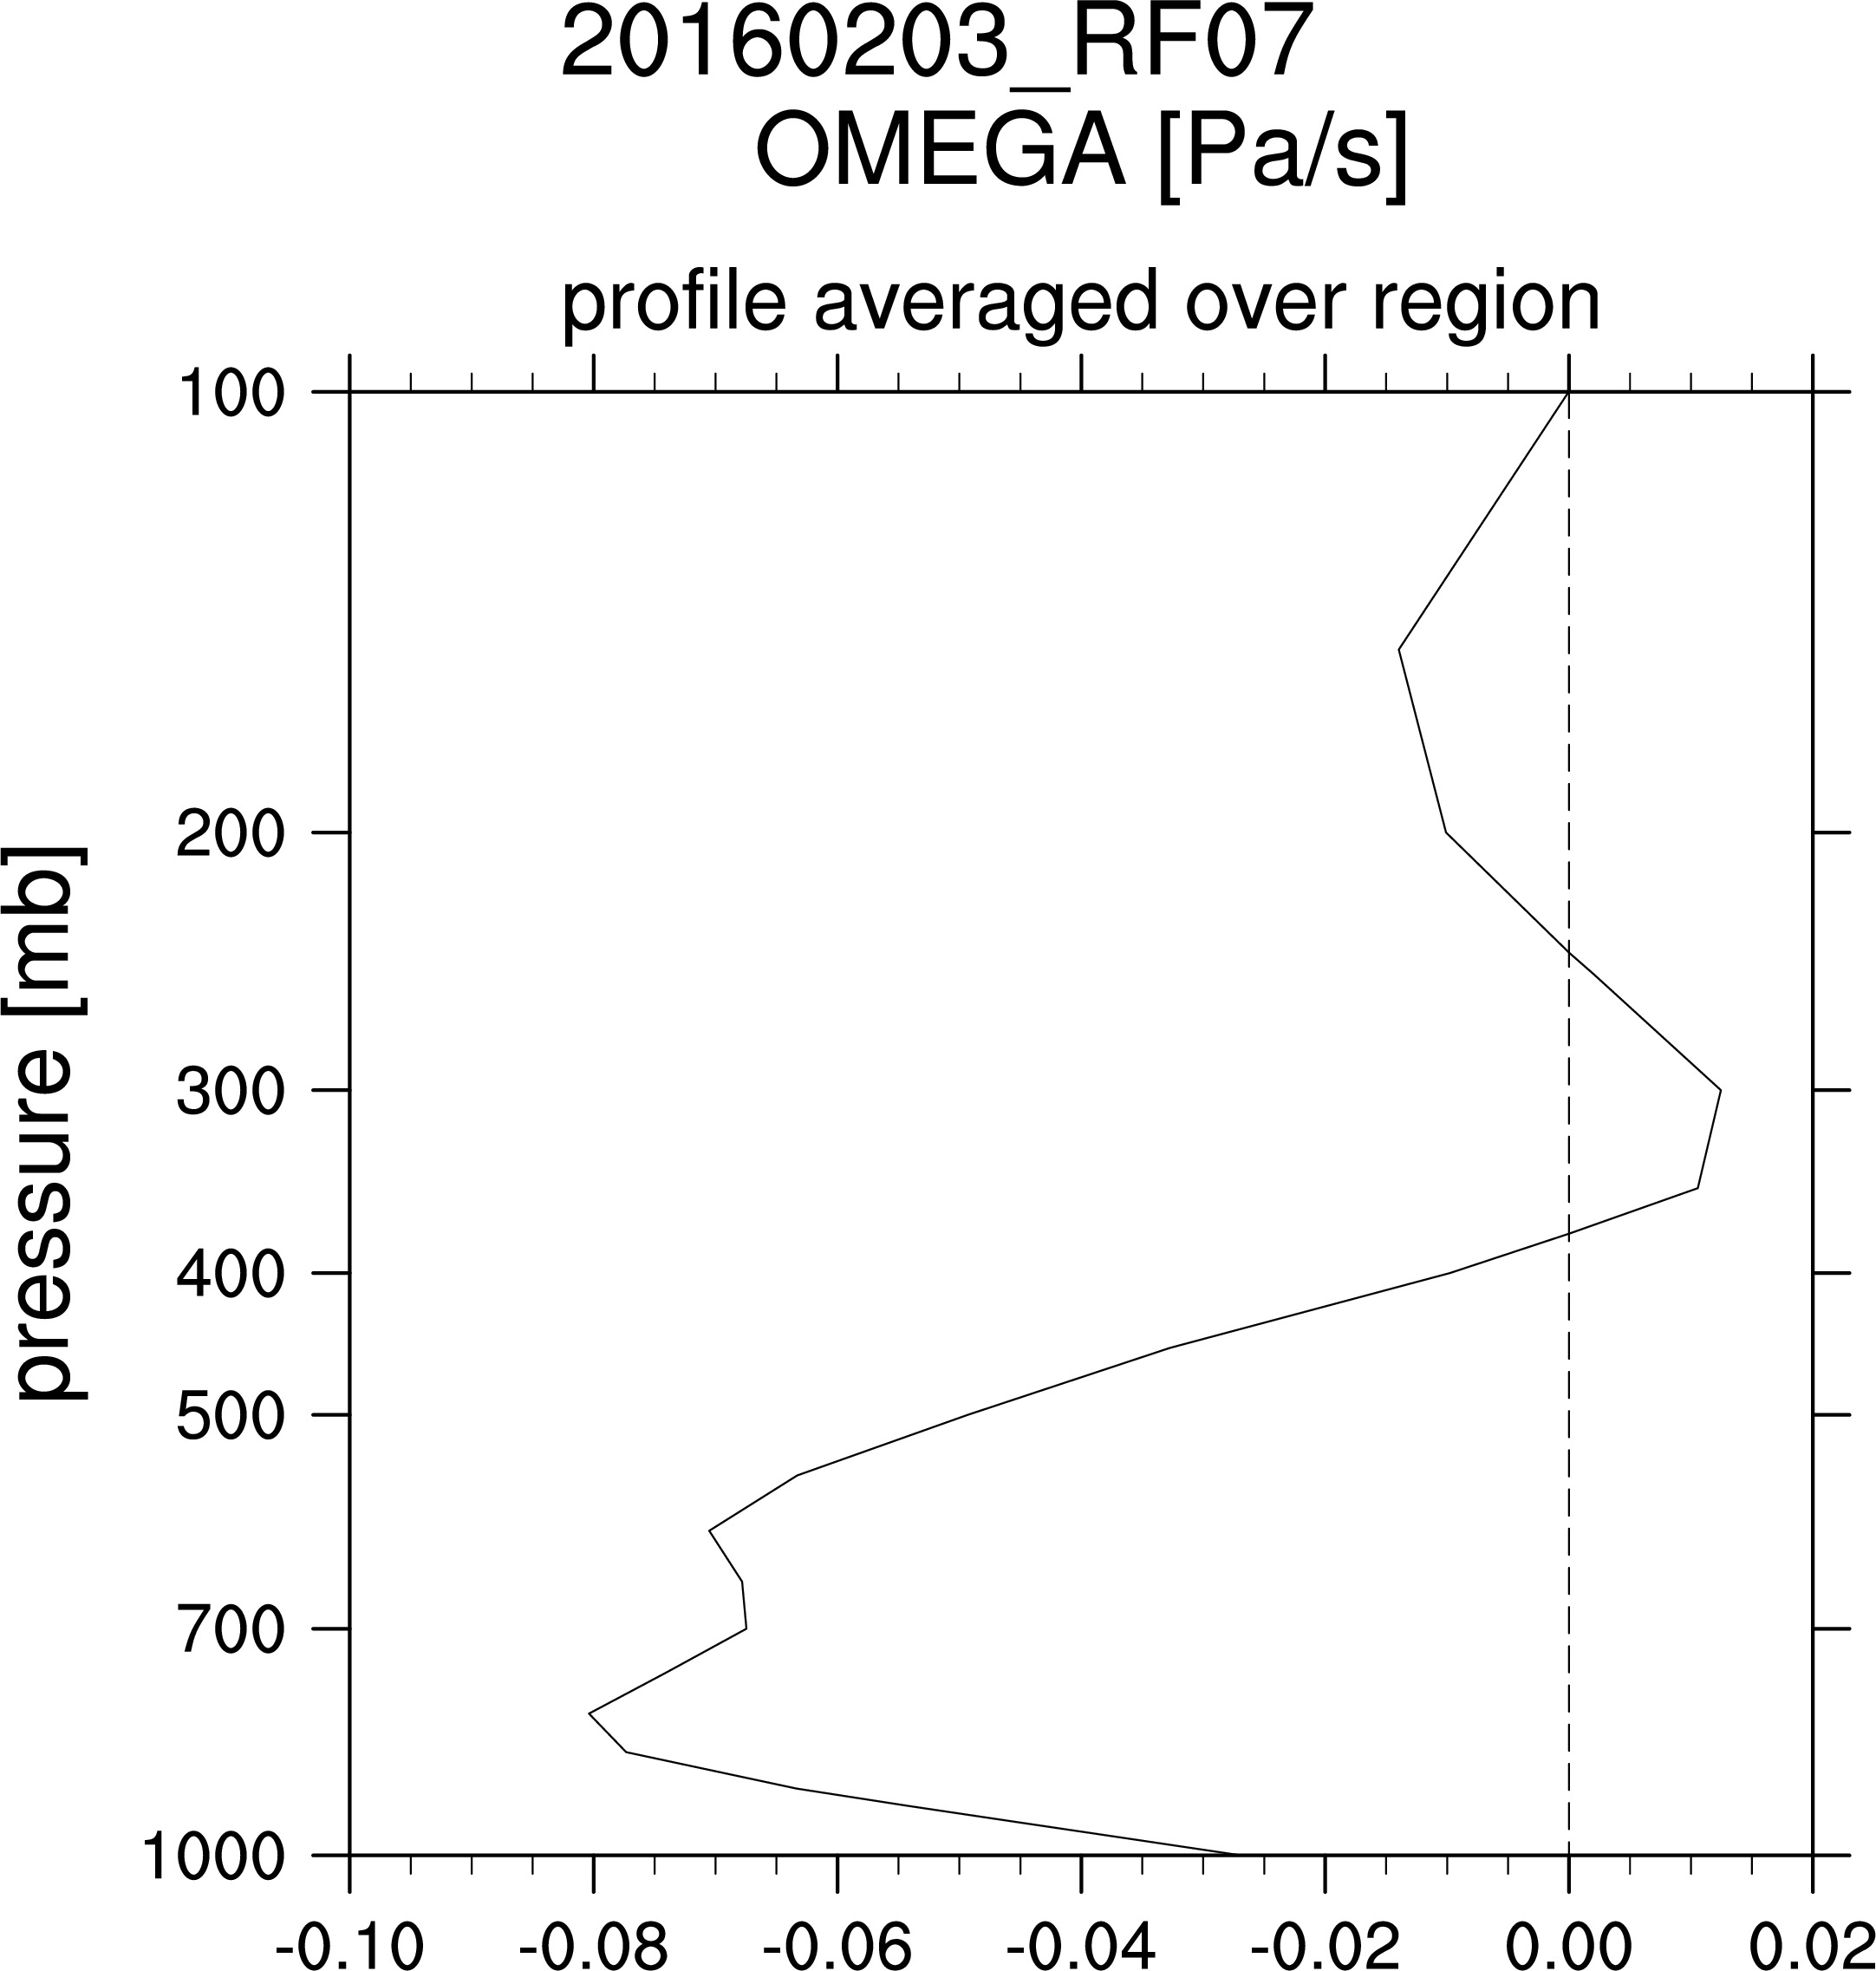
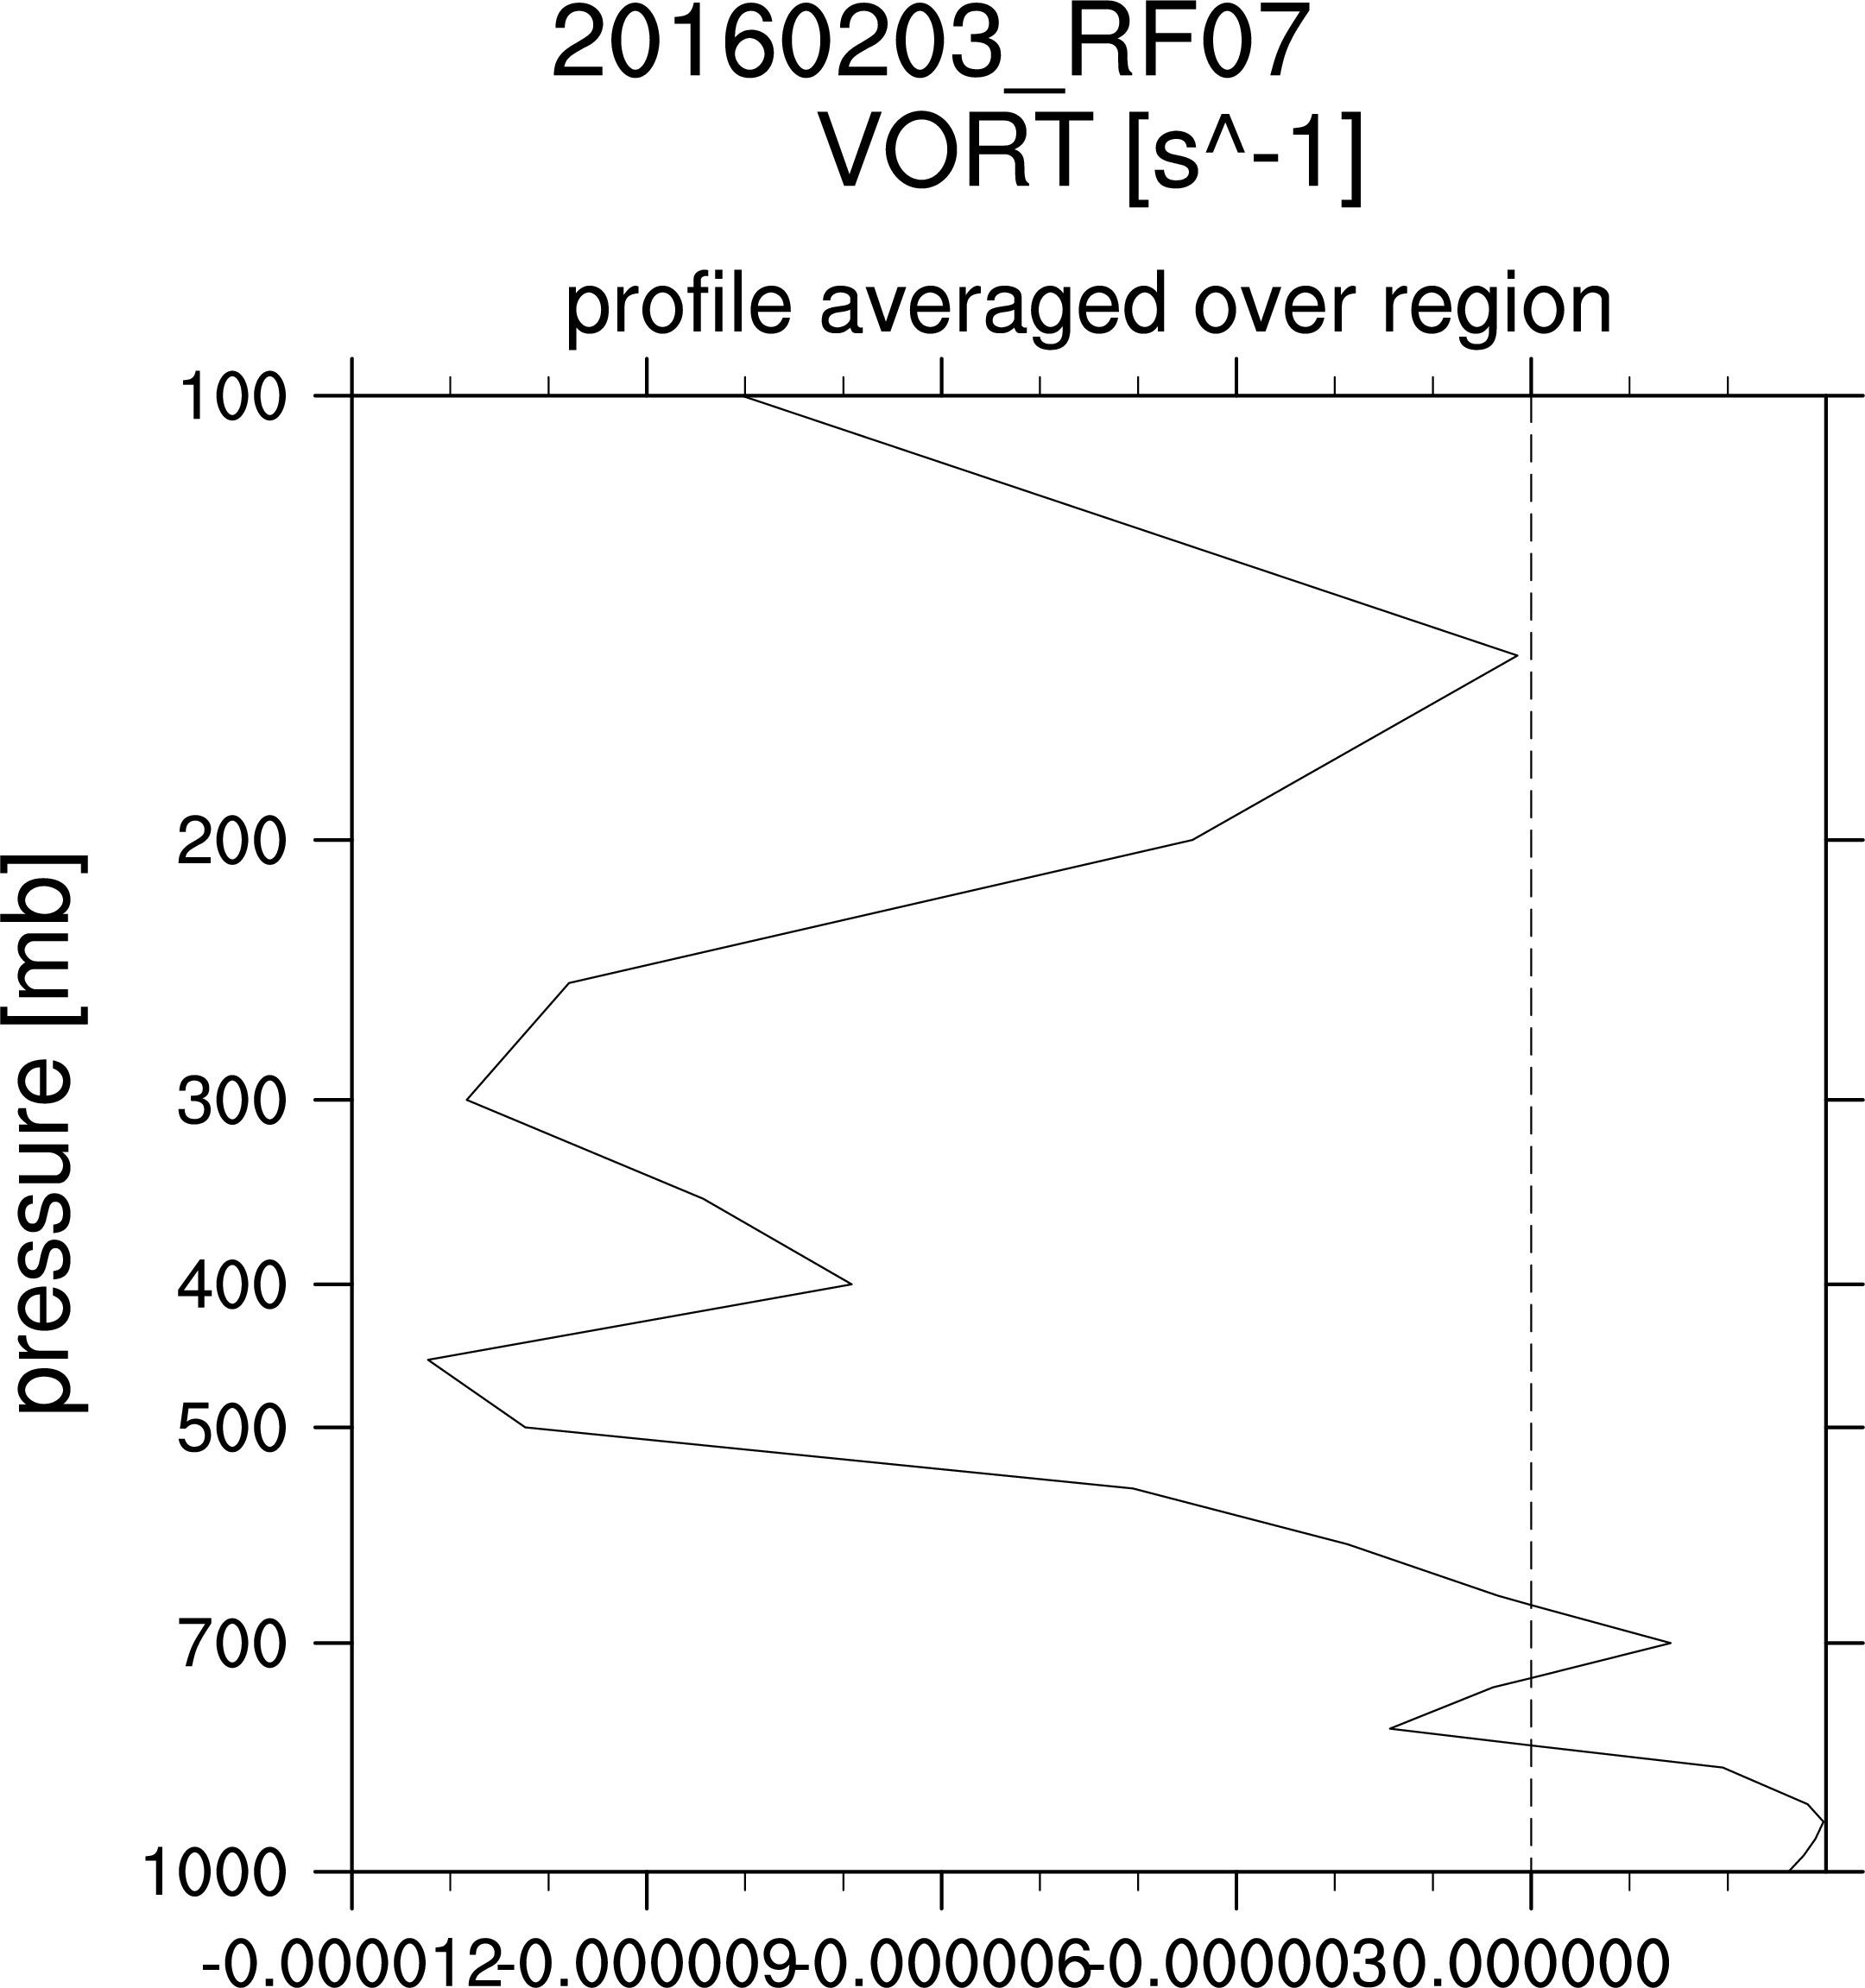
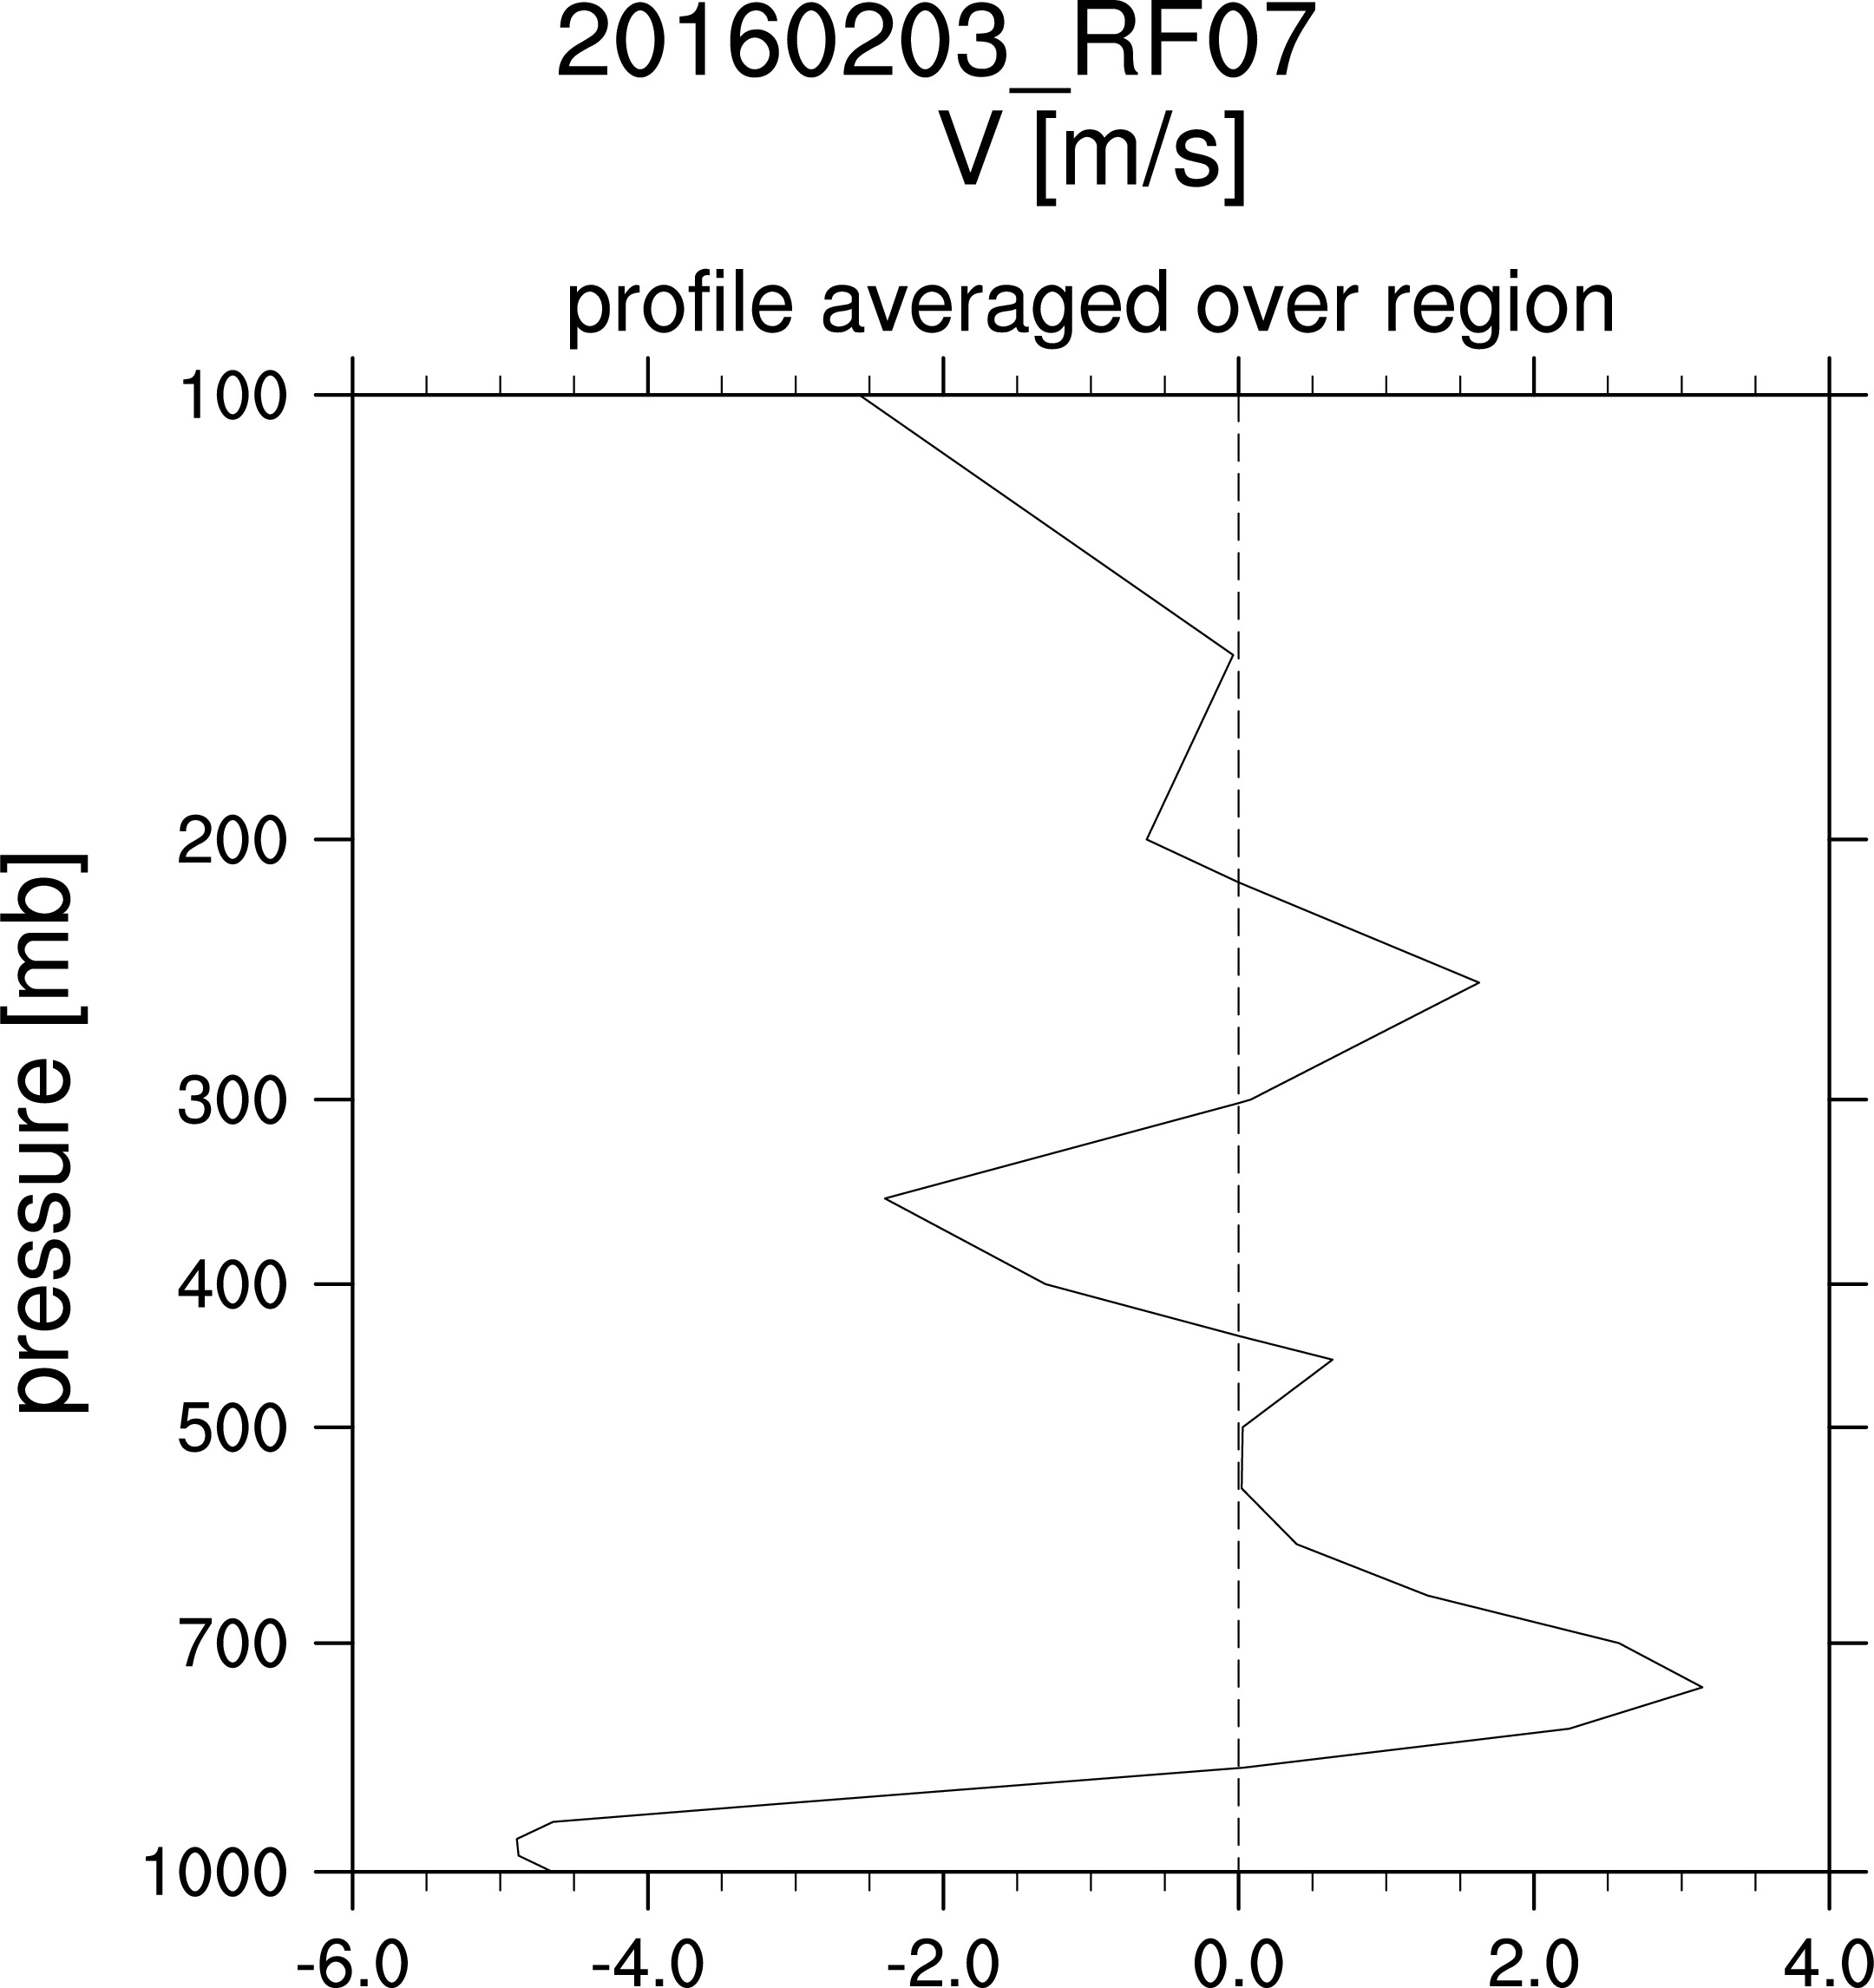
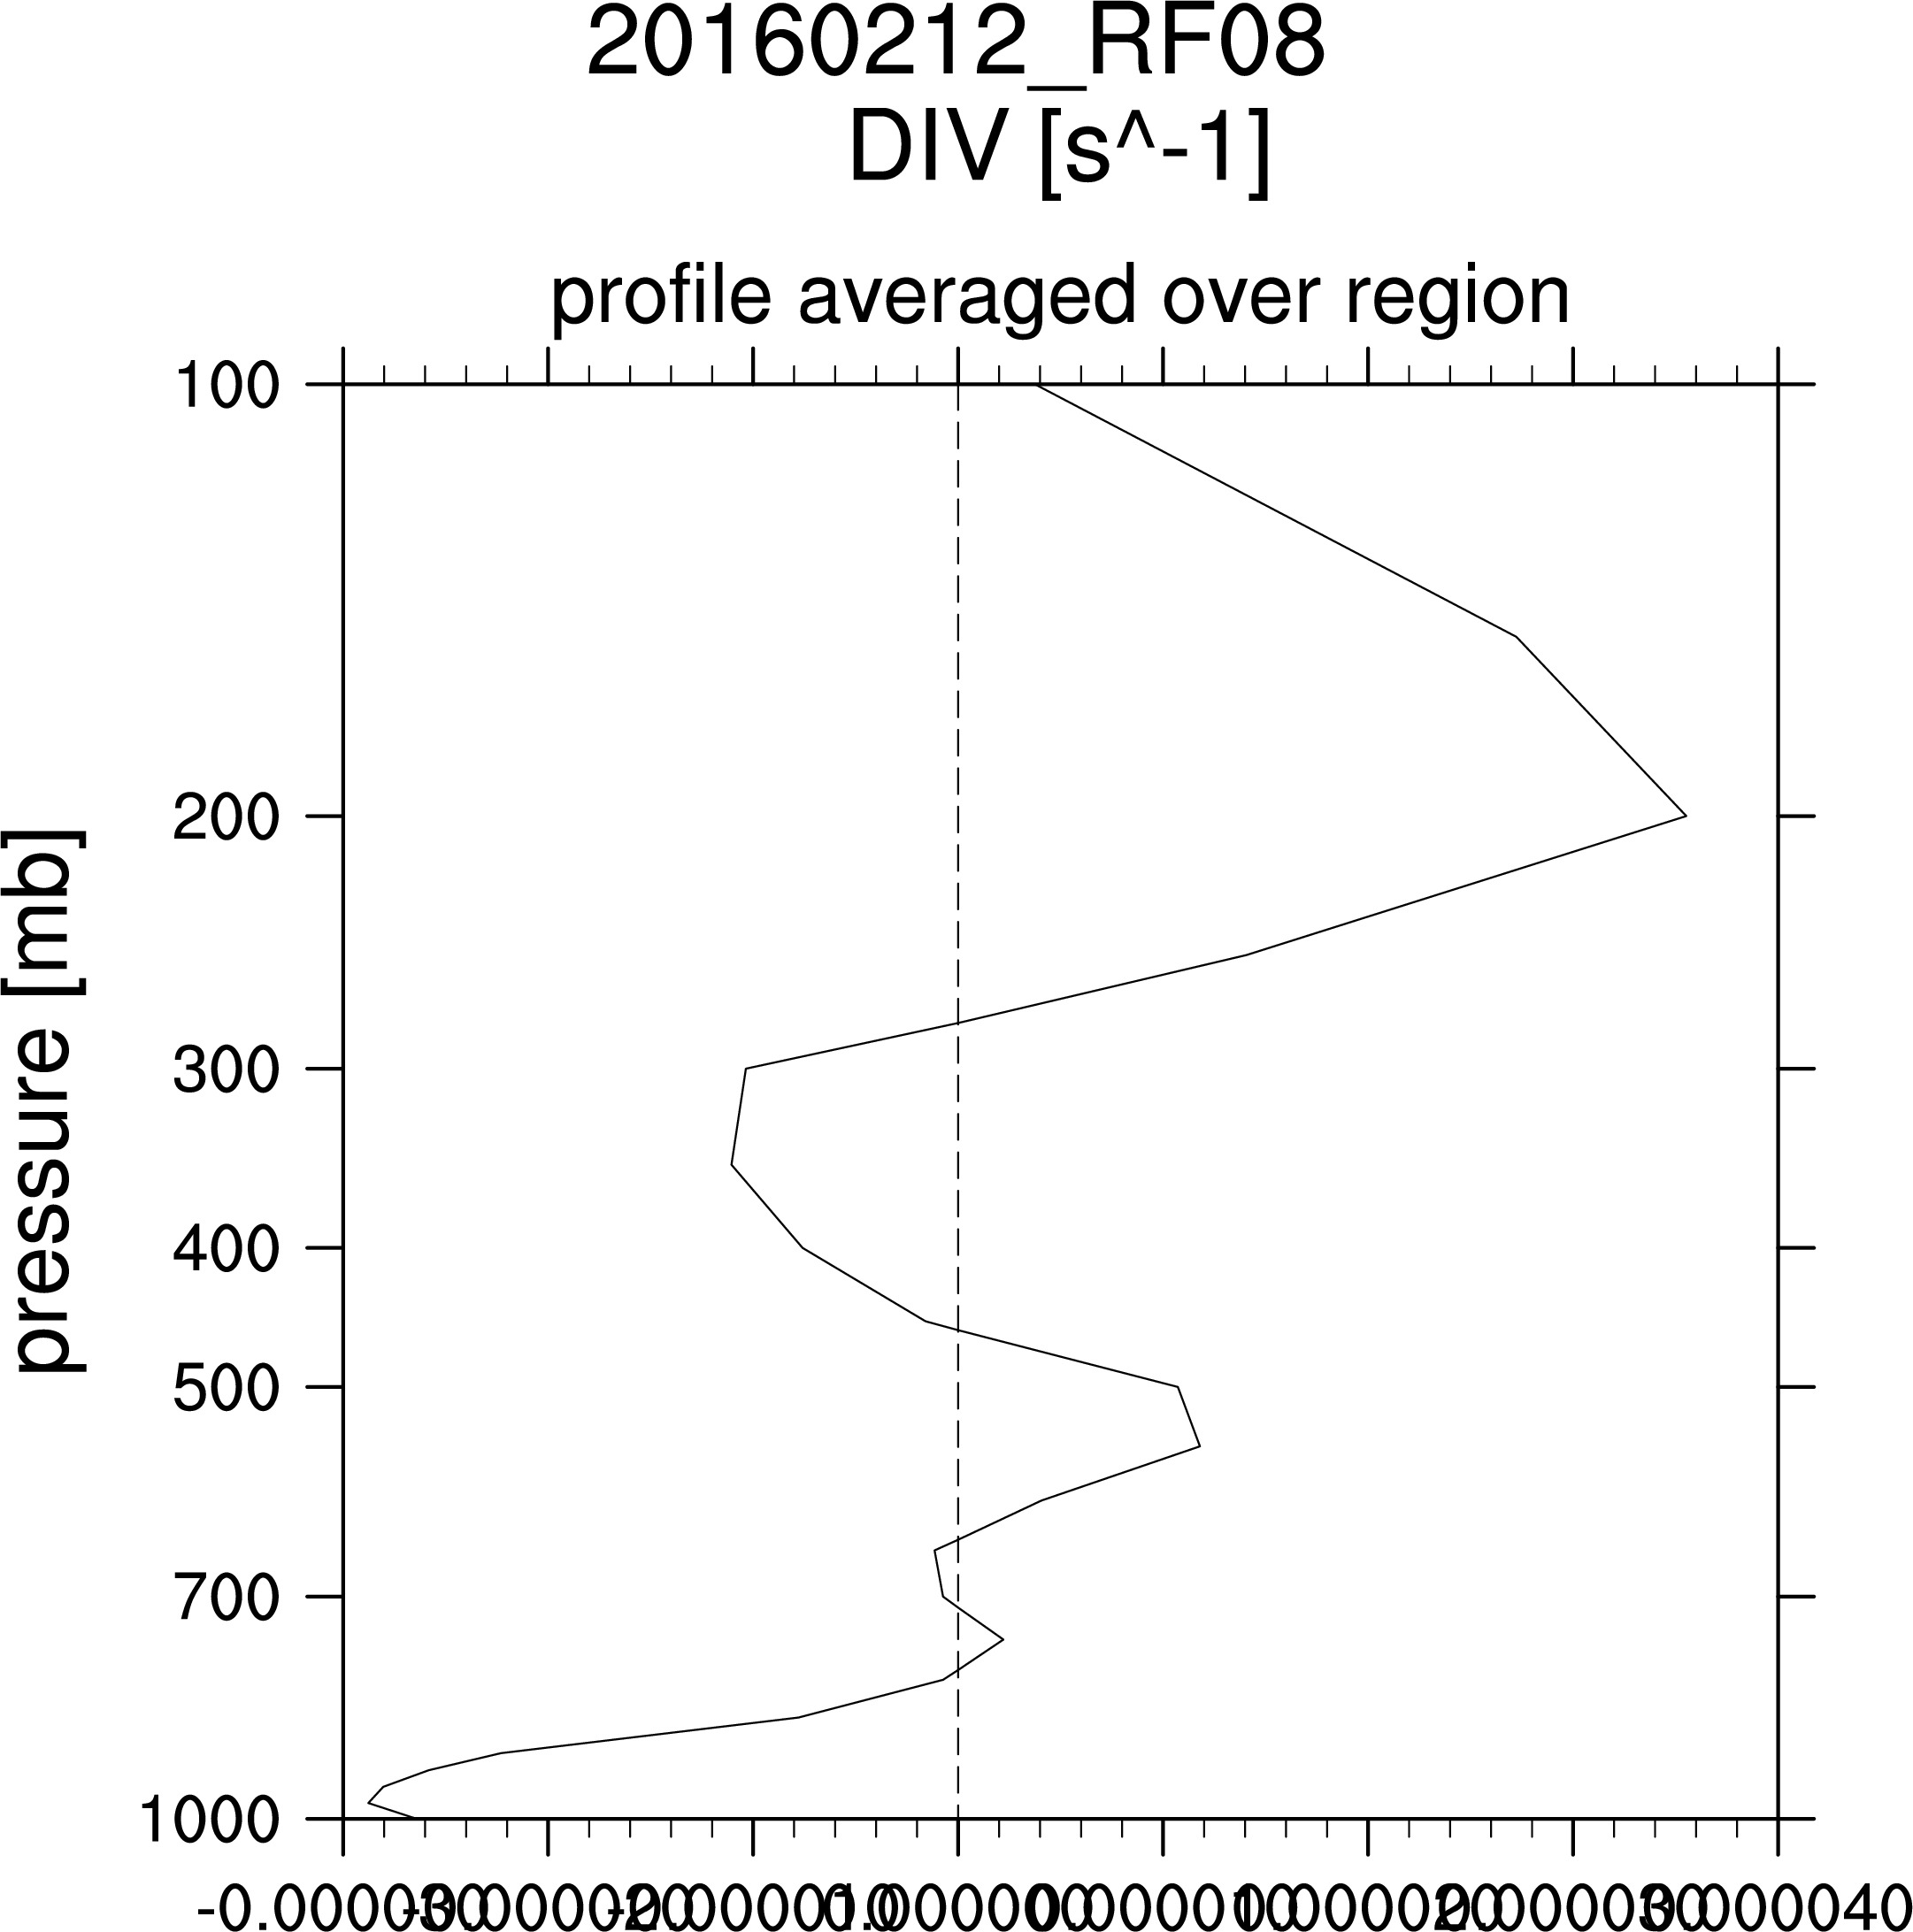
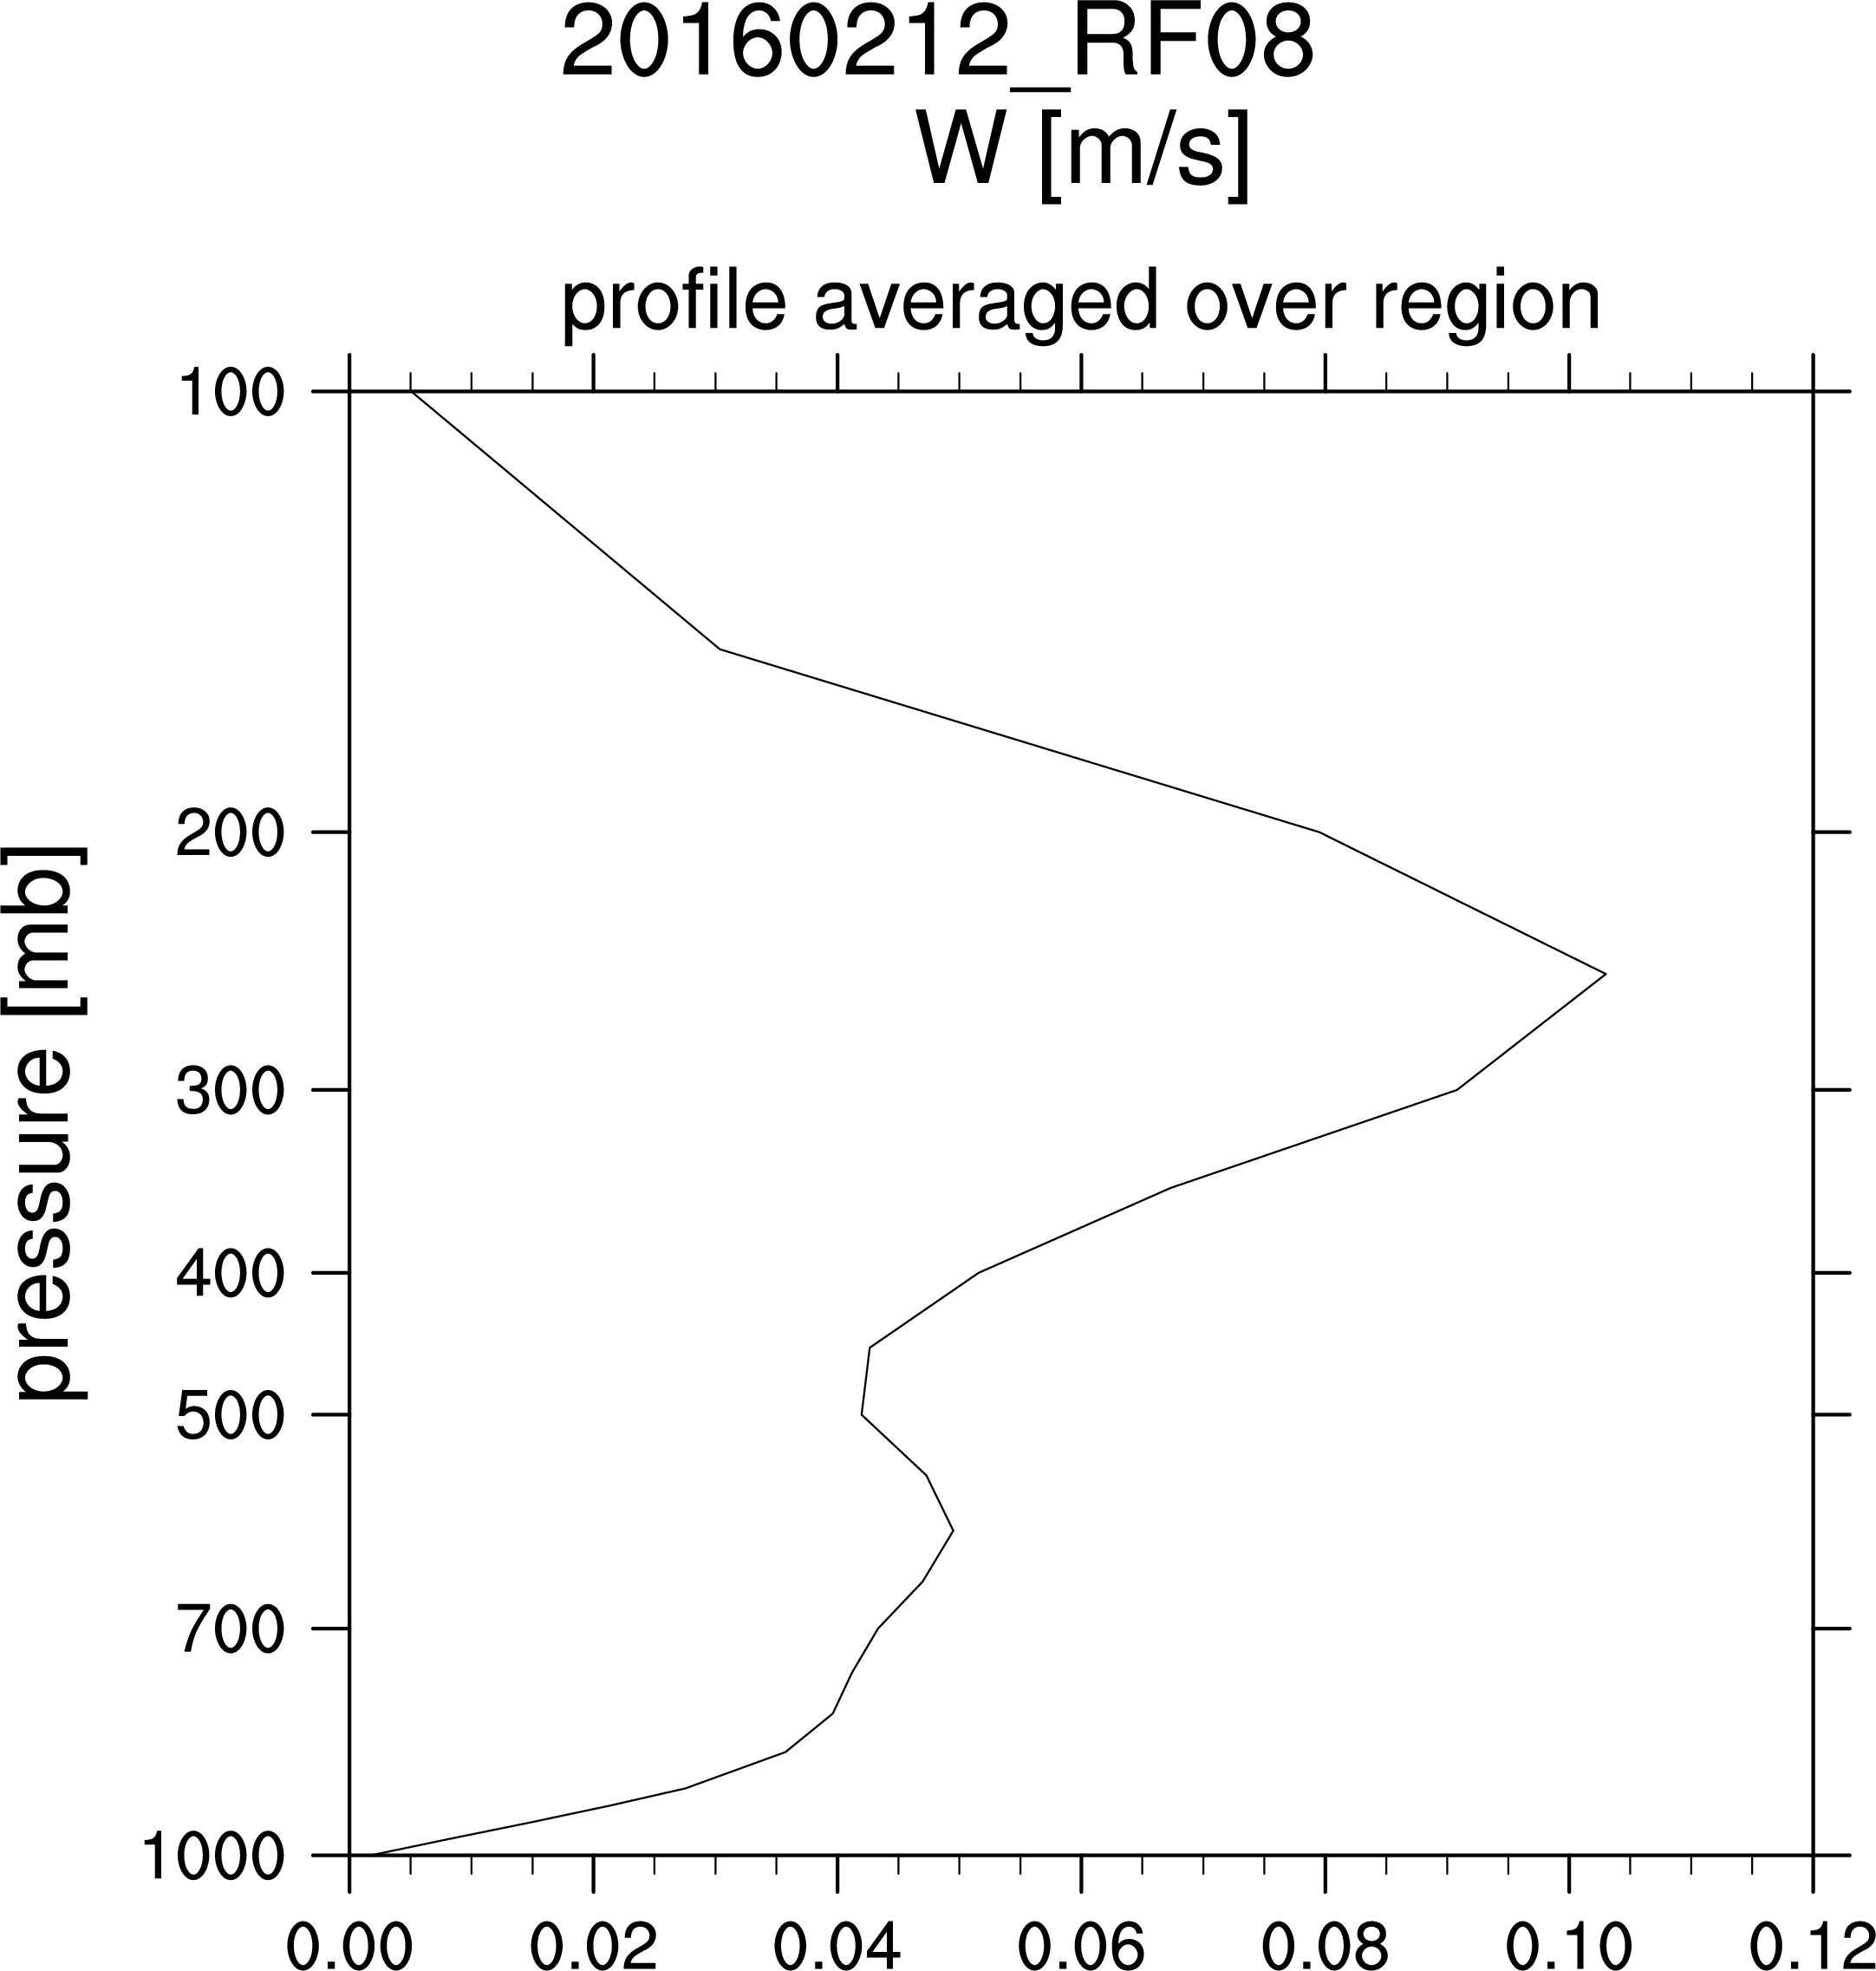
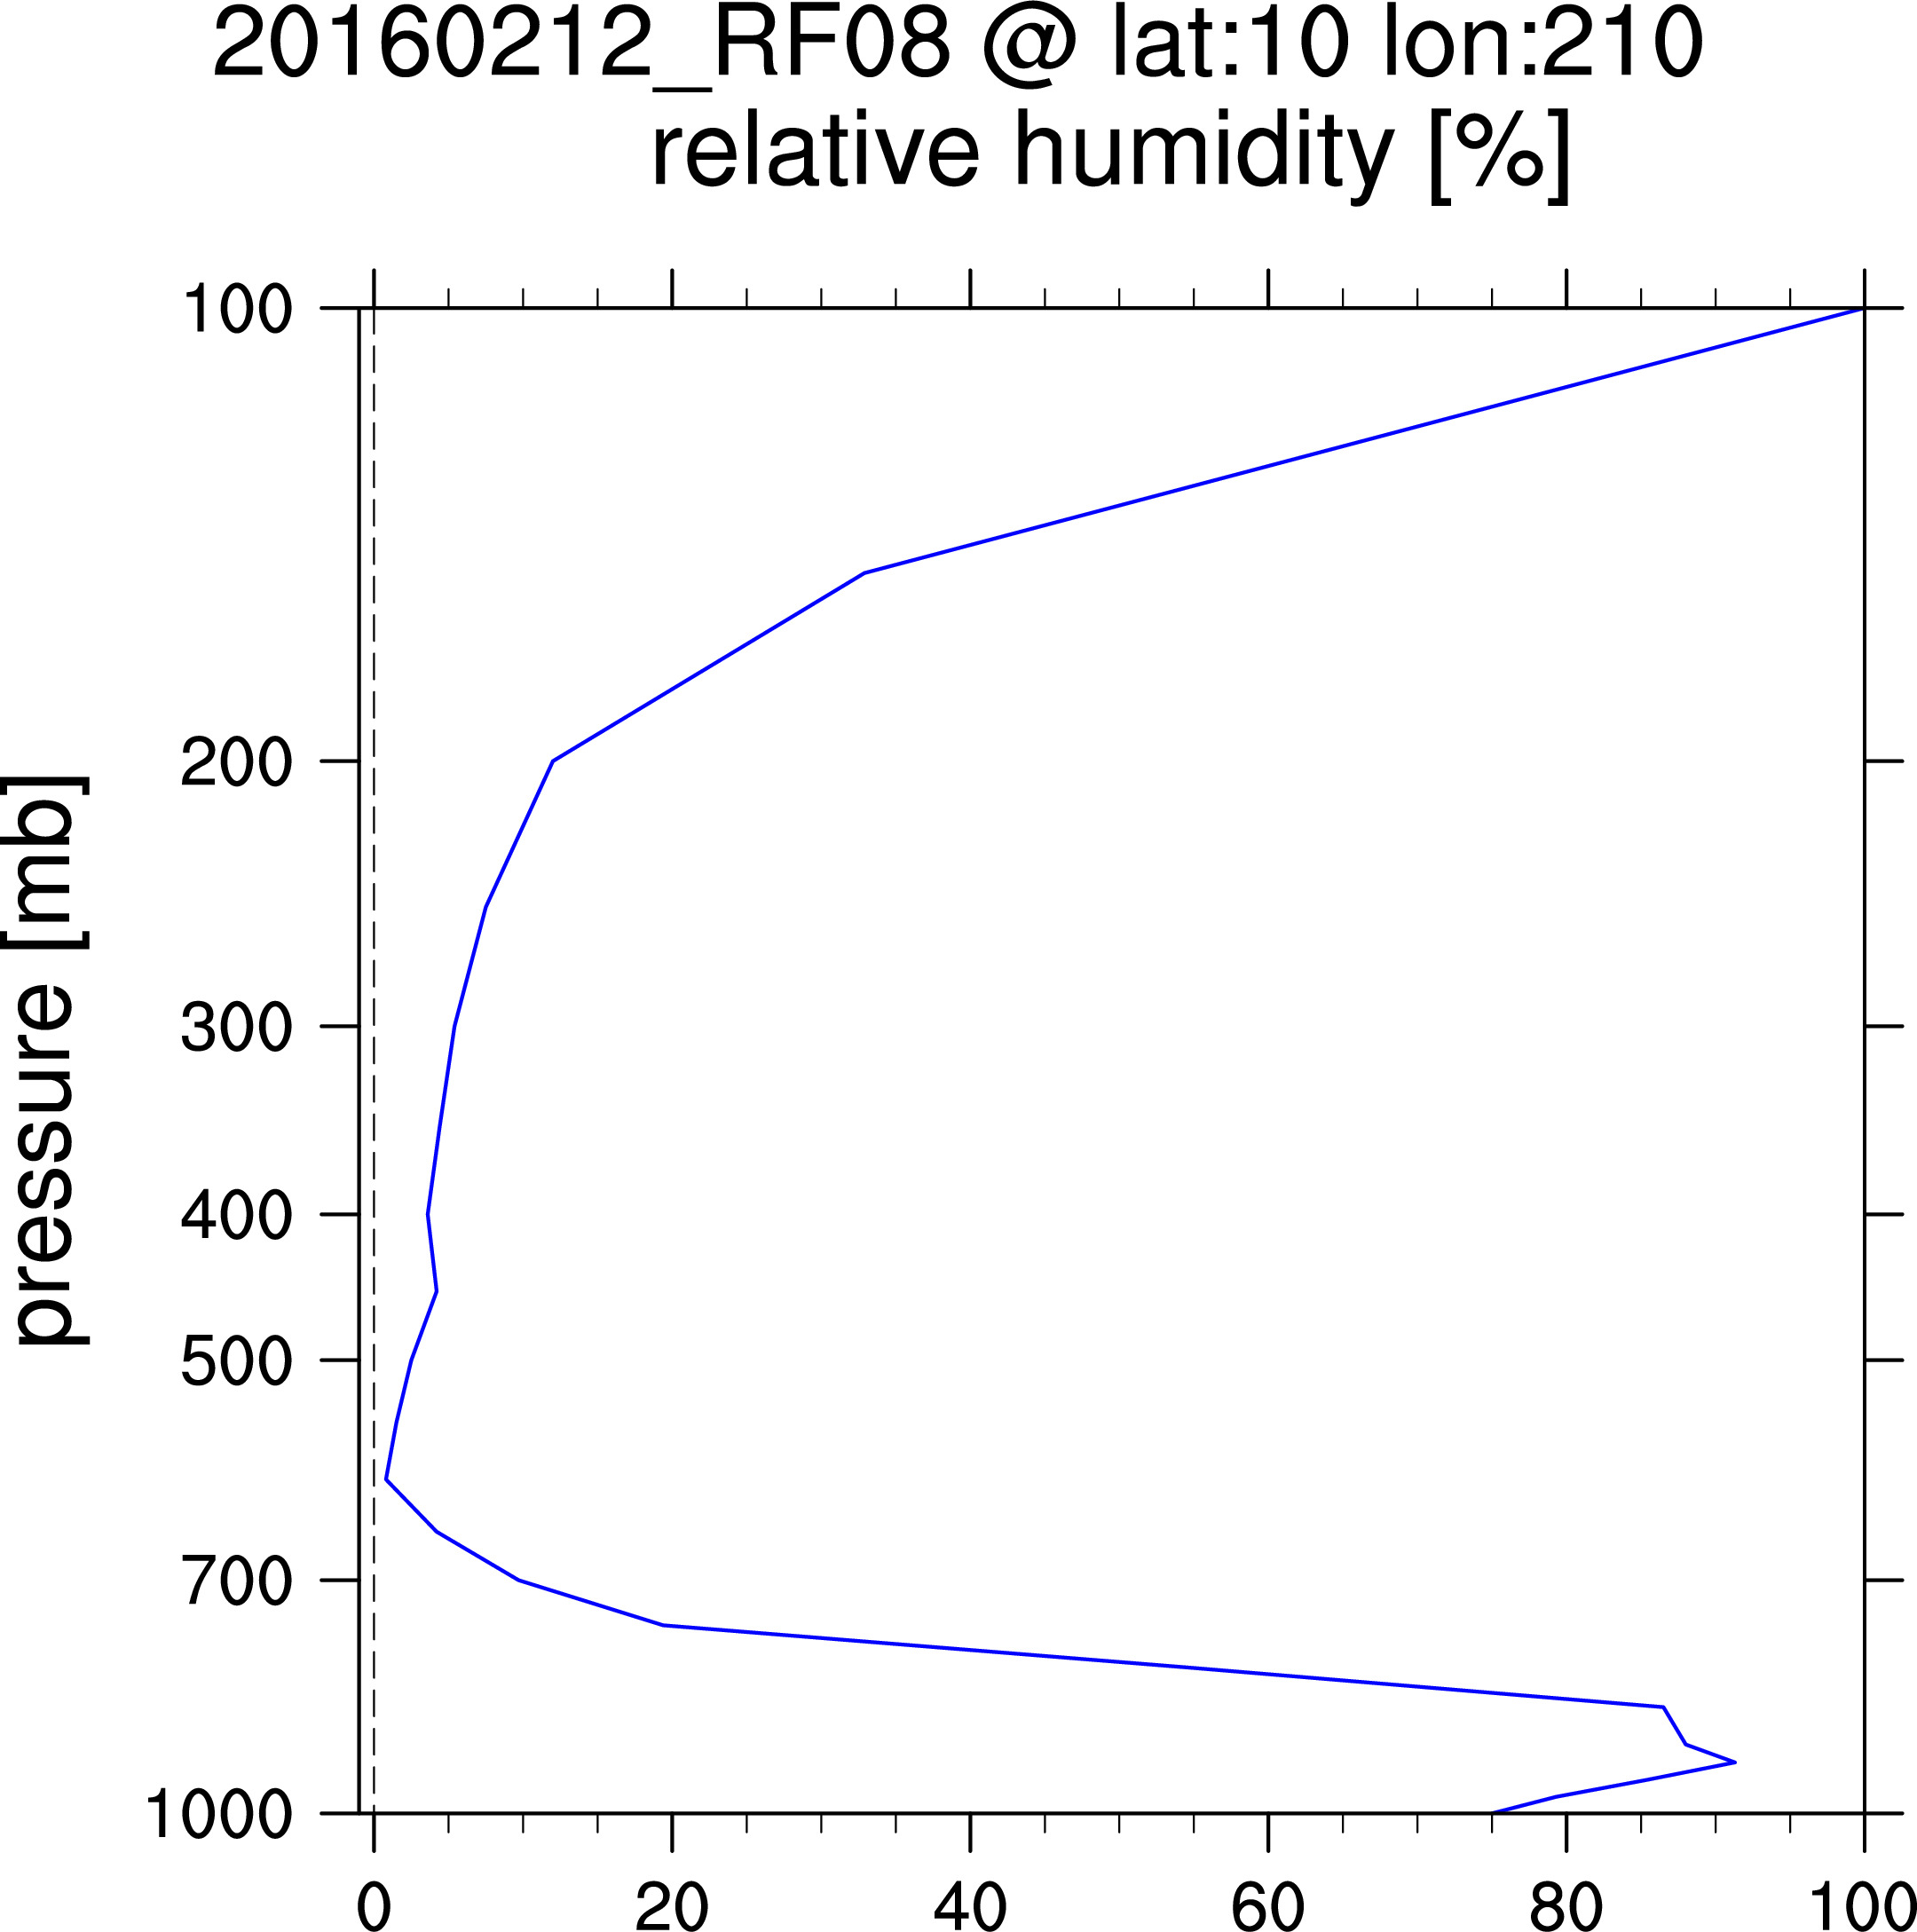
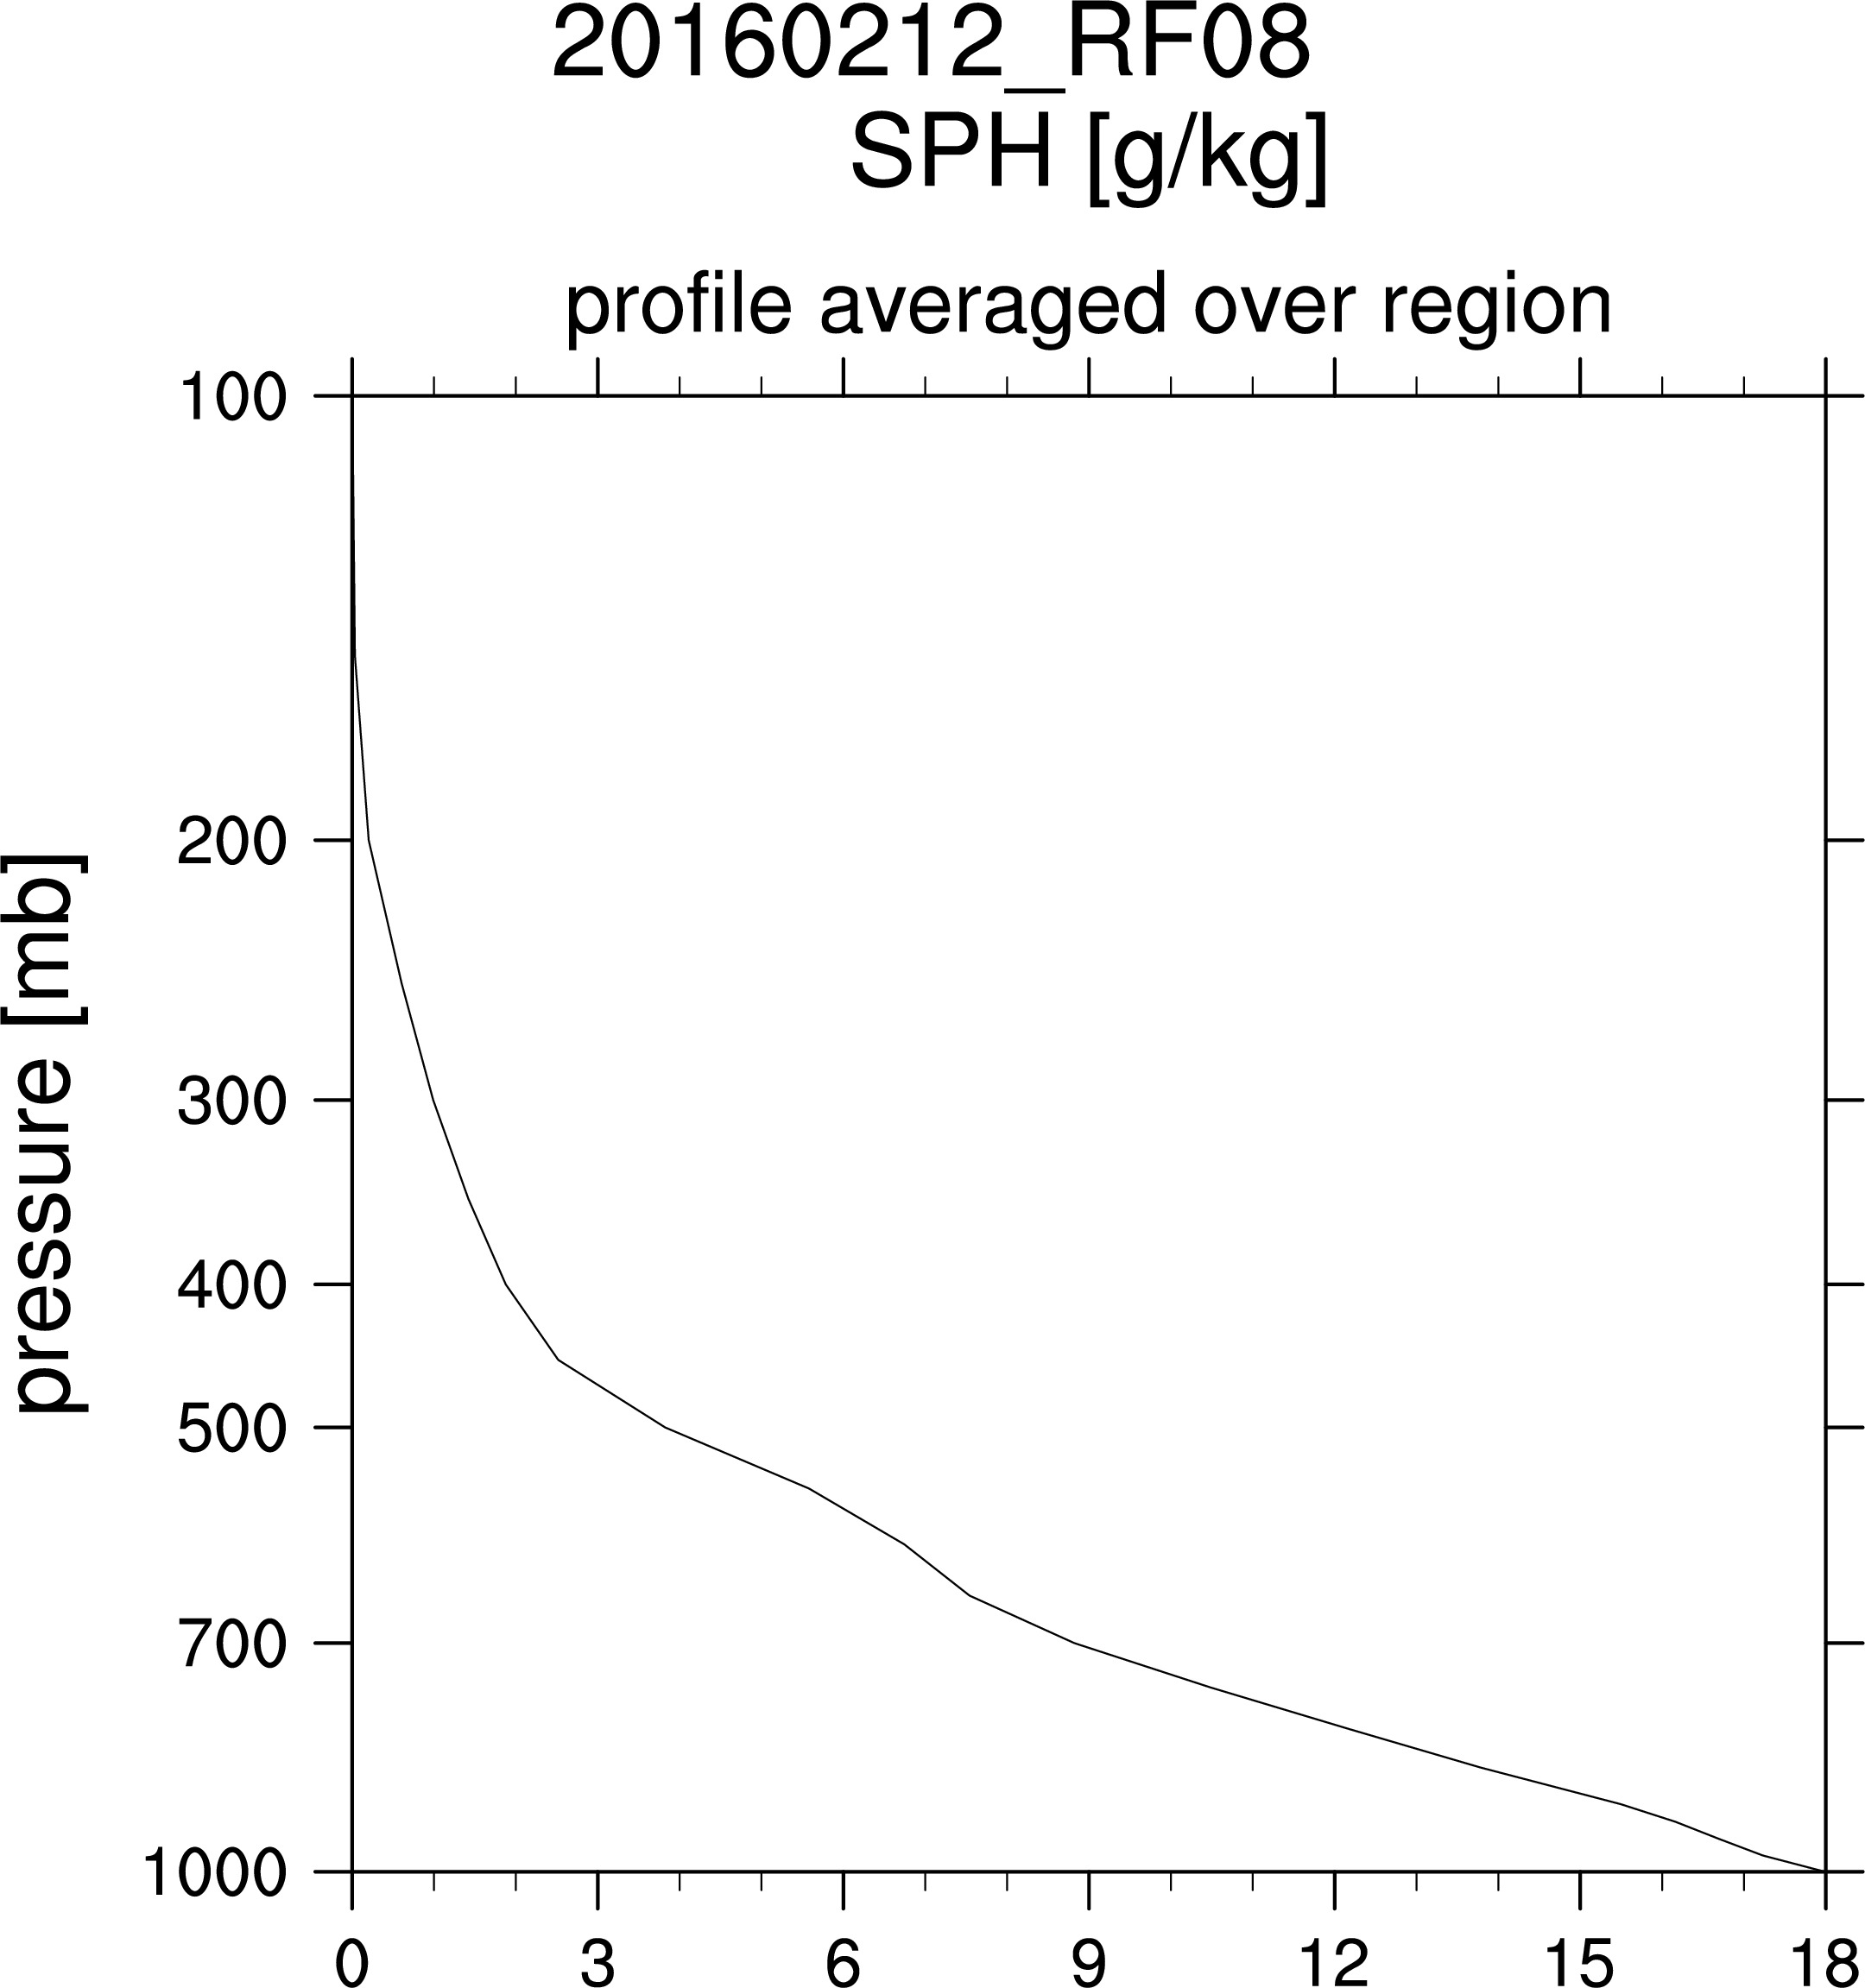
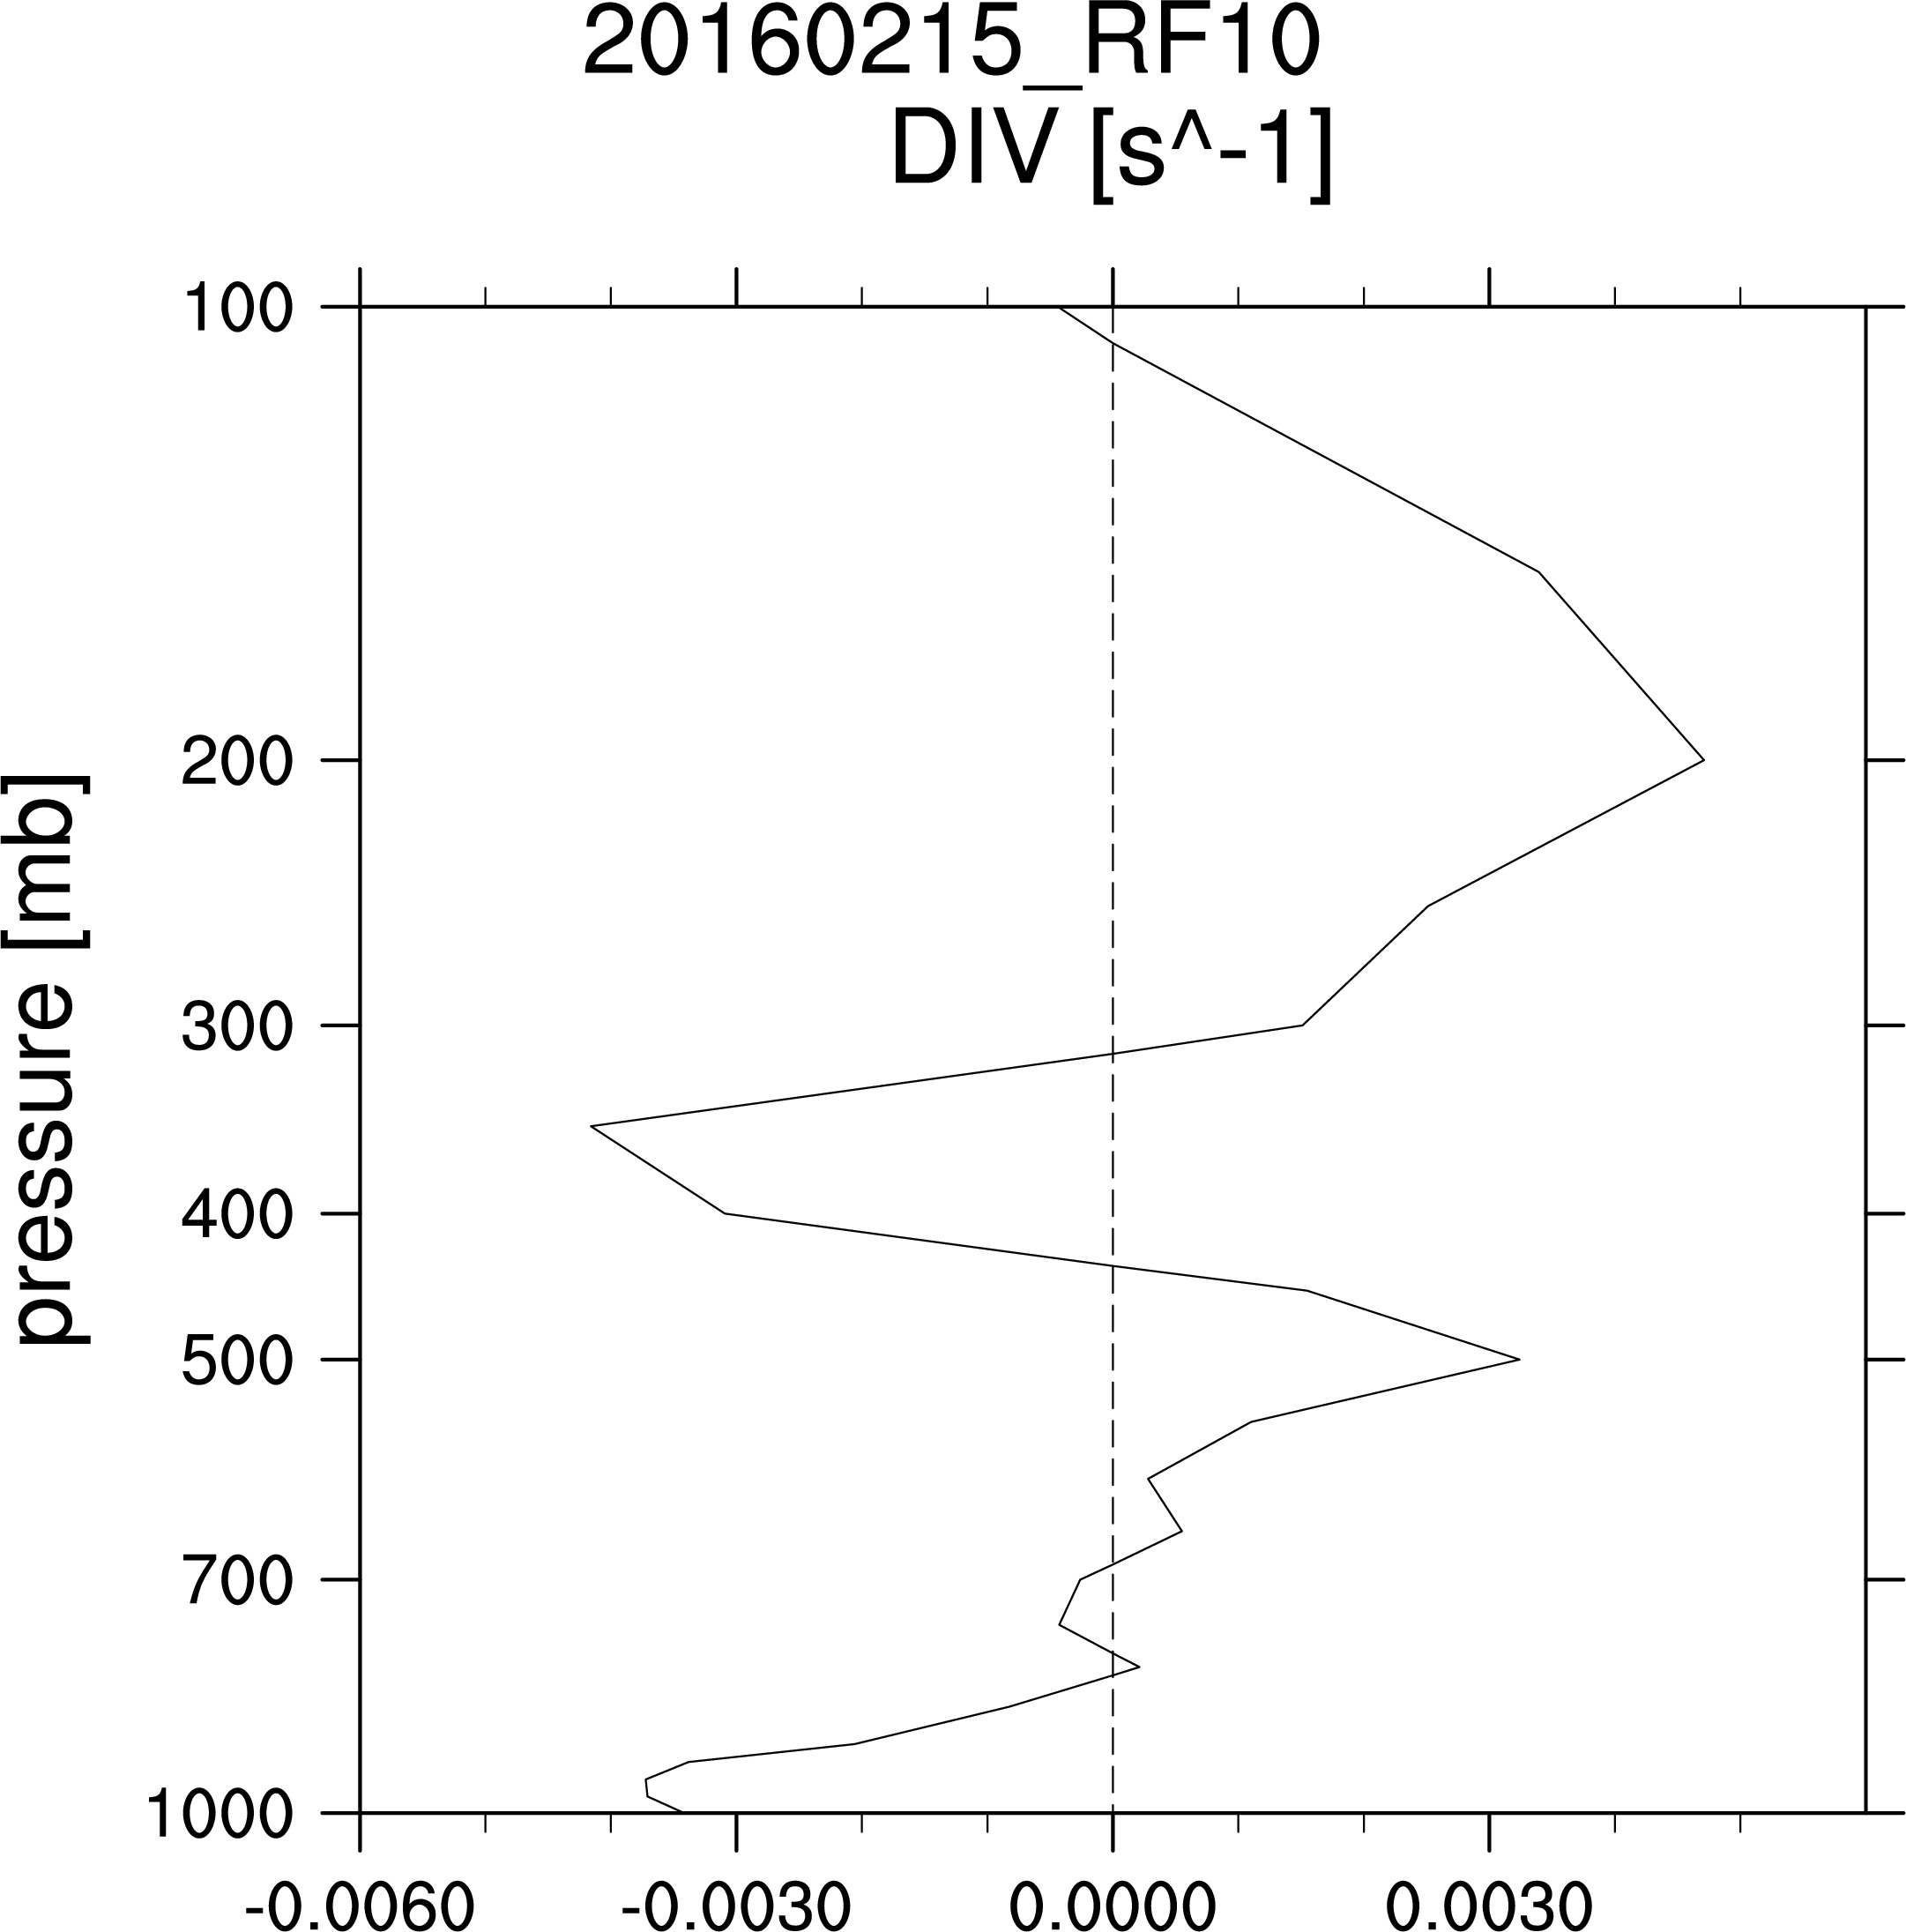
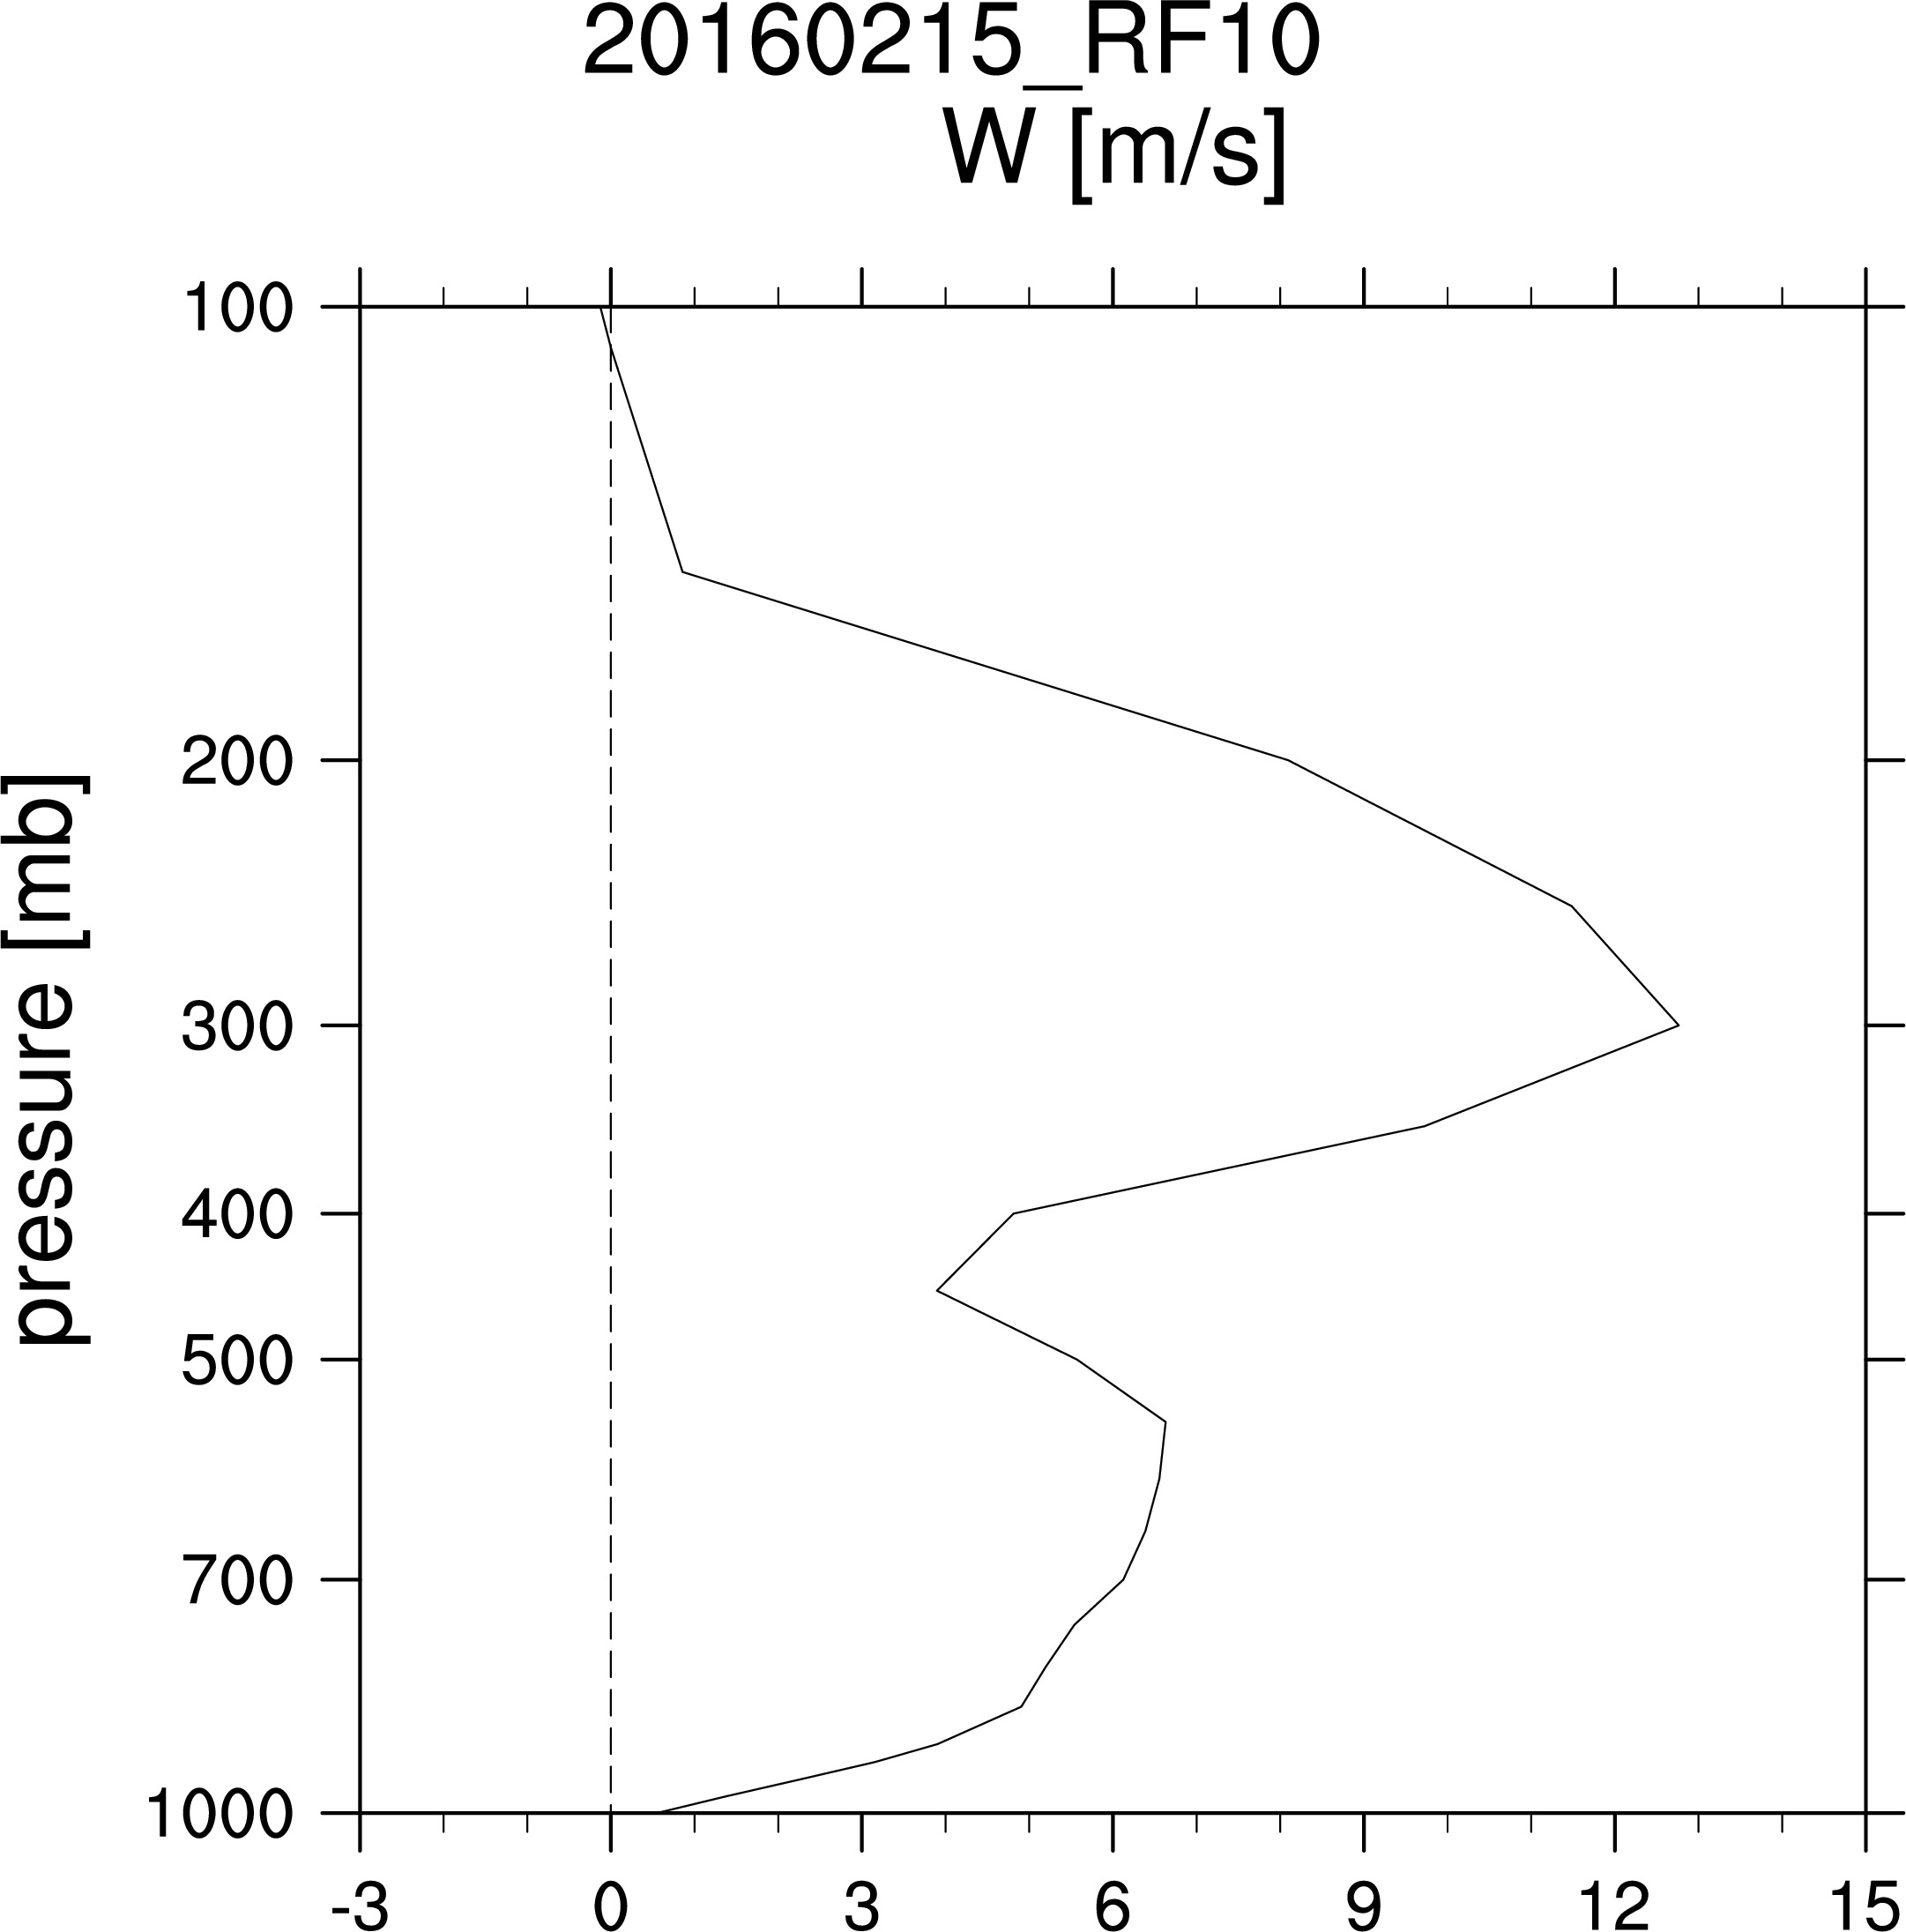
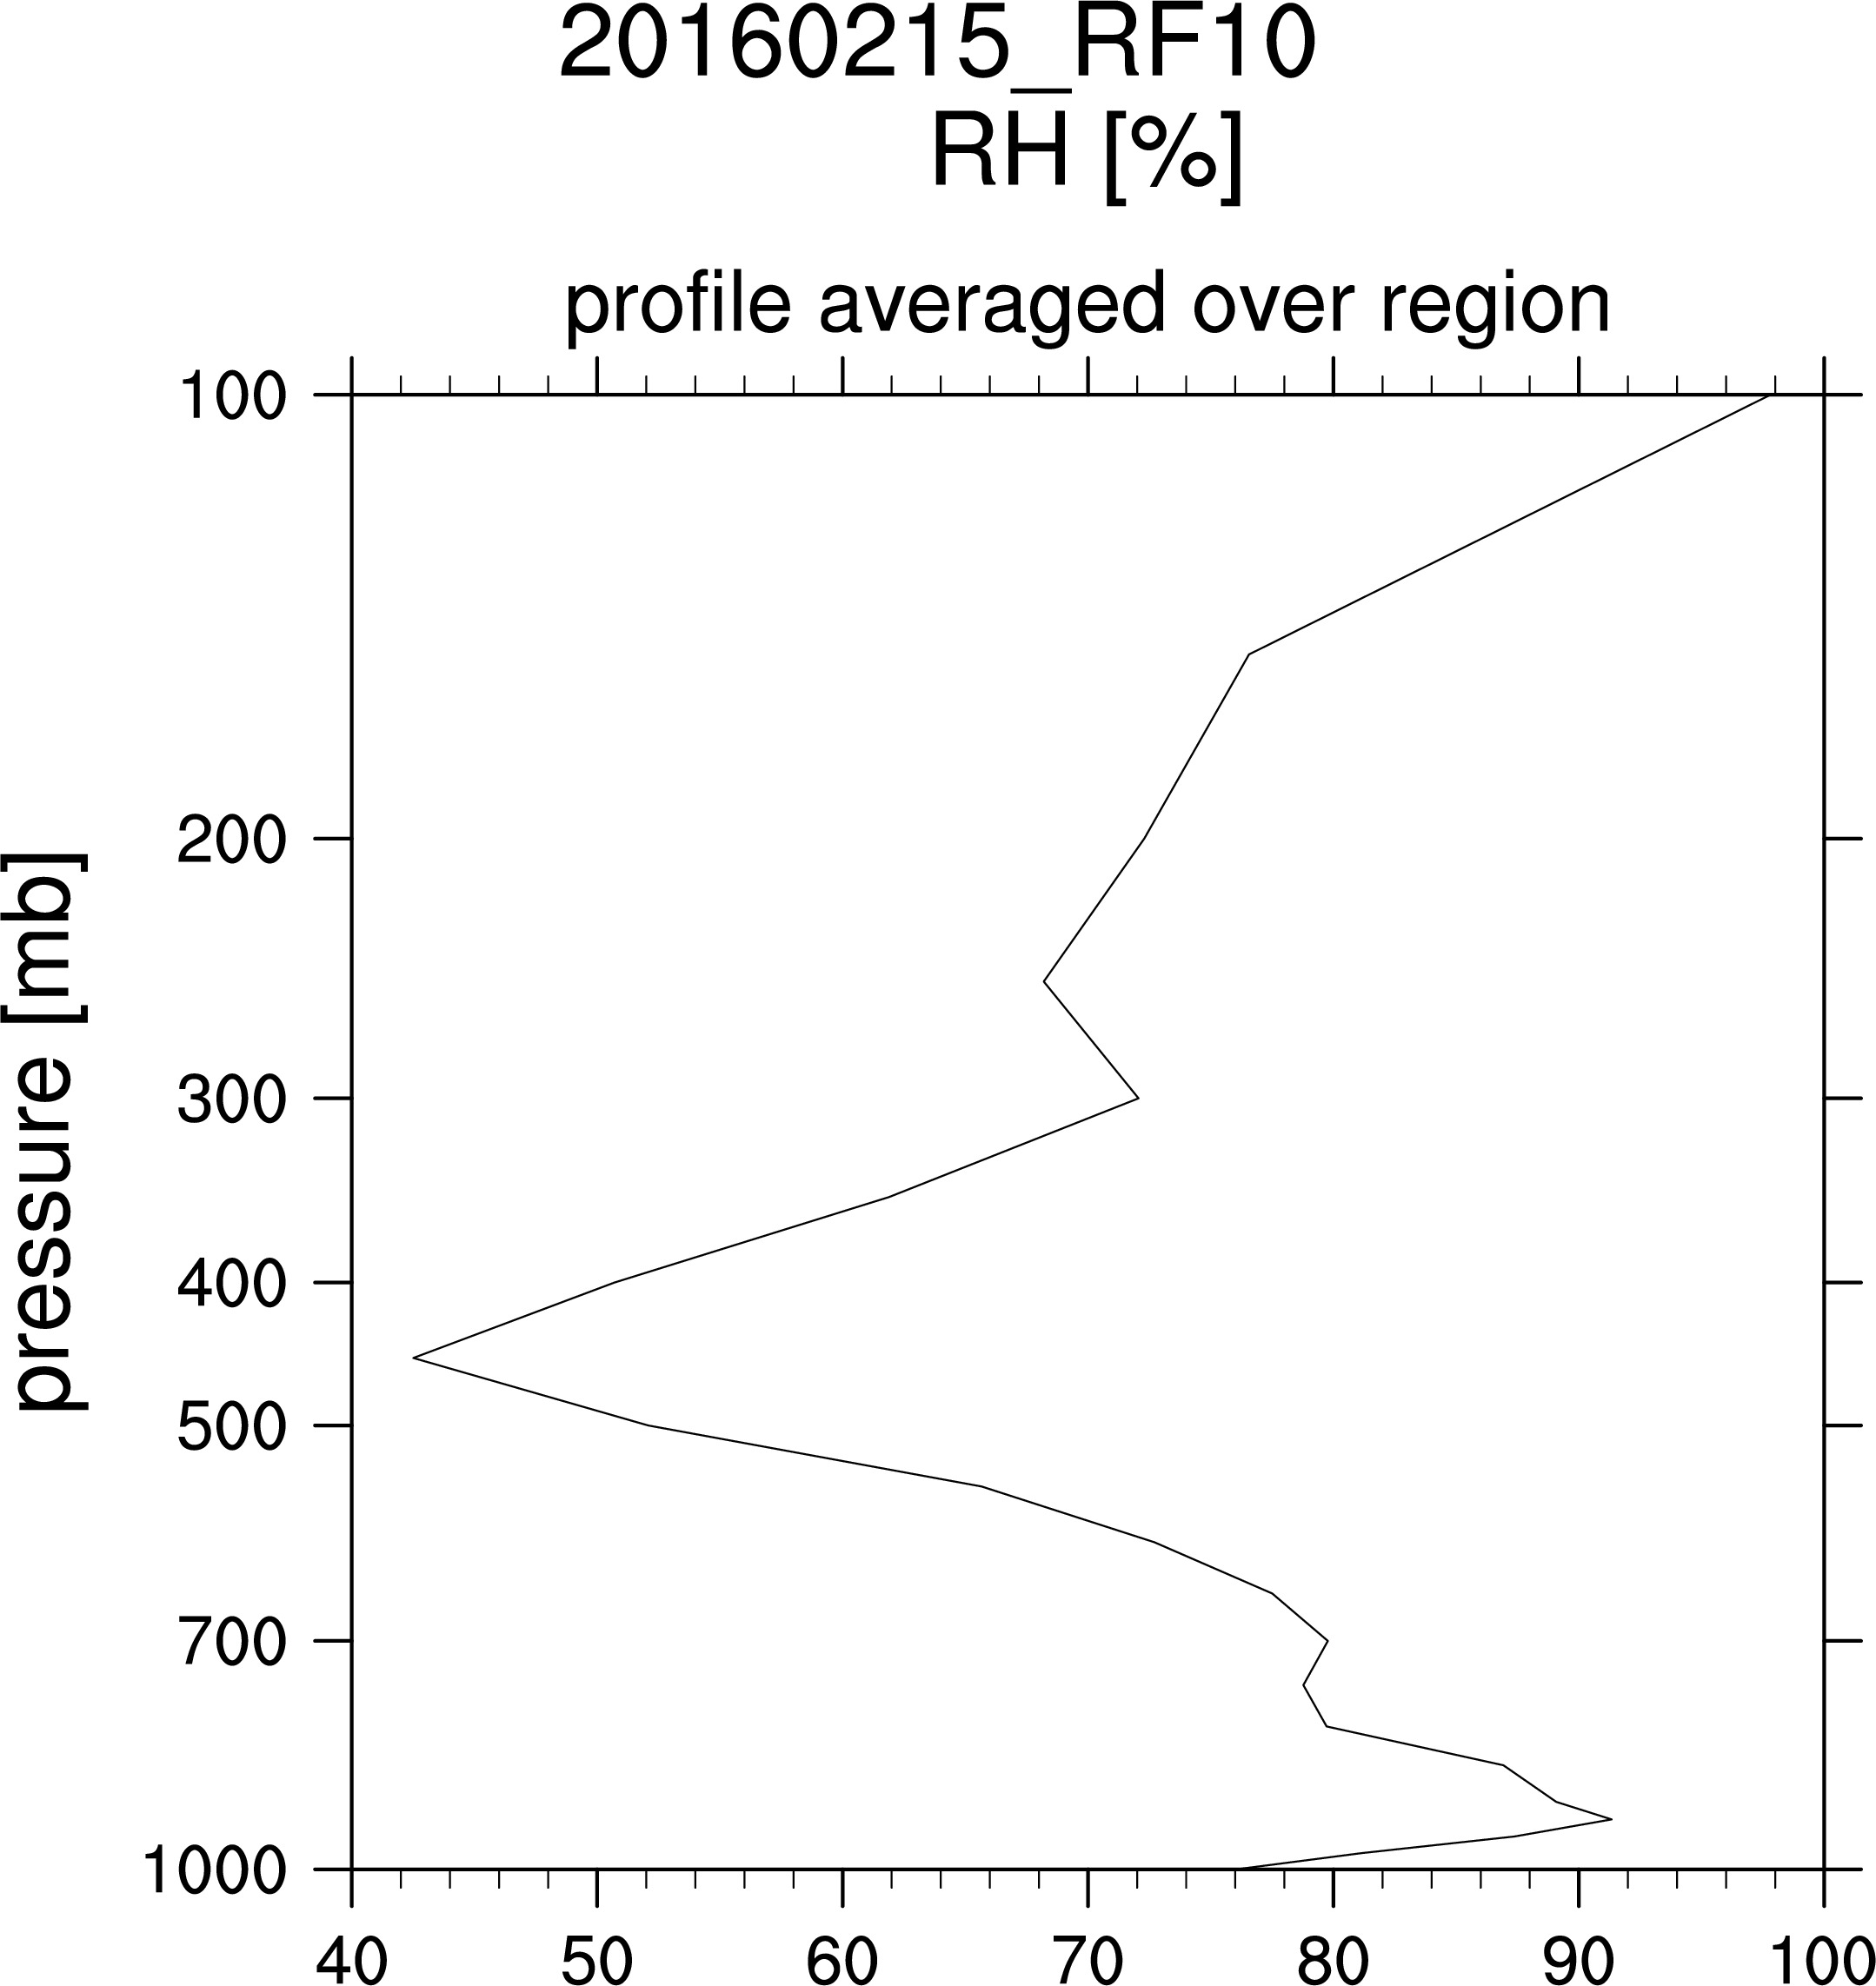
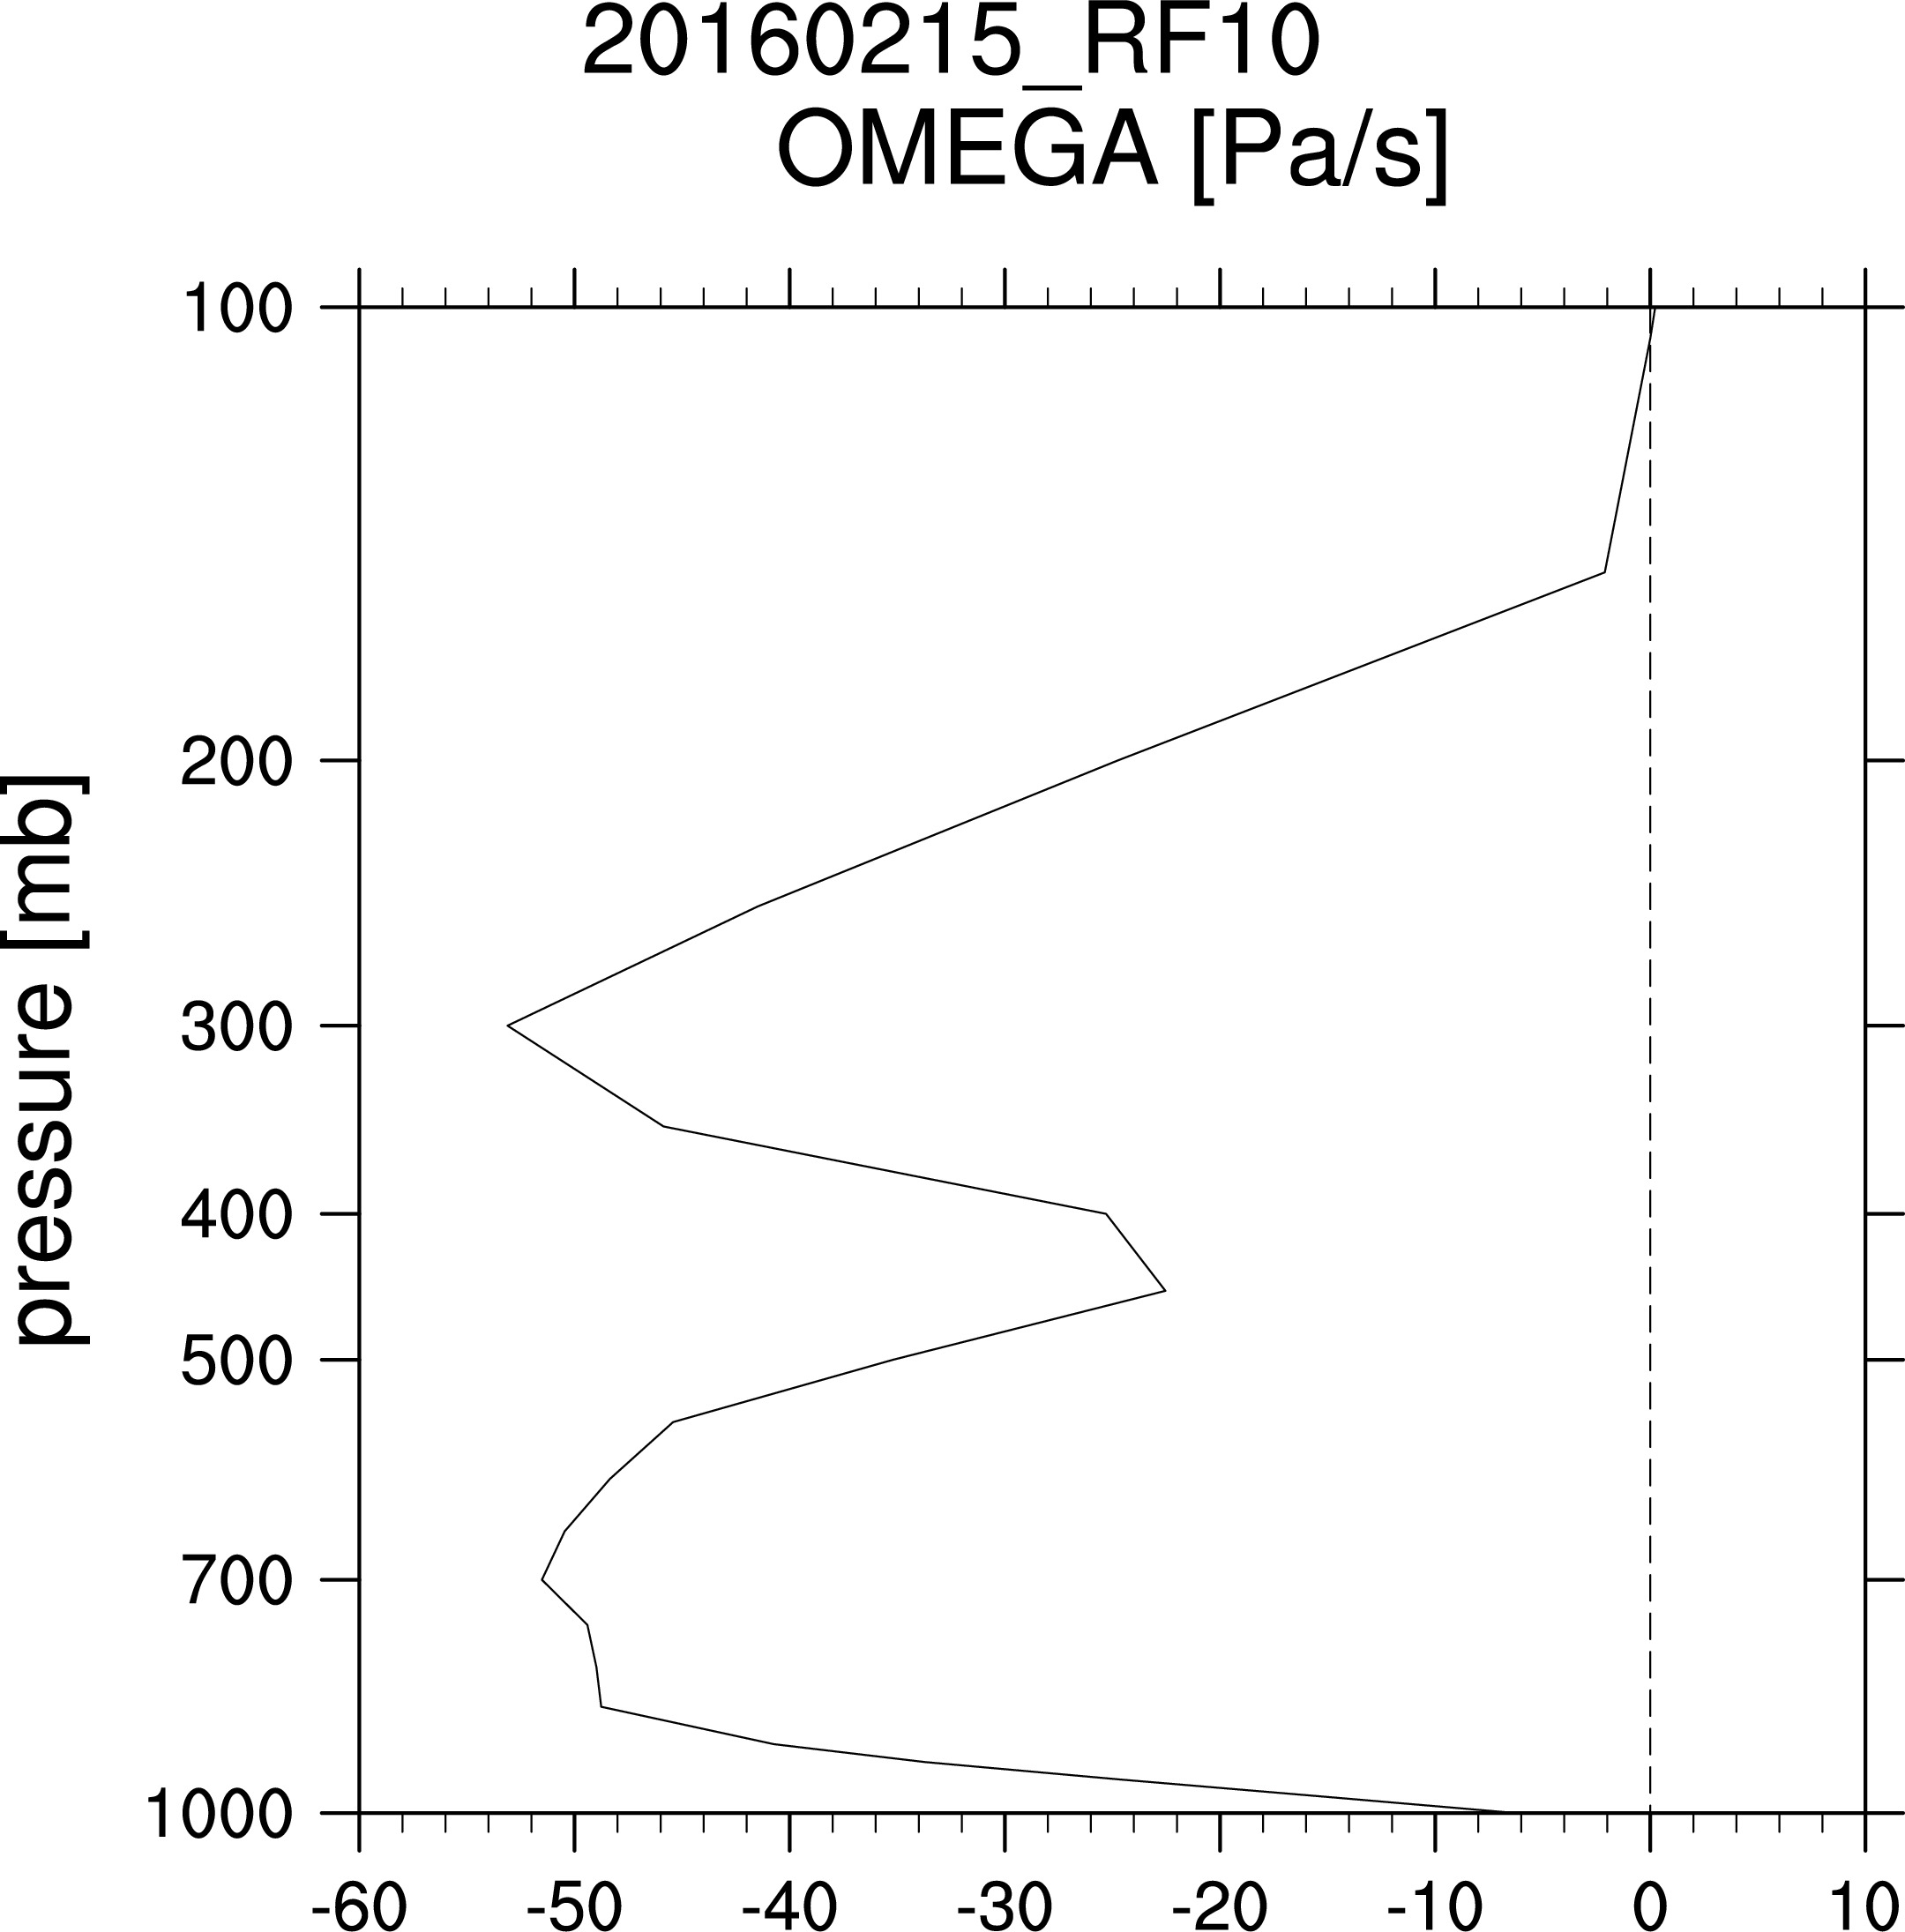
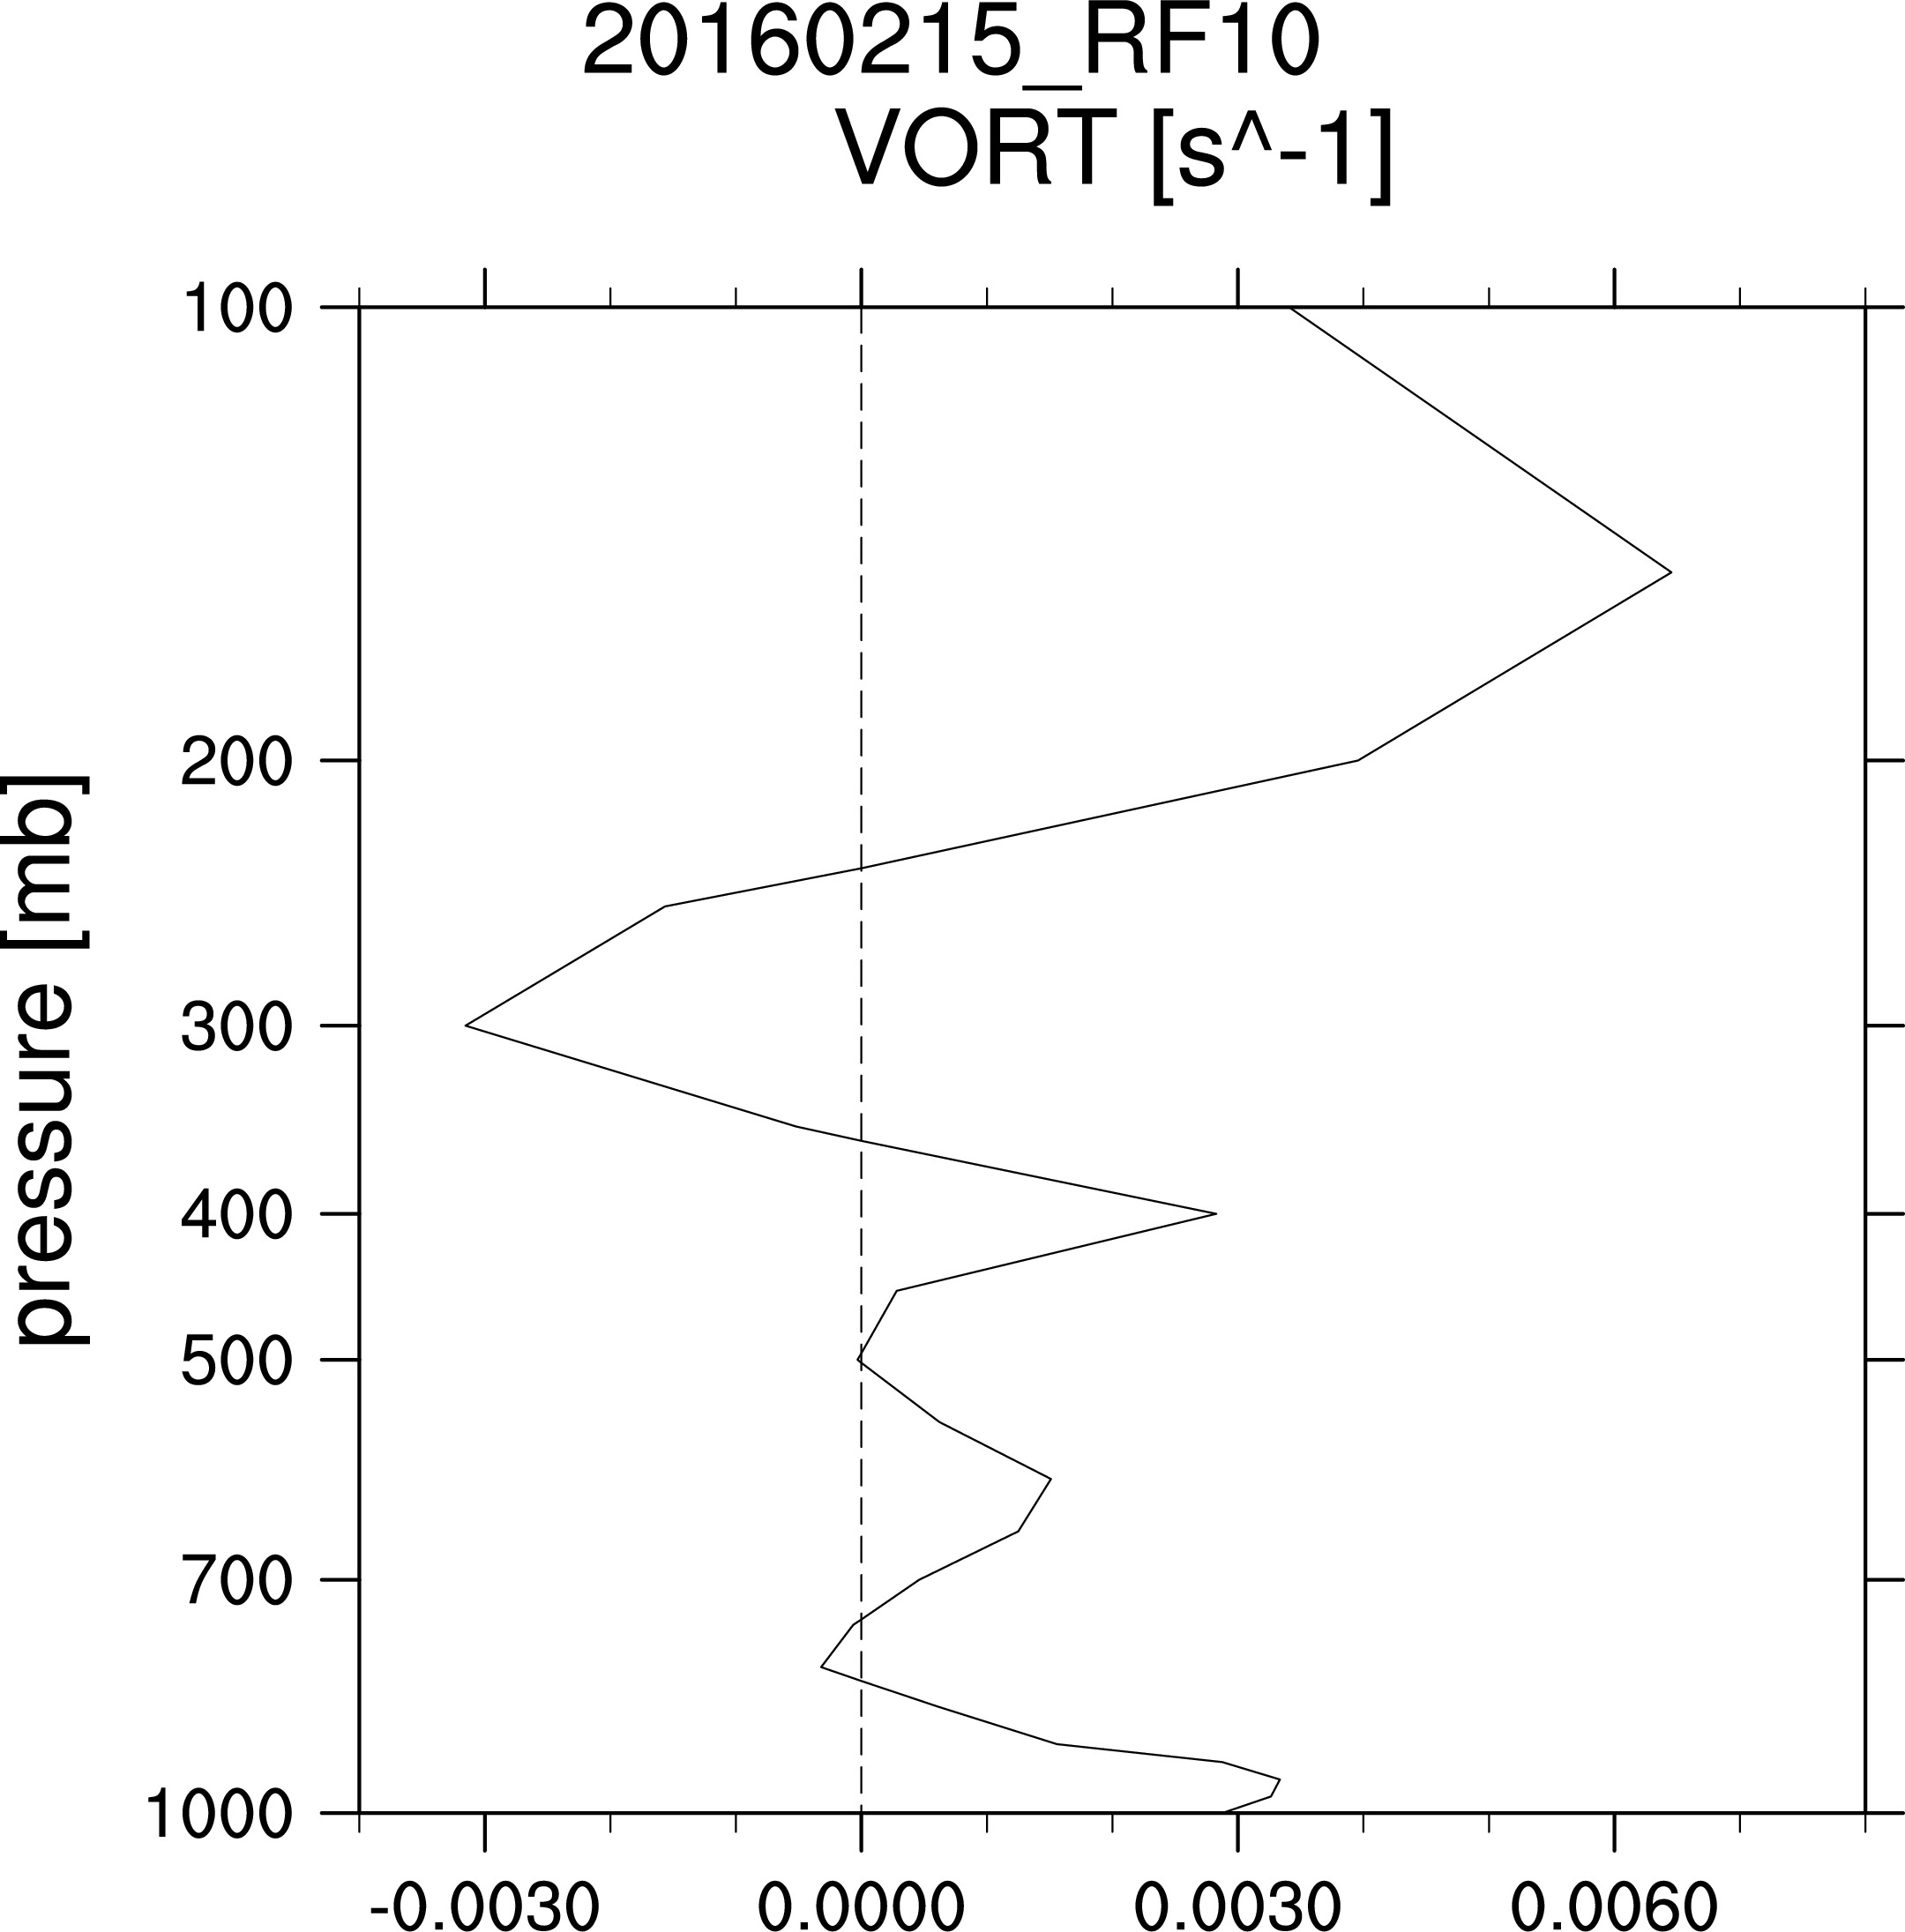
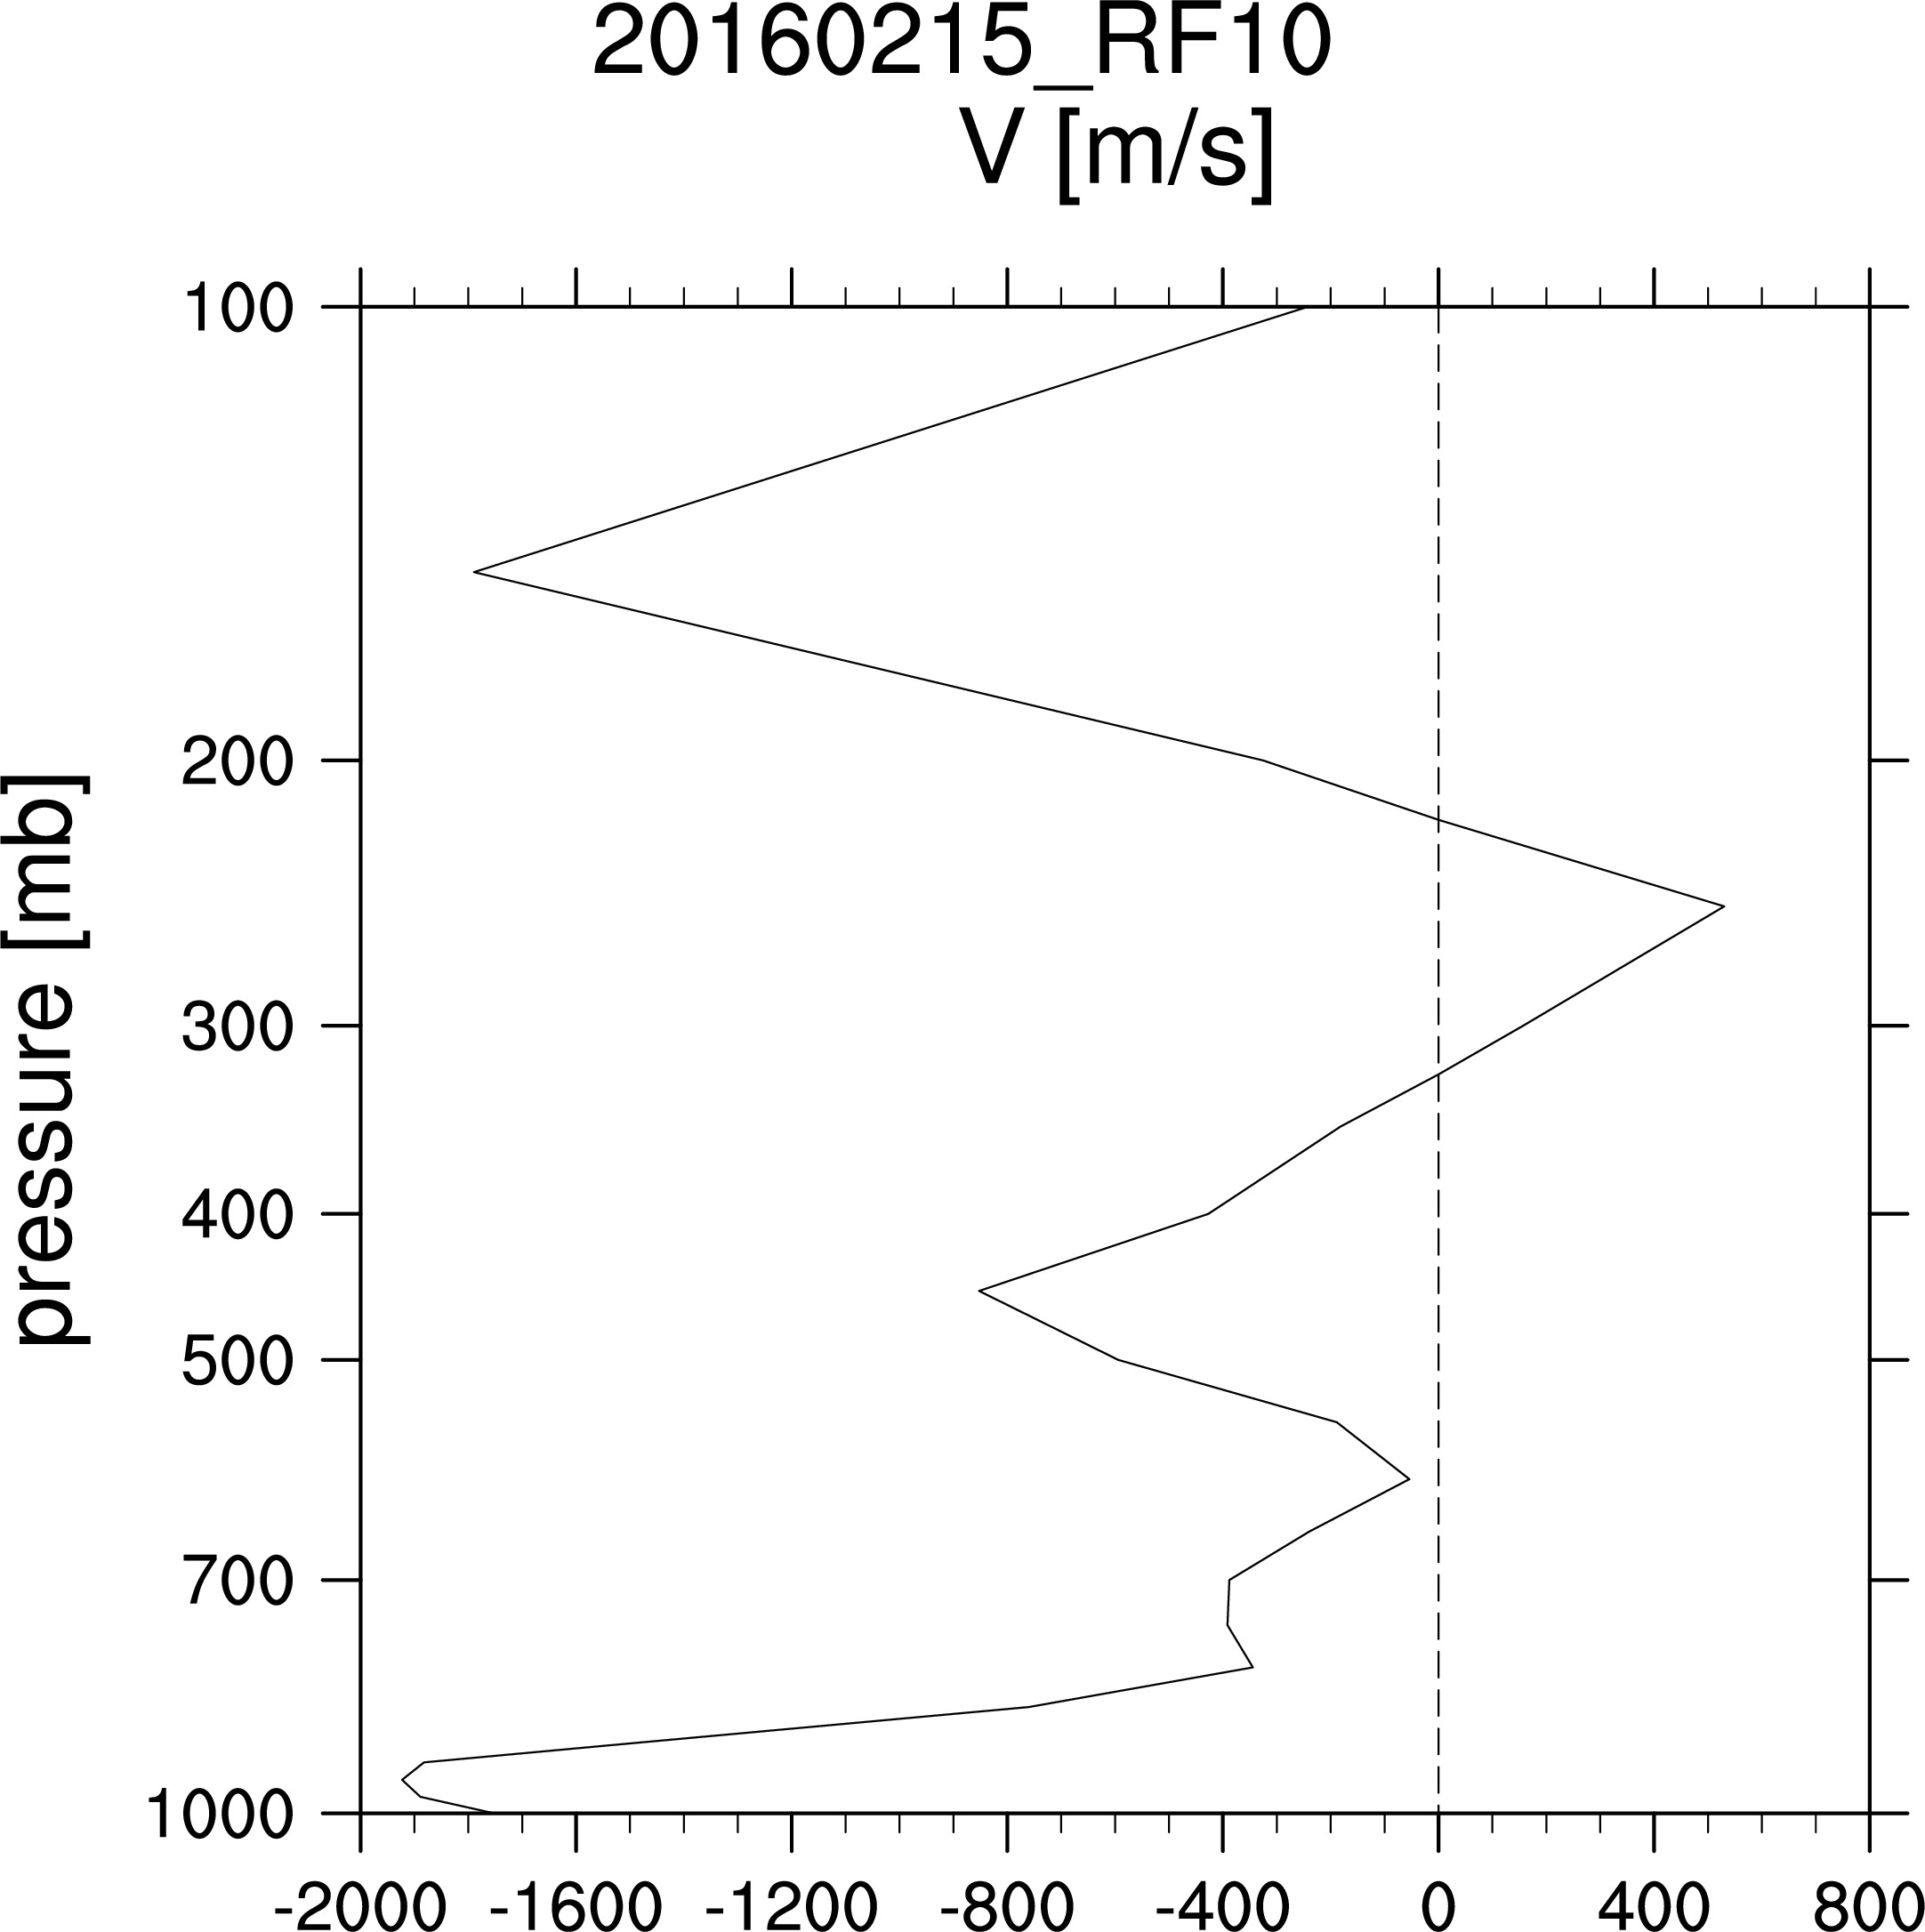
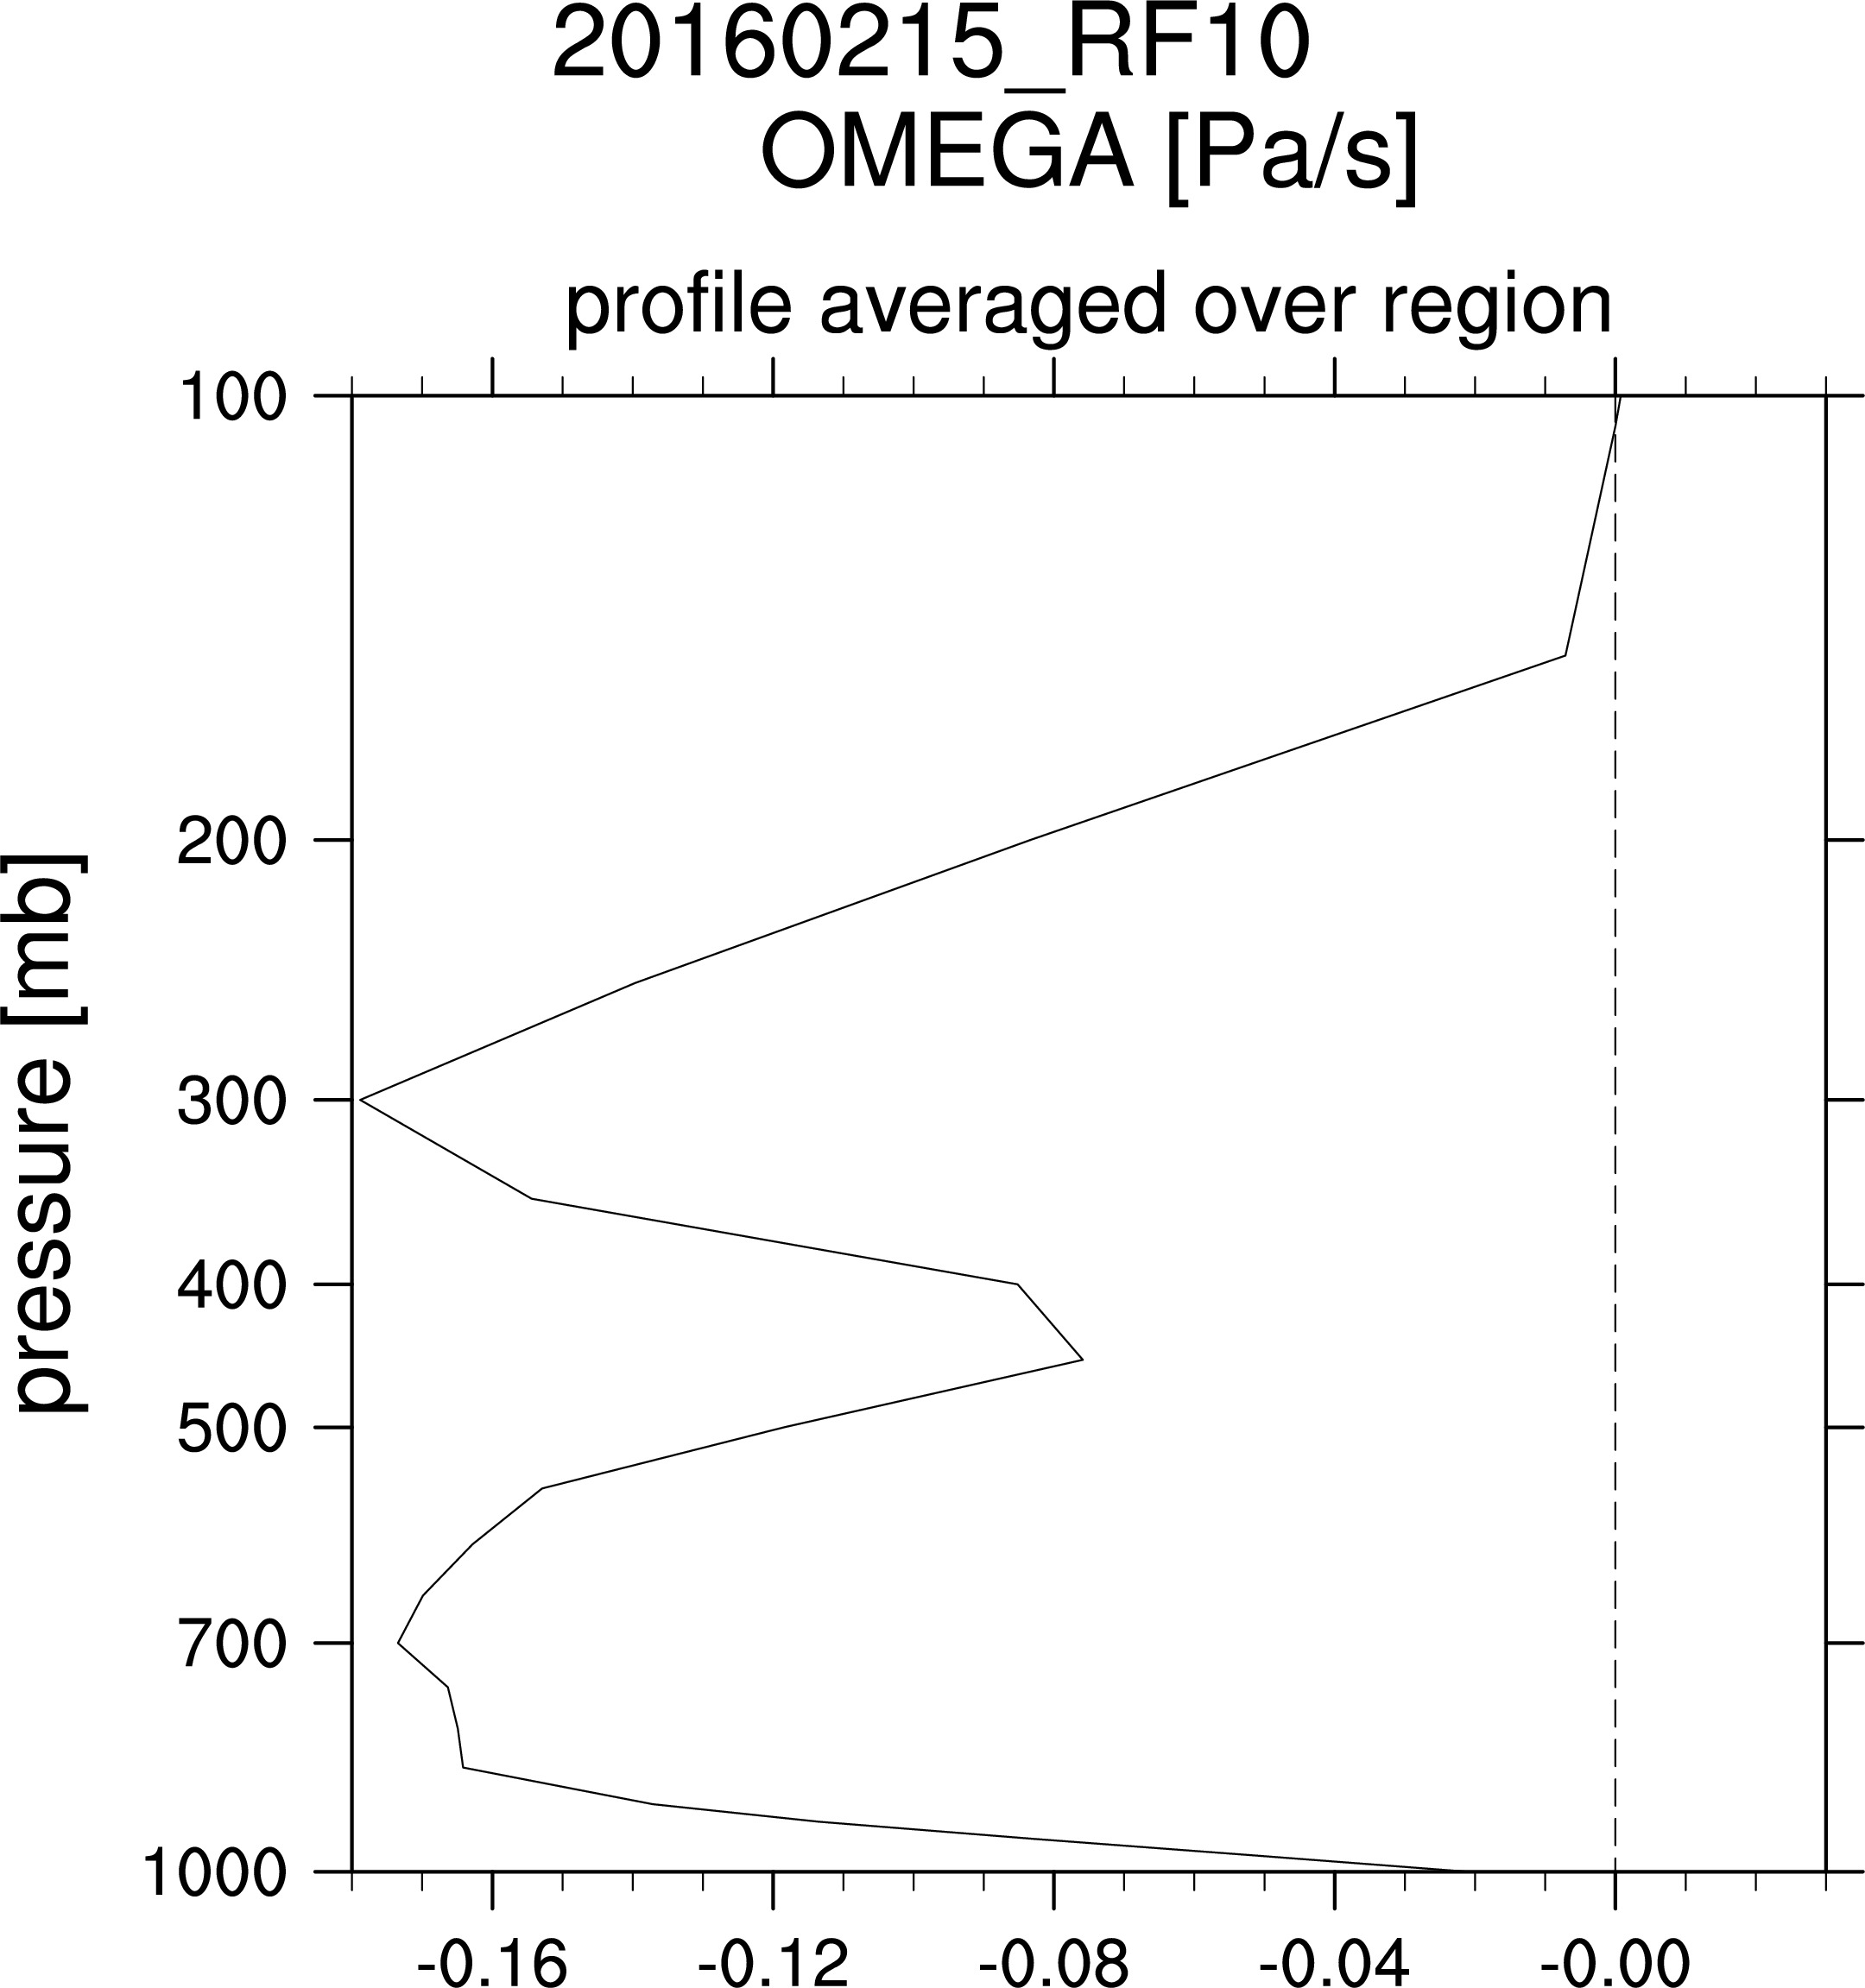
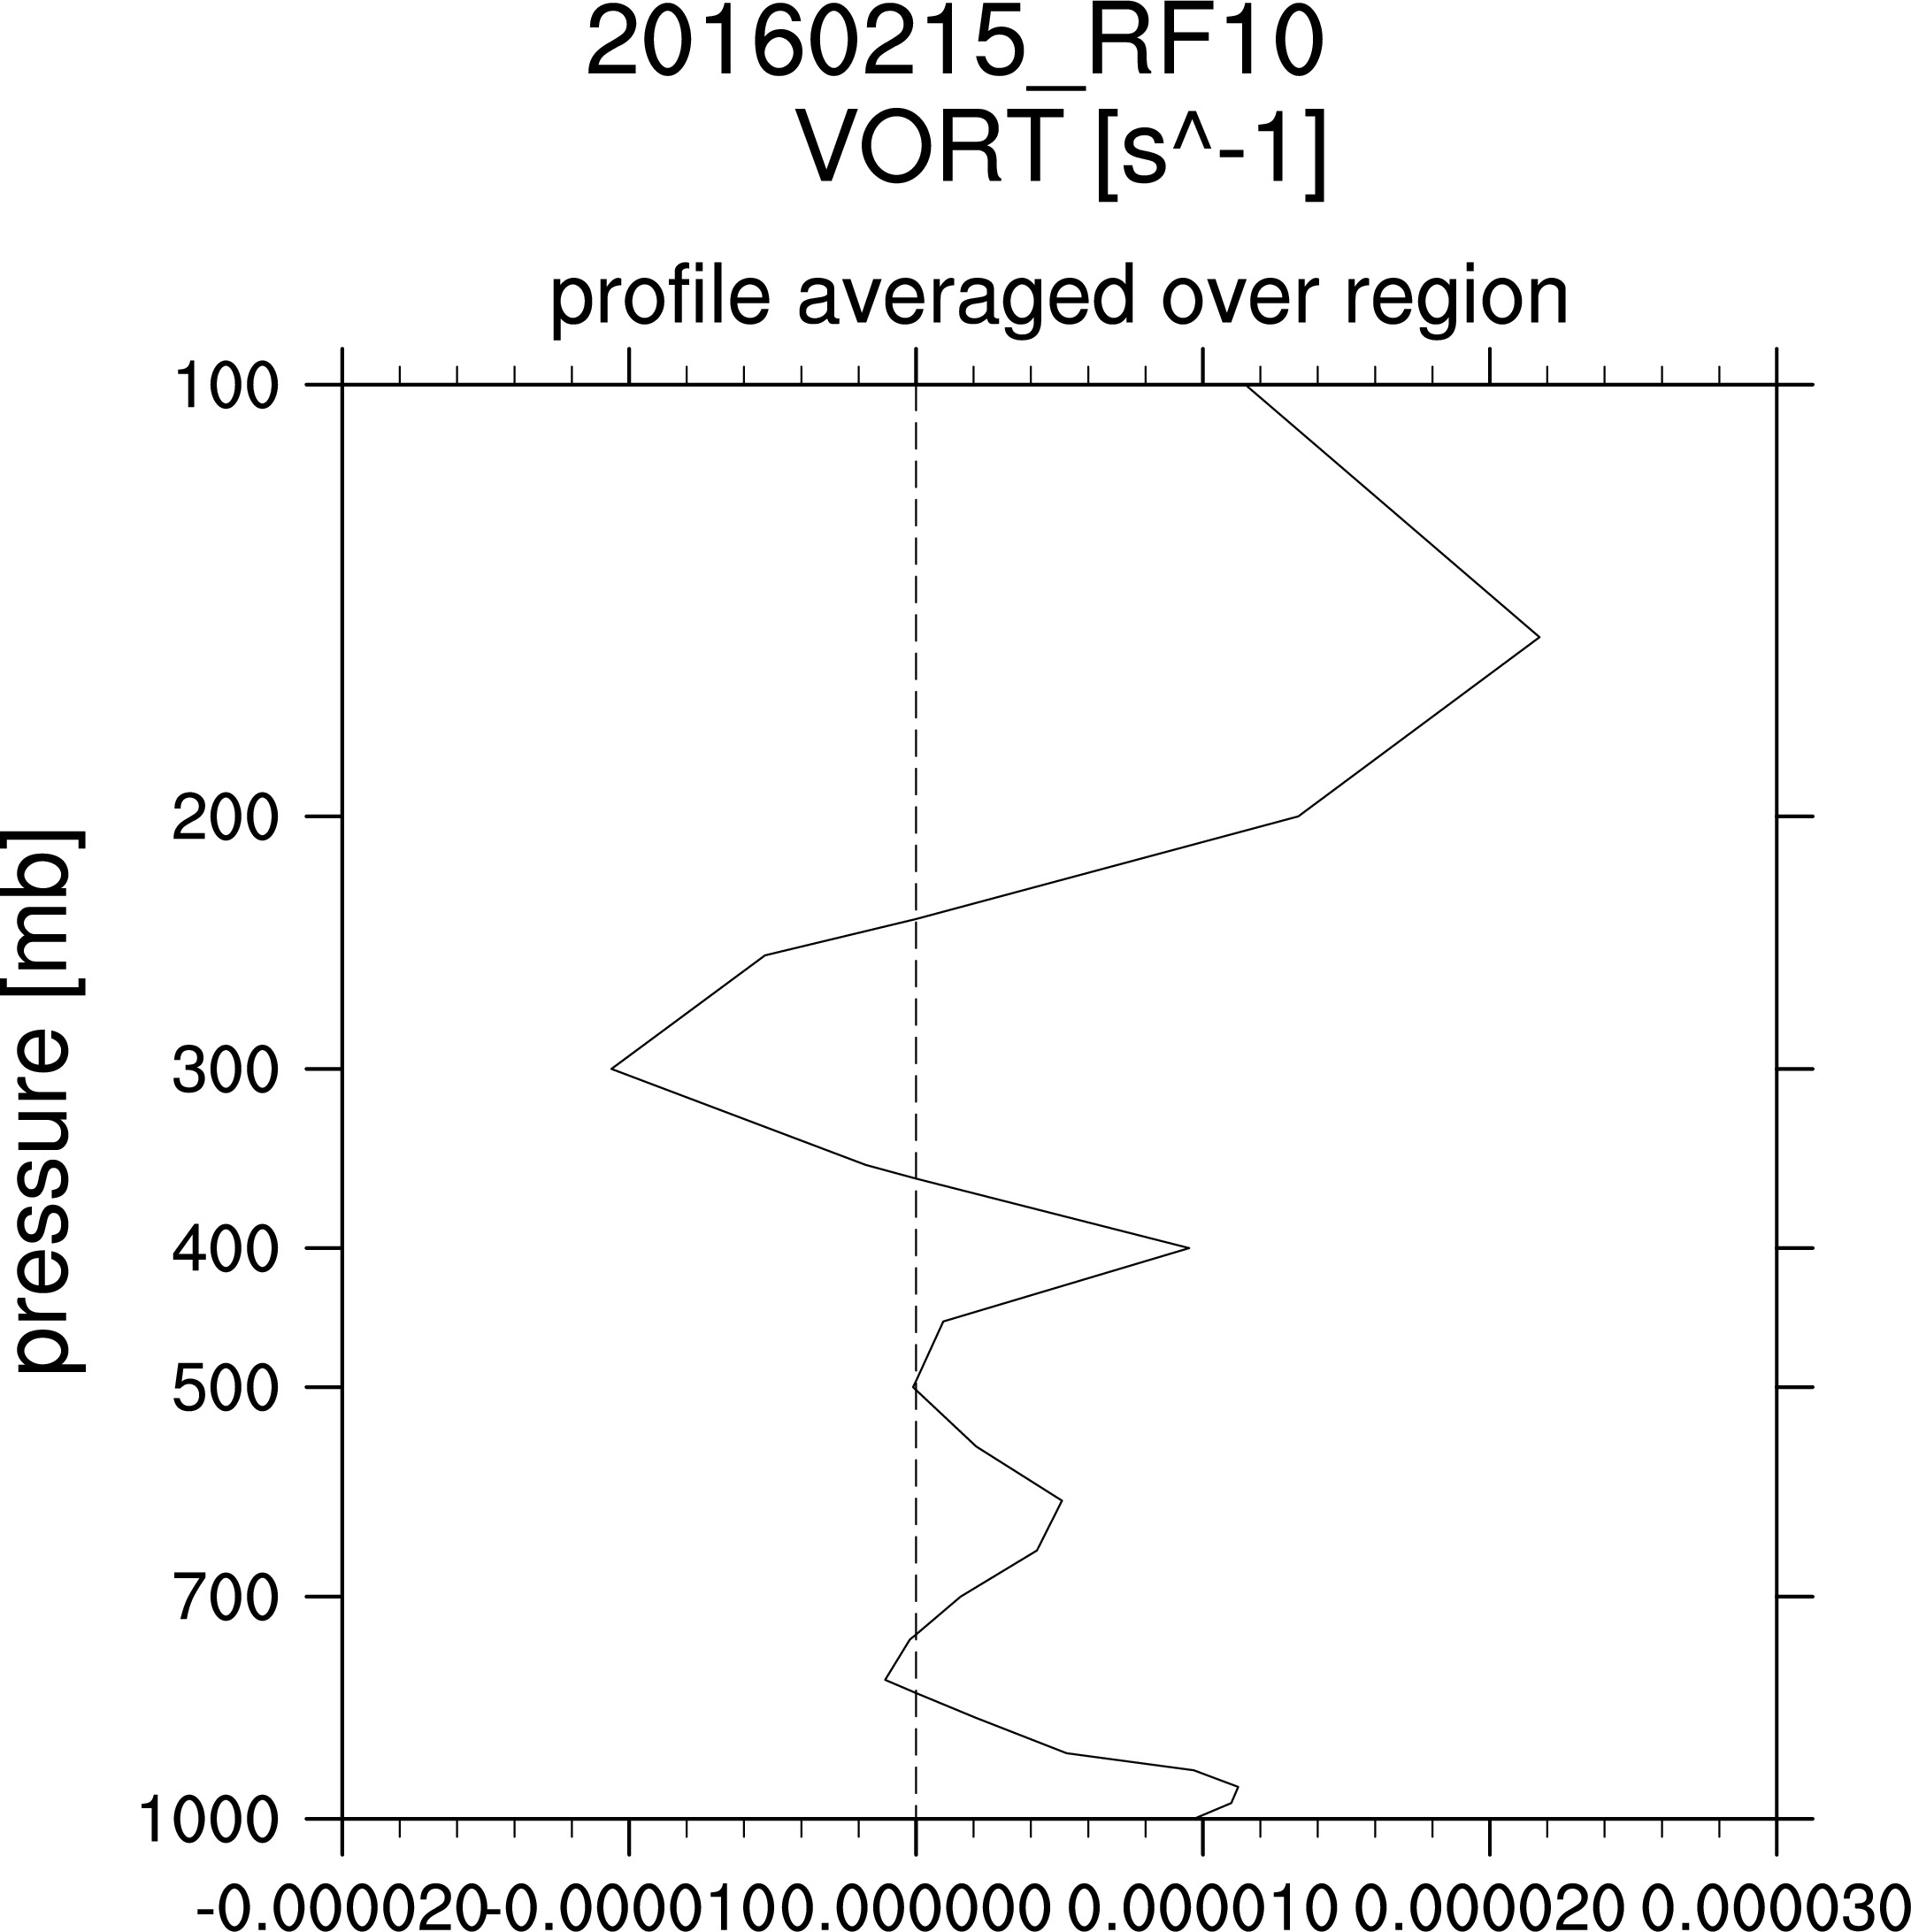
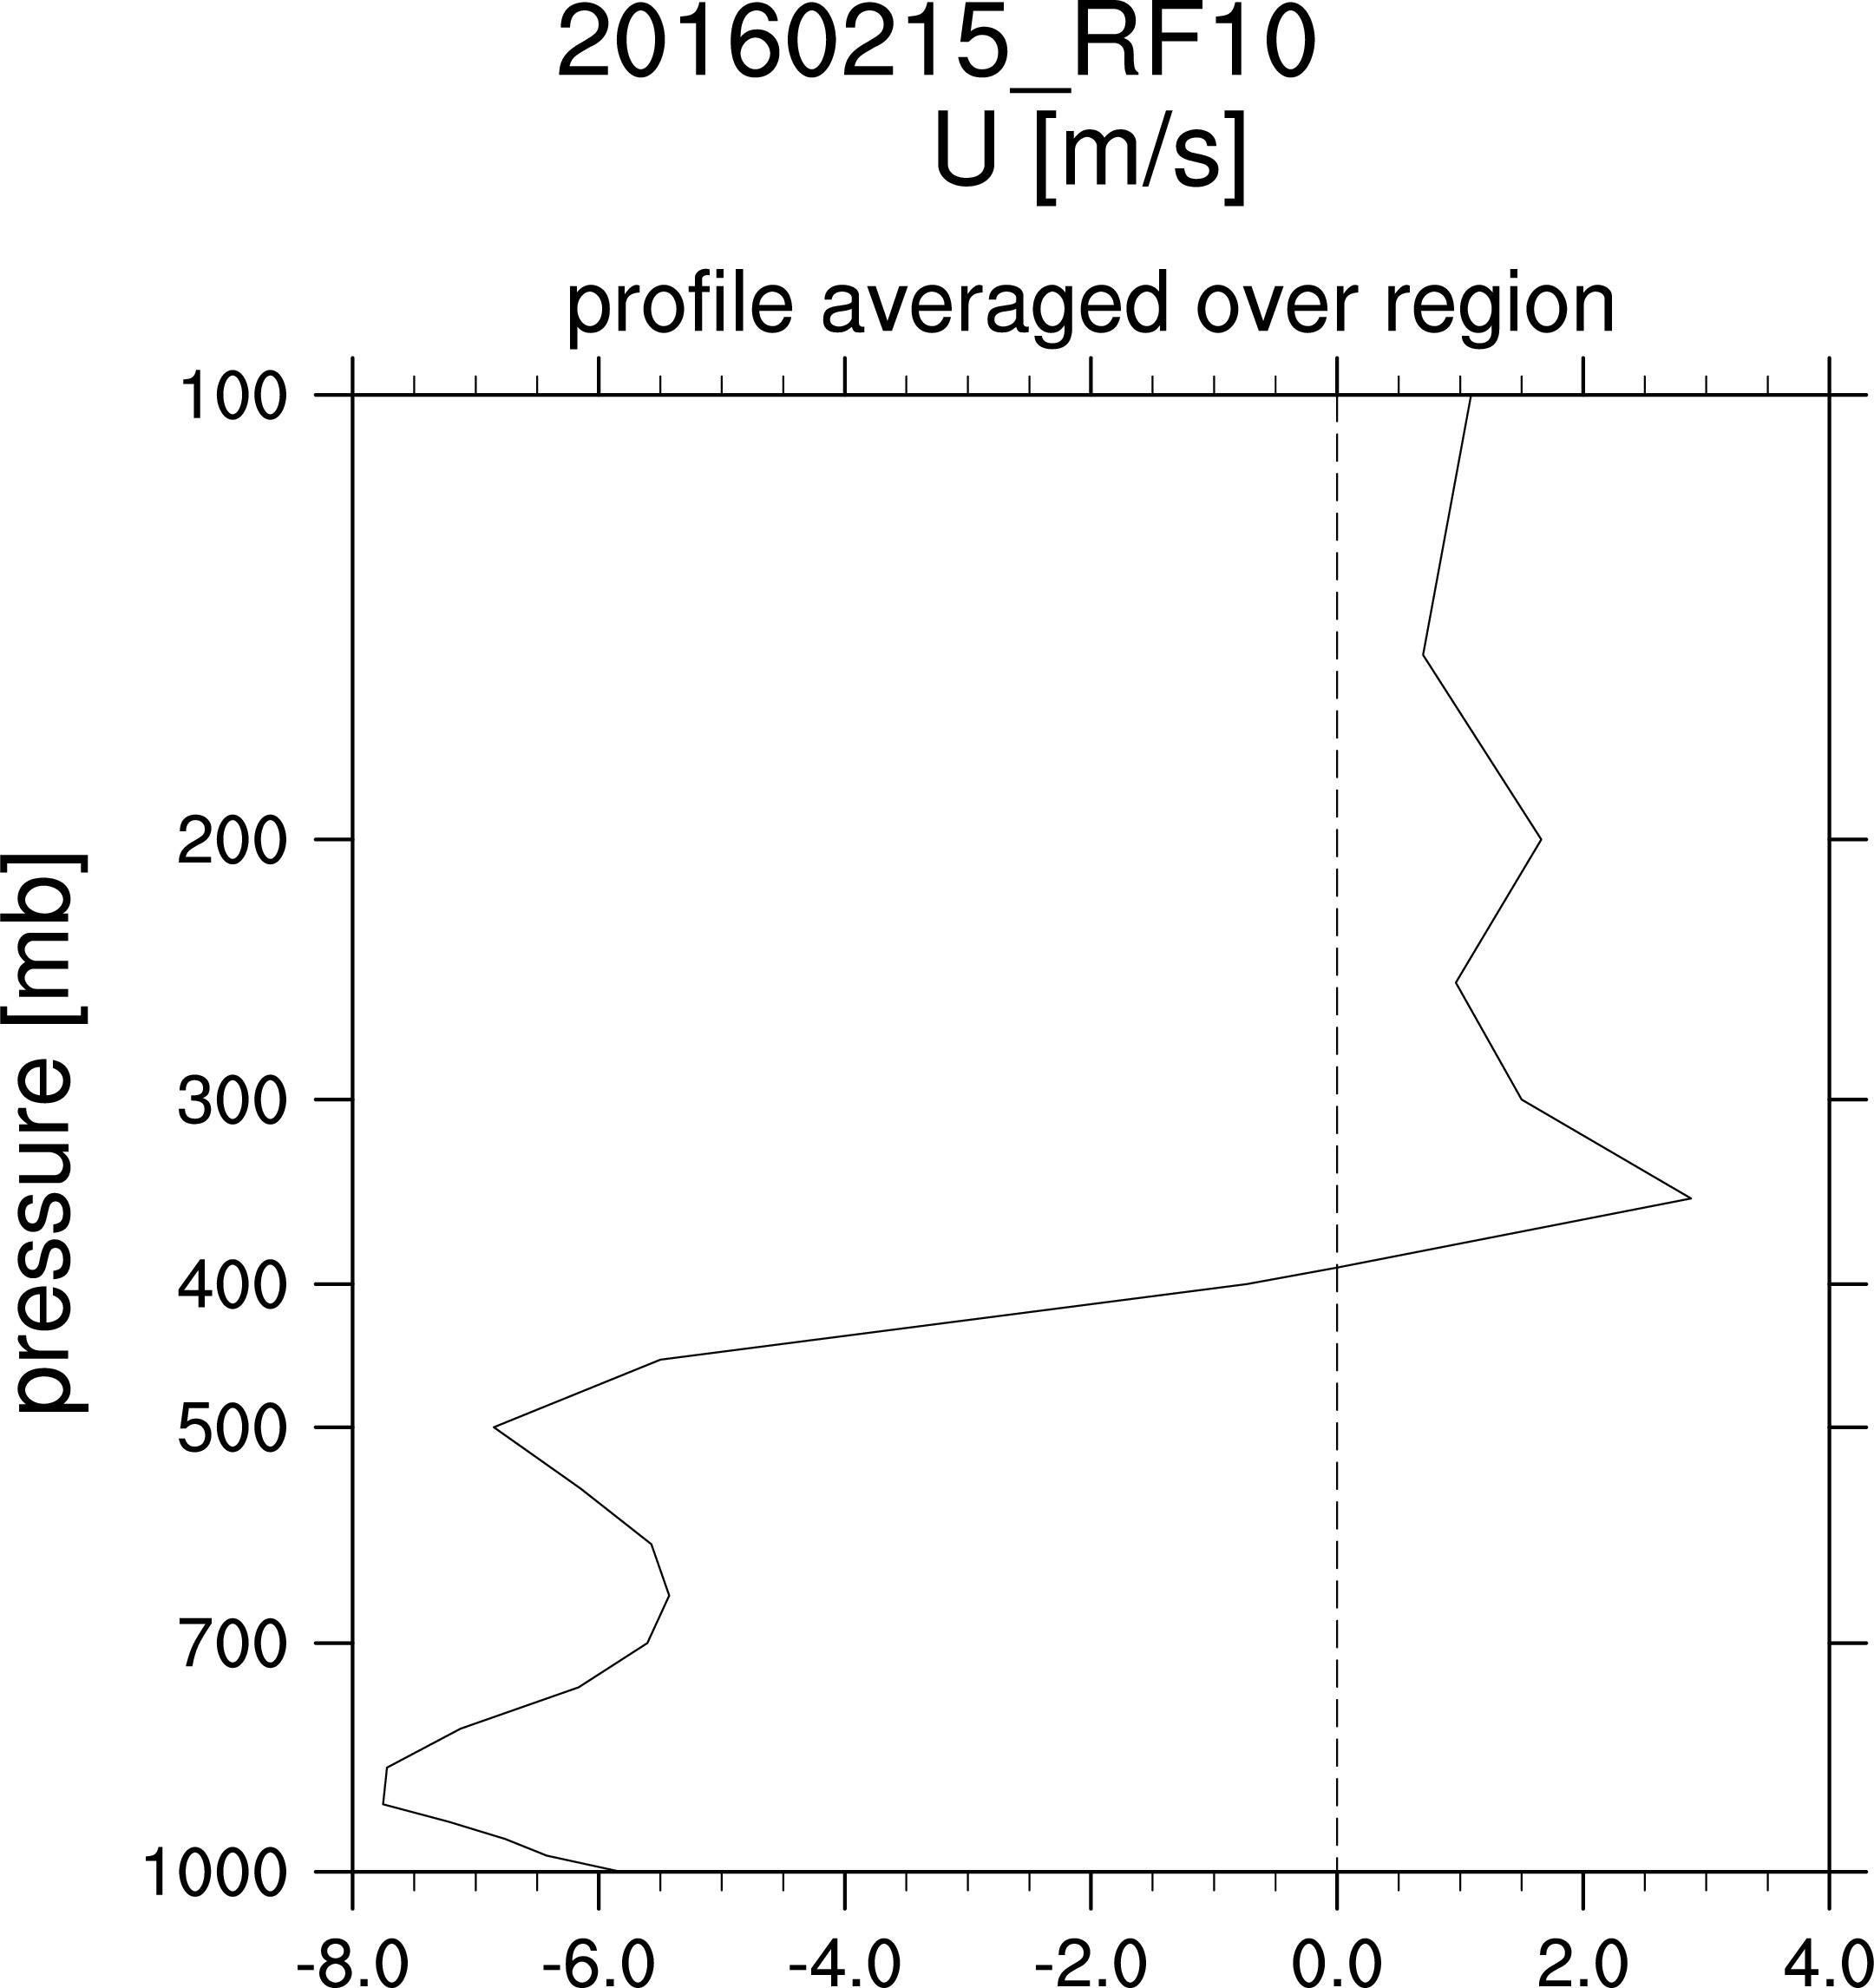
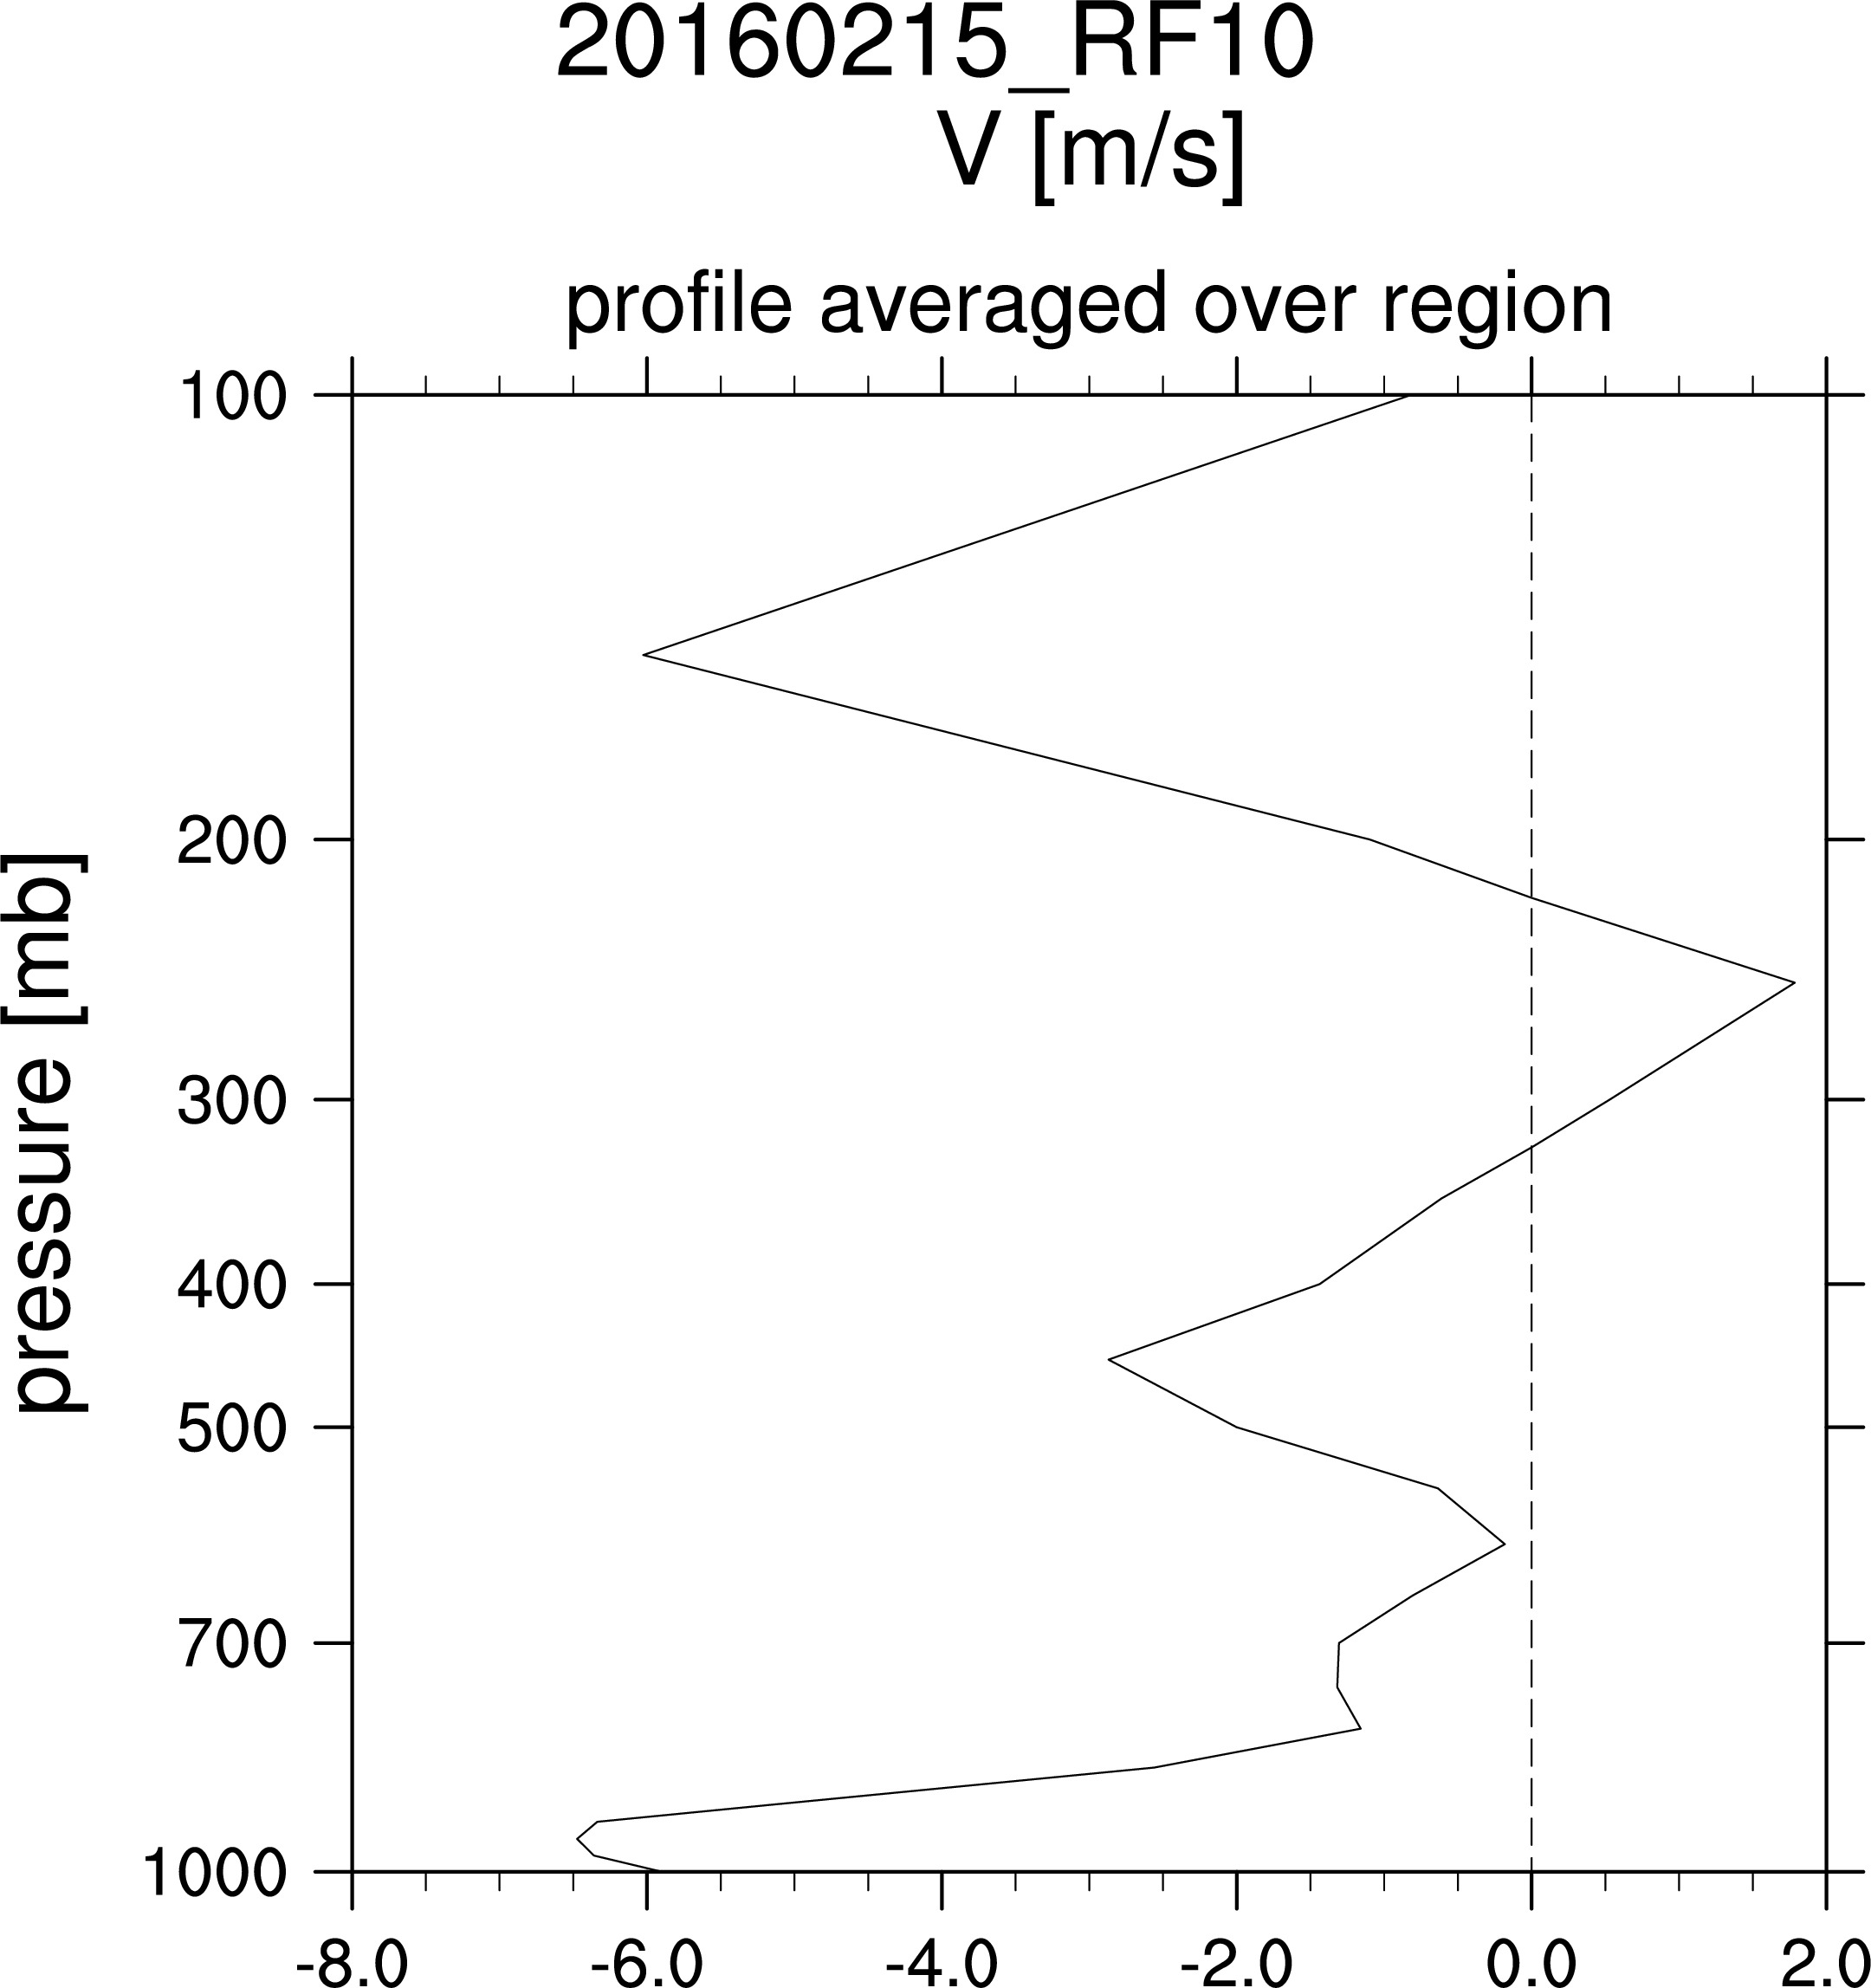
Below unless otherwise stated, profiles are for integrated wrap area, i.e. totals.
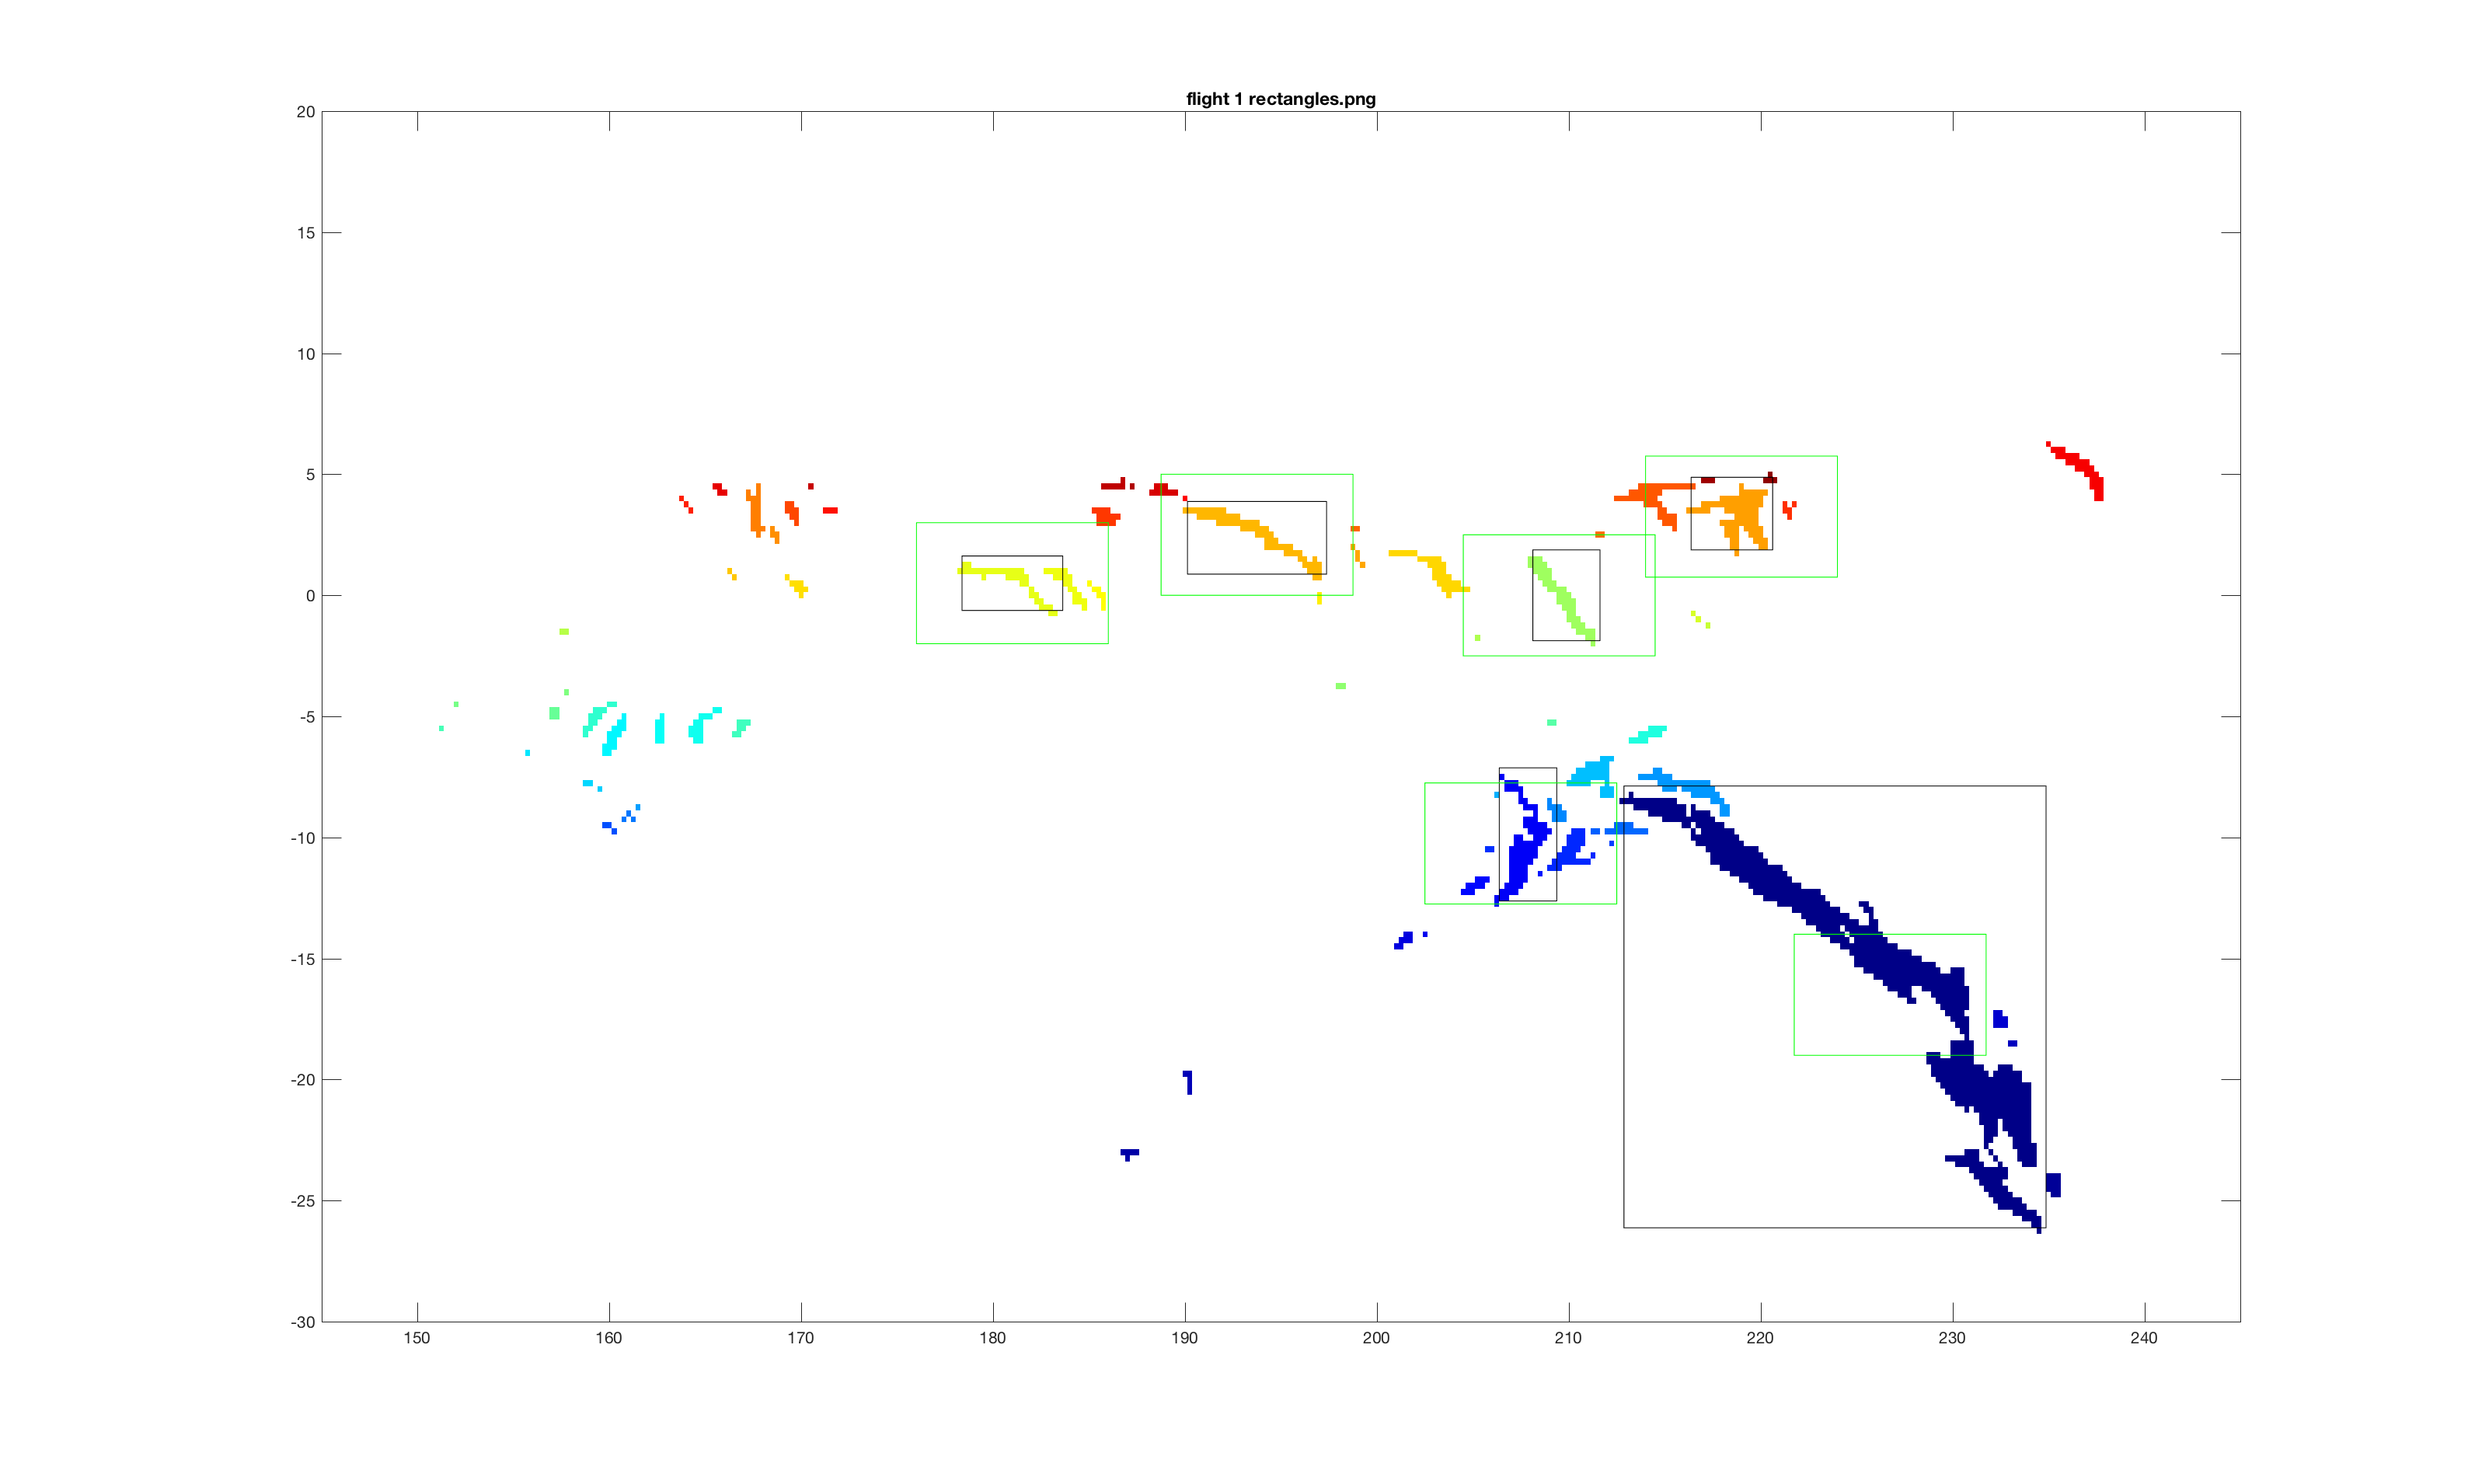
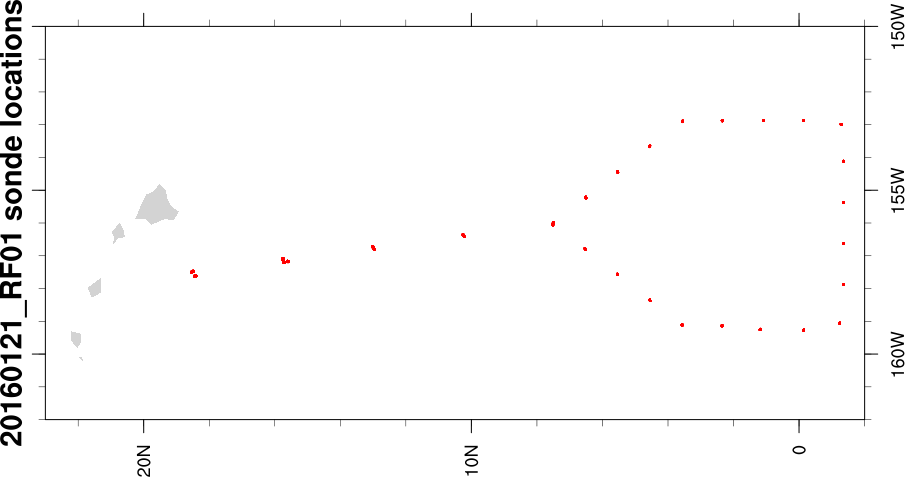
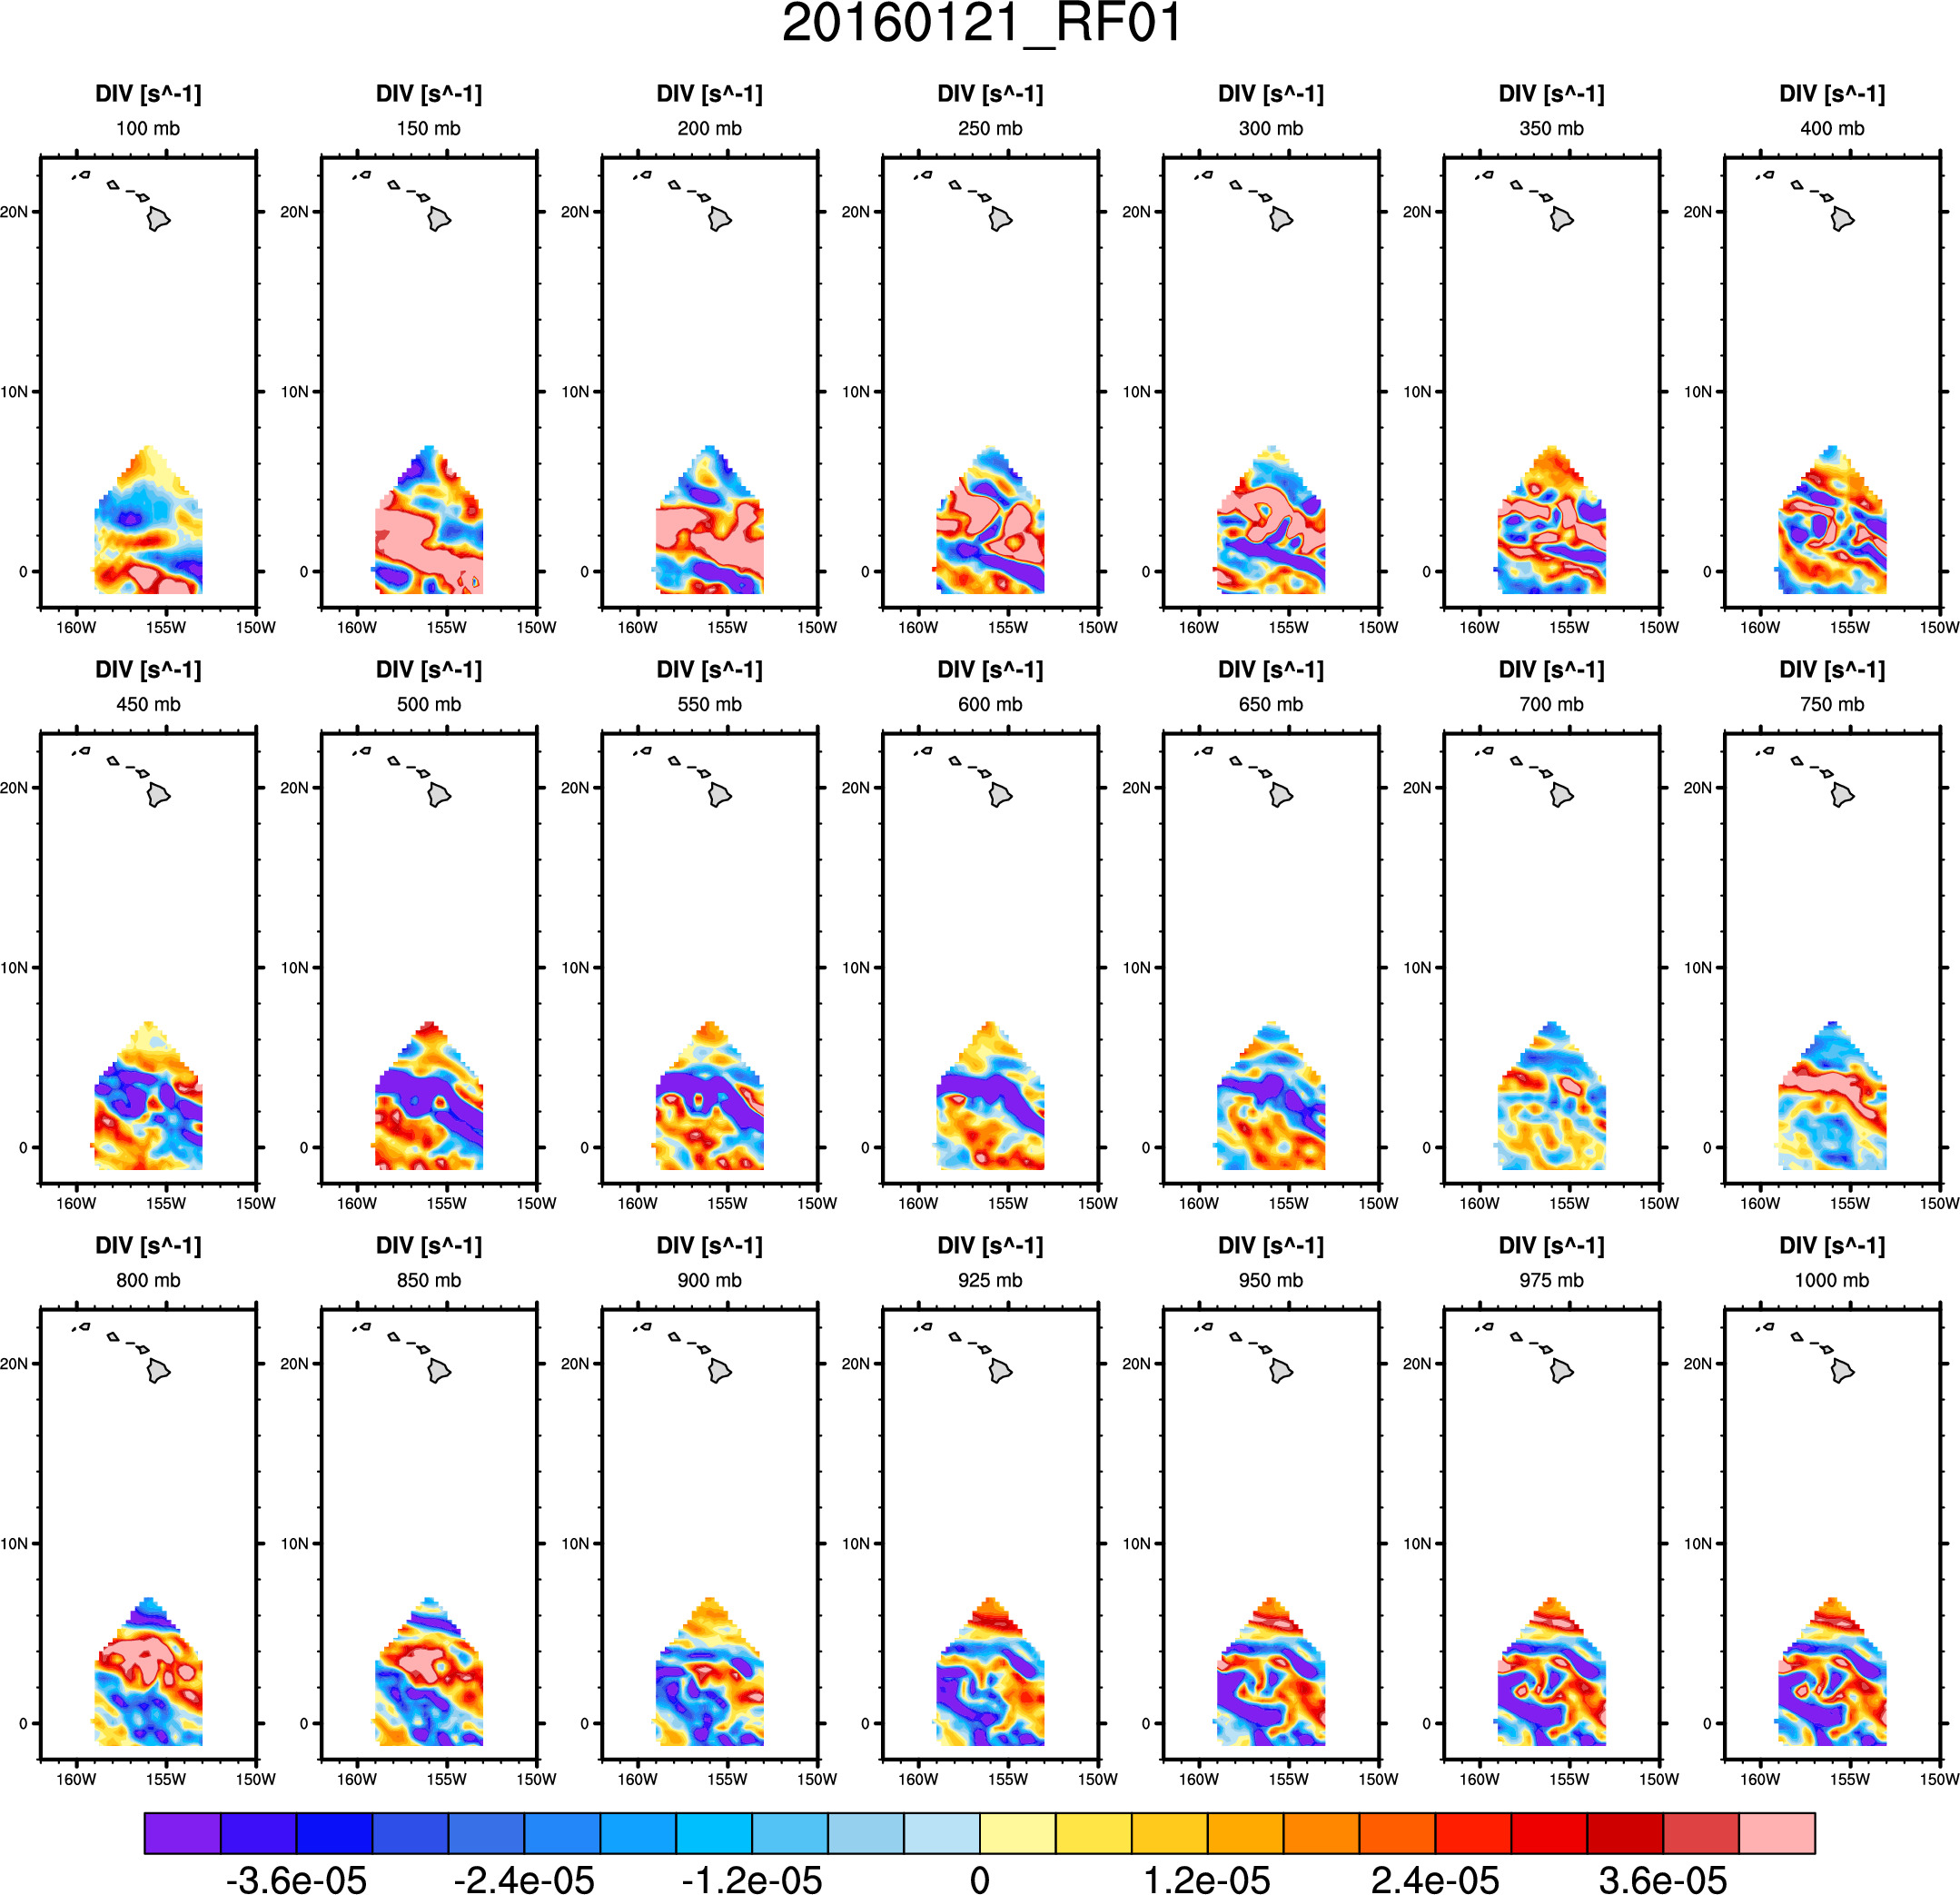
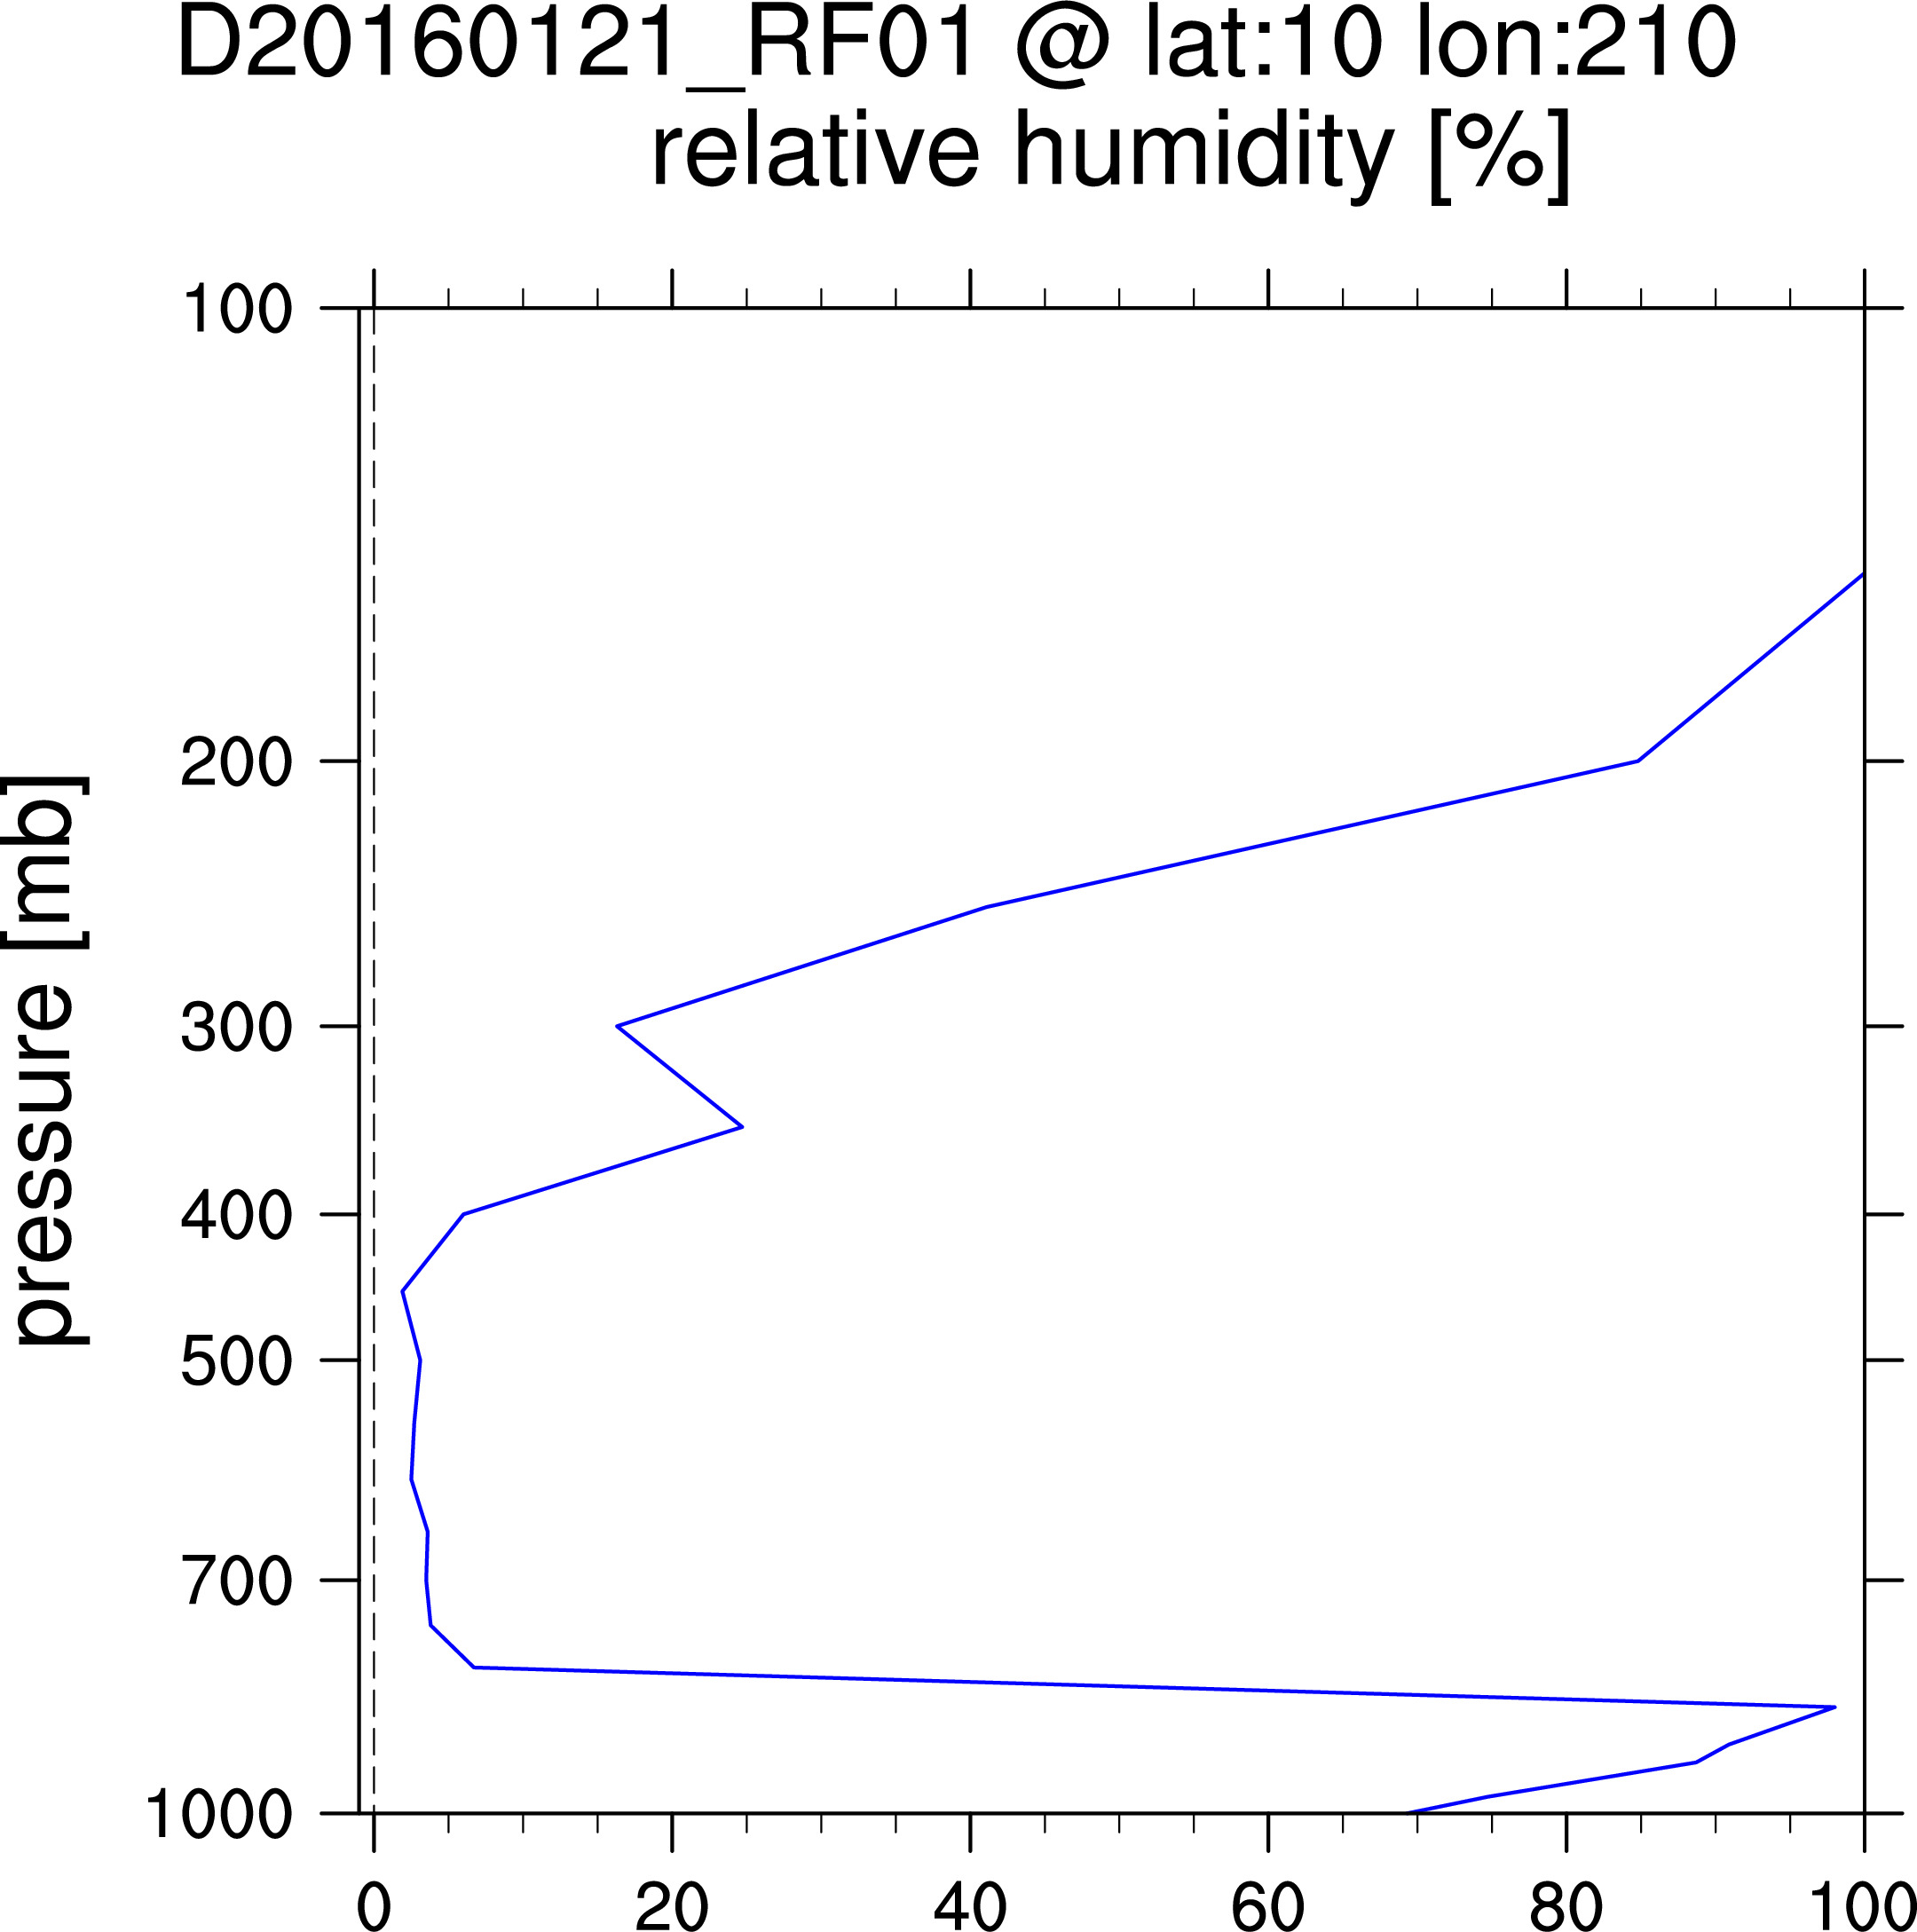
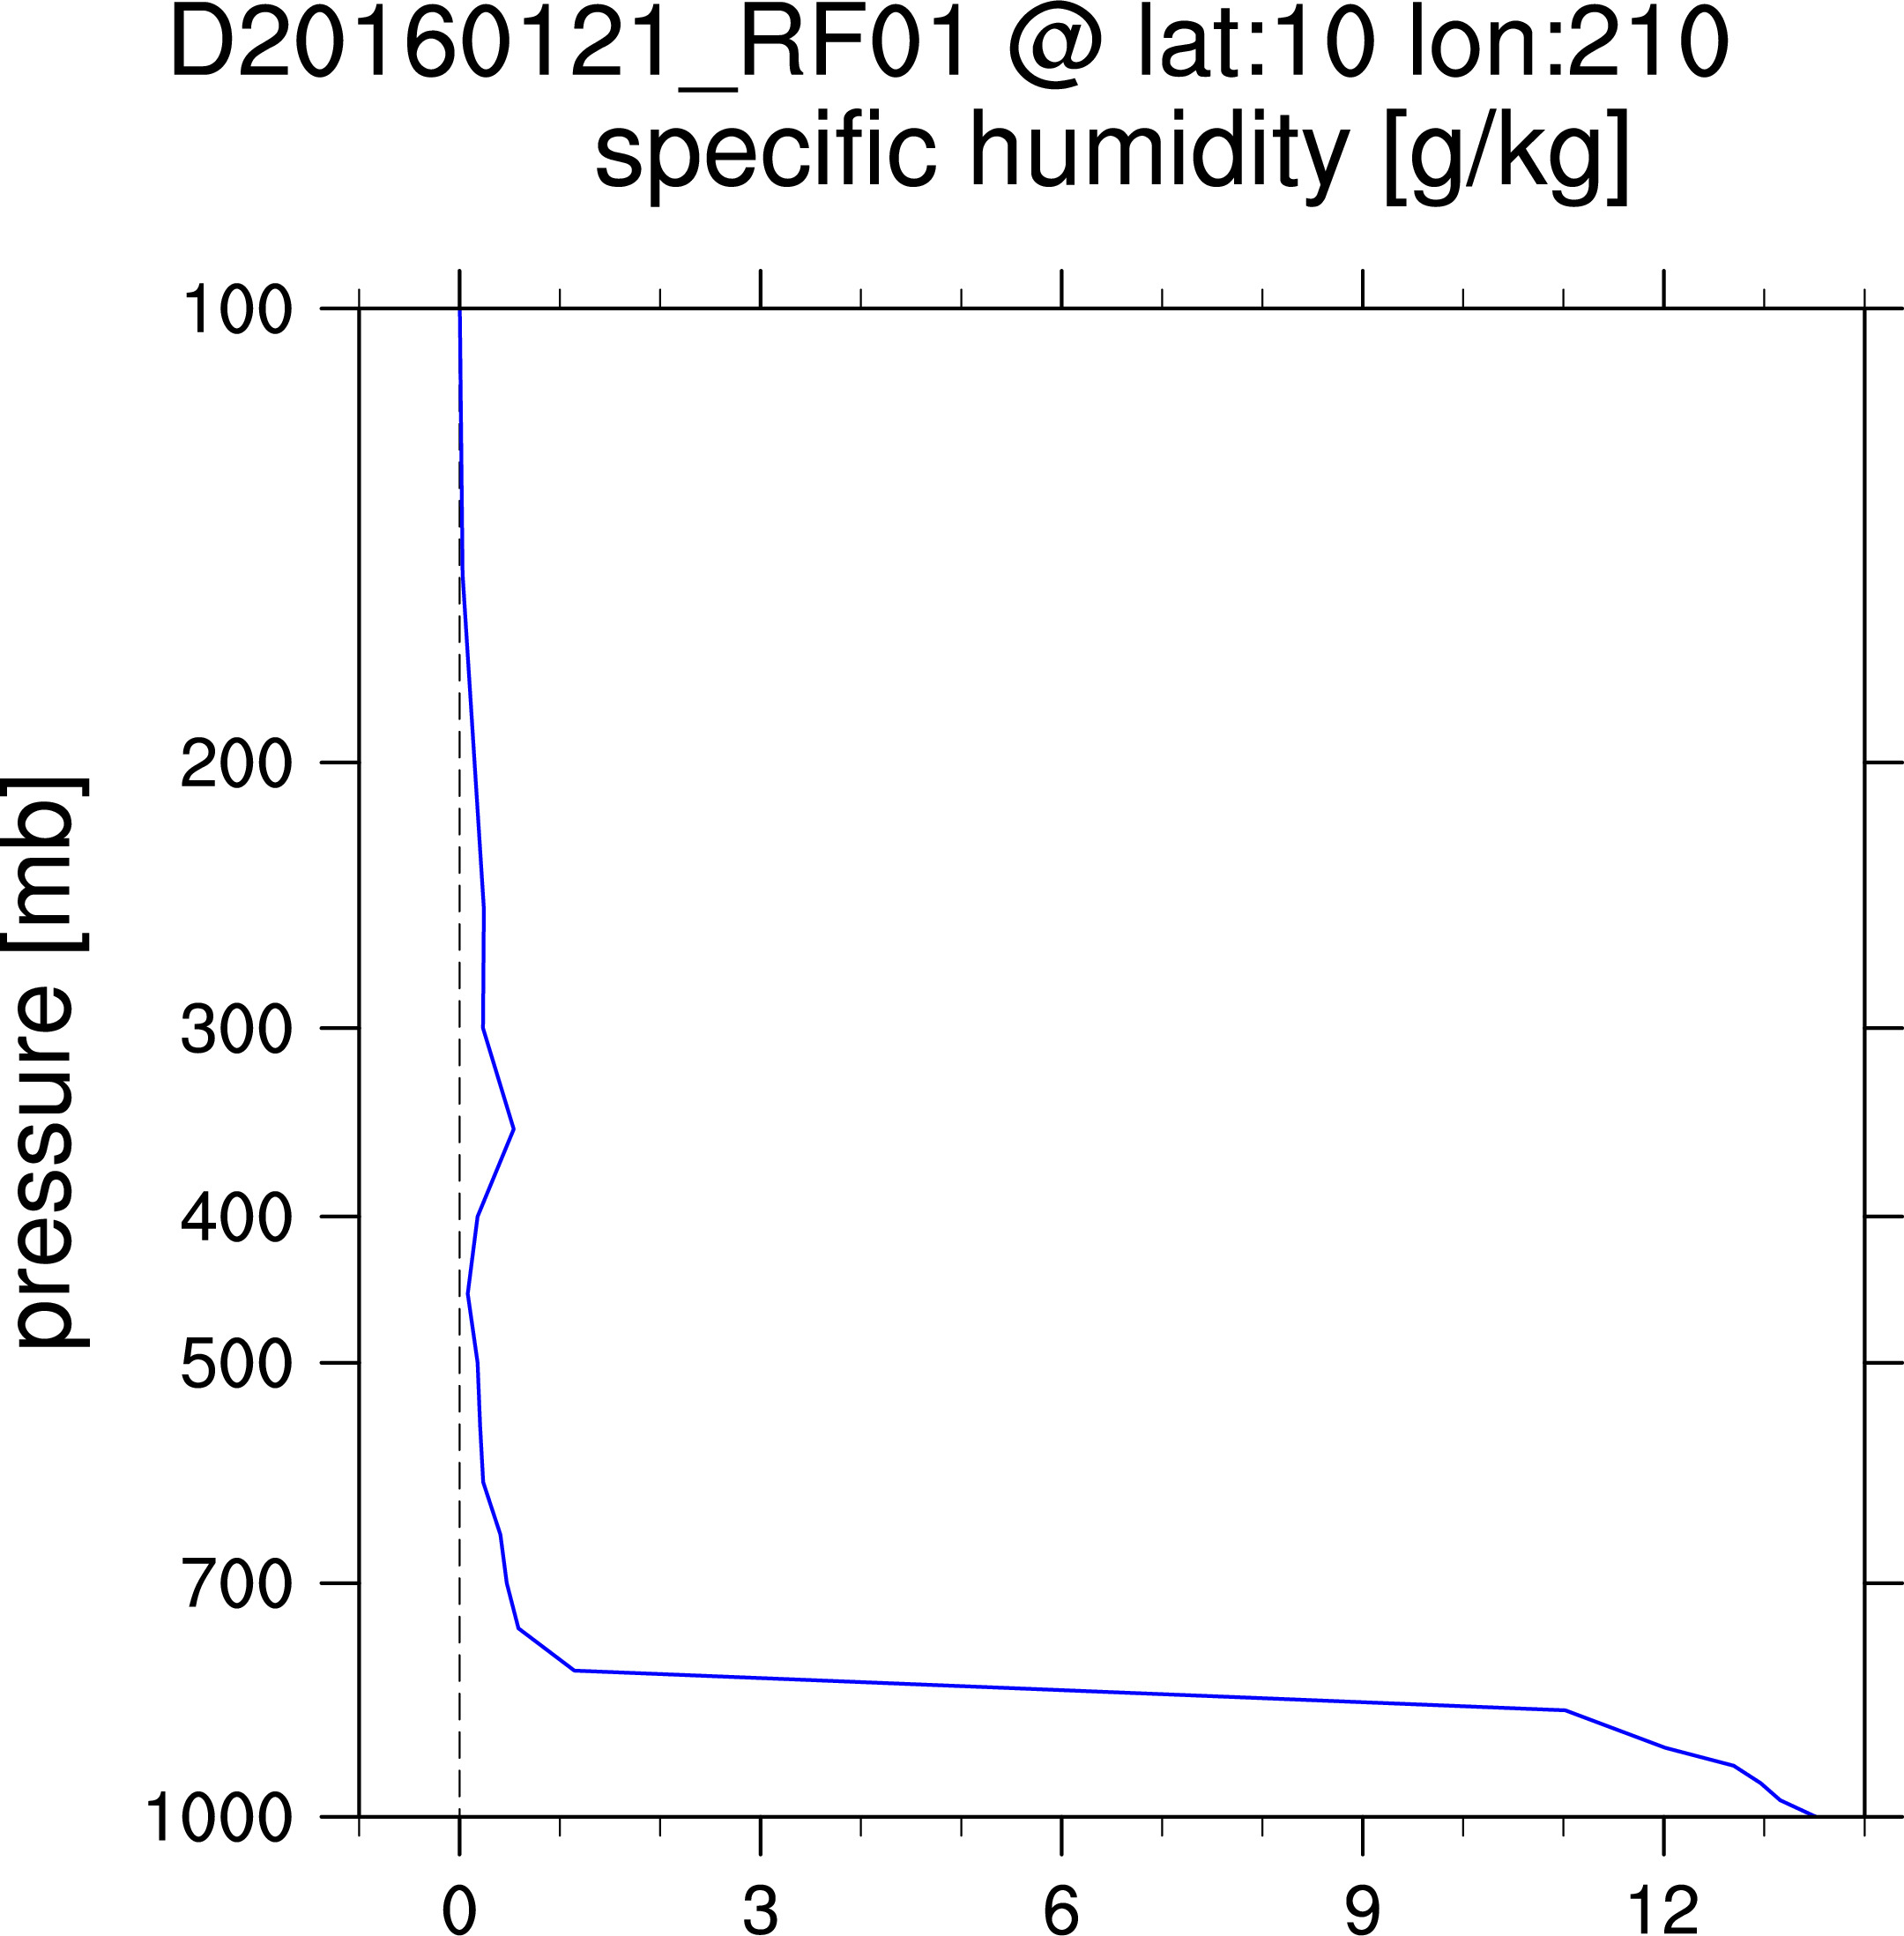
Flight 1: 20160121_RF01 profile.avg.20160121_RF01.xlsx area ~ 693.

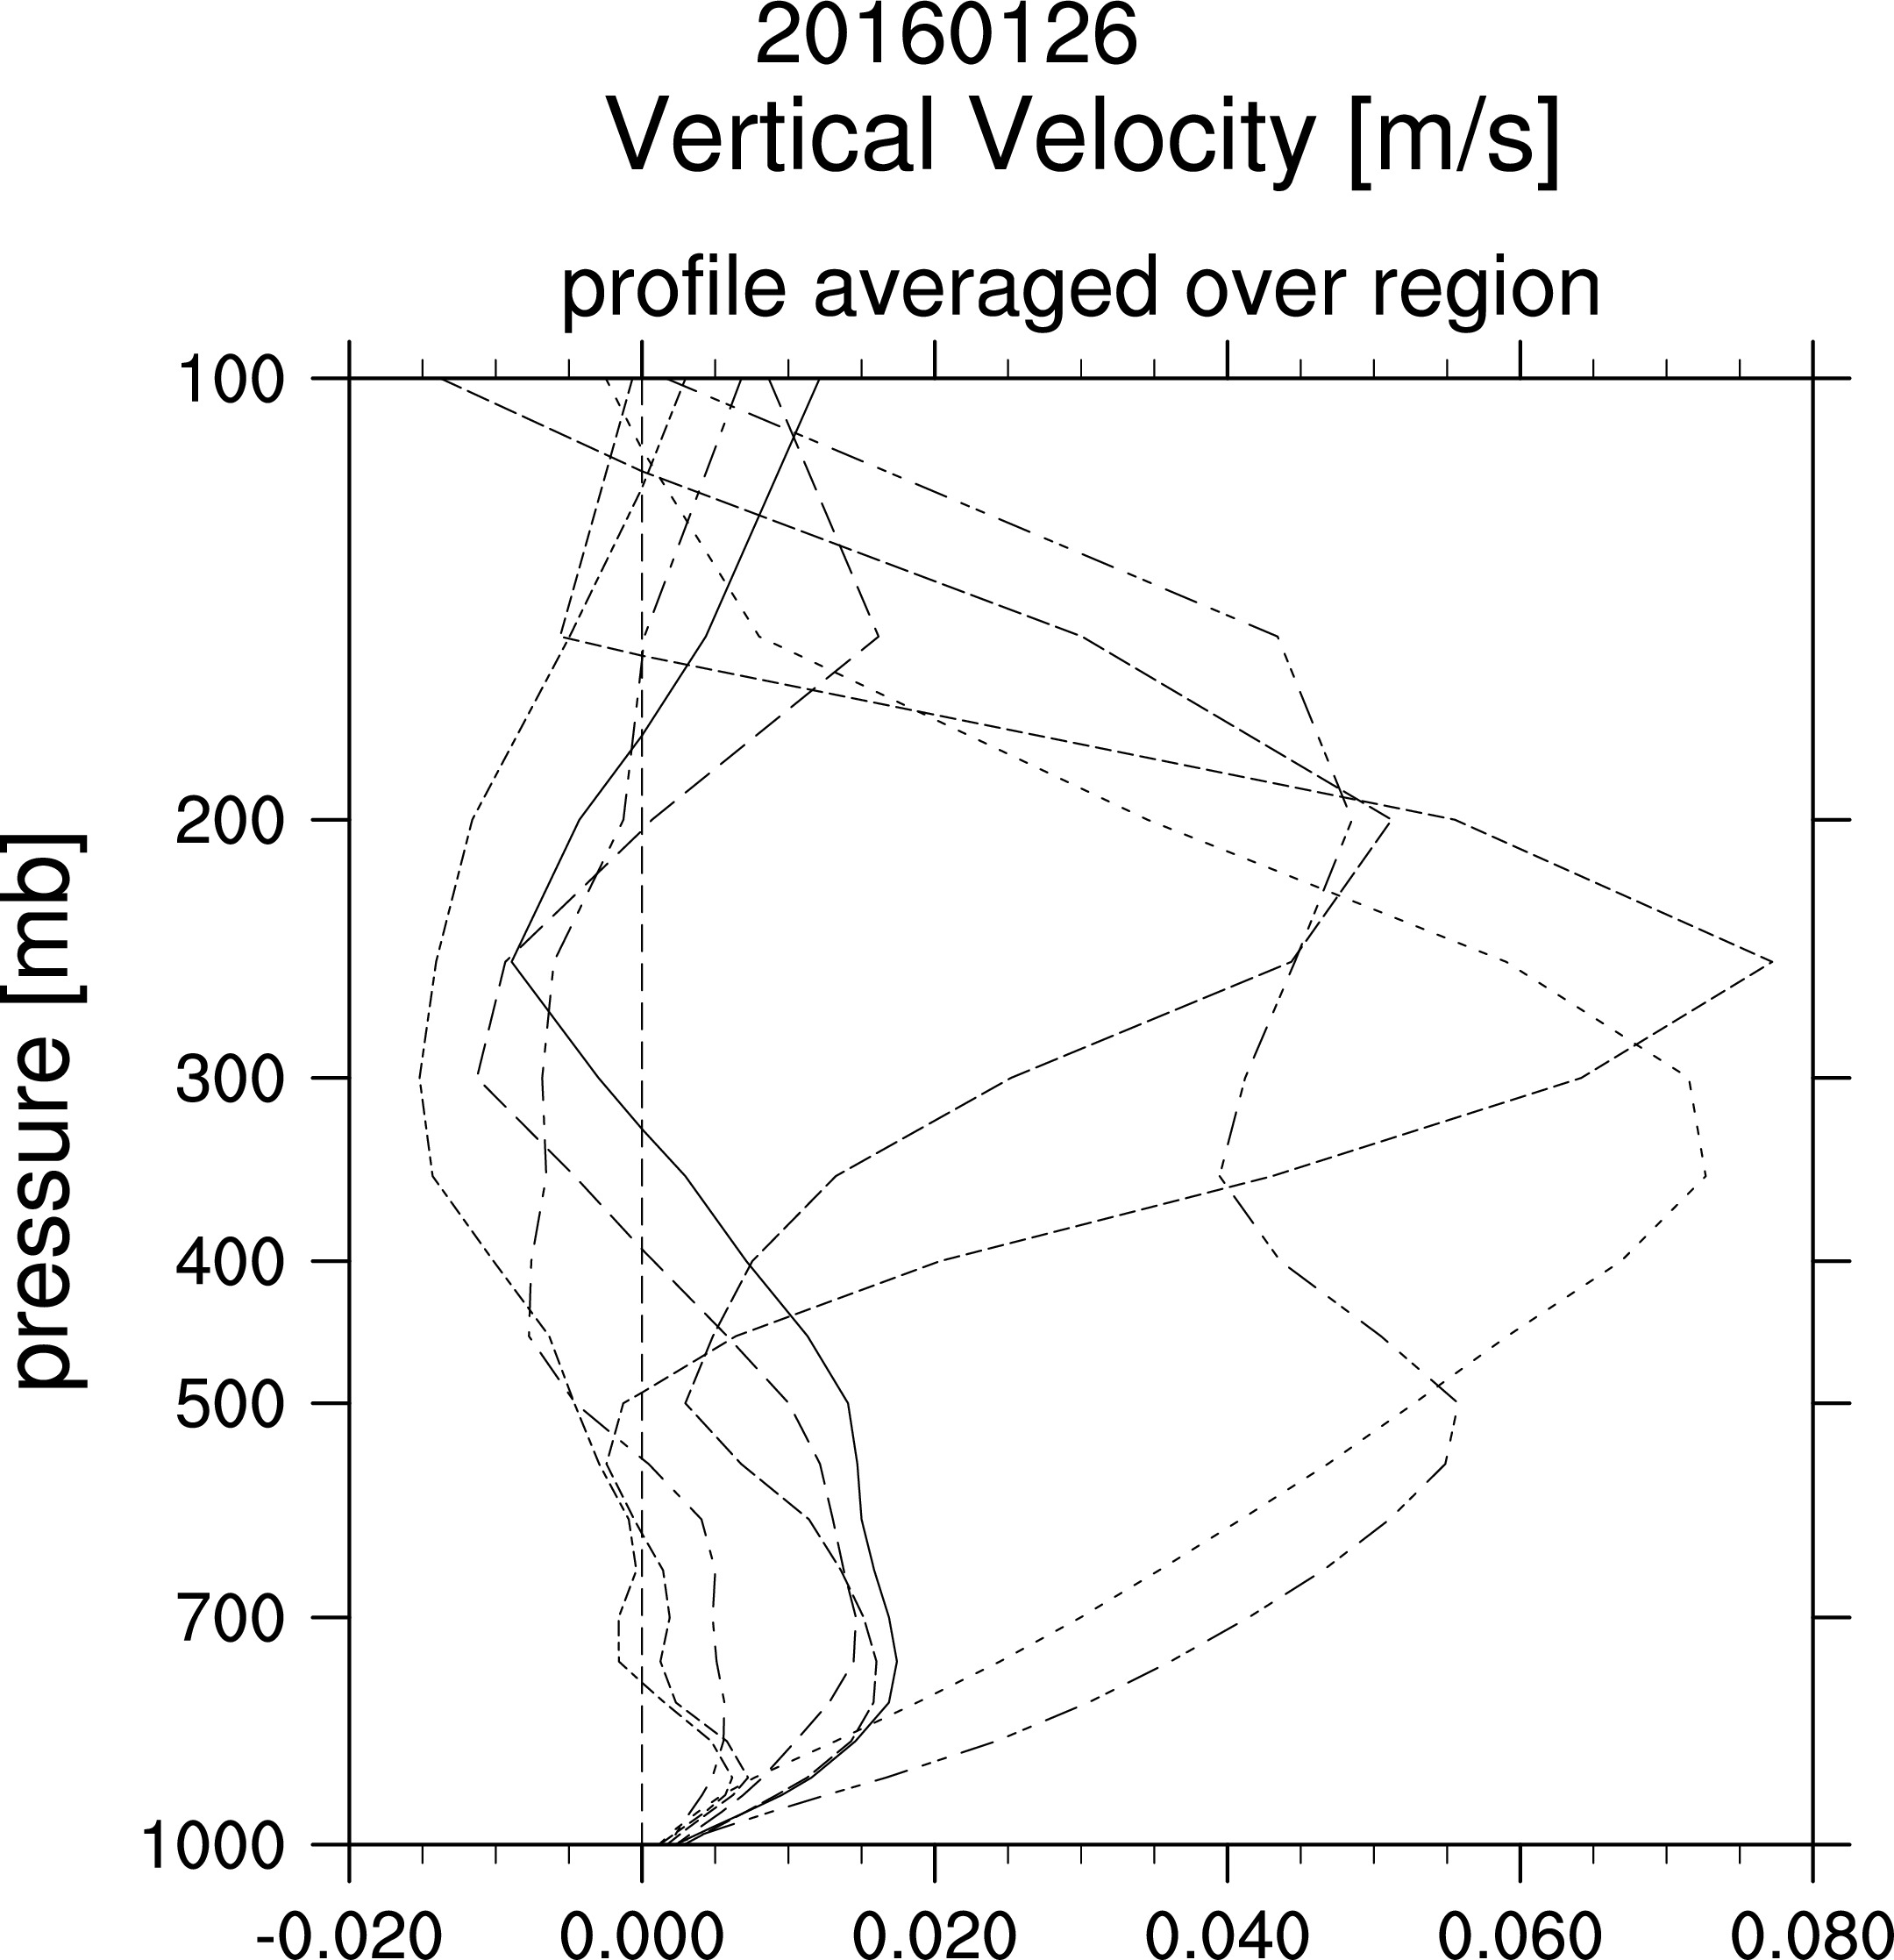
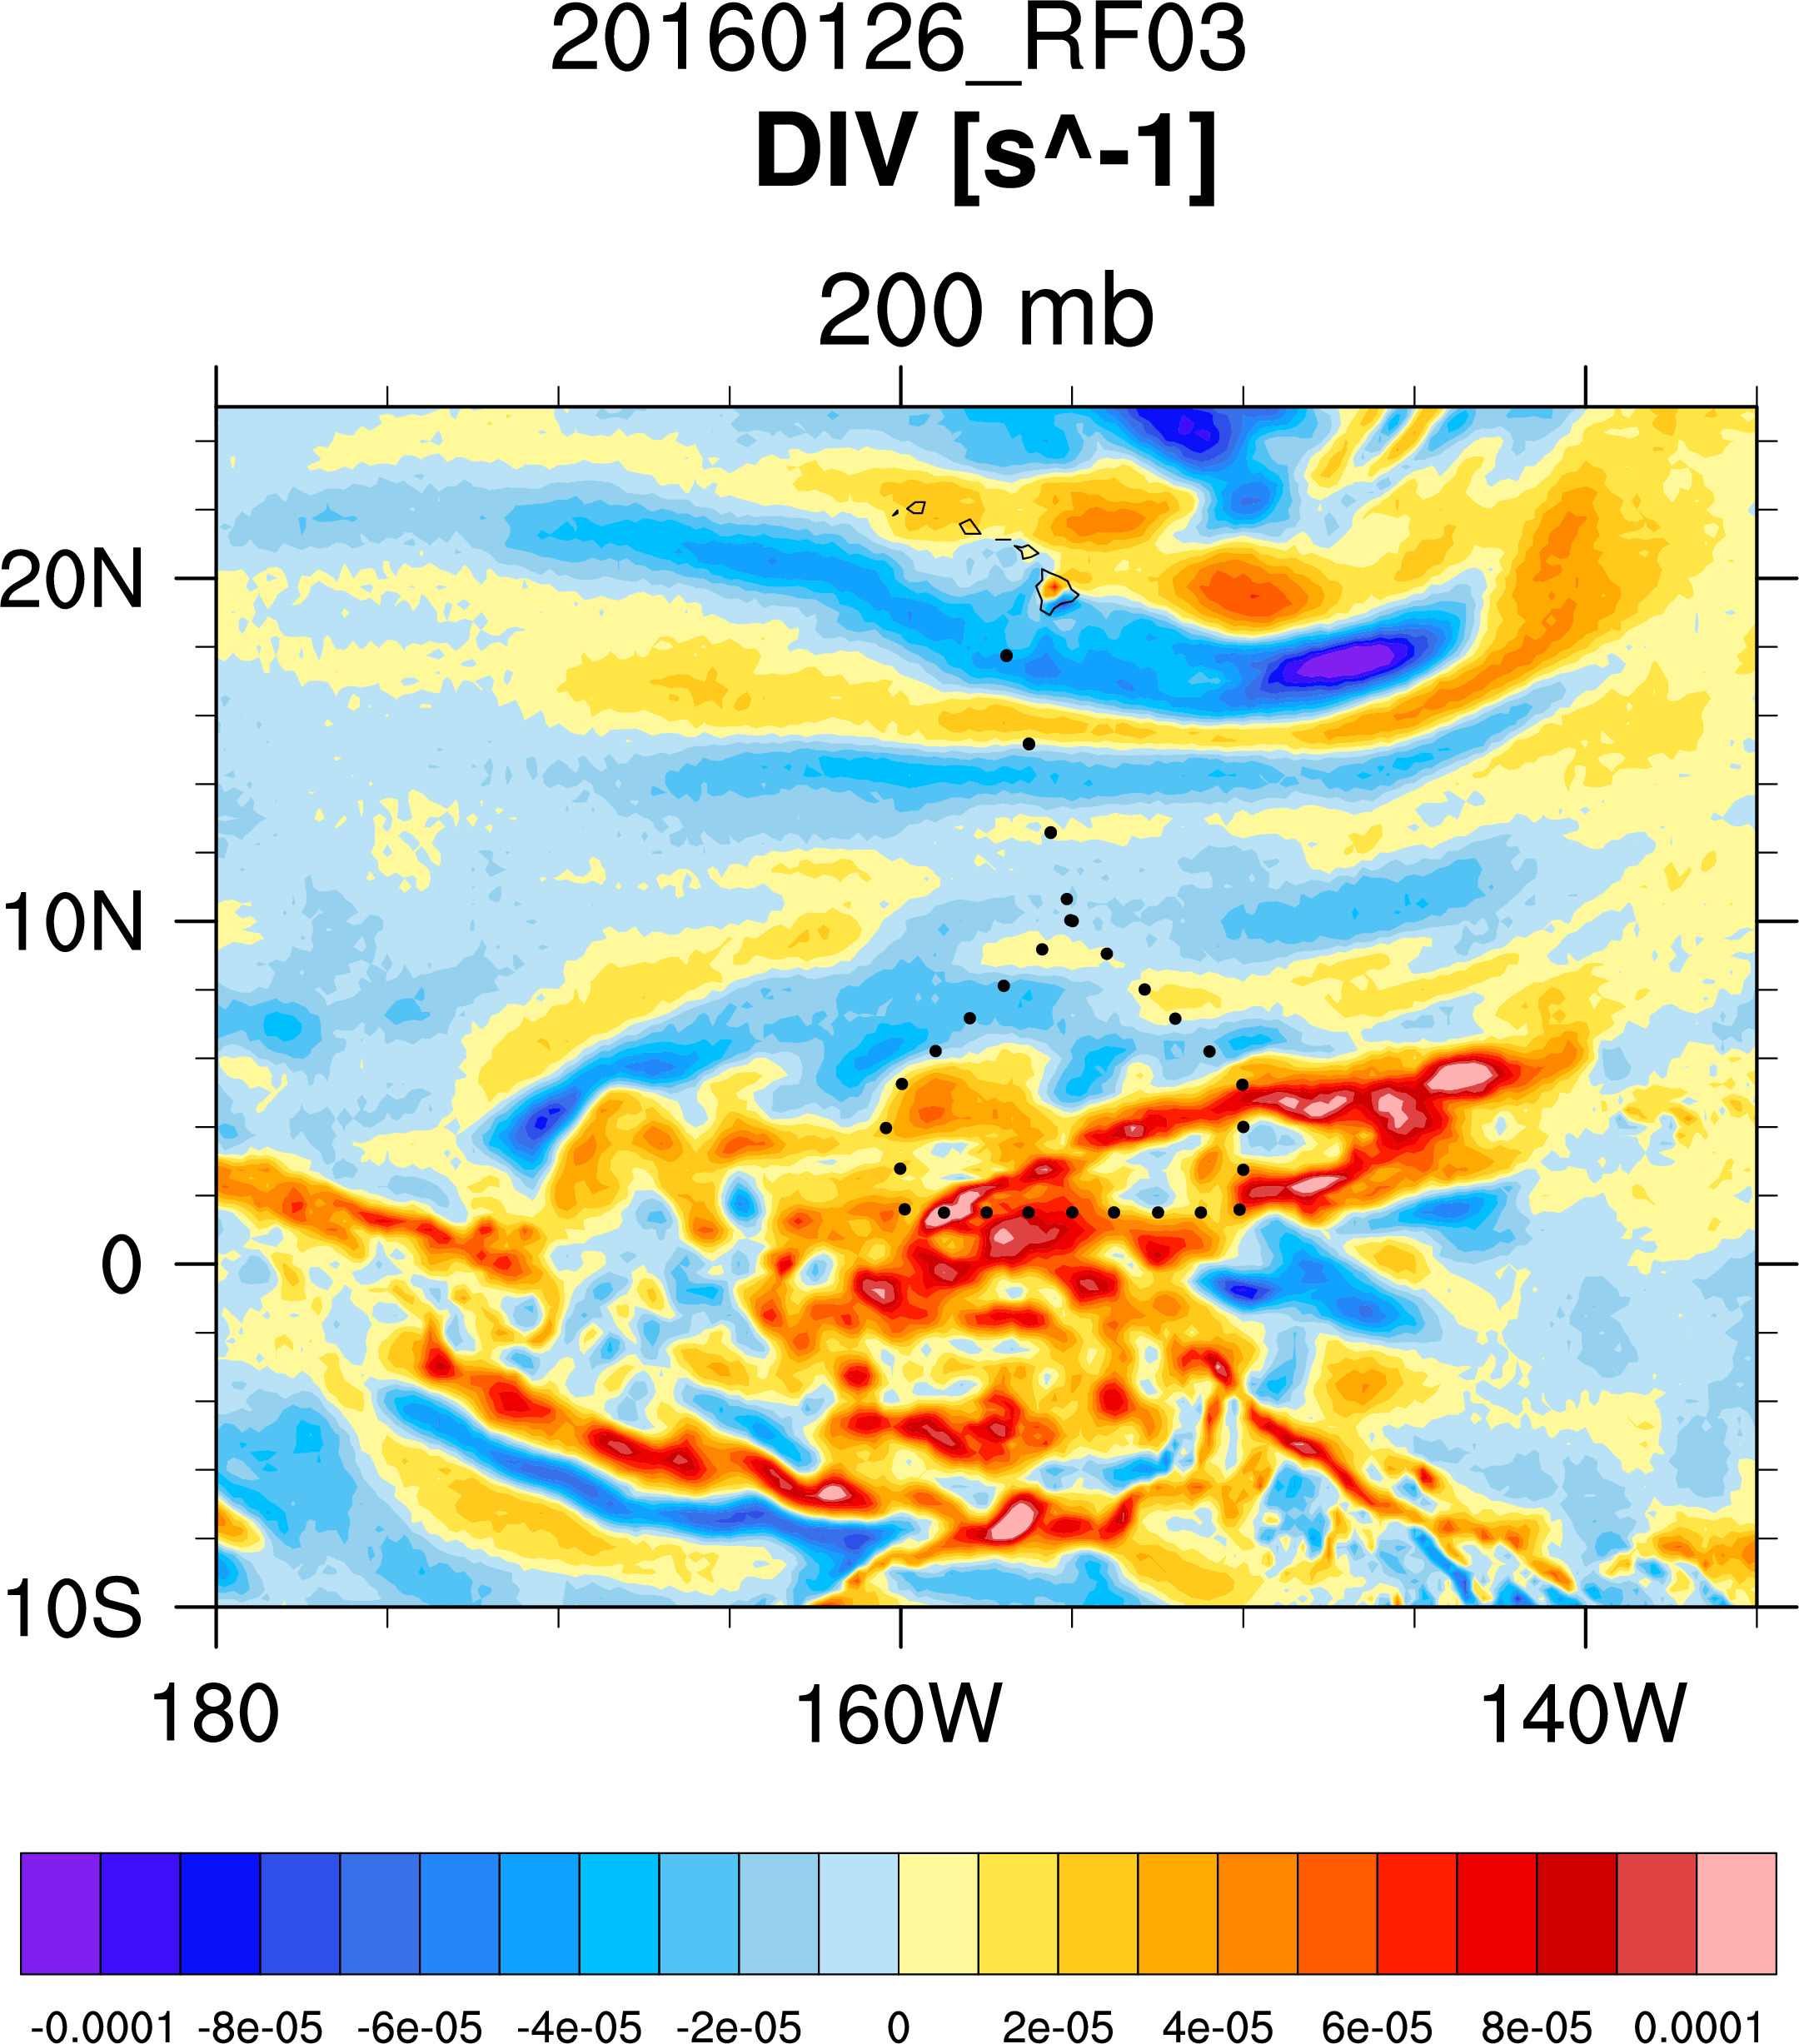
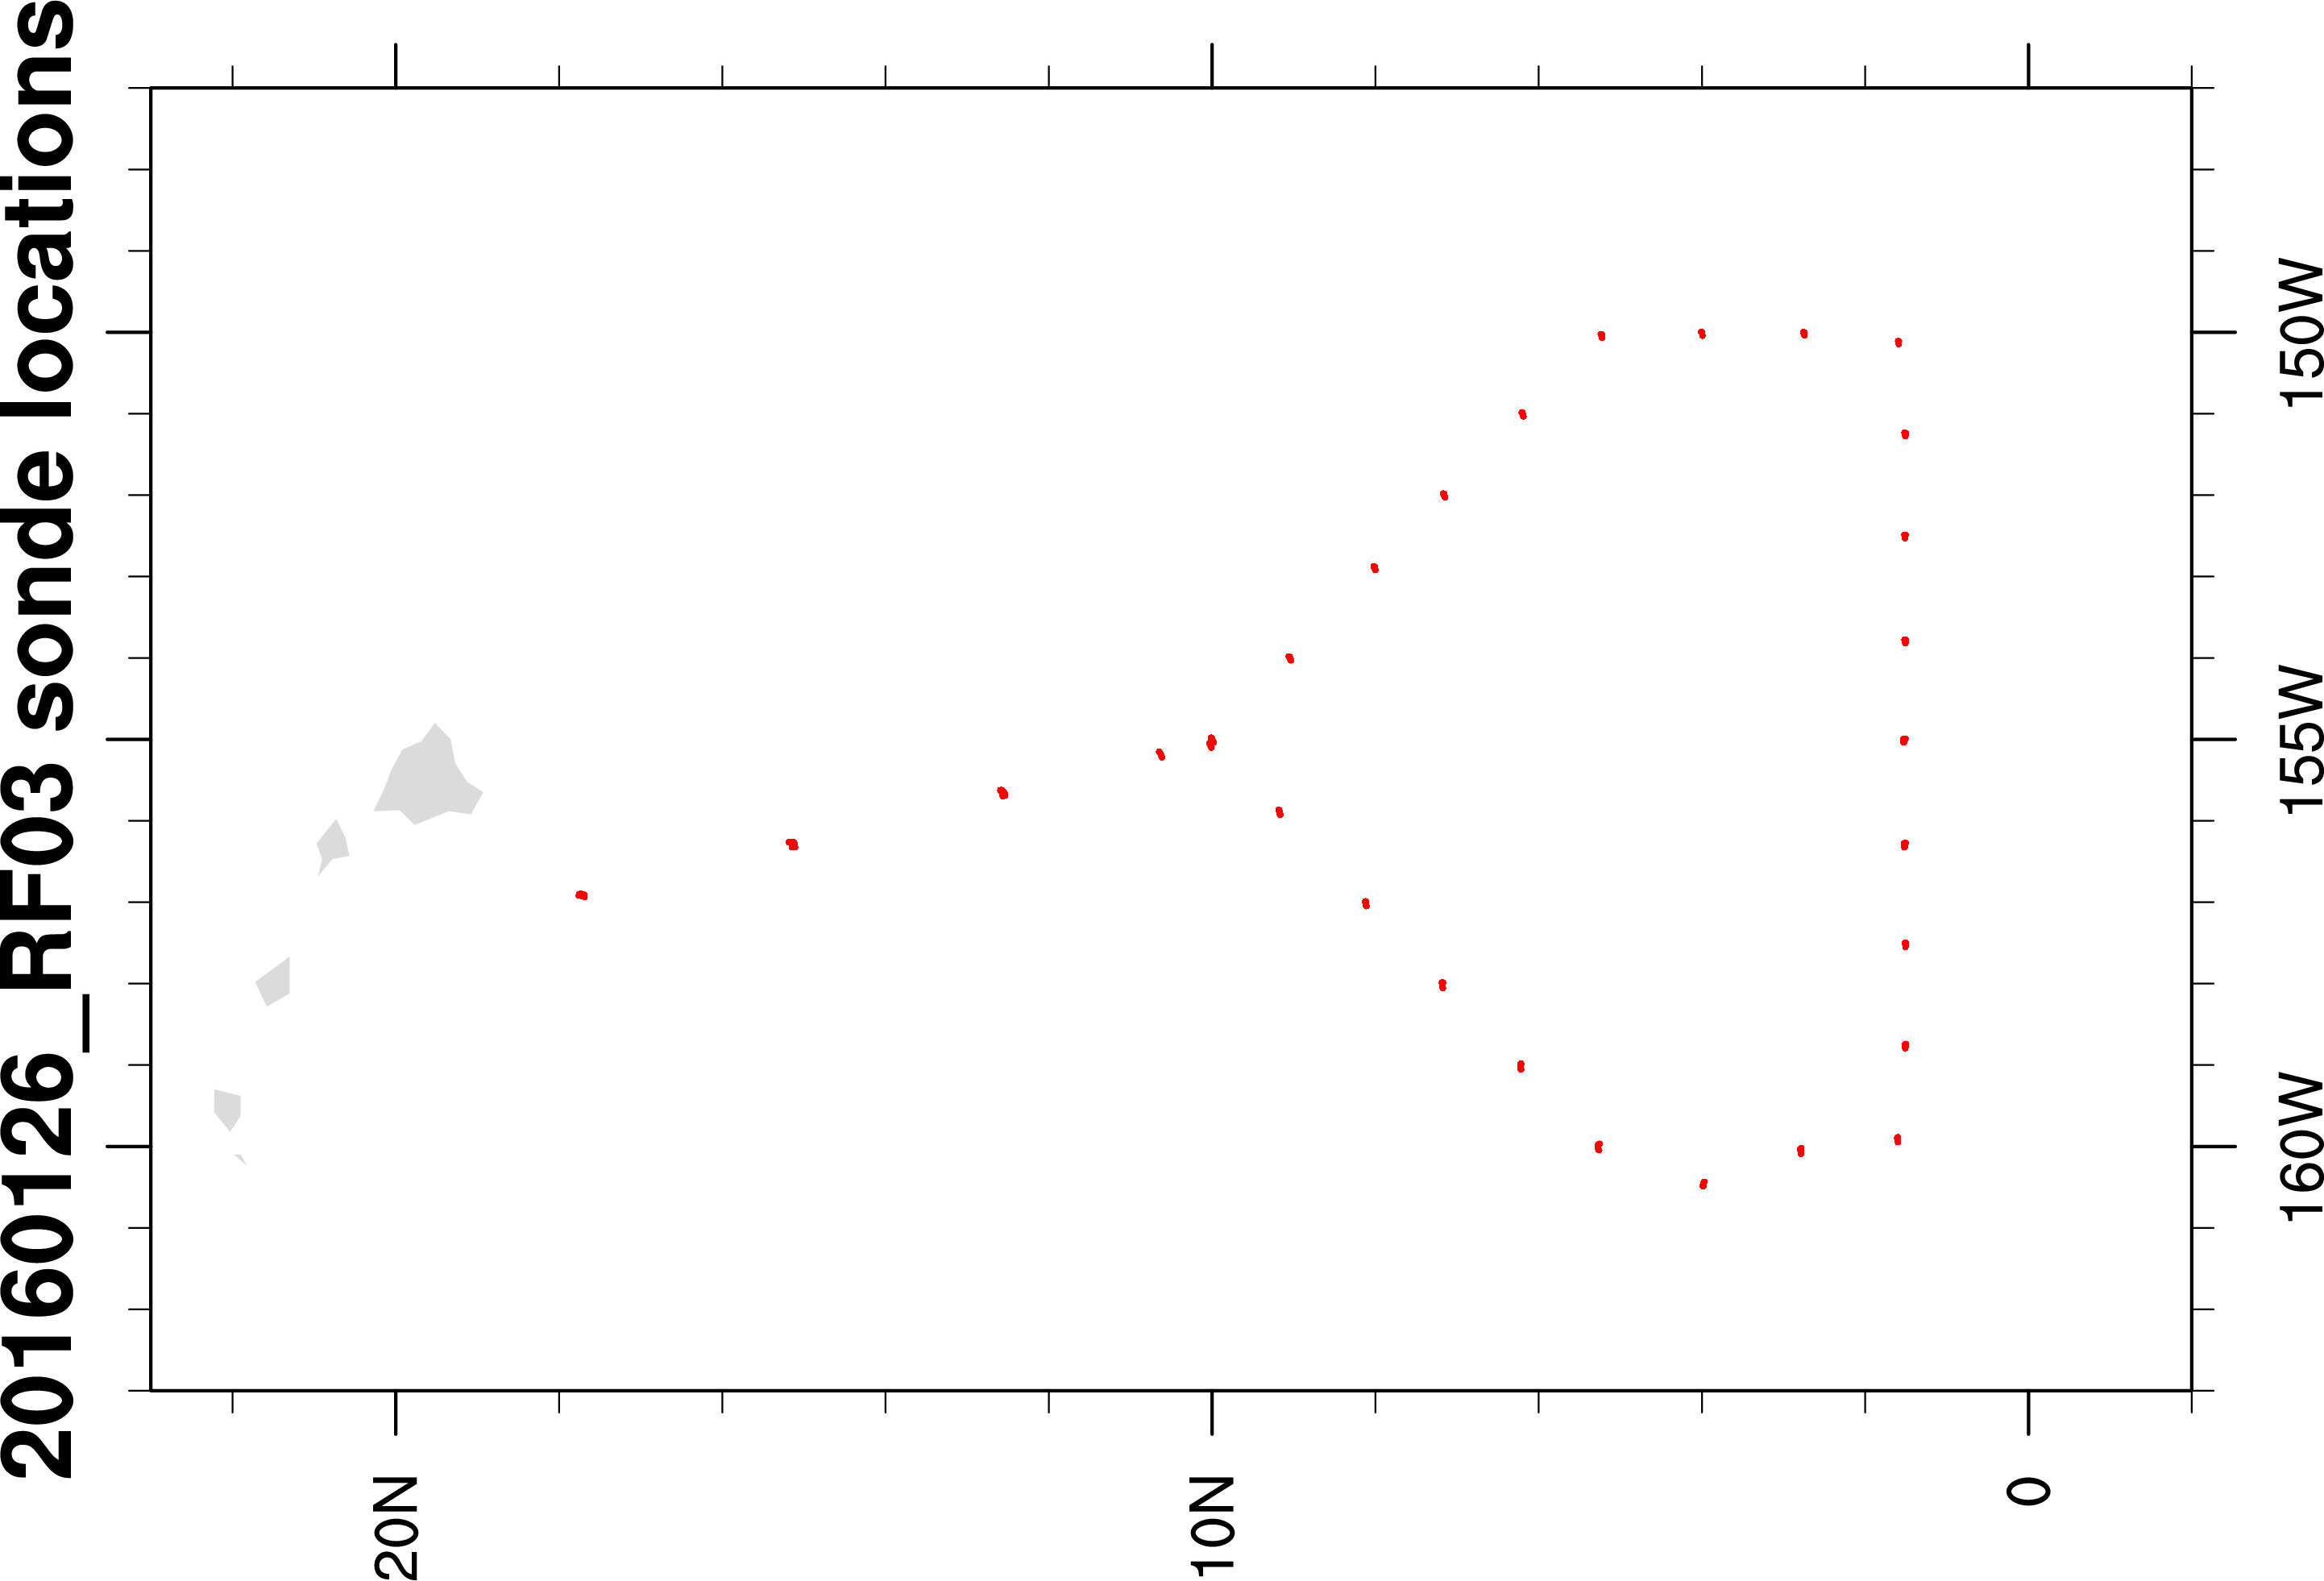
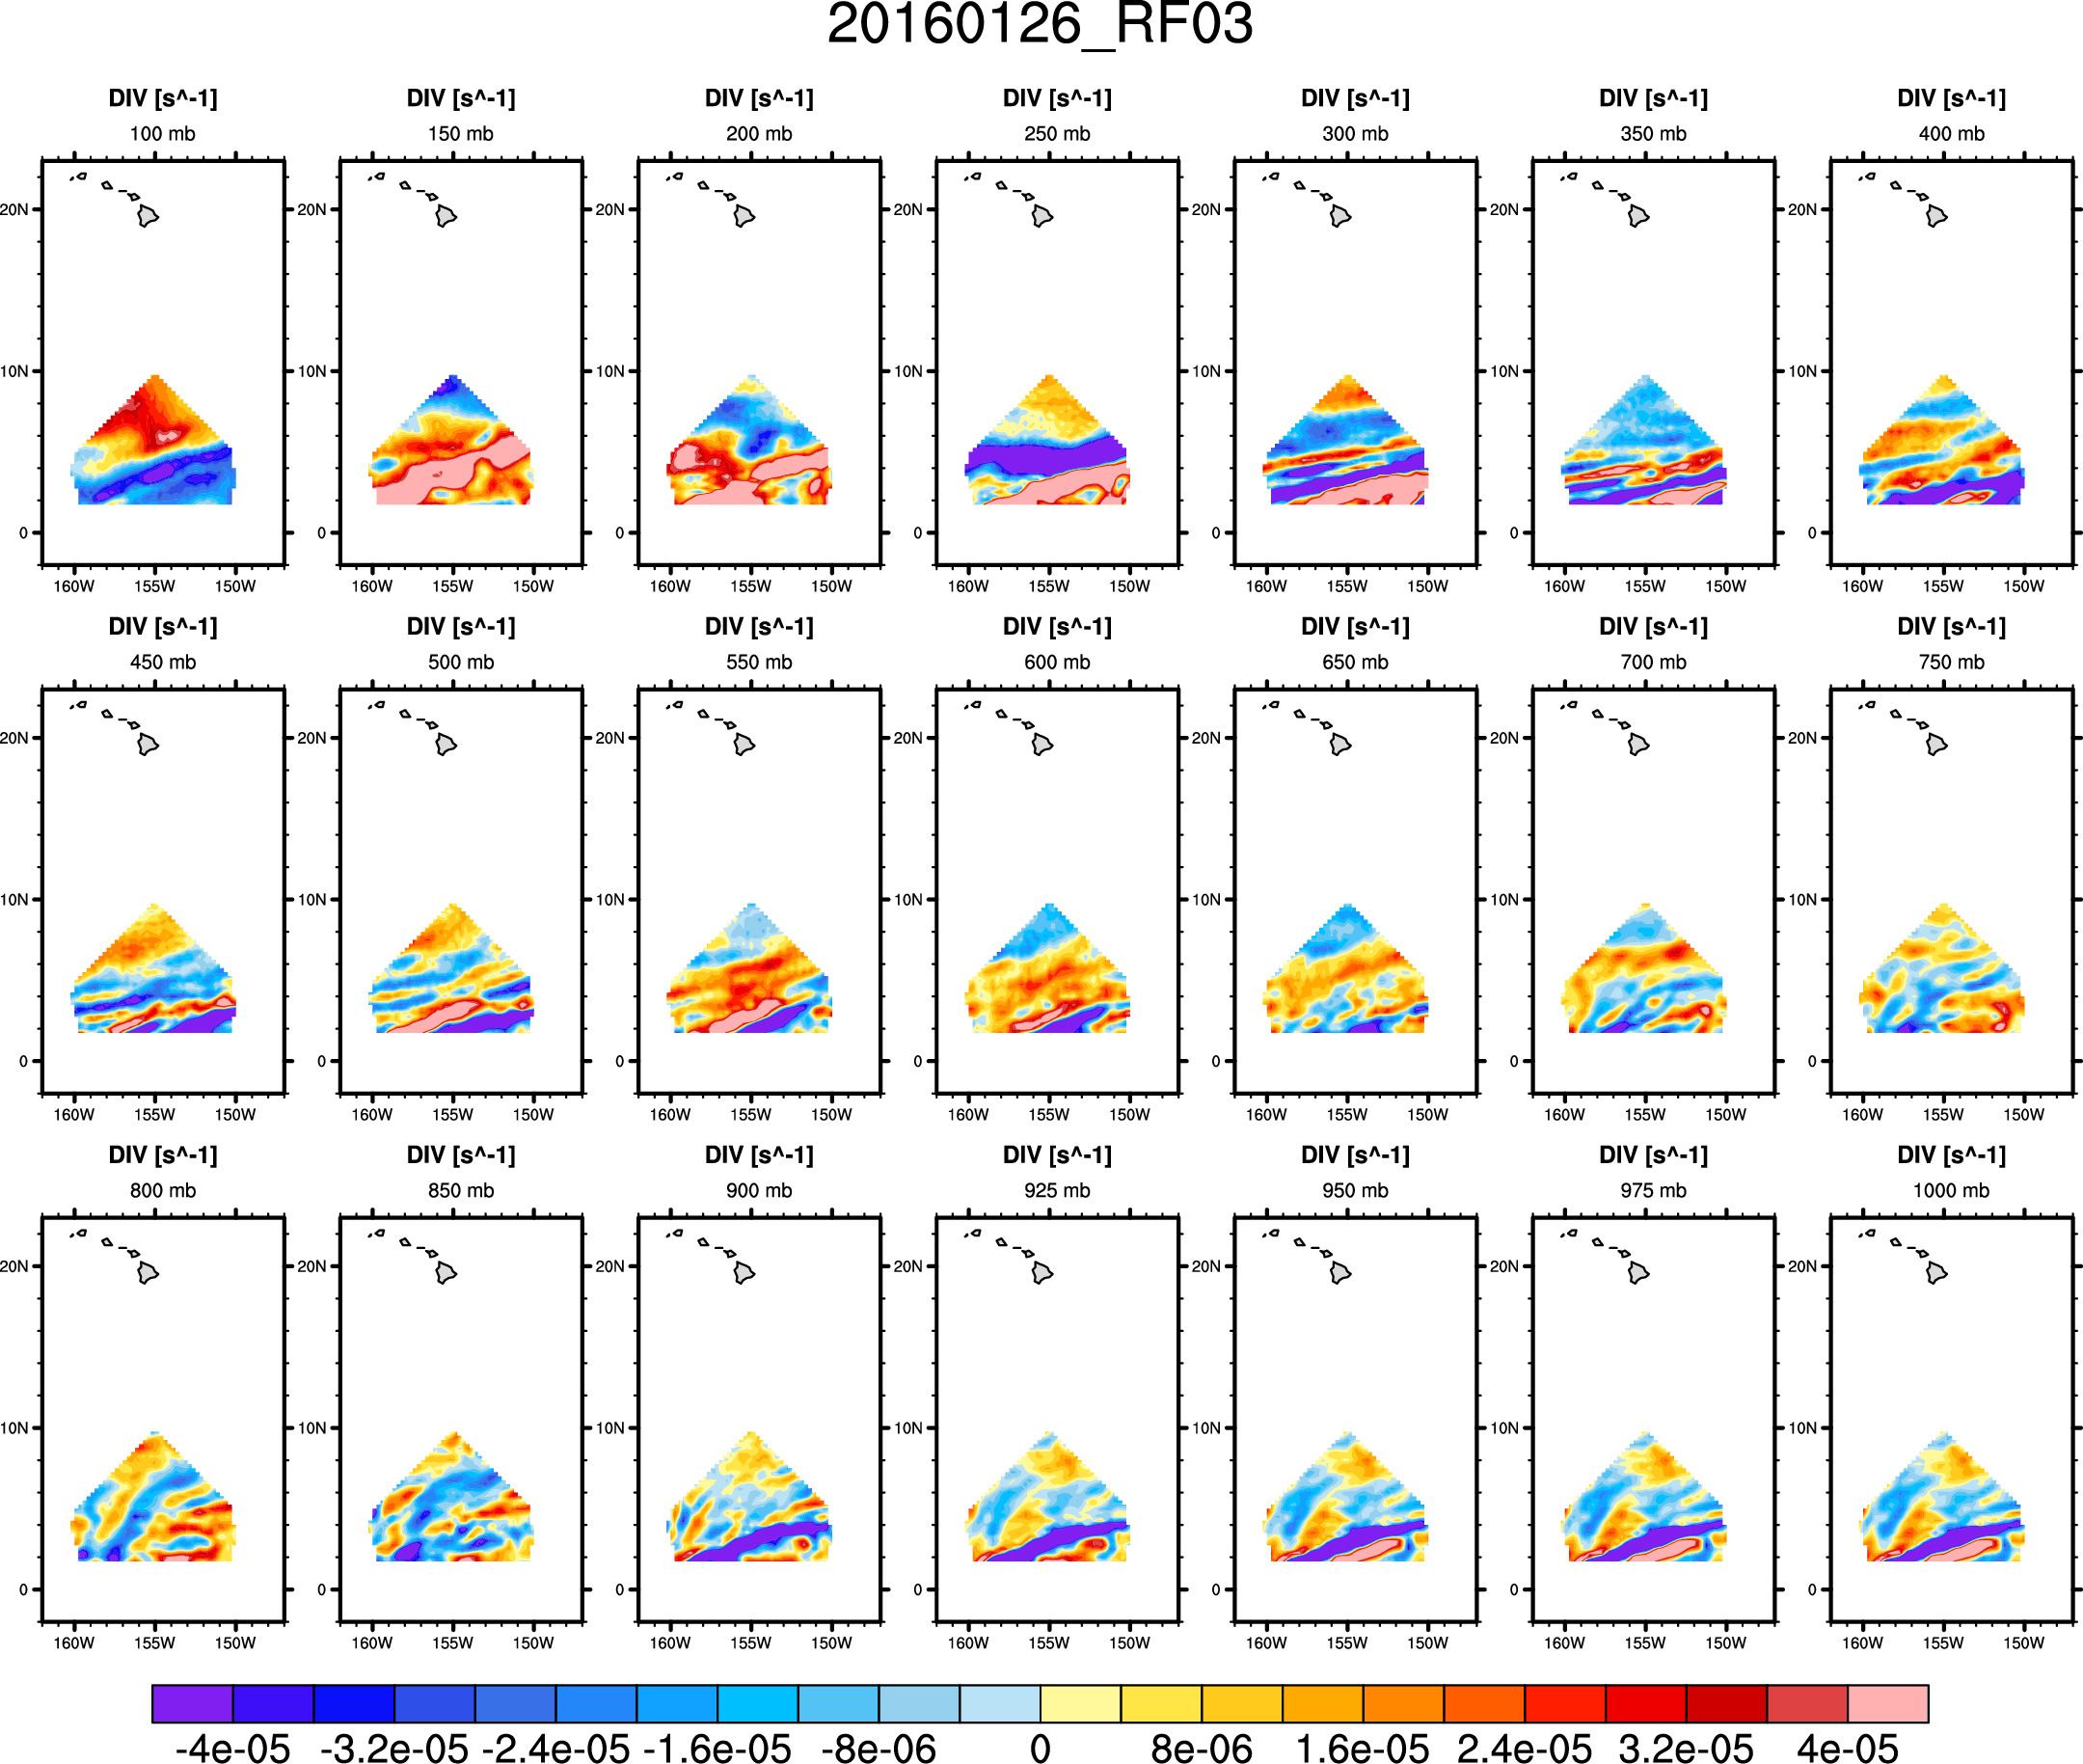
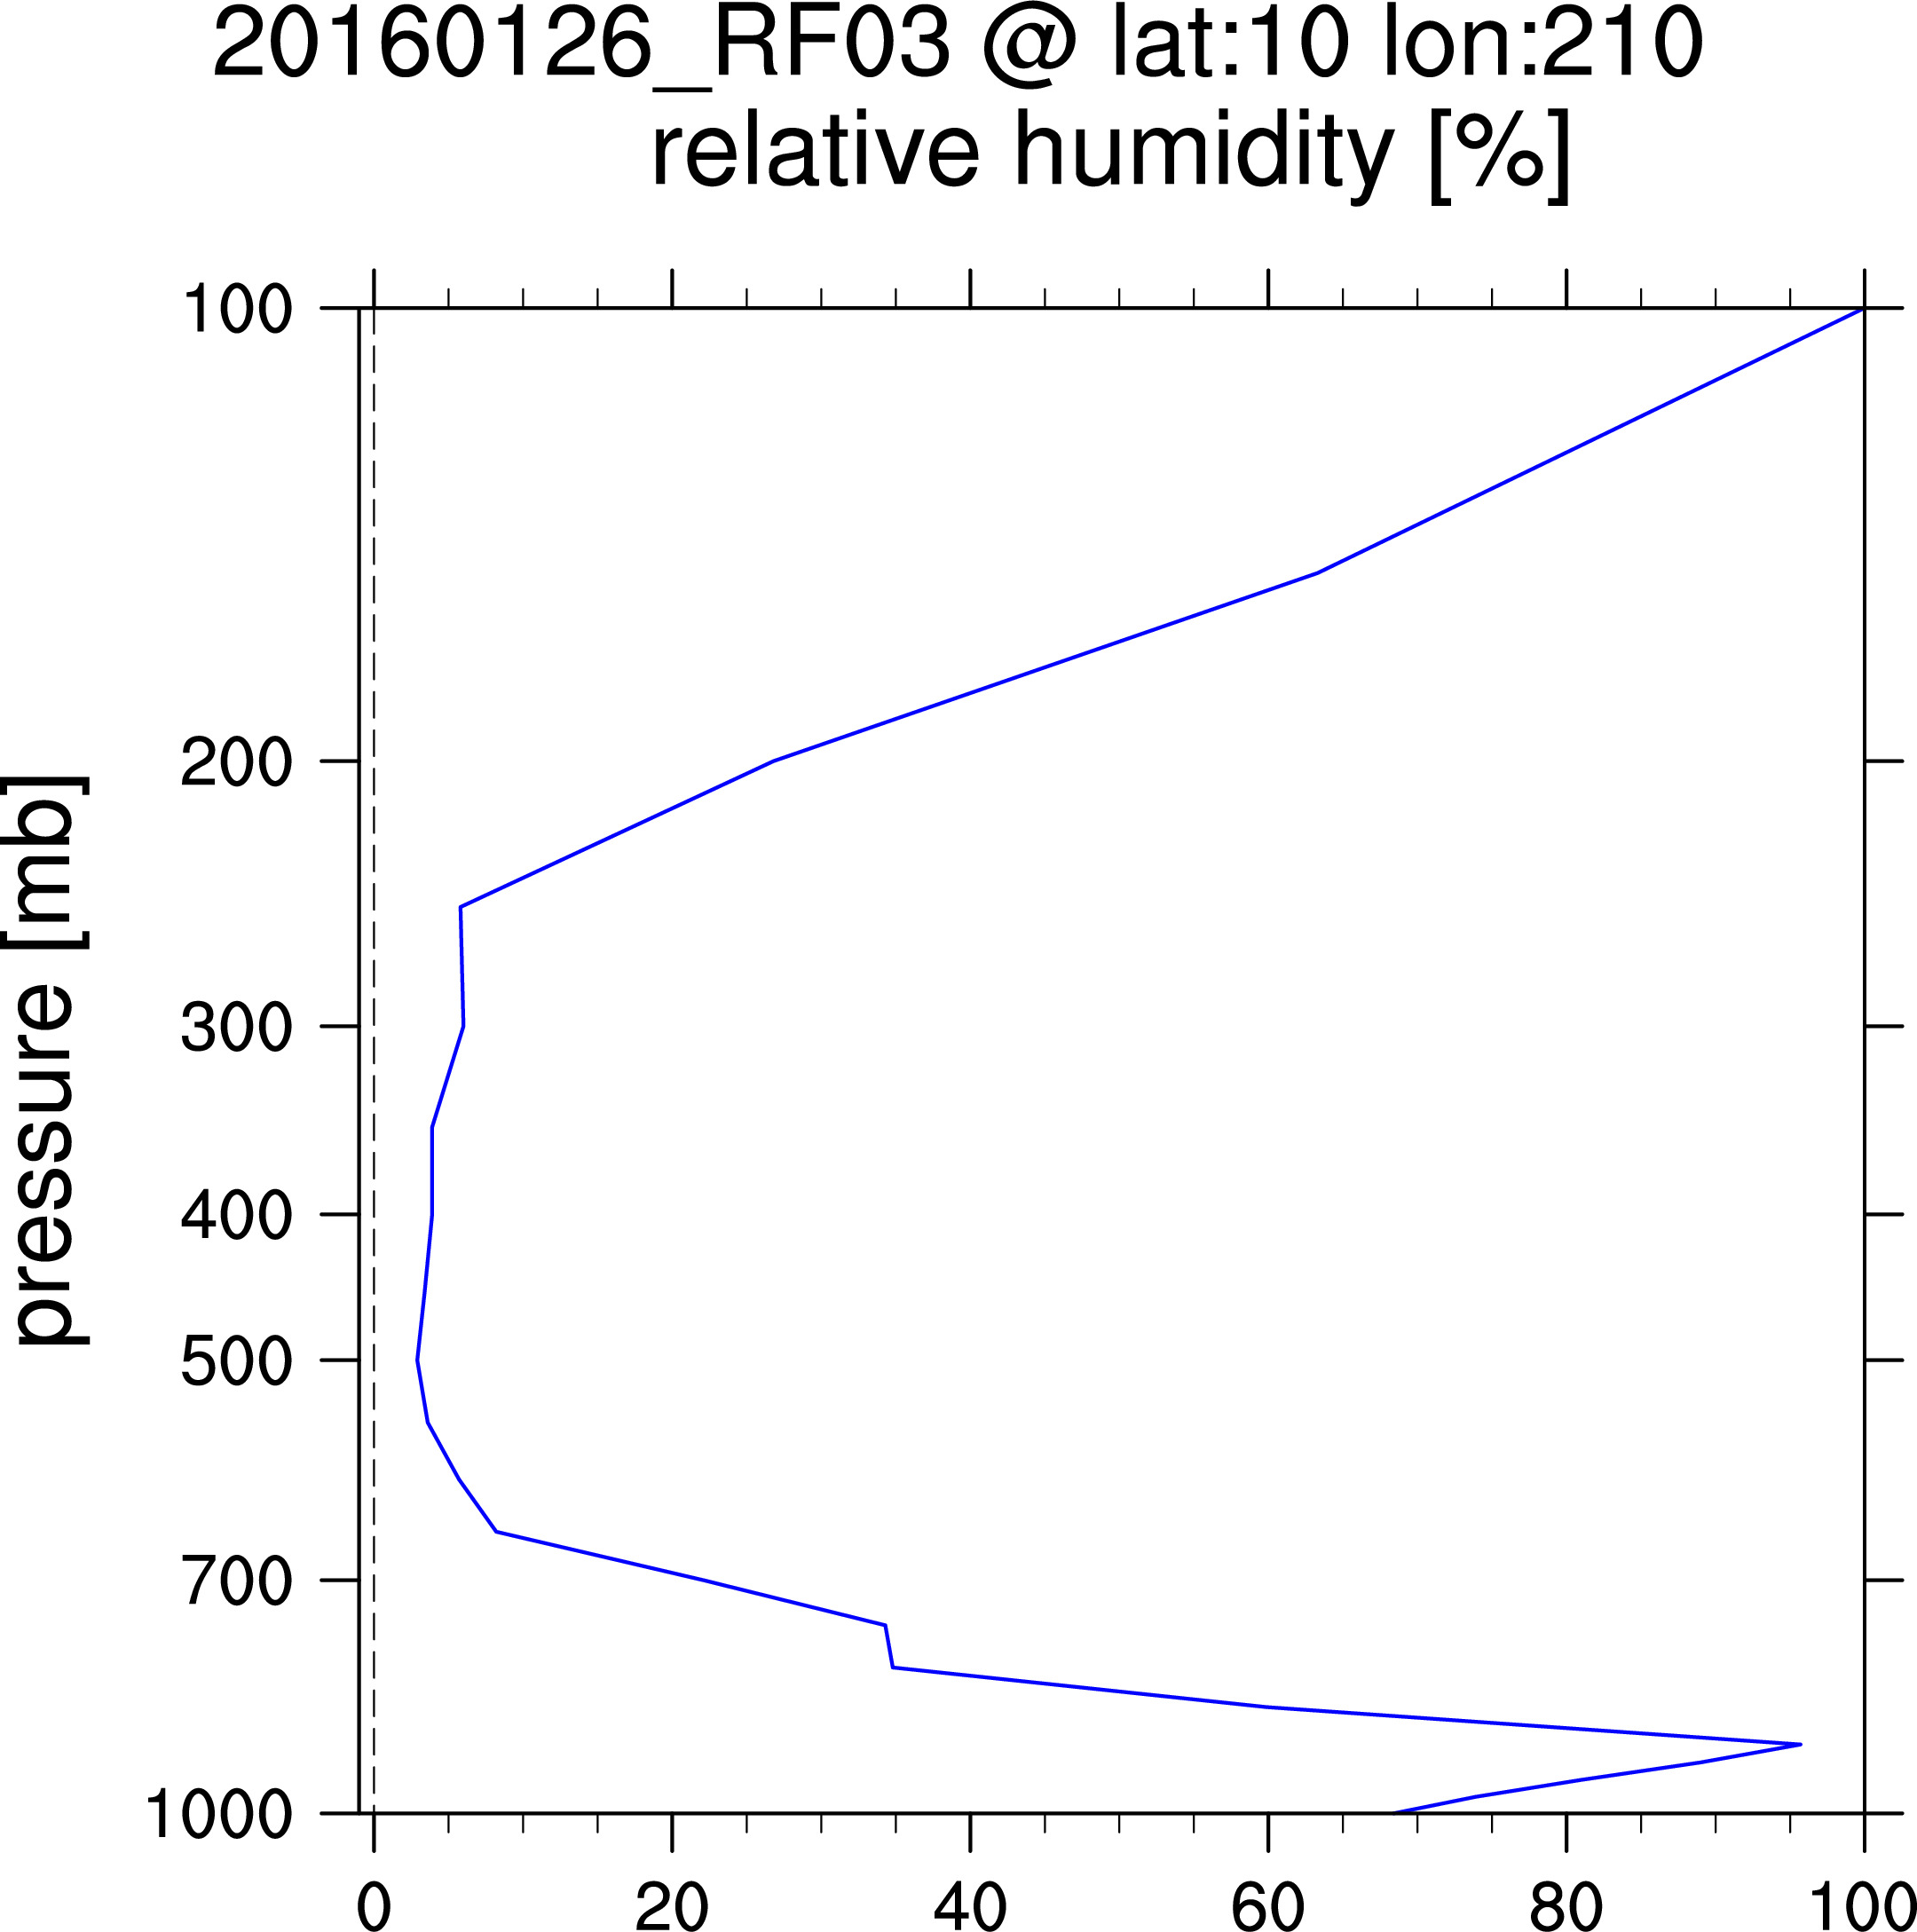
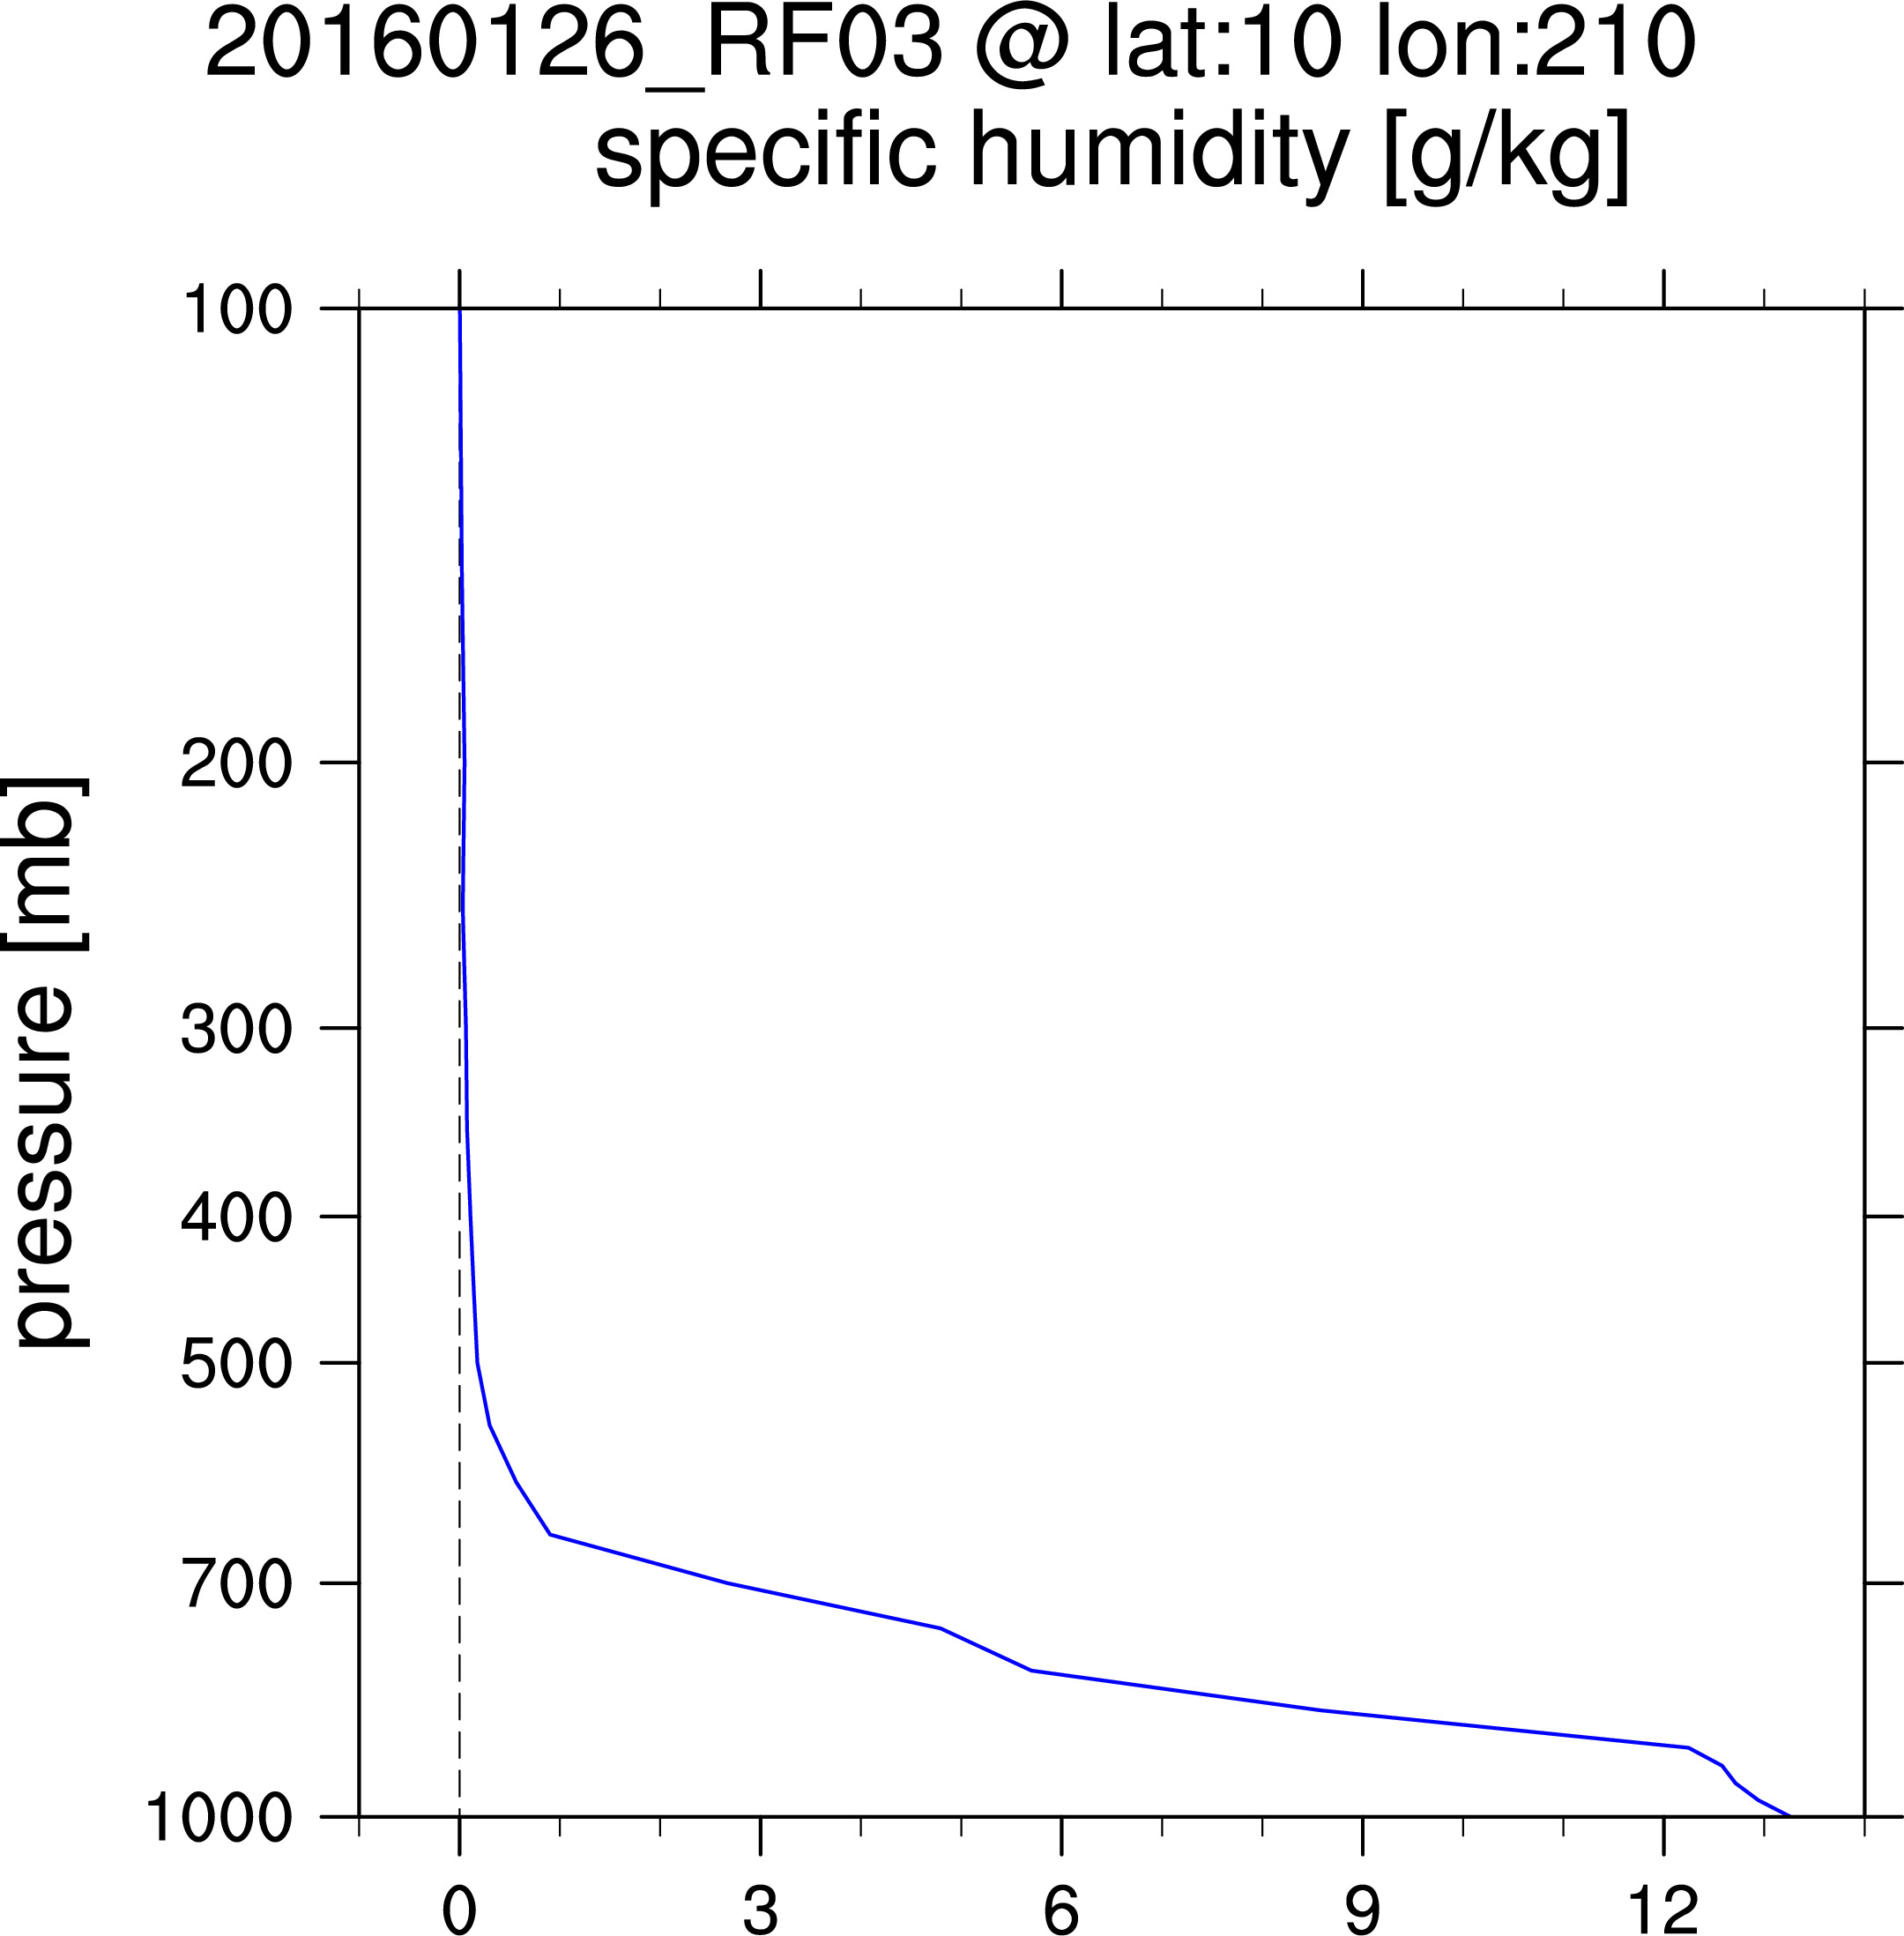
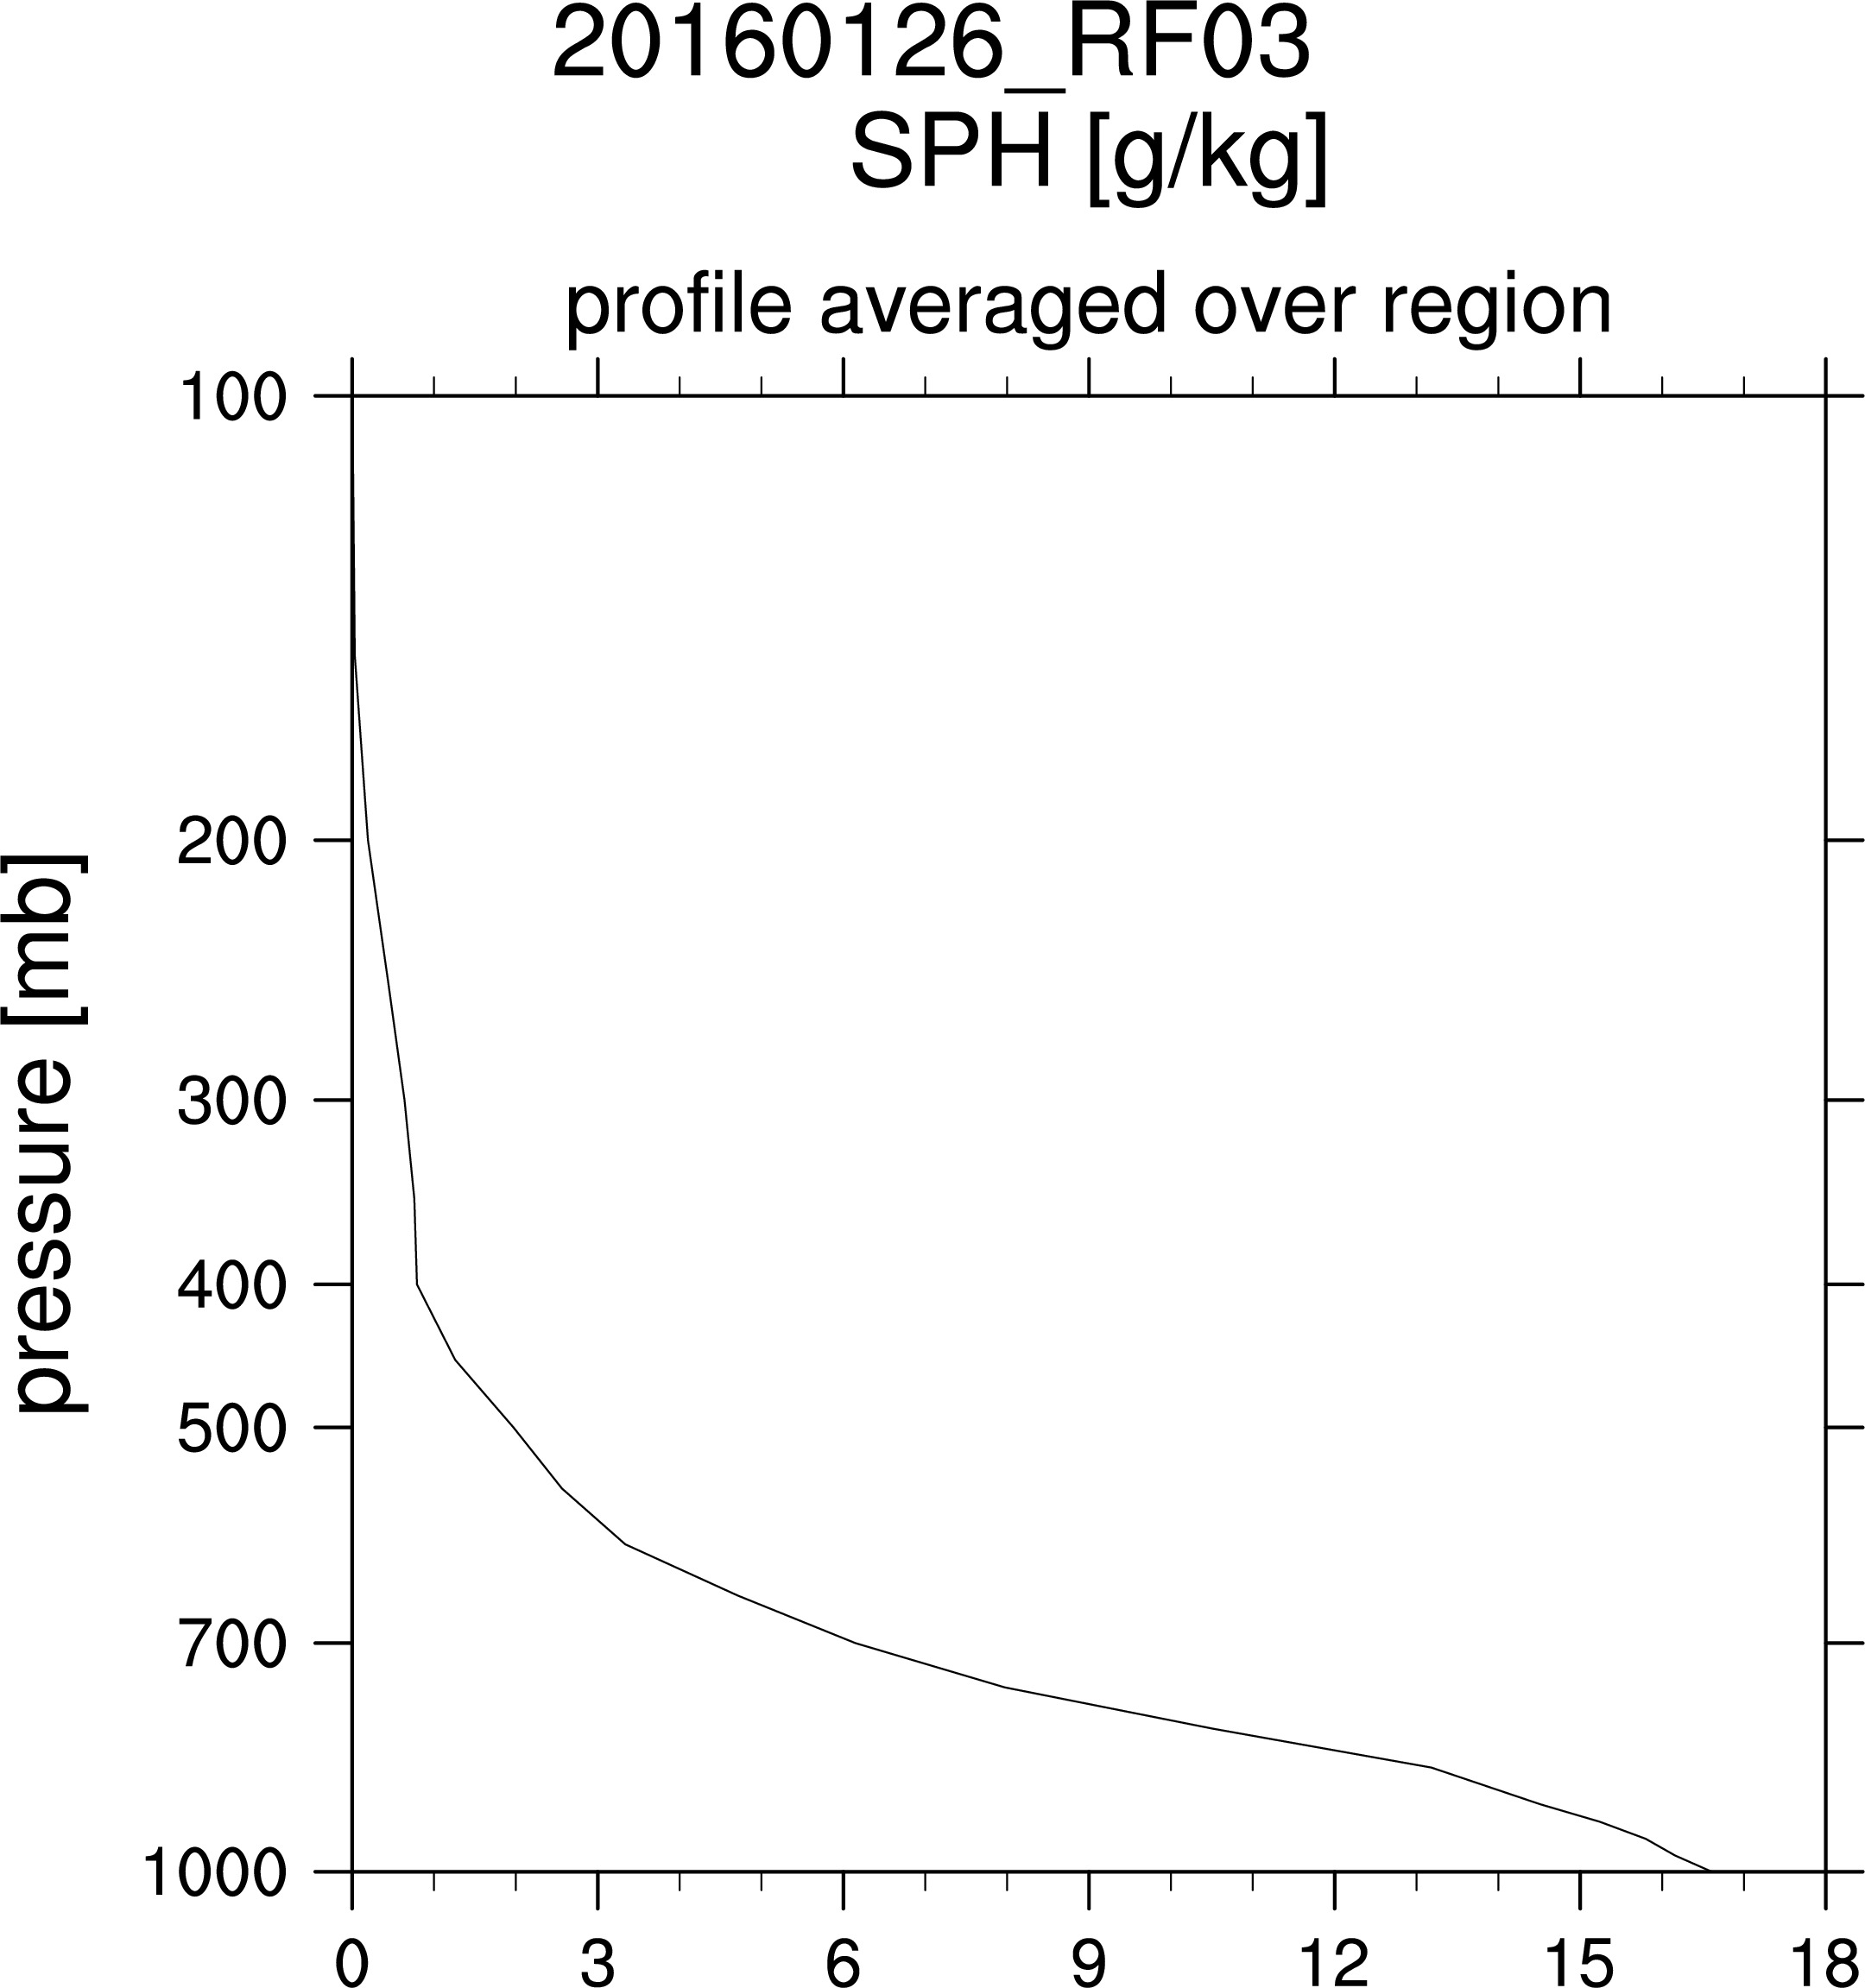
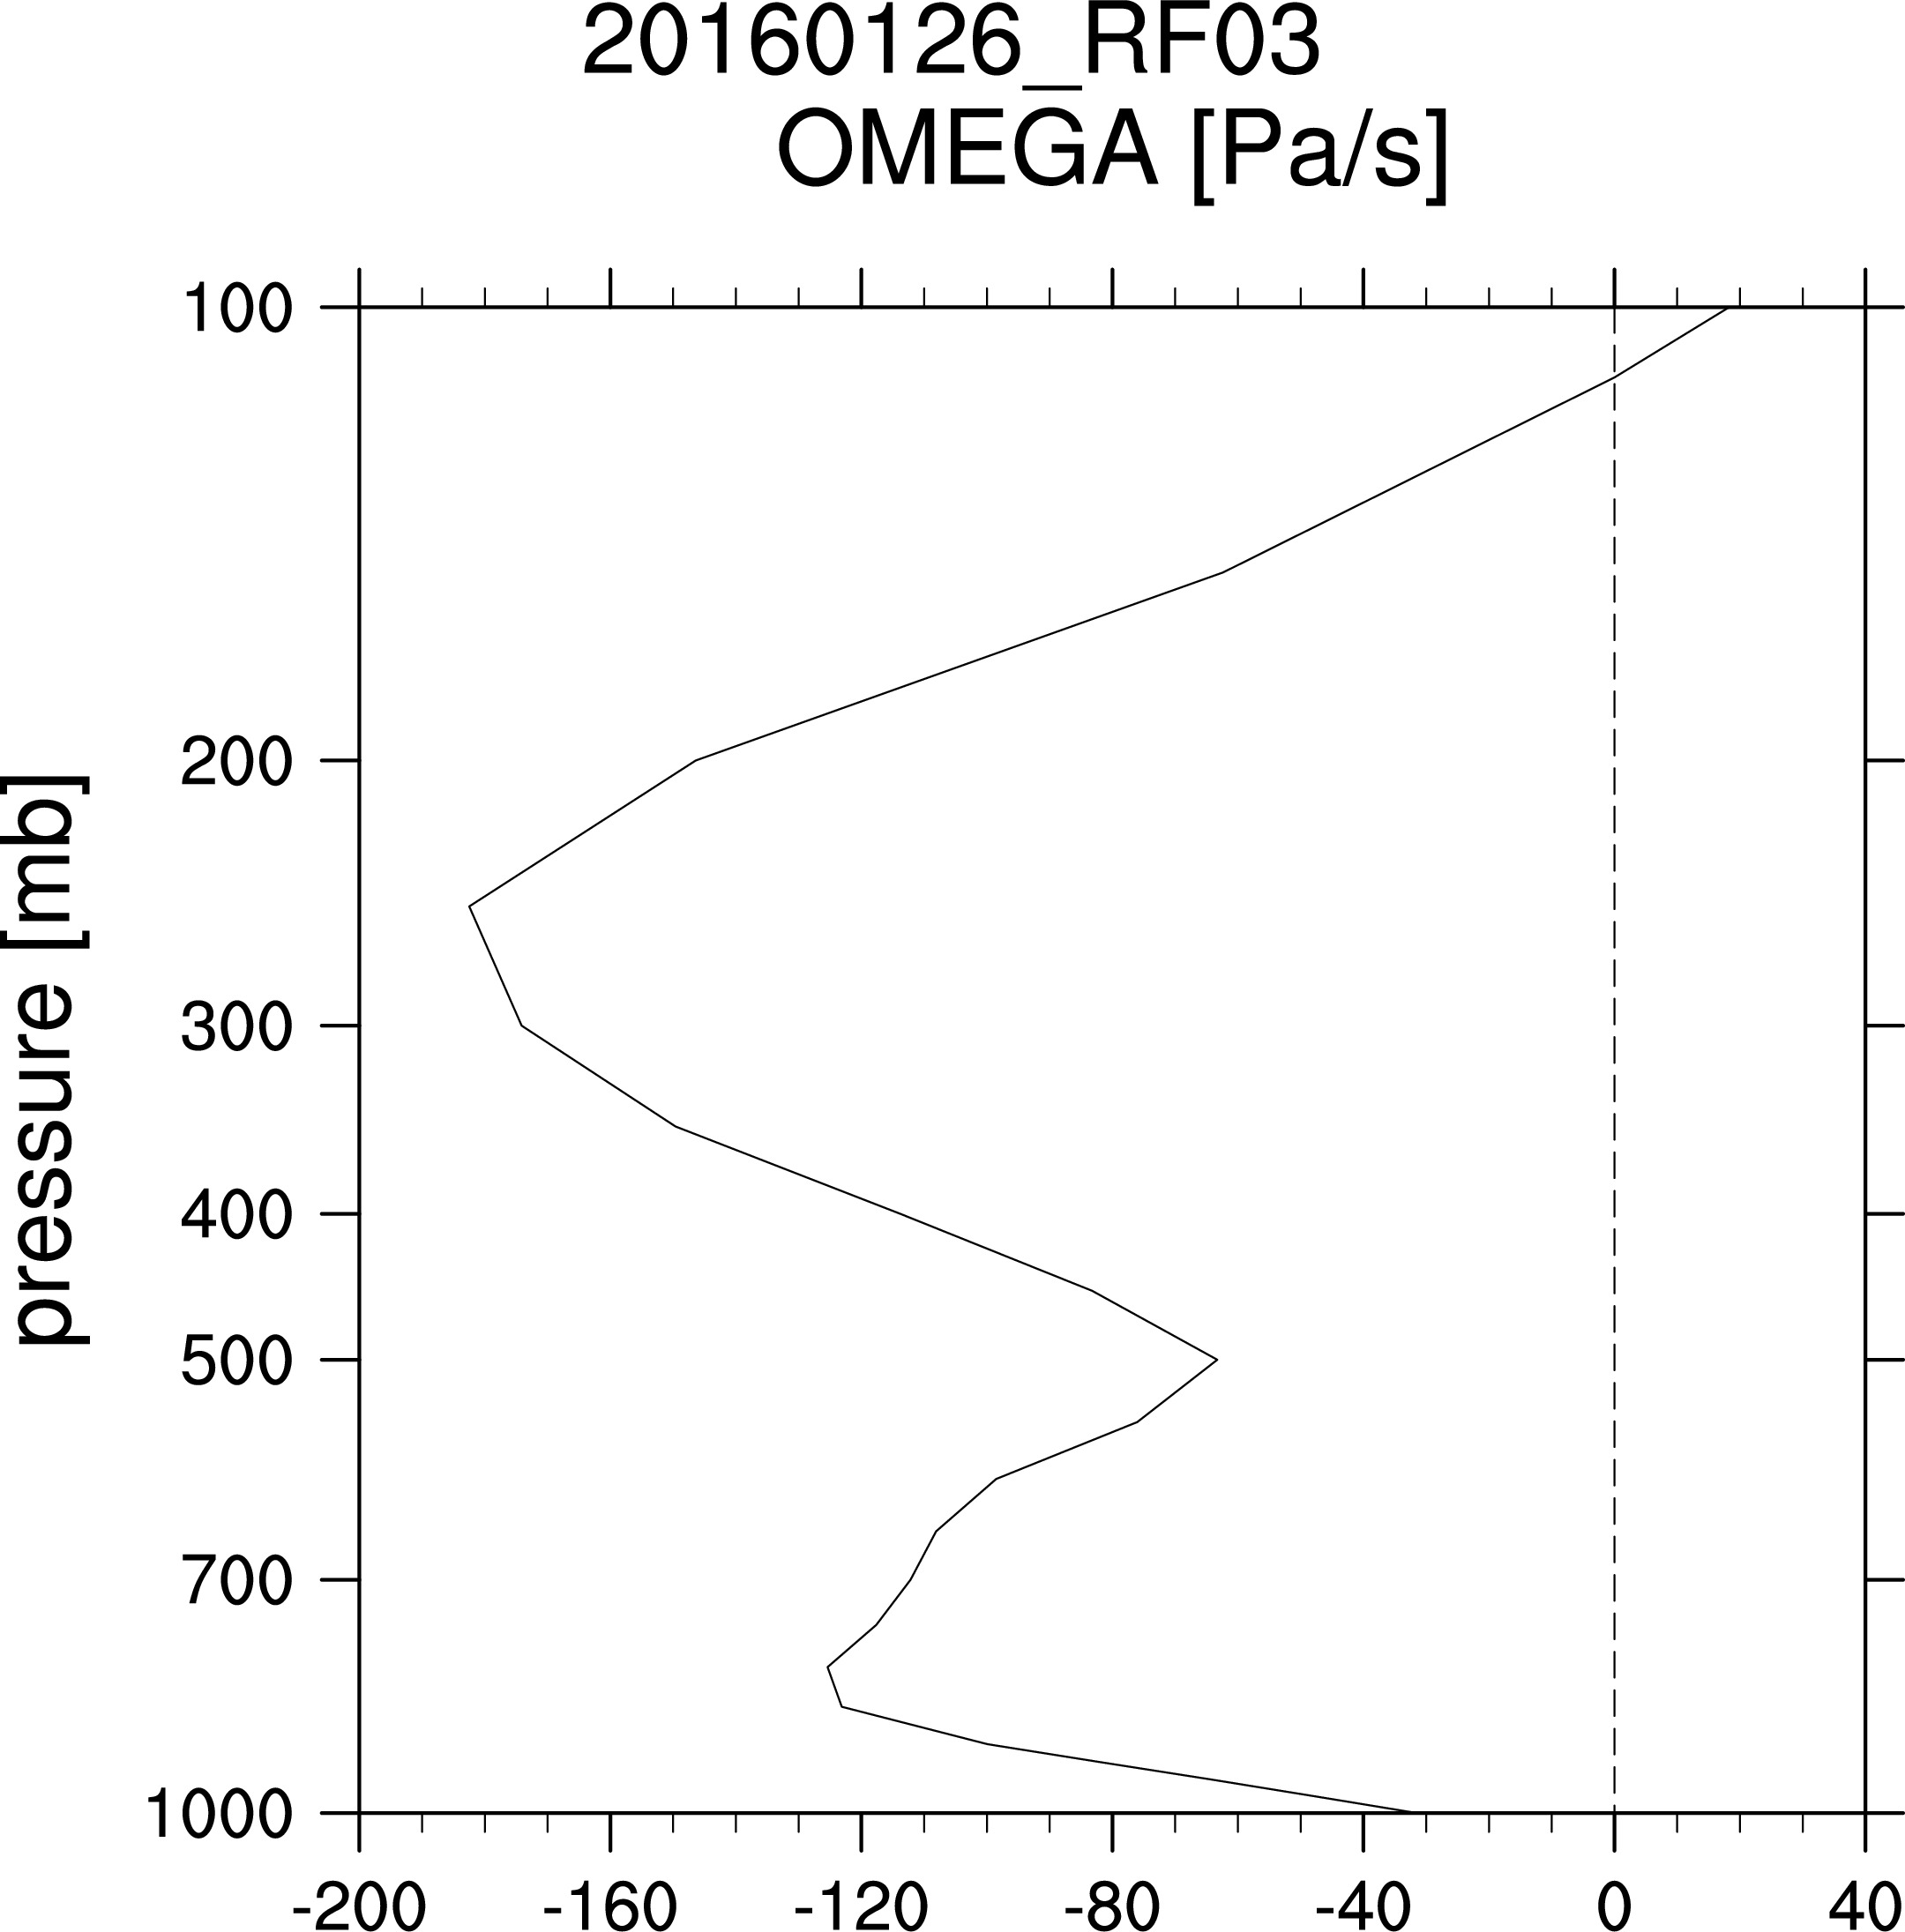
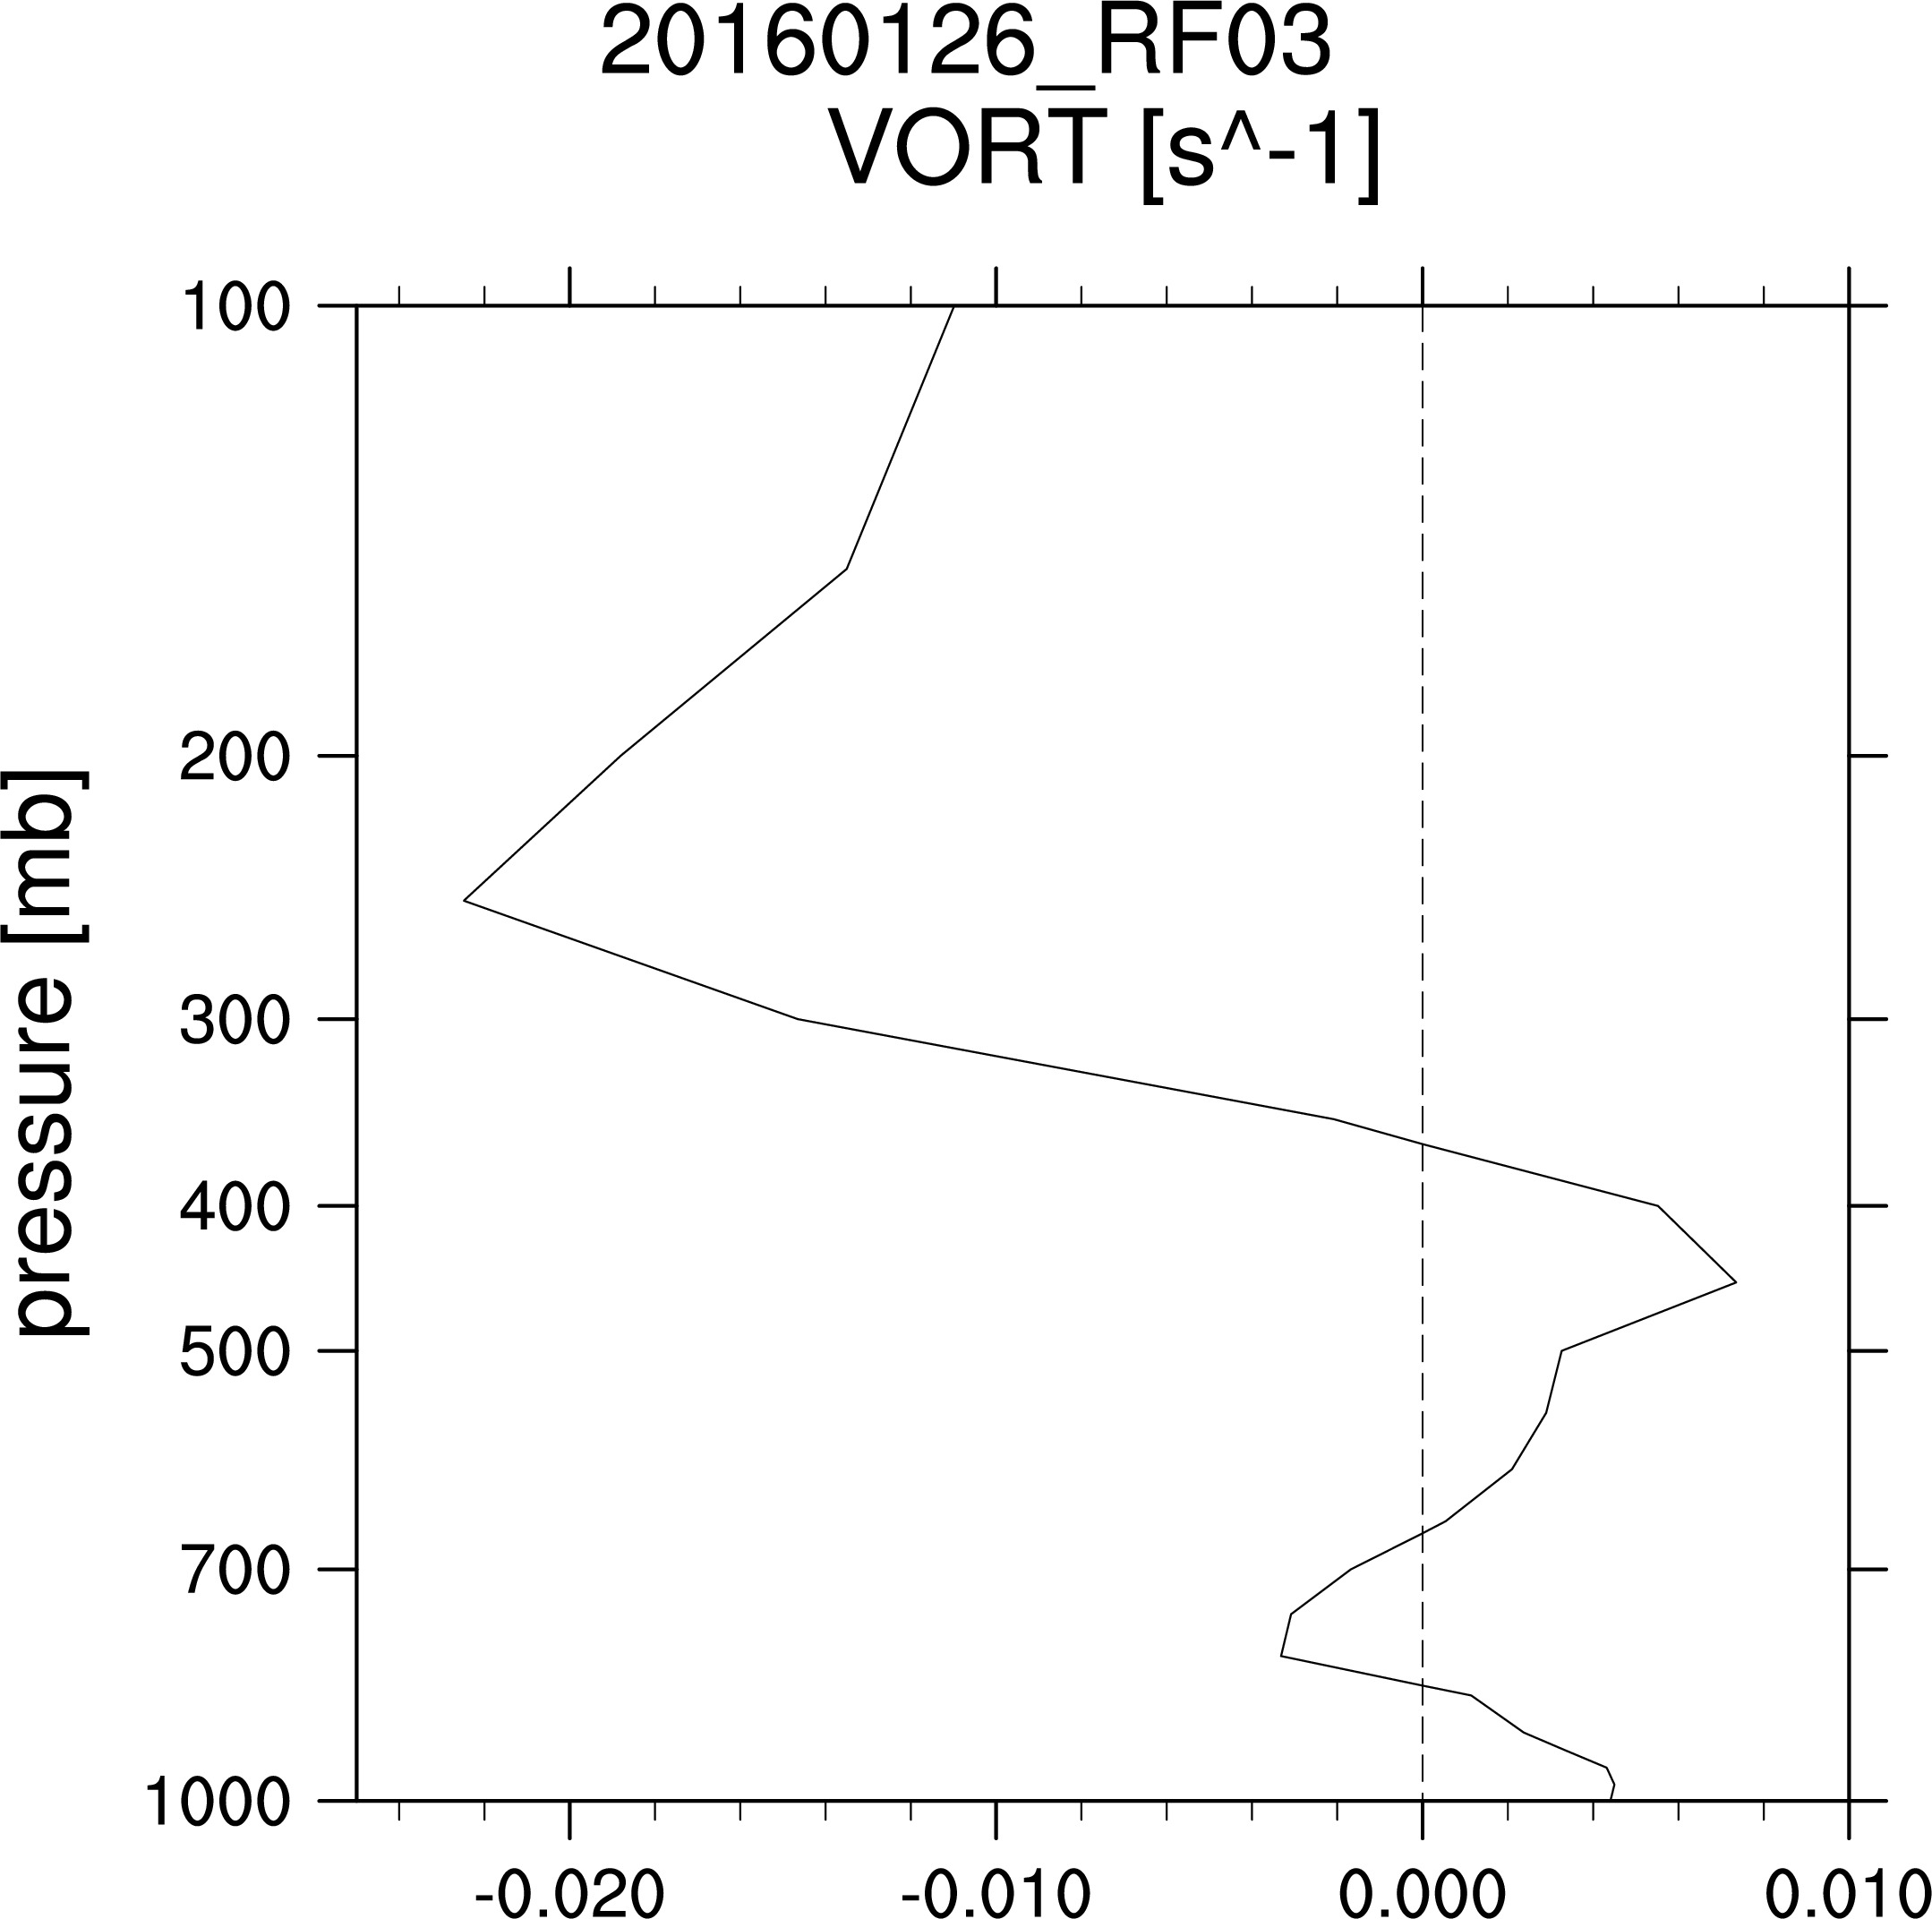
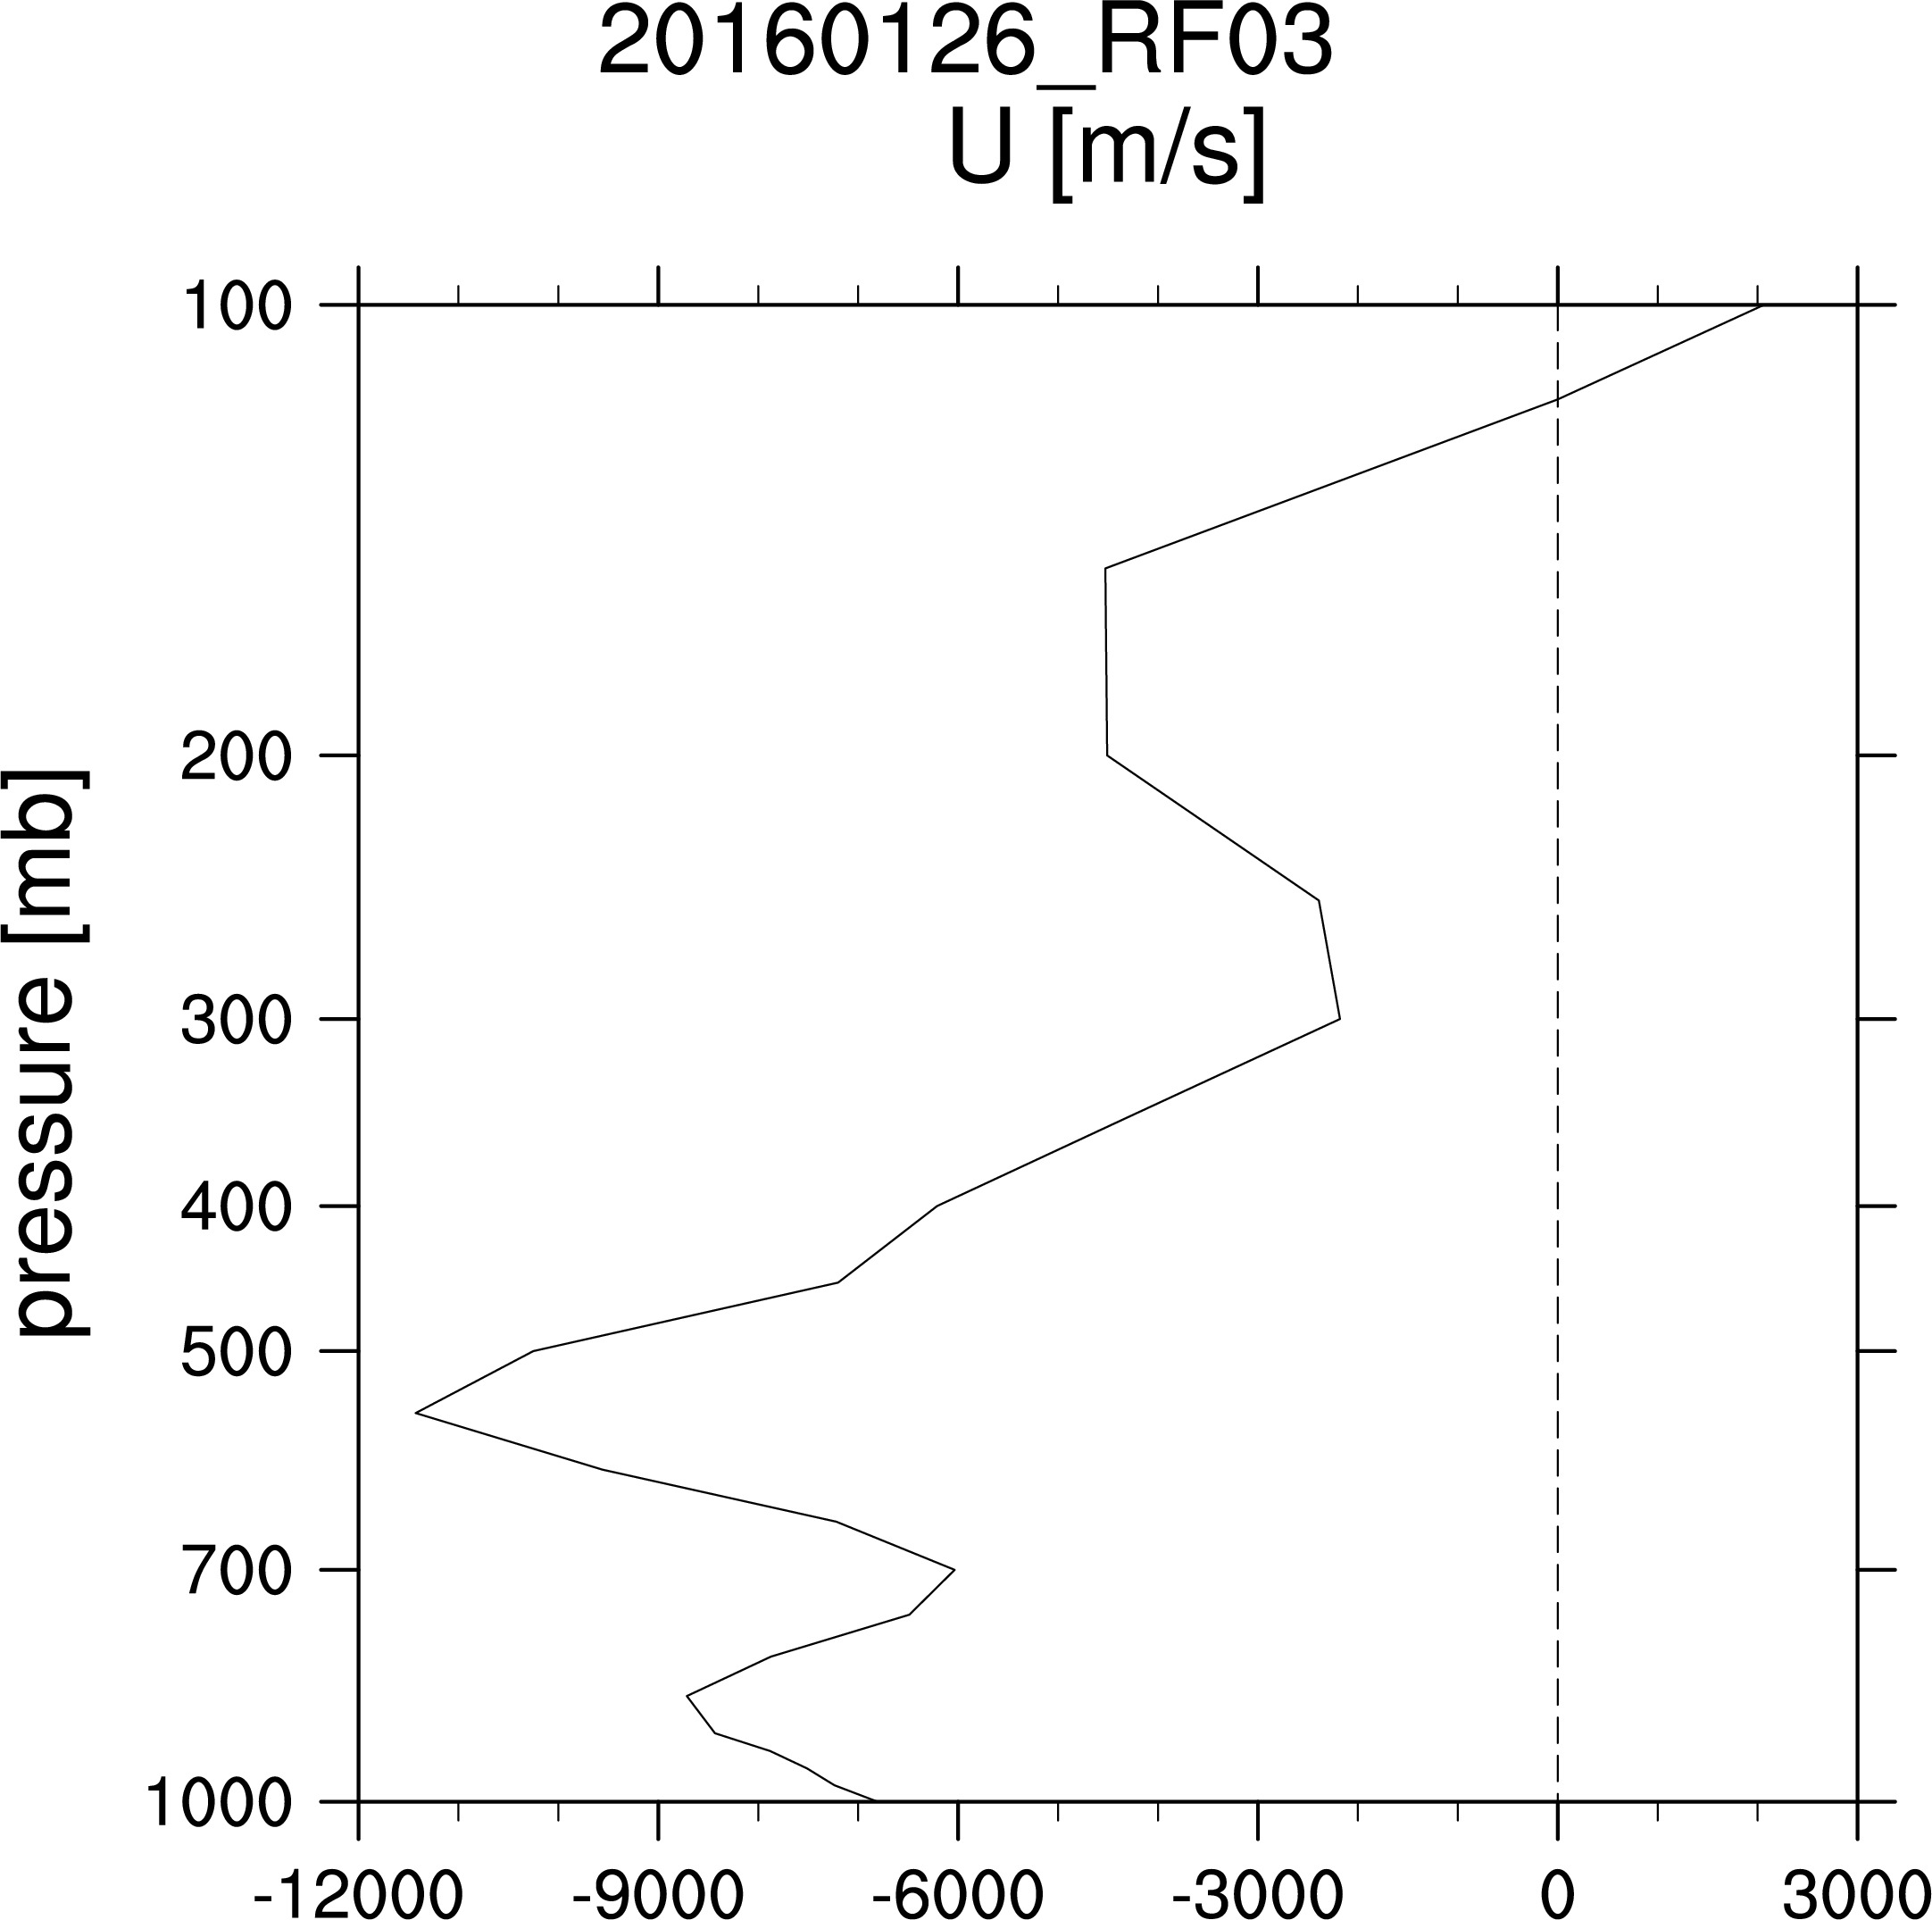
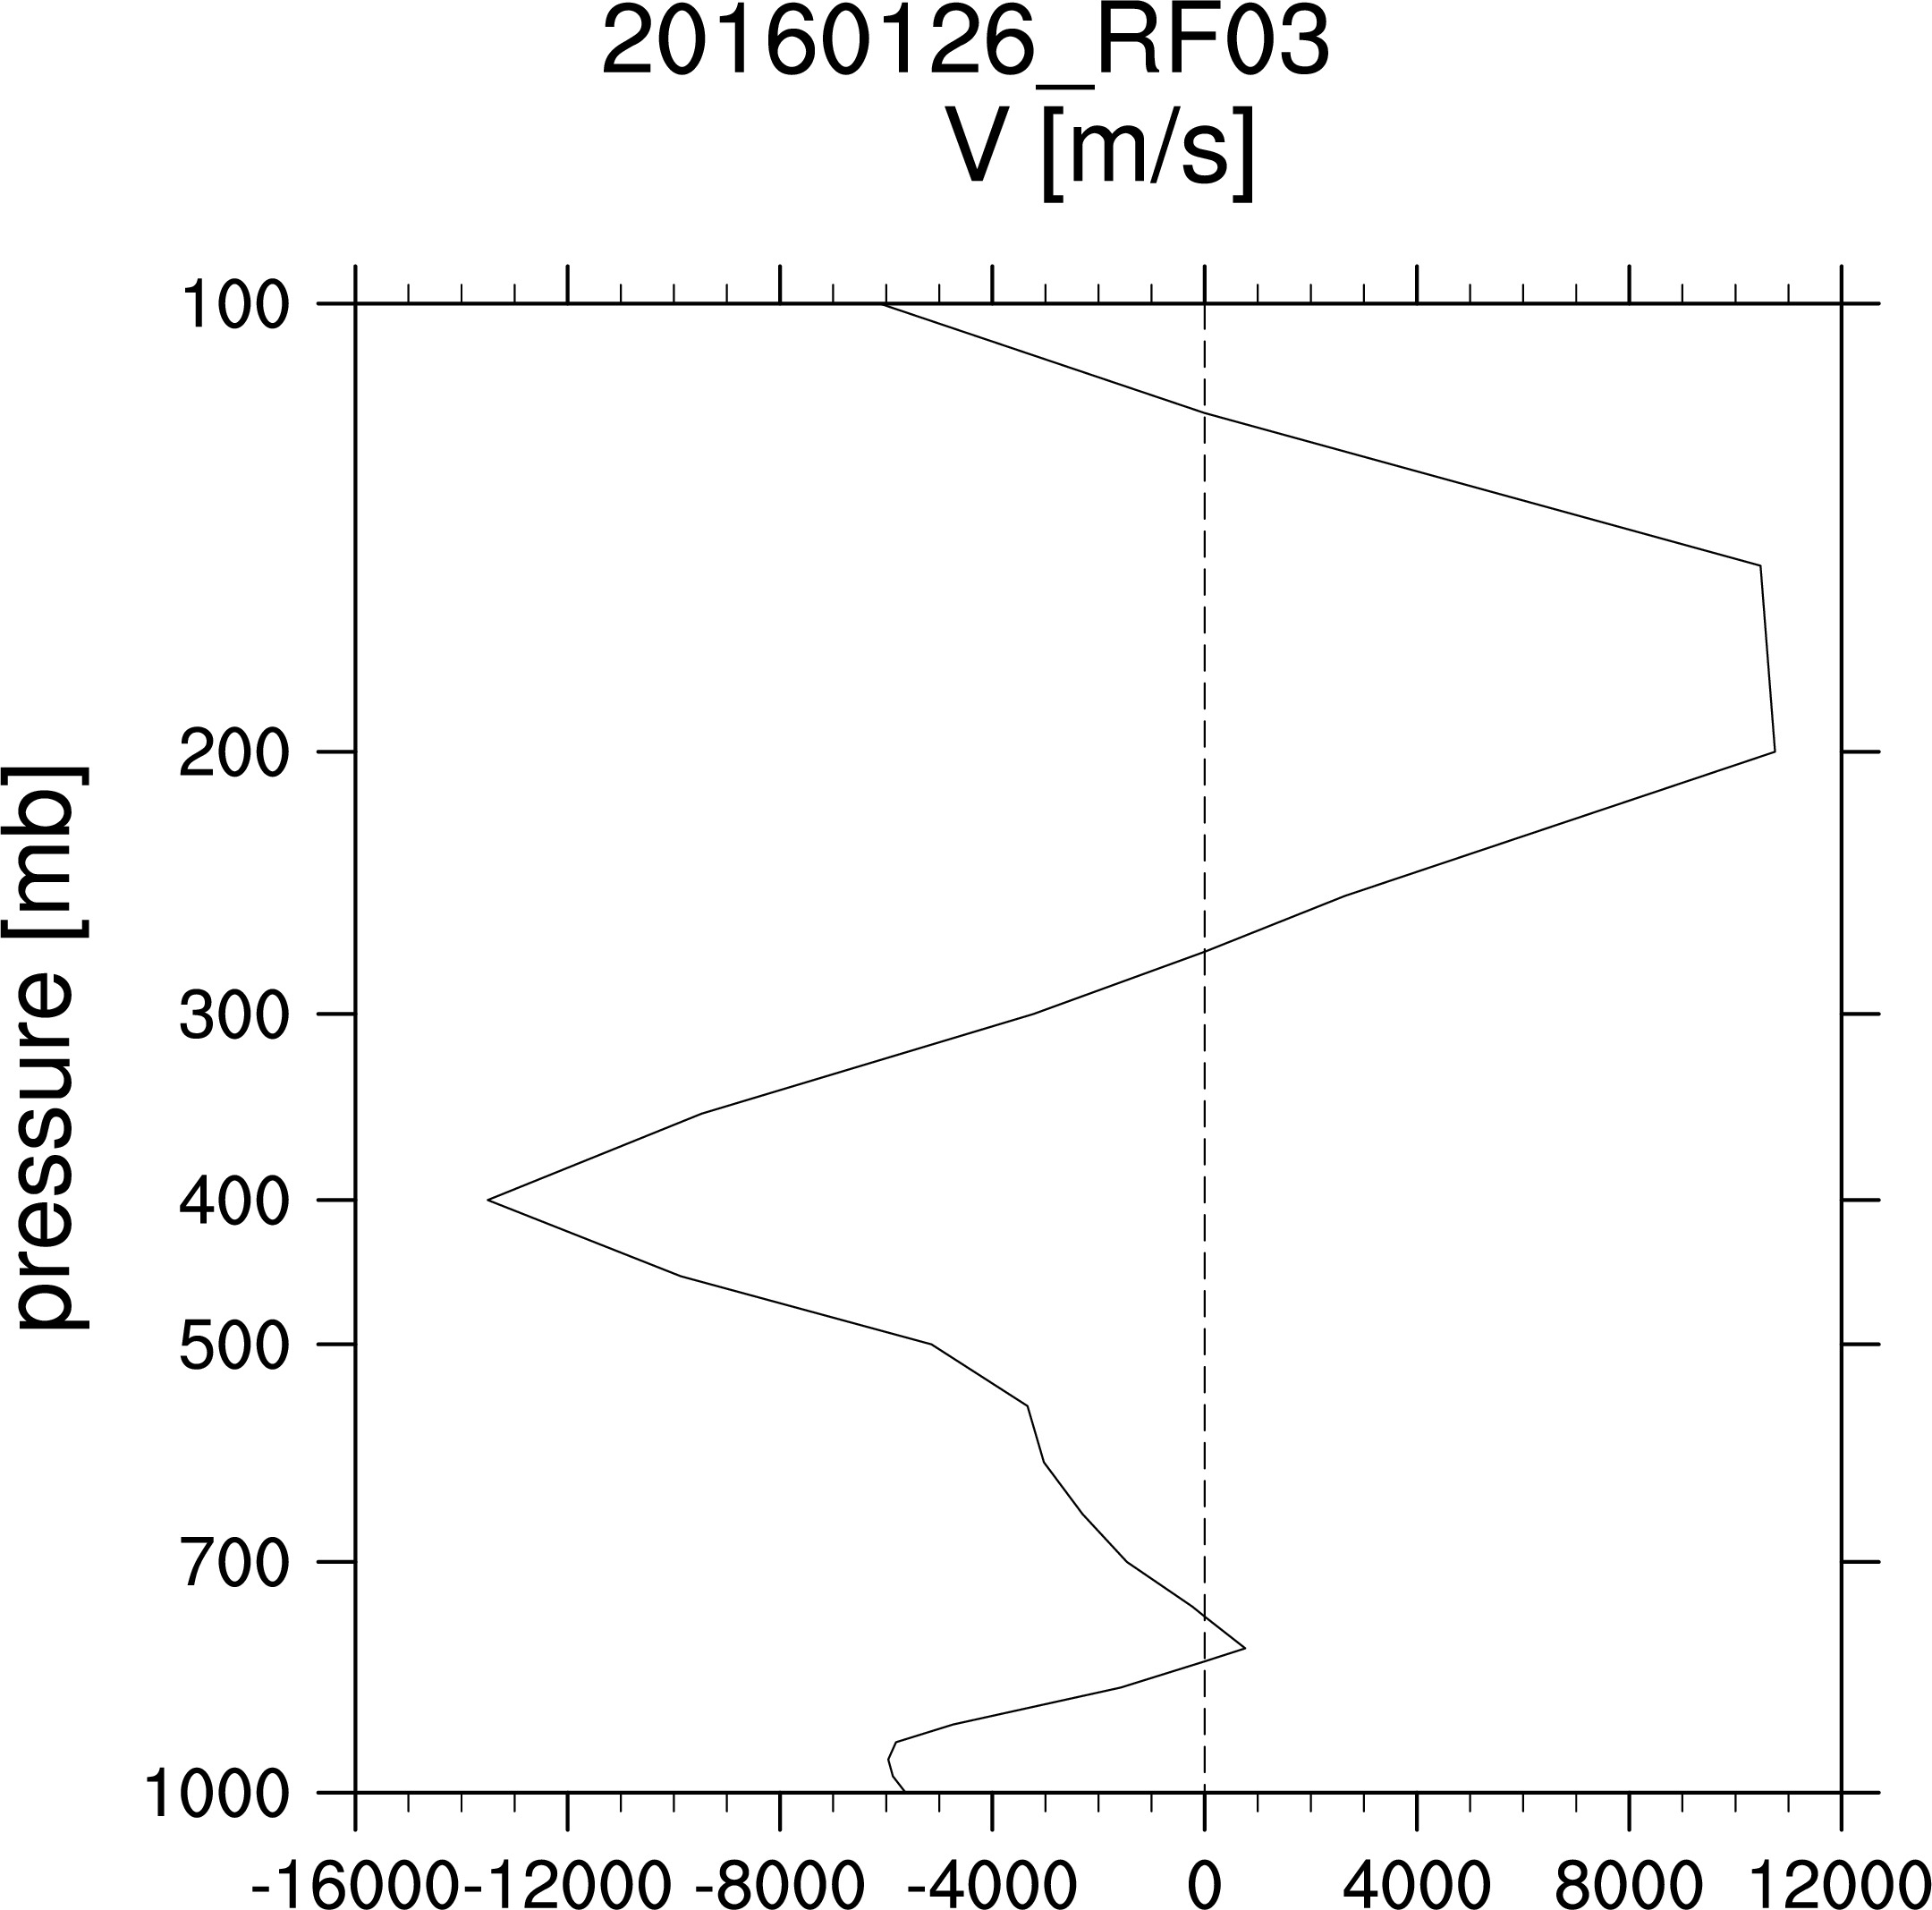
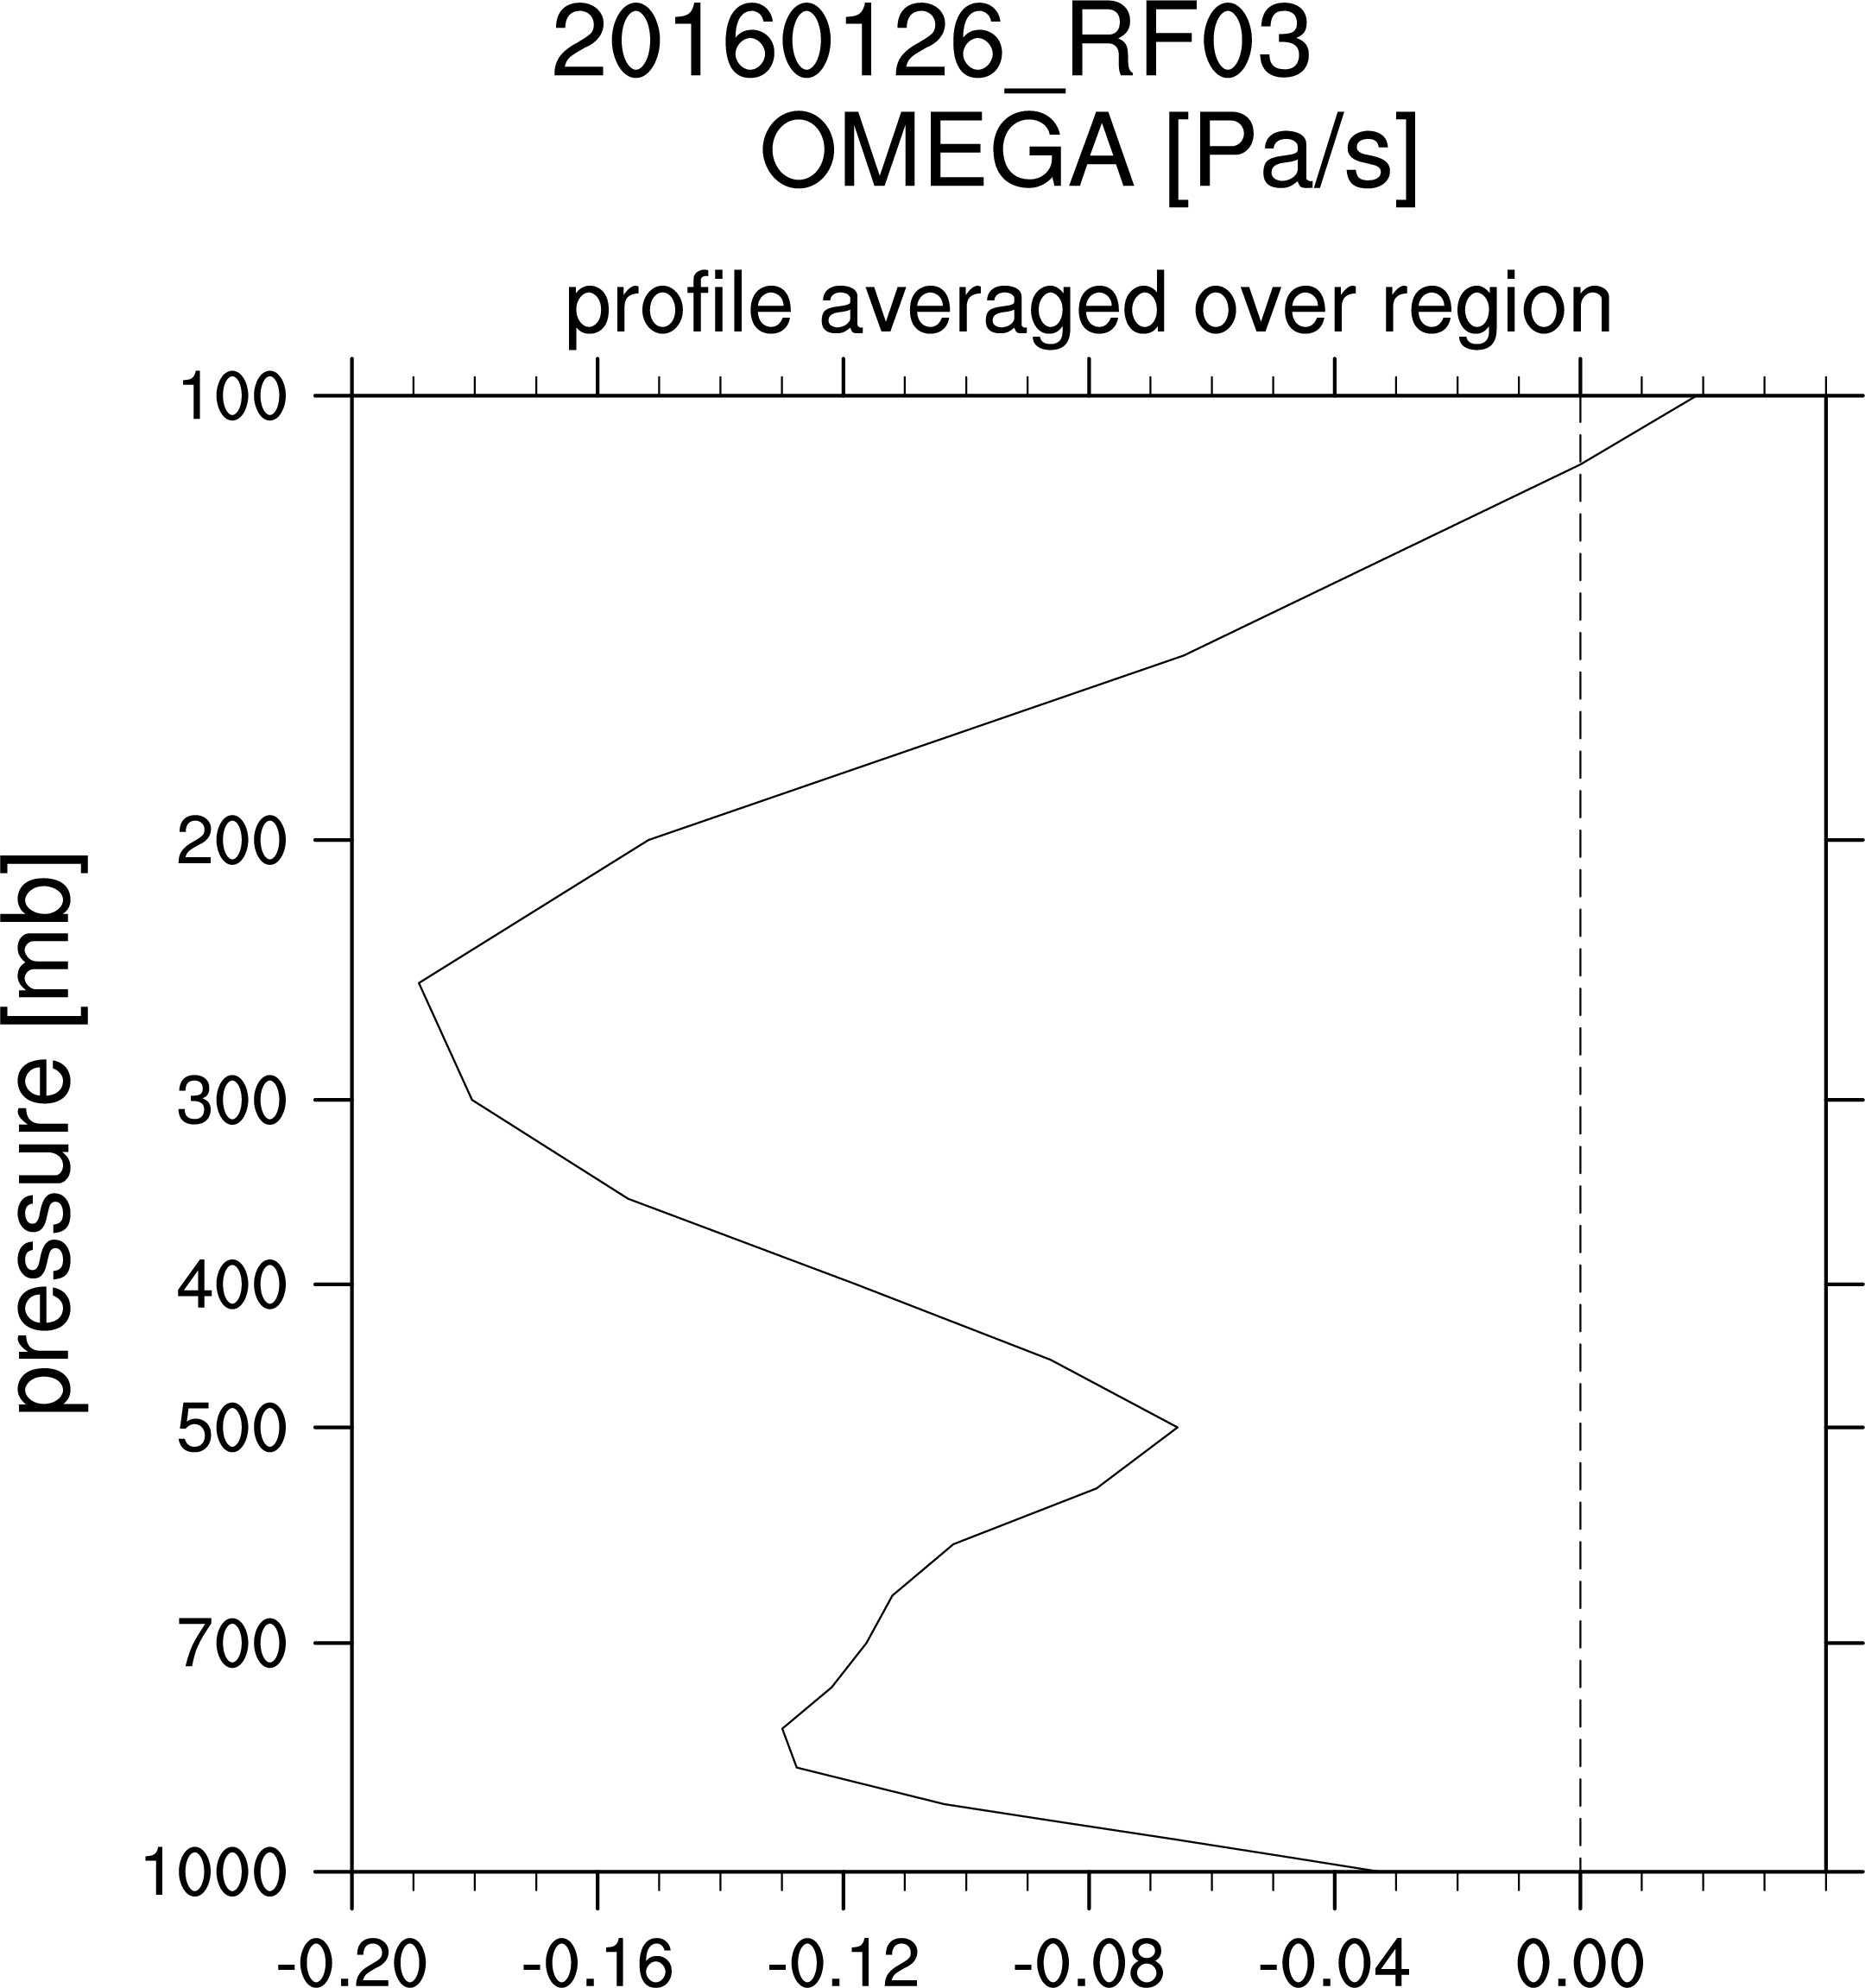
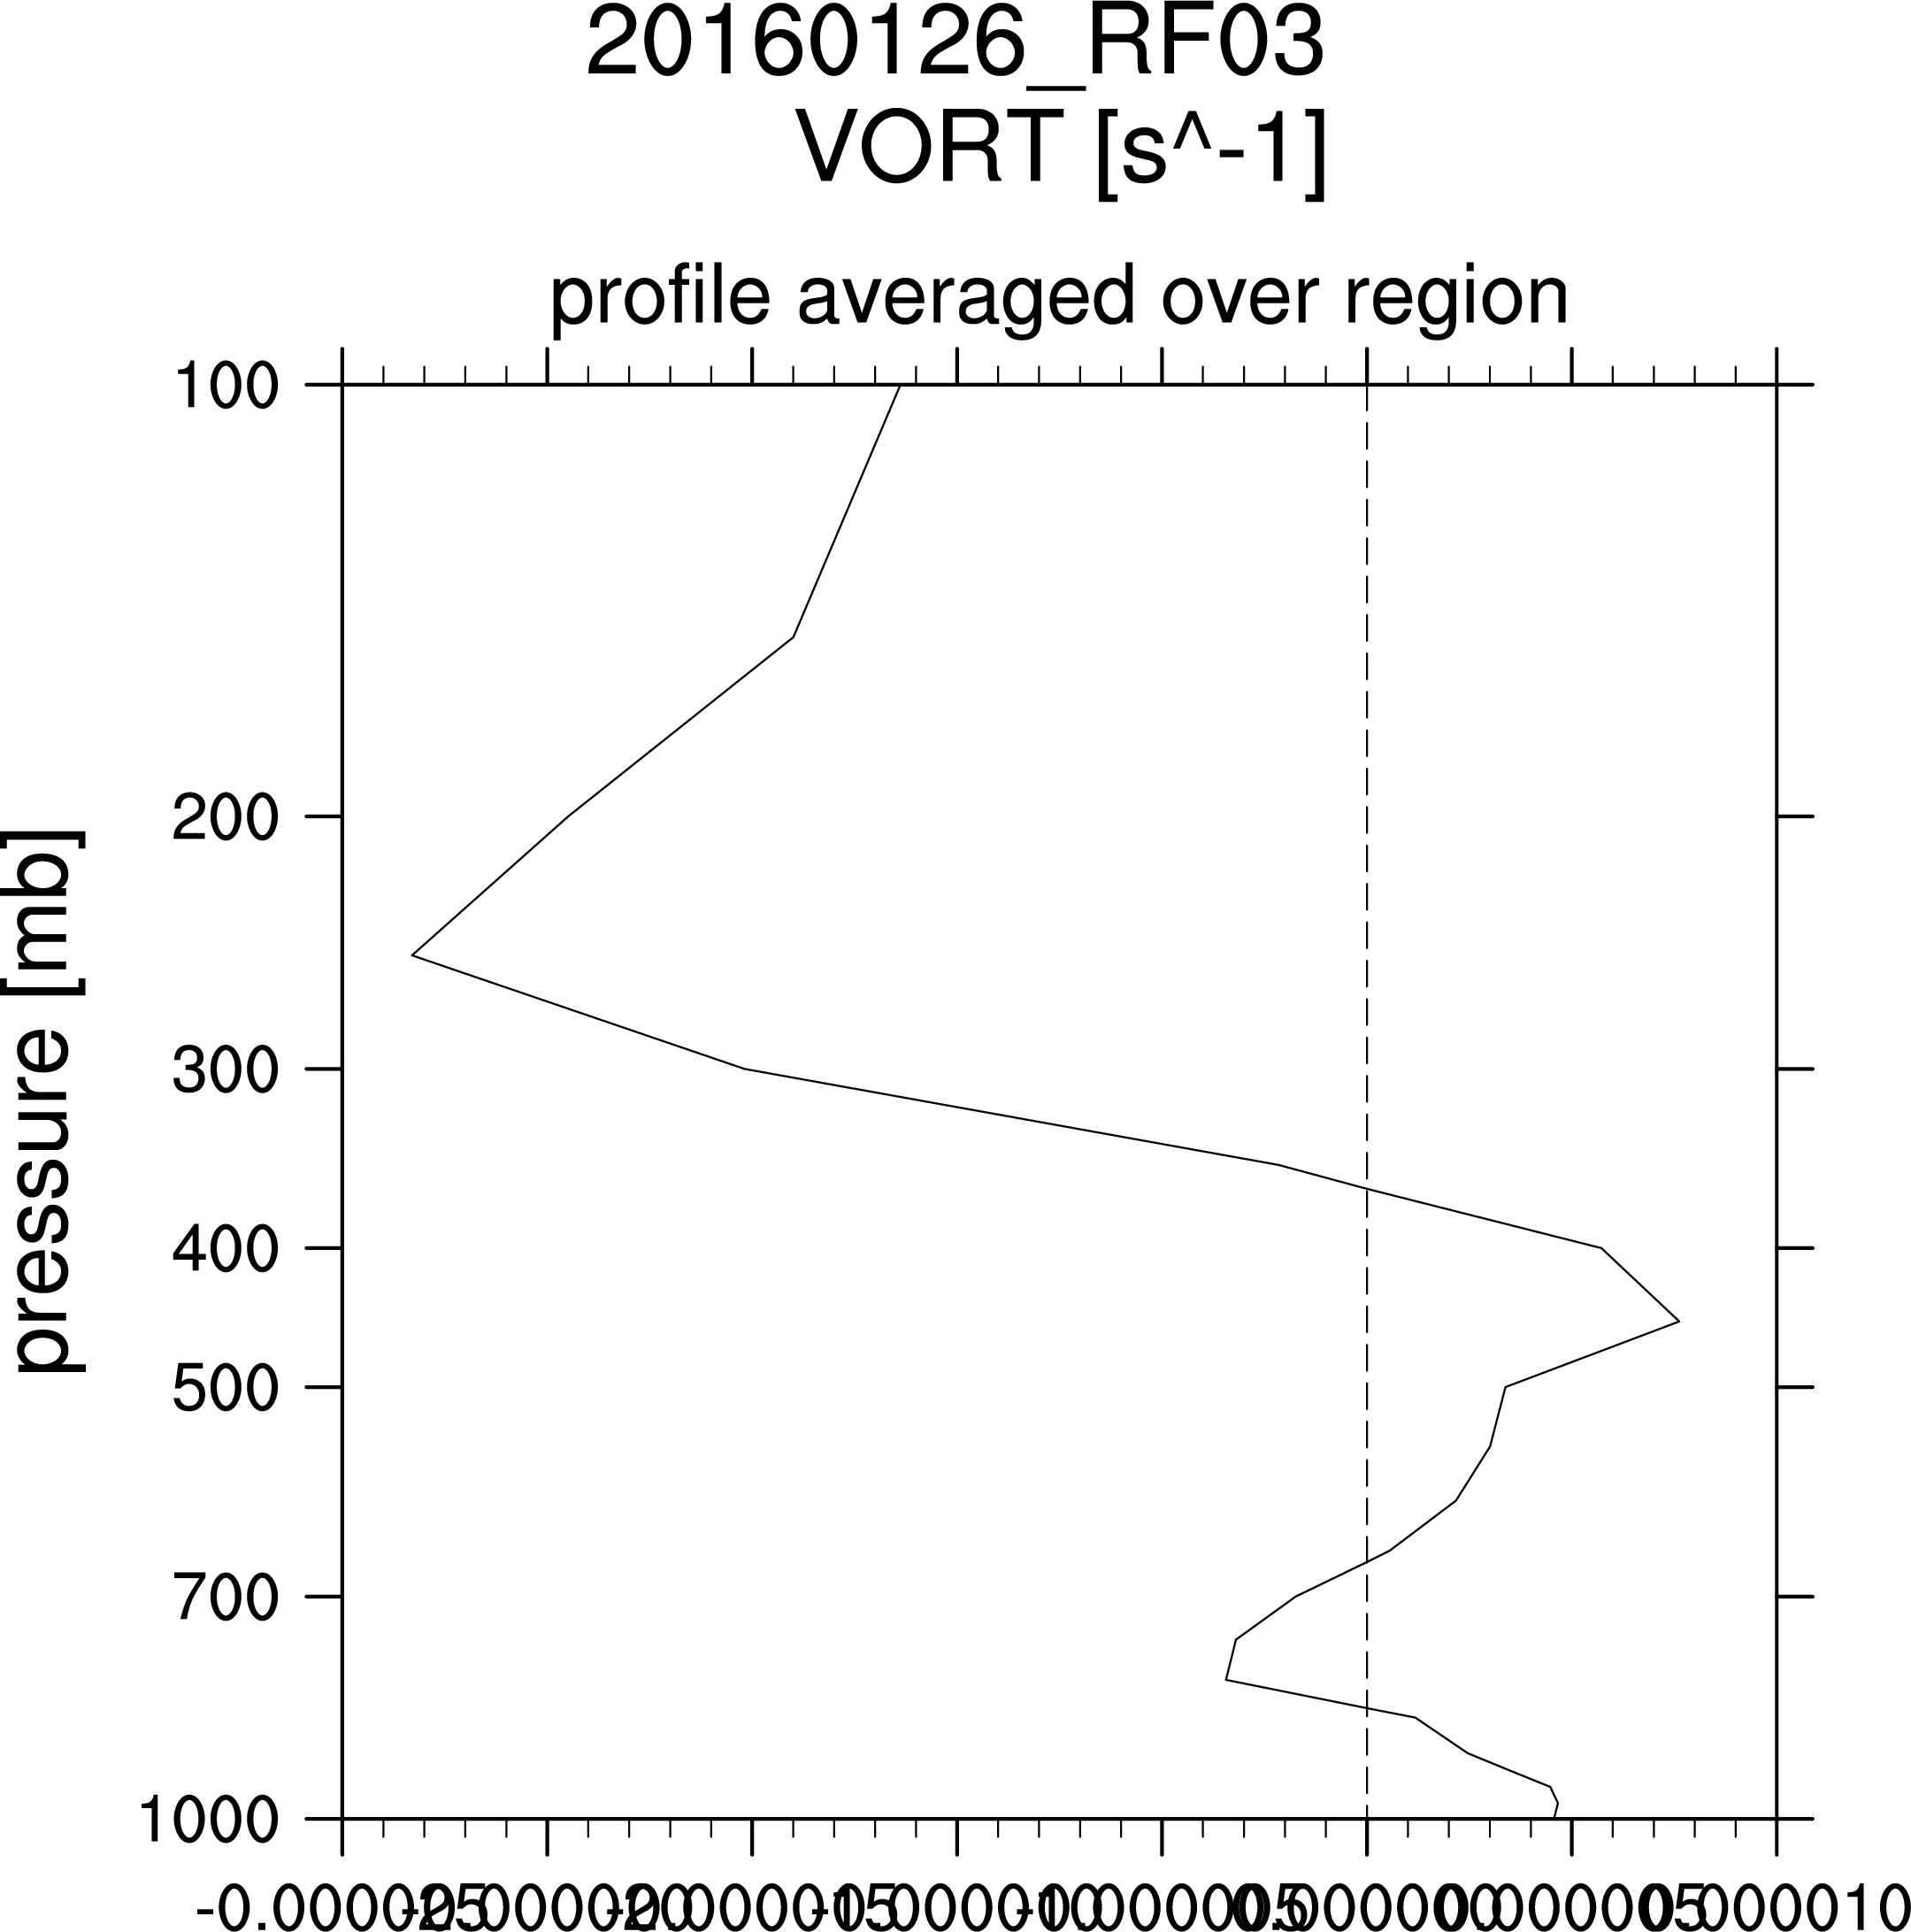
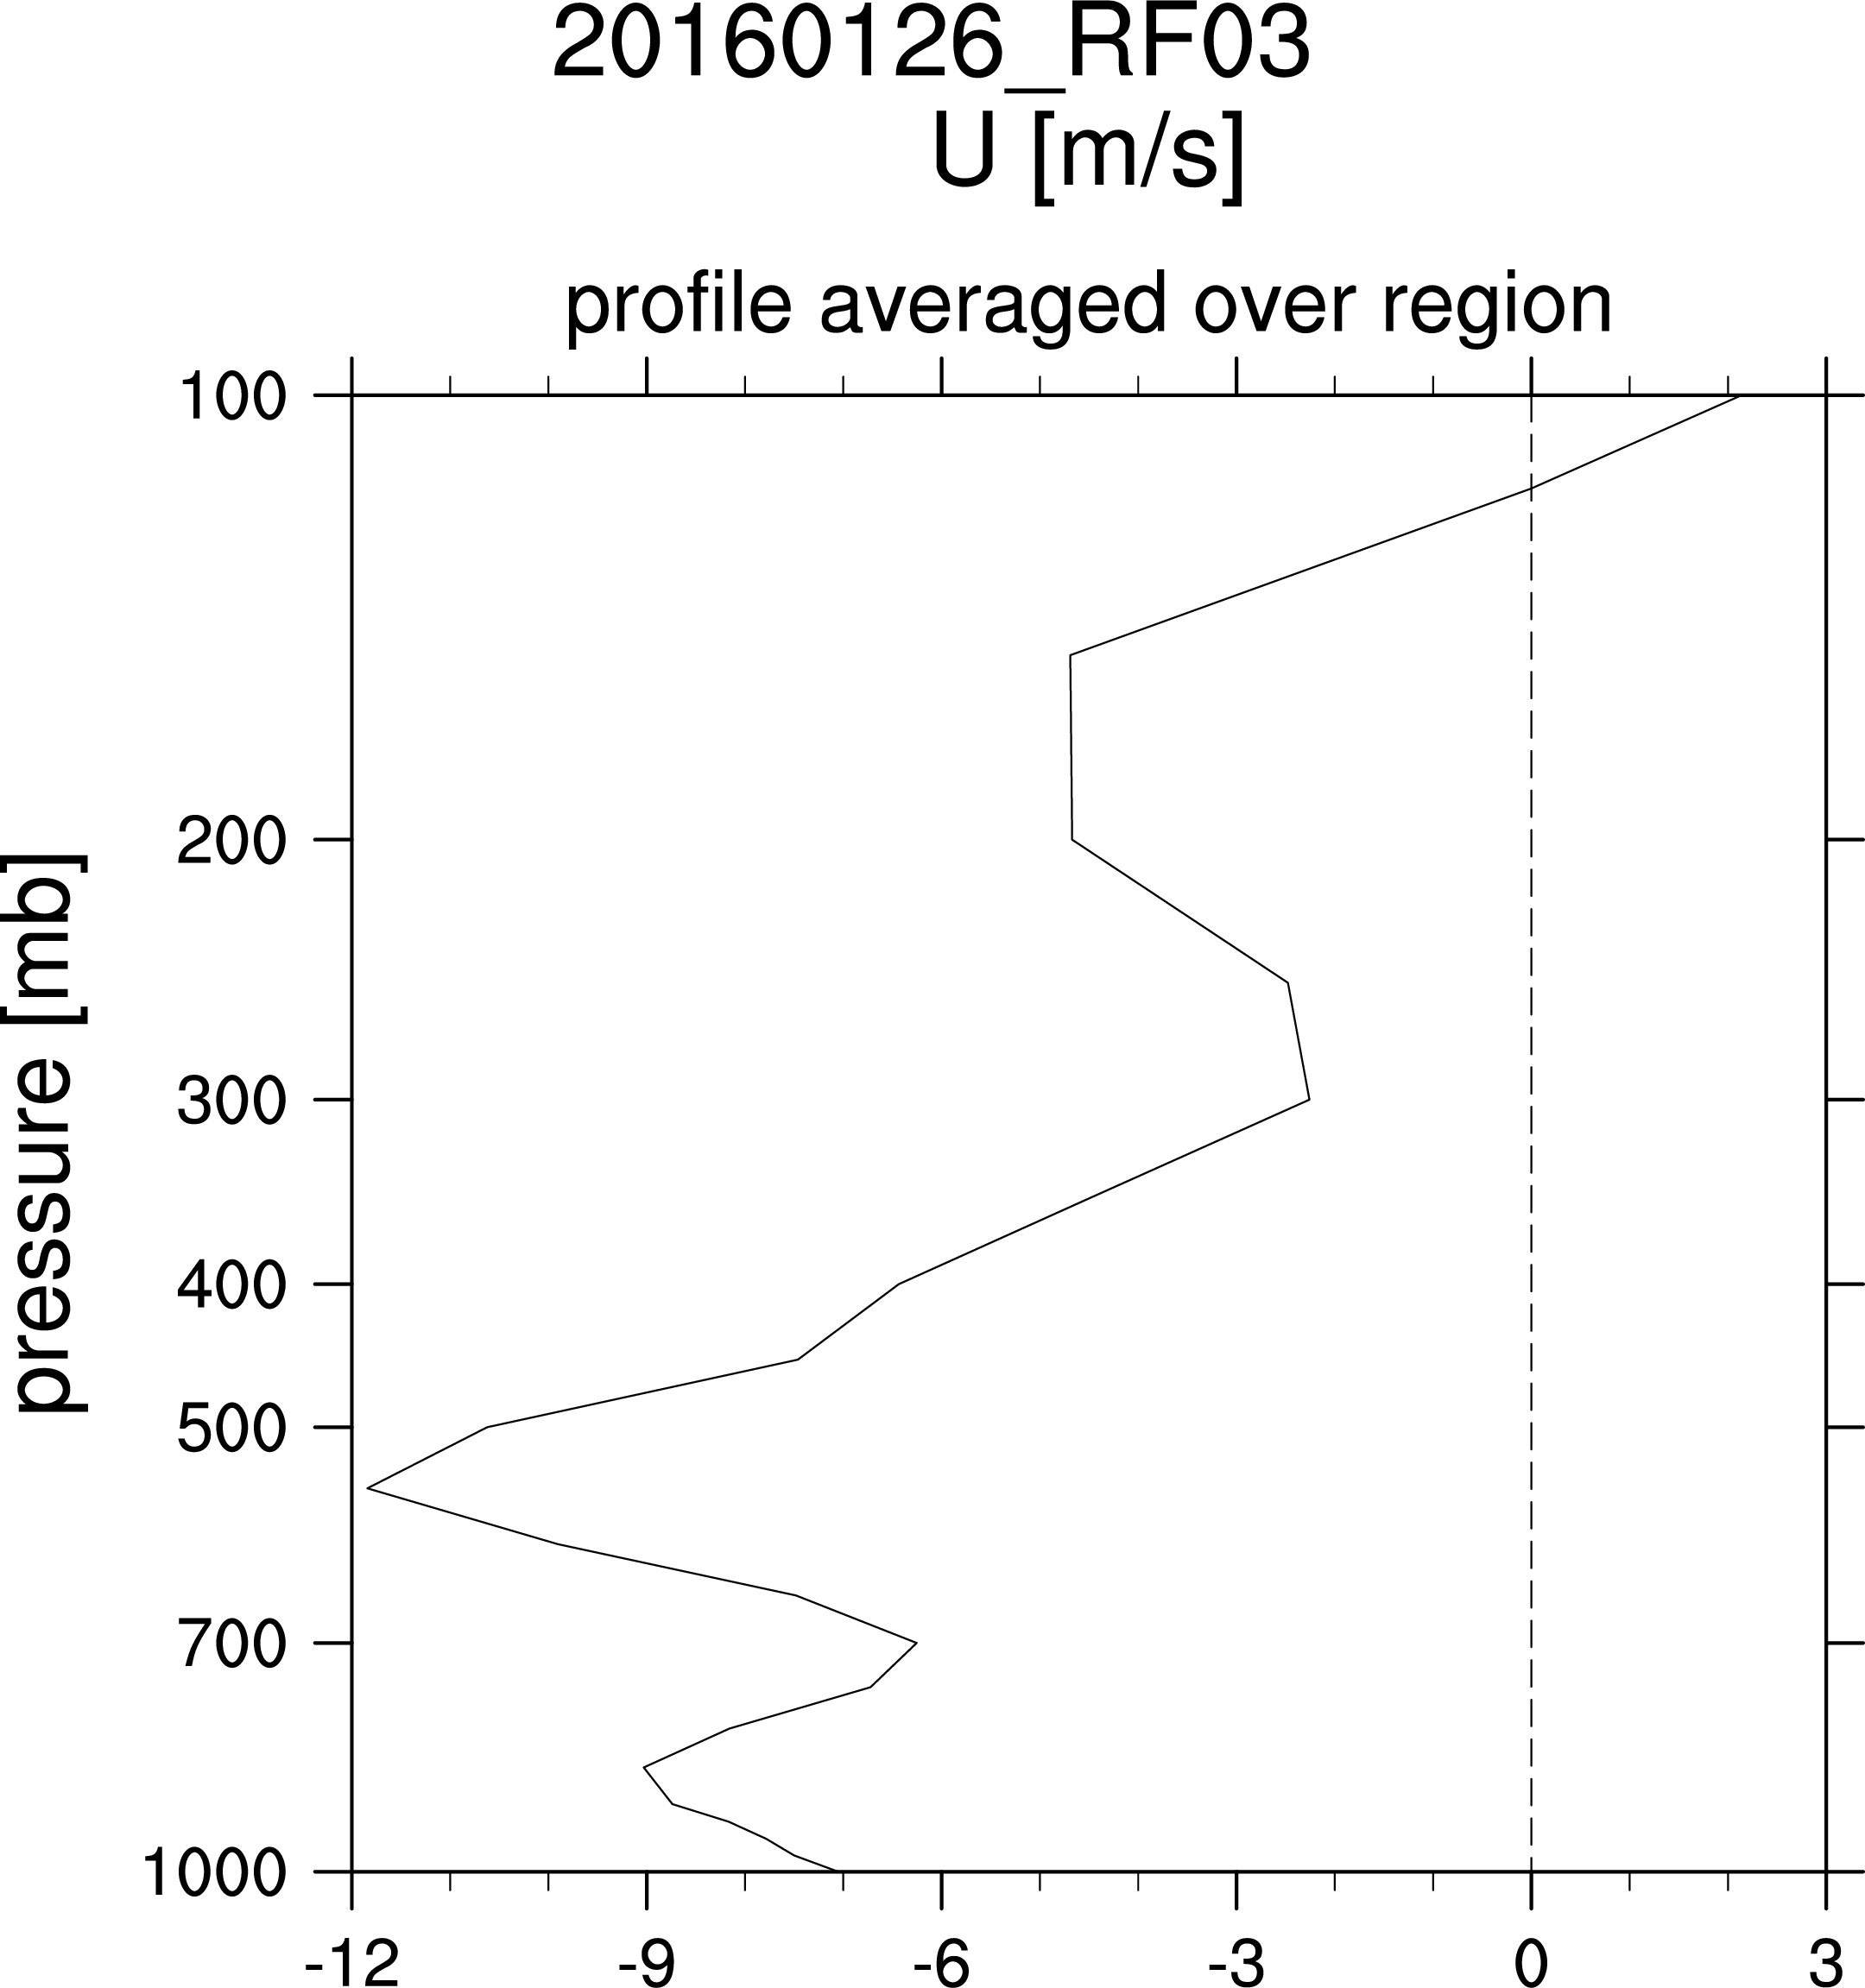
Flight 3: 20160126_RF03profile.avg.20160126_RF03.xlsx area ~ 965.


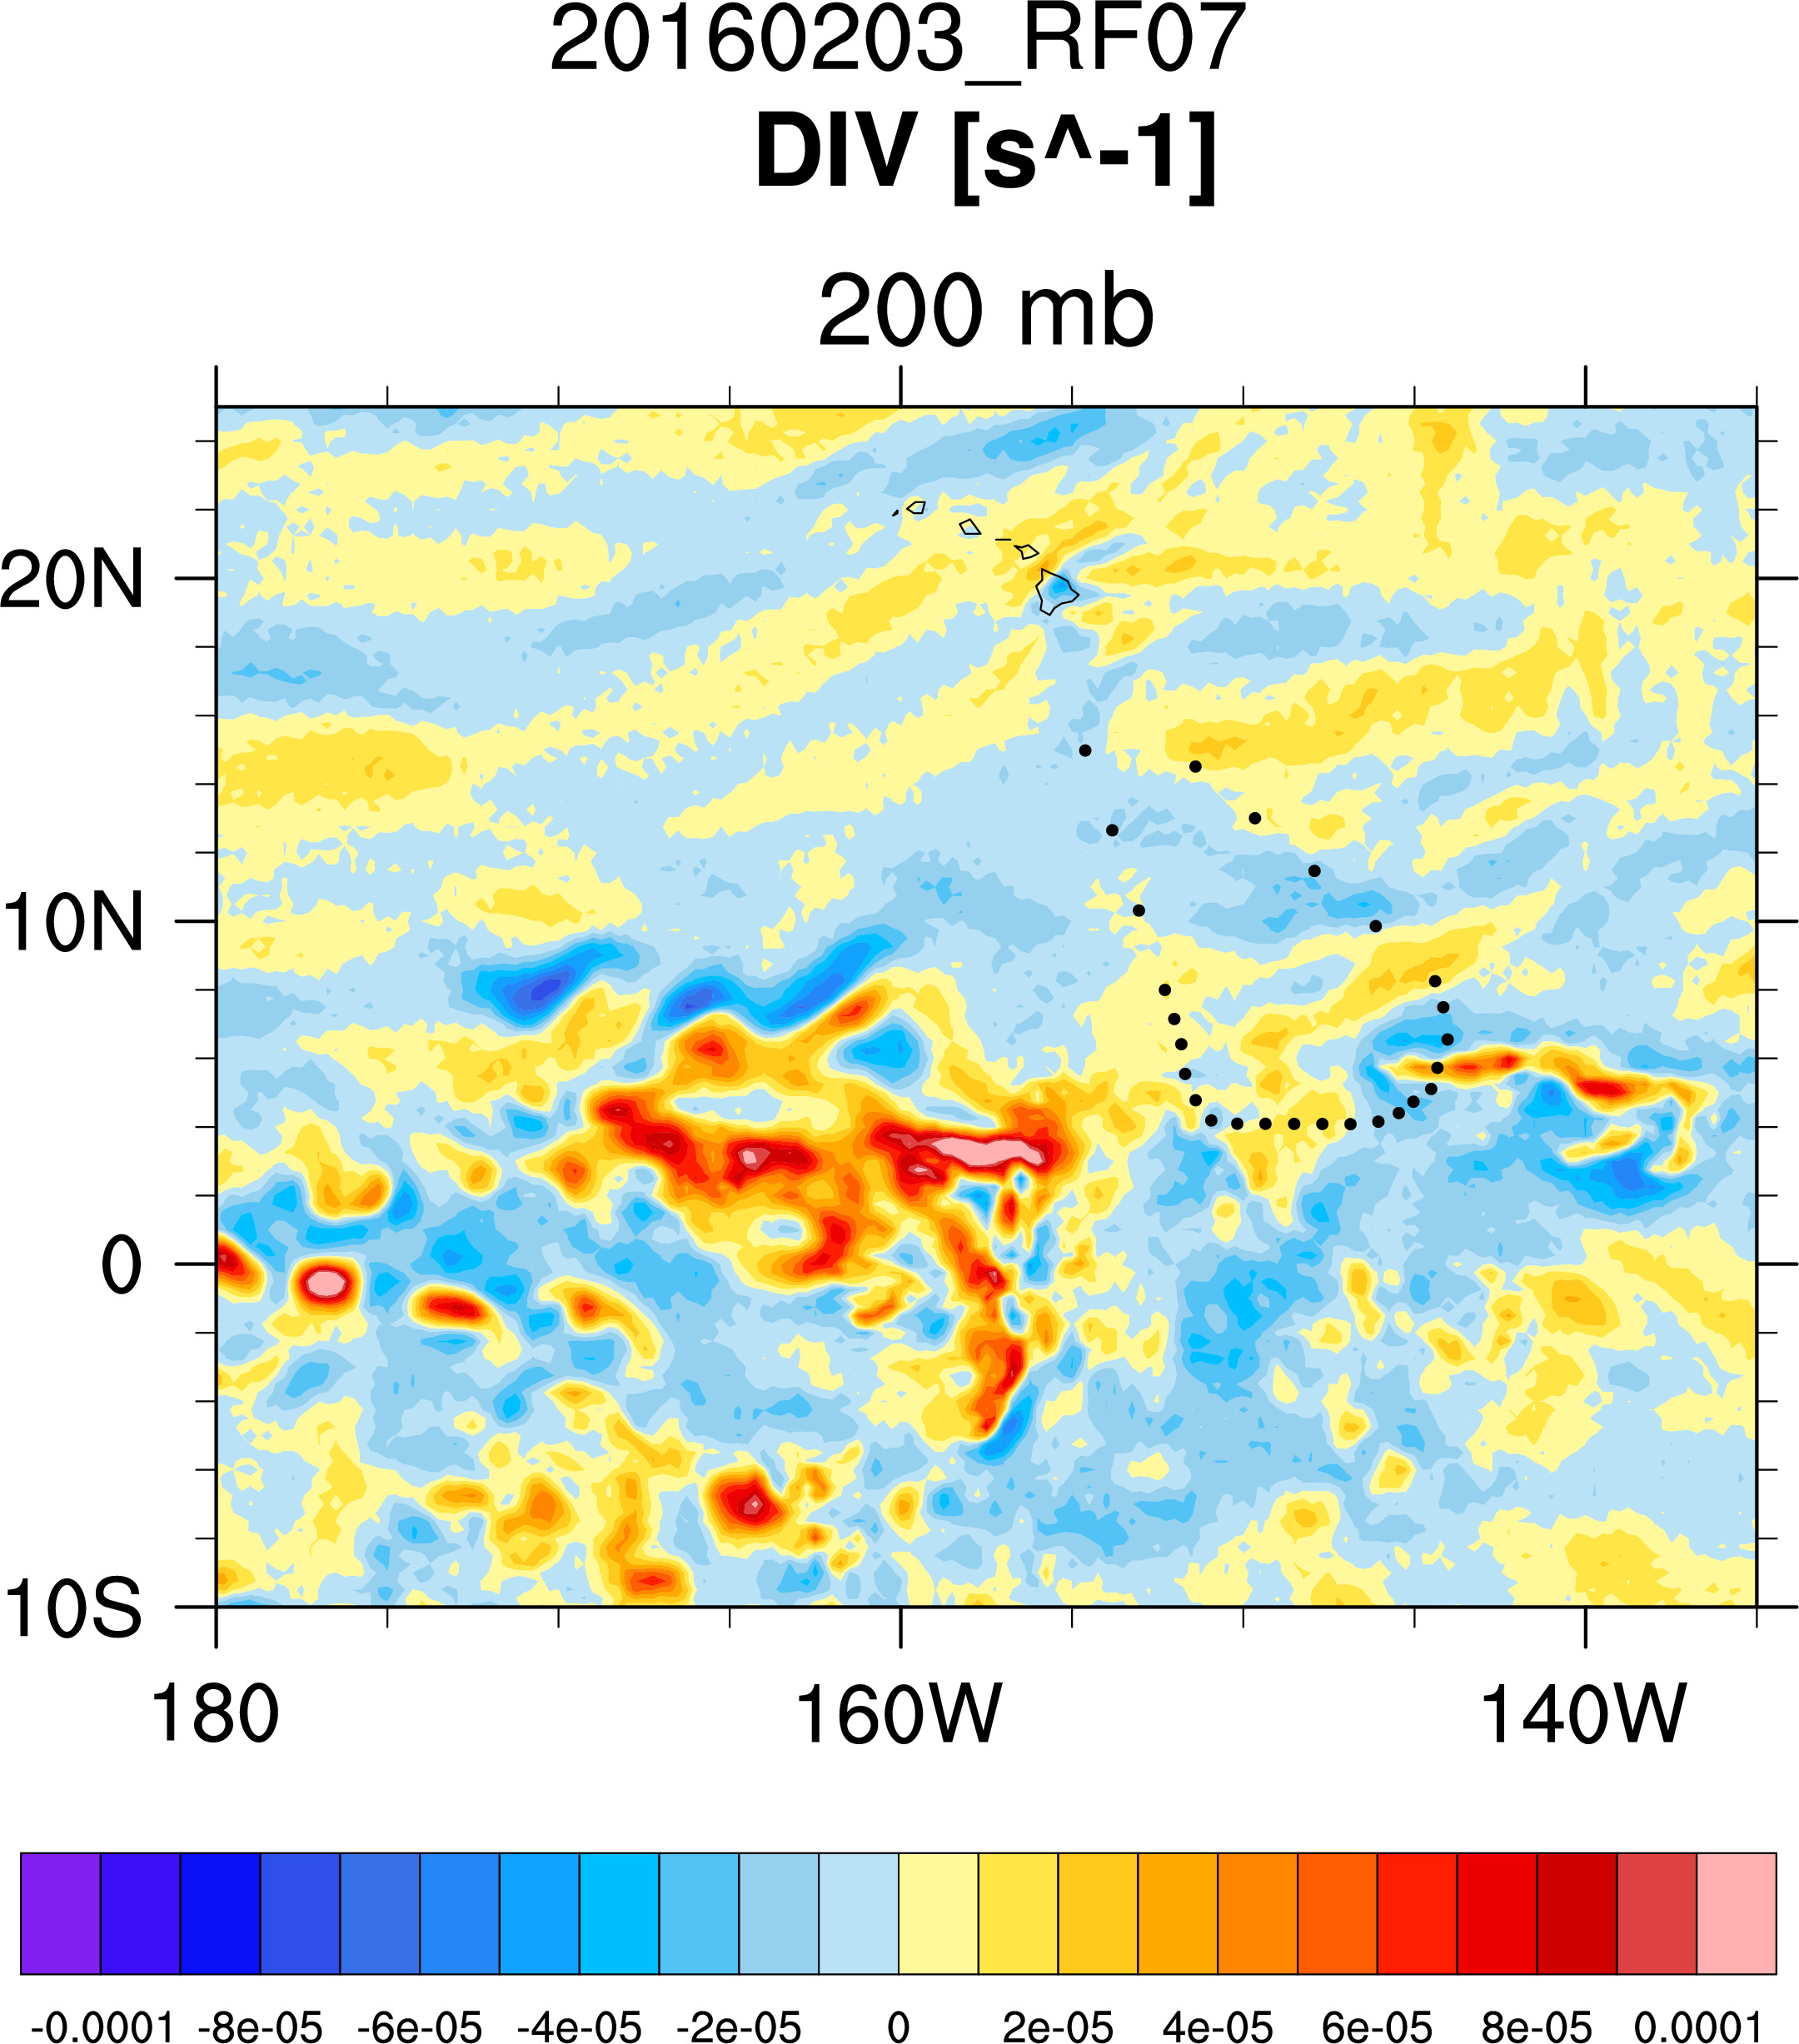
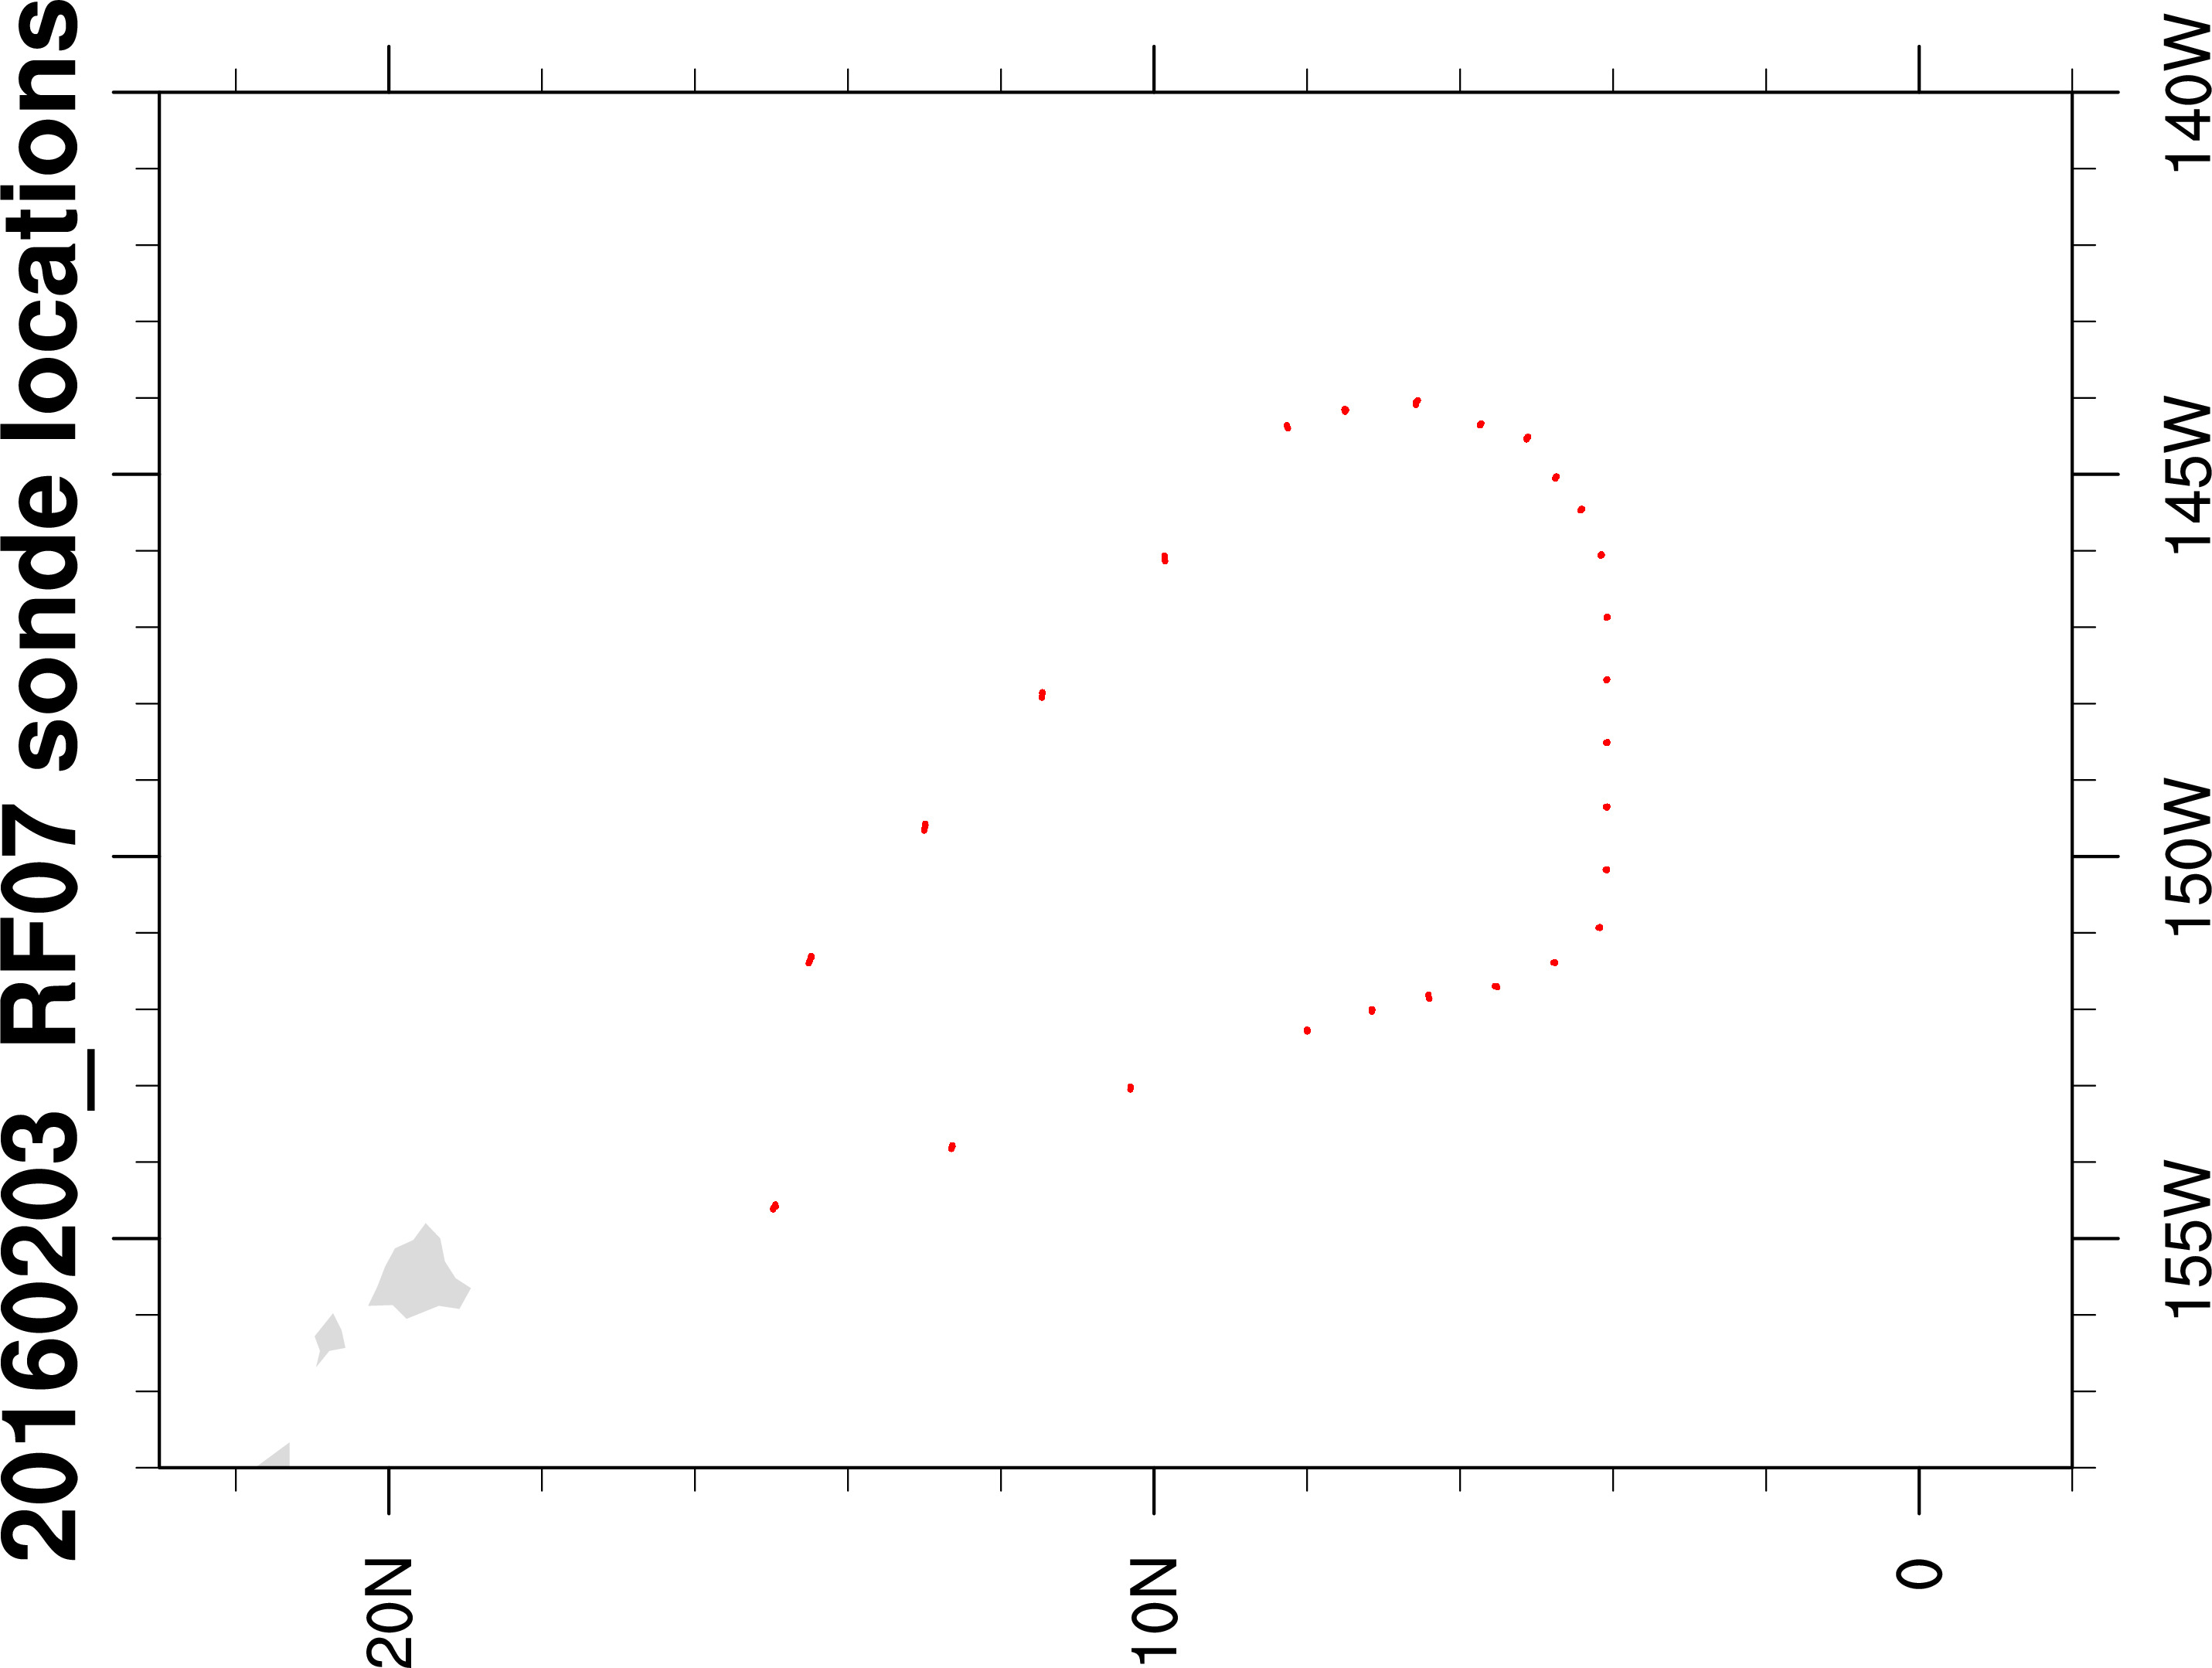
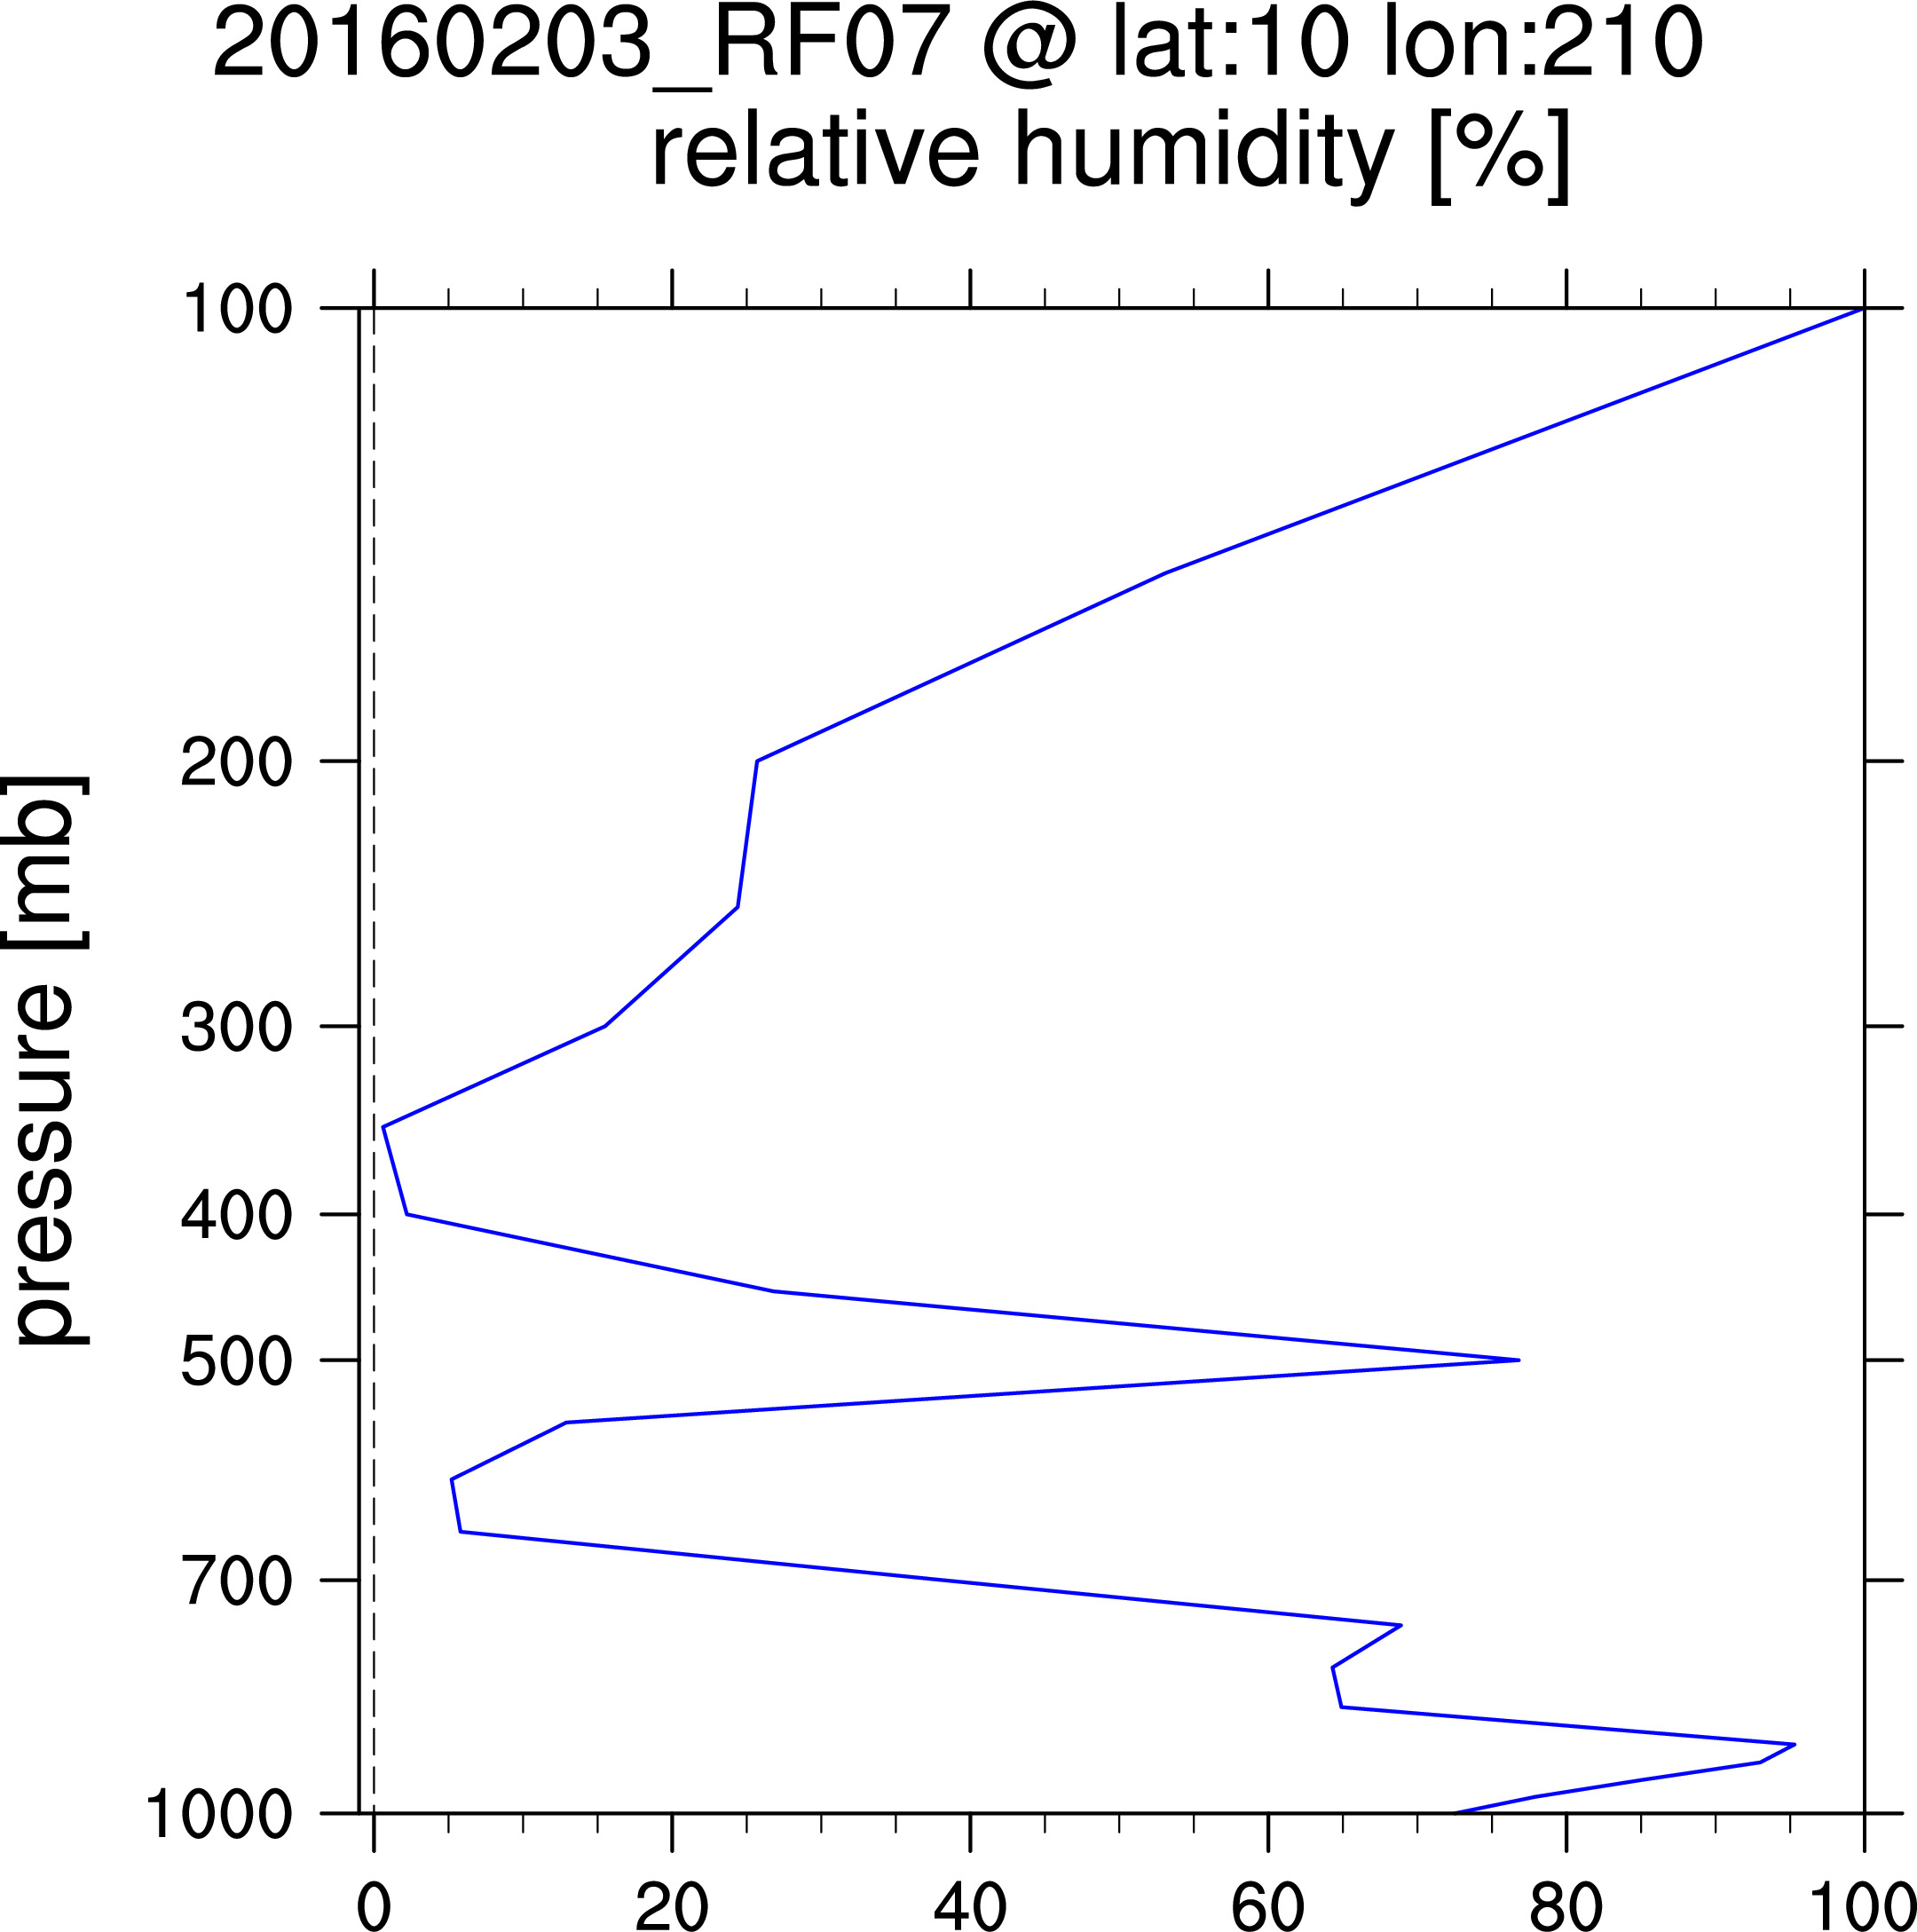
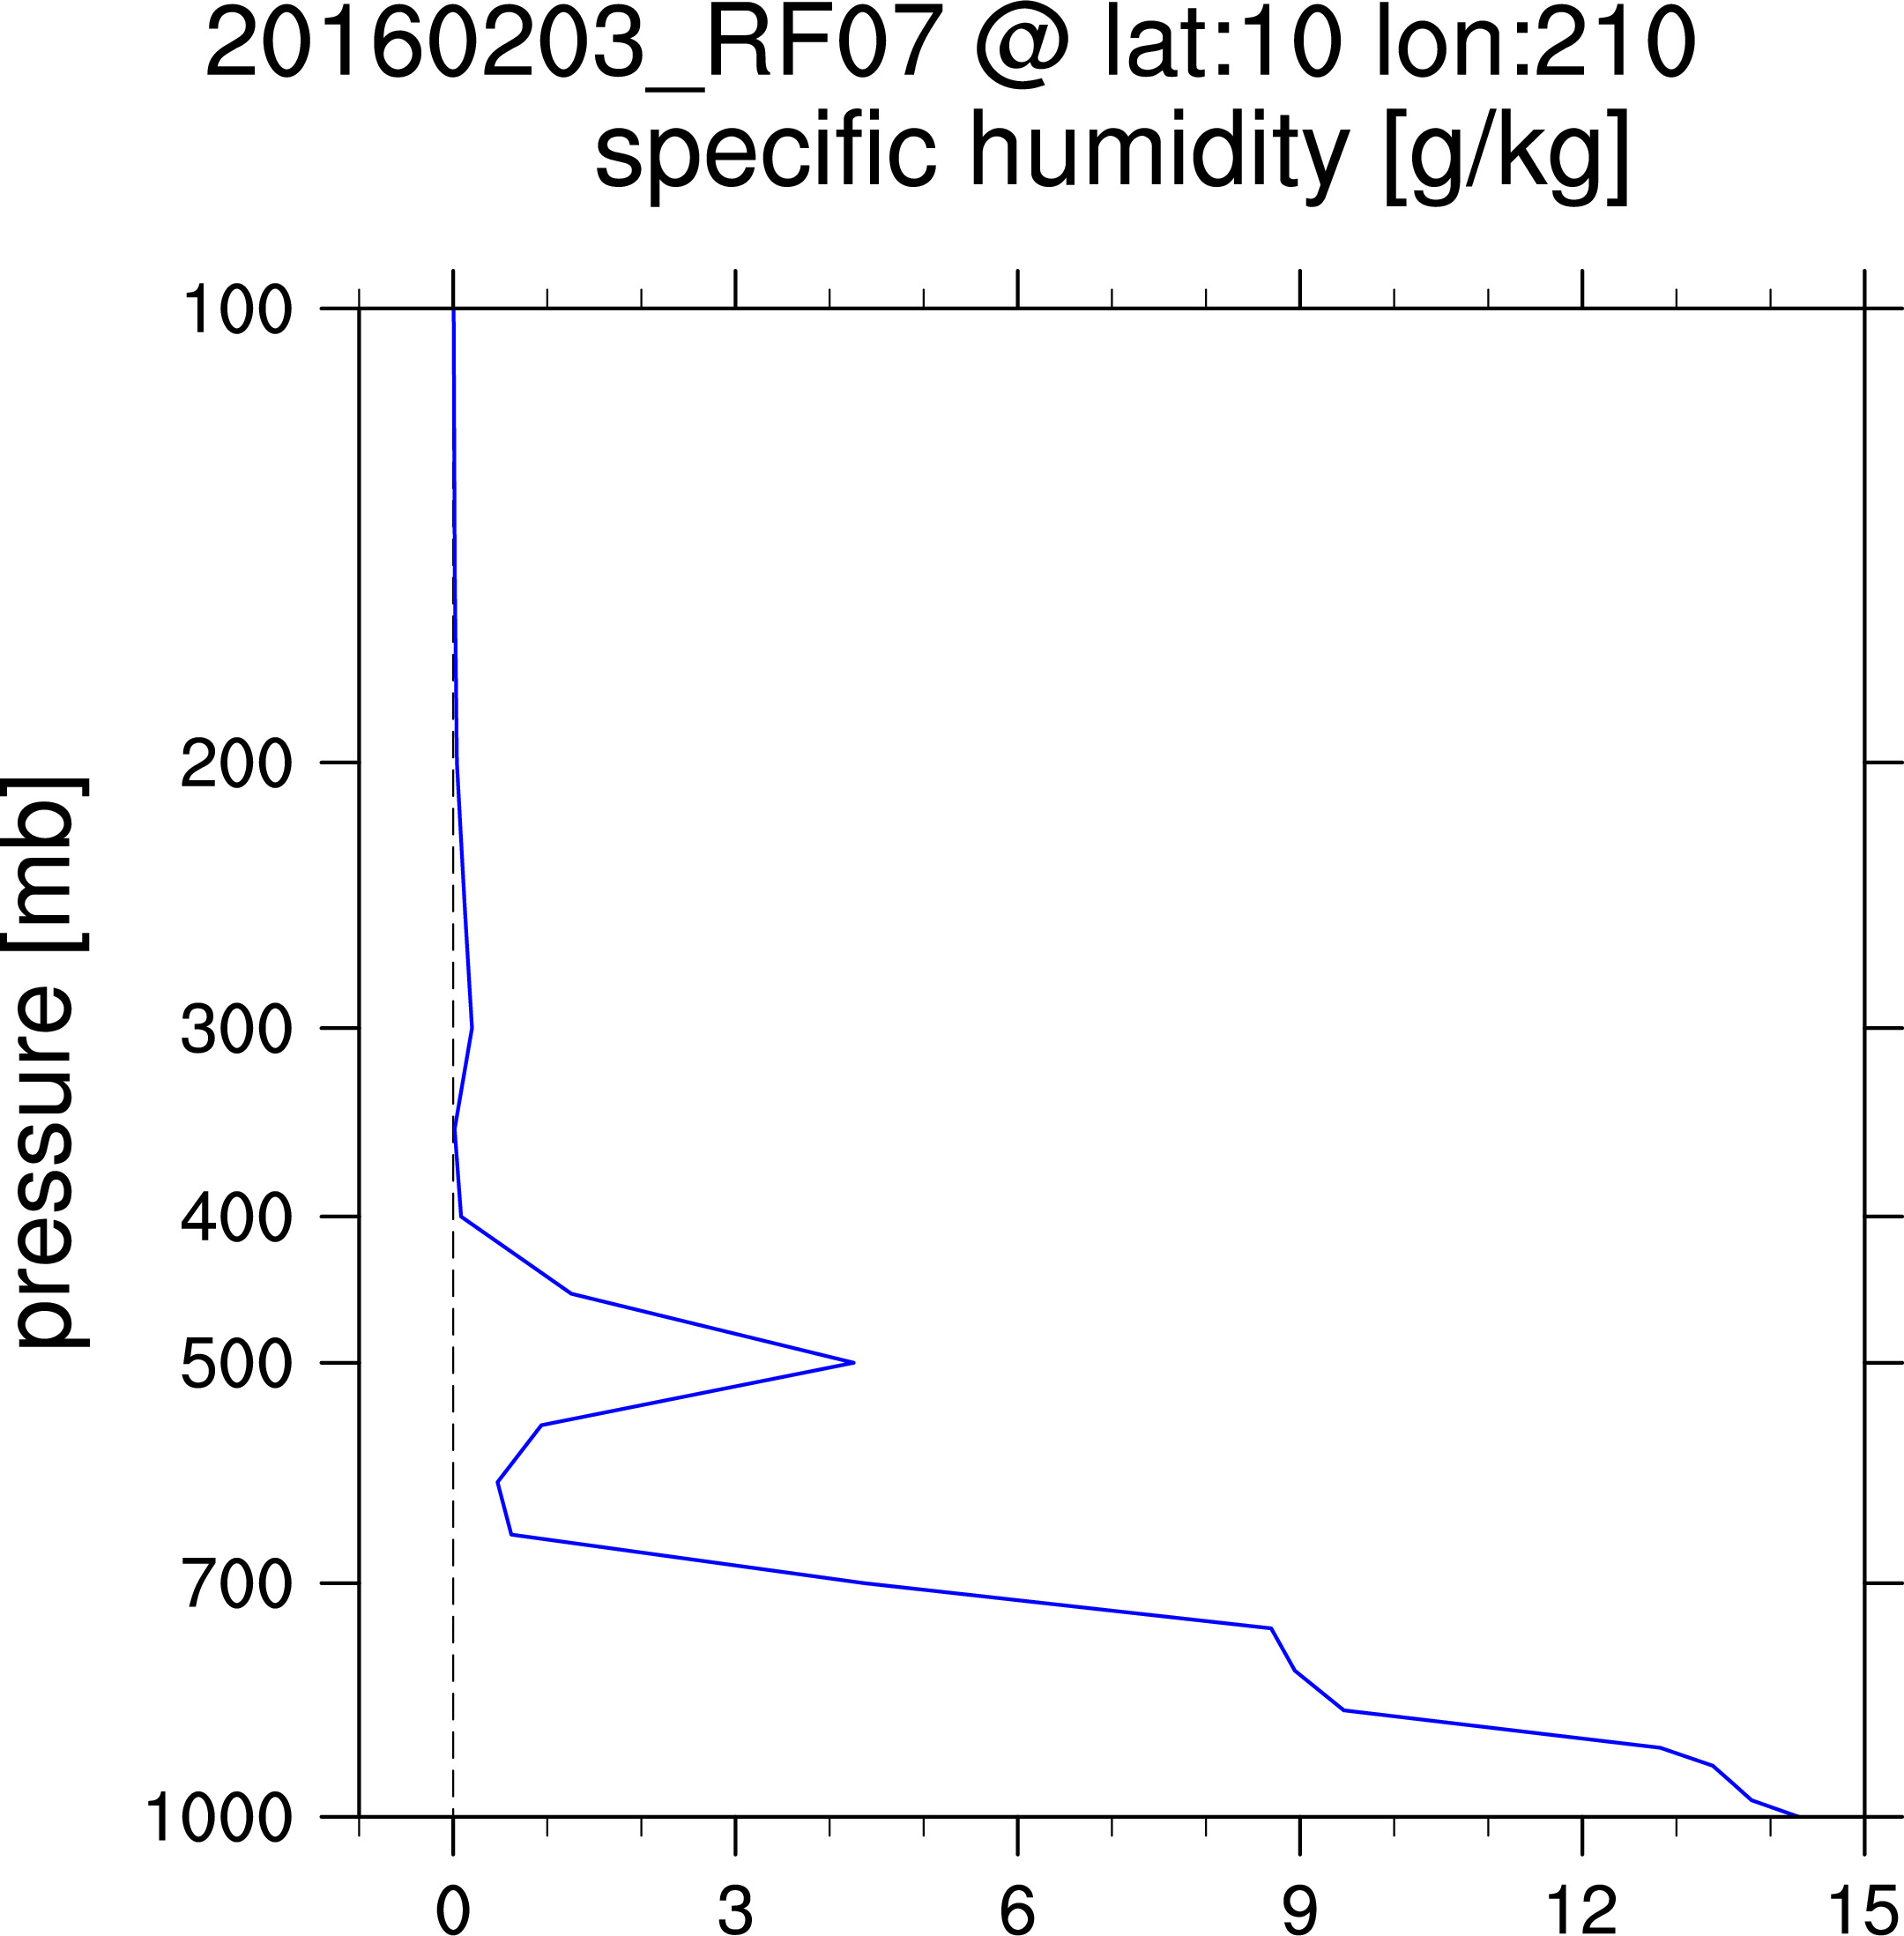
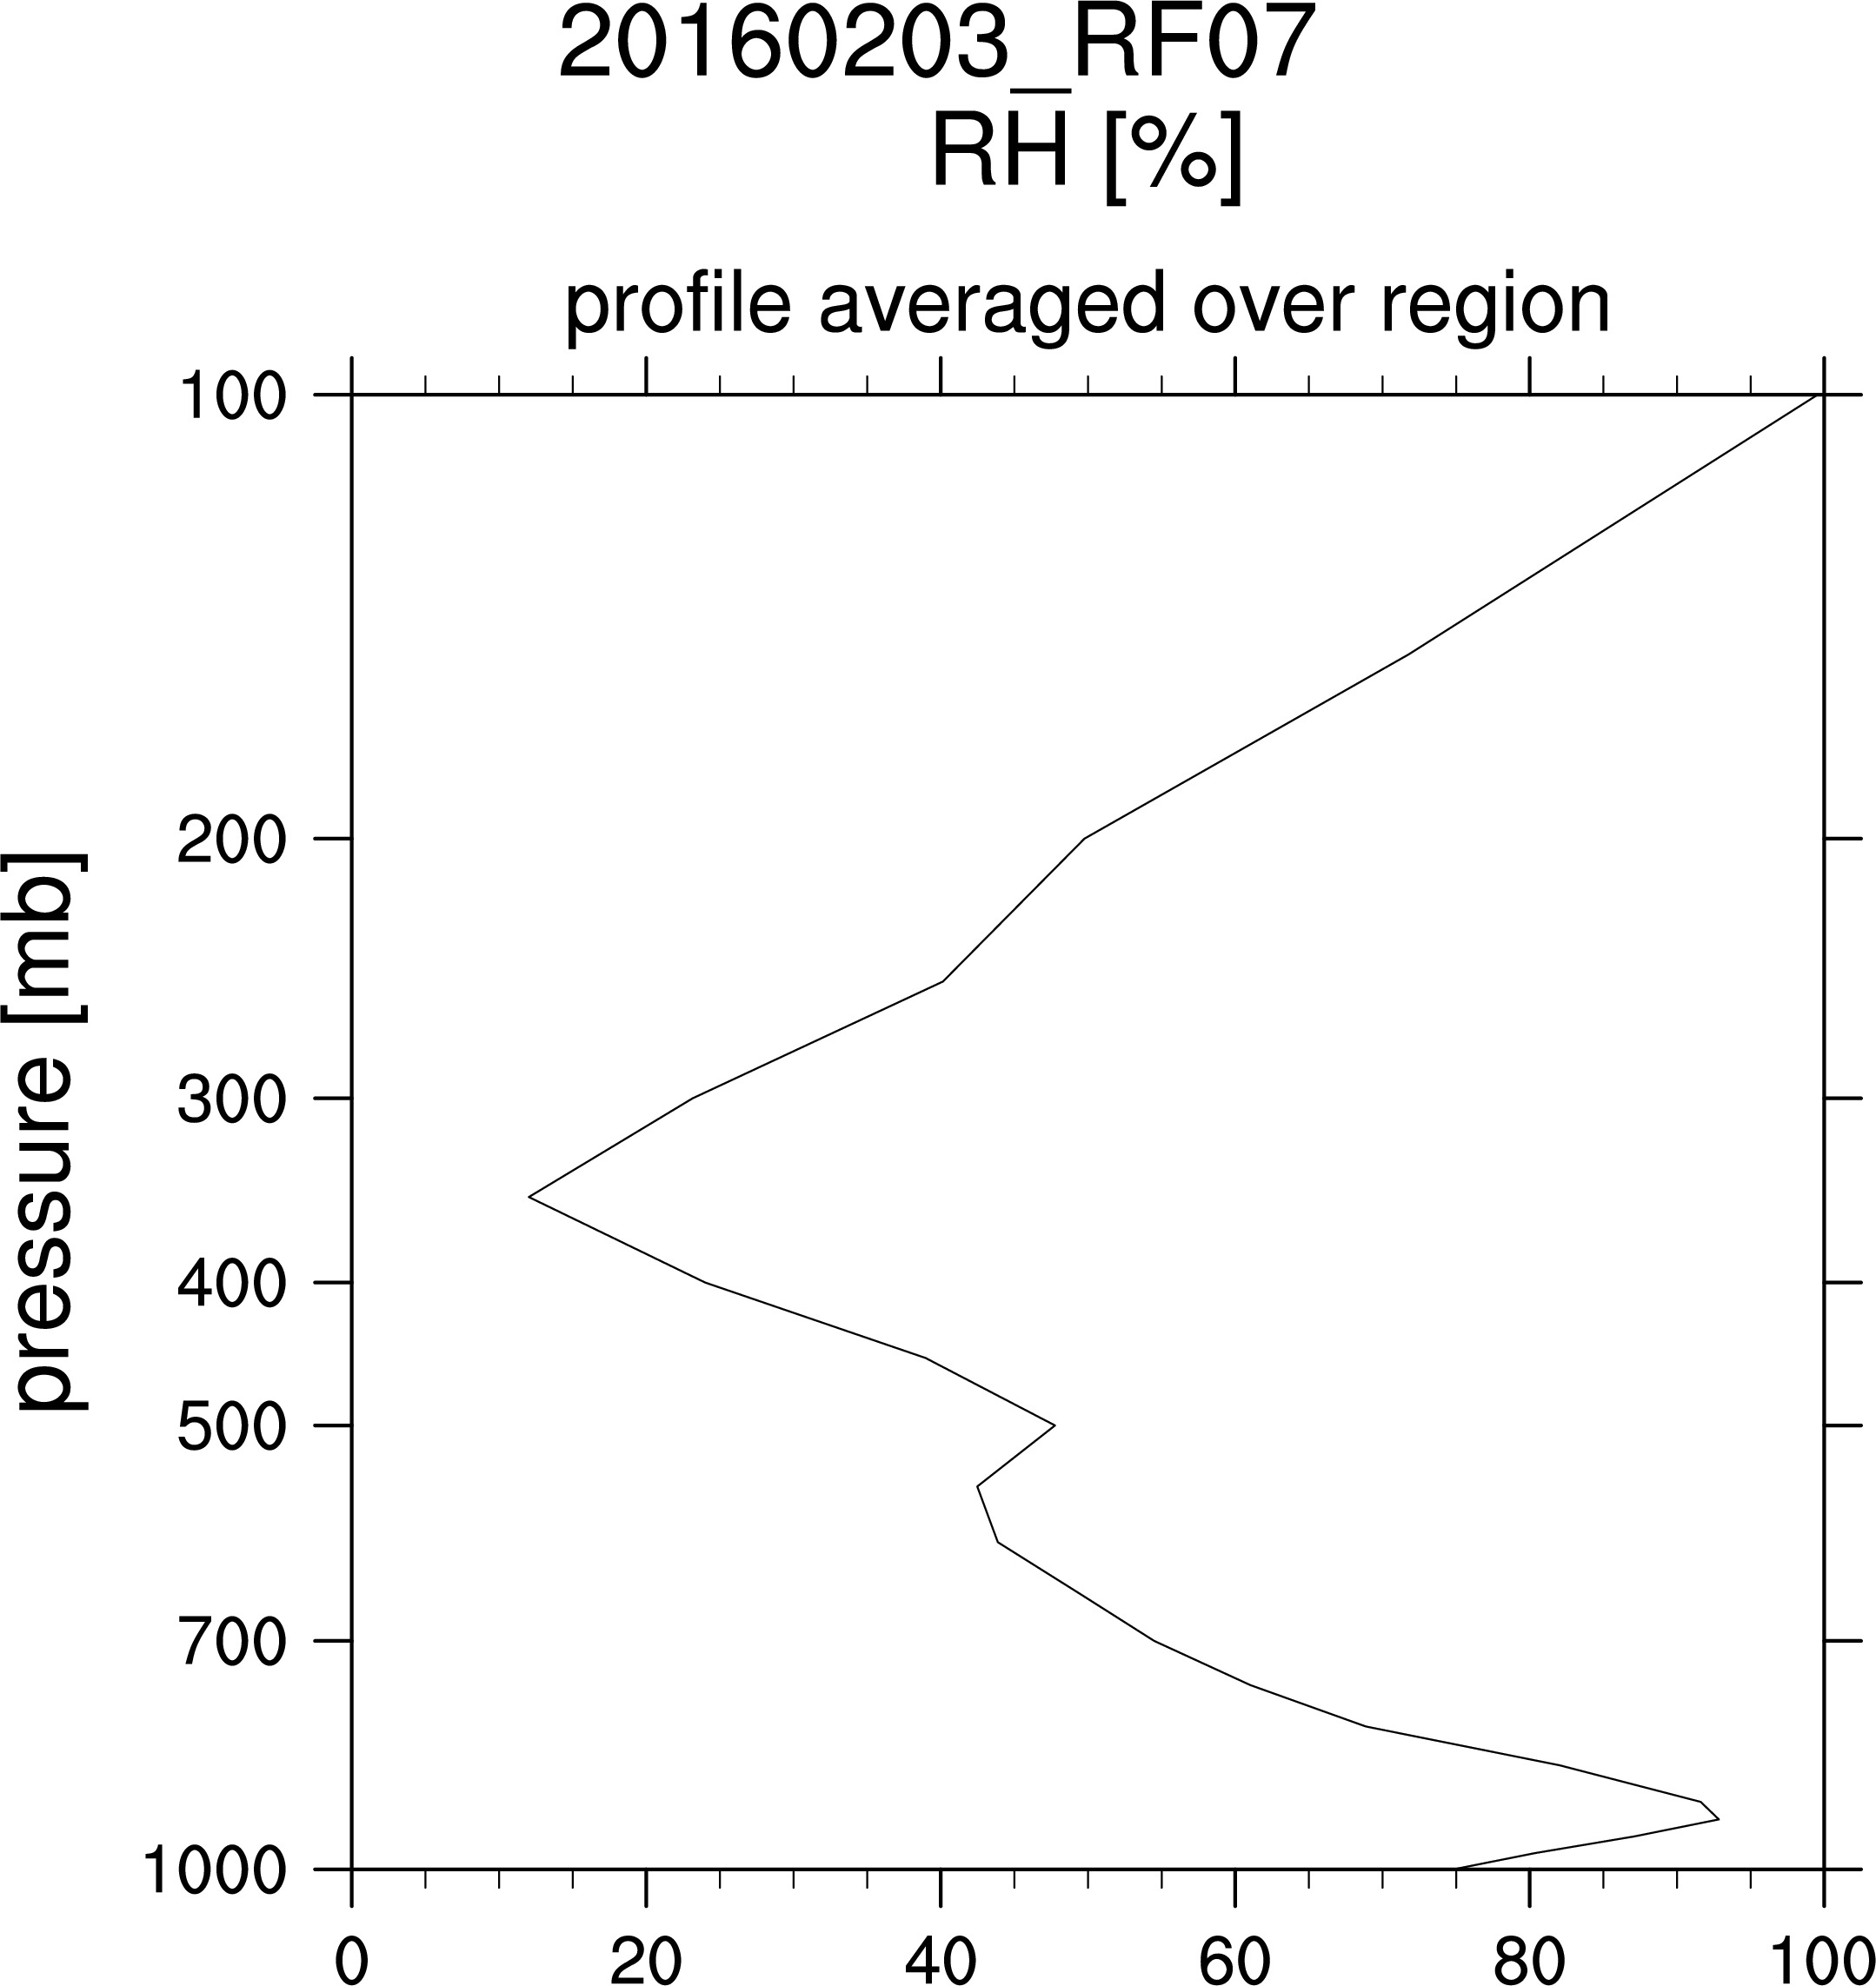
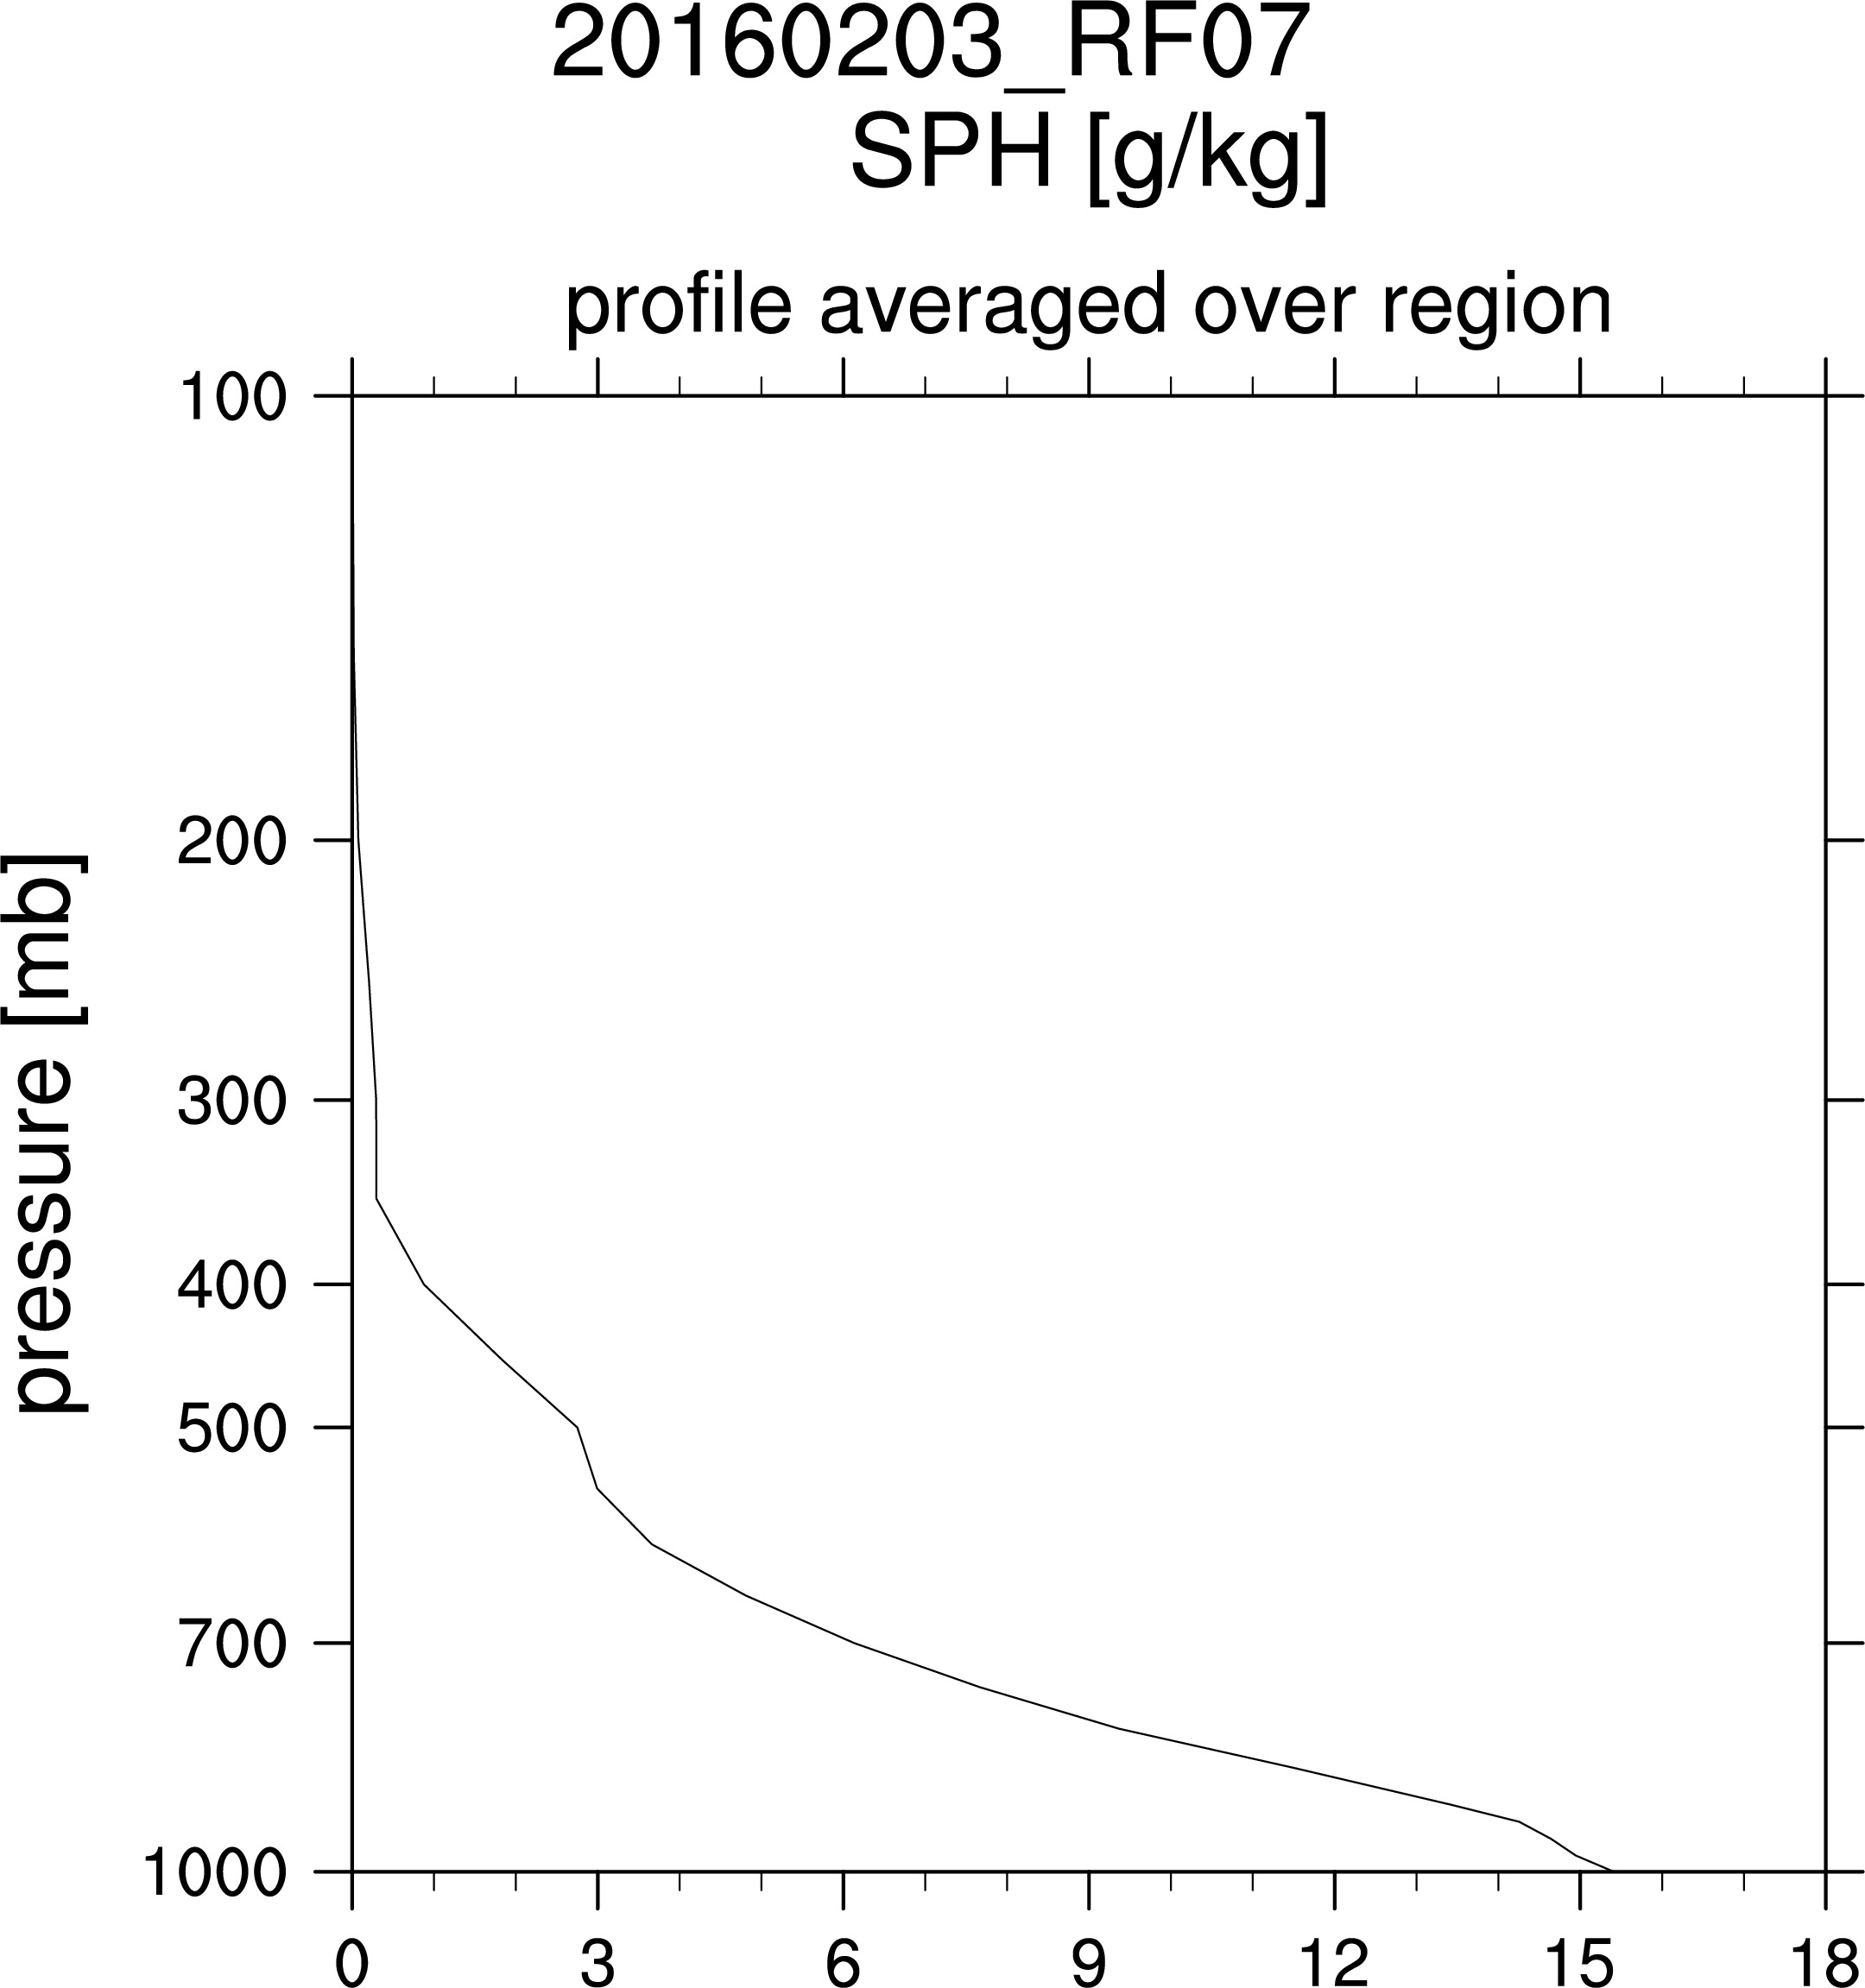
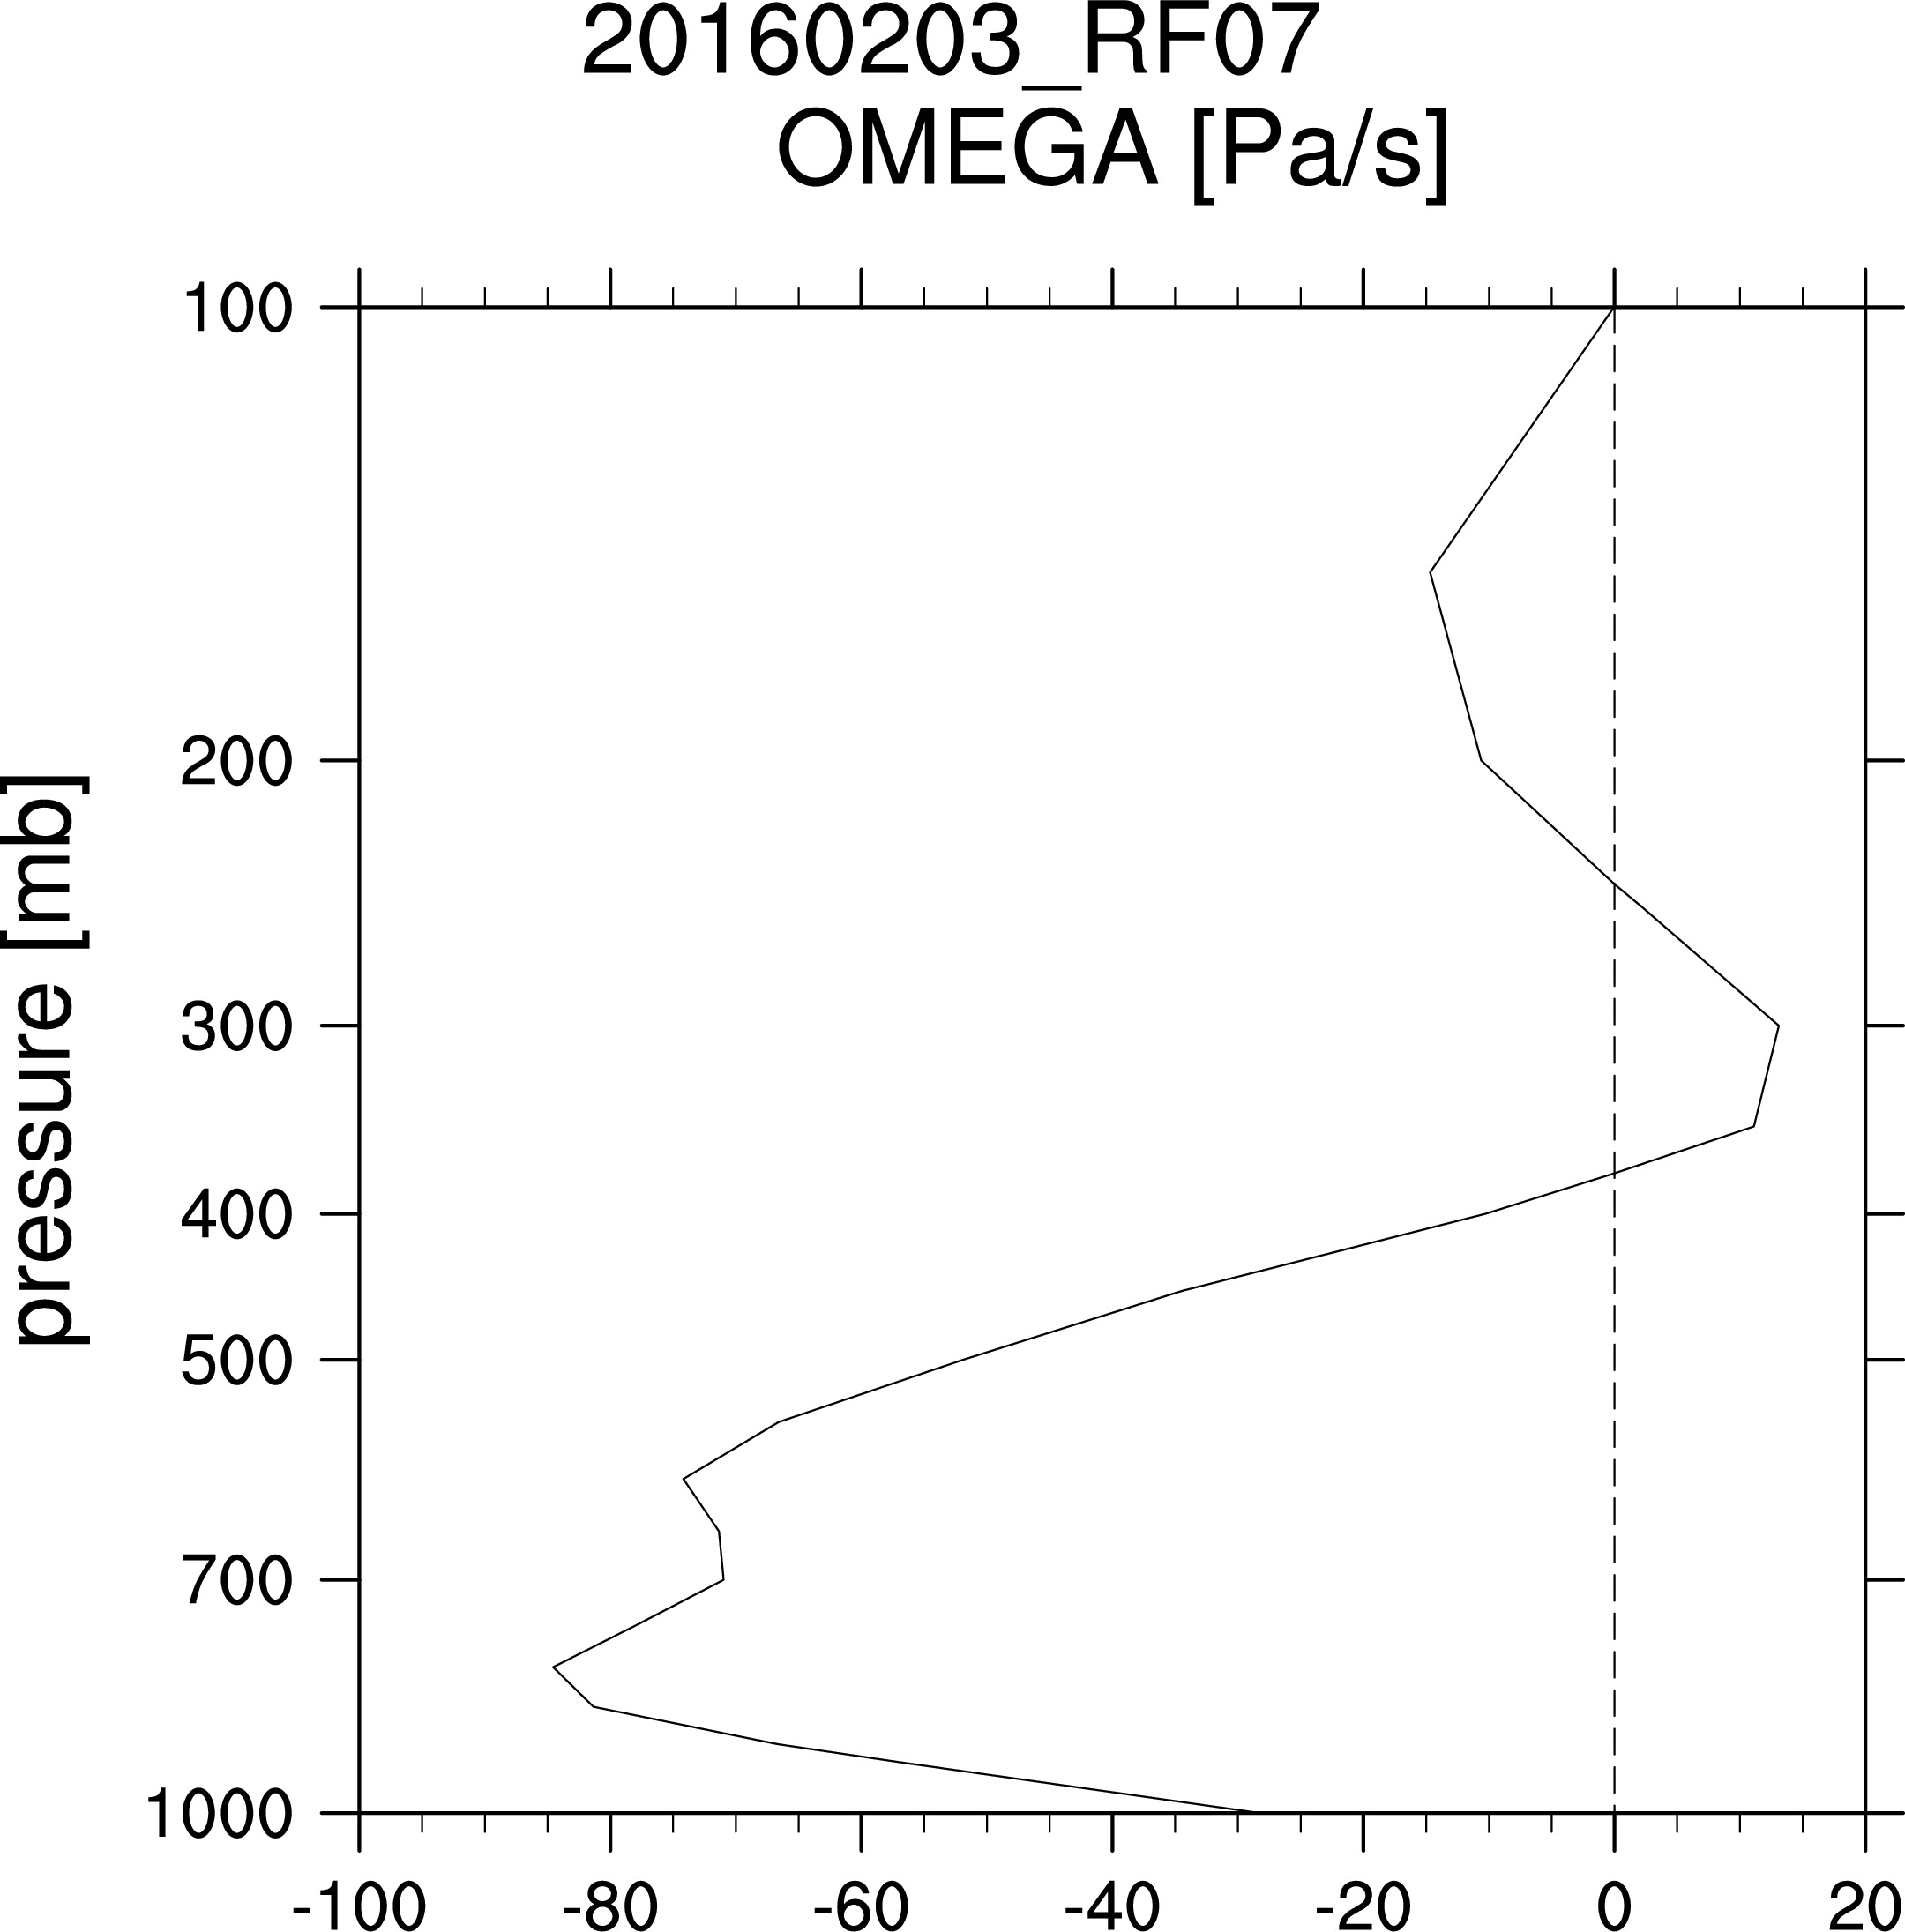
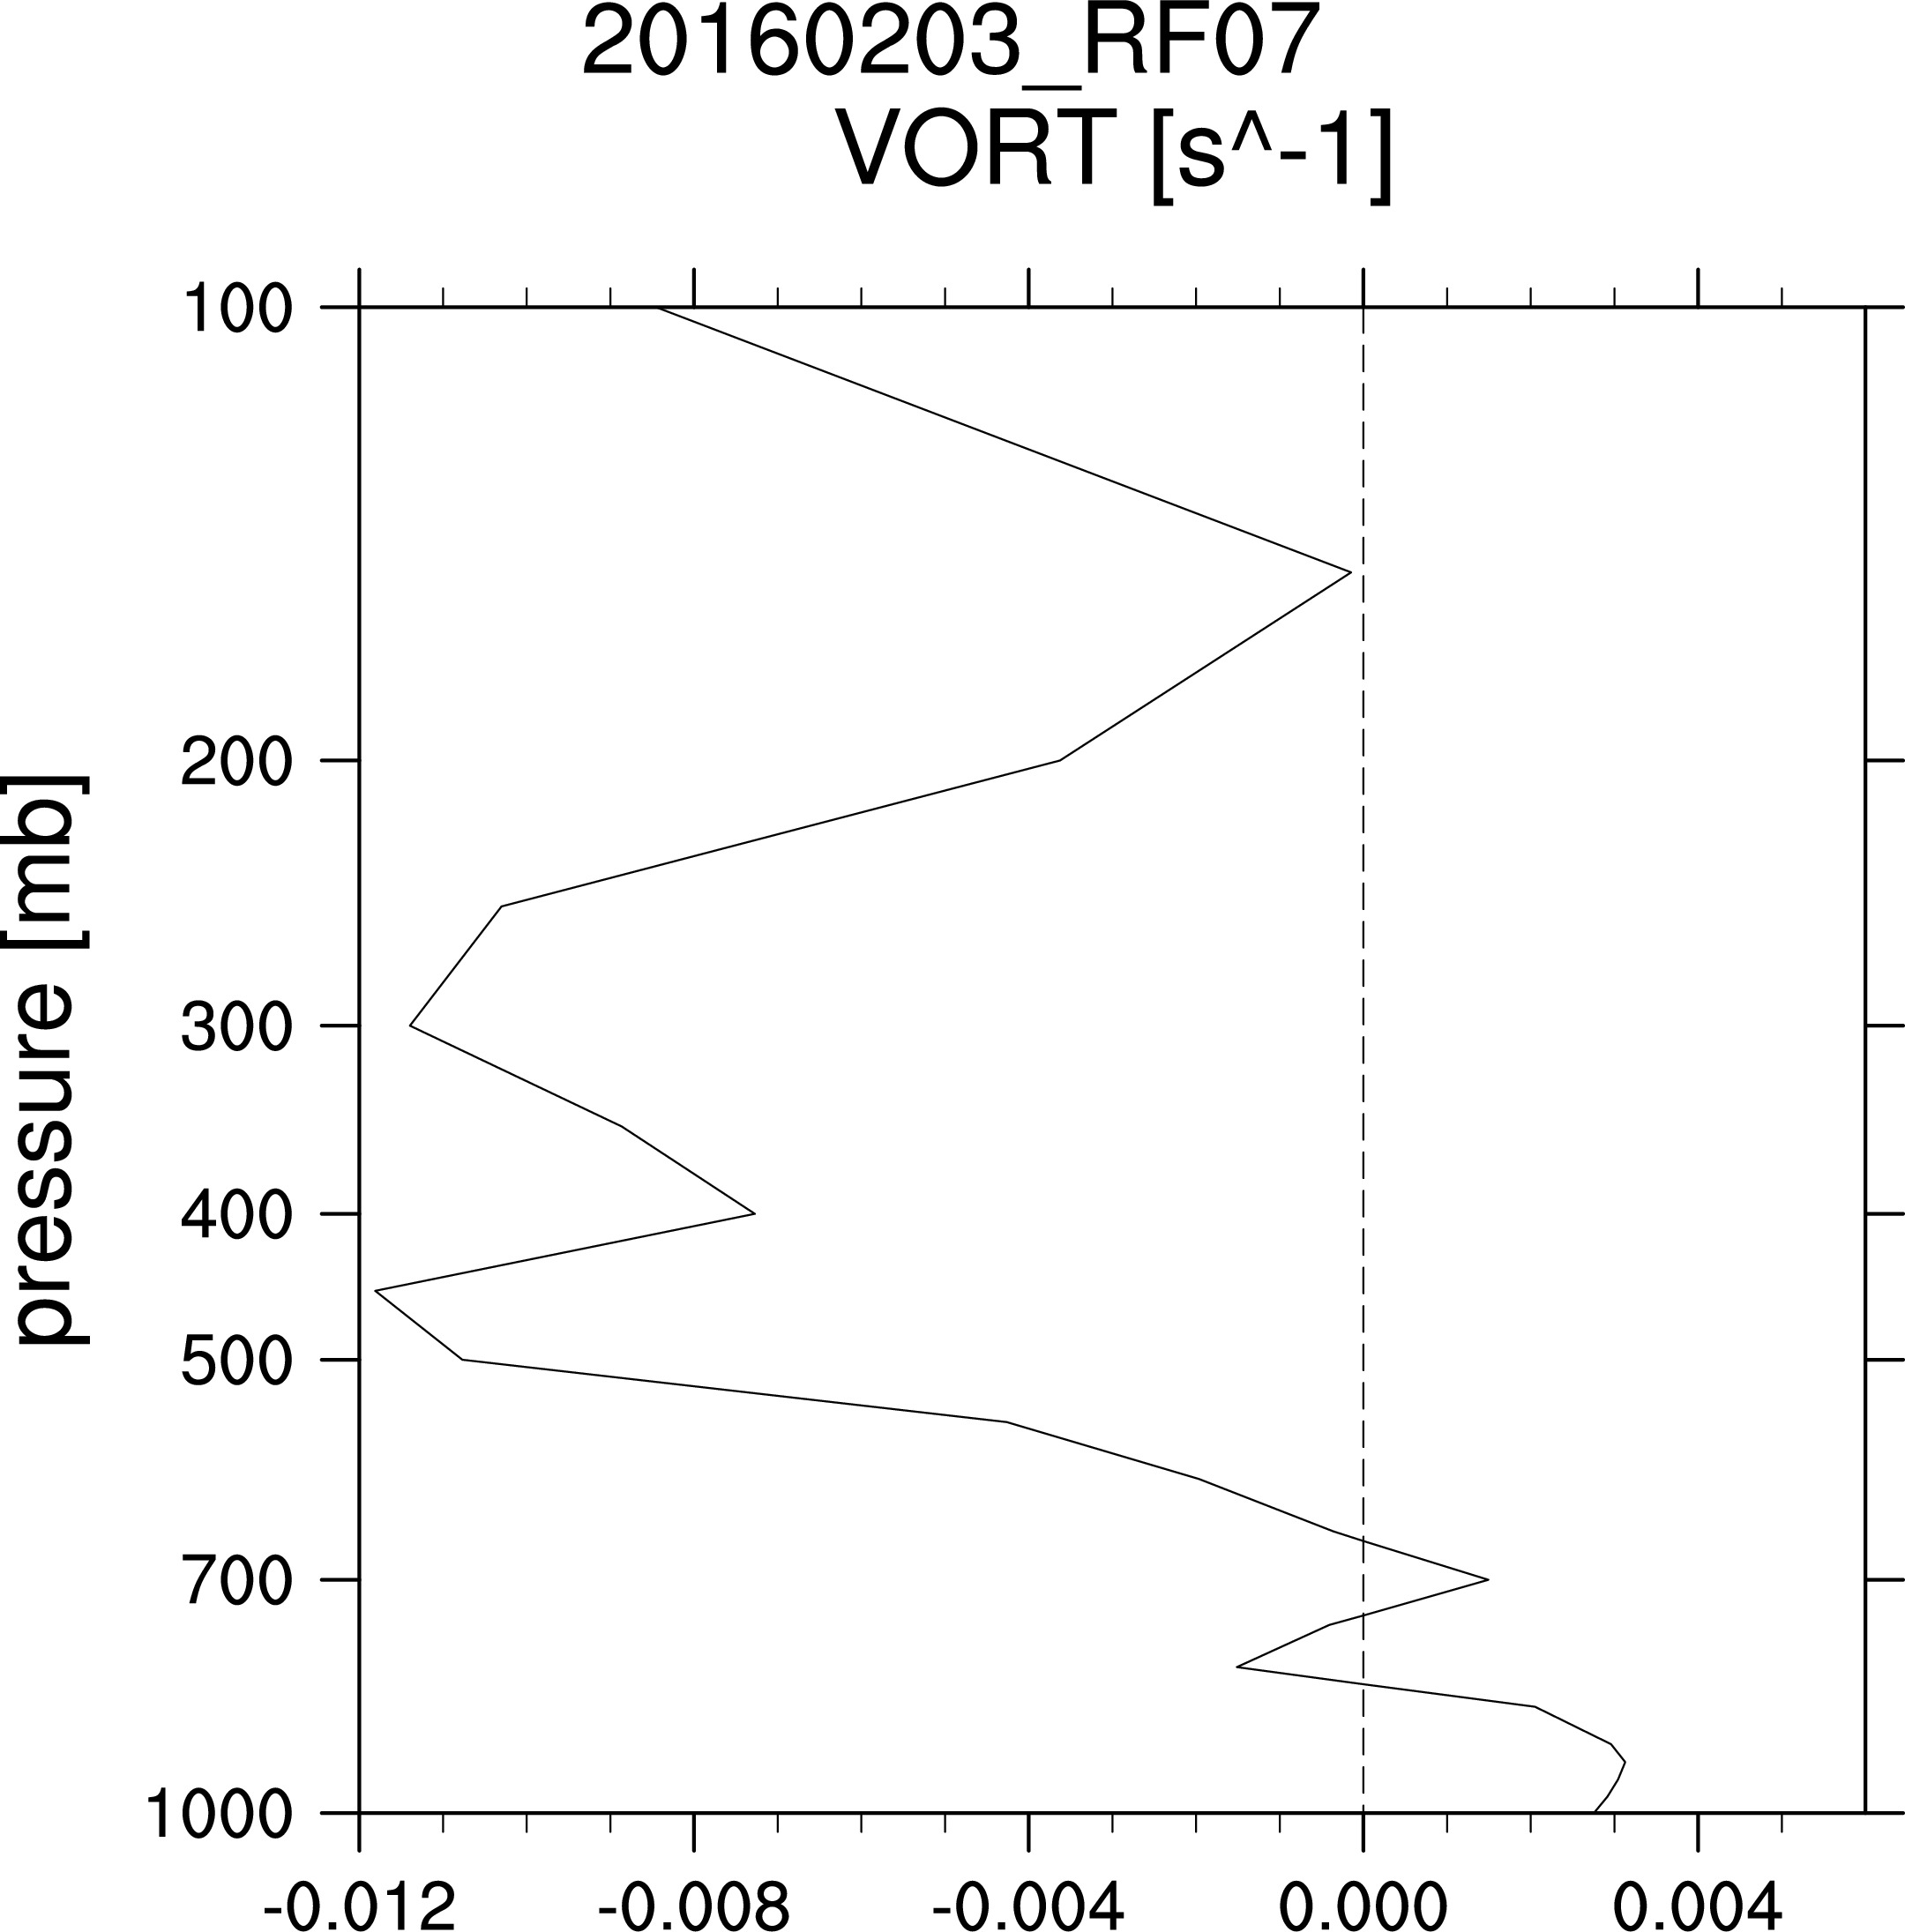
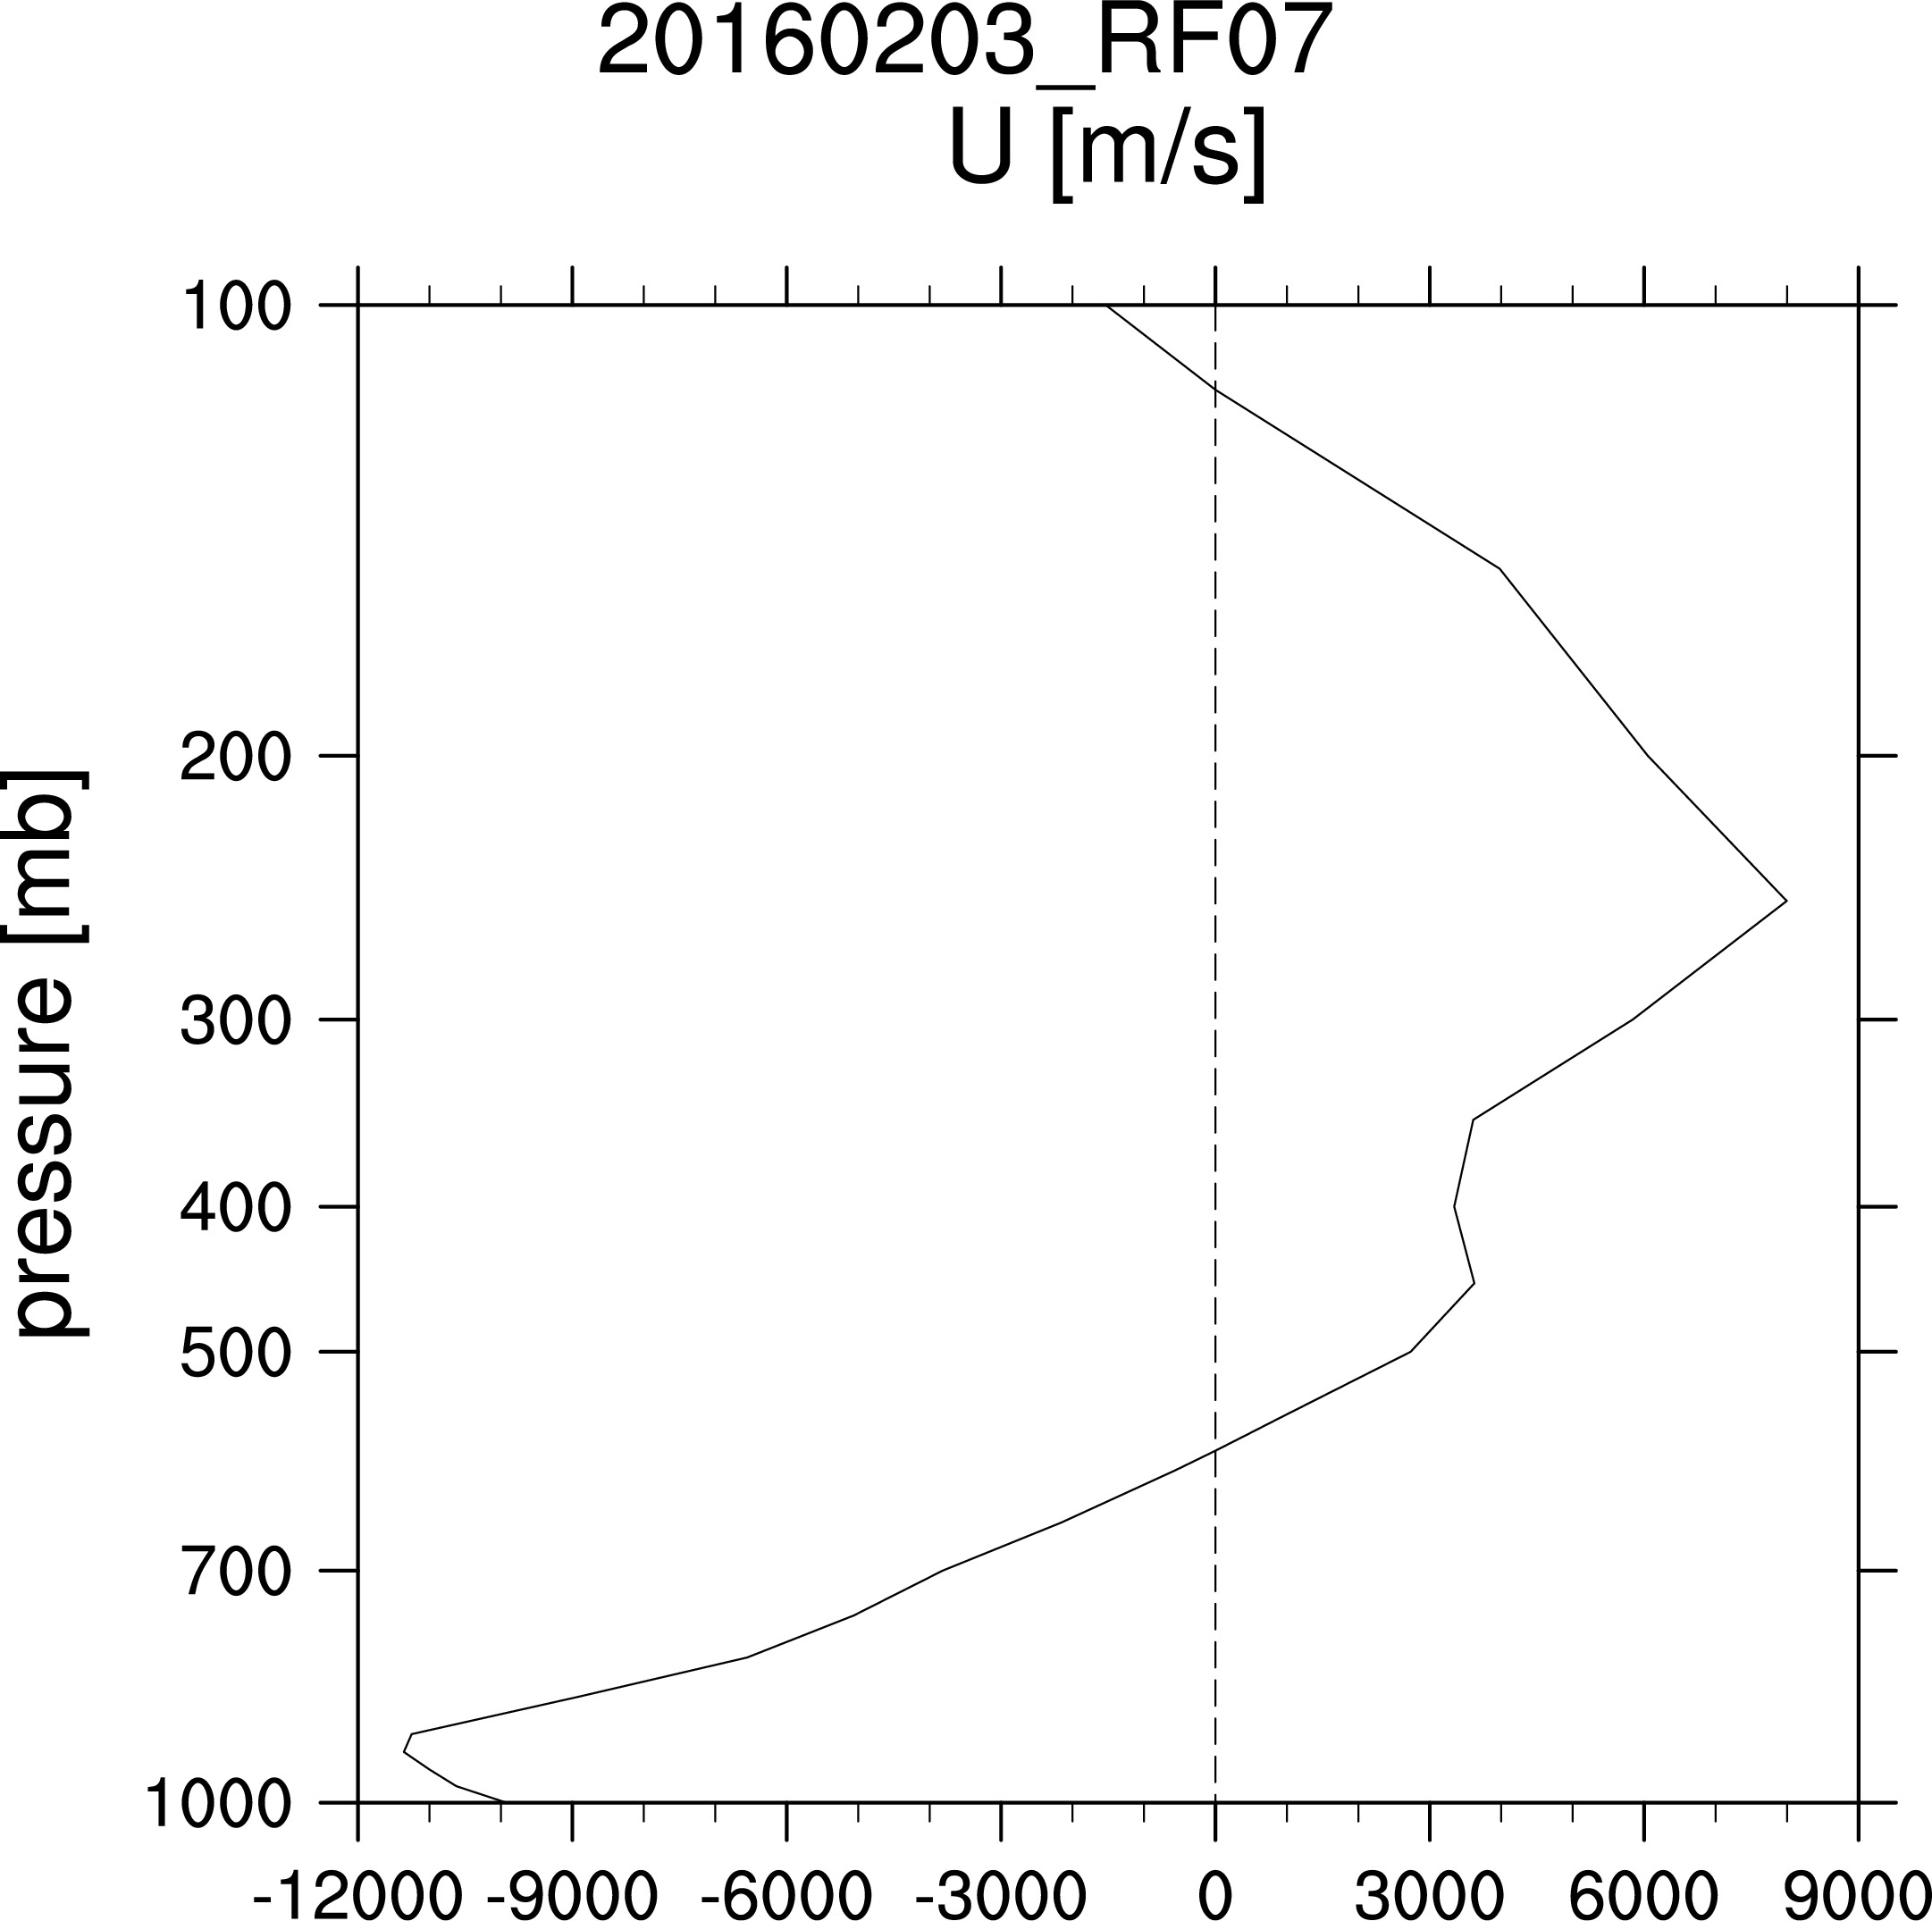
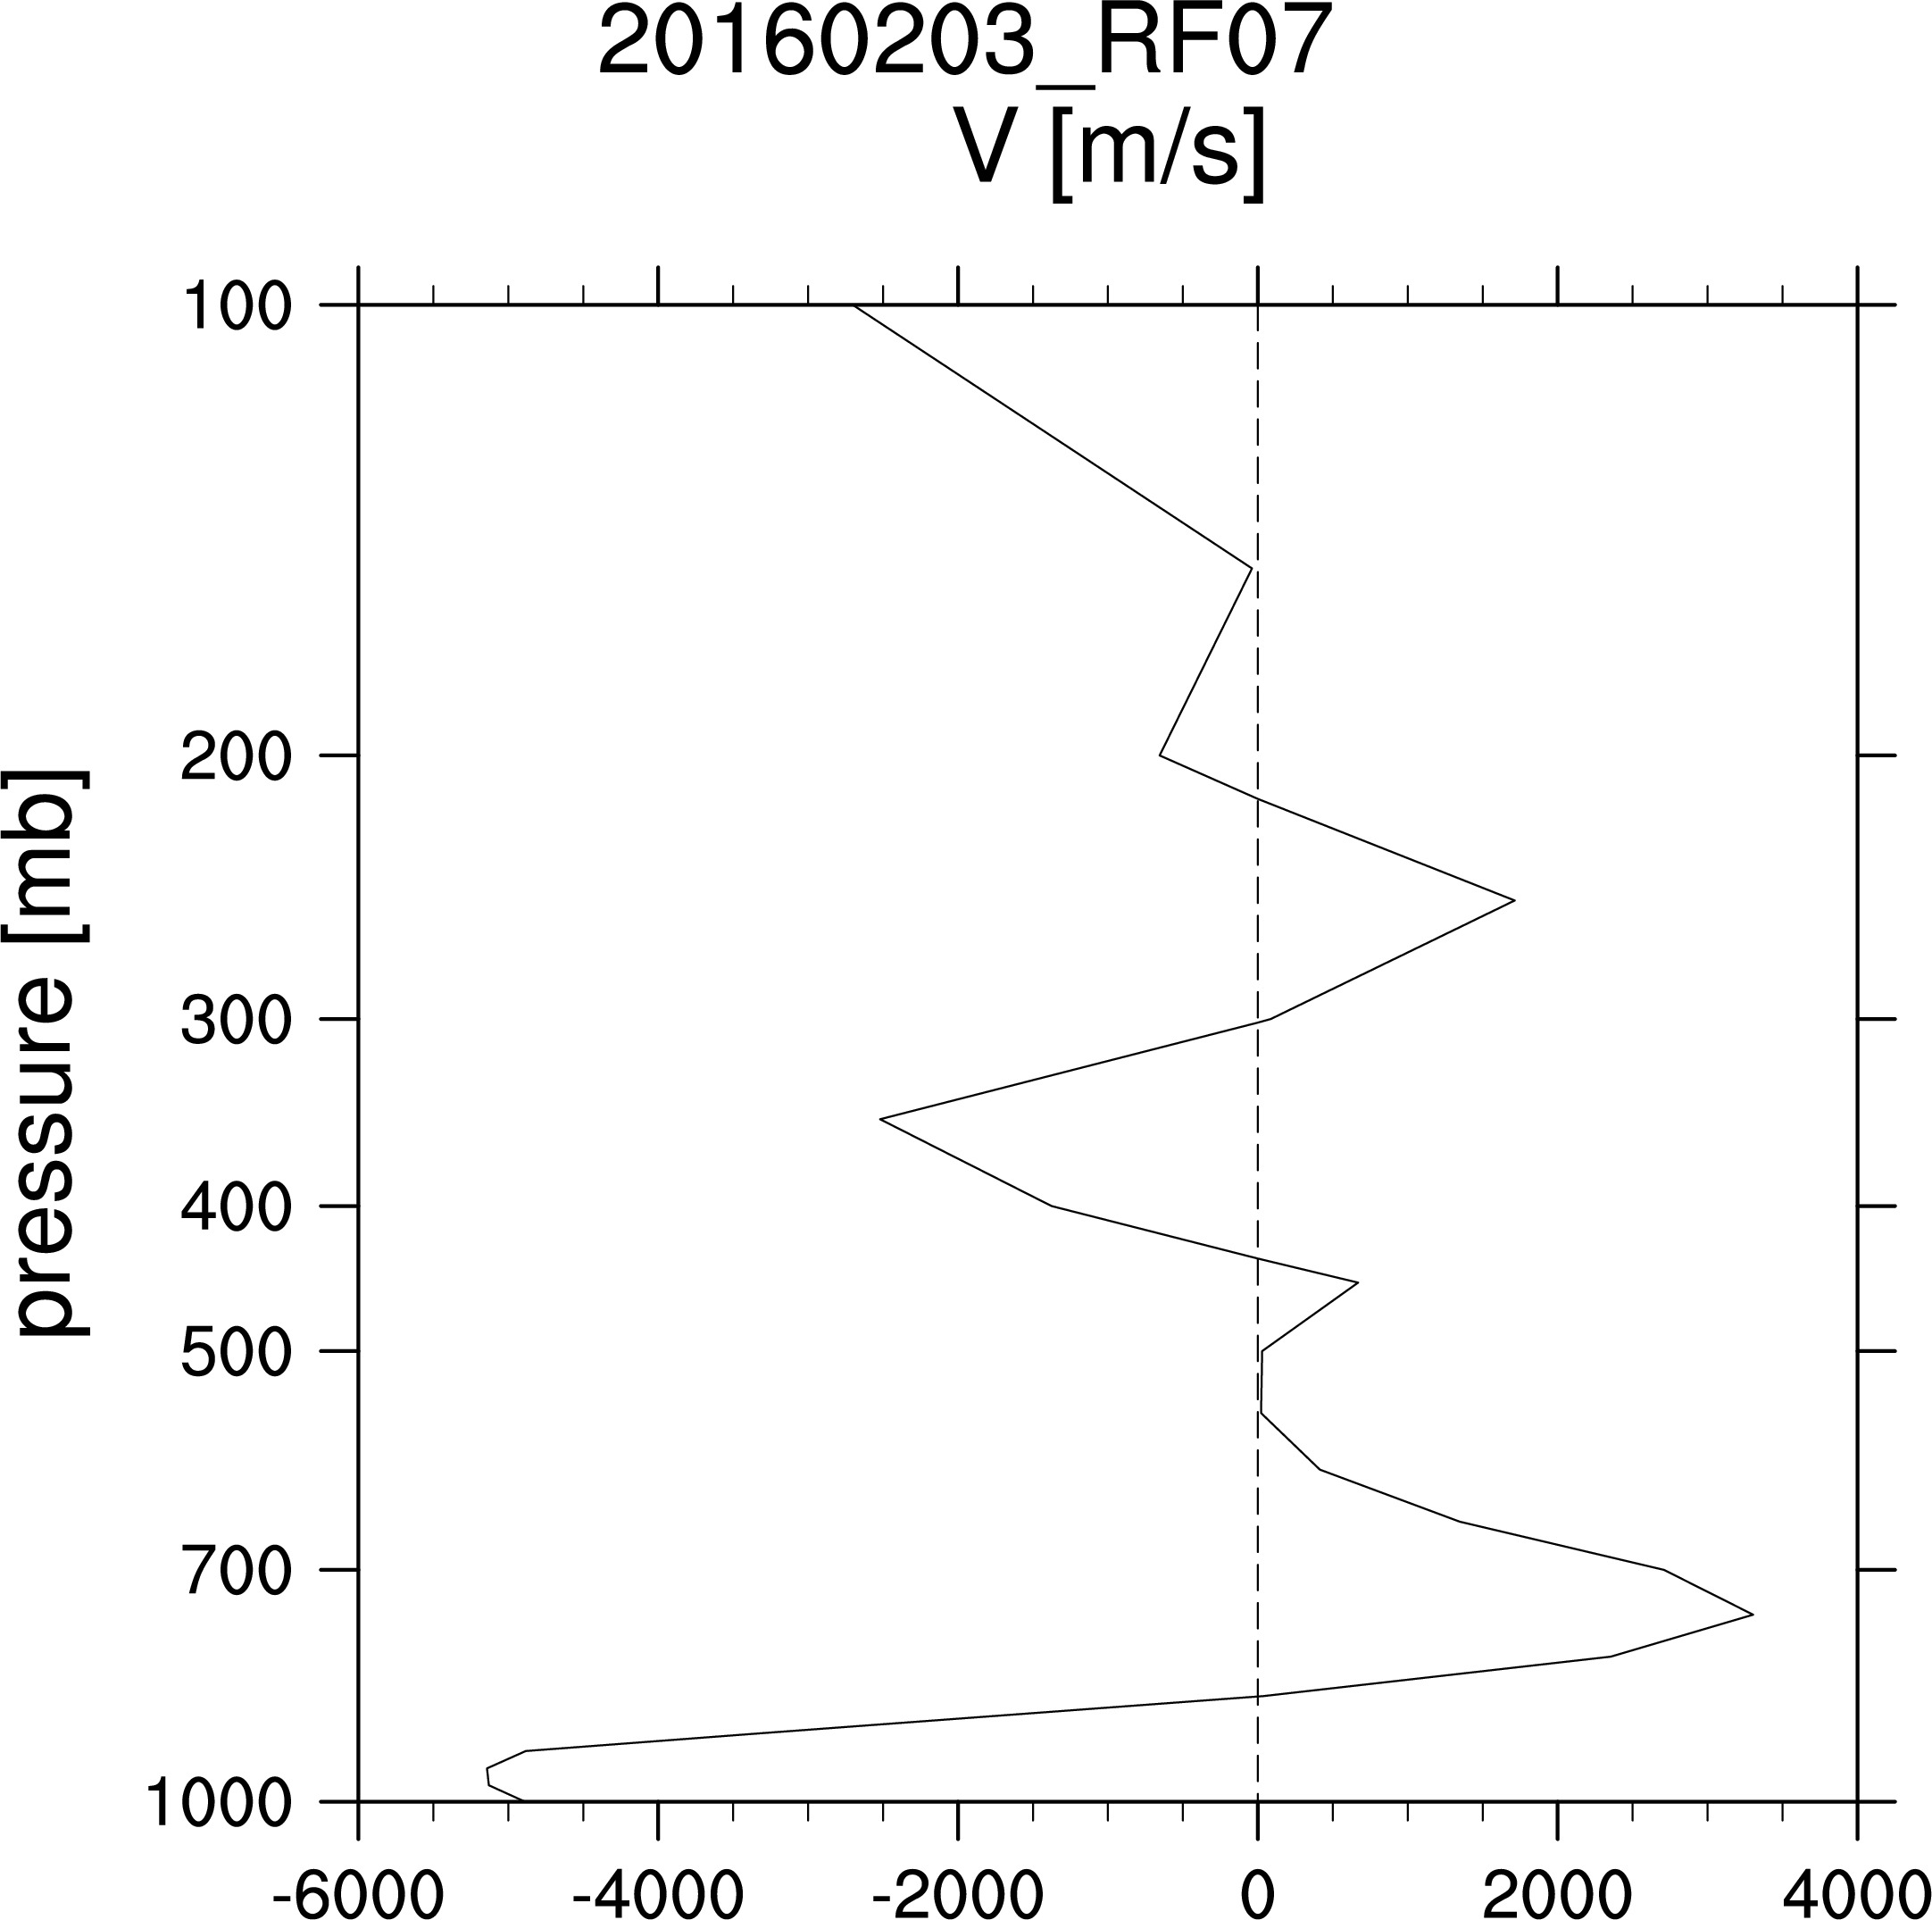
Flight 7: 20160203_RF07profile.avg.20160203_RF07.xlsx area ~ 1052.


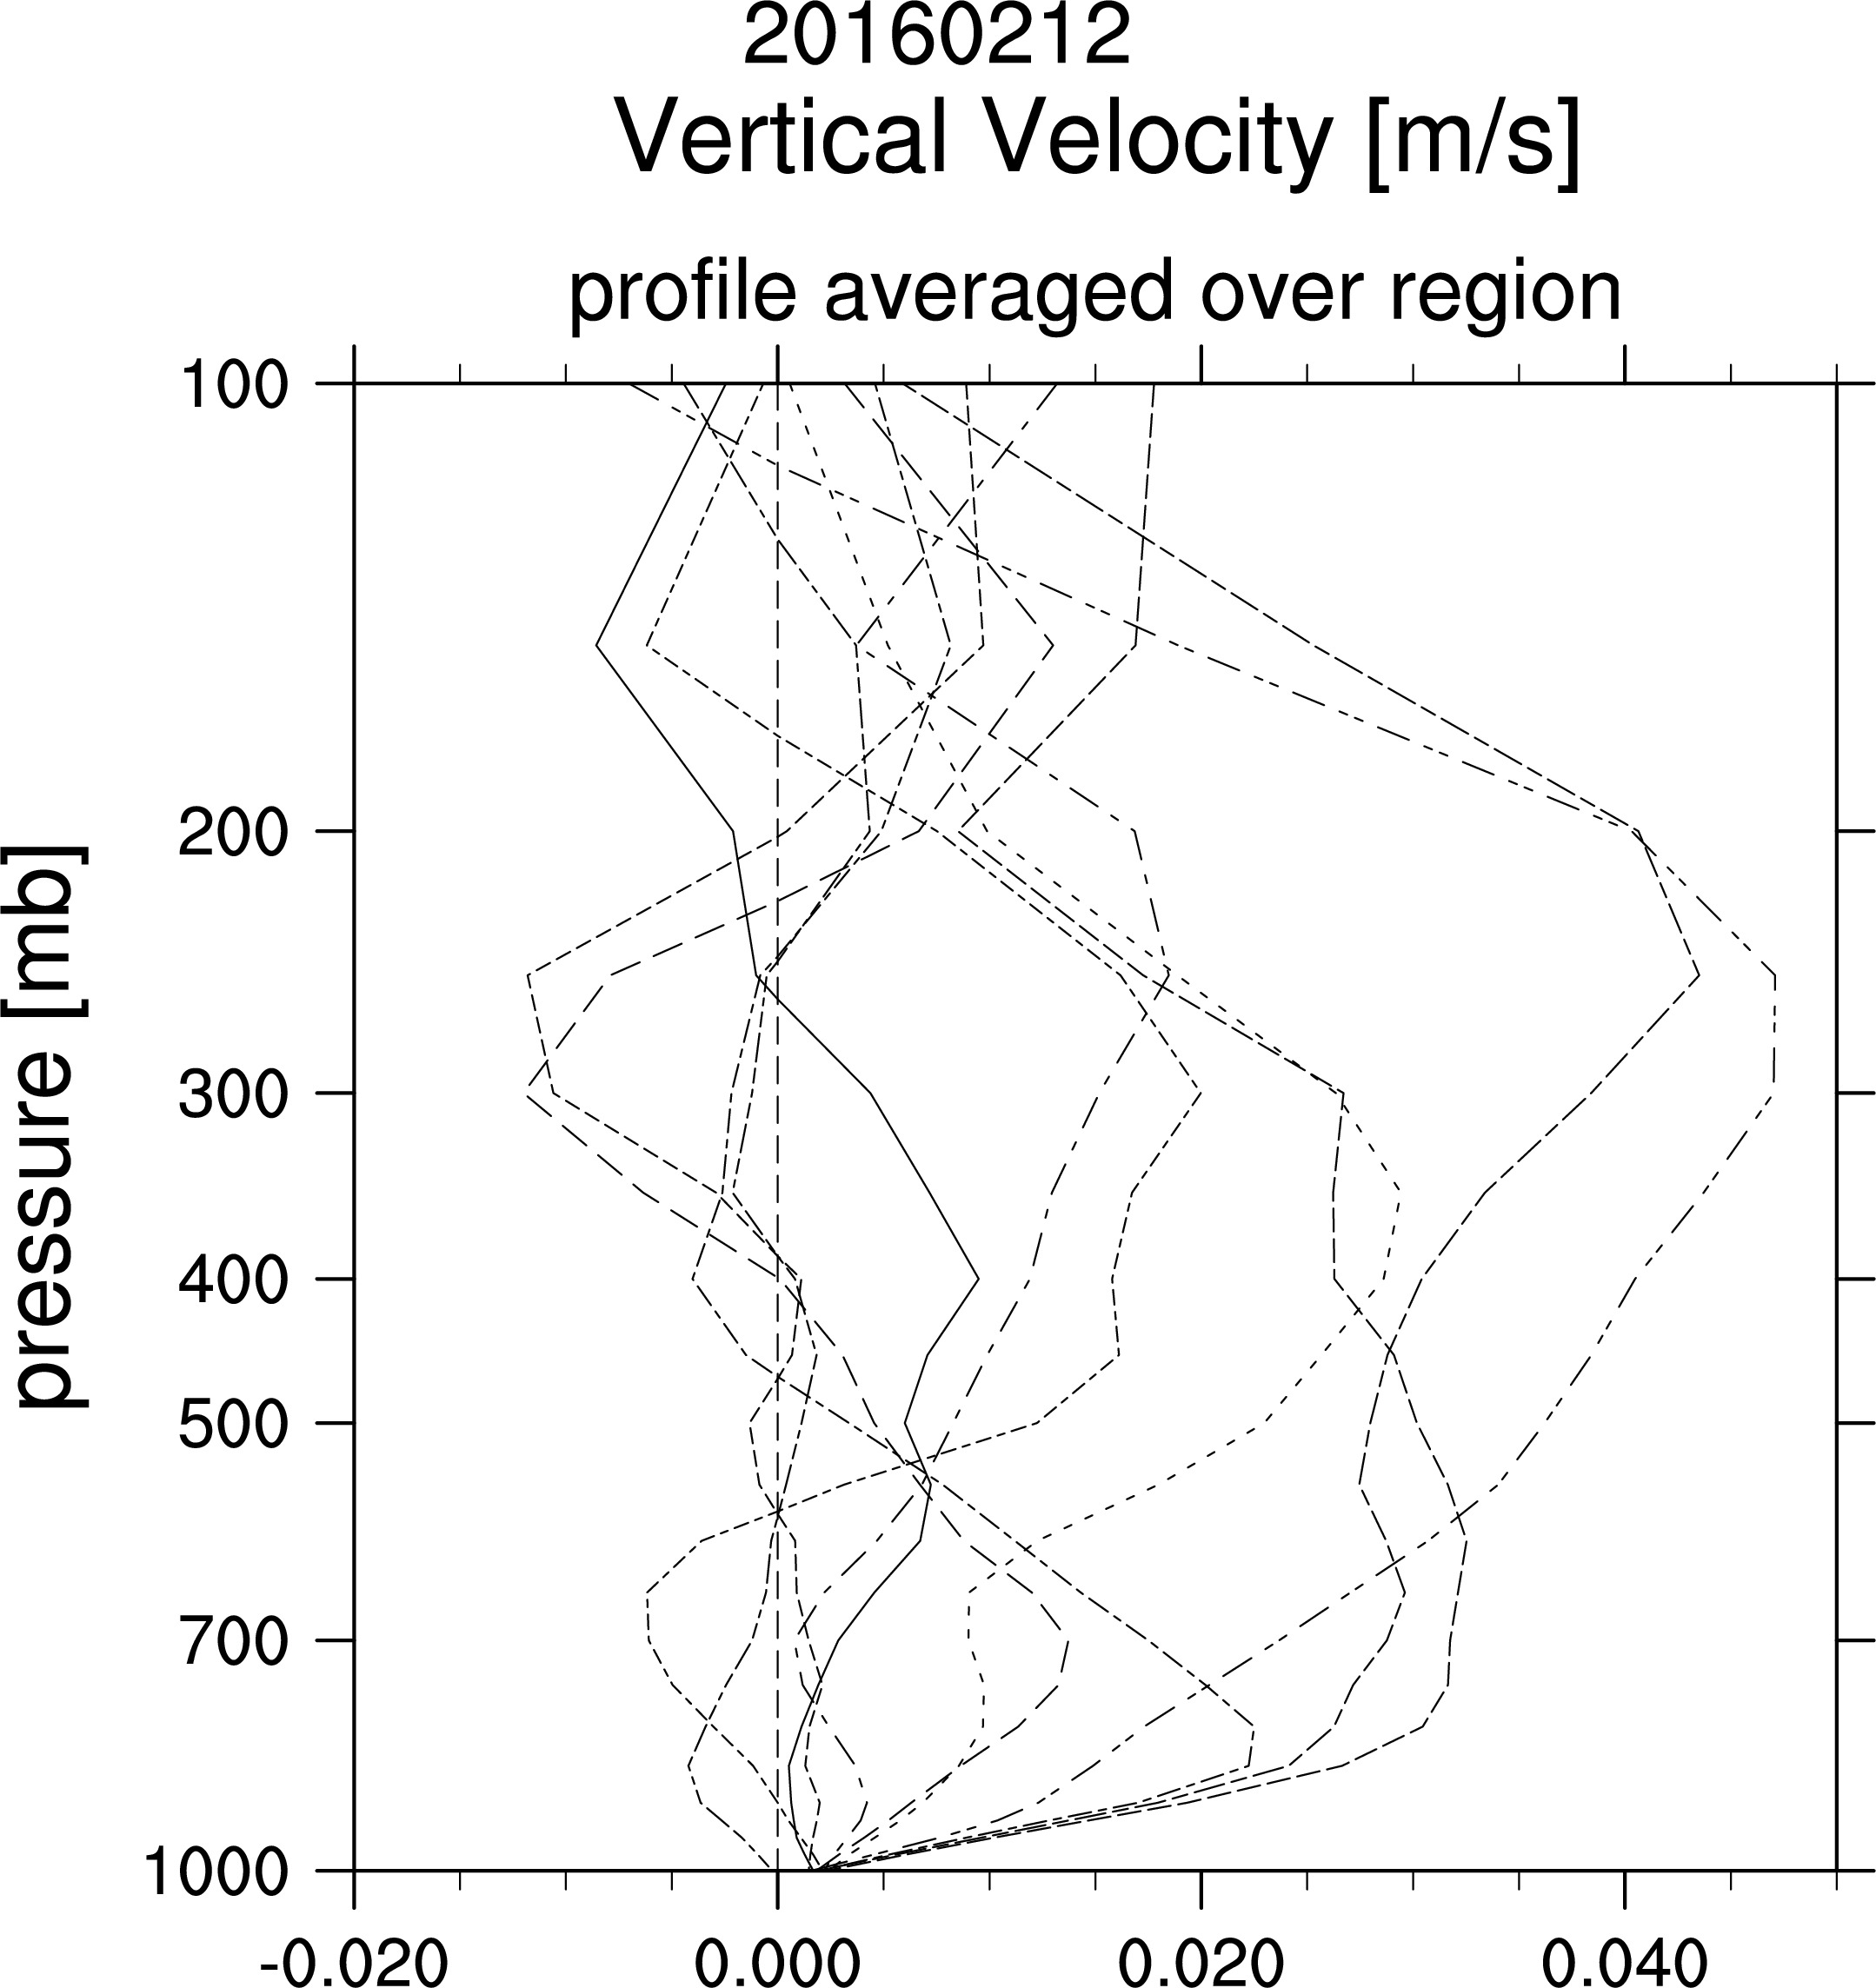
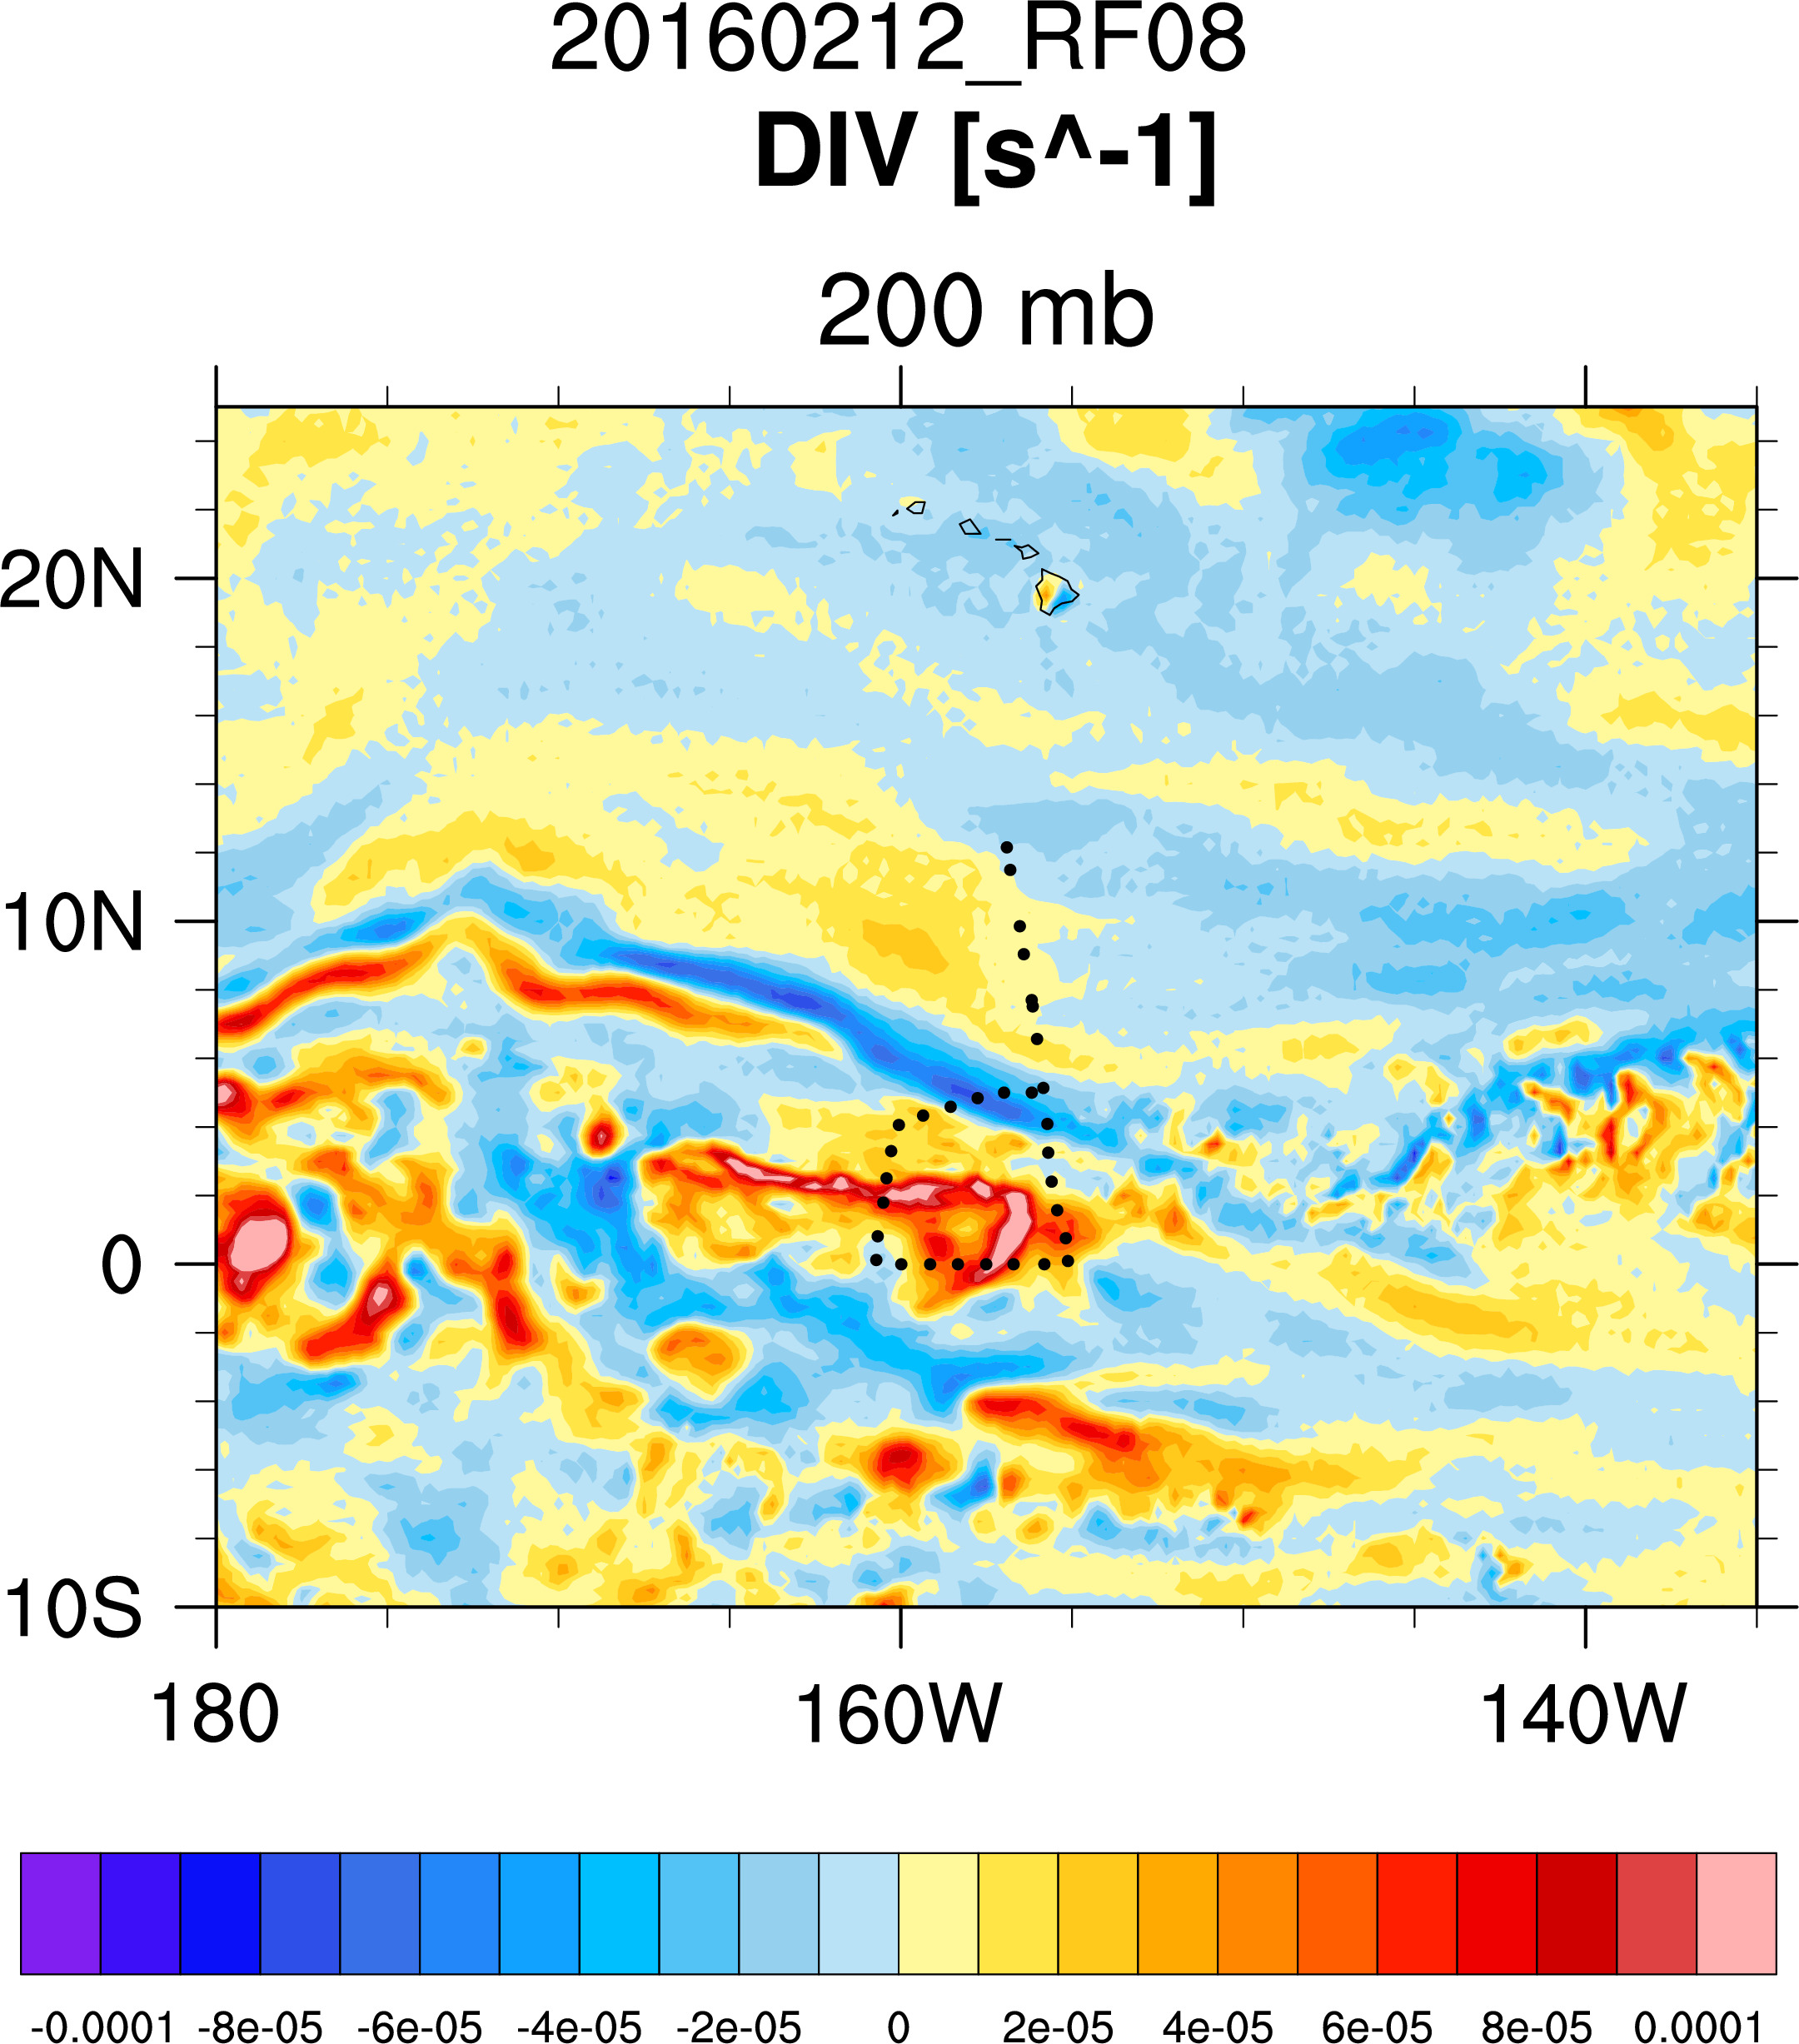
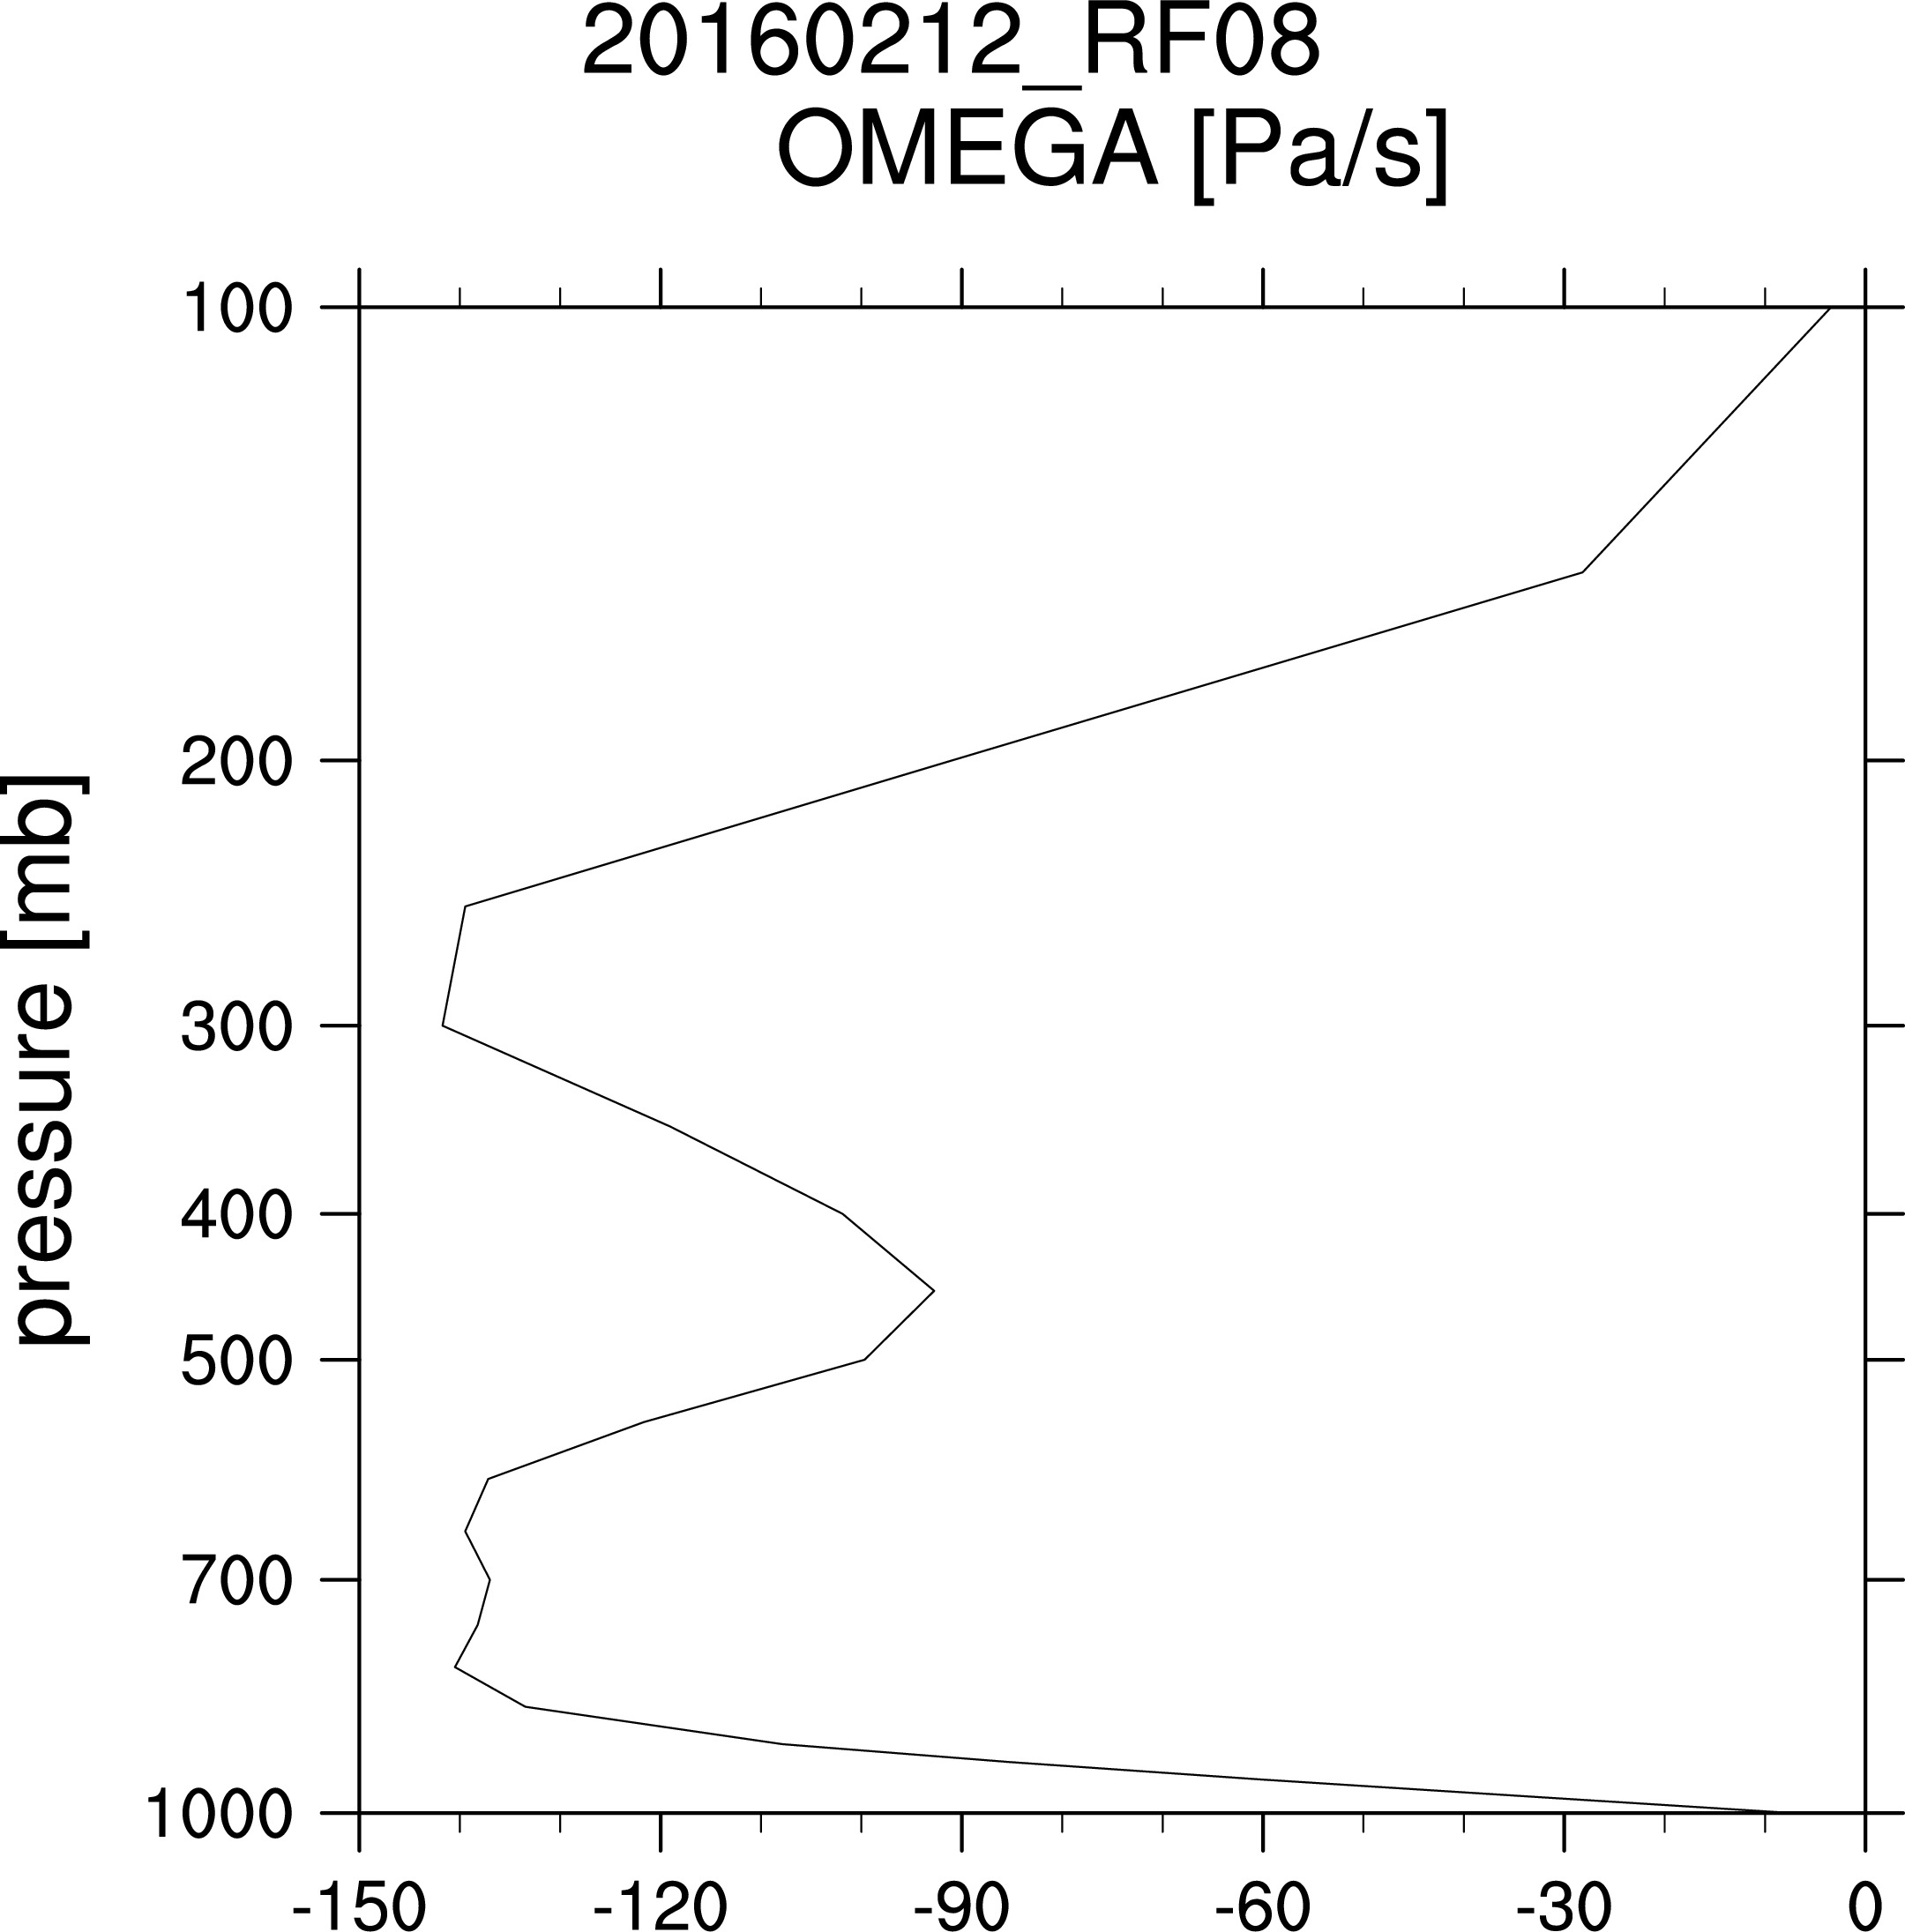
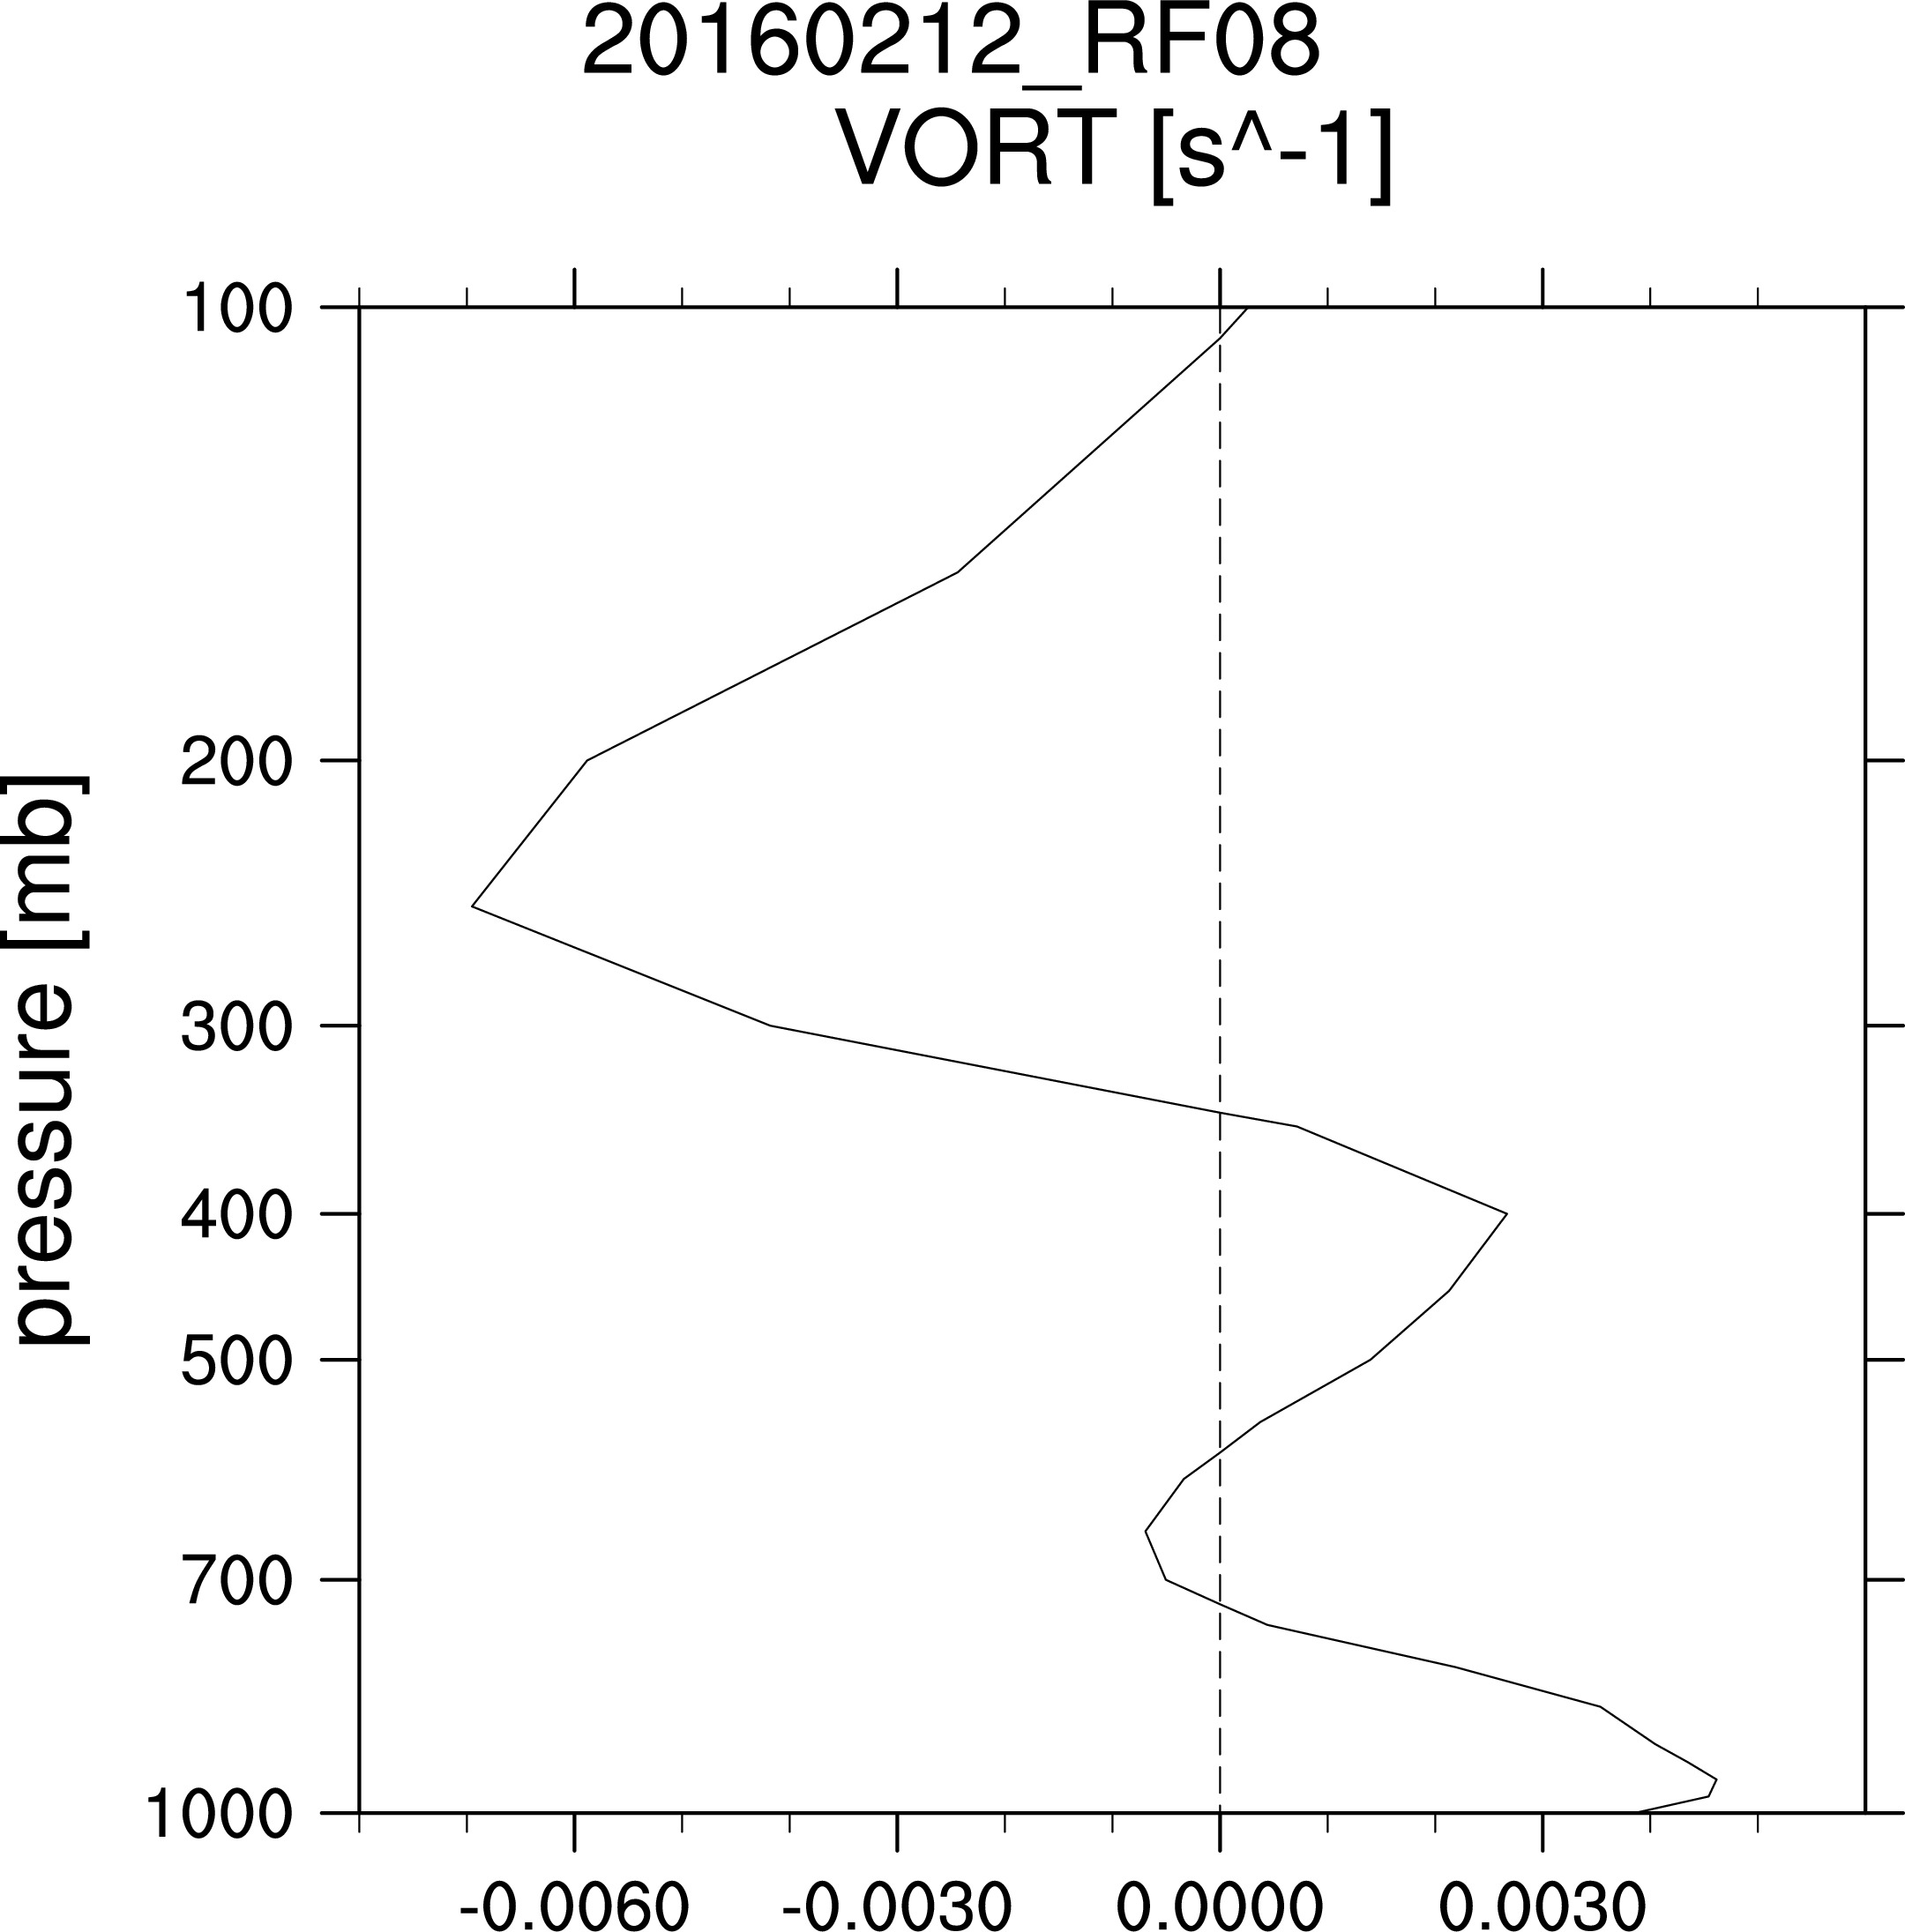
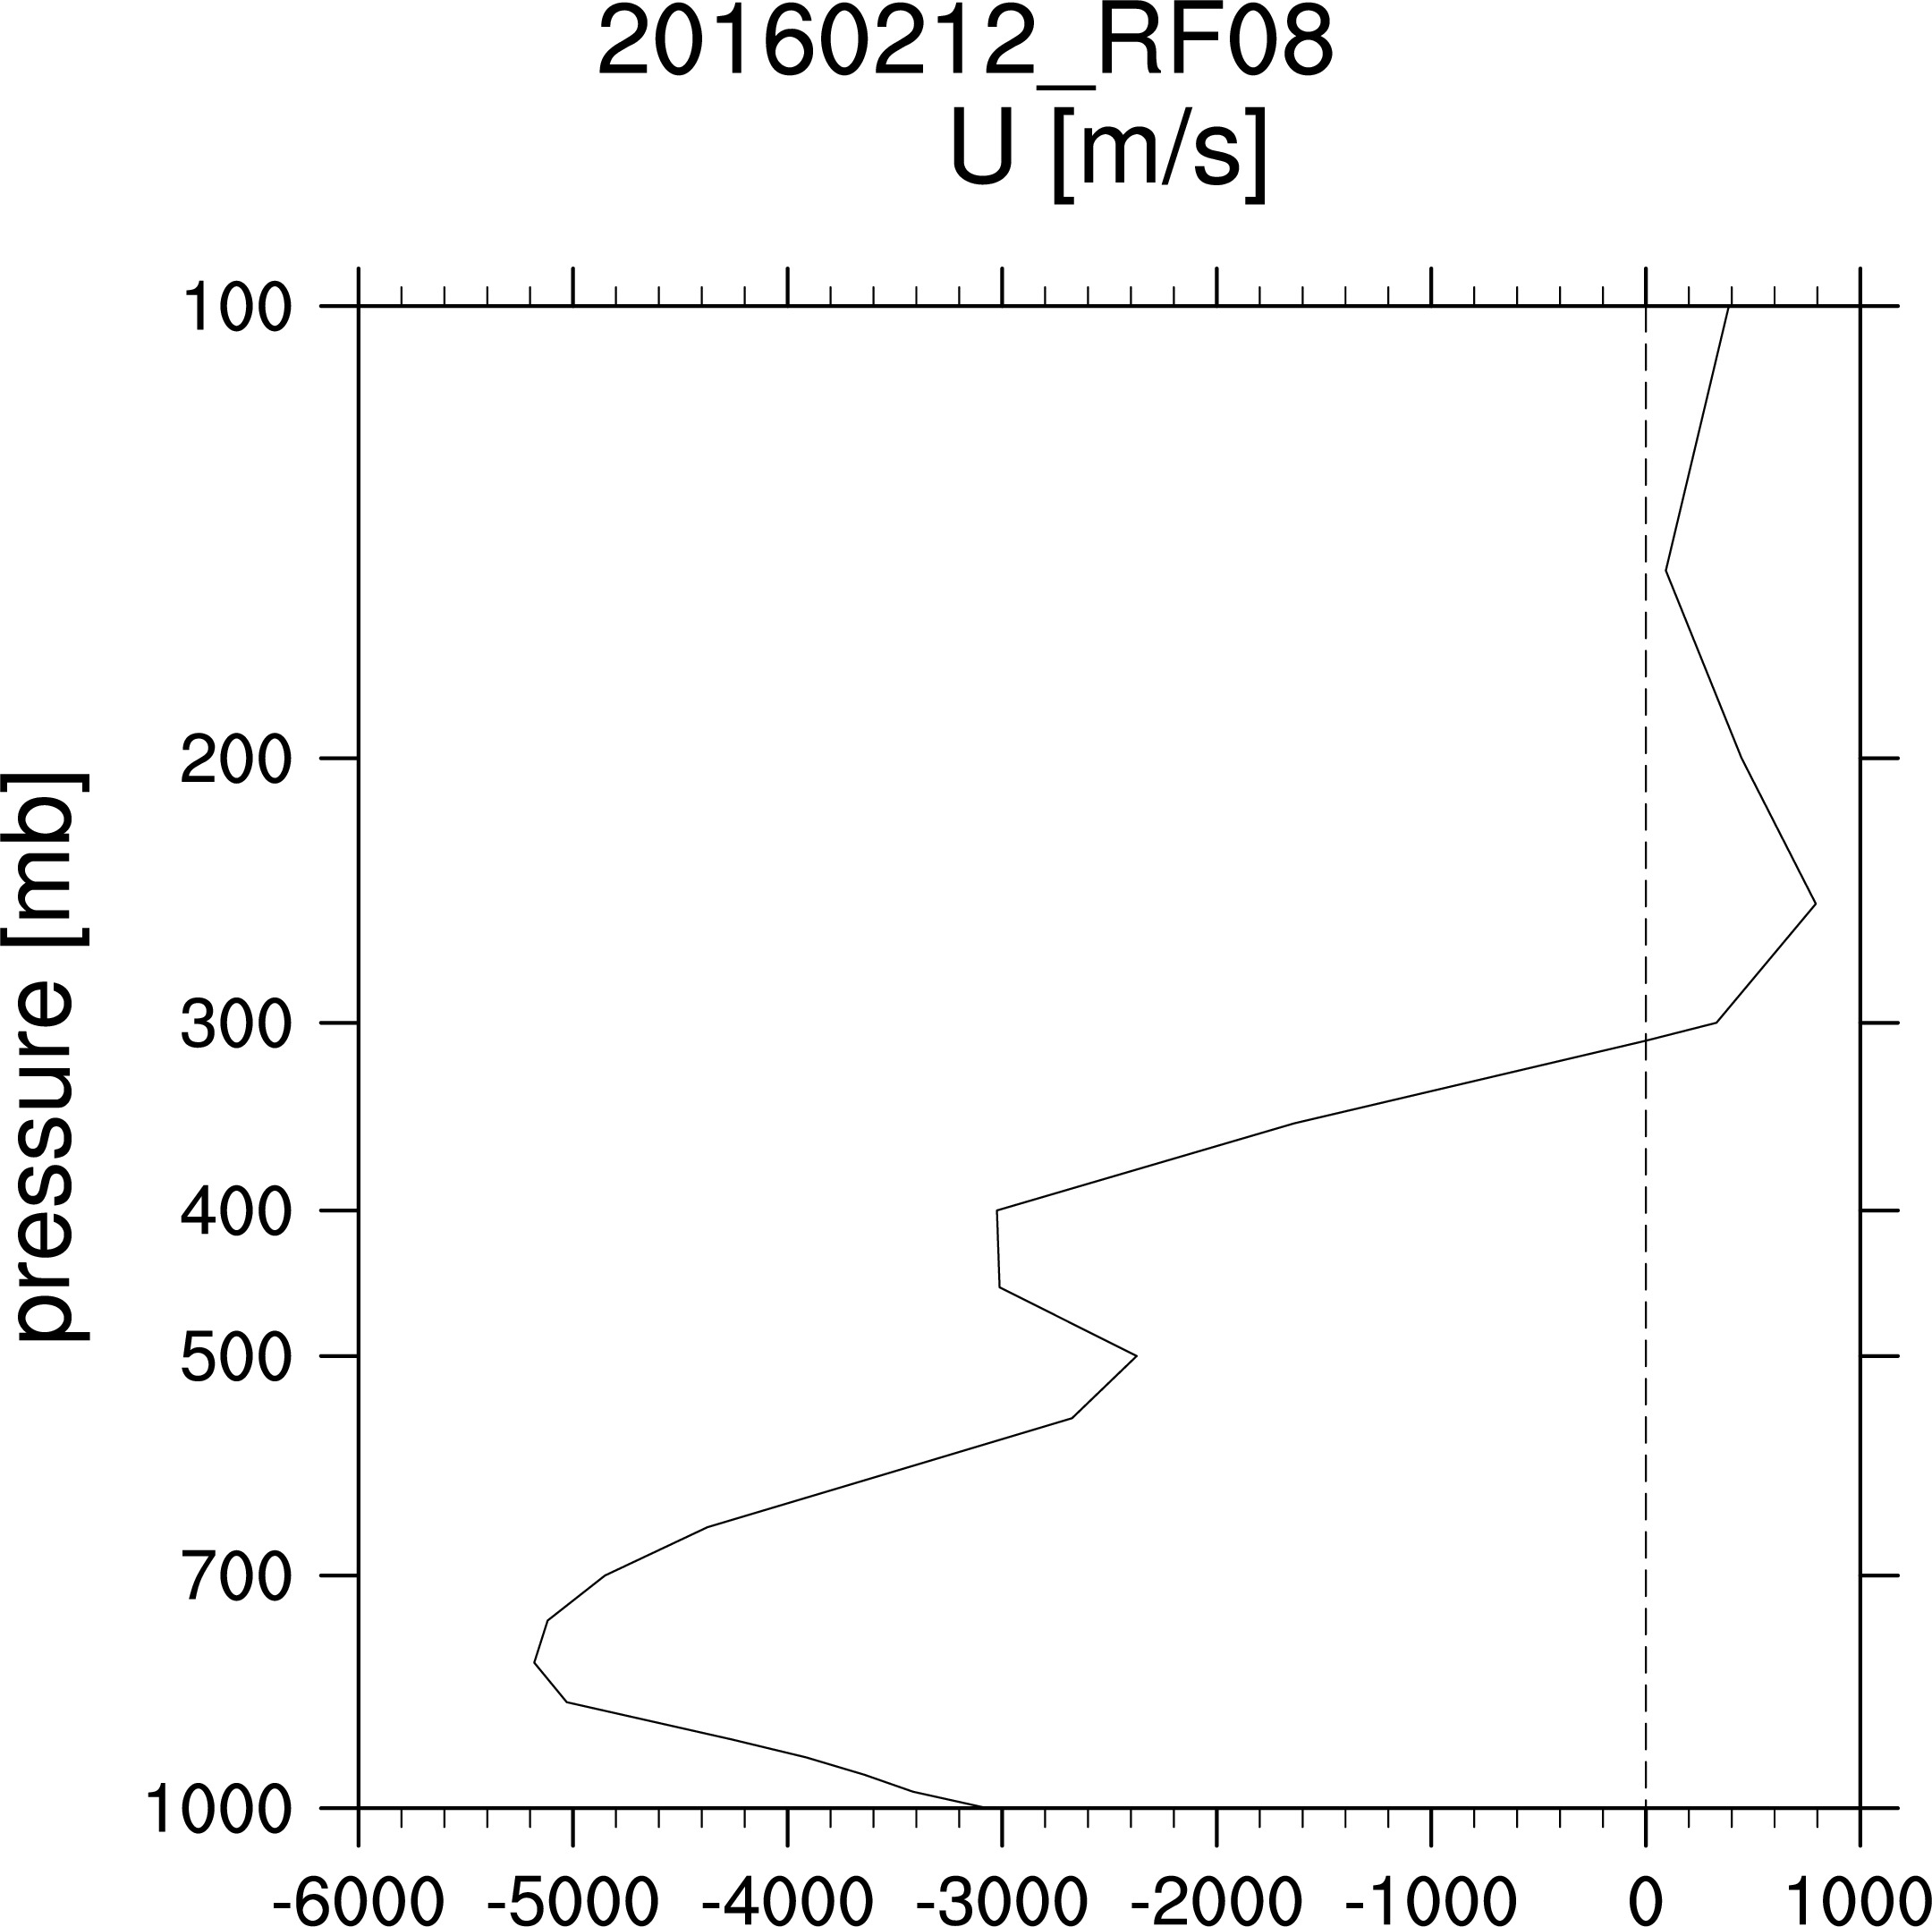
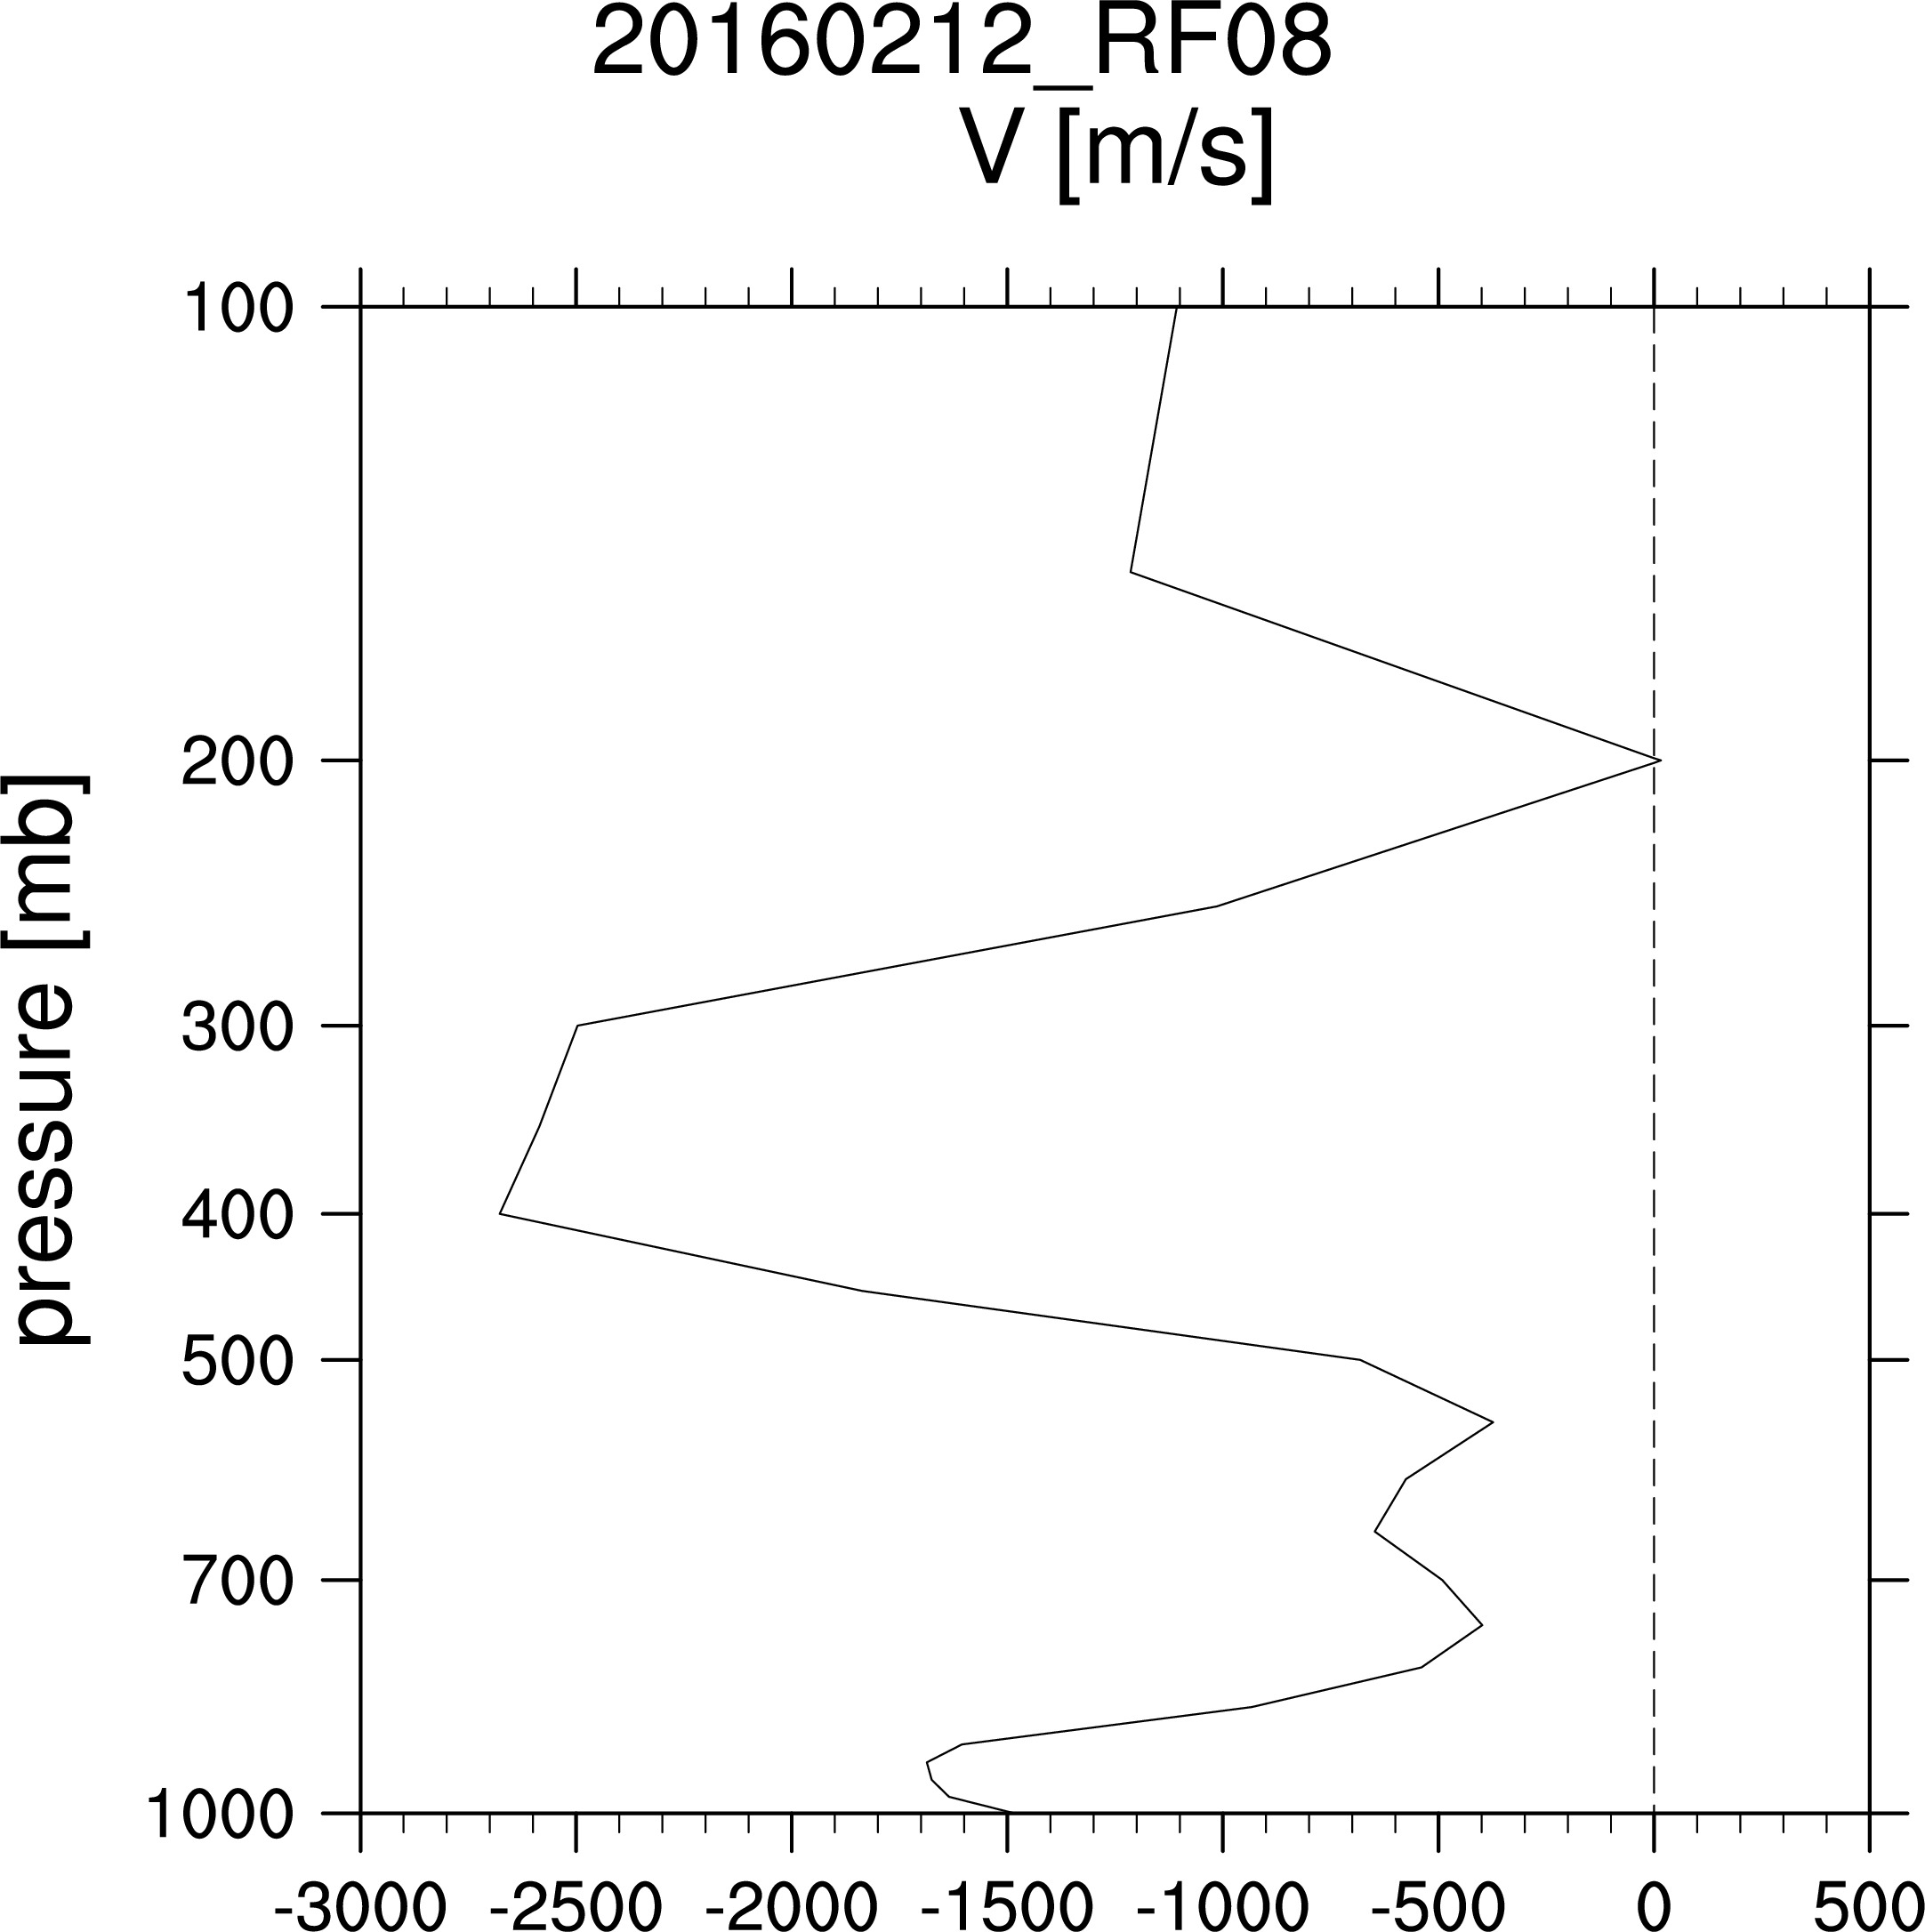
Flight 8: 20160212_RF08profile.avg.20160212_RF08.xlsx area ~ 376.


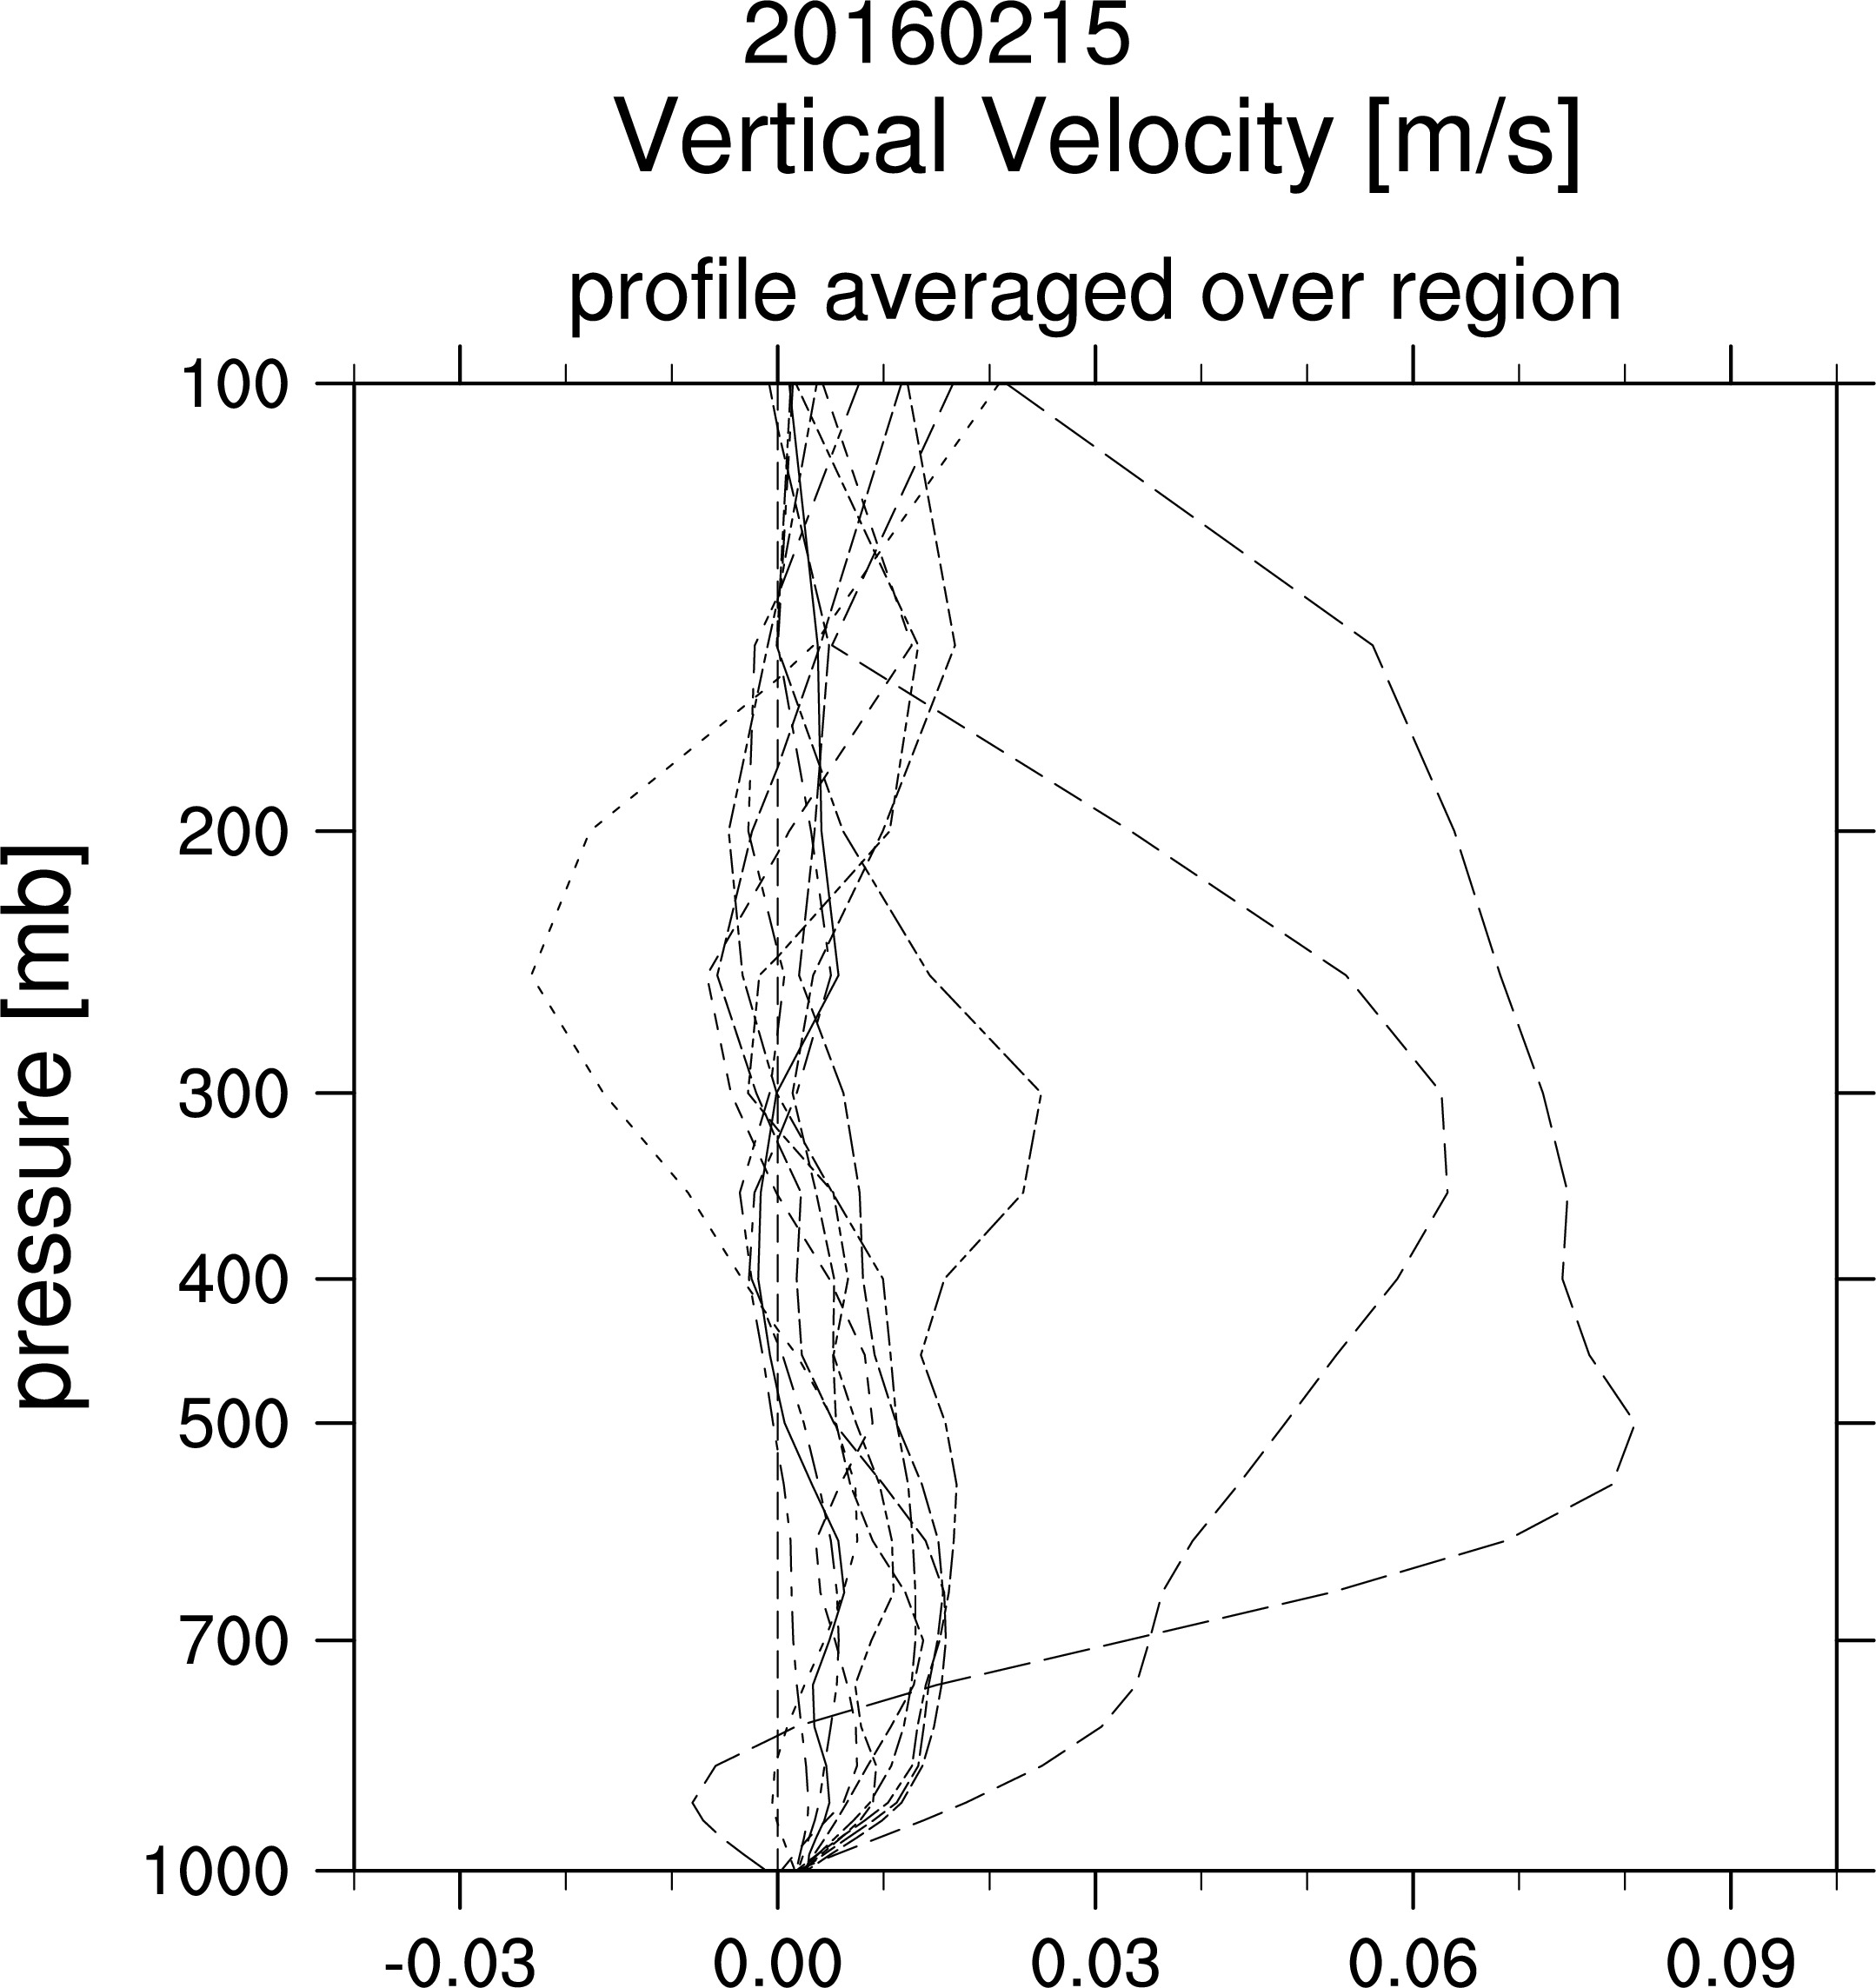
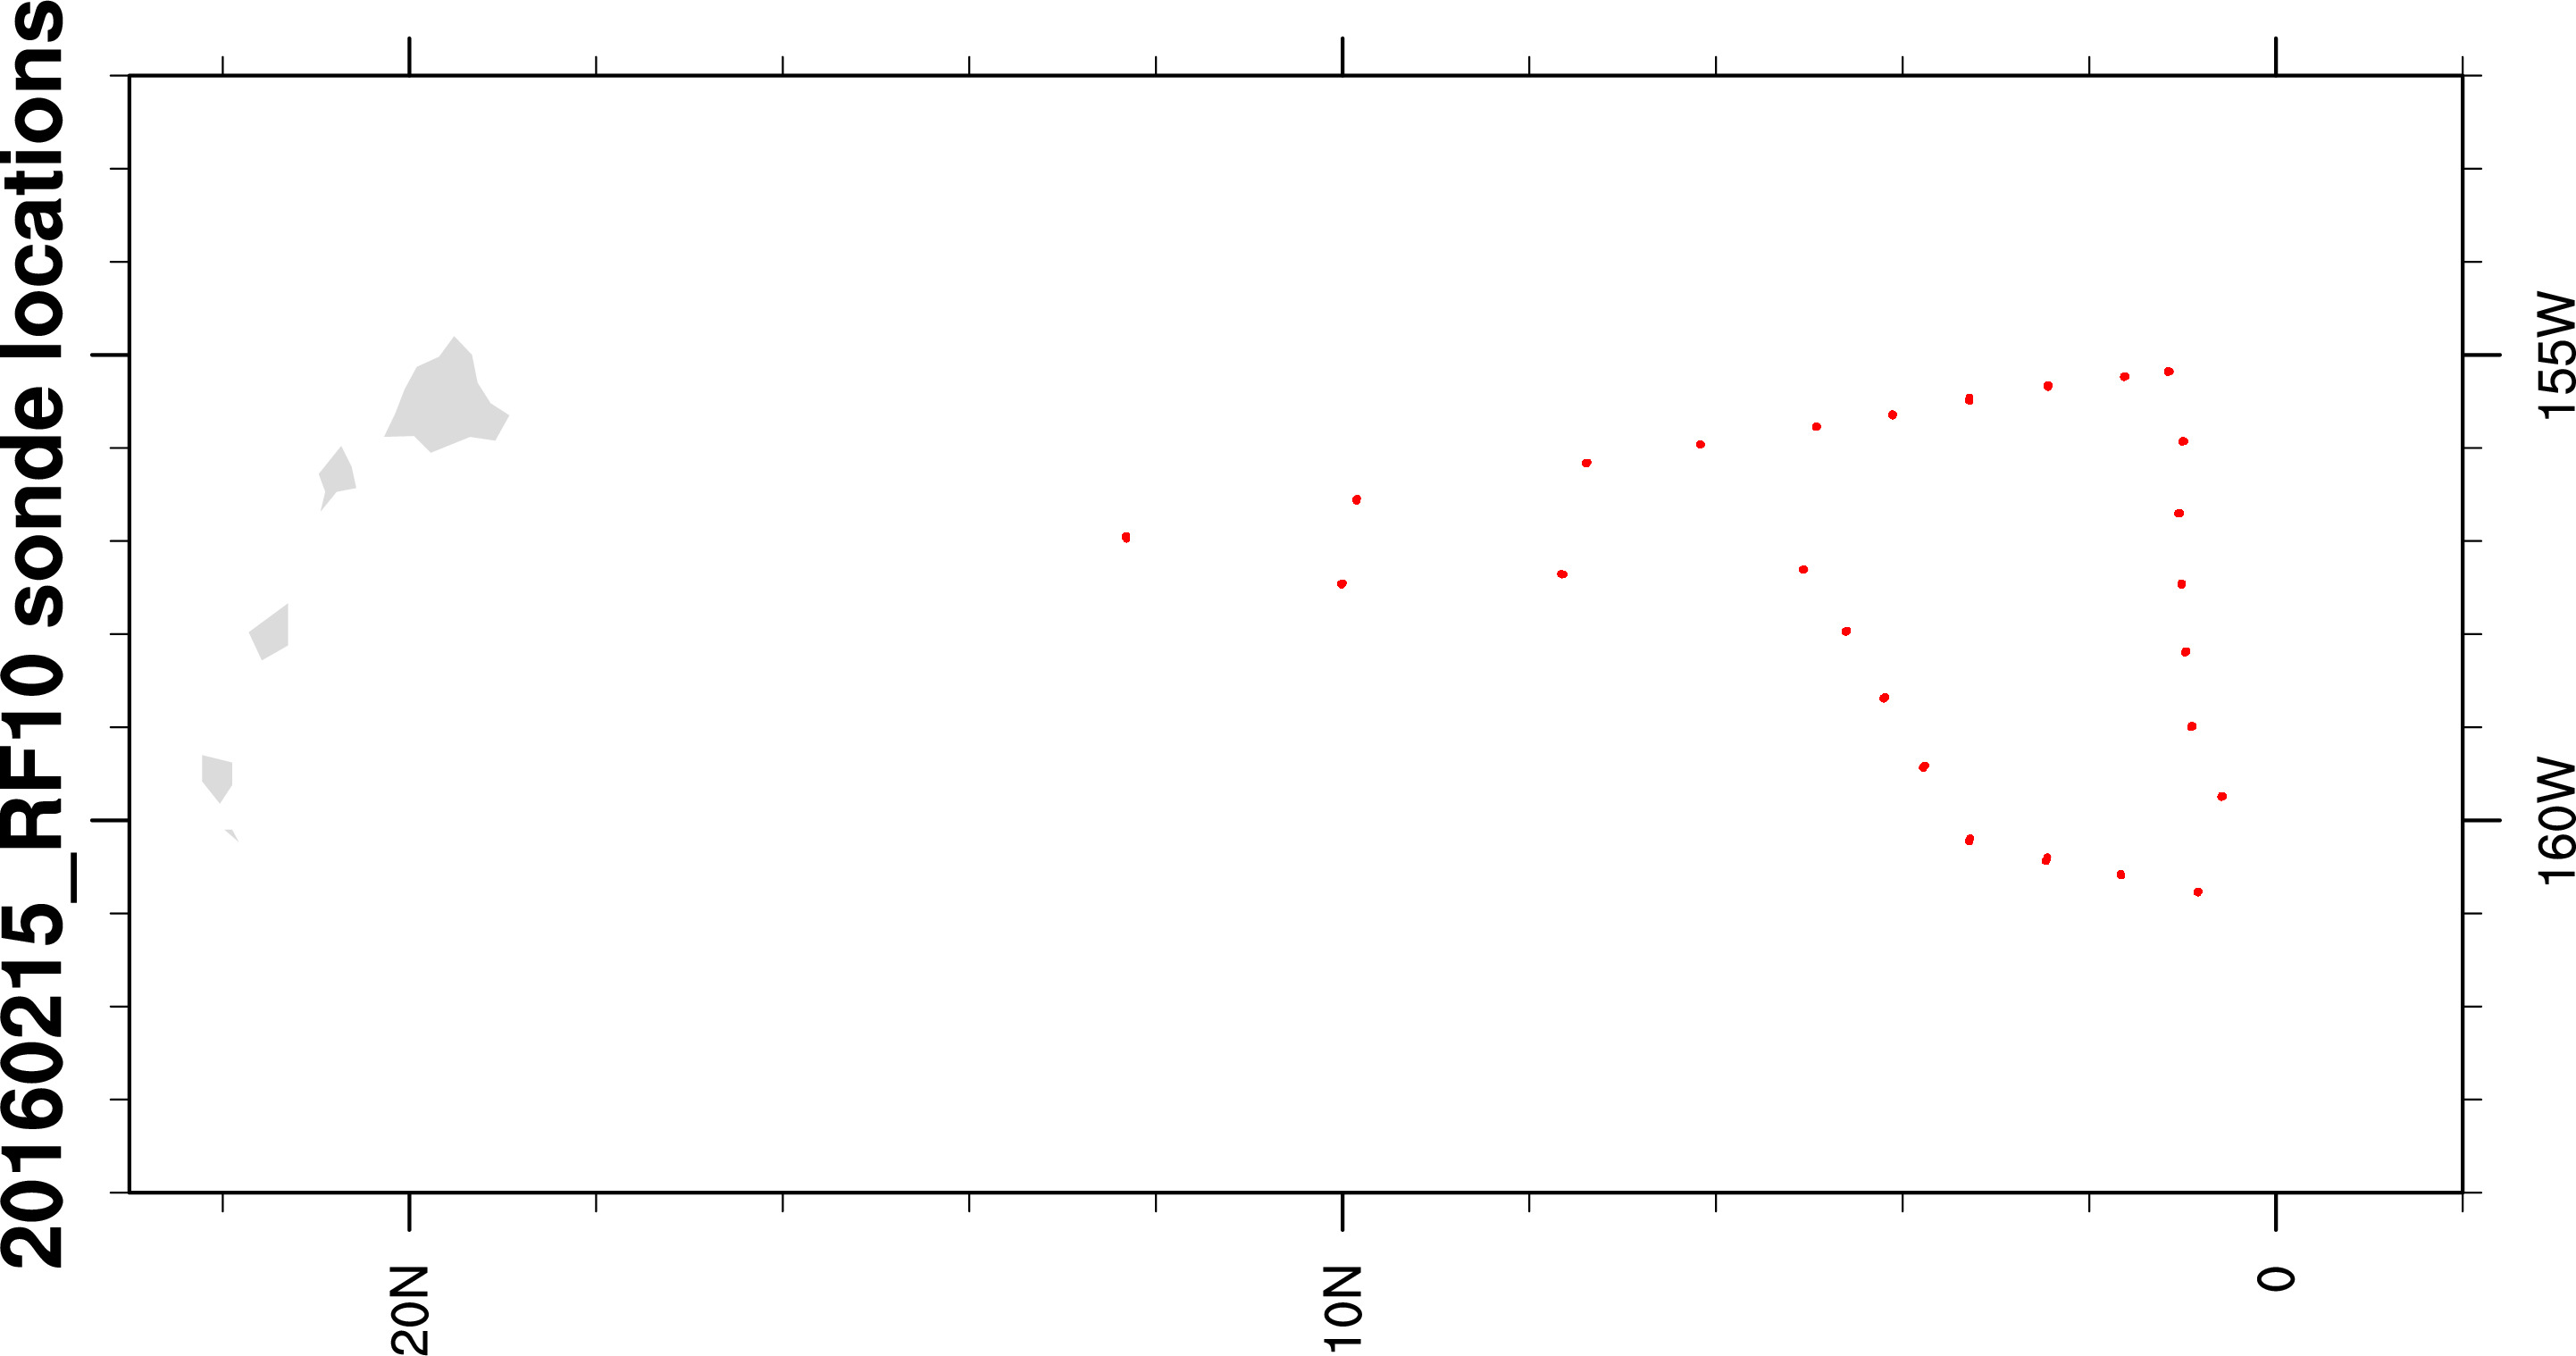
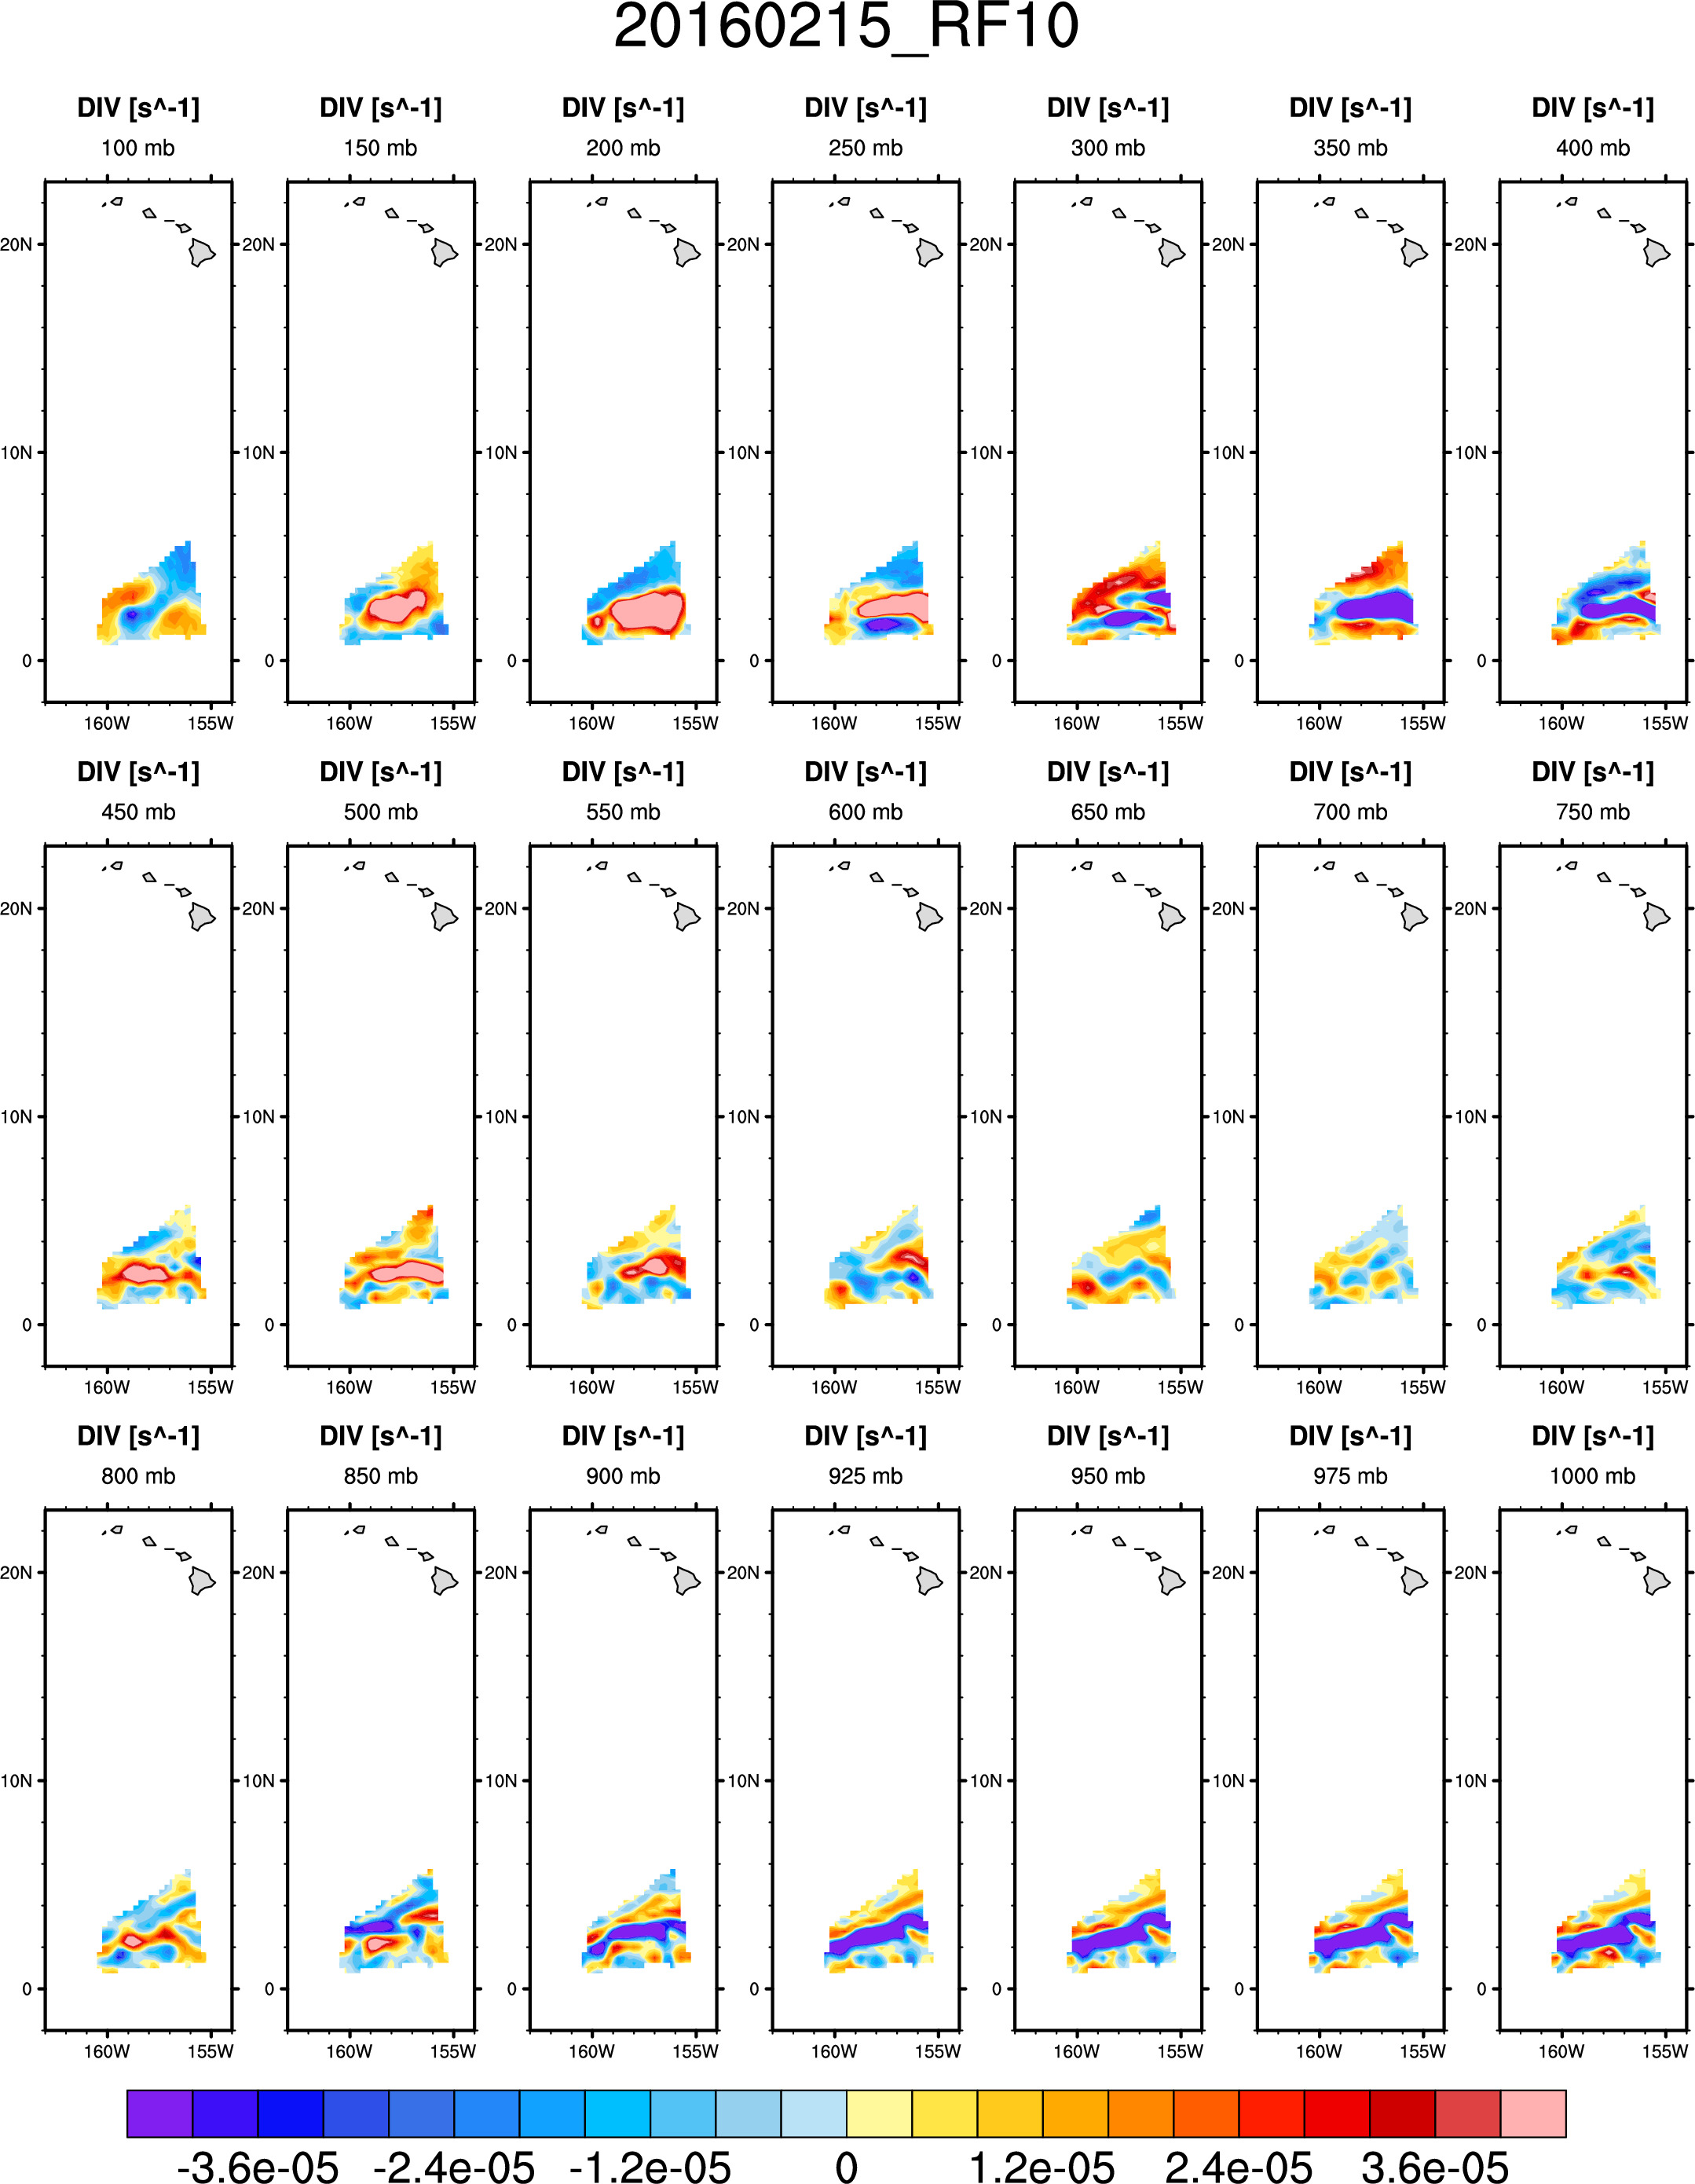
Flight 10: 20160215_RF10profile.avg.20160215_RF10.xlsx area ~ 297.


----------------------------------------------------------------------------------------------------------------------------------------------------------------------------------------------------------------------------
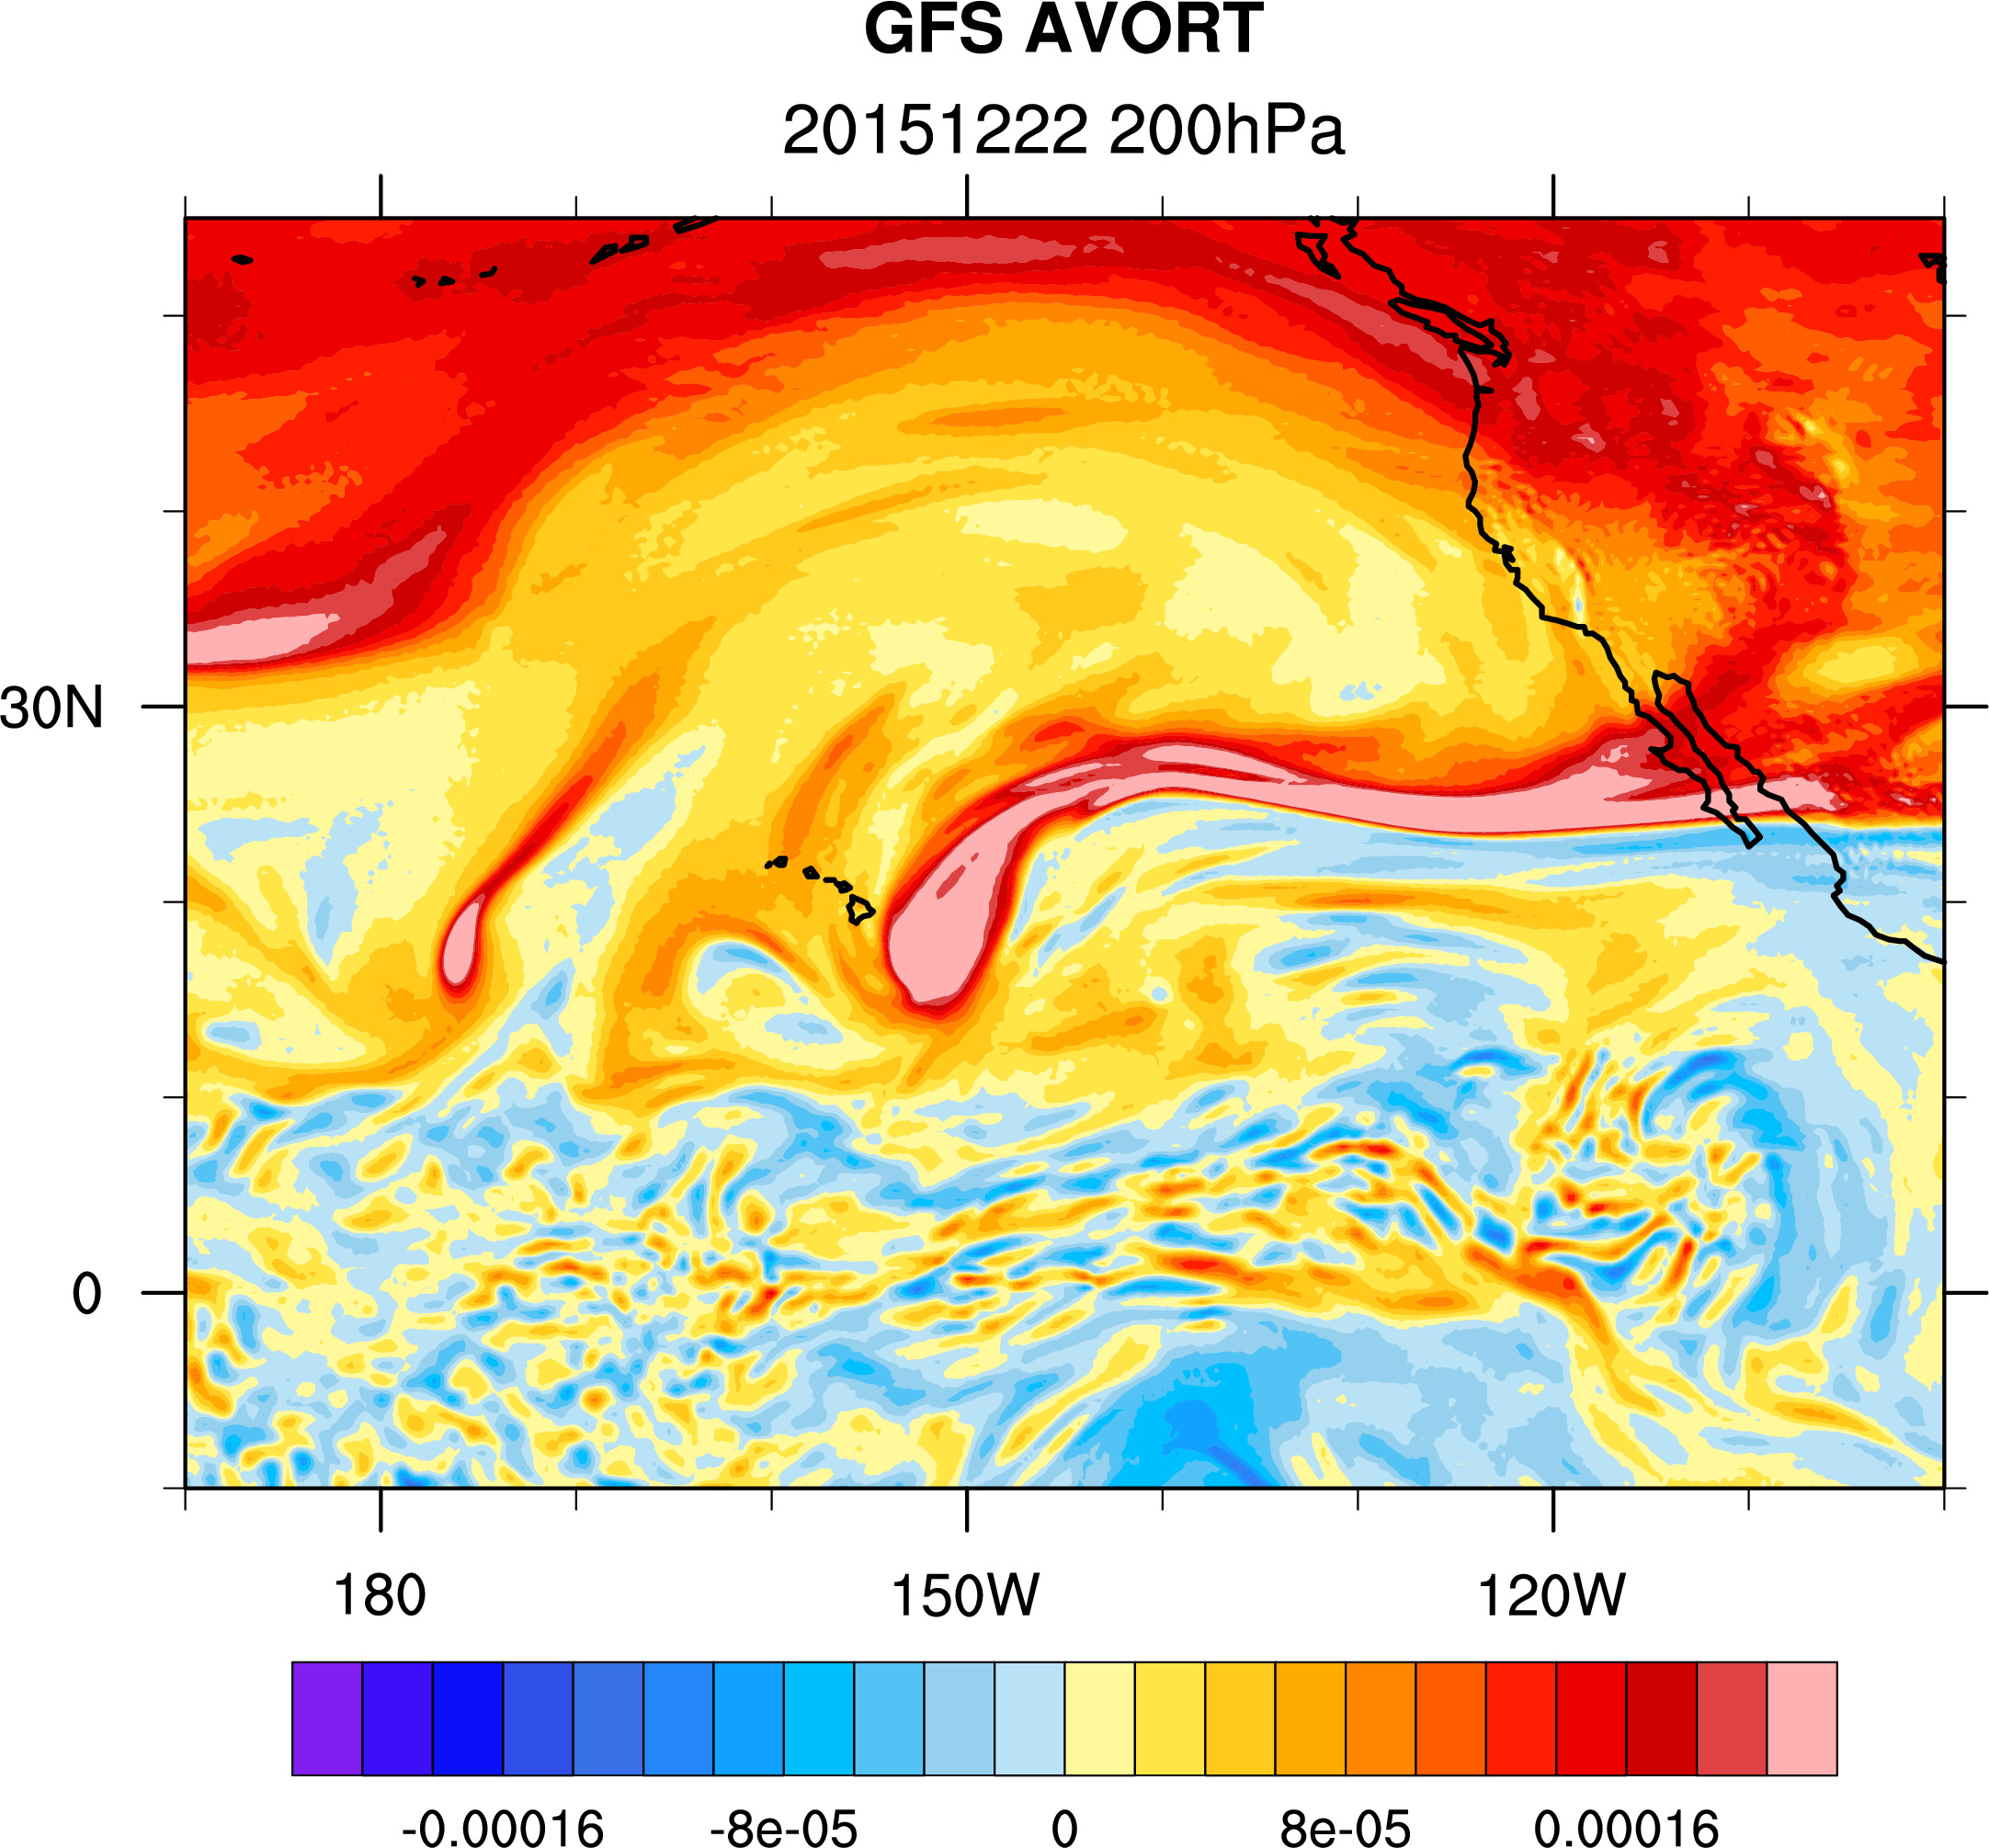
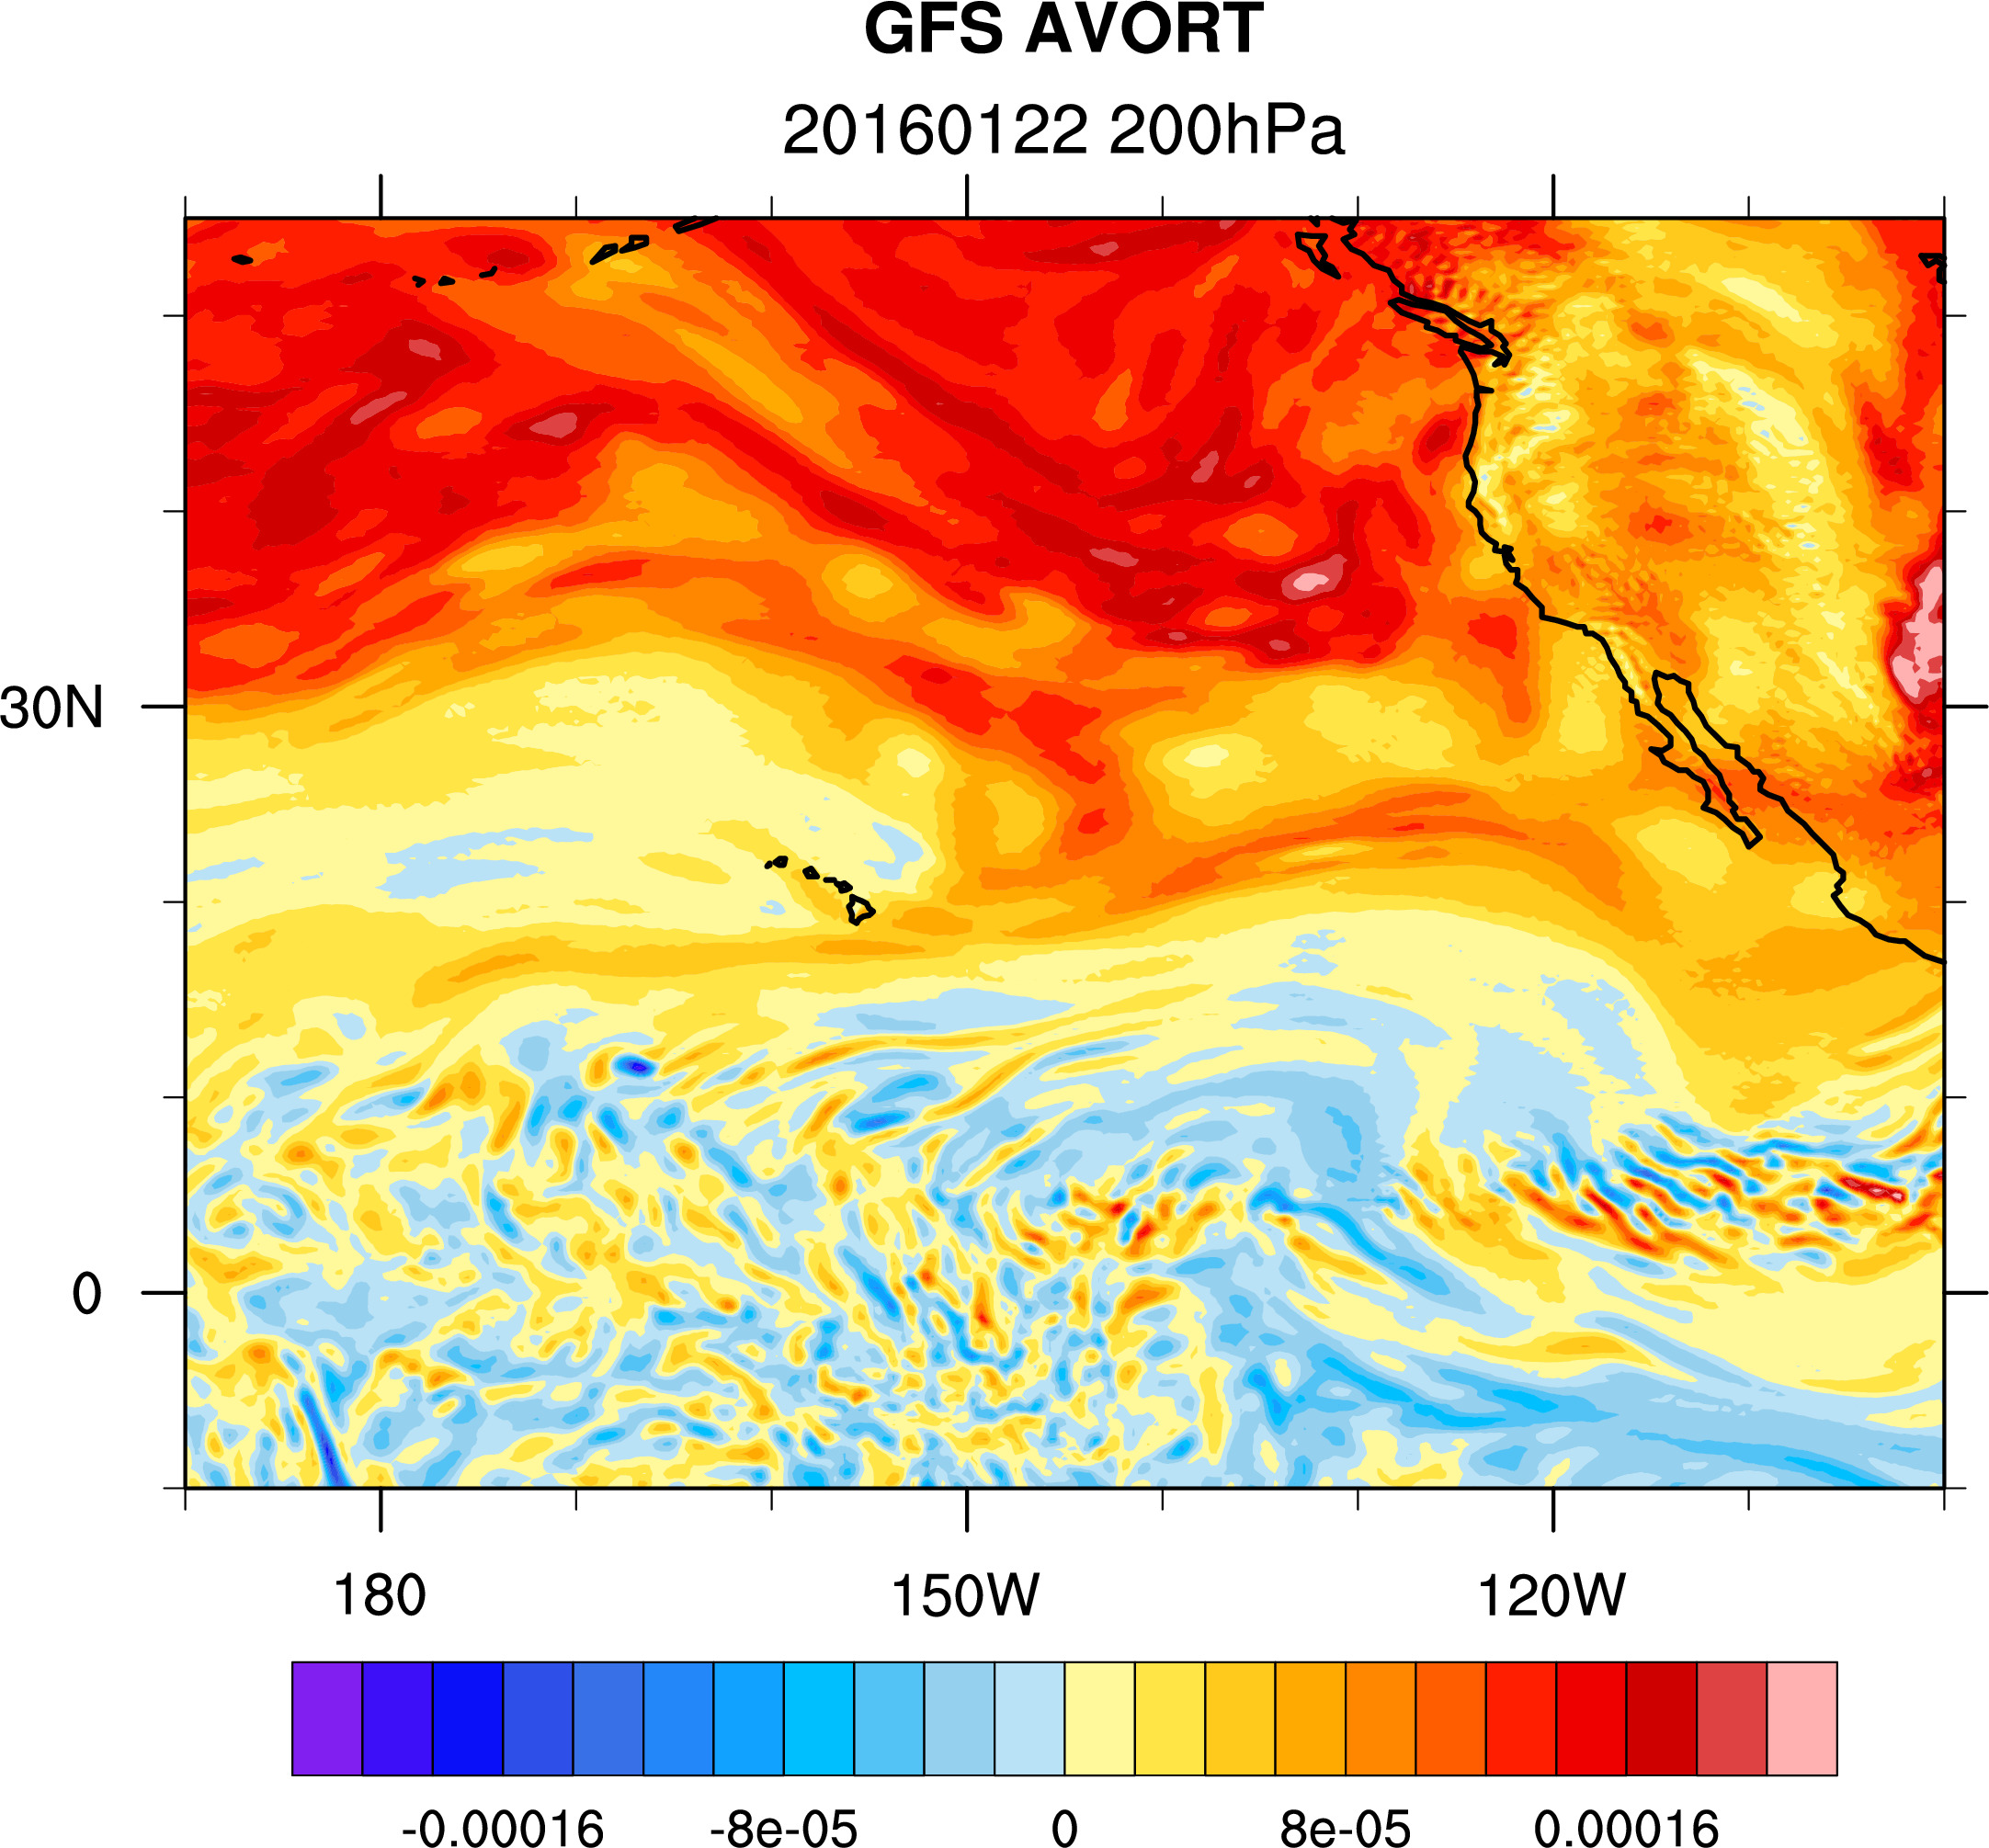
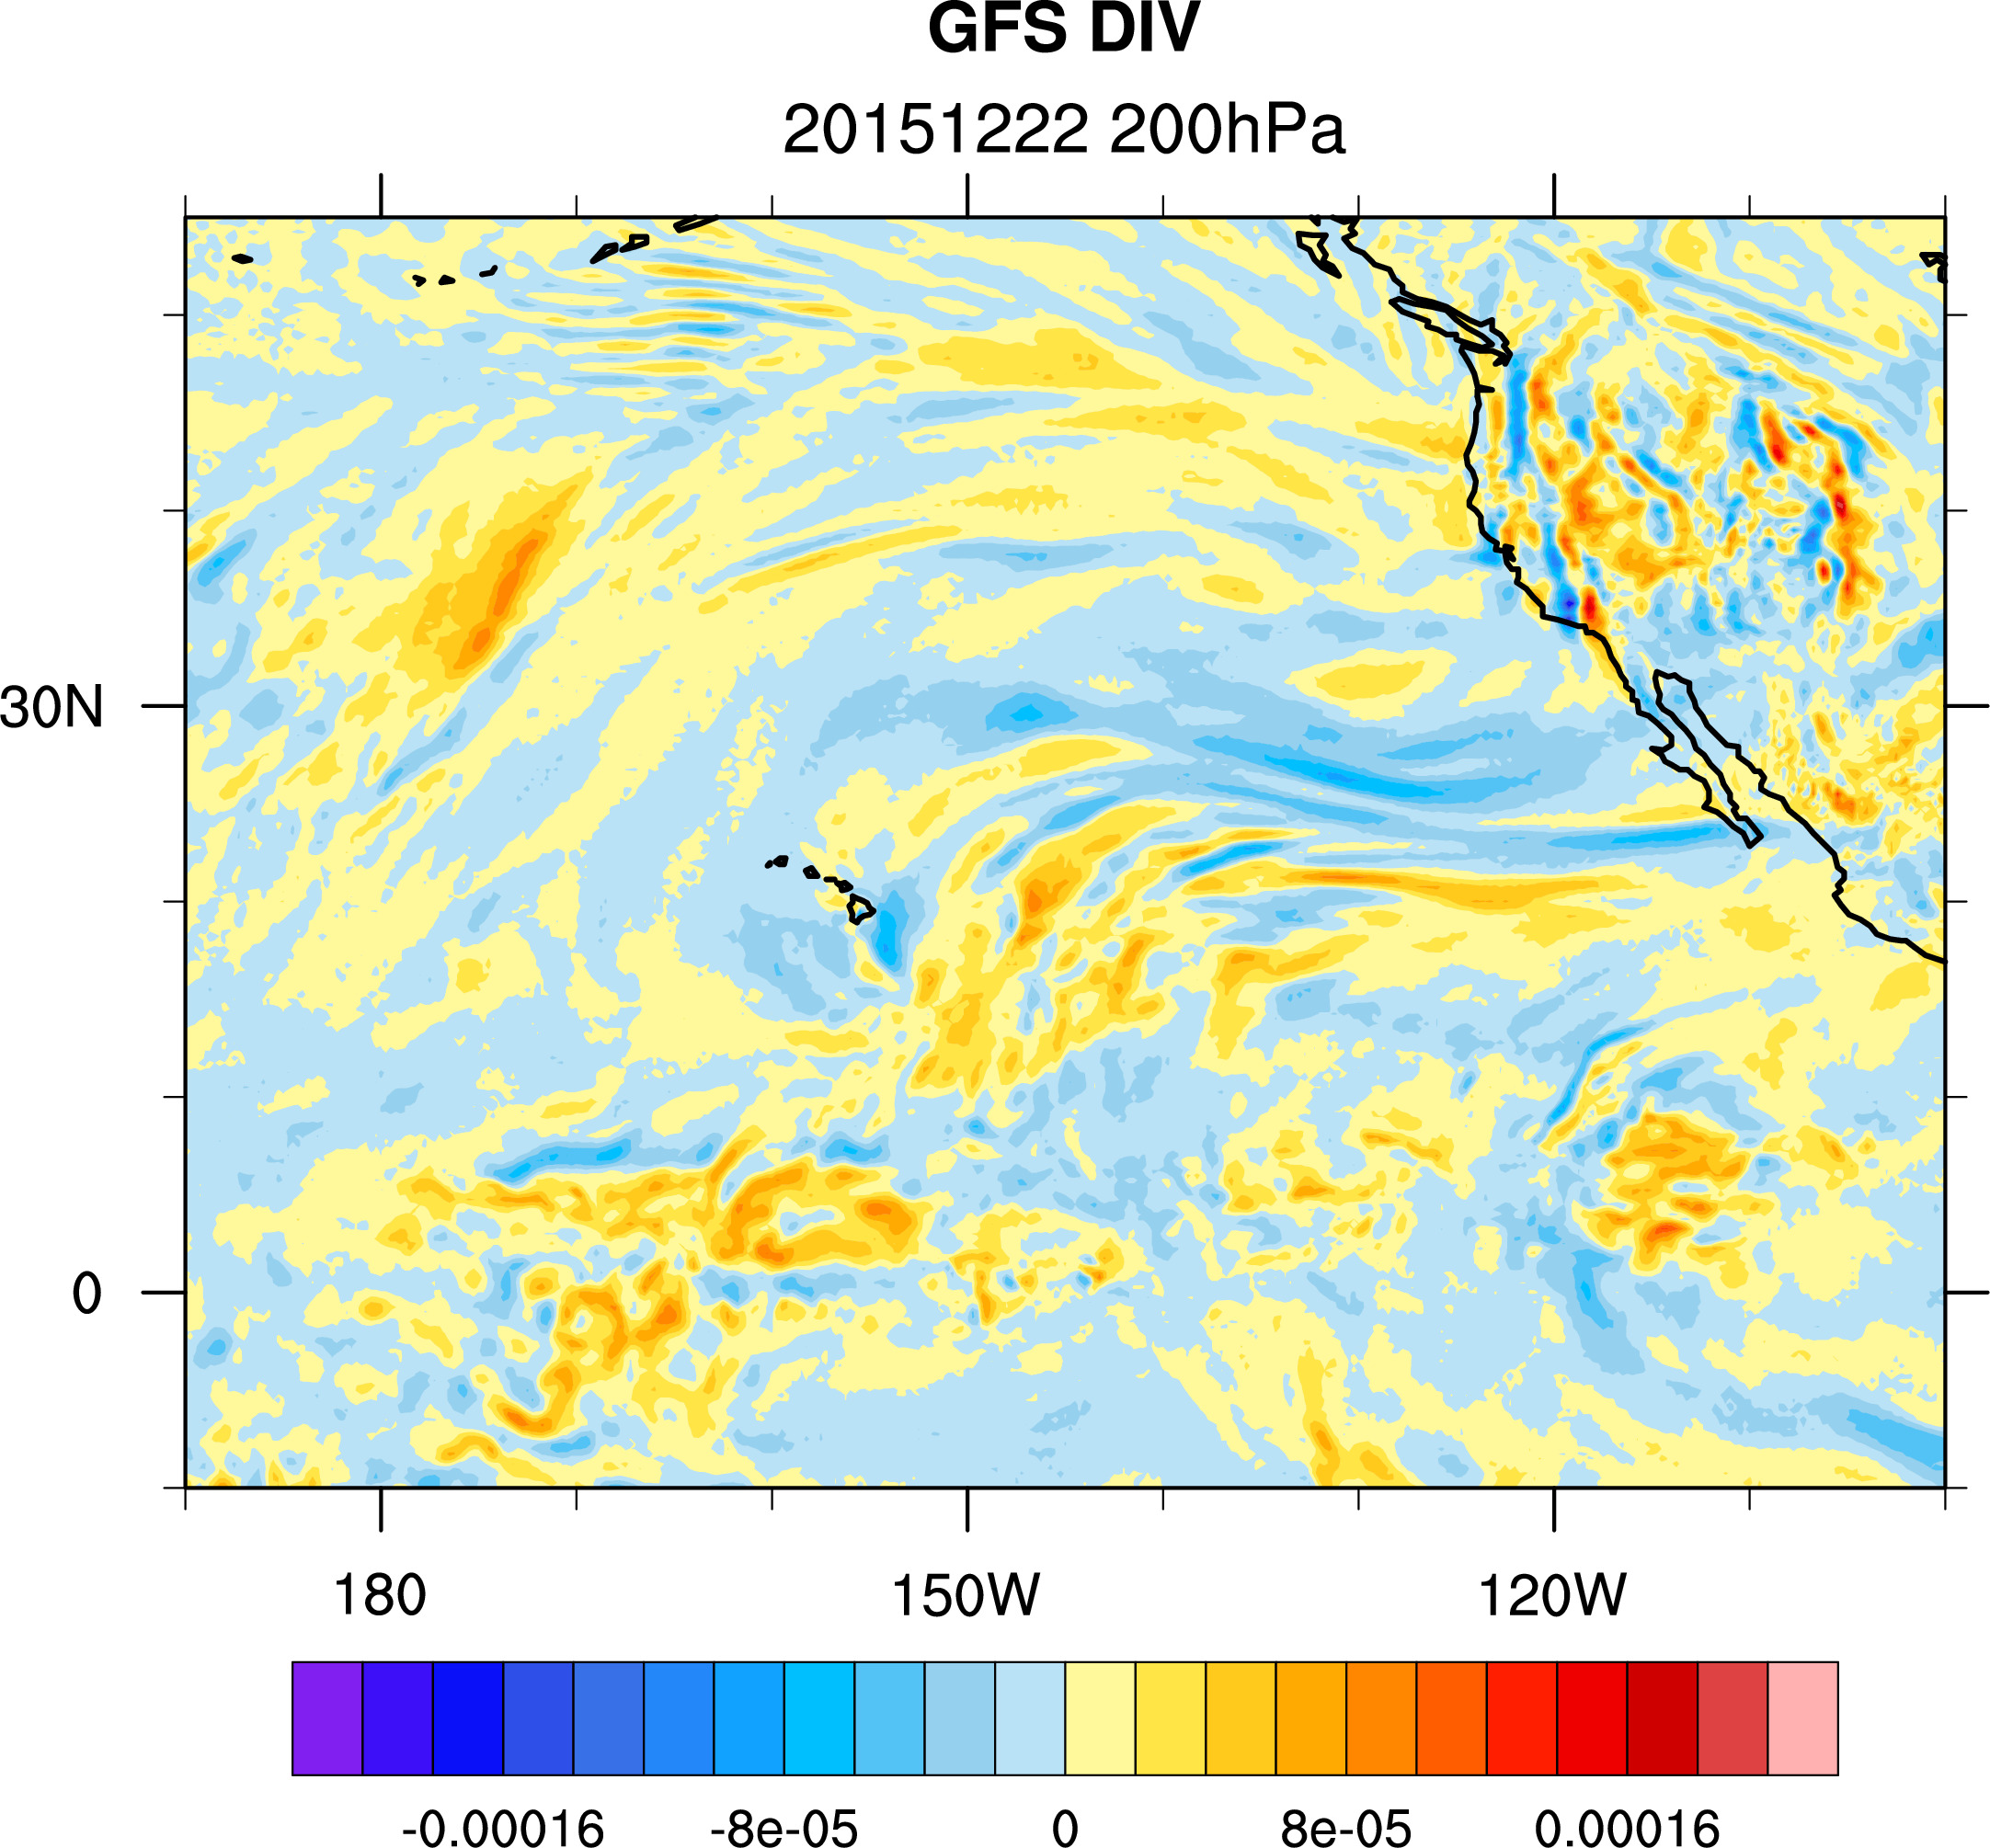
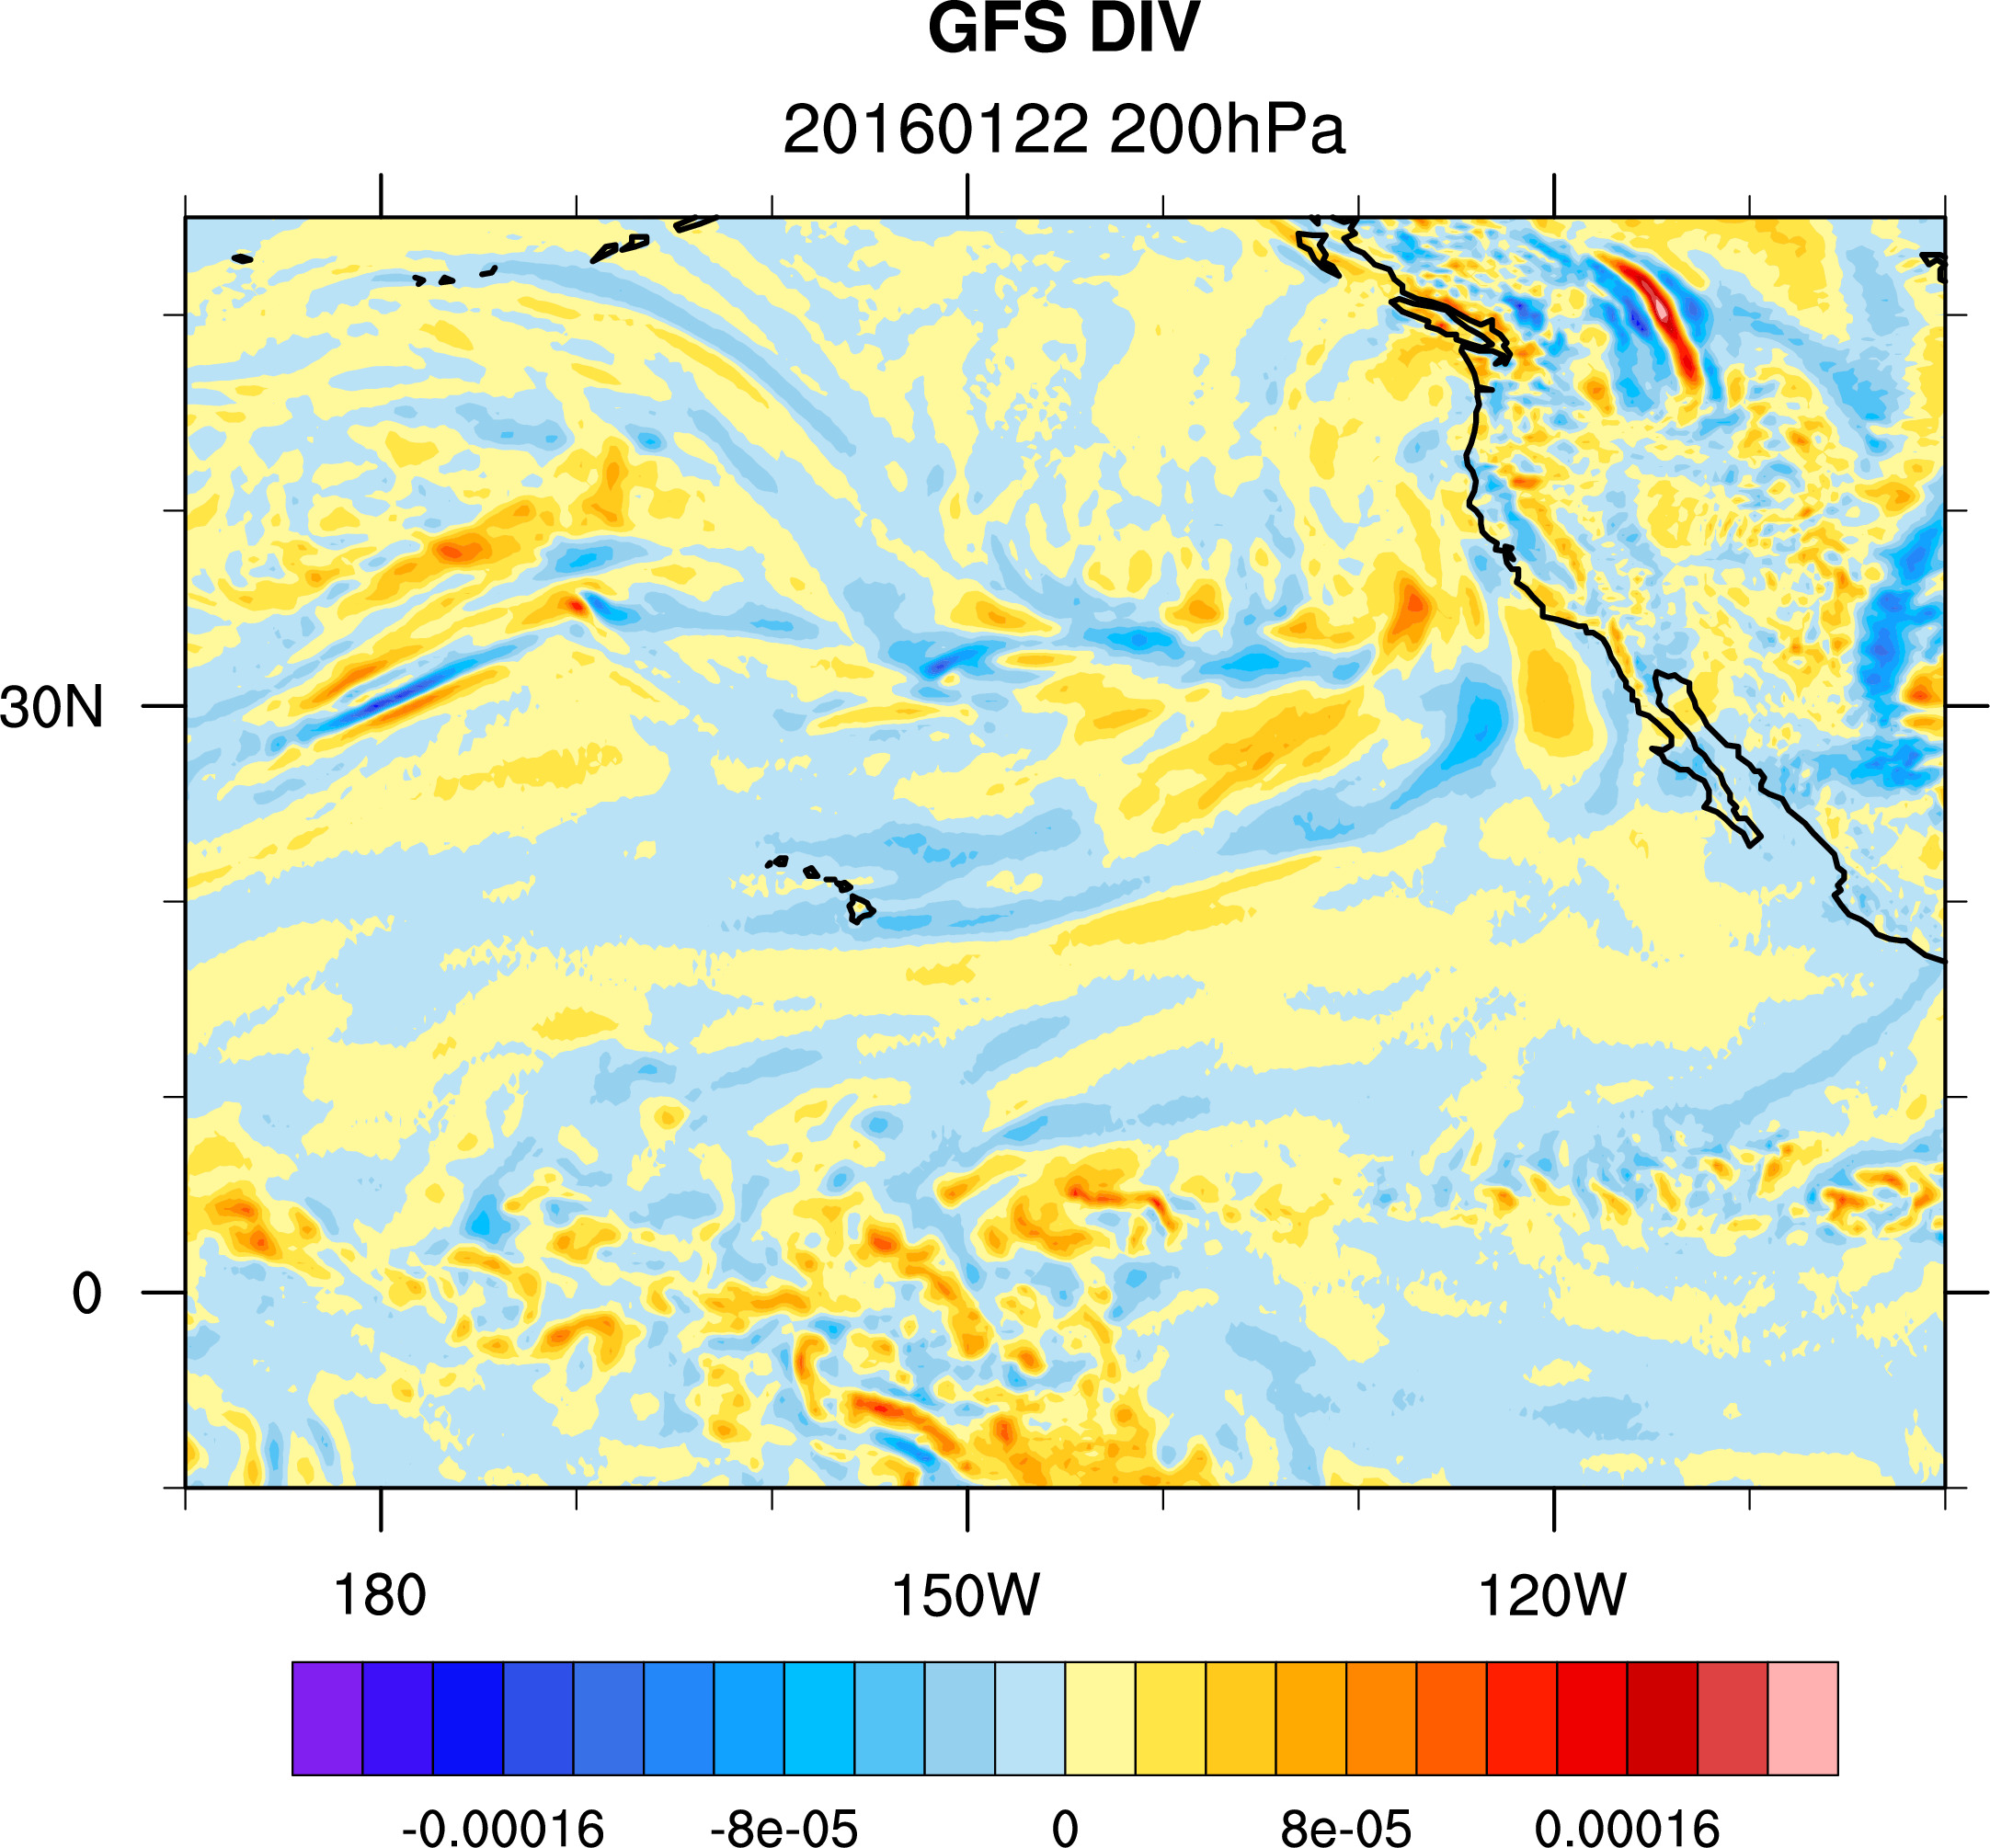
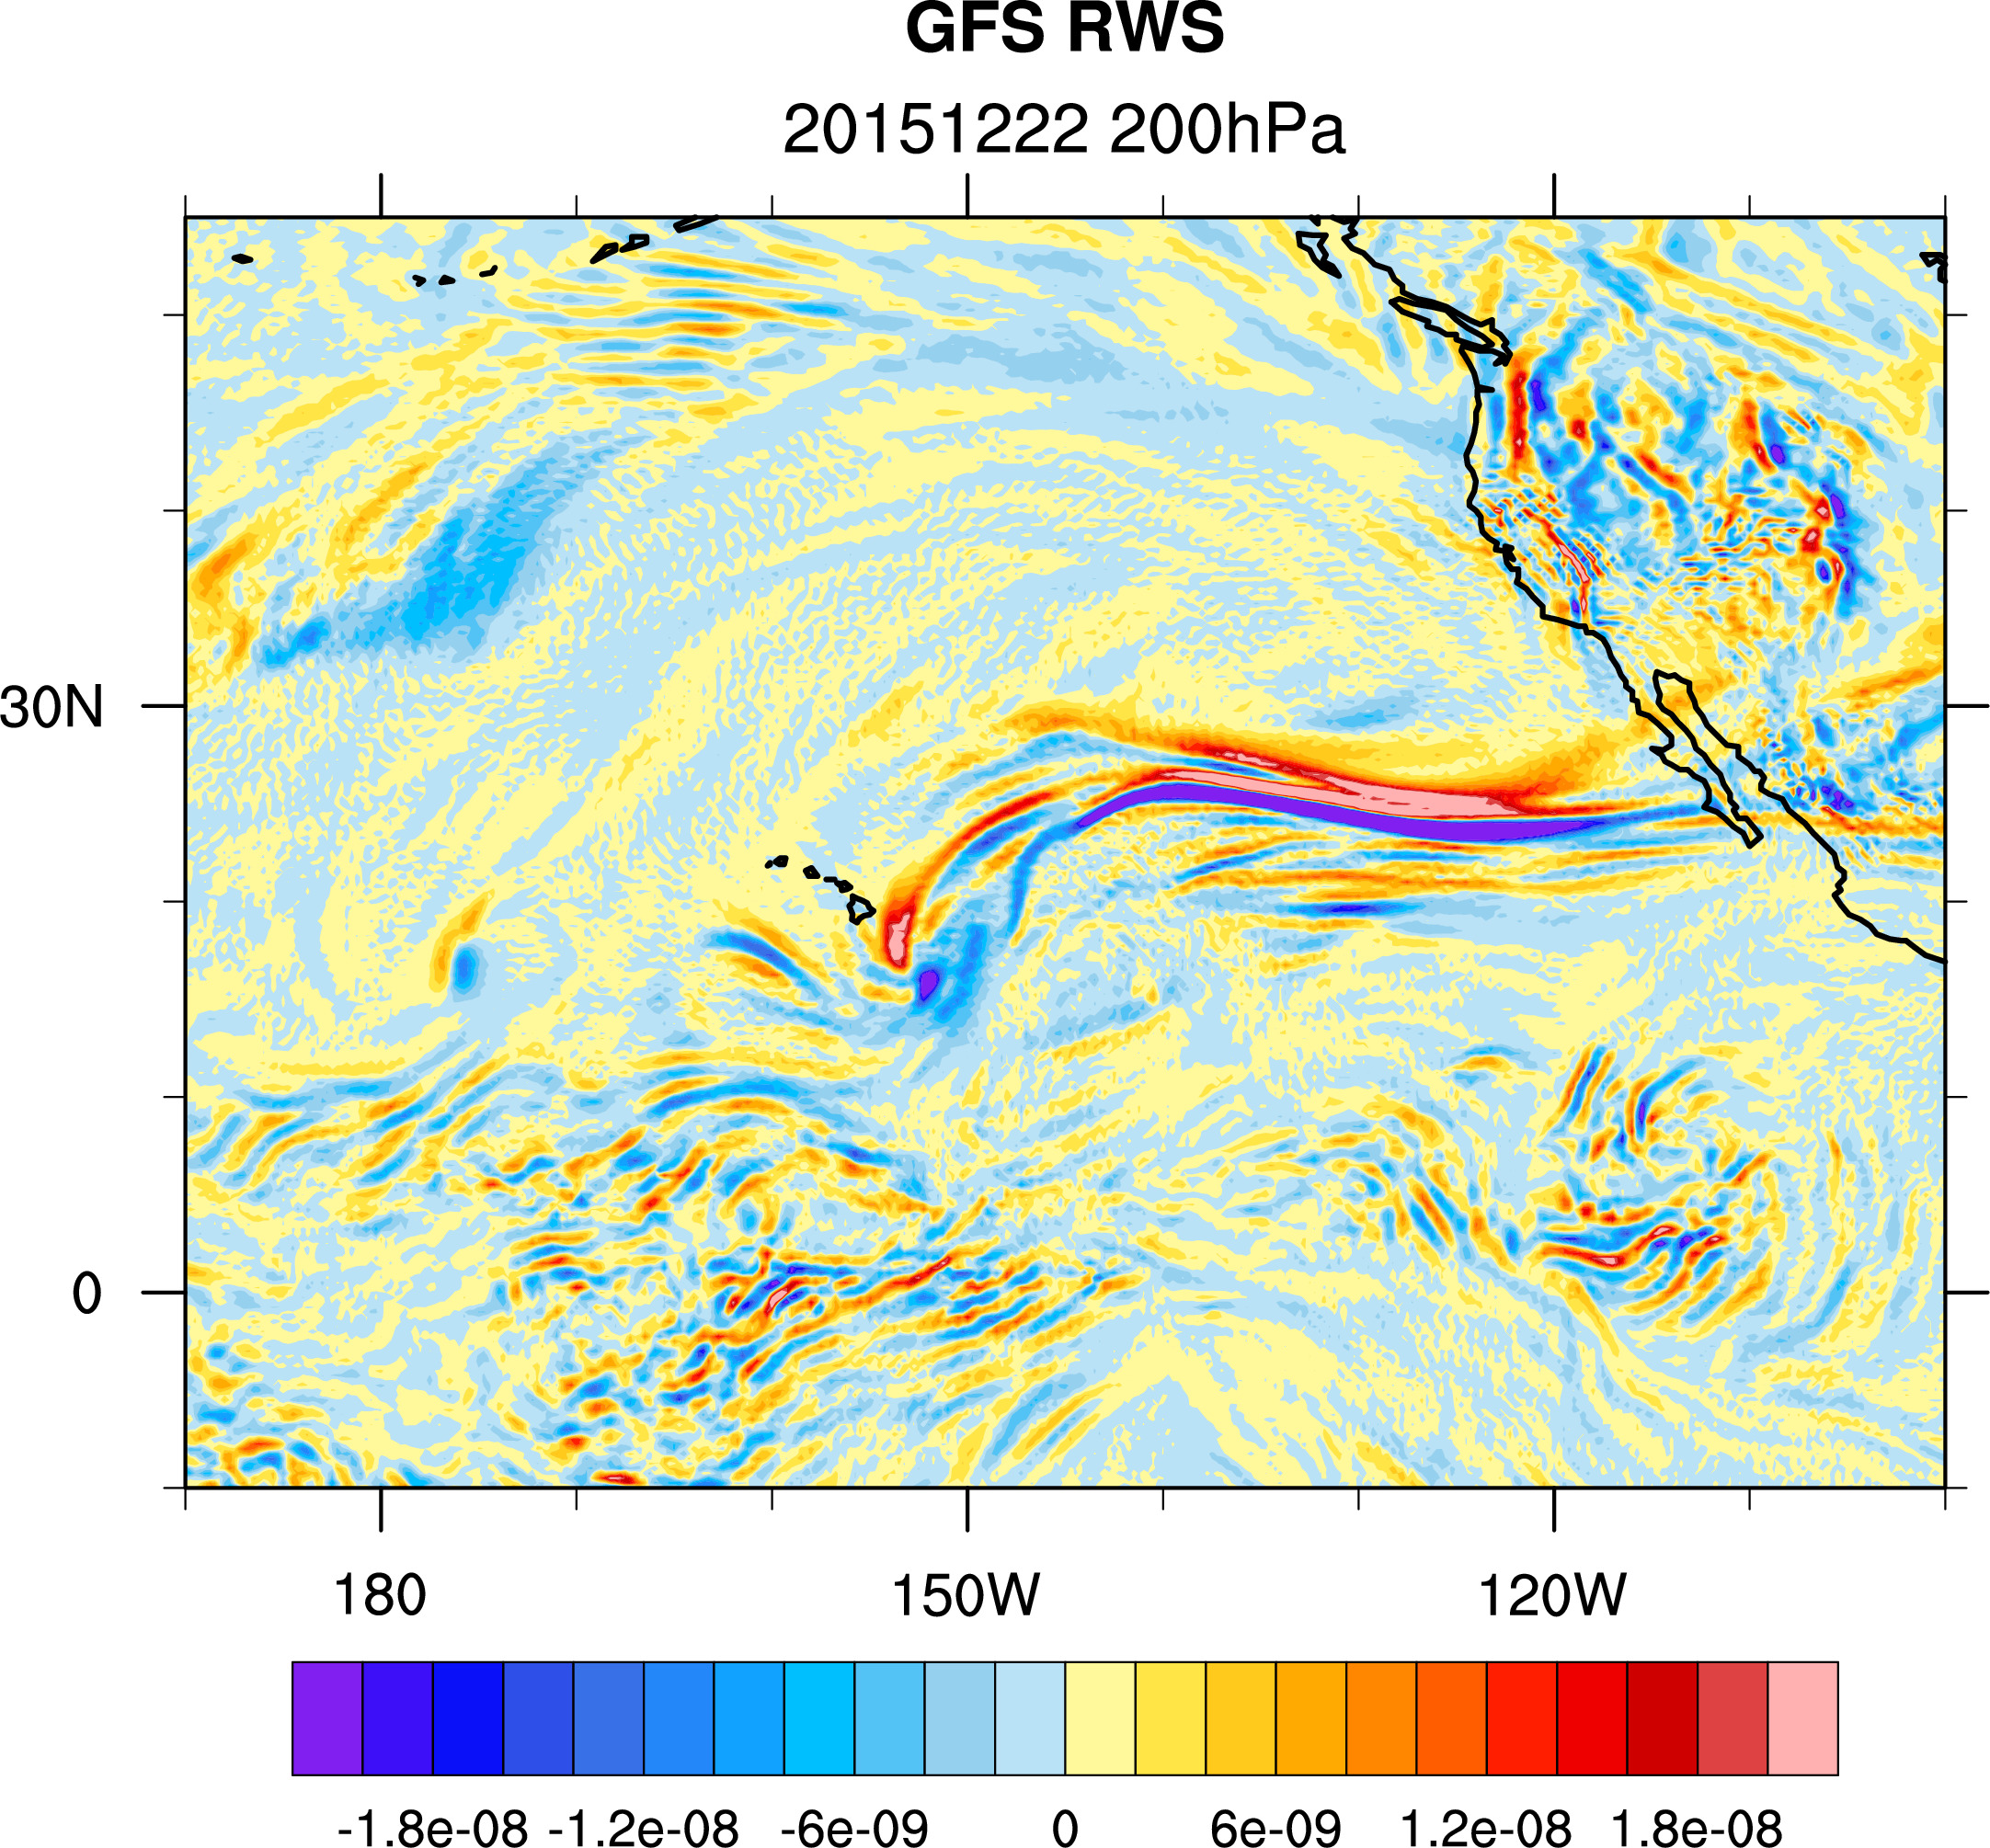
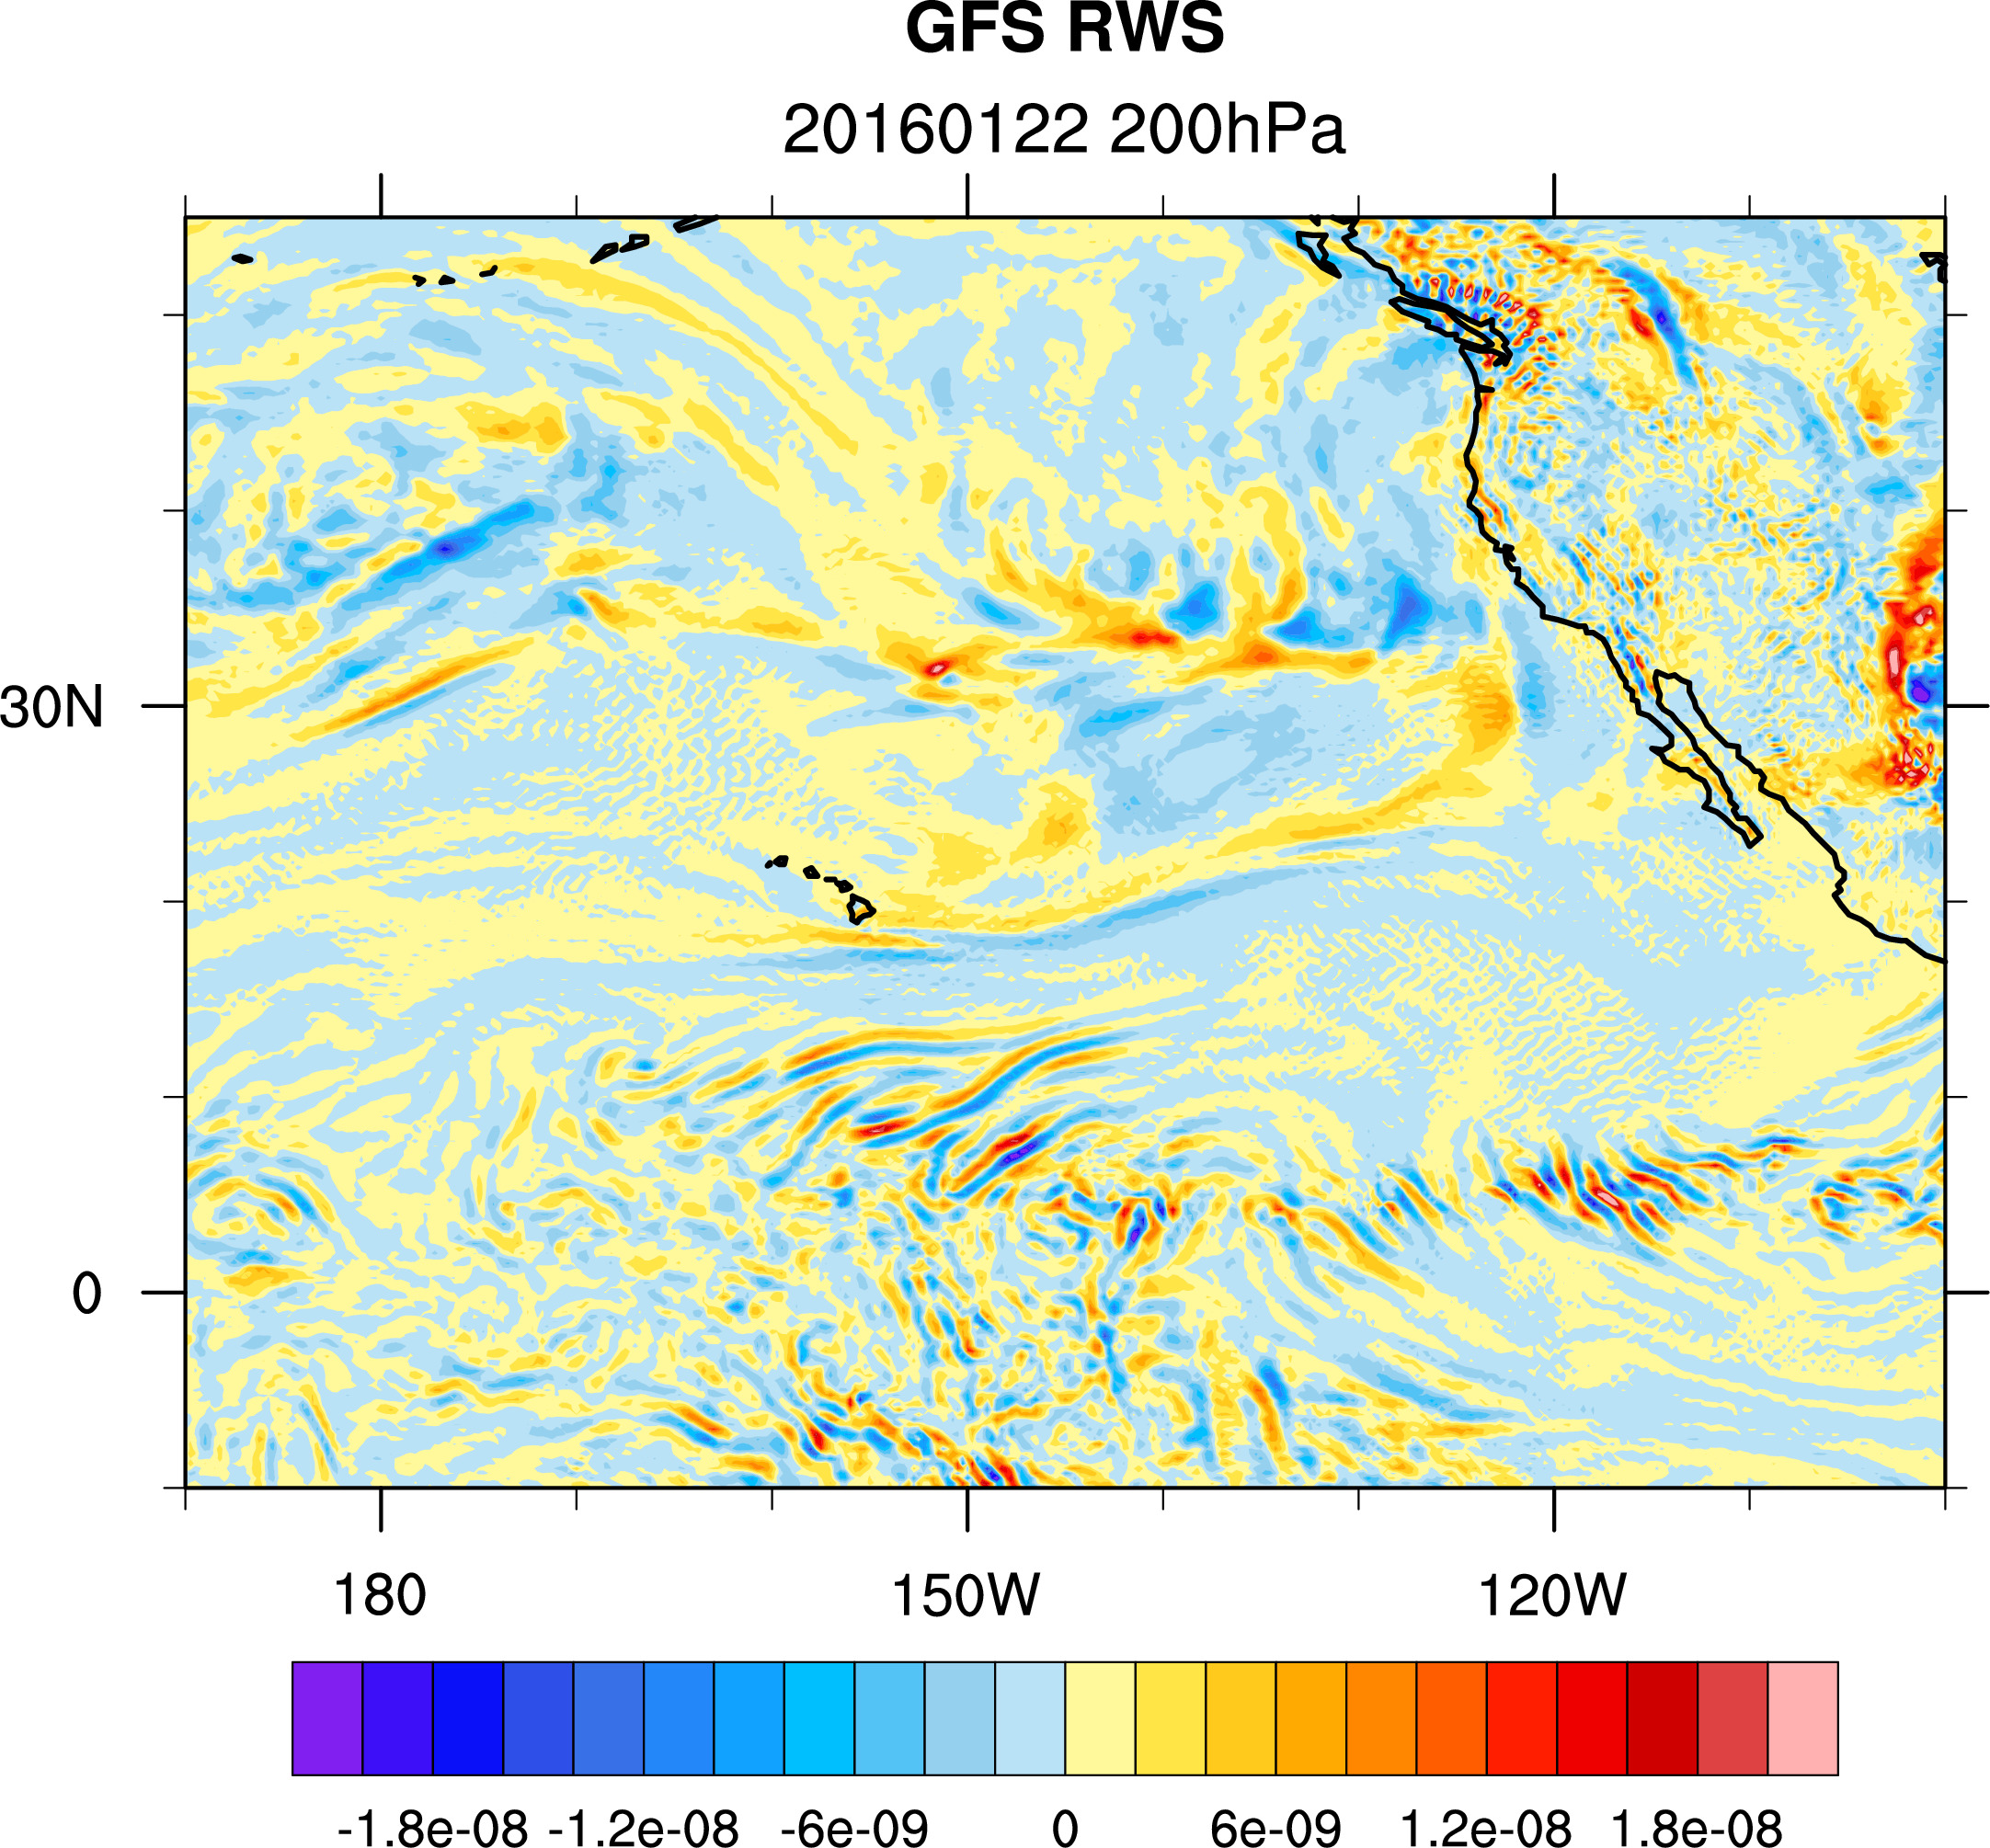
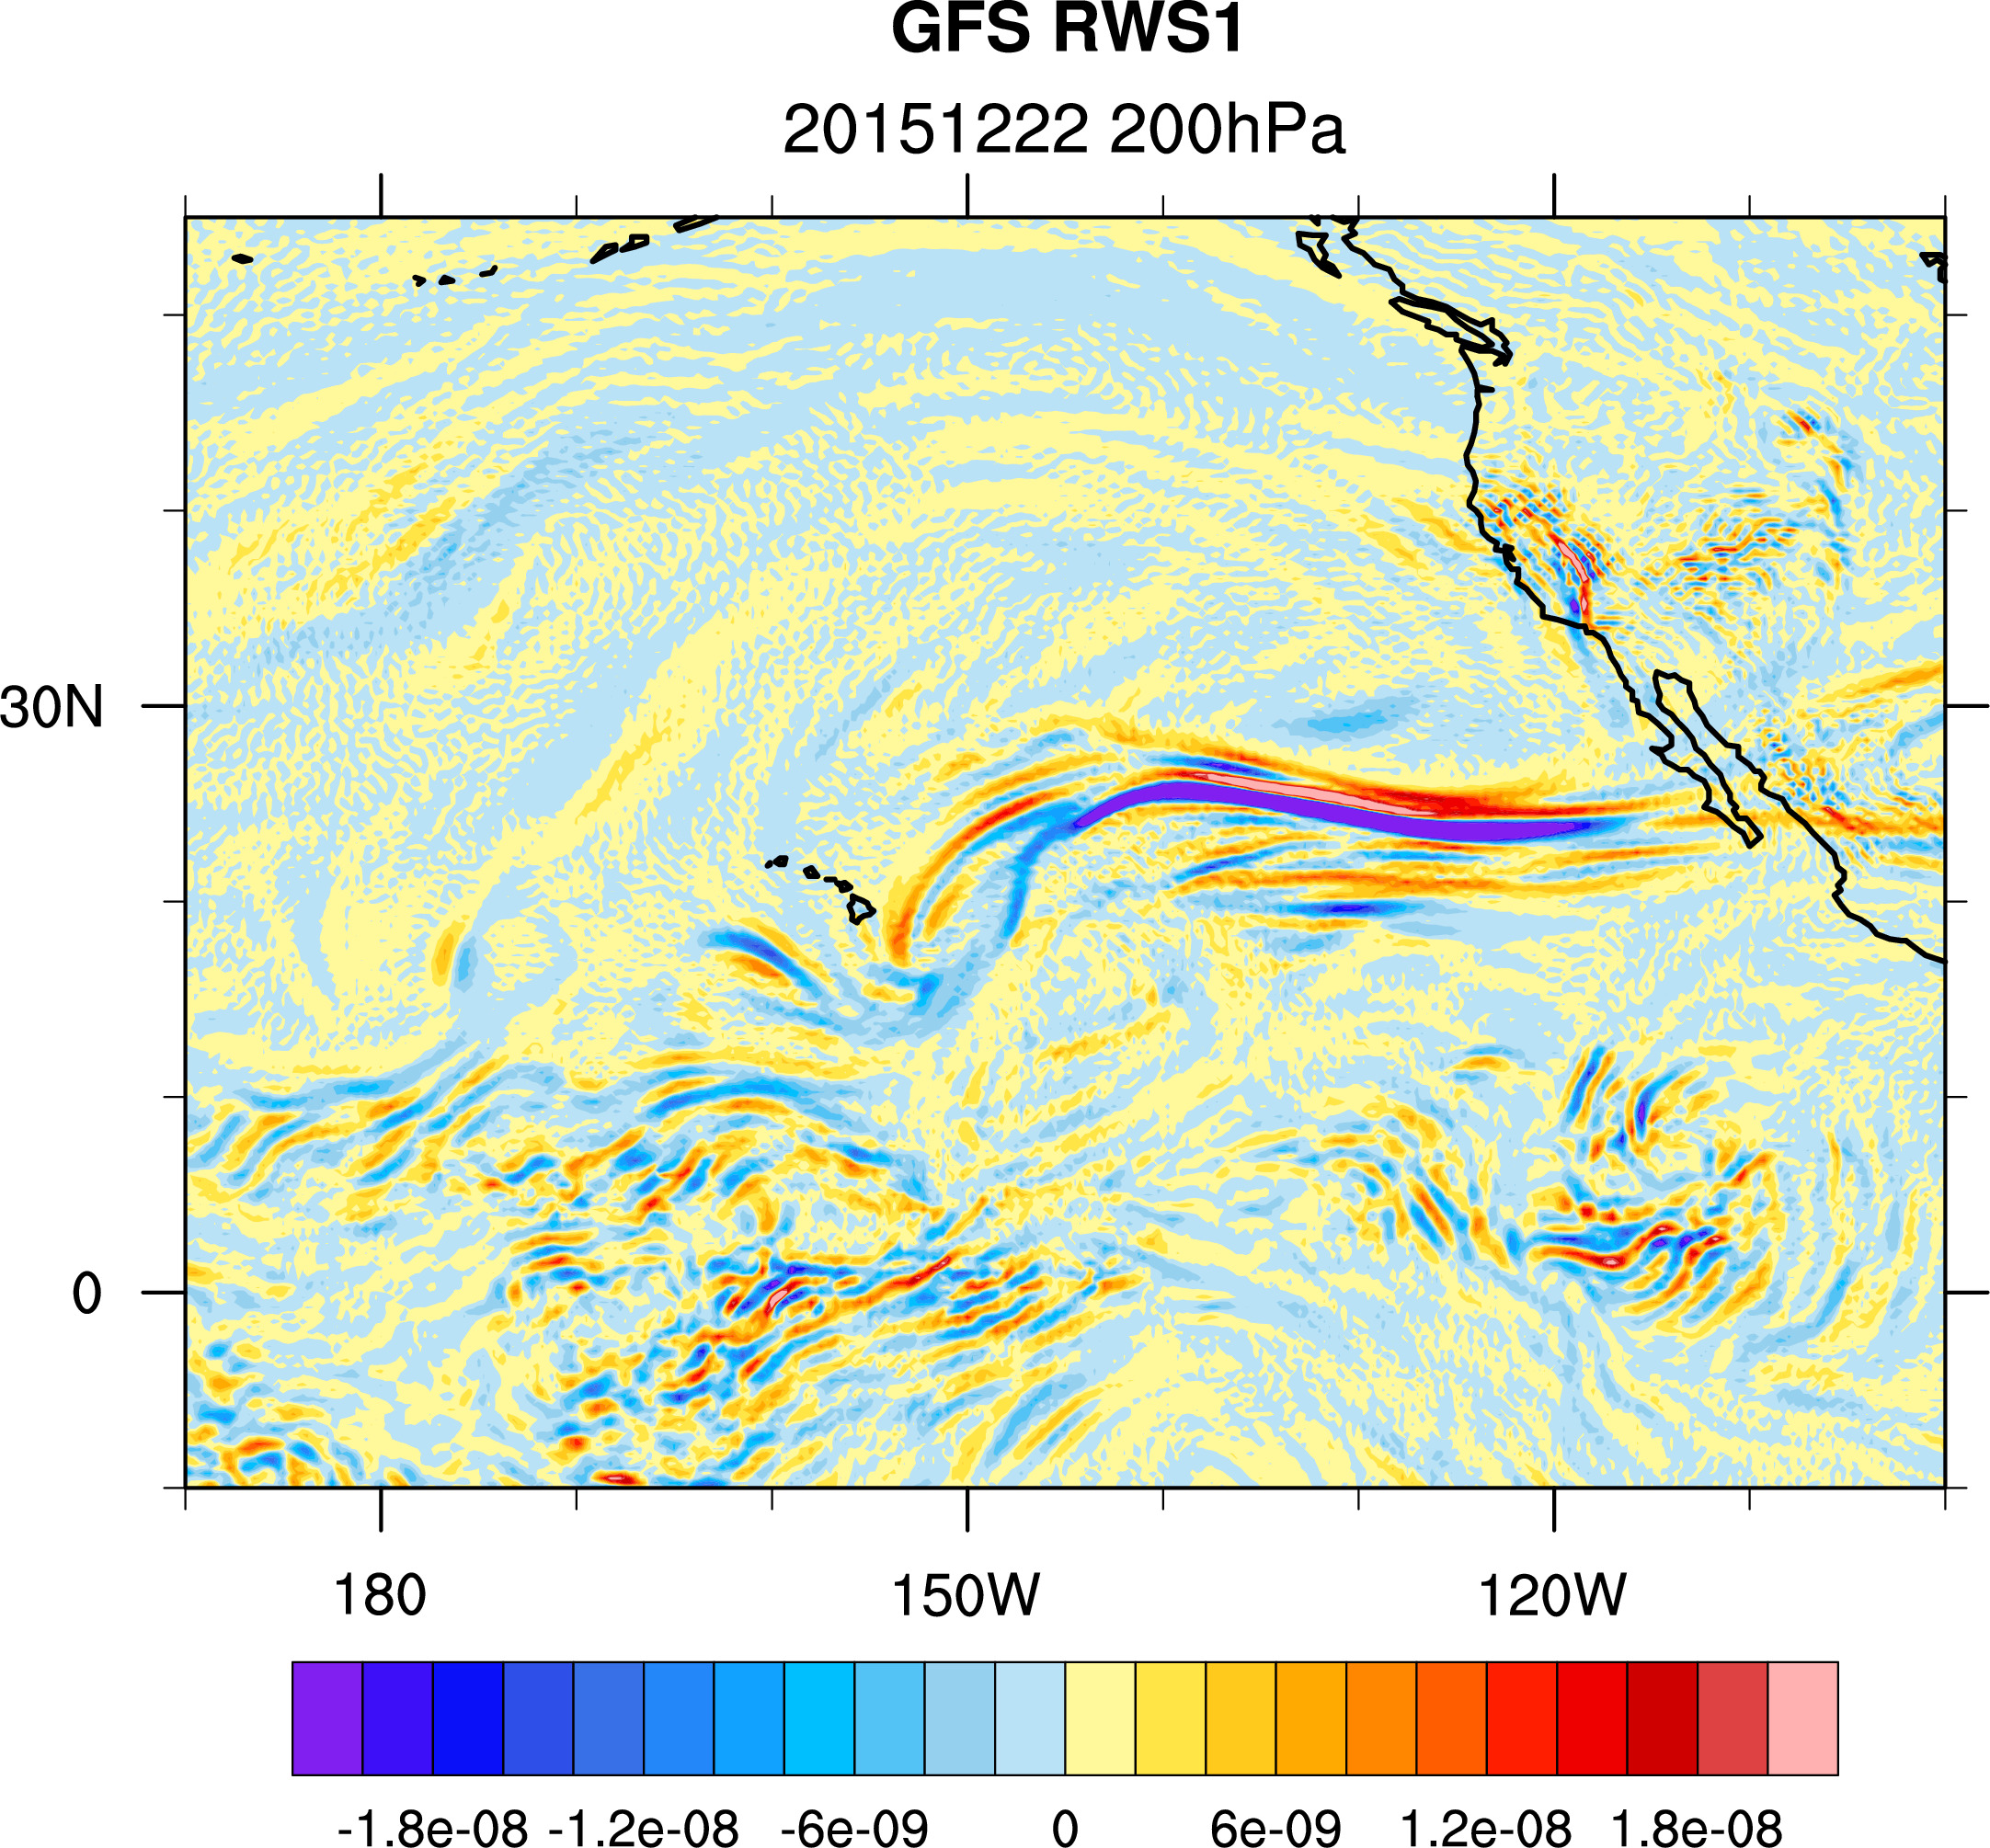
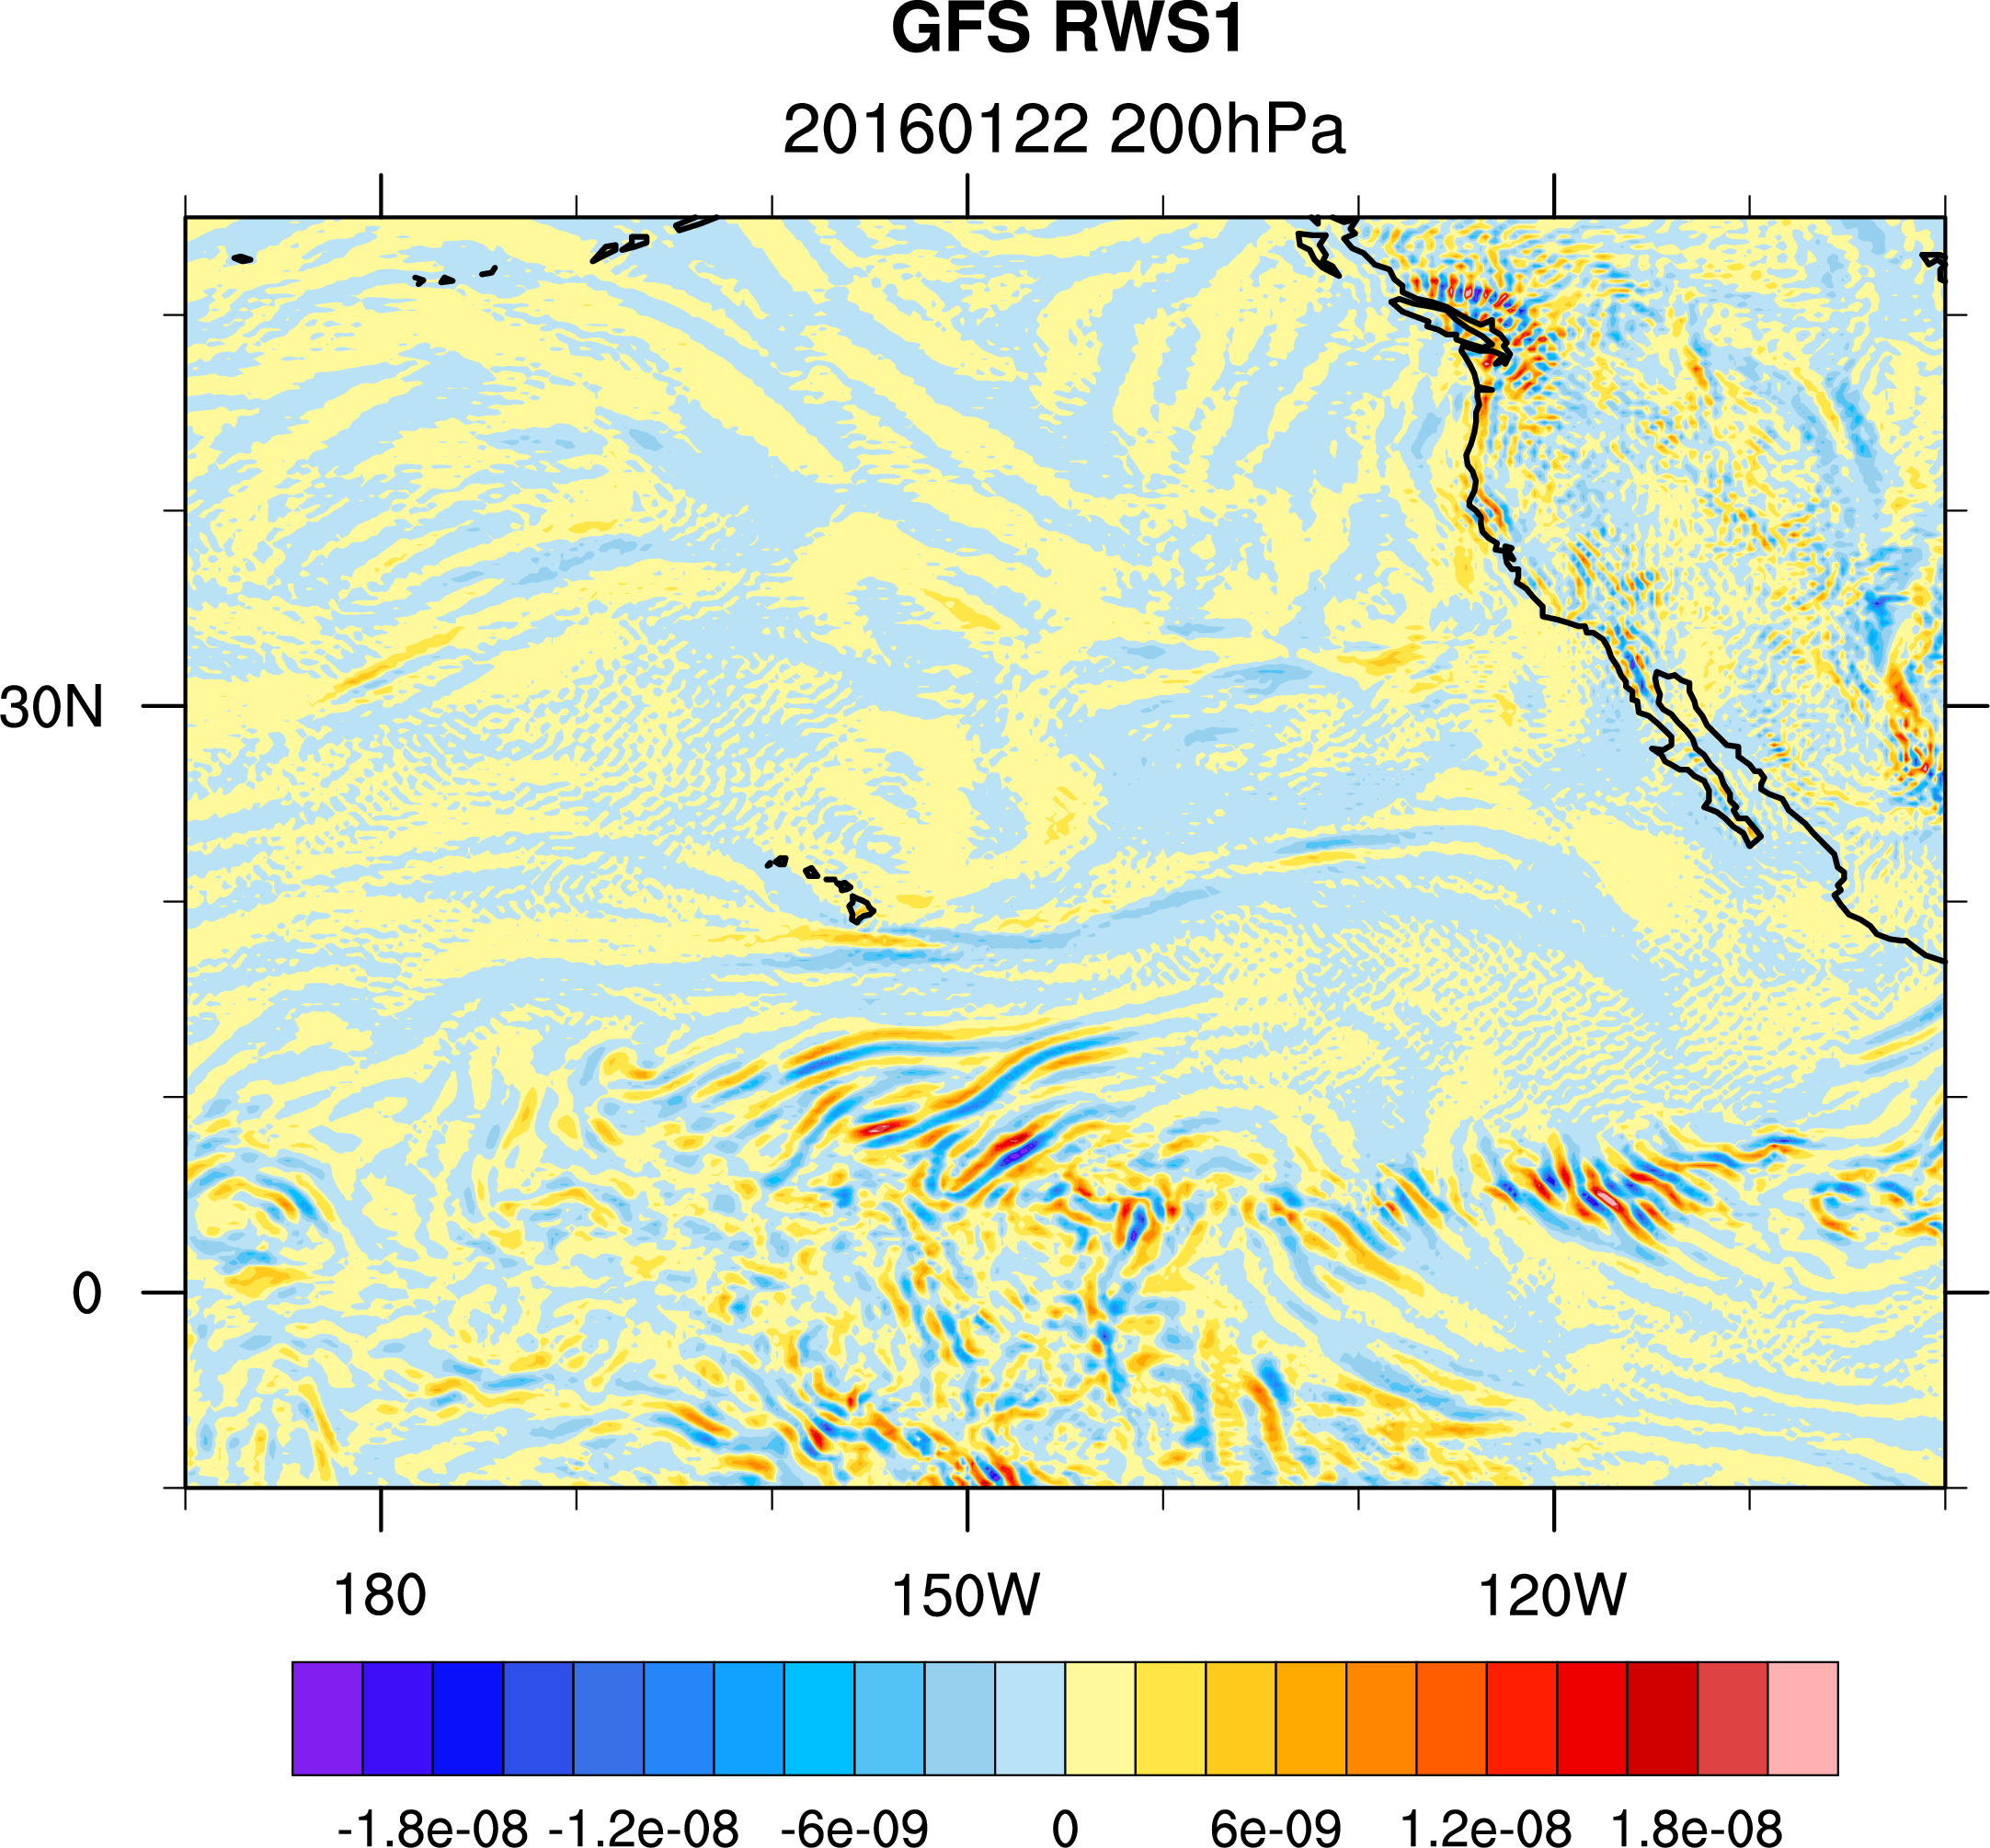
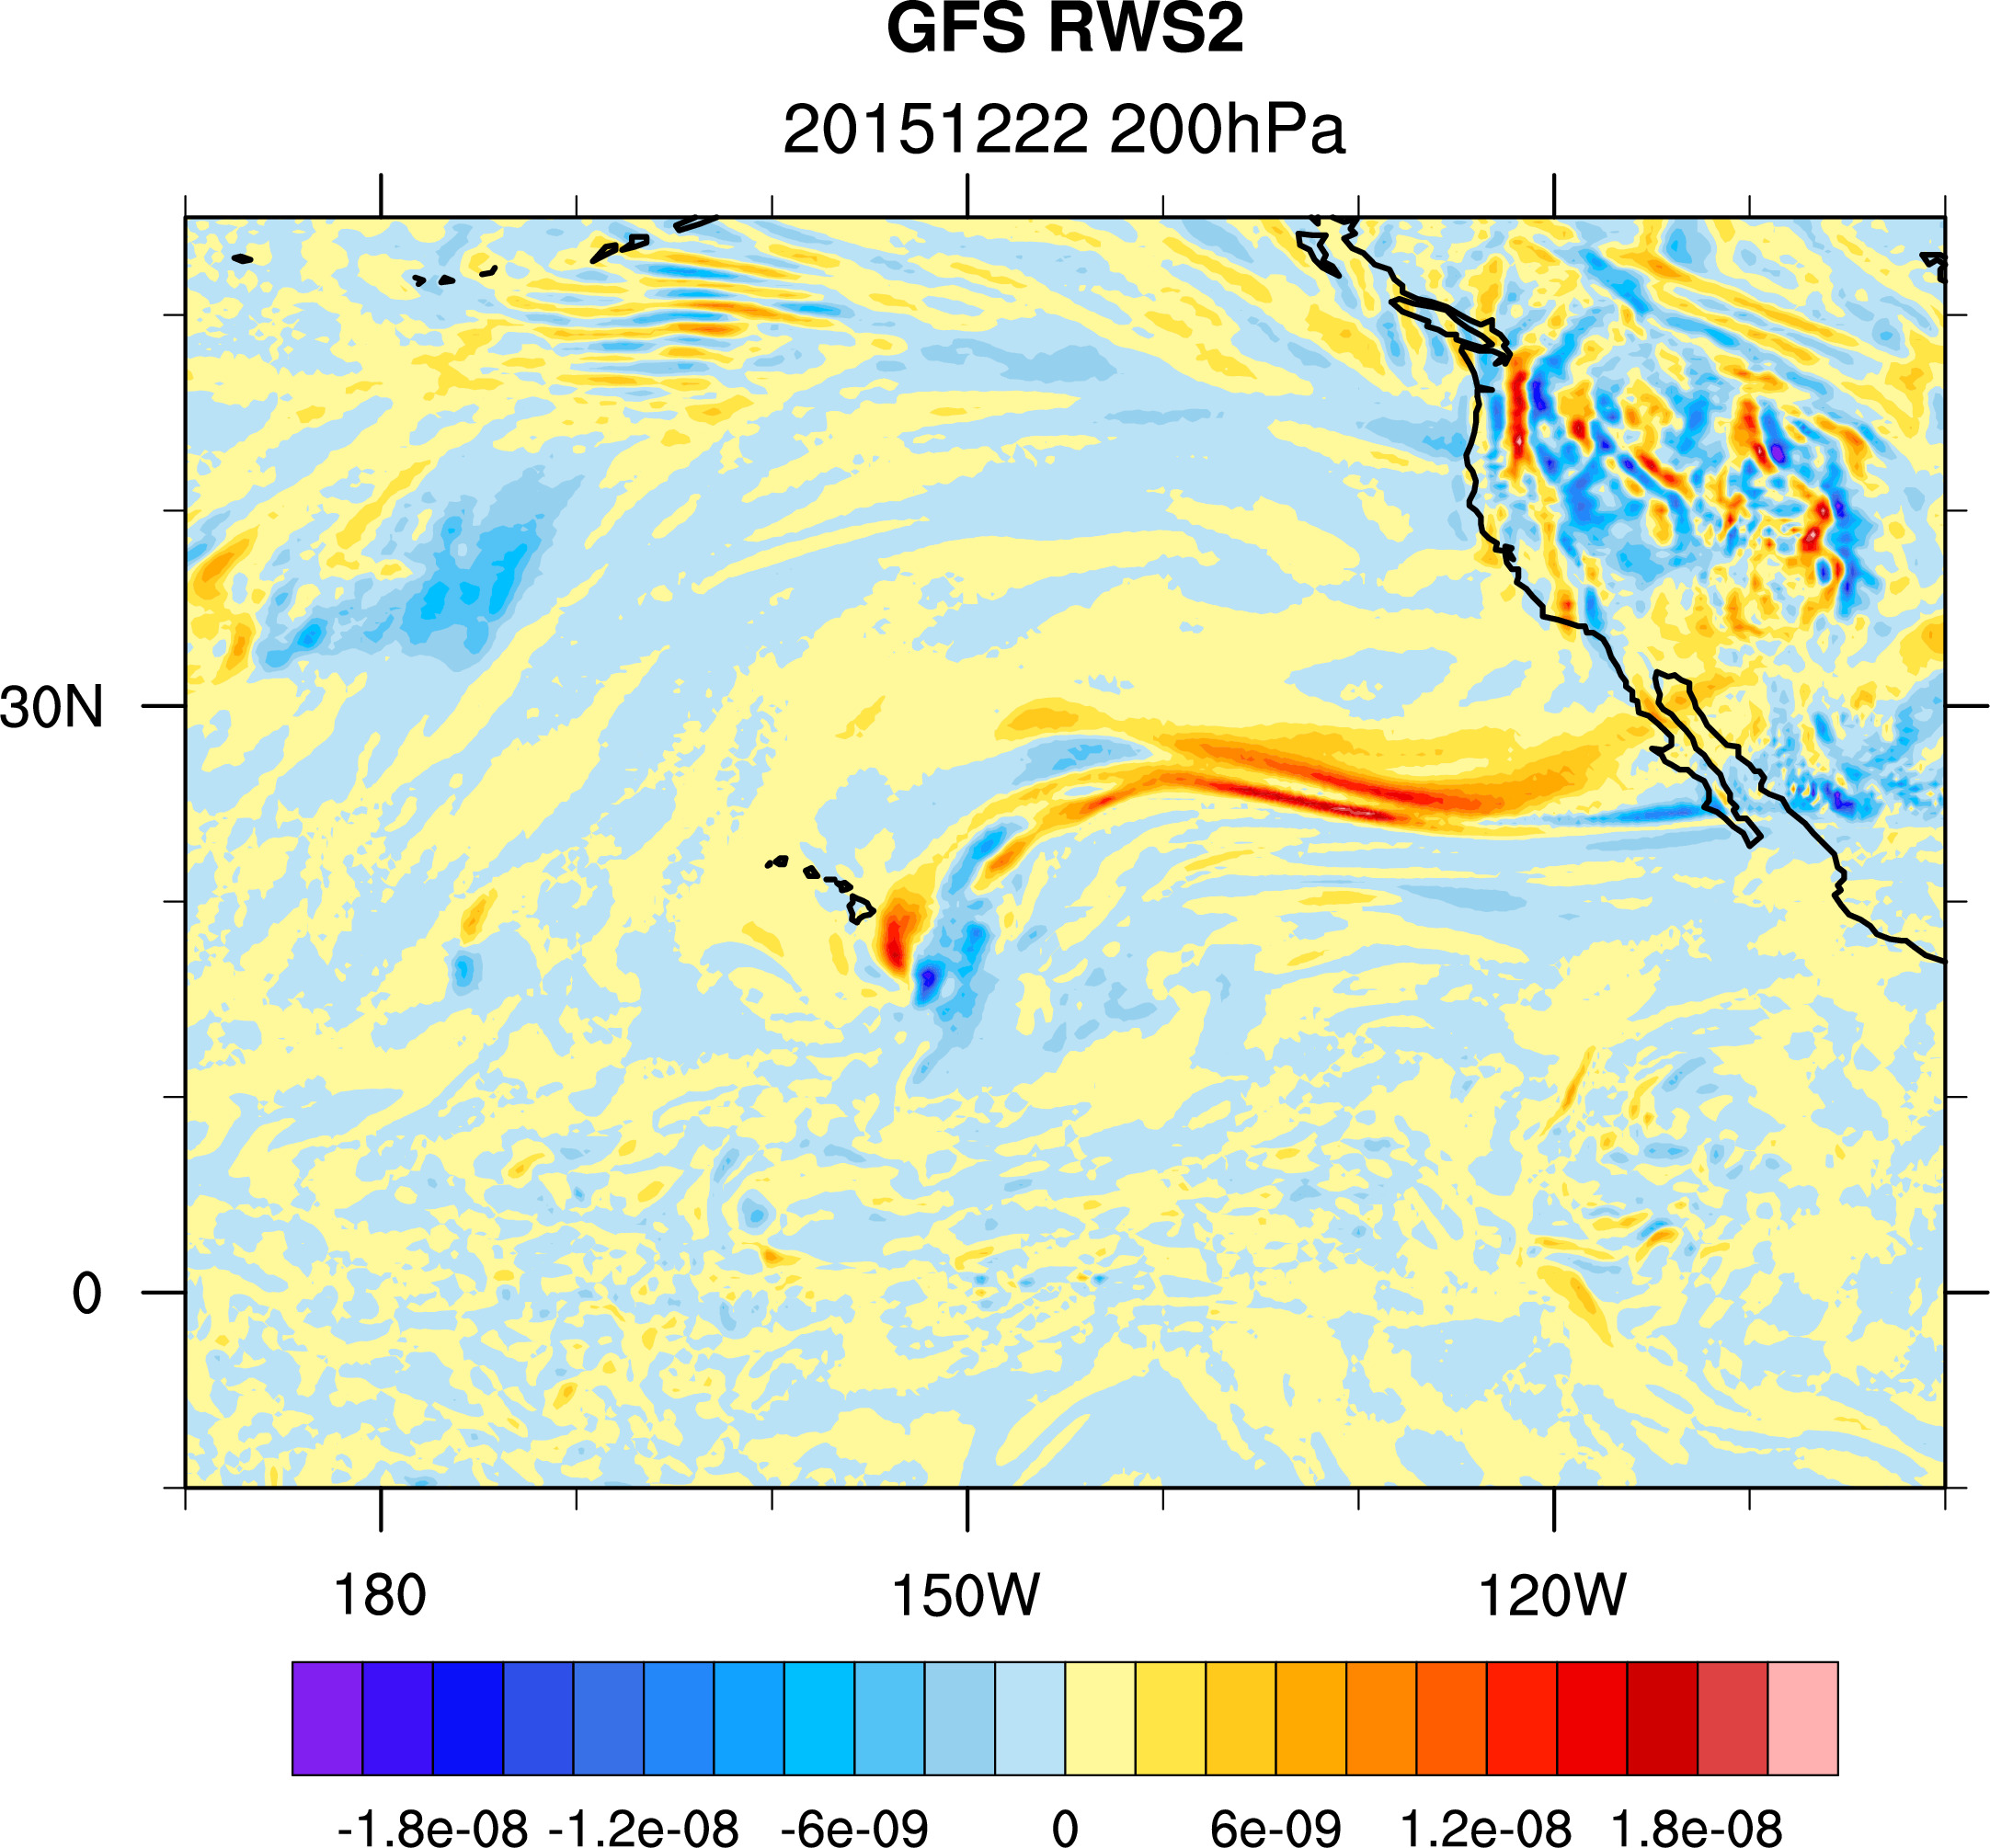
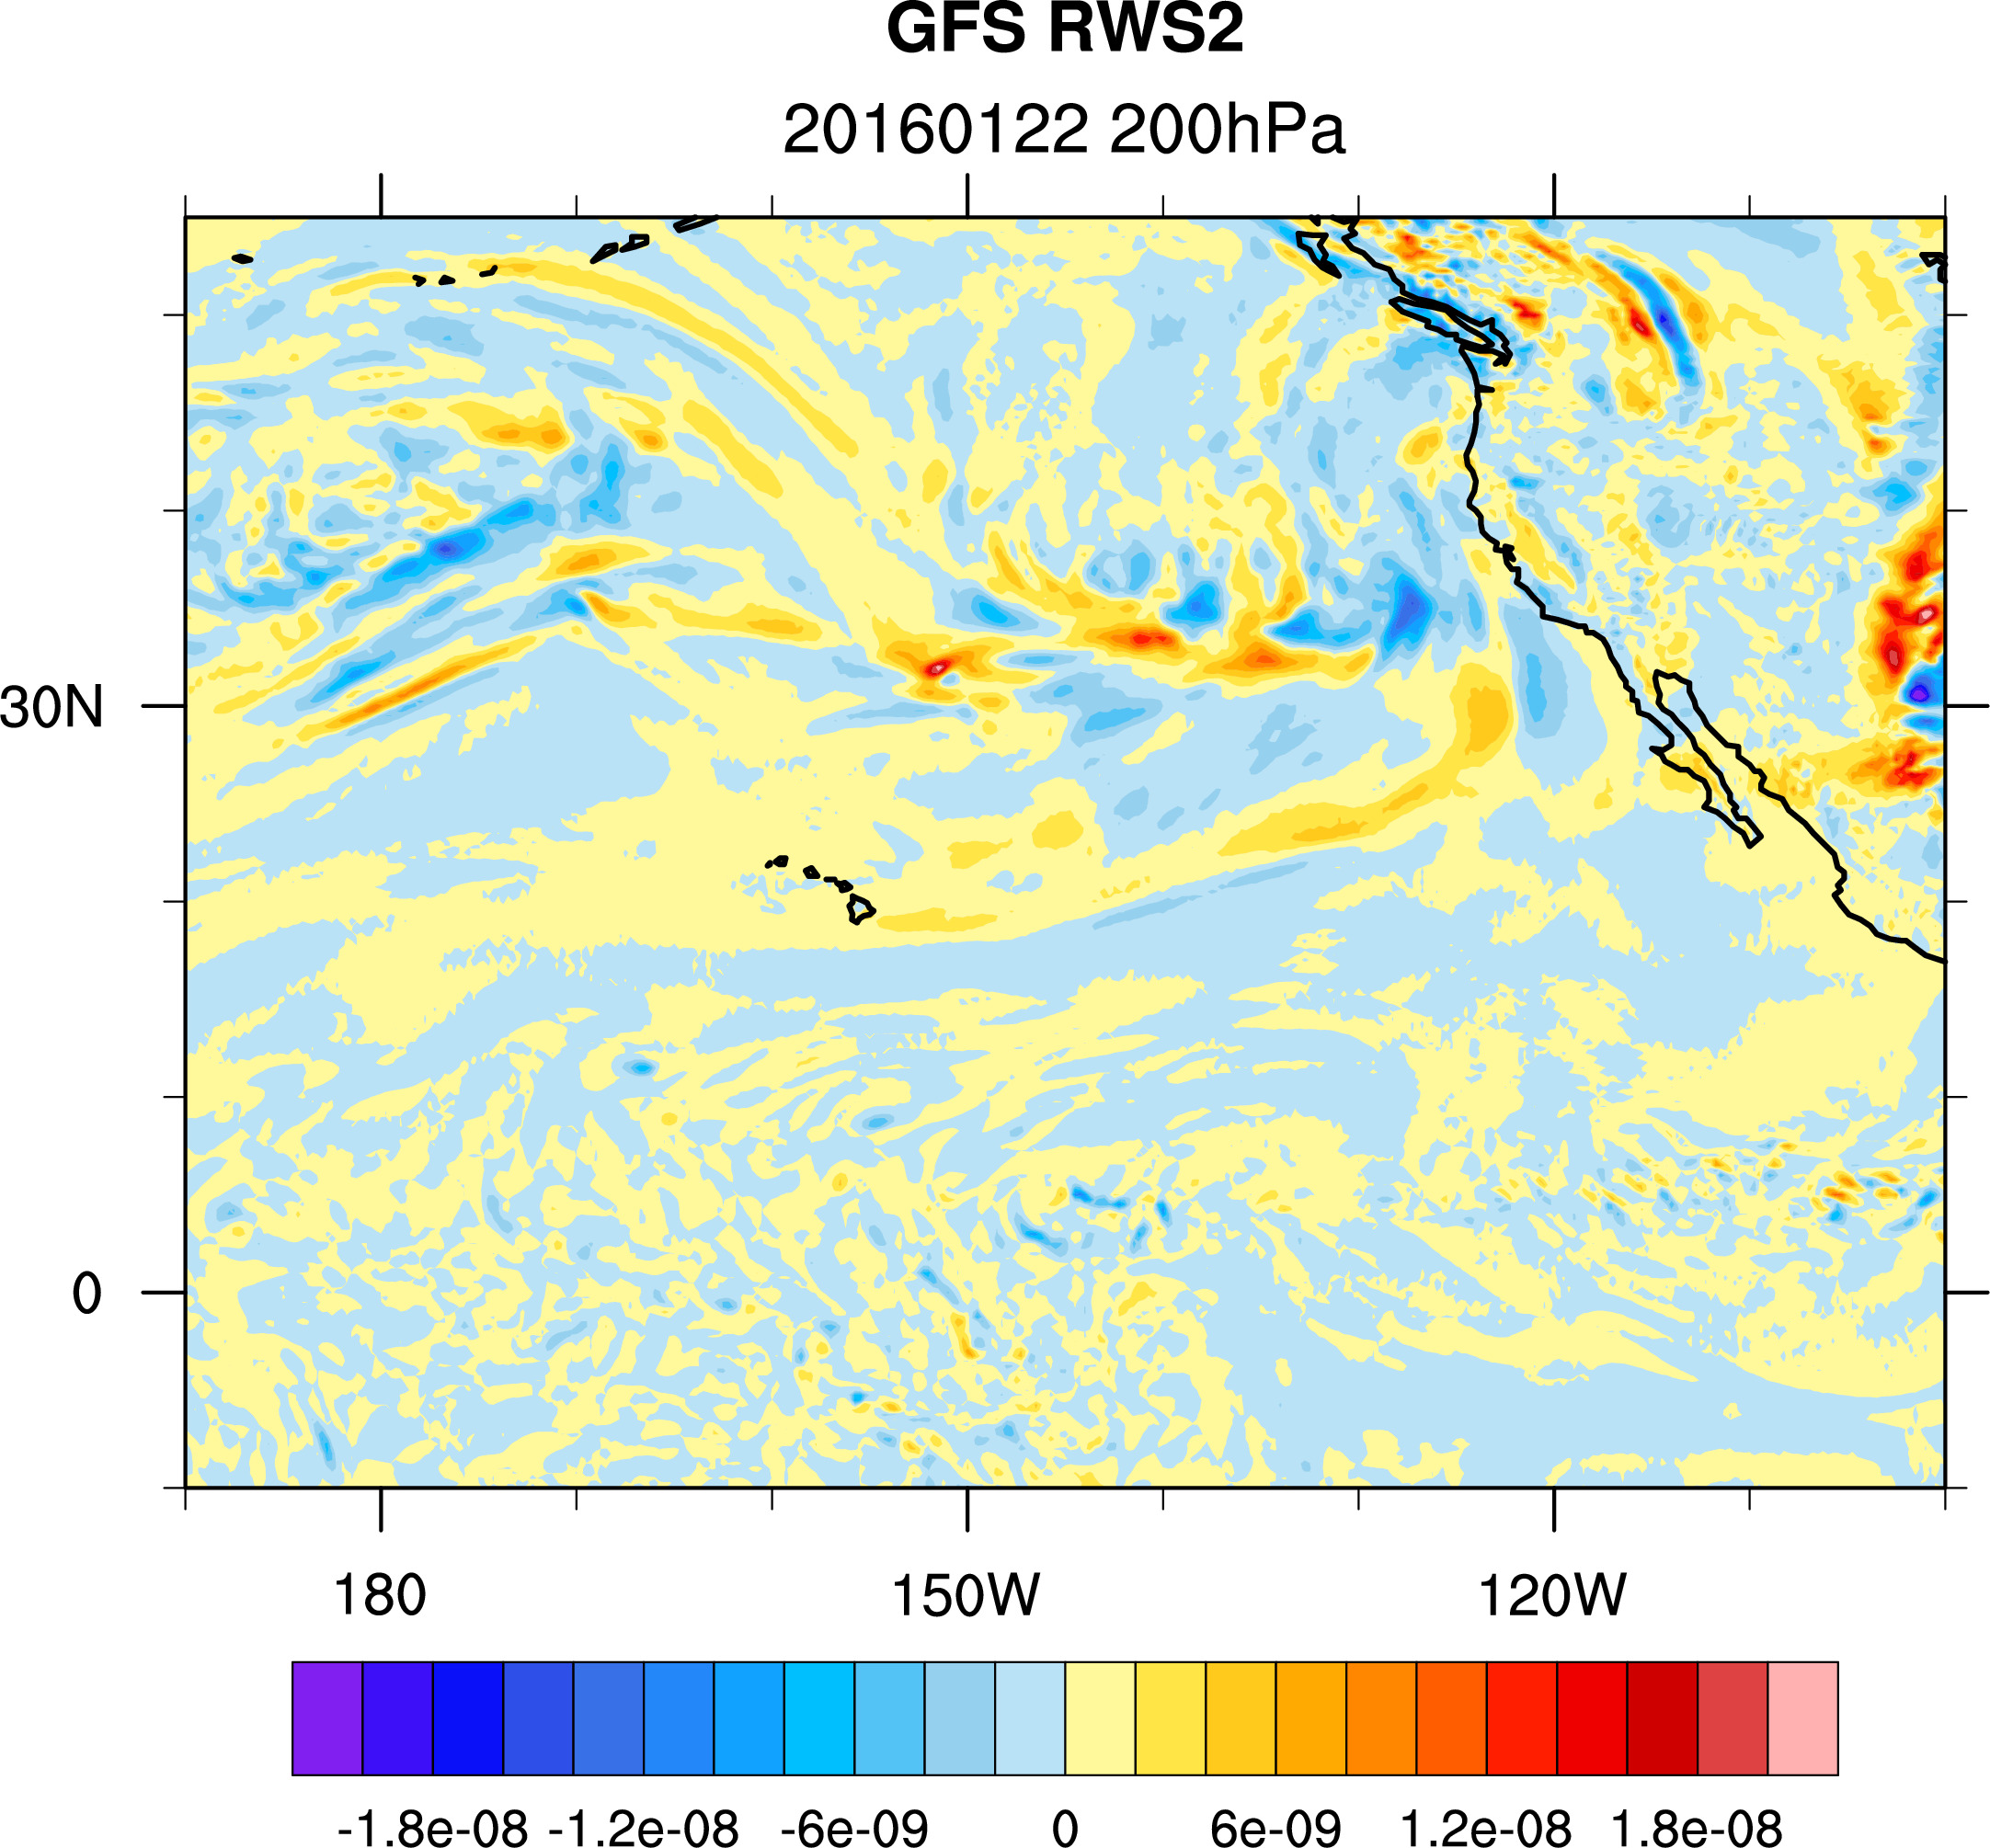
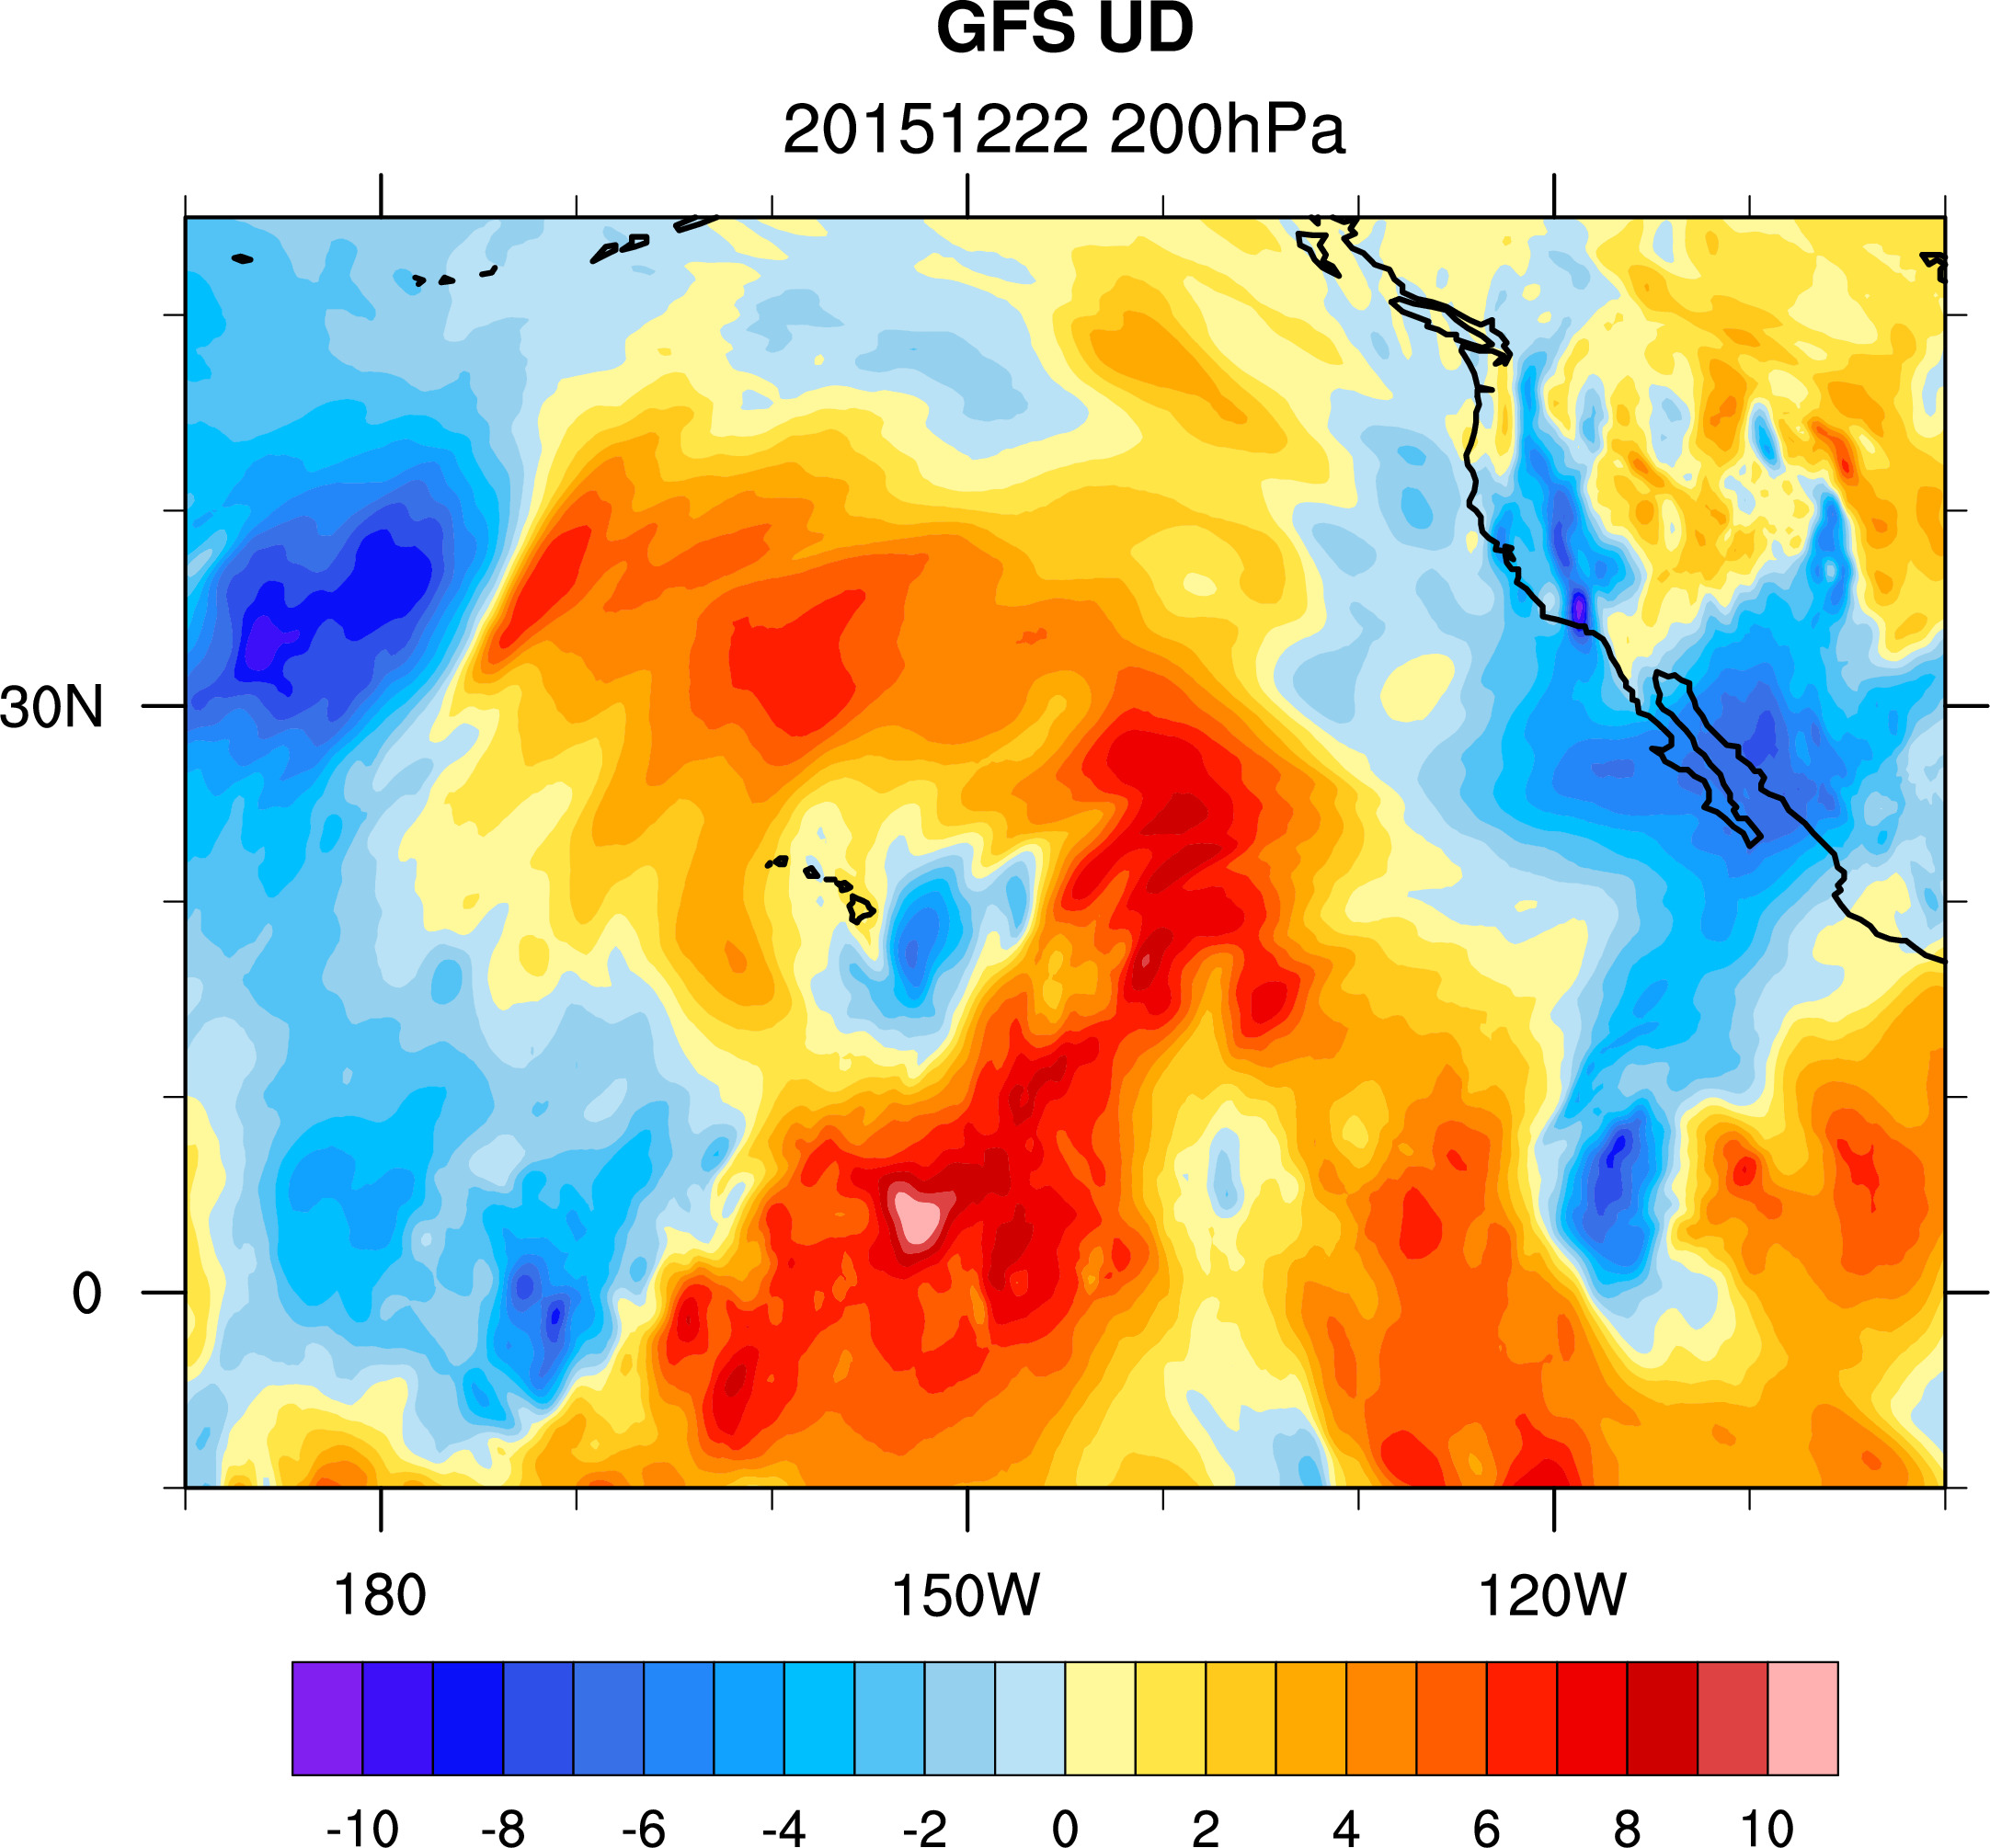
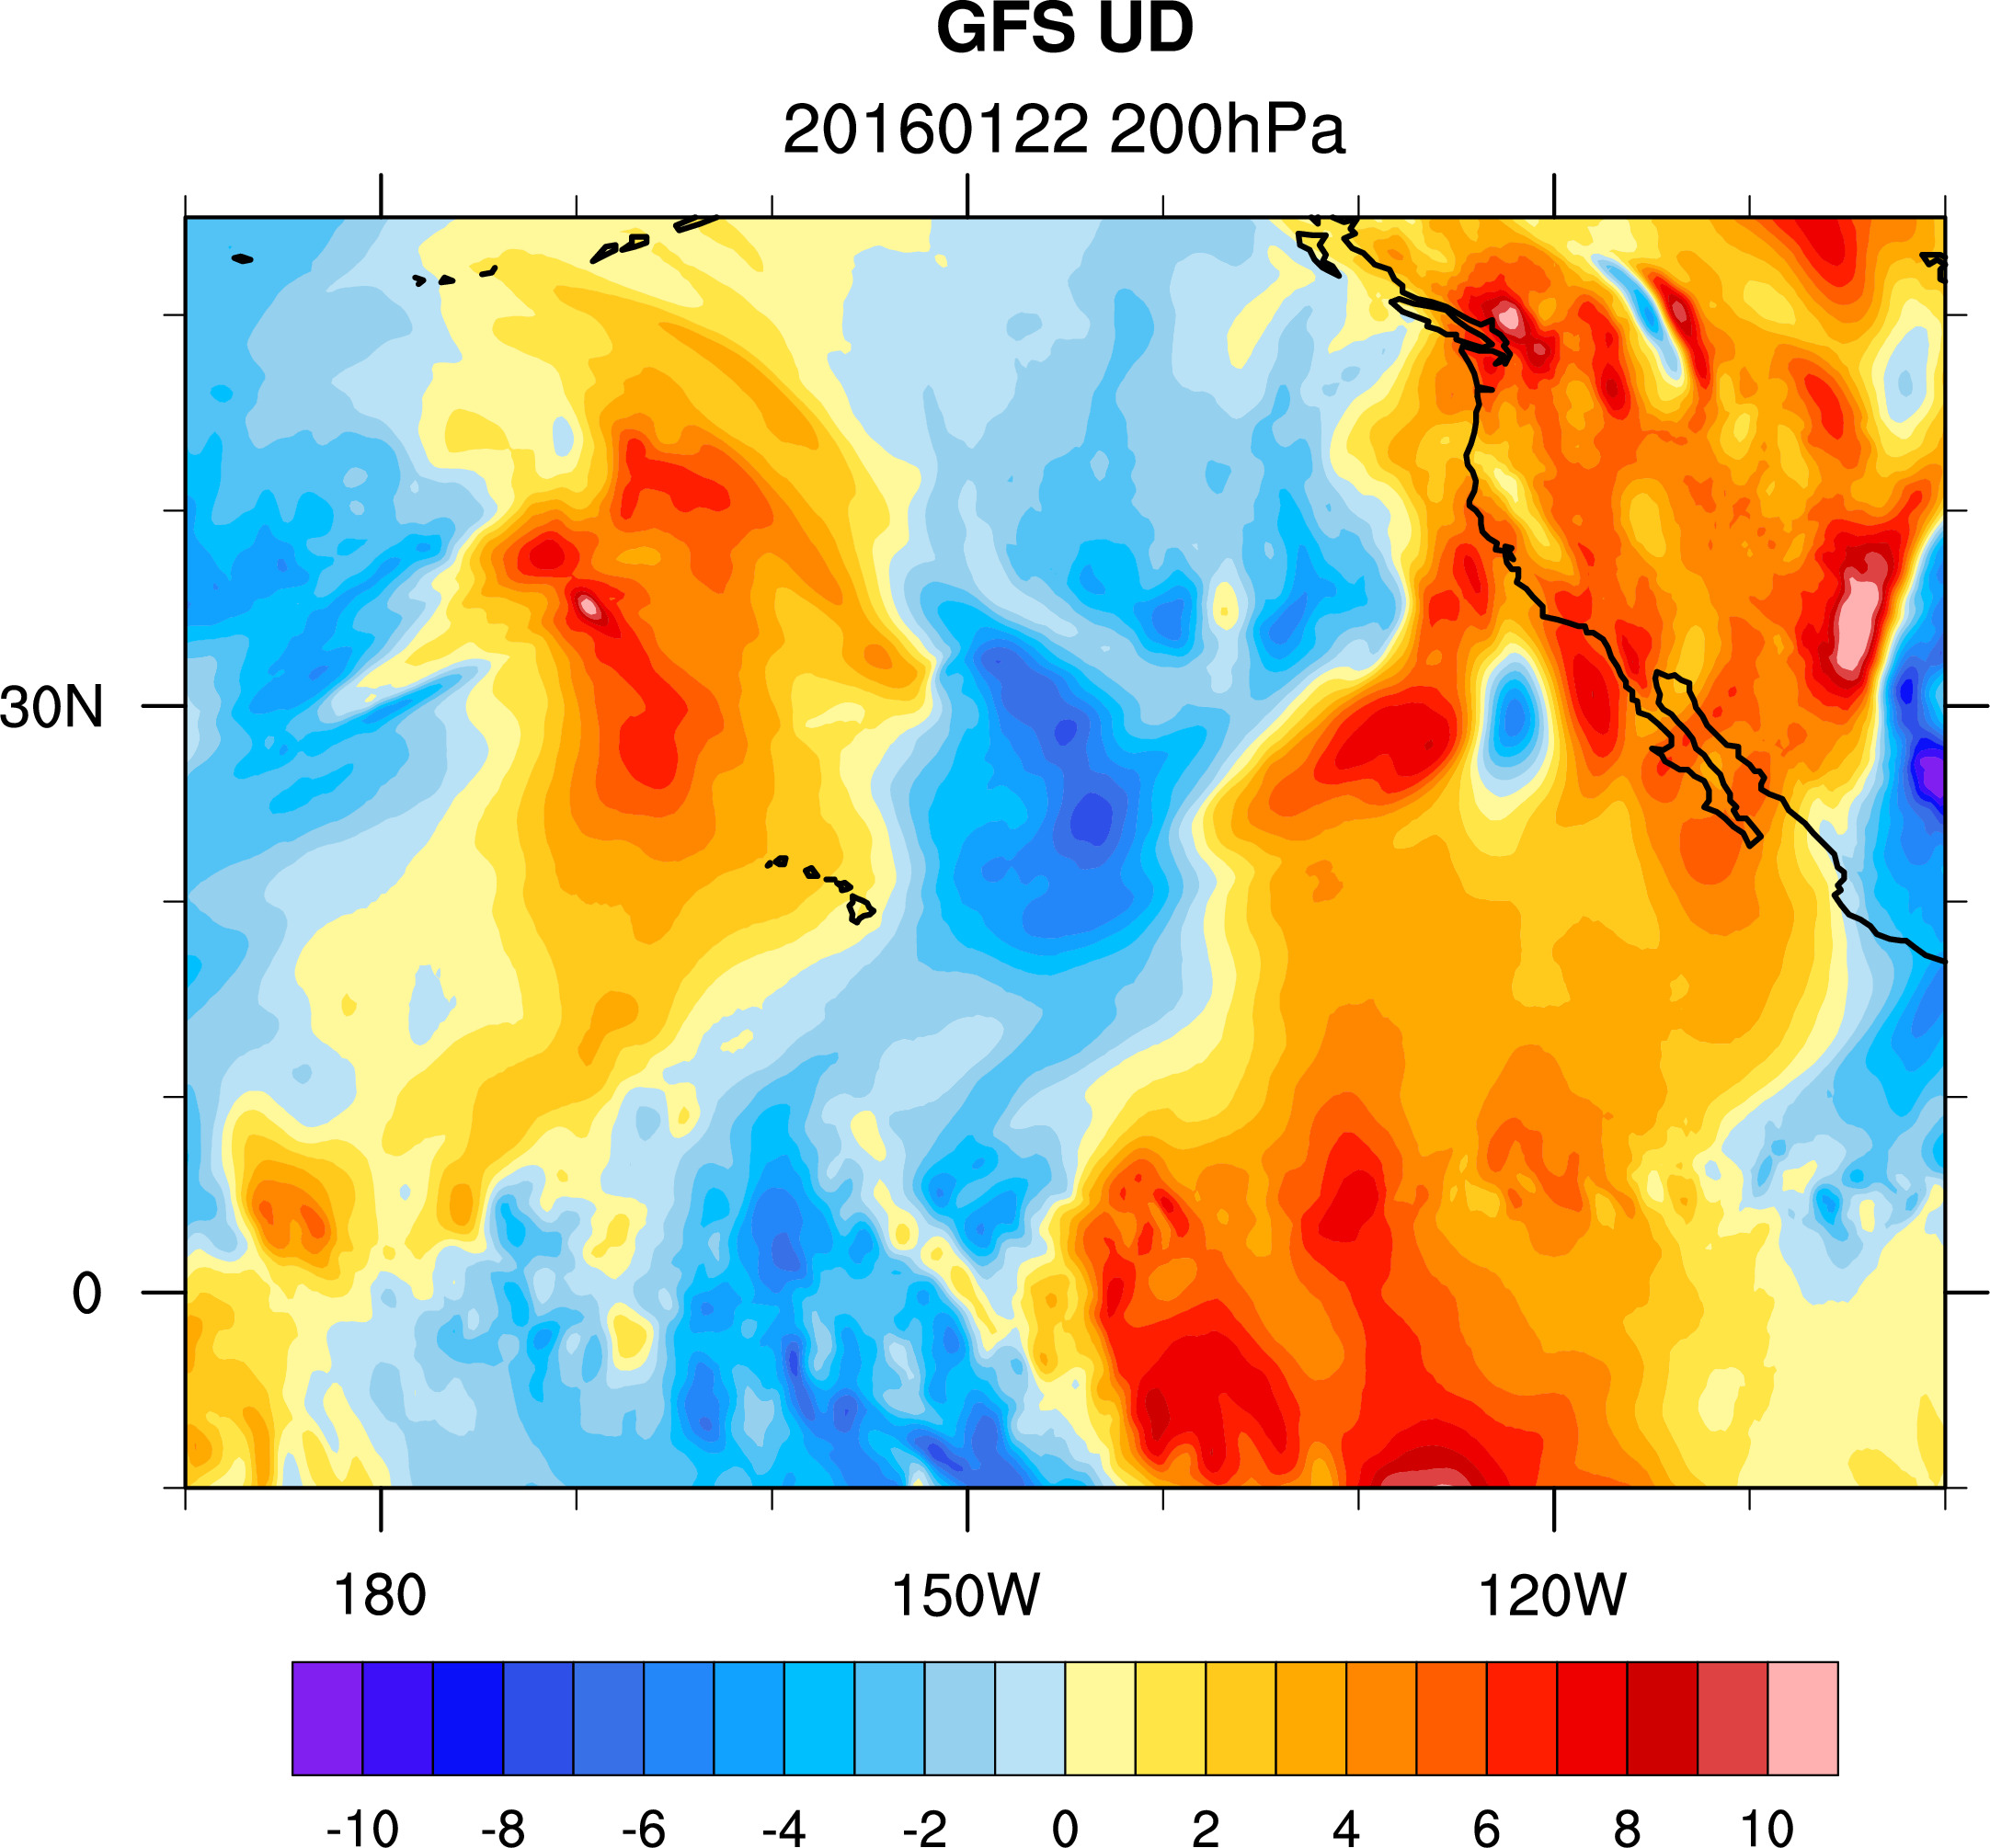
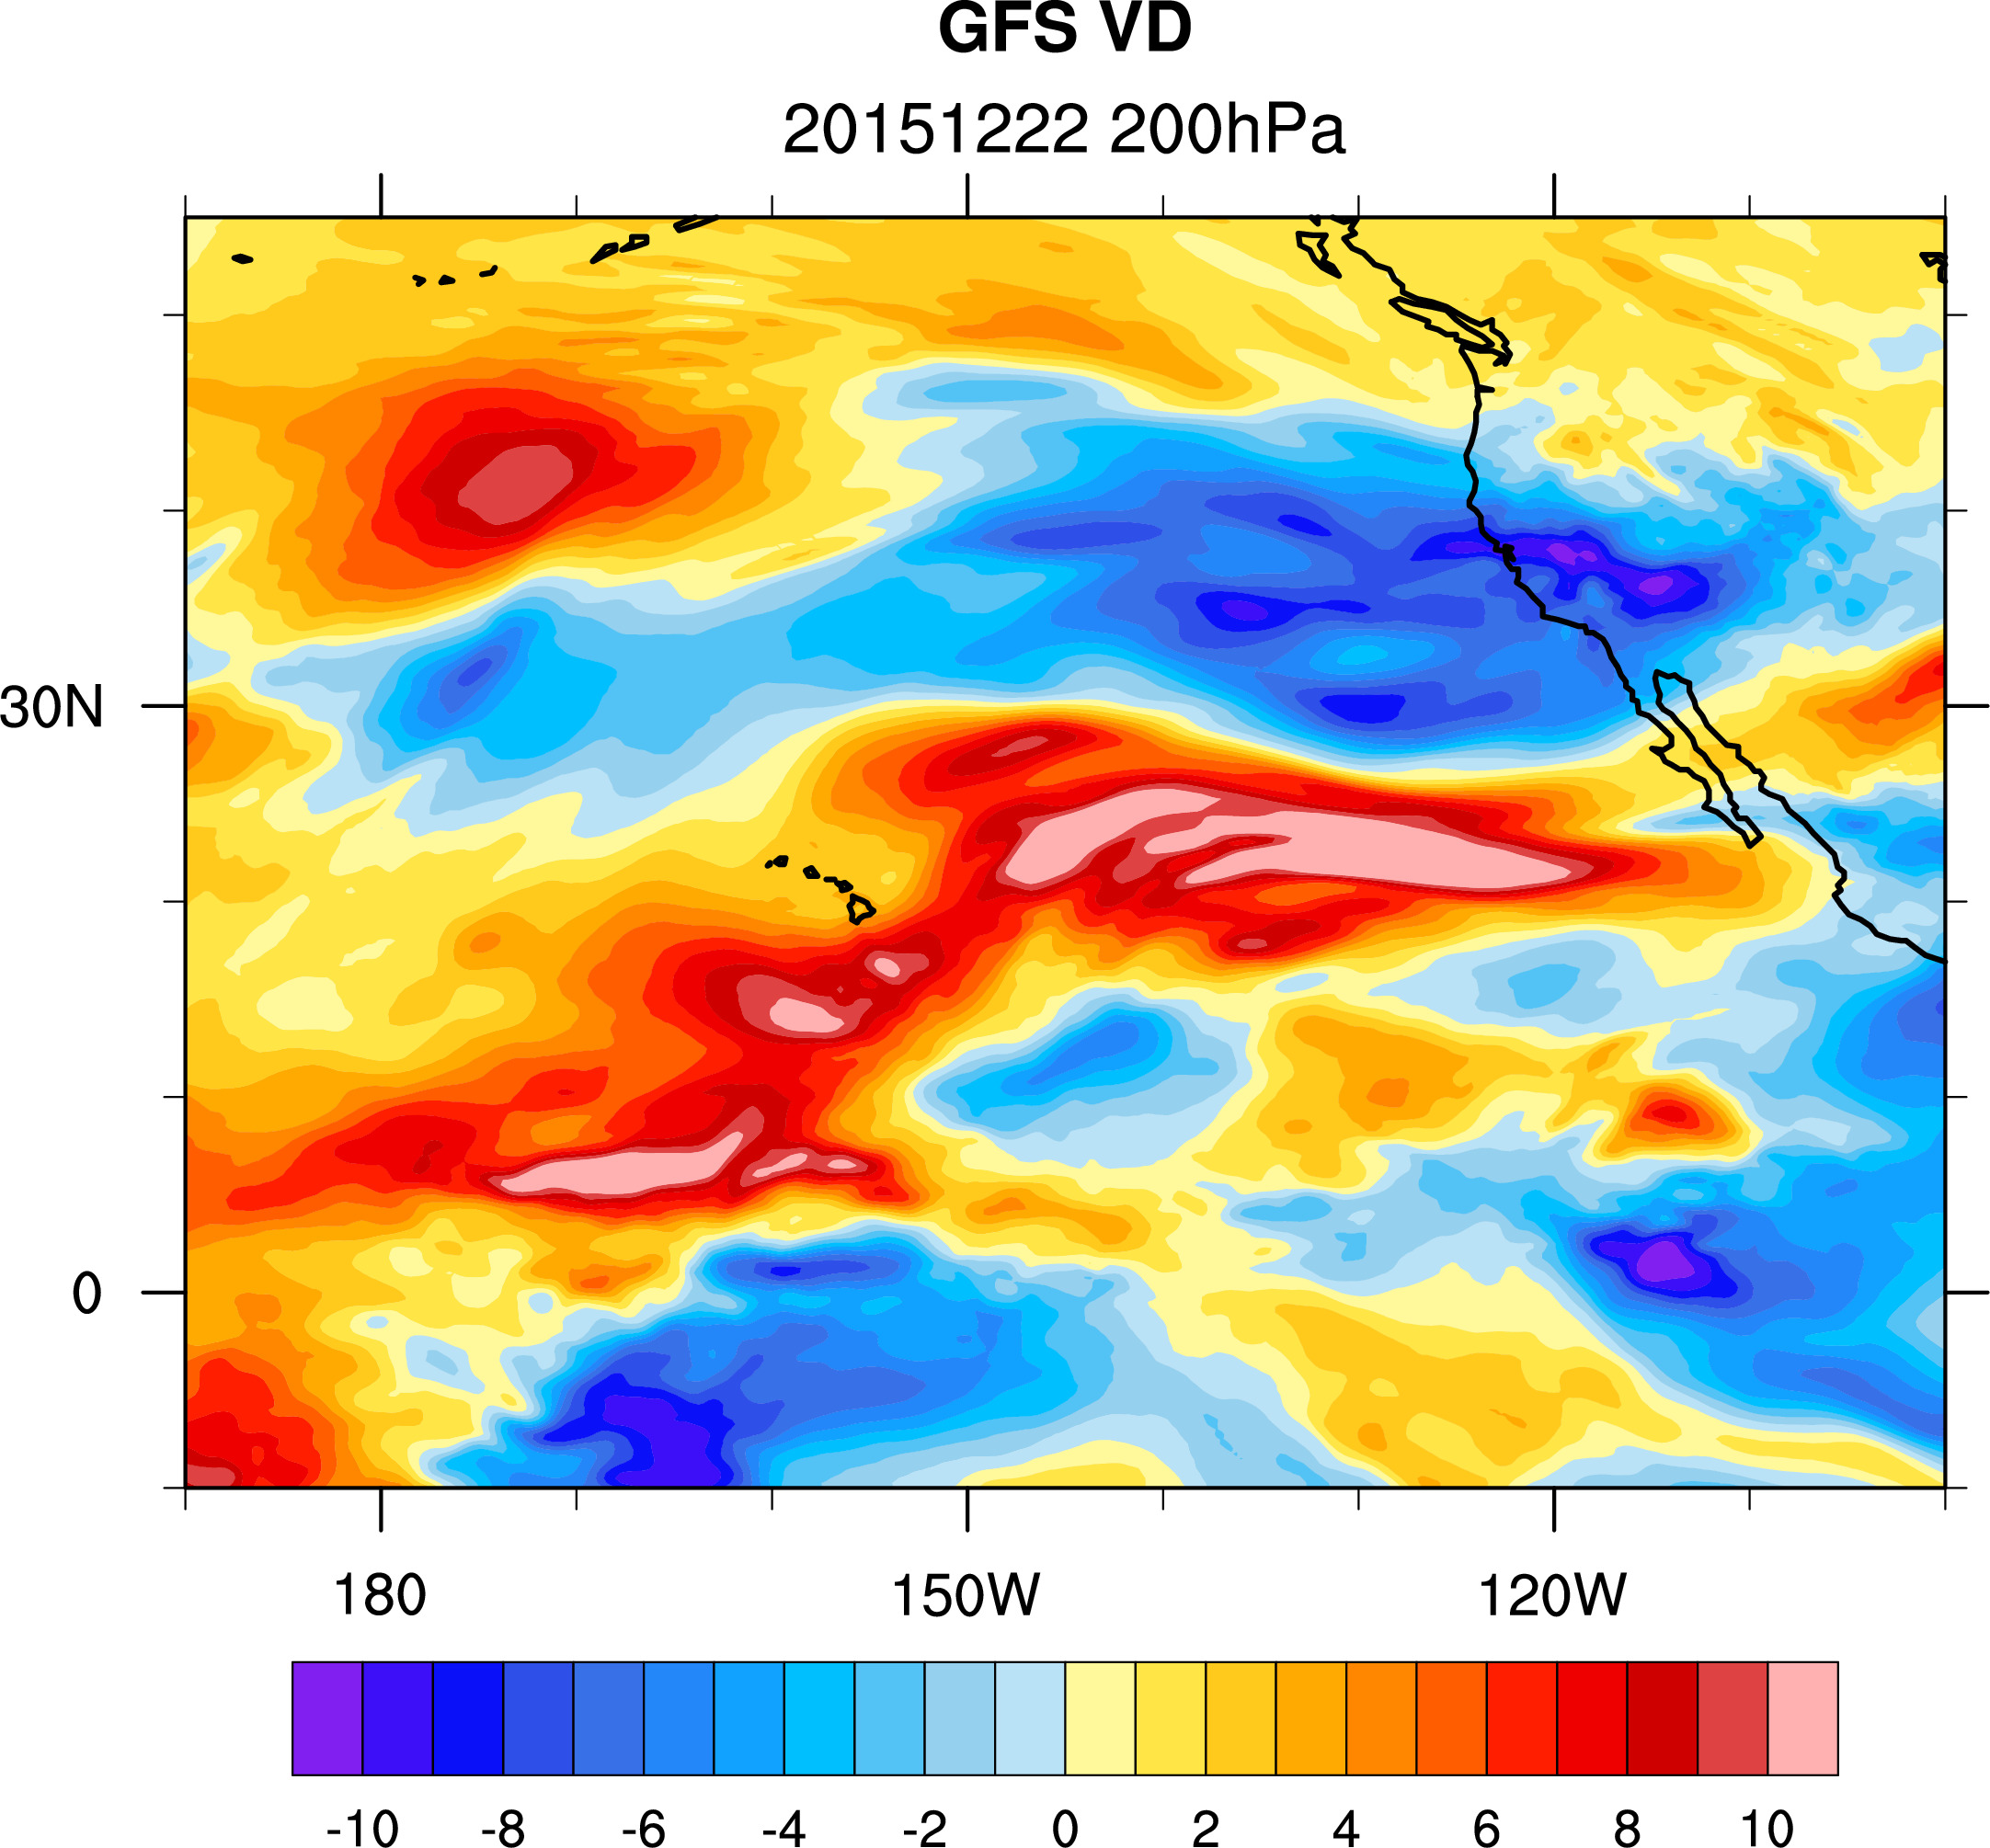
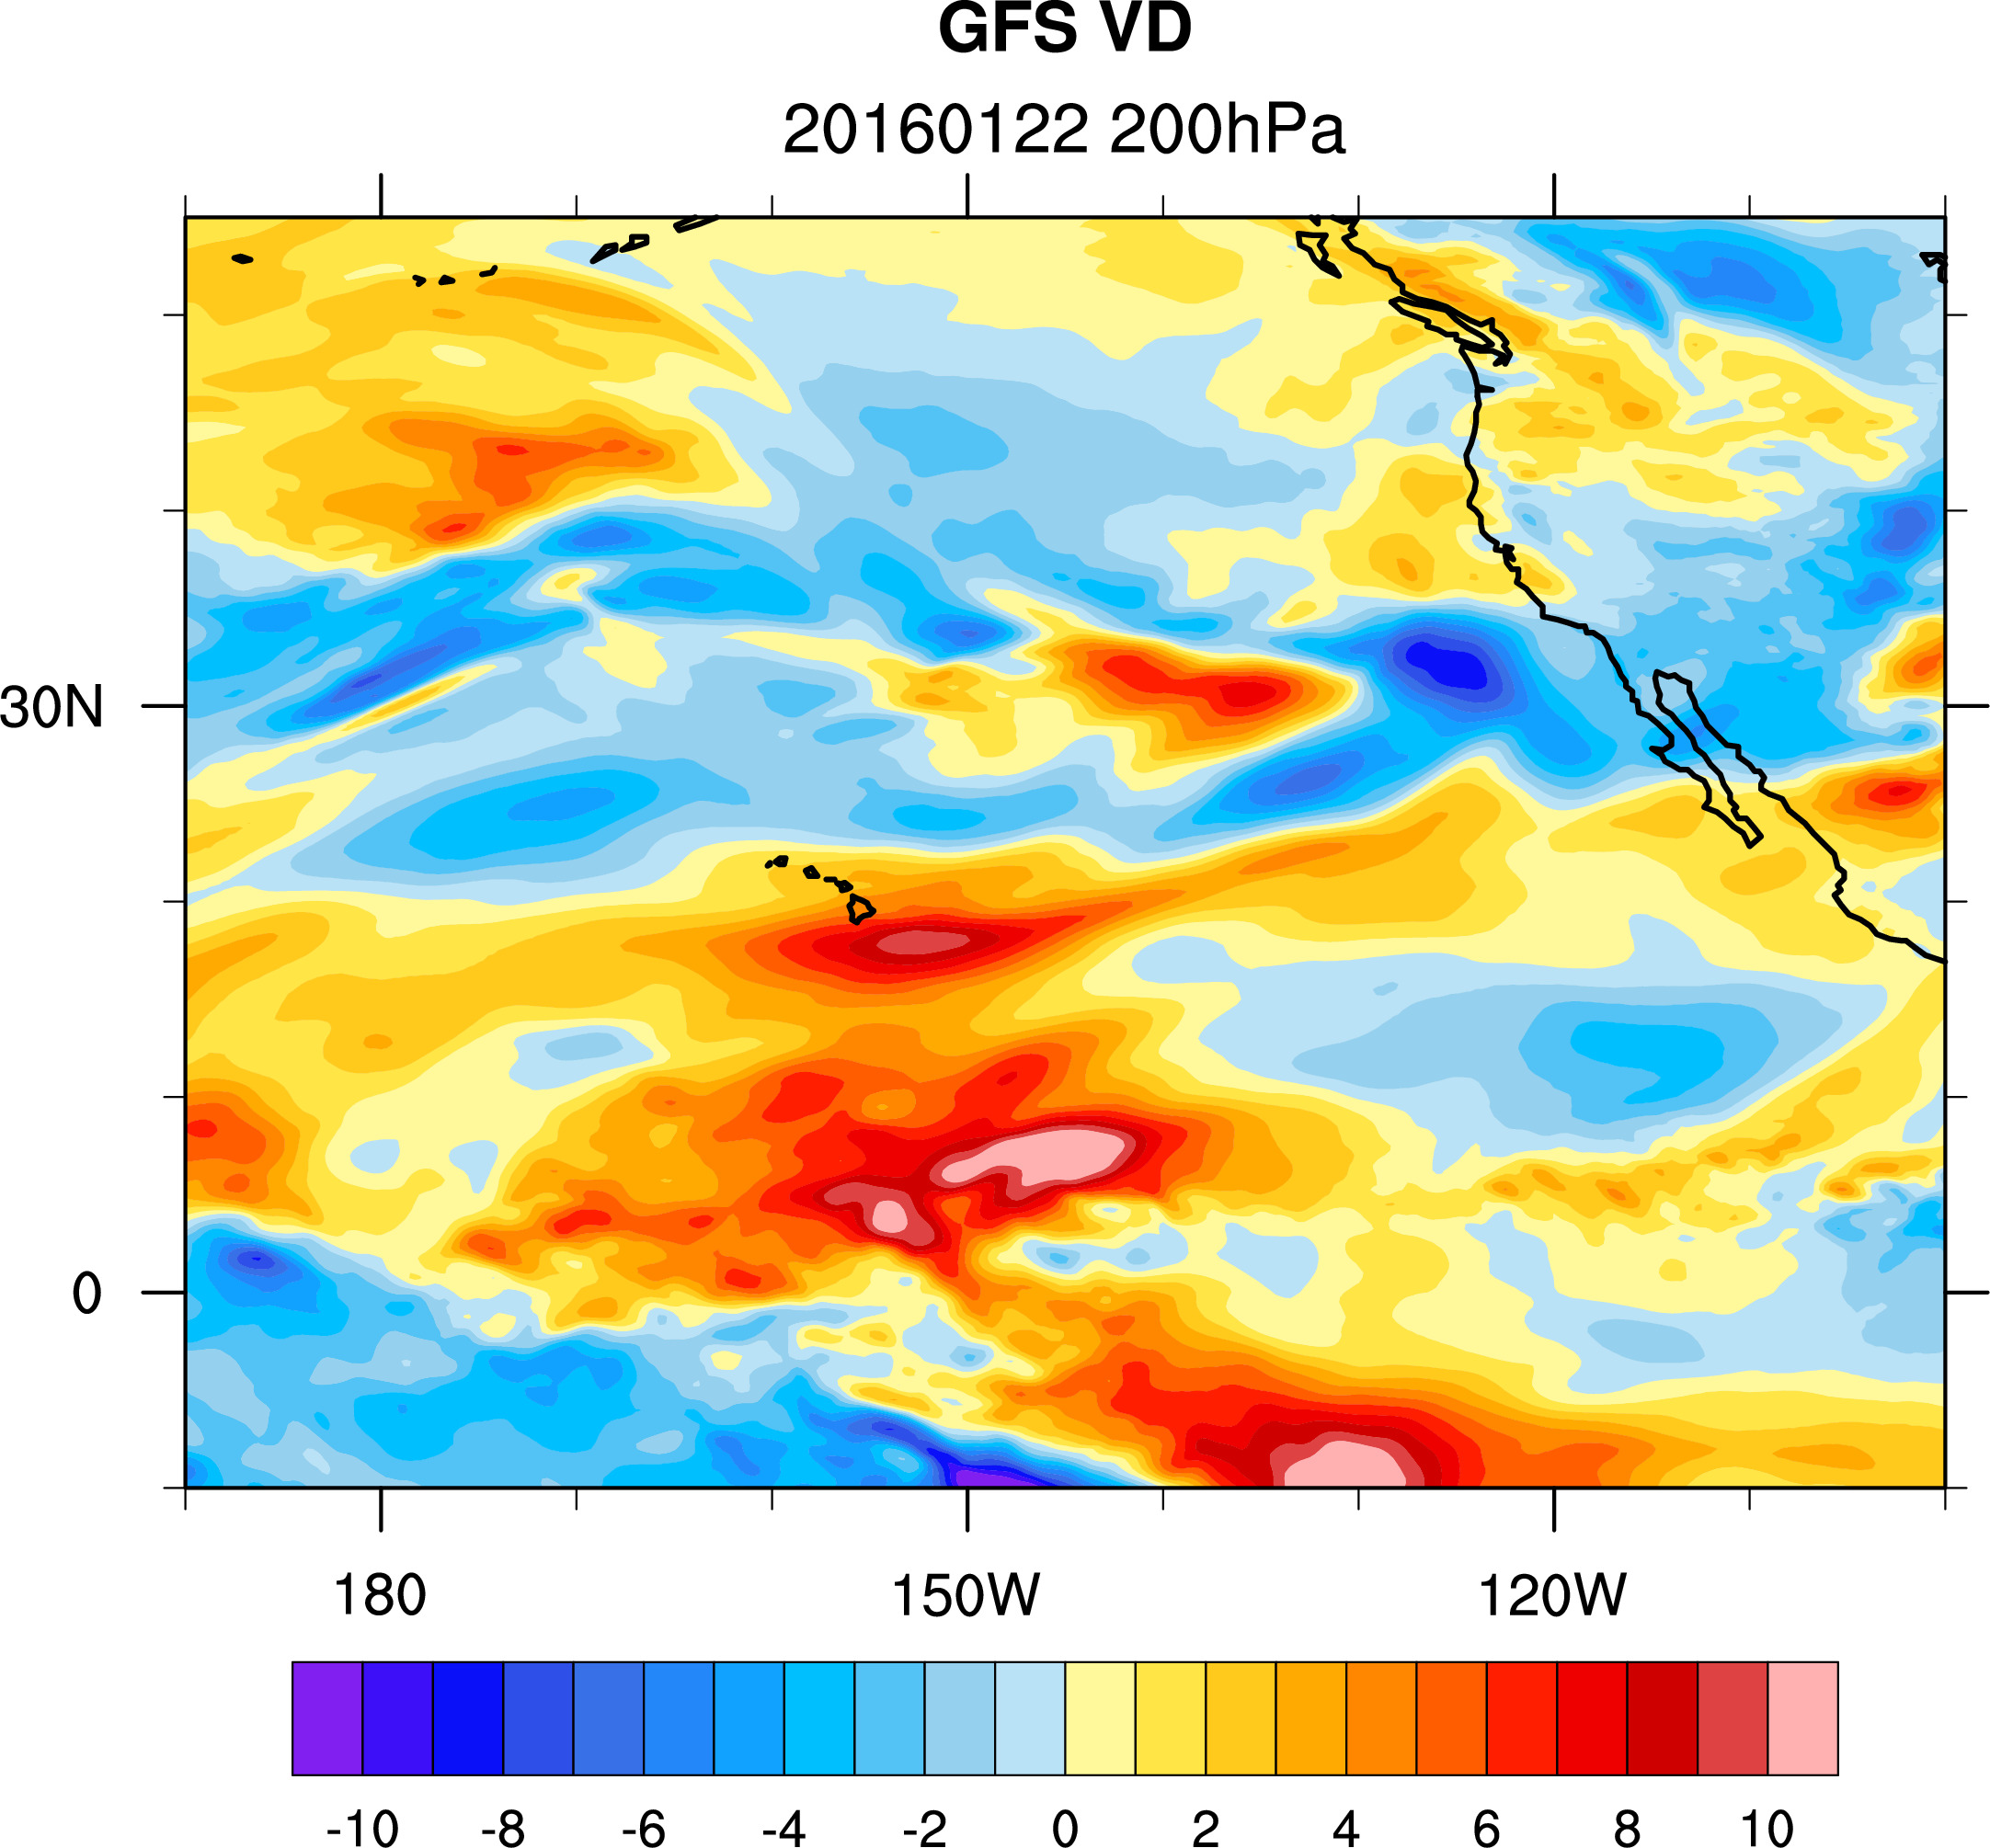
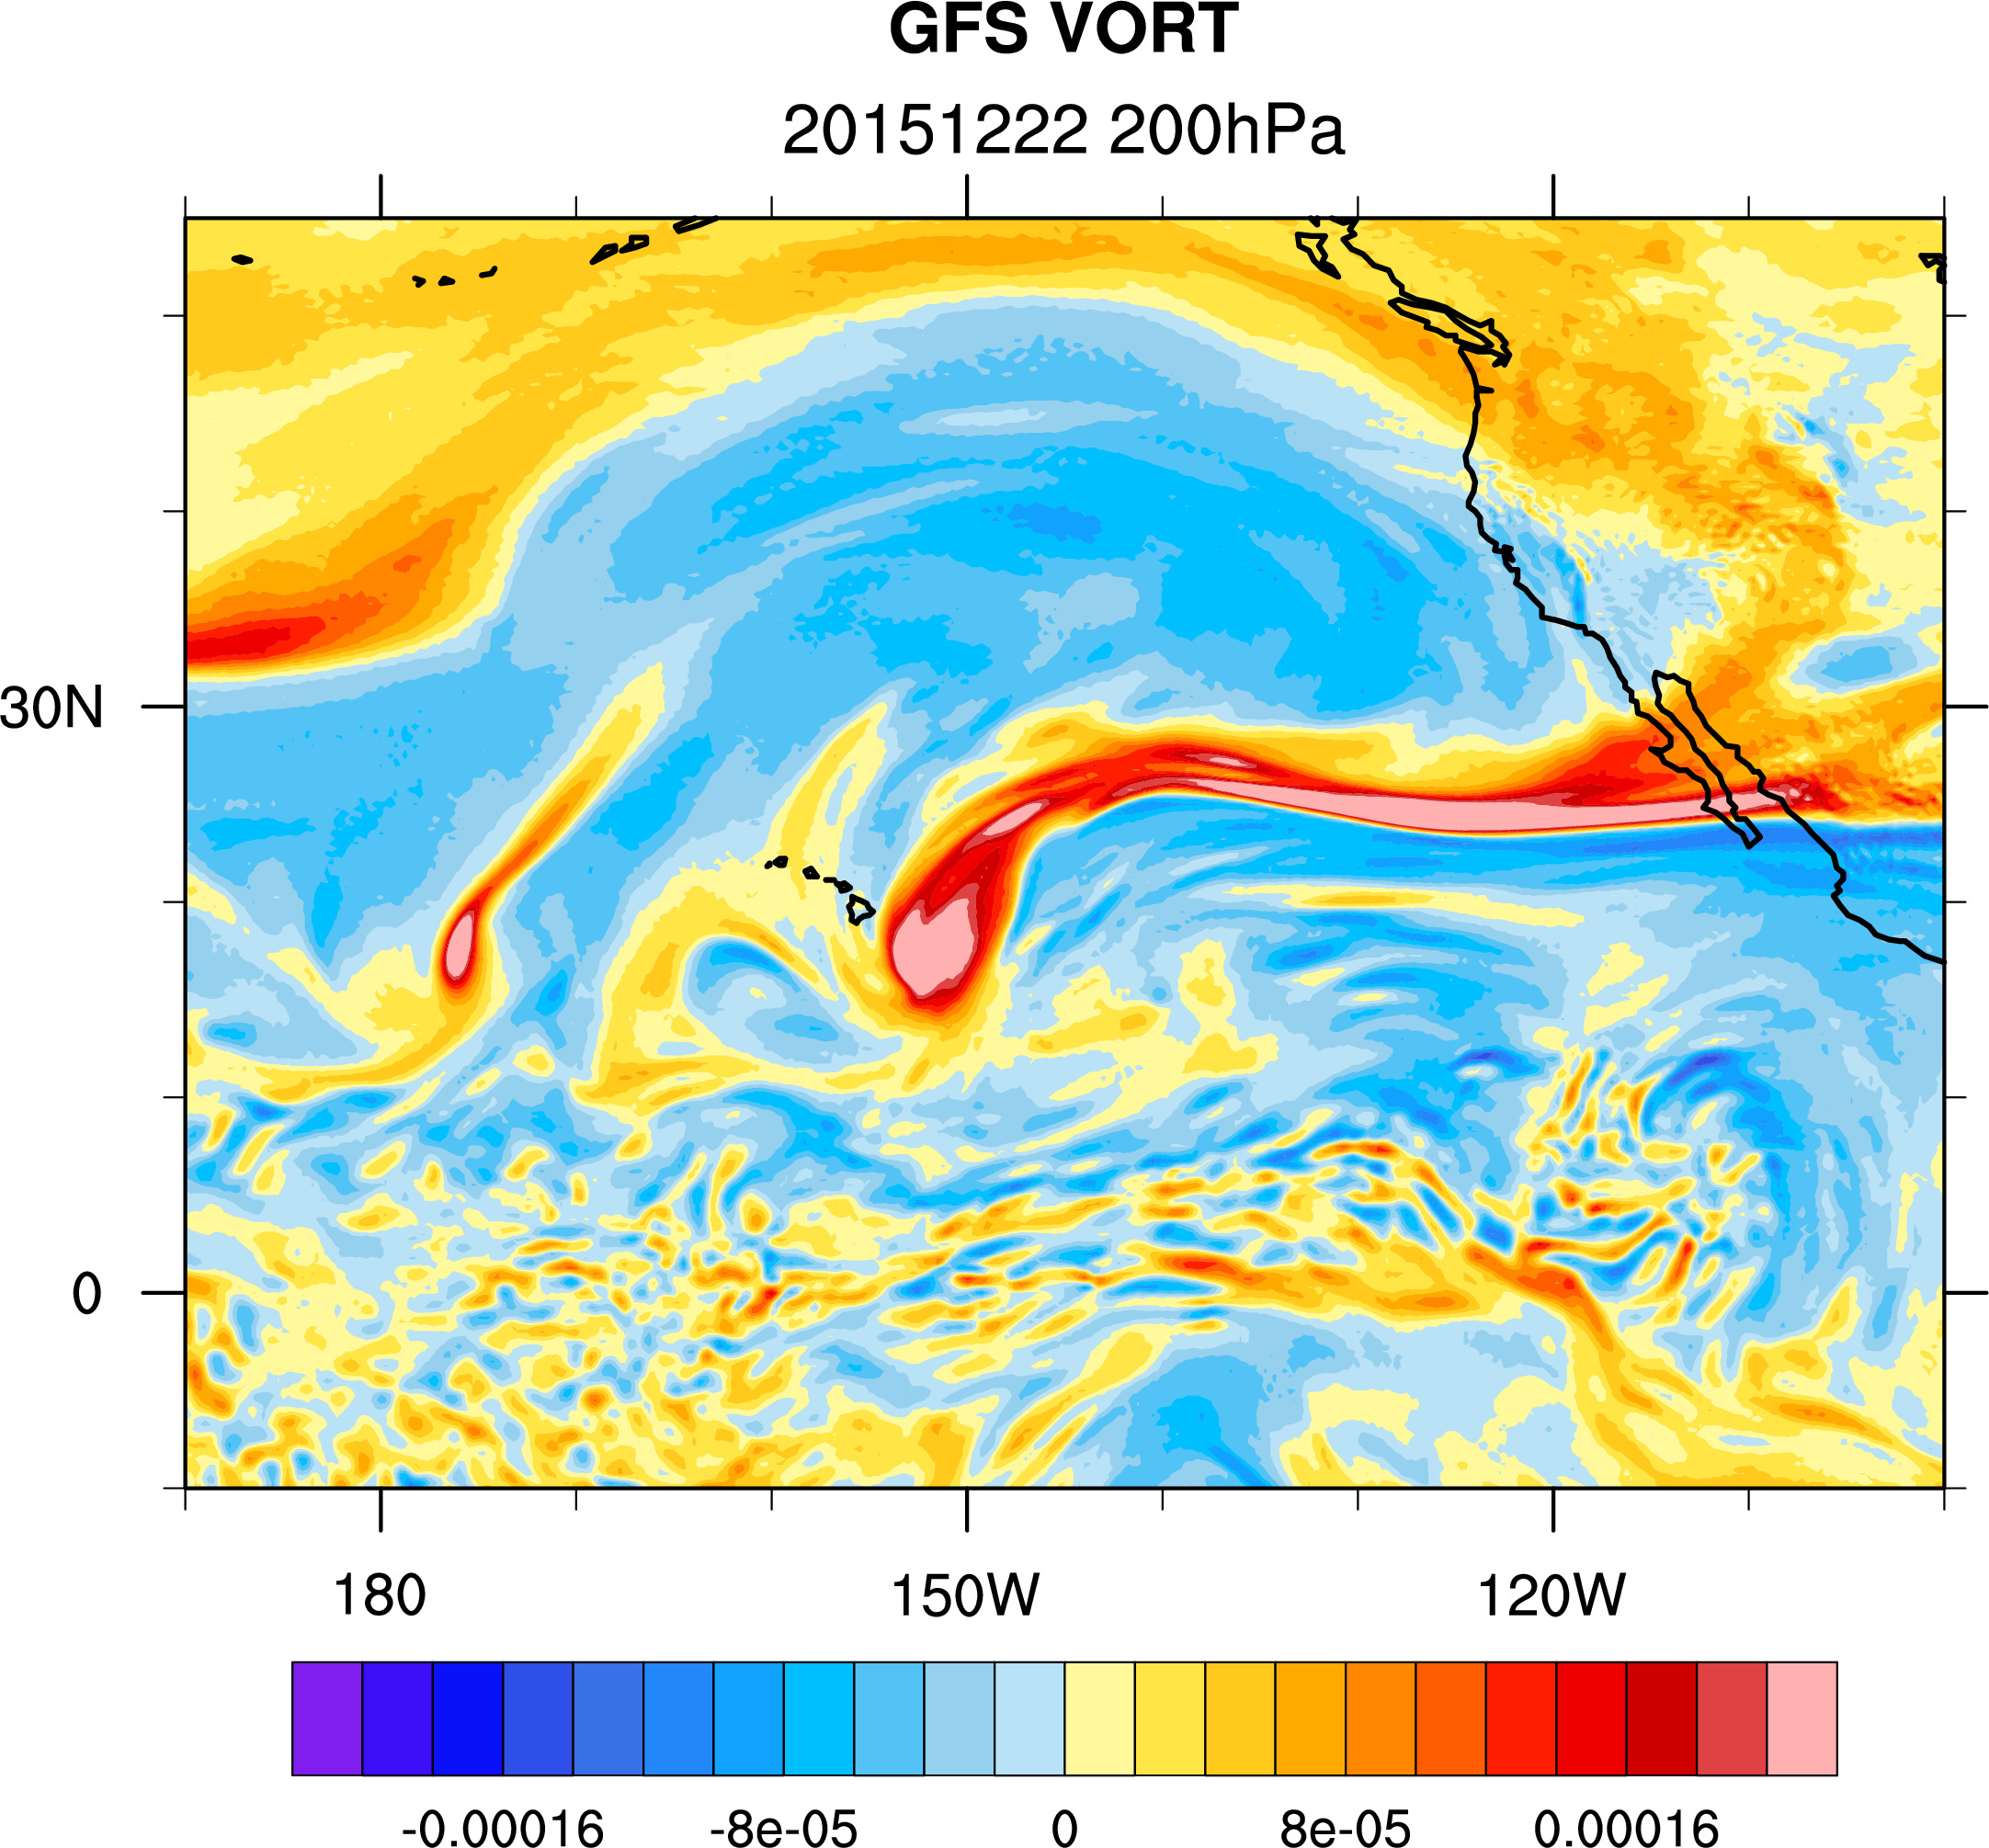
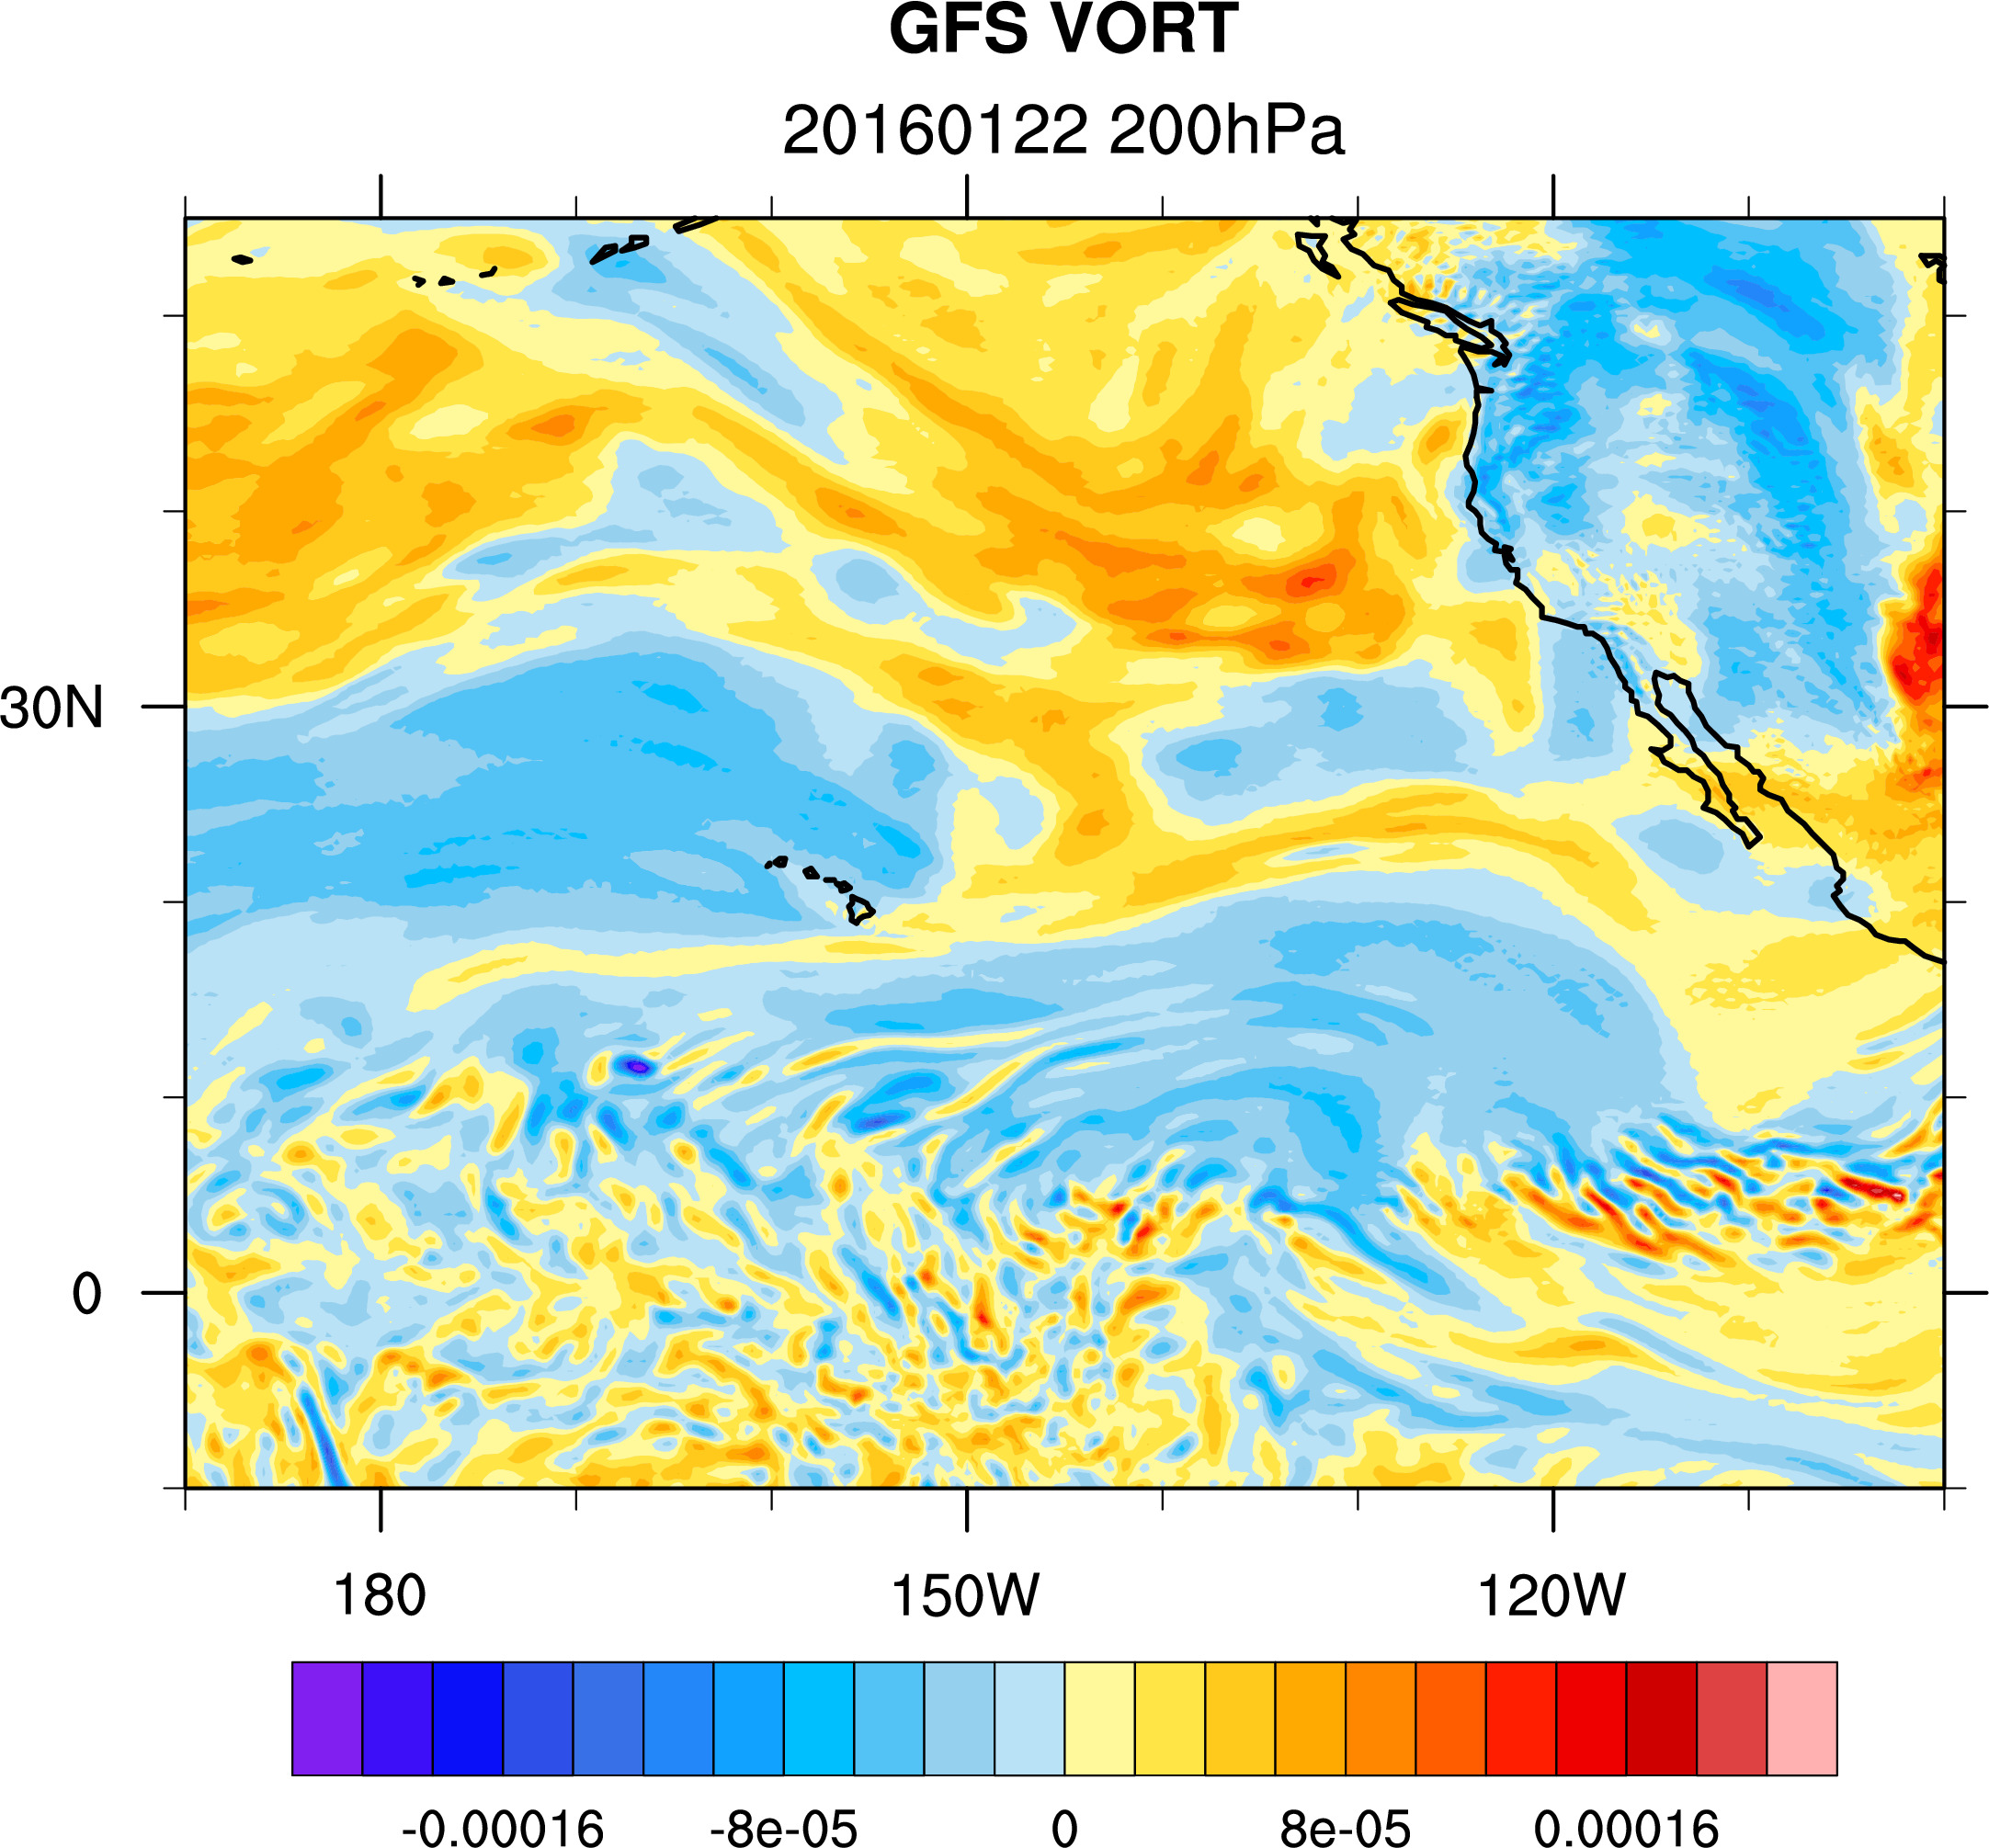
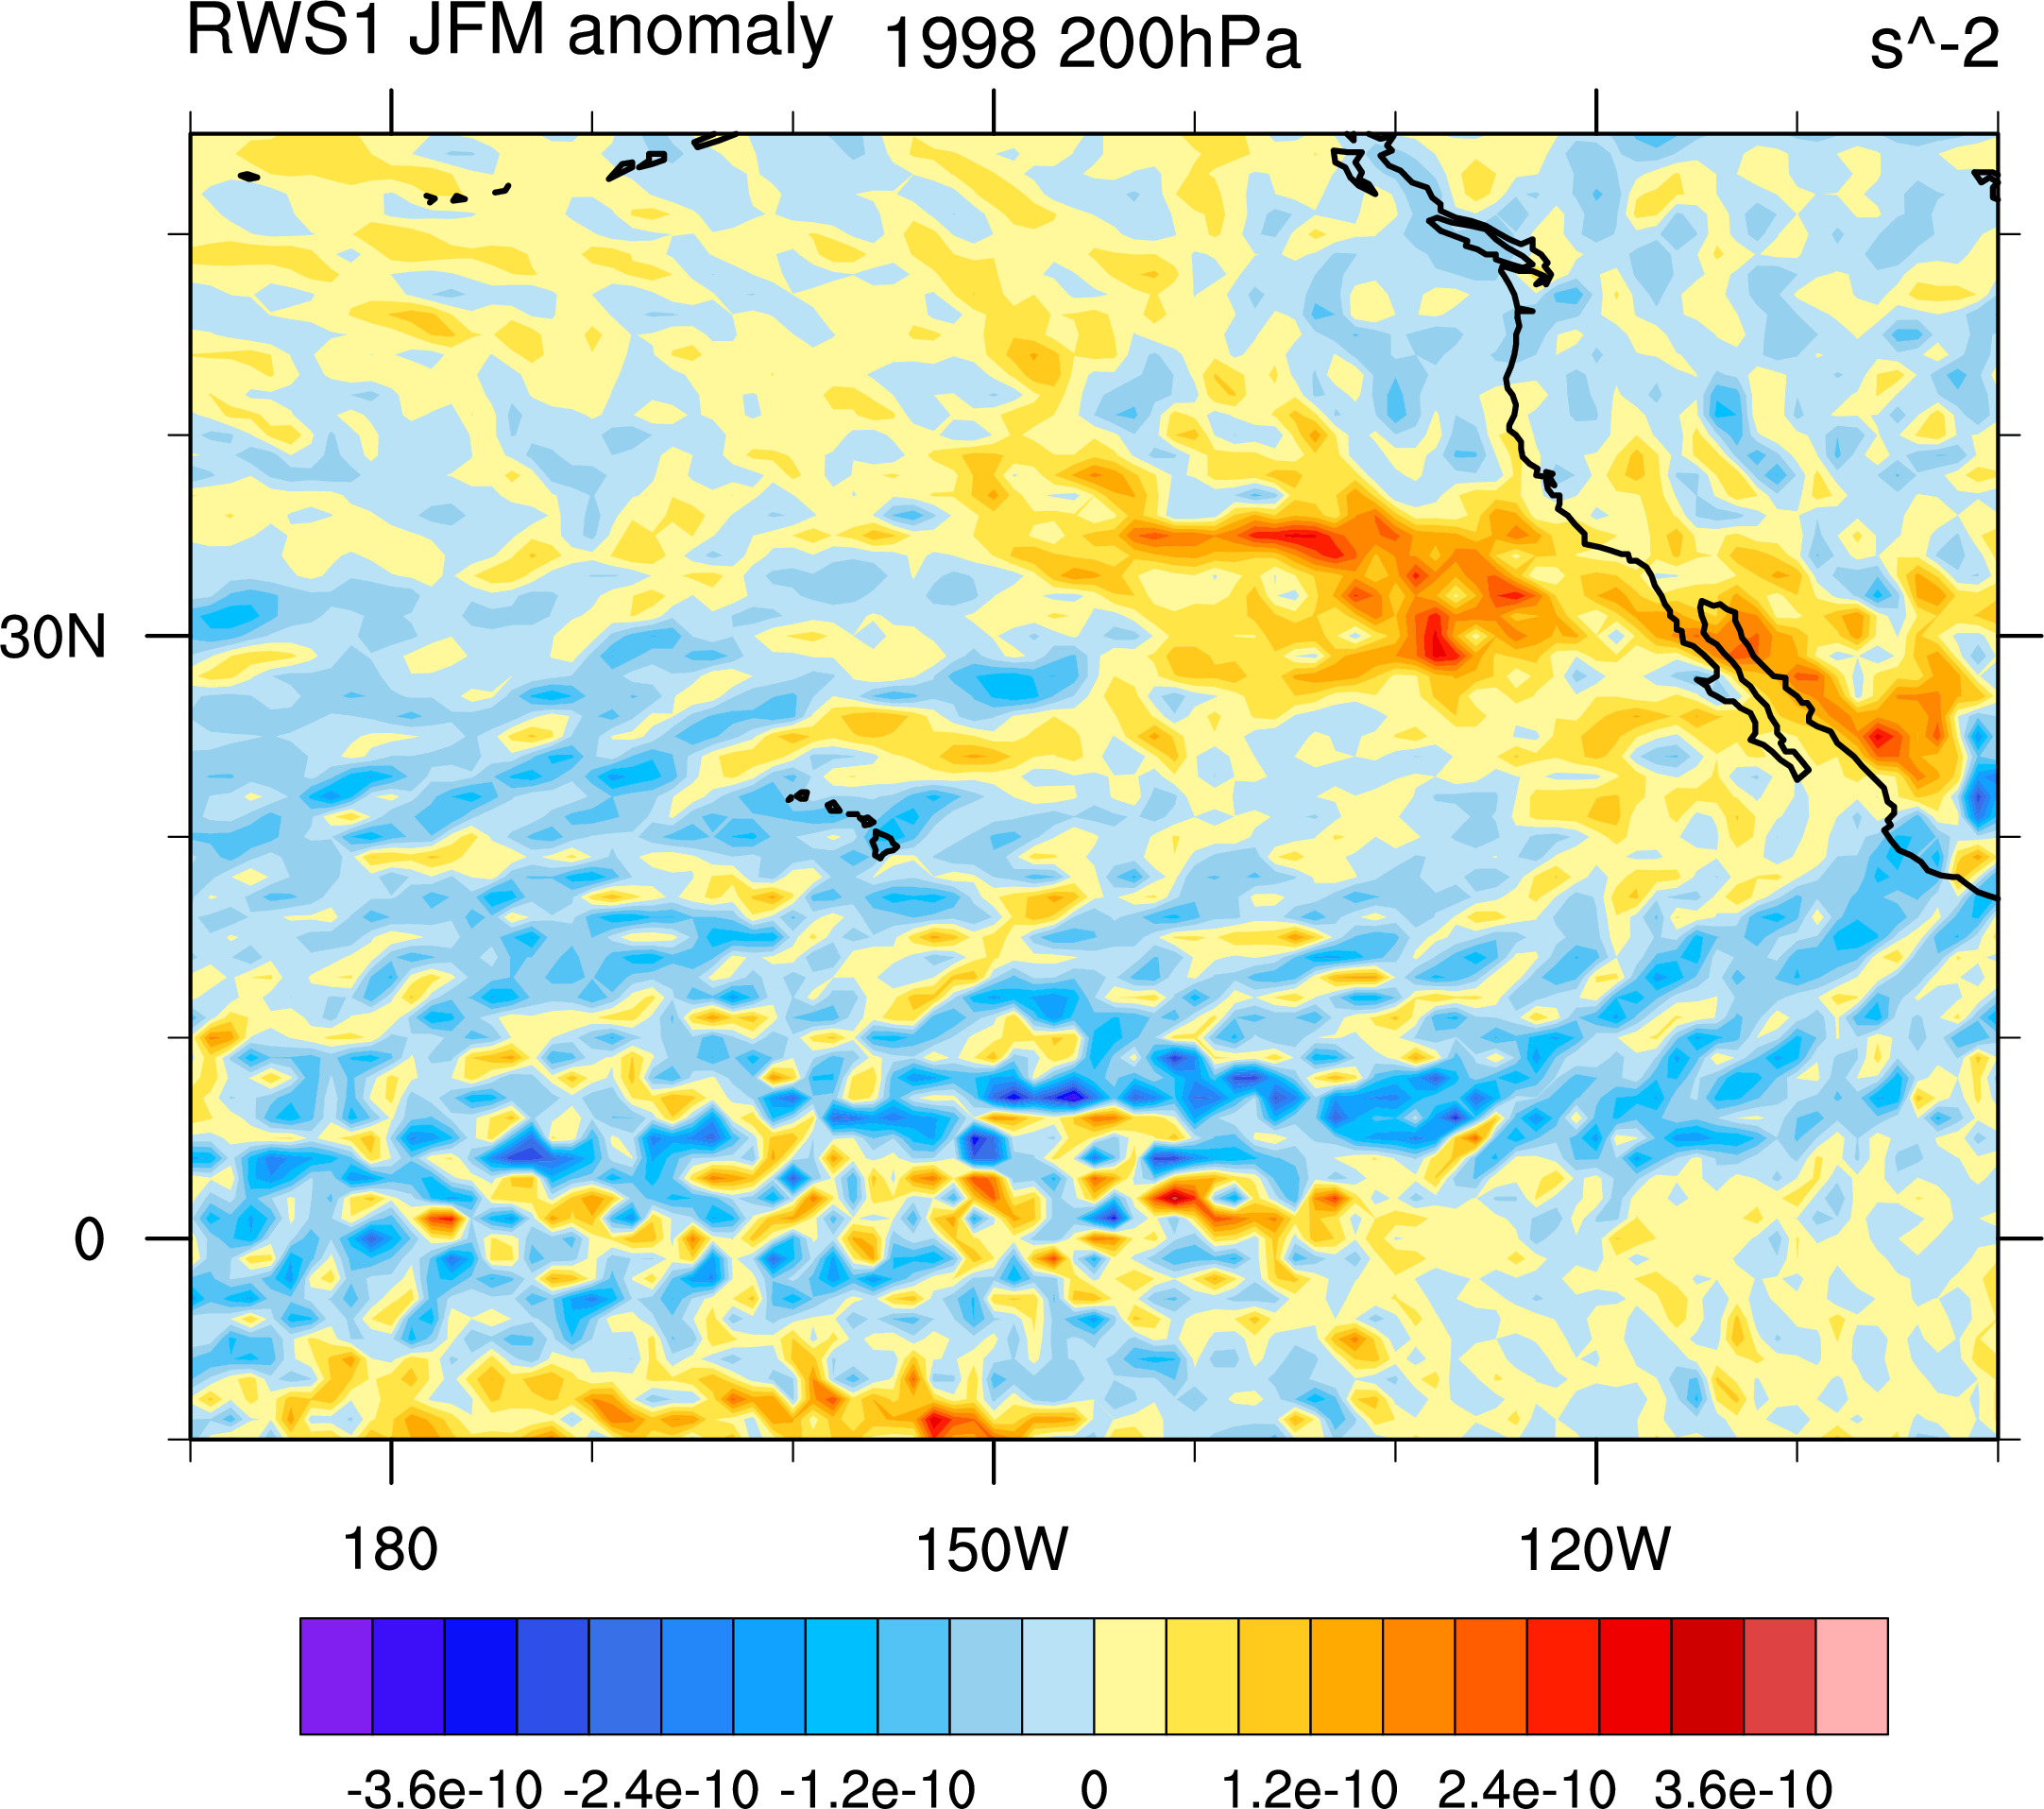
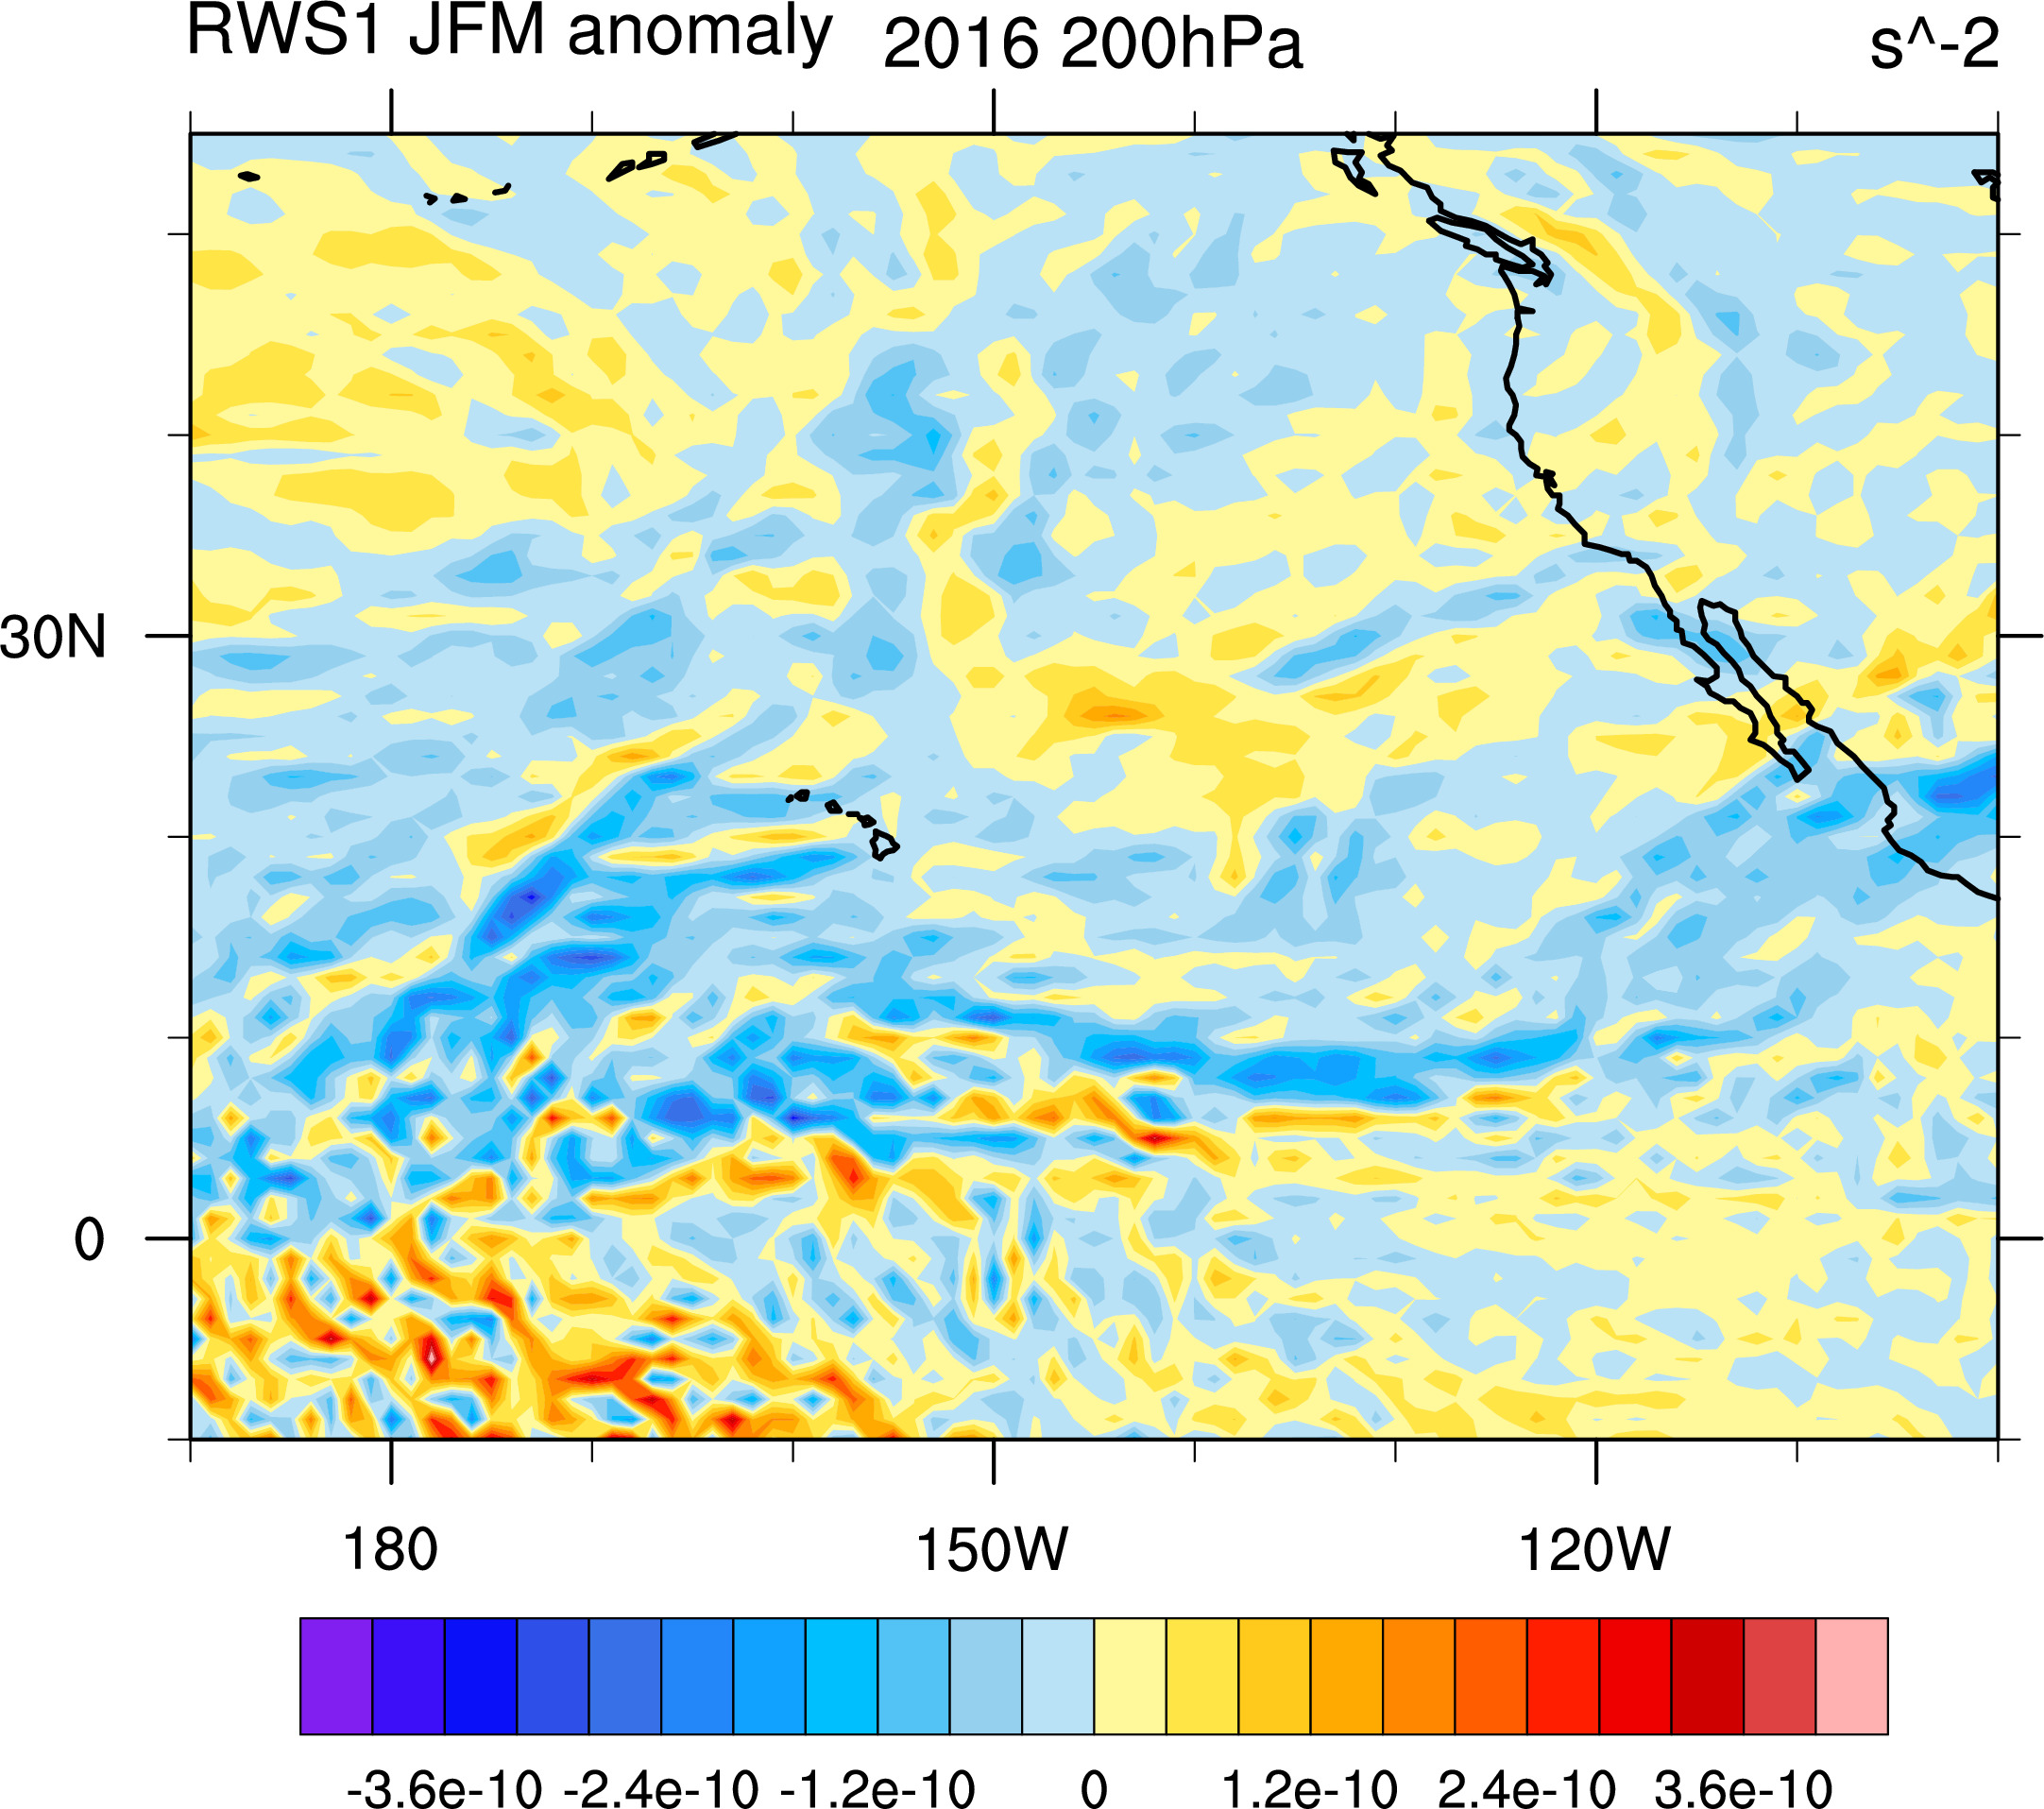
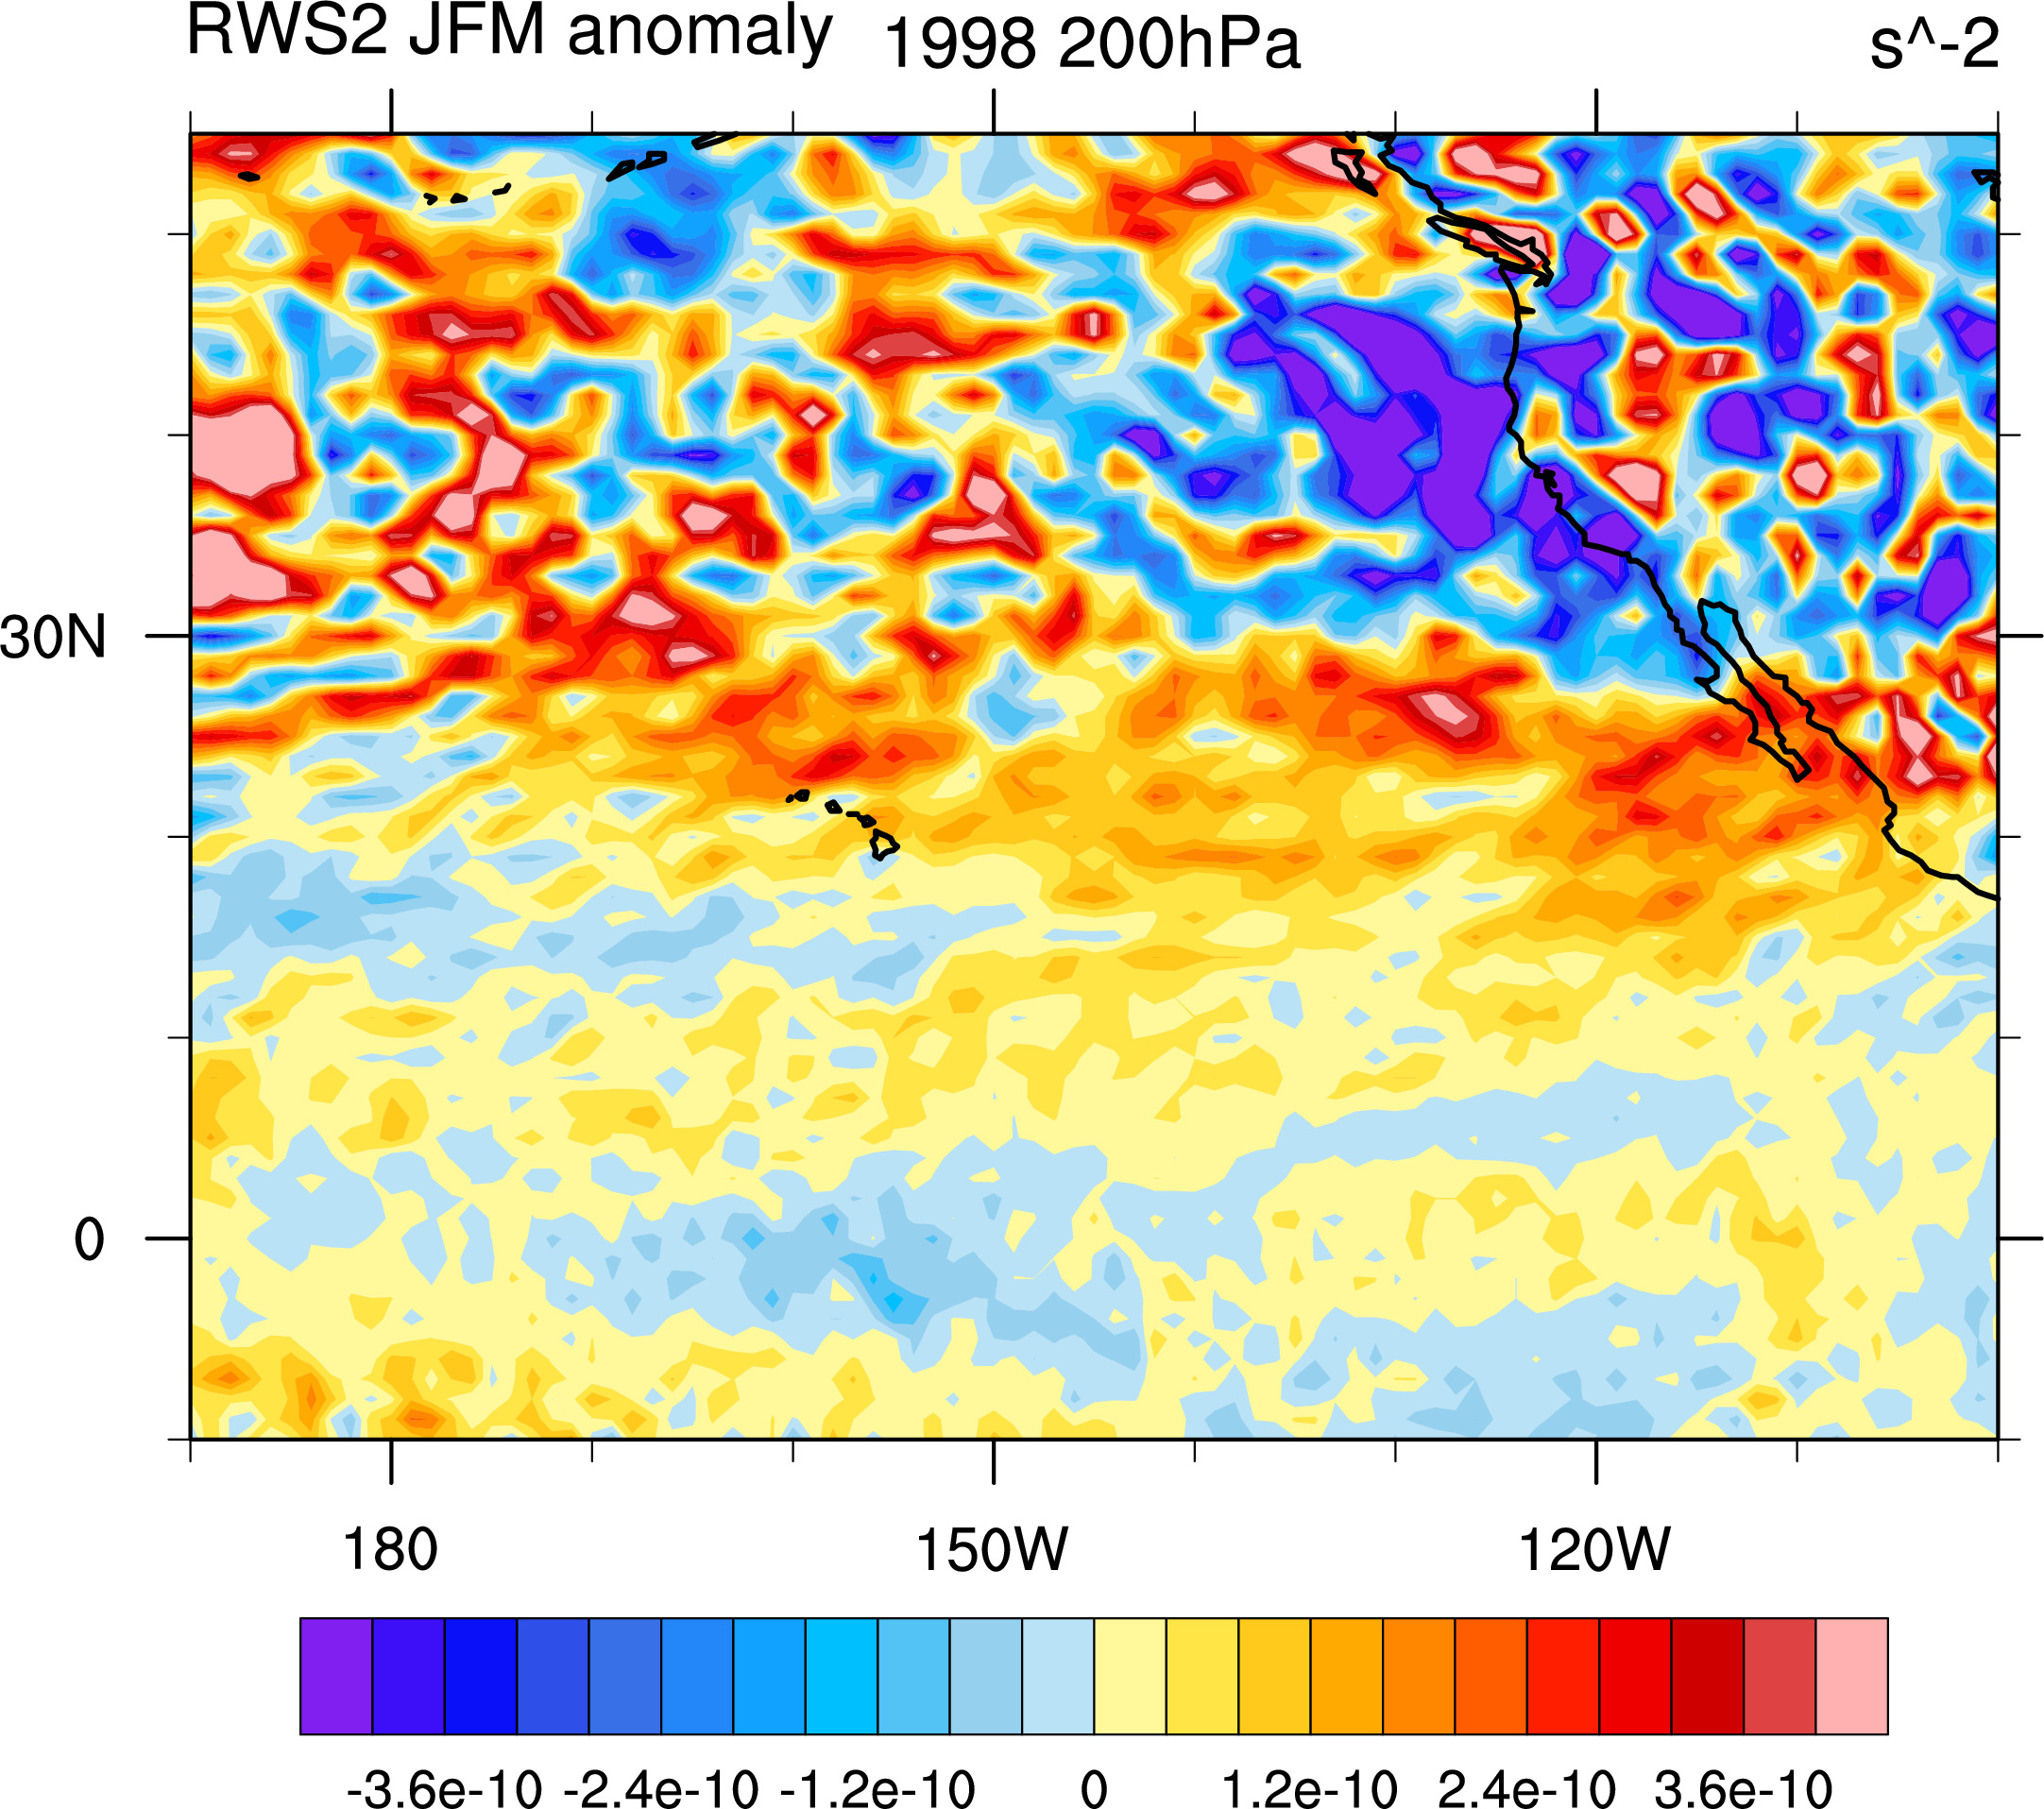
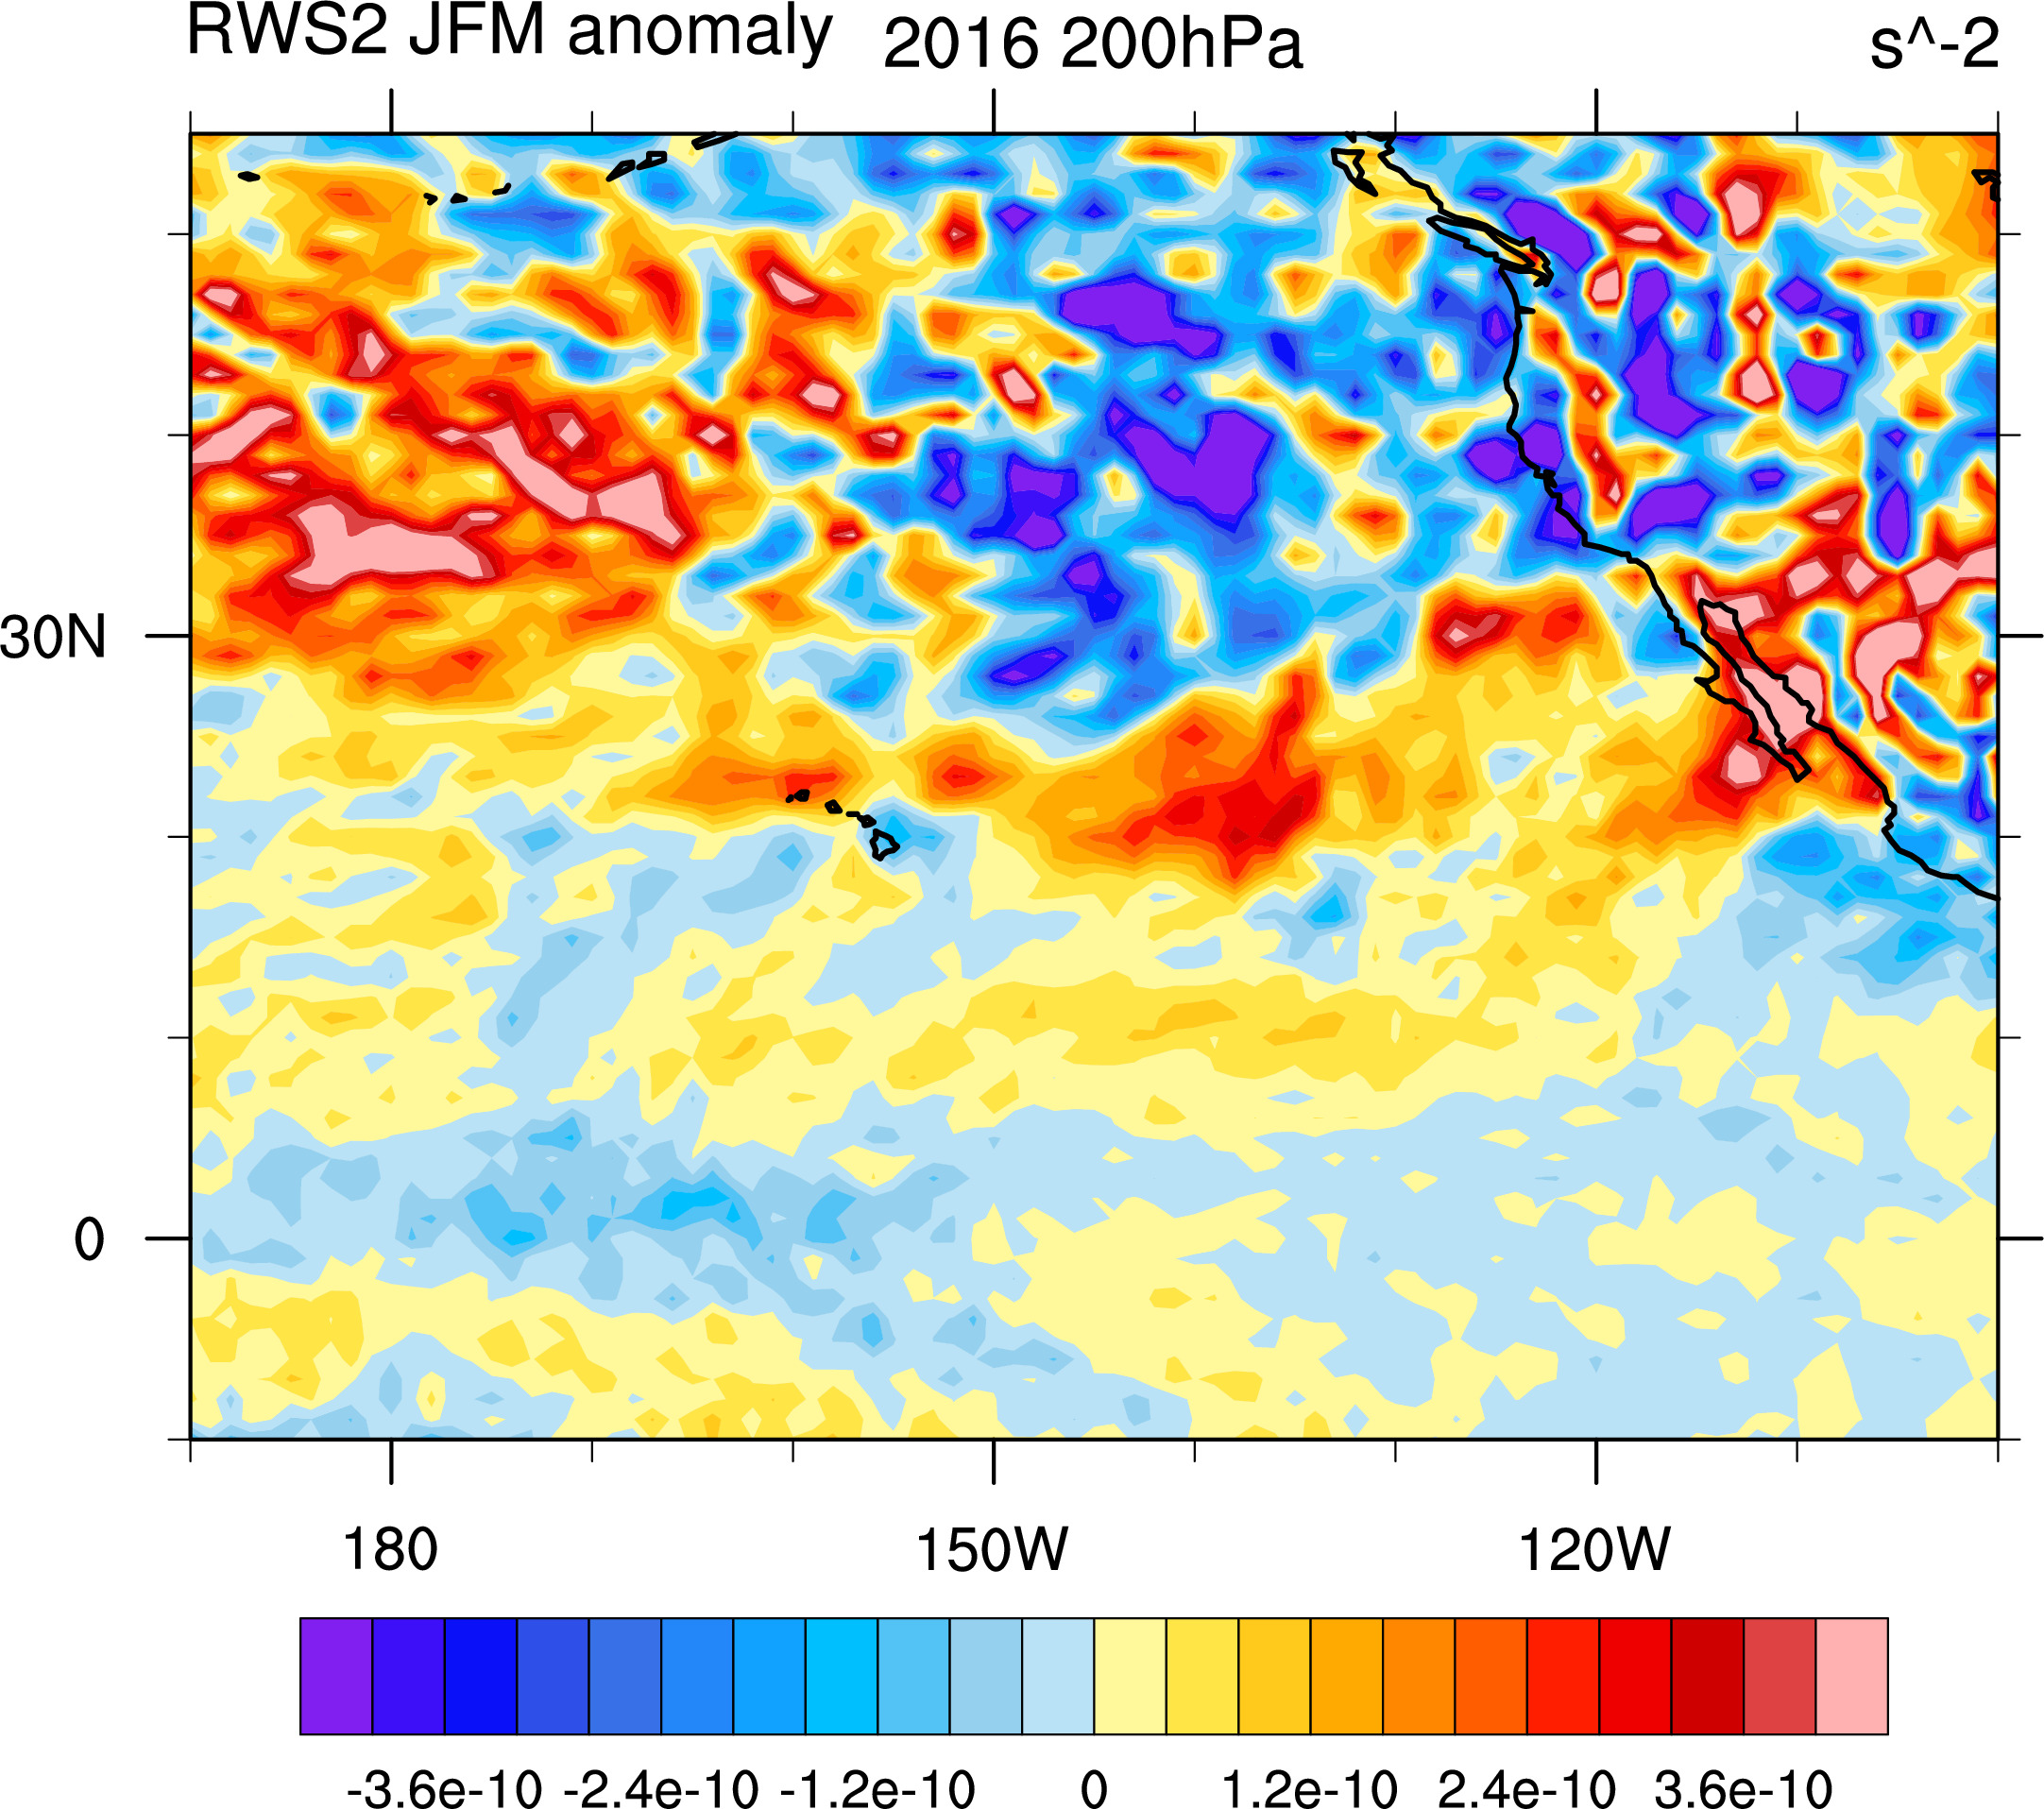
Tests related to Rossby Wave Source analysis
some similar plots using ERA-Interim data here
Sample days 20151222 (left) and 20161022 (right)
variables in alphabetical order, color bars/scales differ
-----------------------------------------------------------------------------------------
Following data created with monthly means of daily anomalies
For more info see /Projects/EN3R/forJOE
-----------------------------------------------------------------------------------------
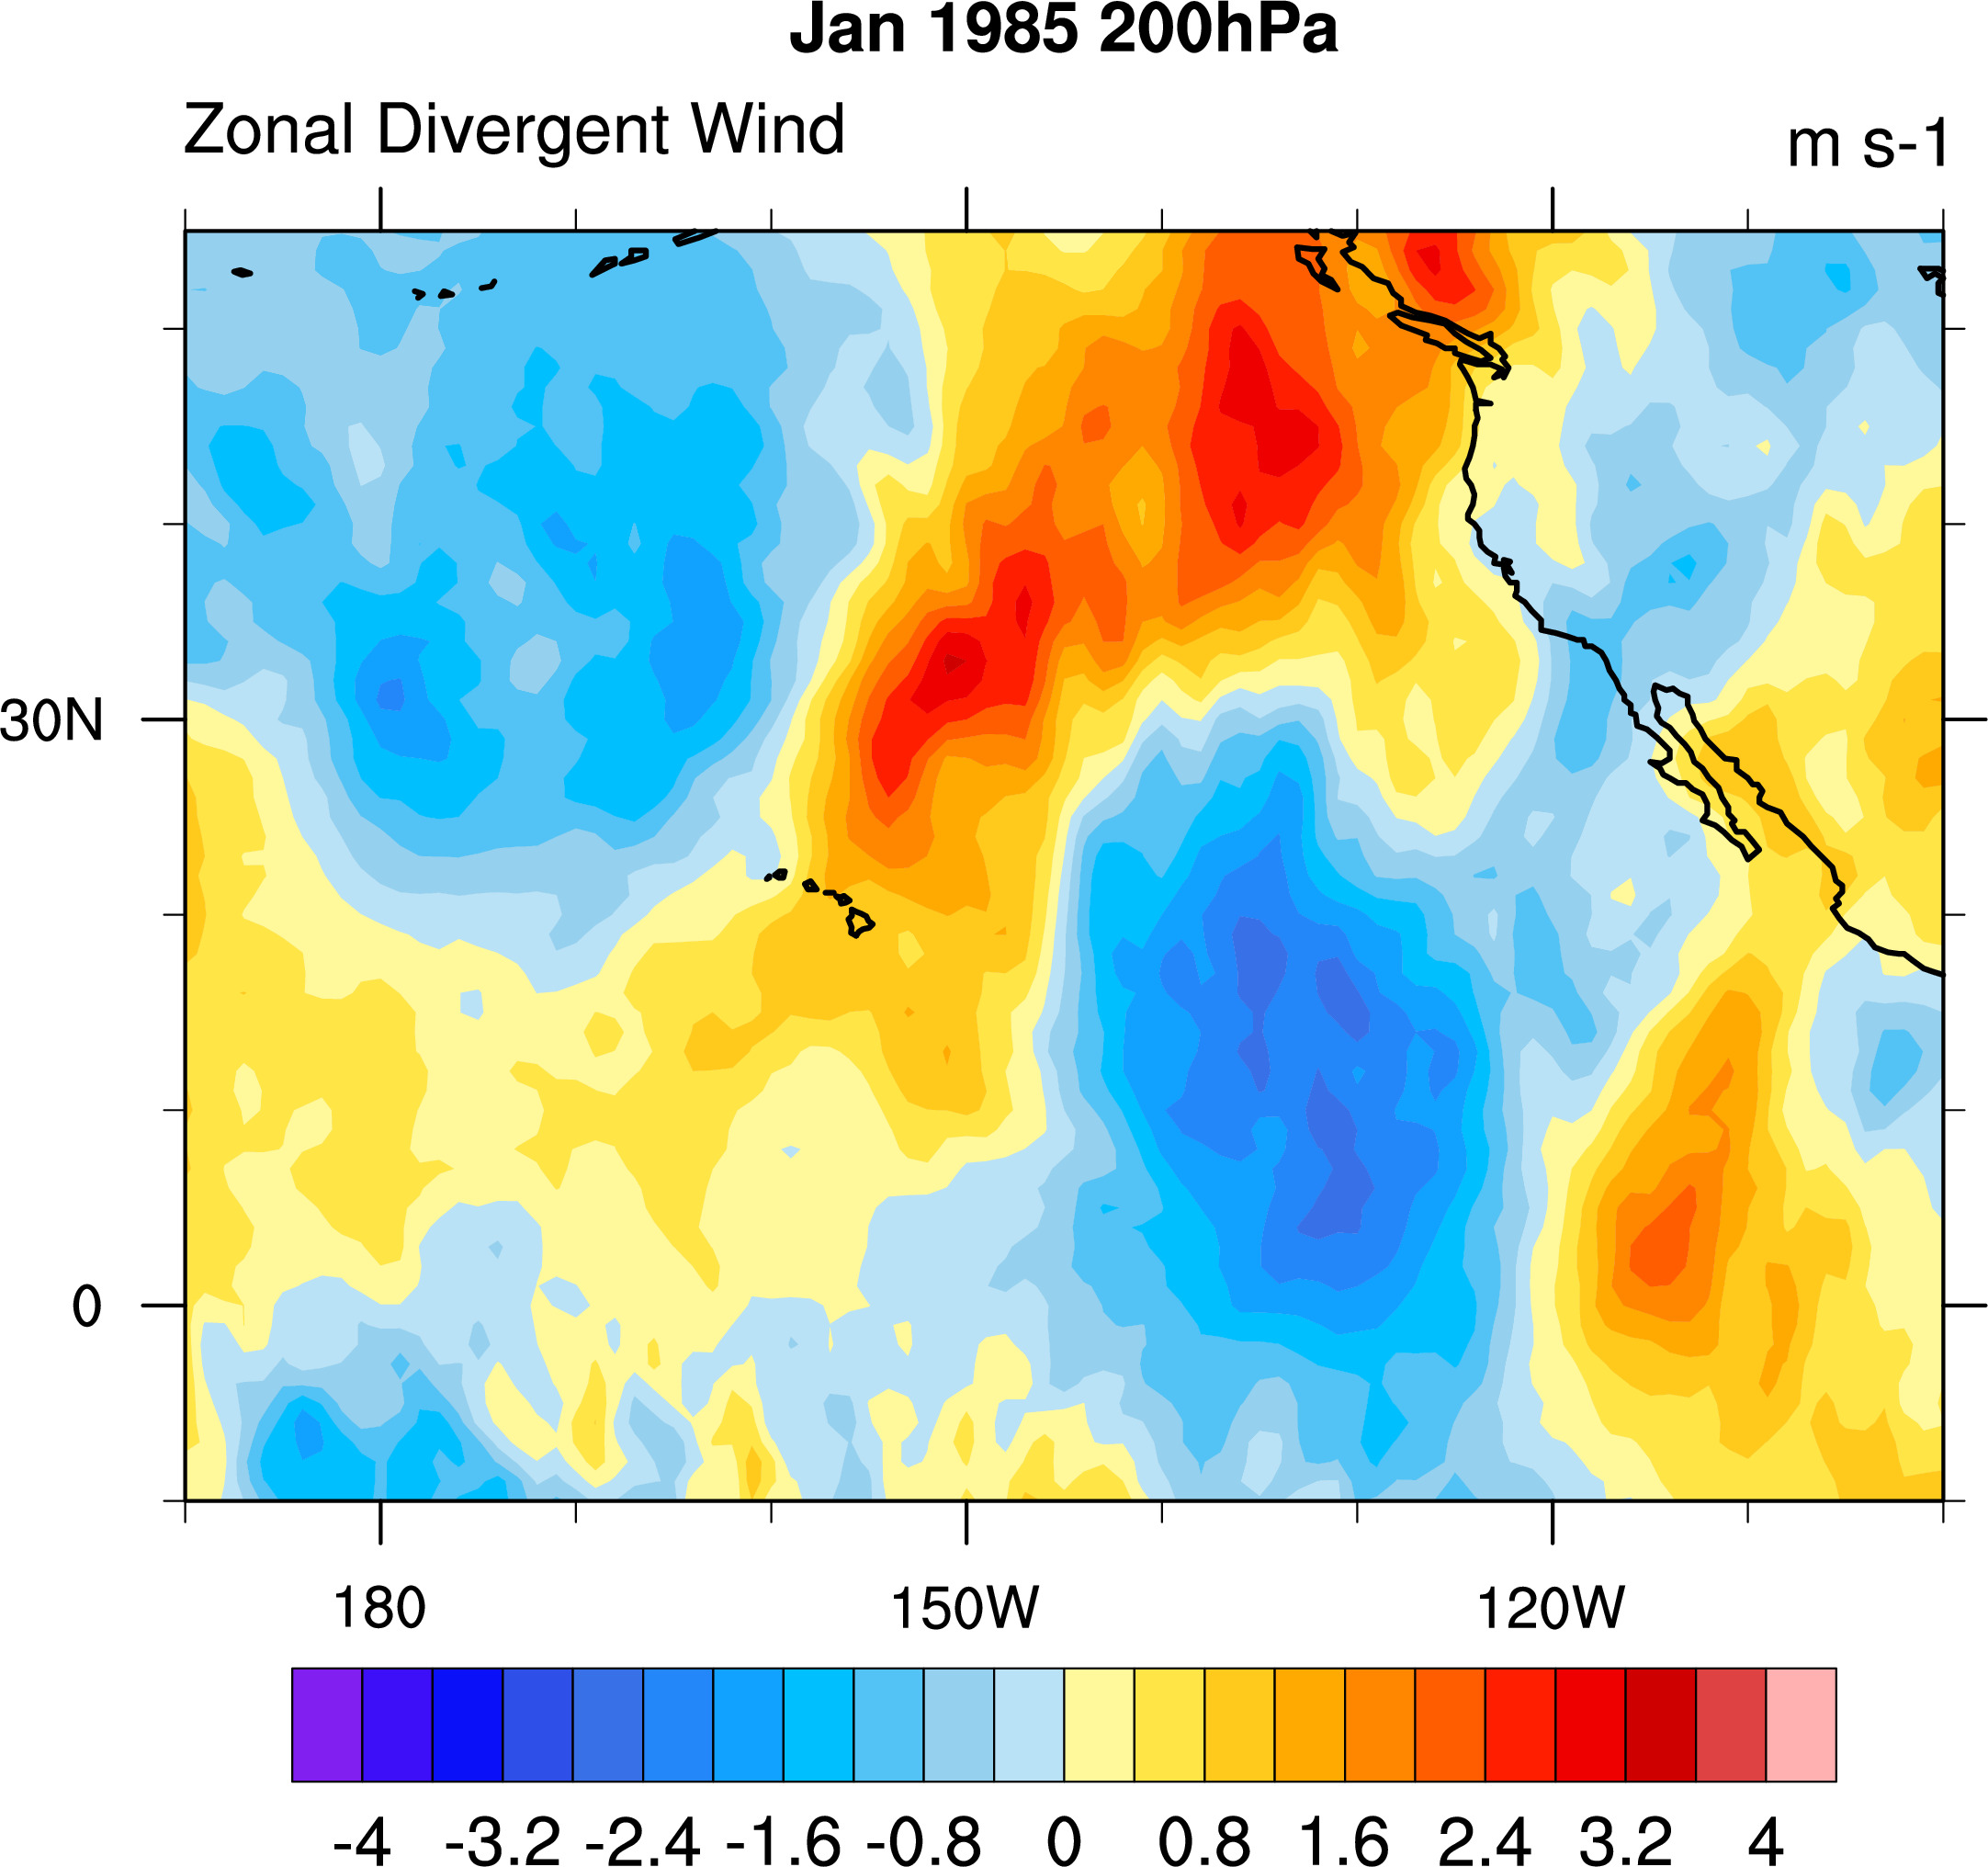
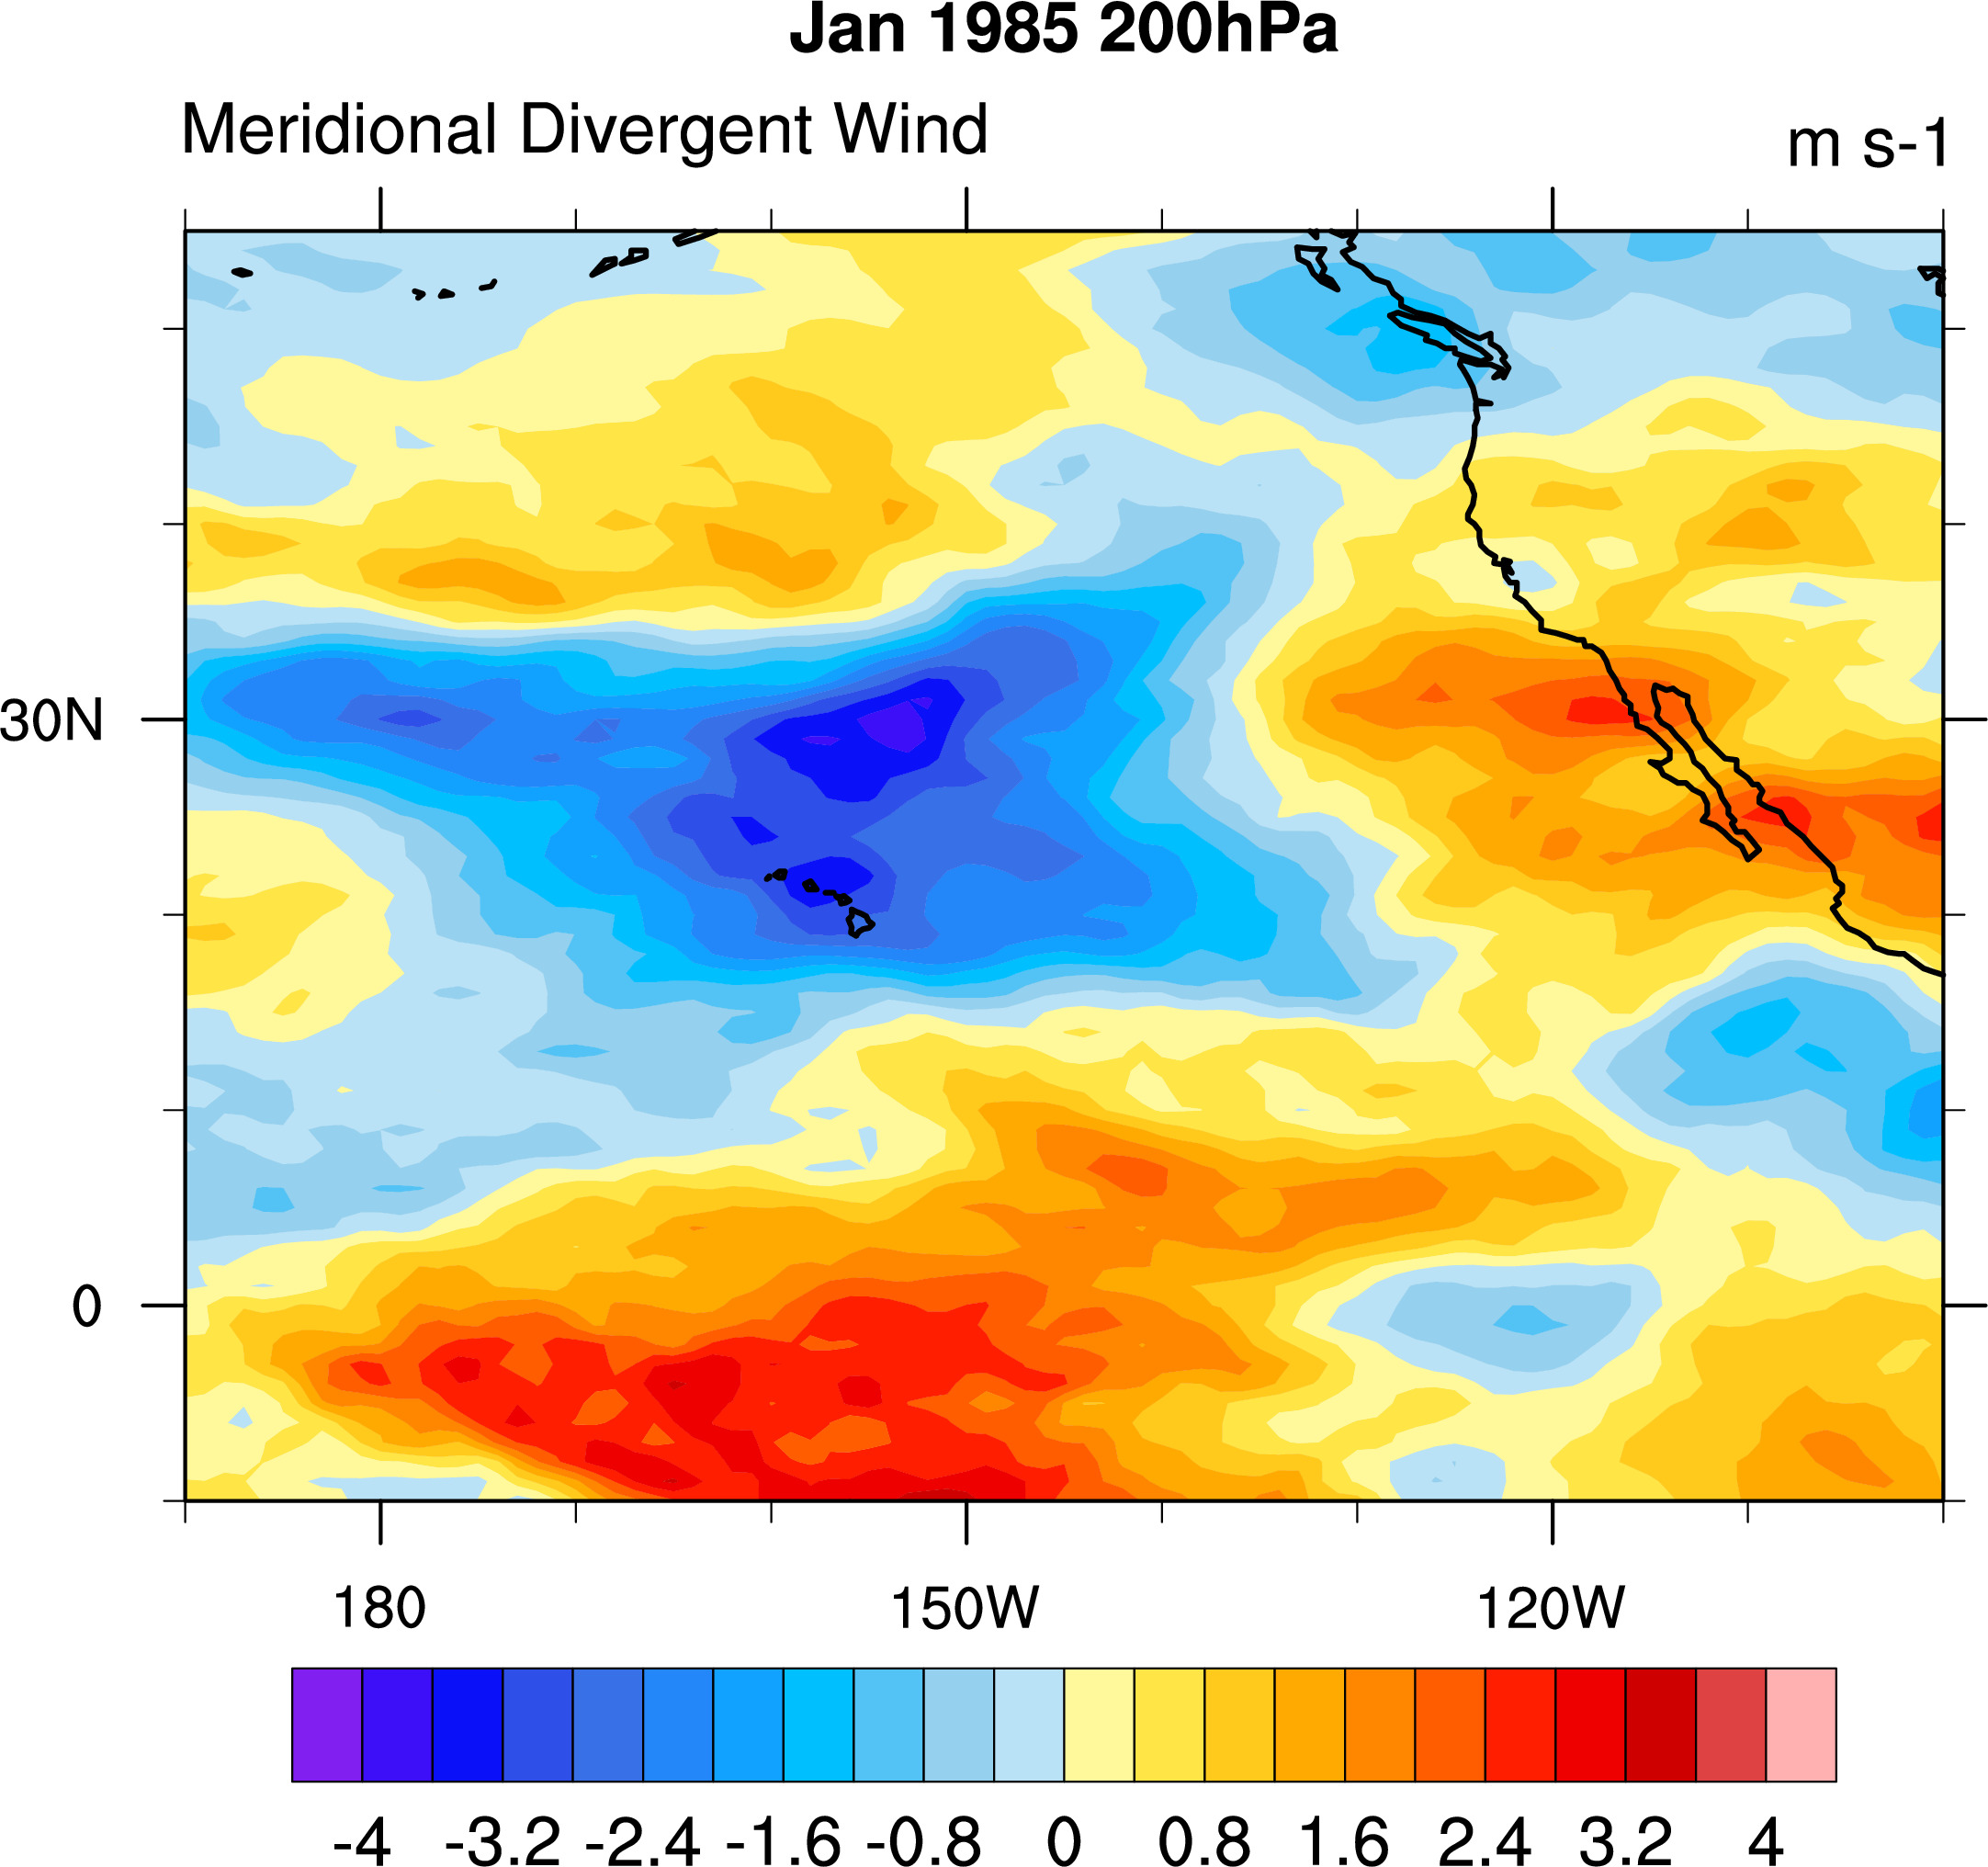
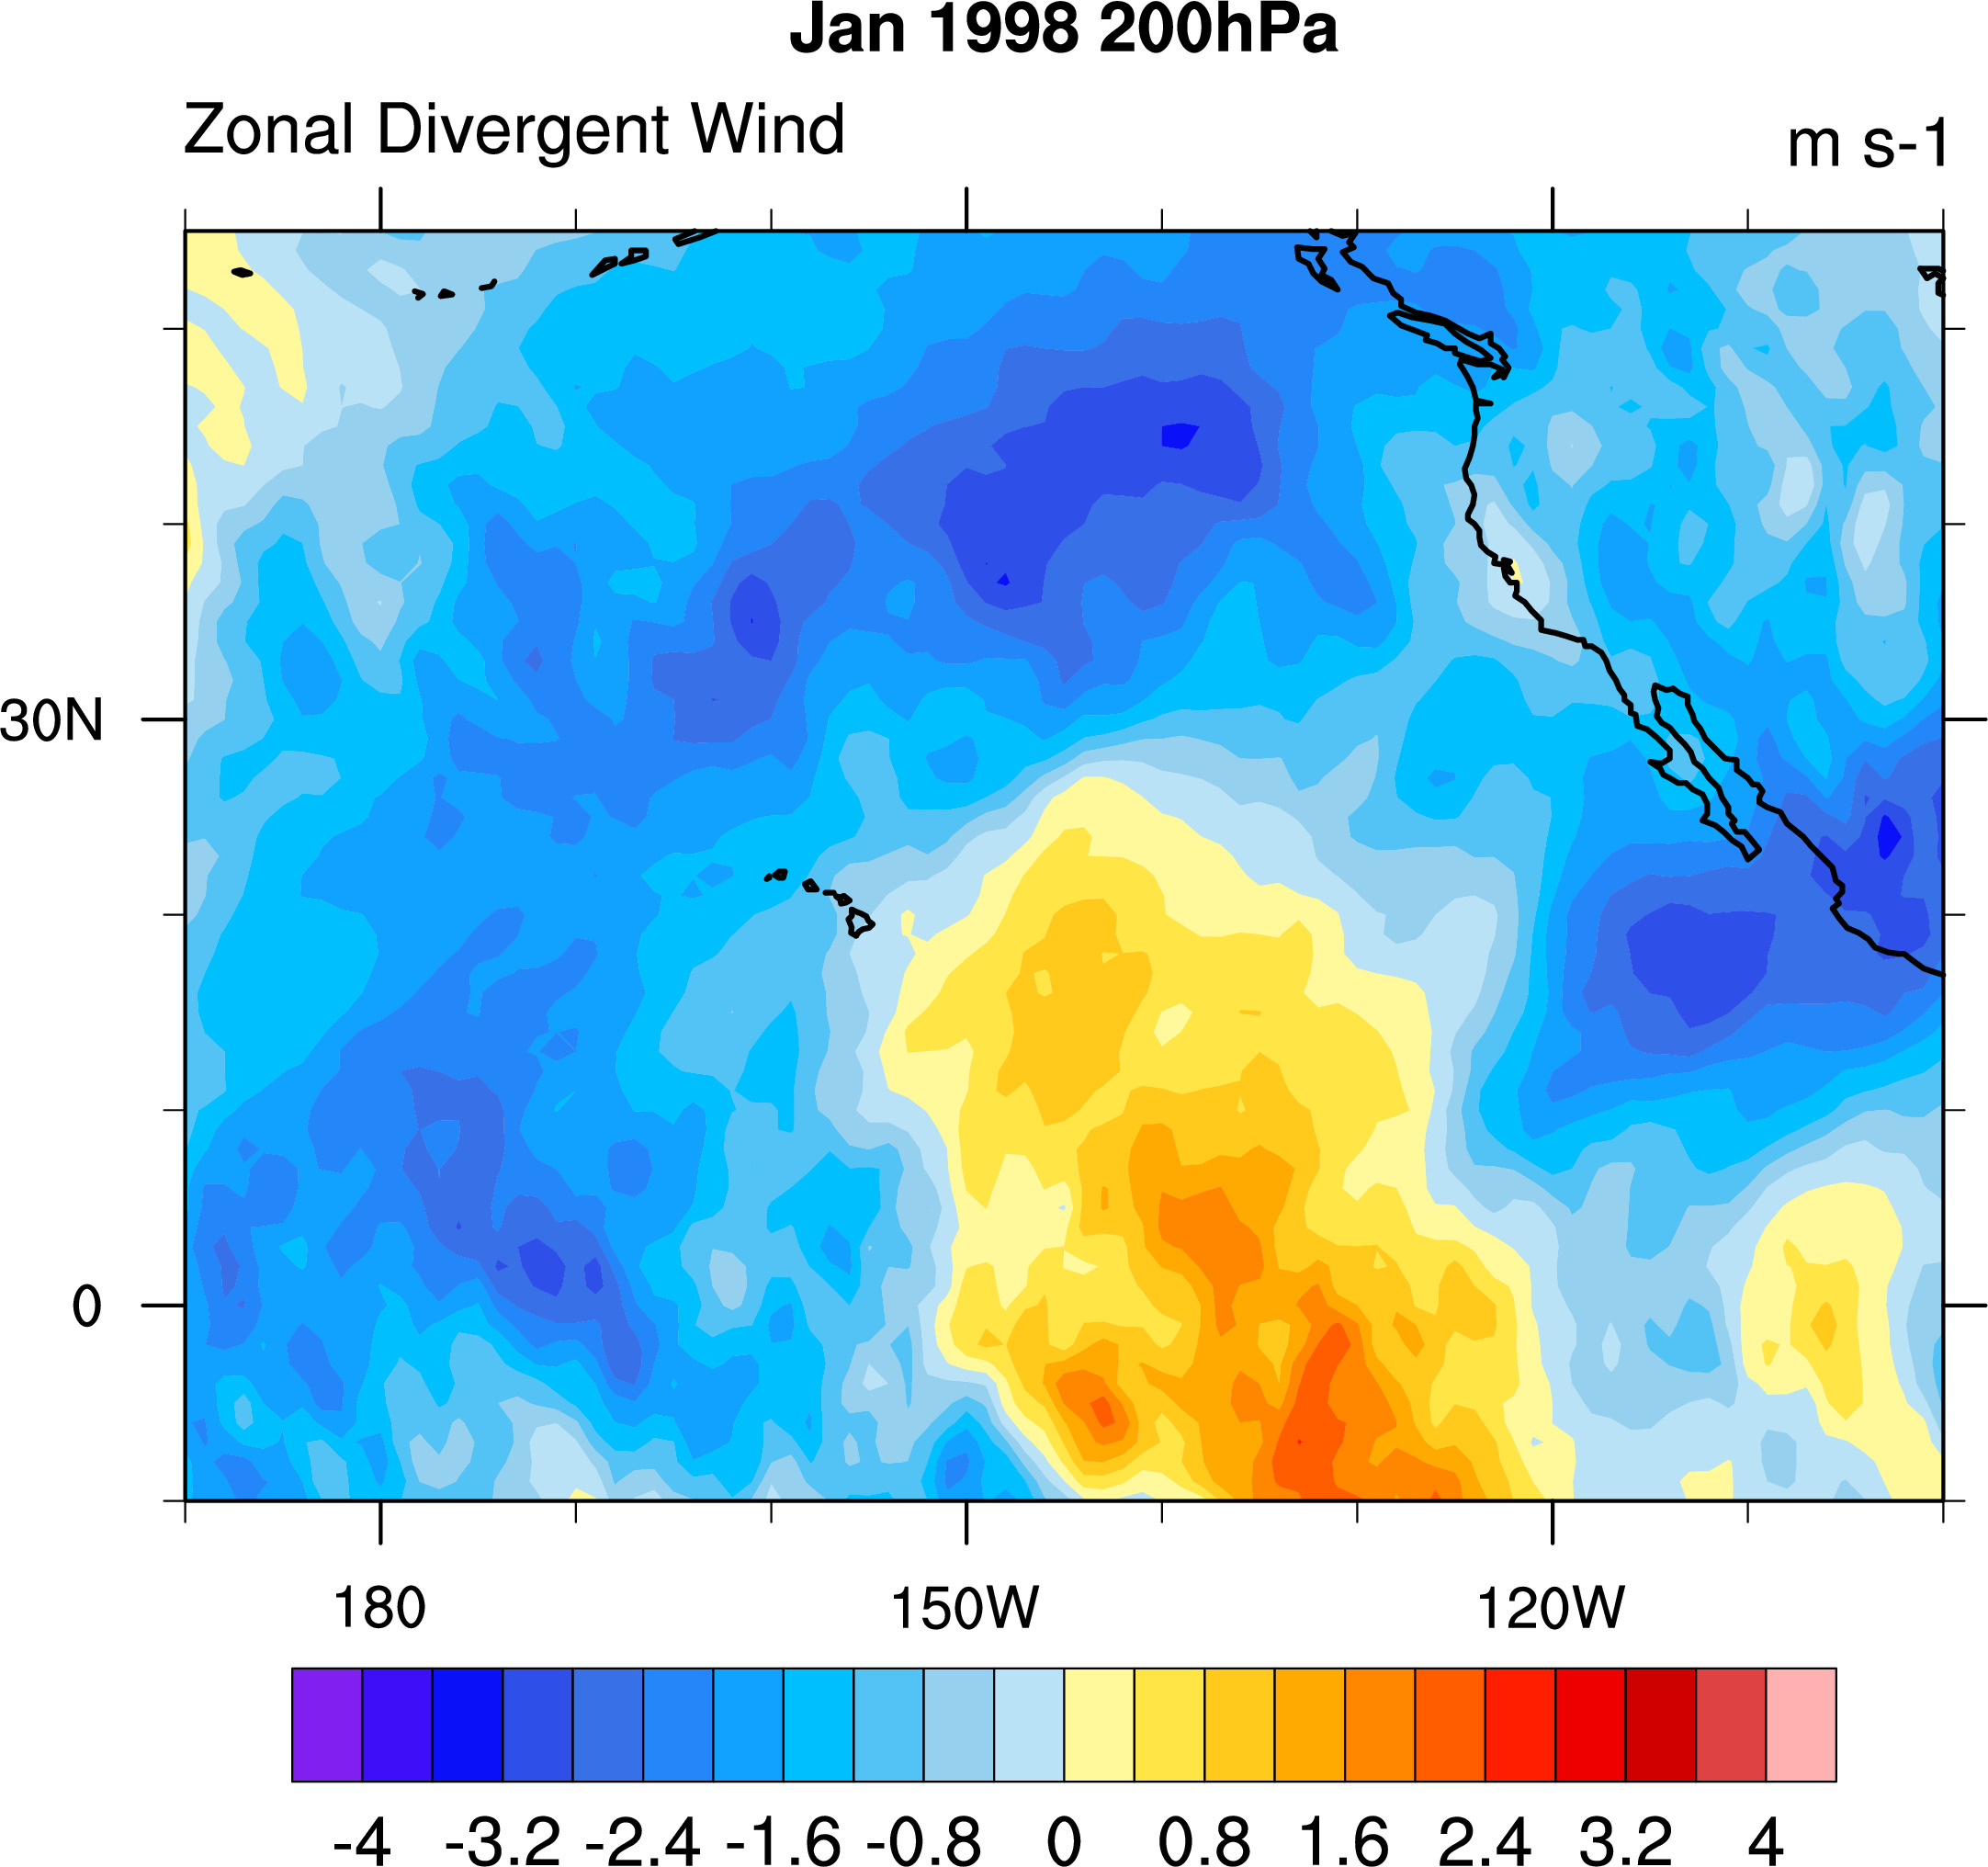
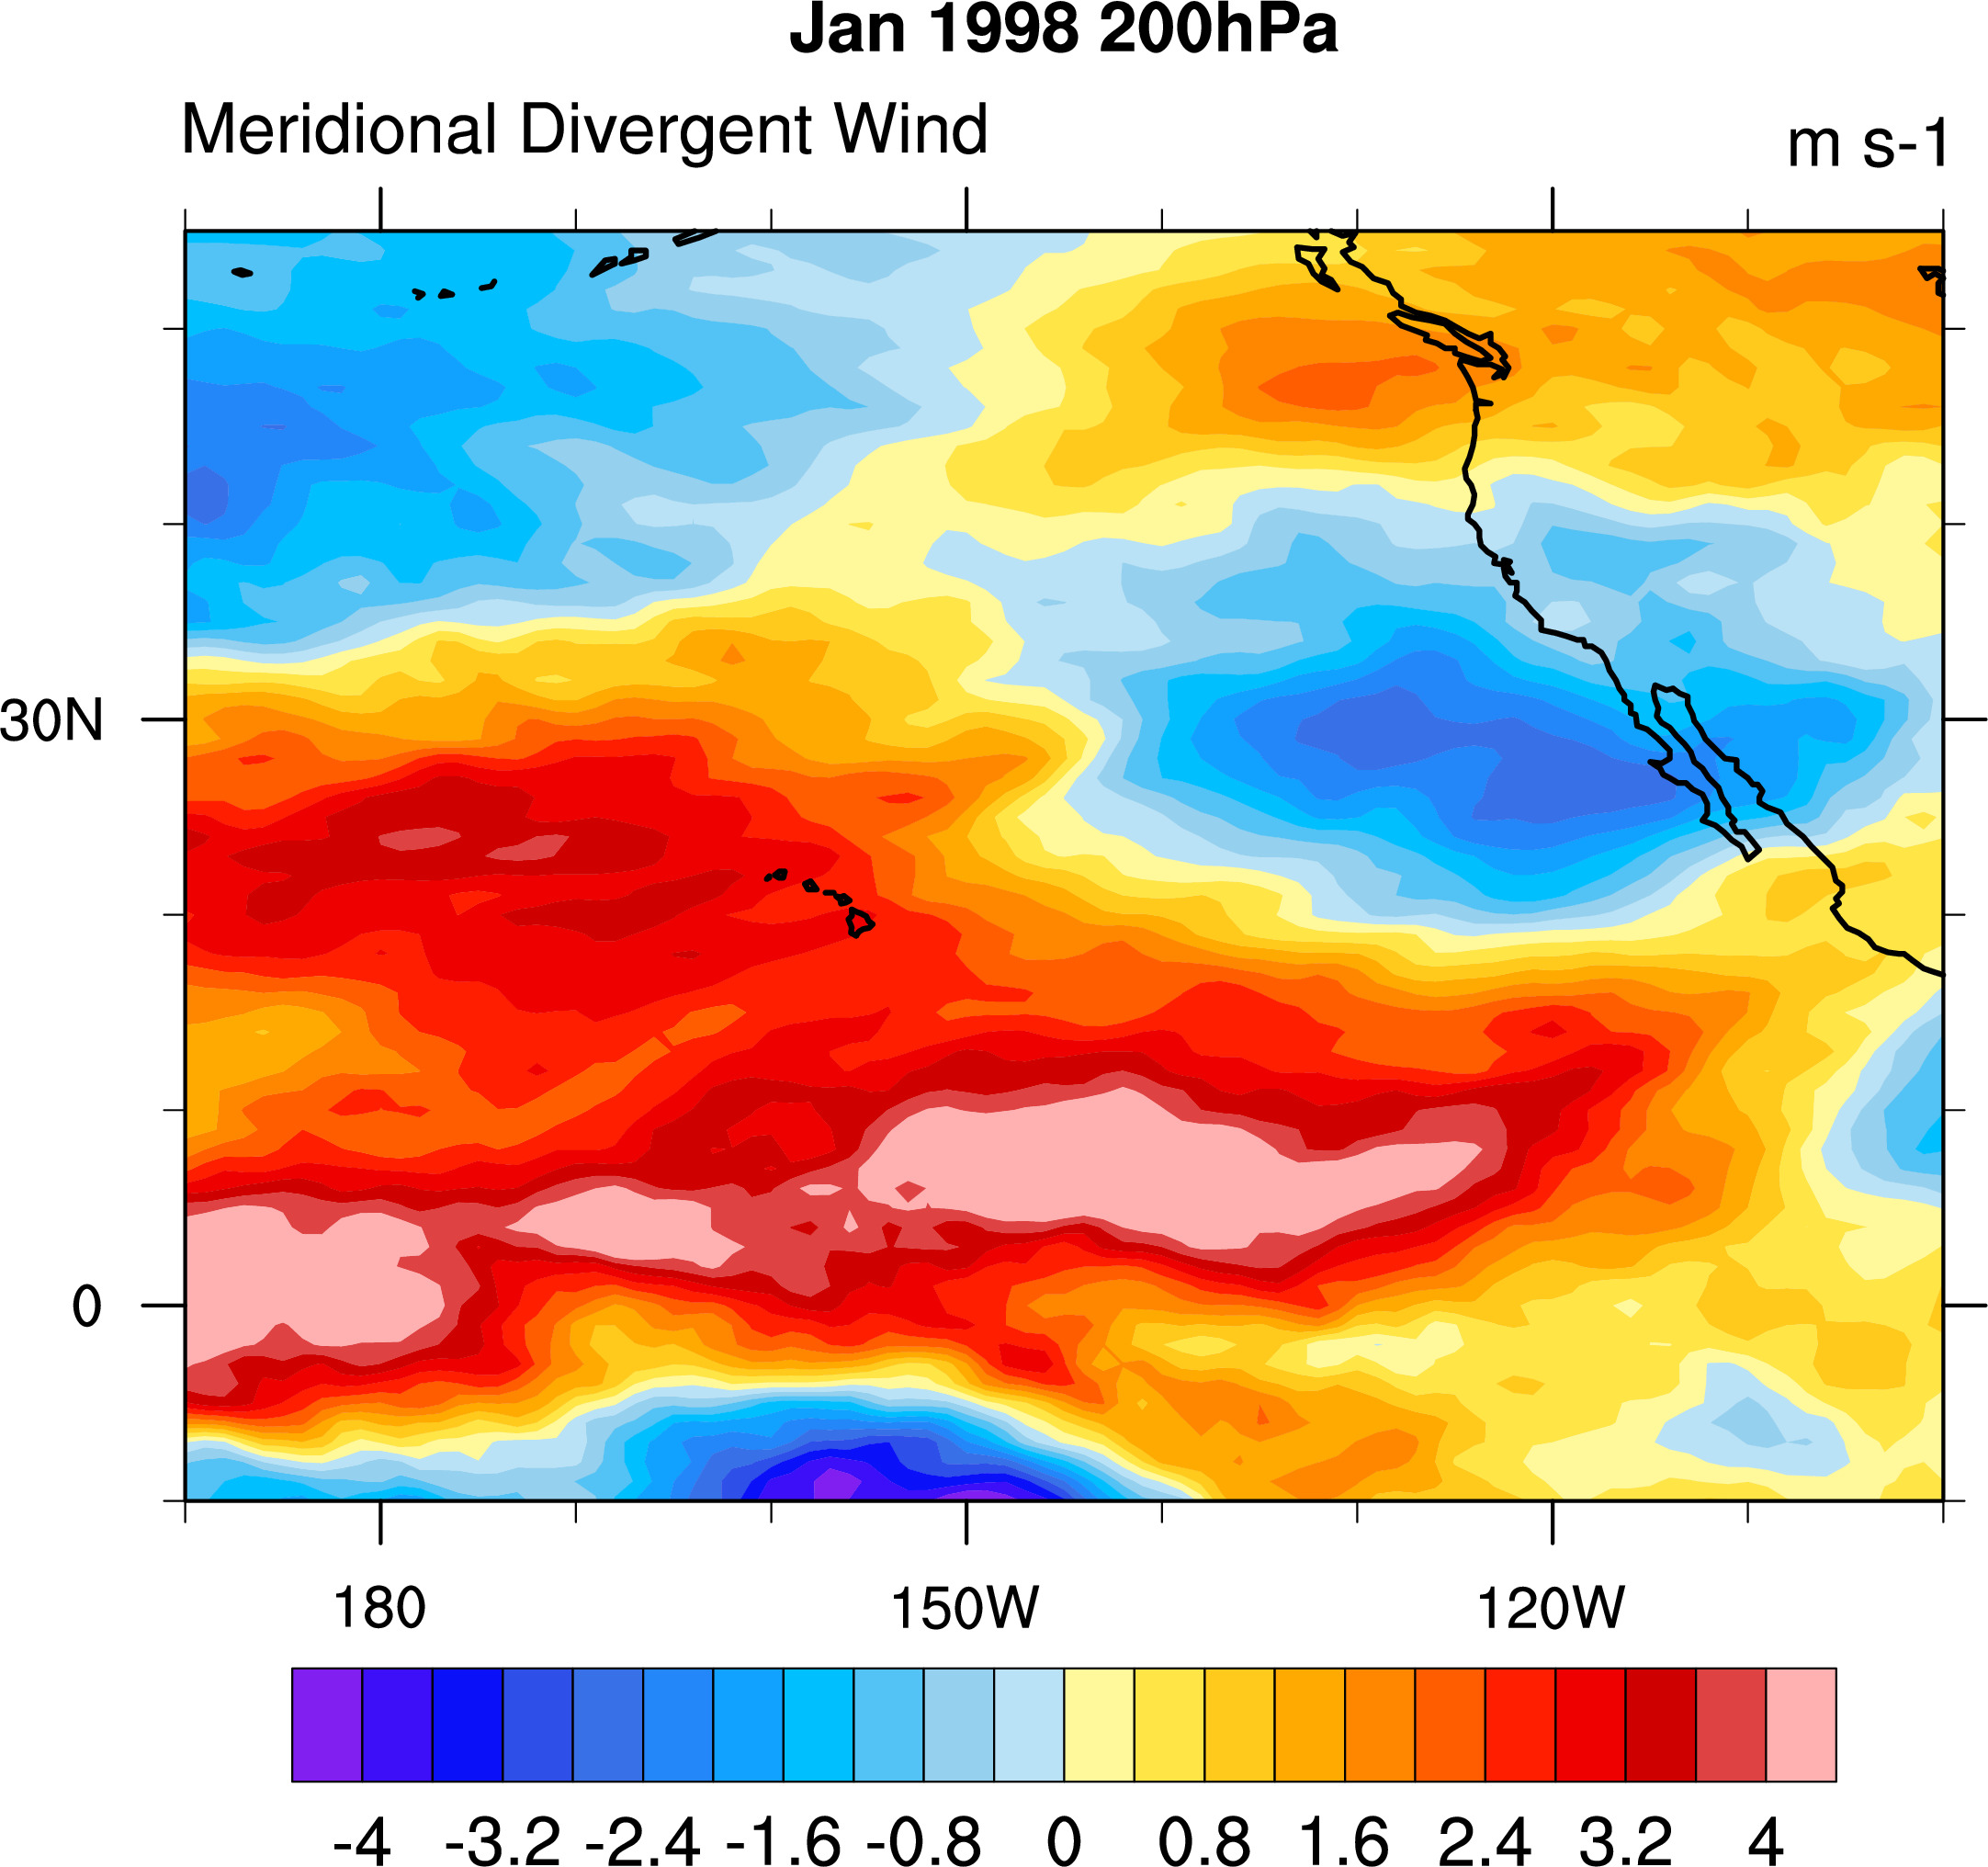
Sample monthly means of daily wind anomalies
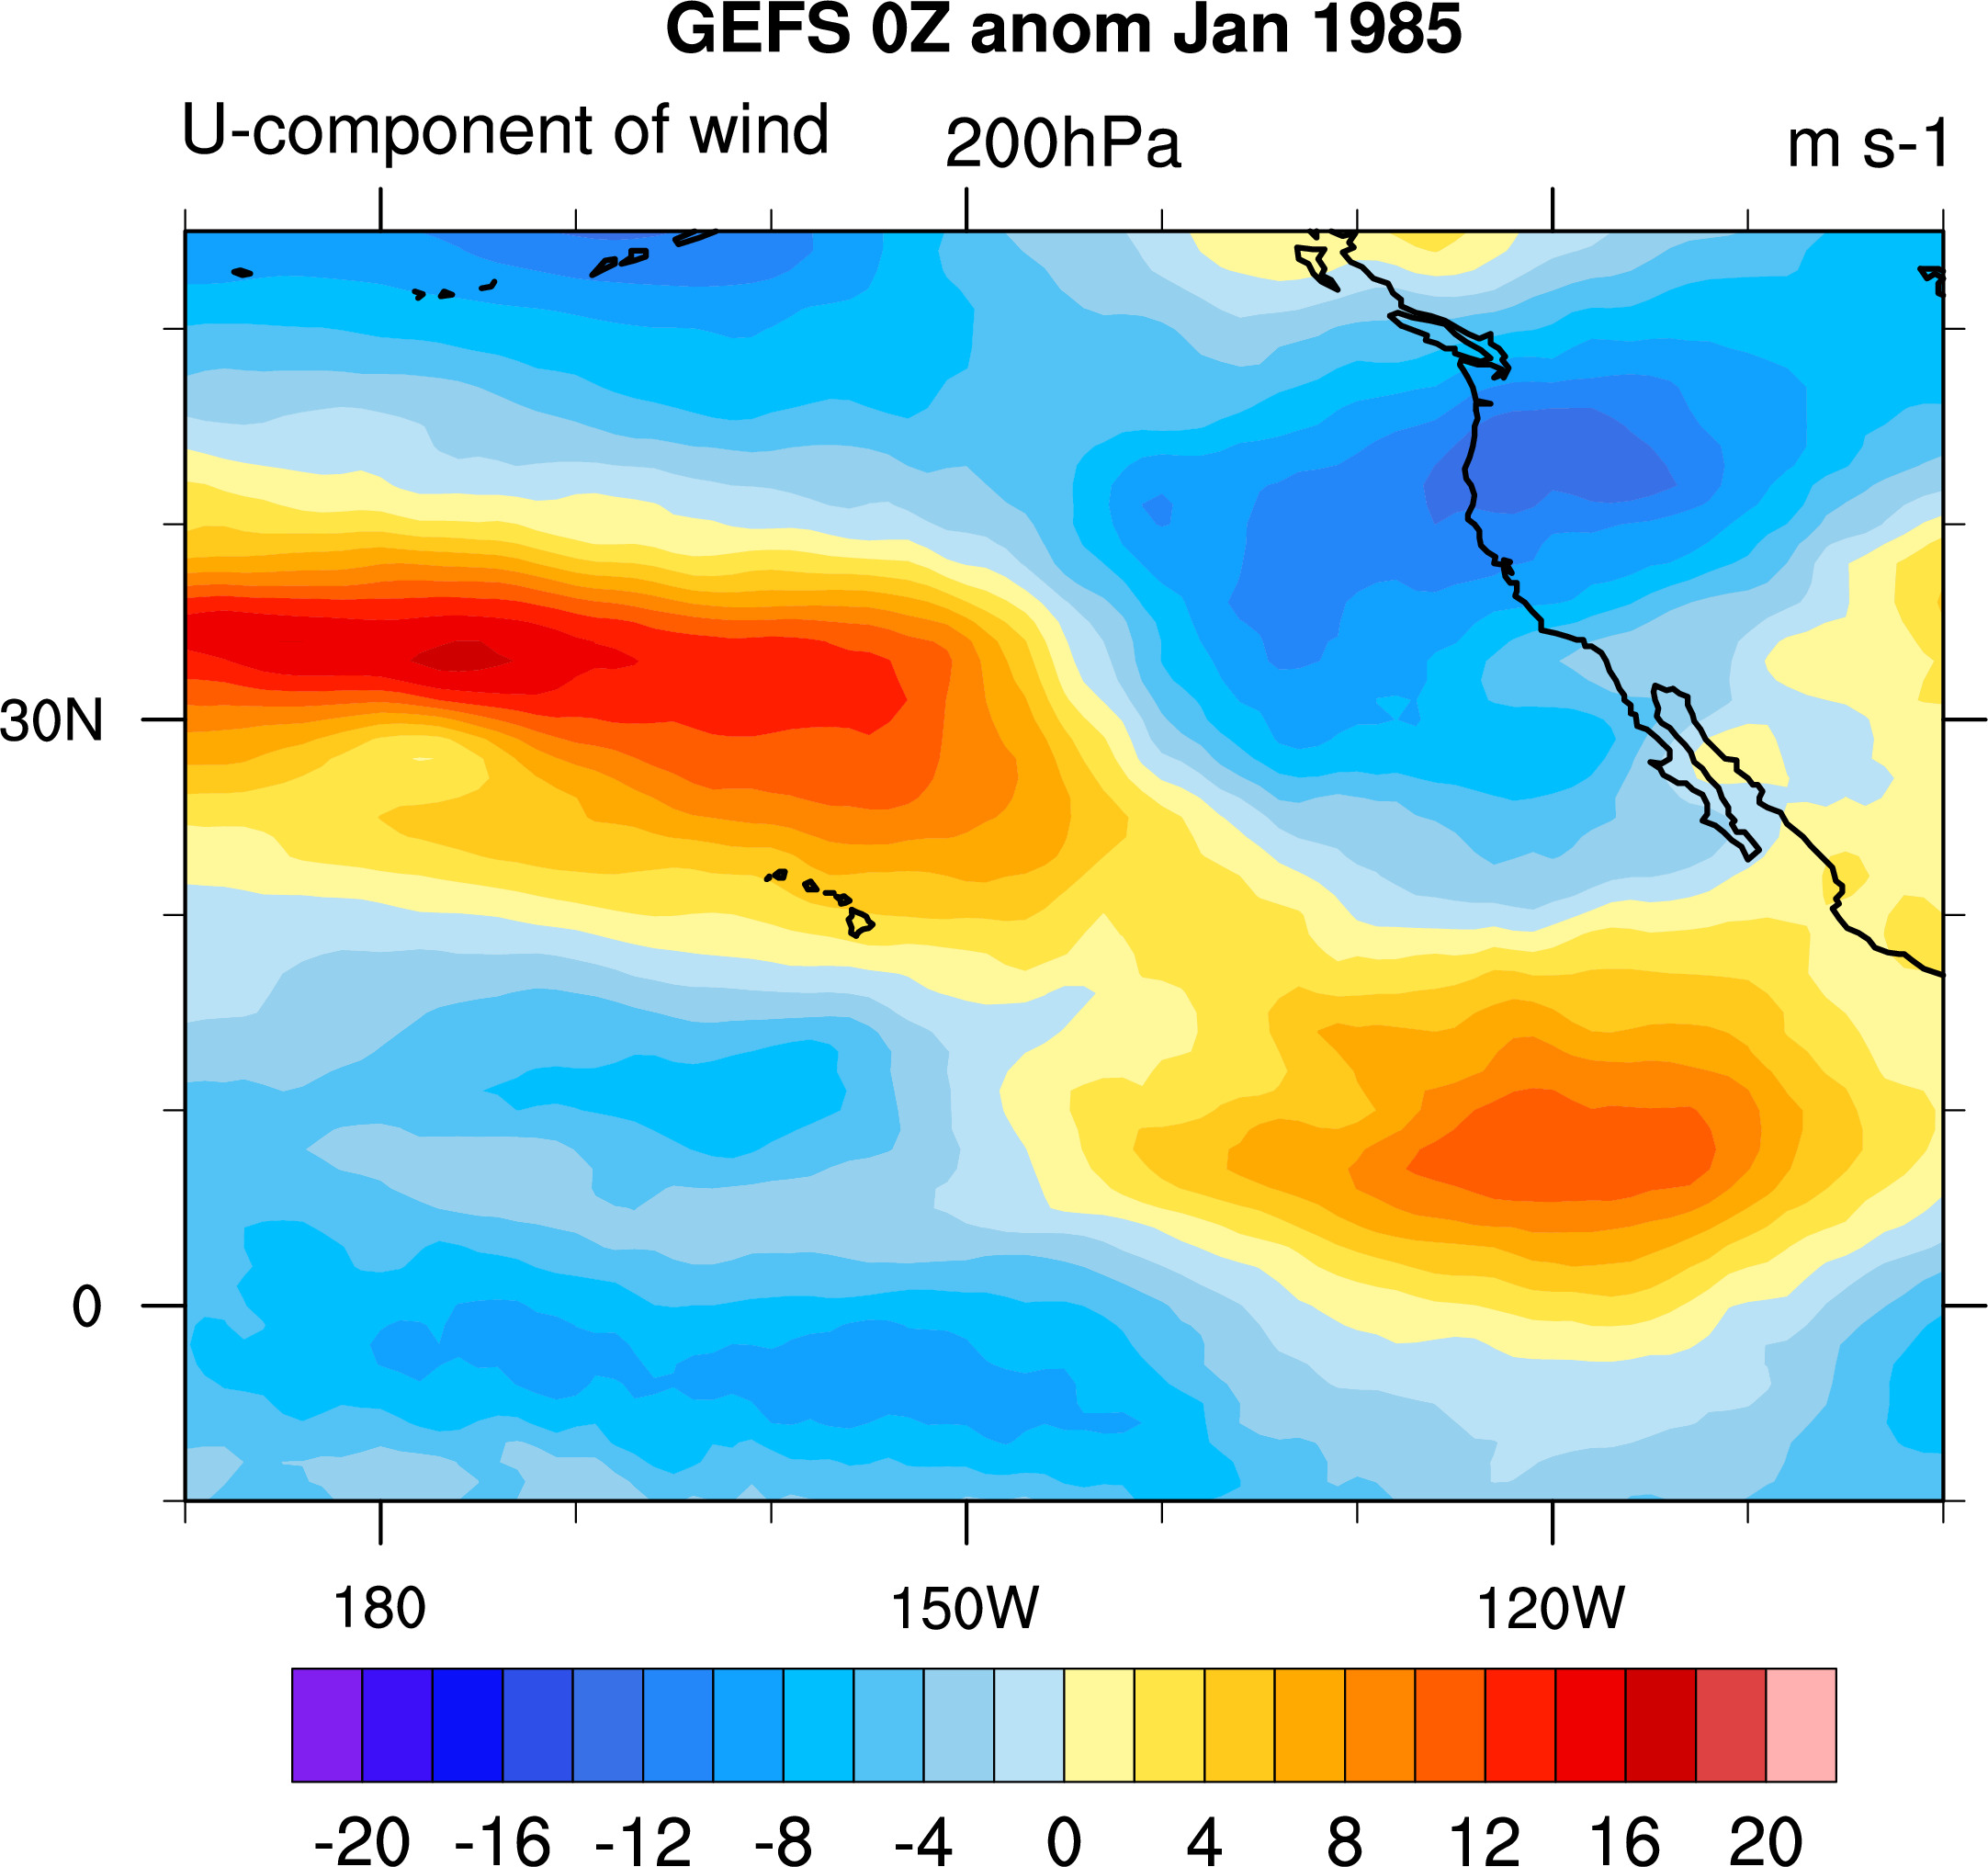
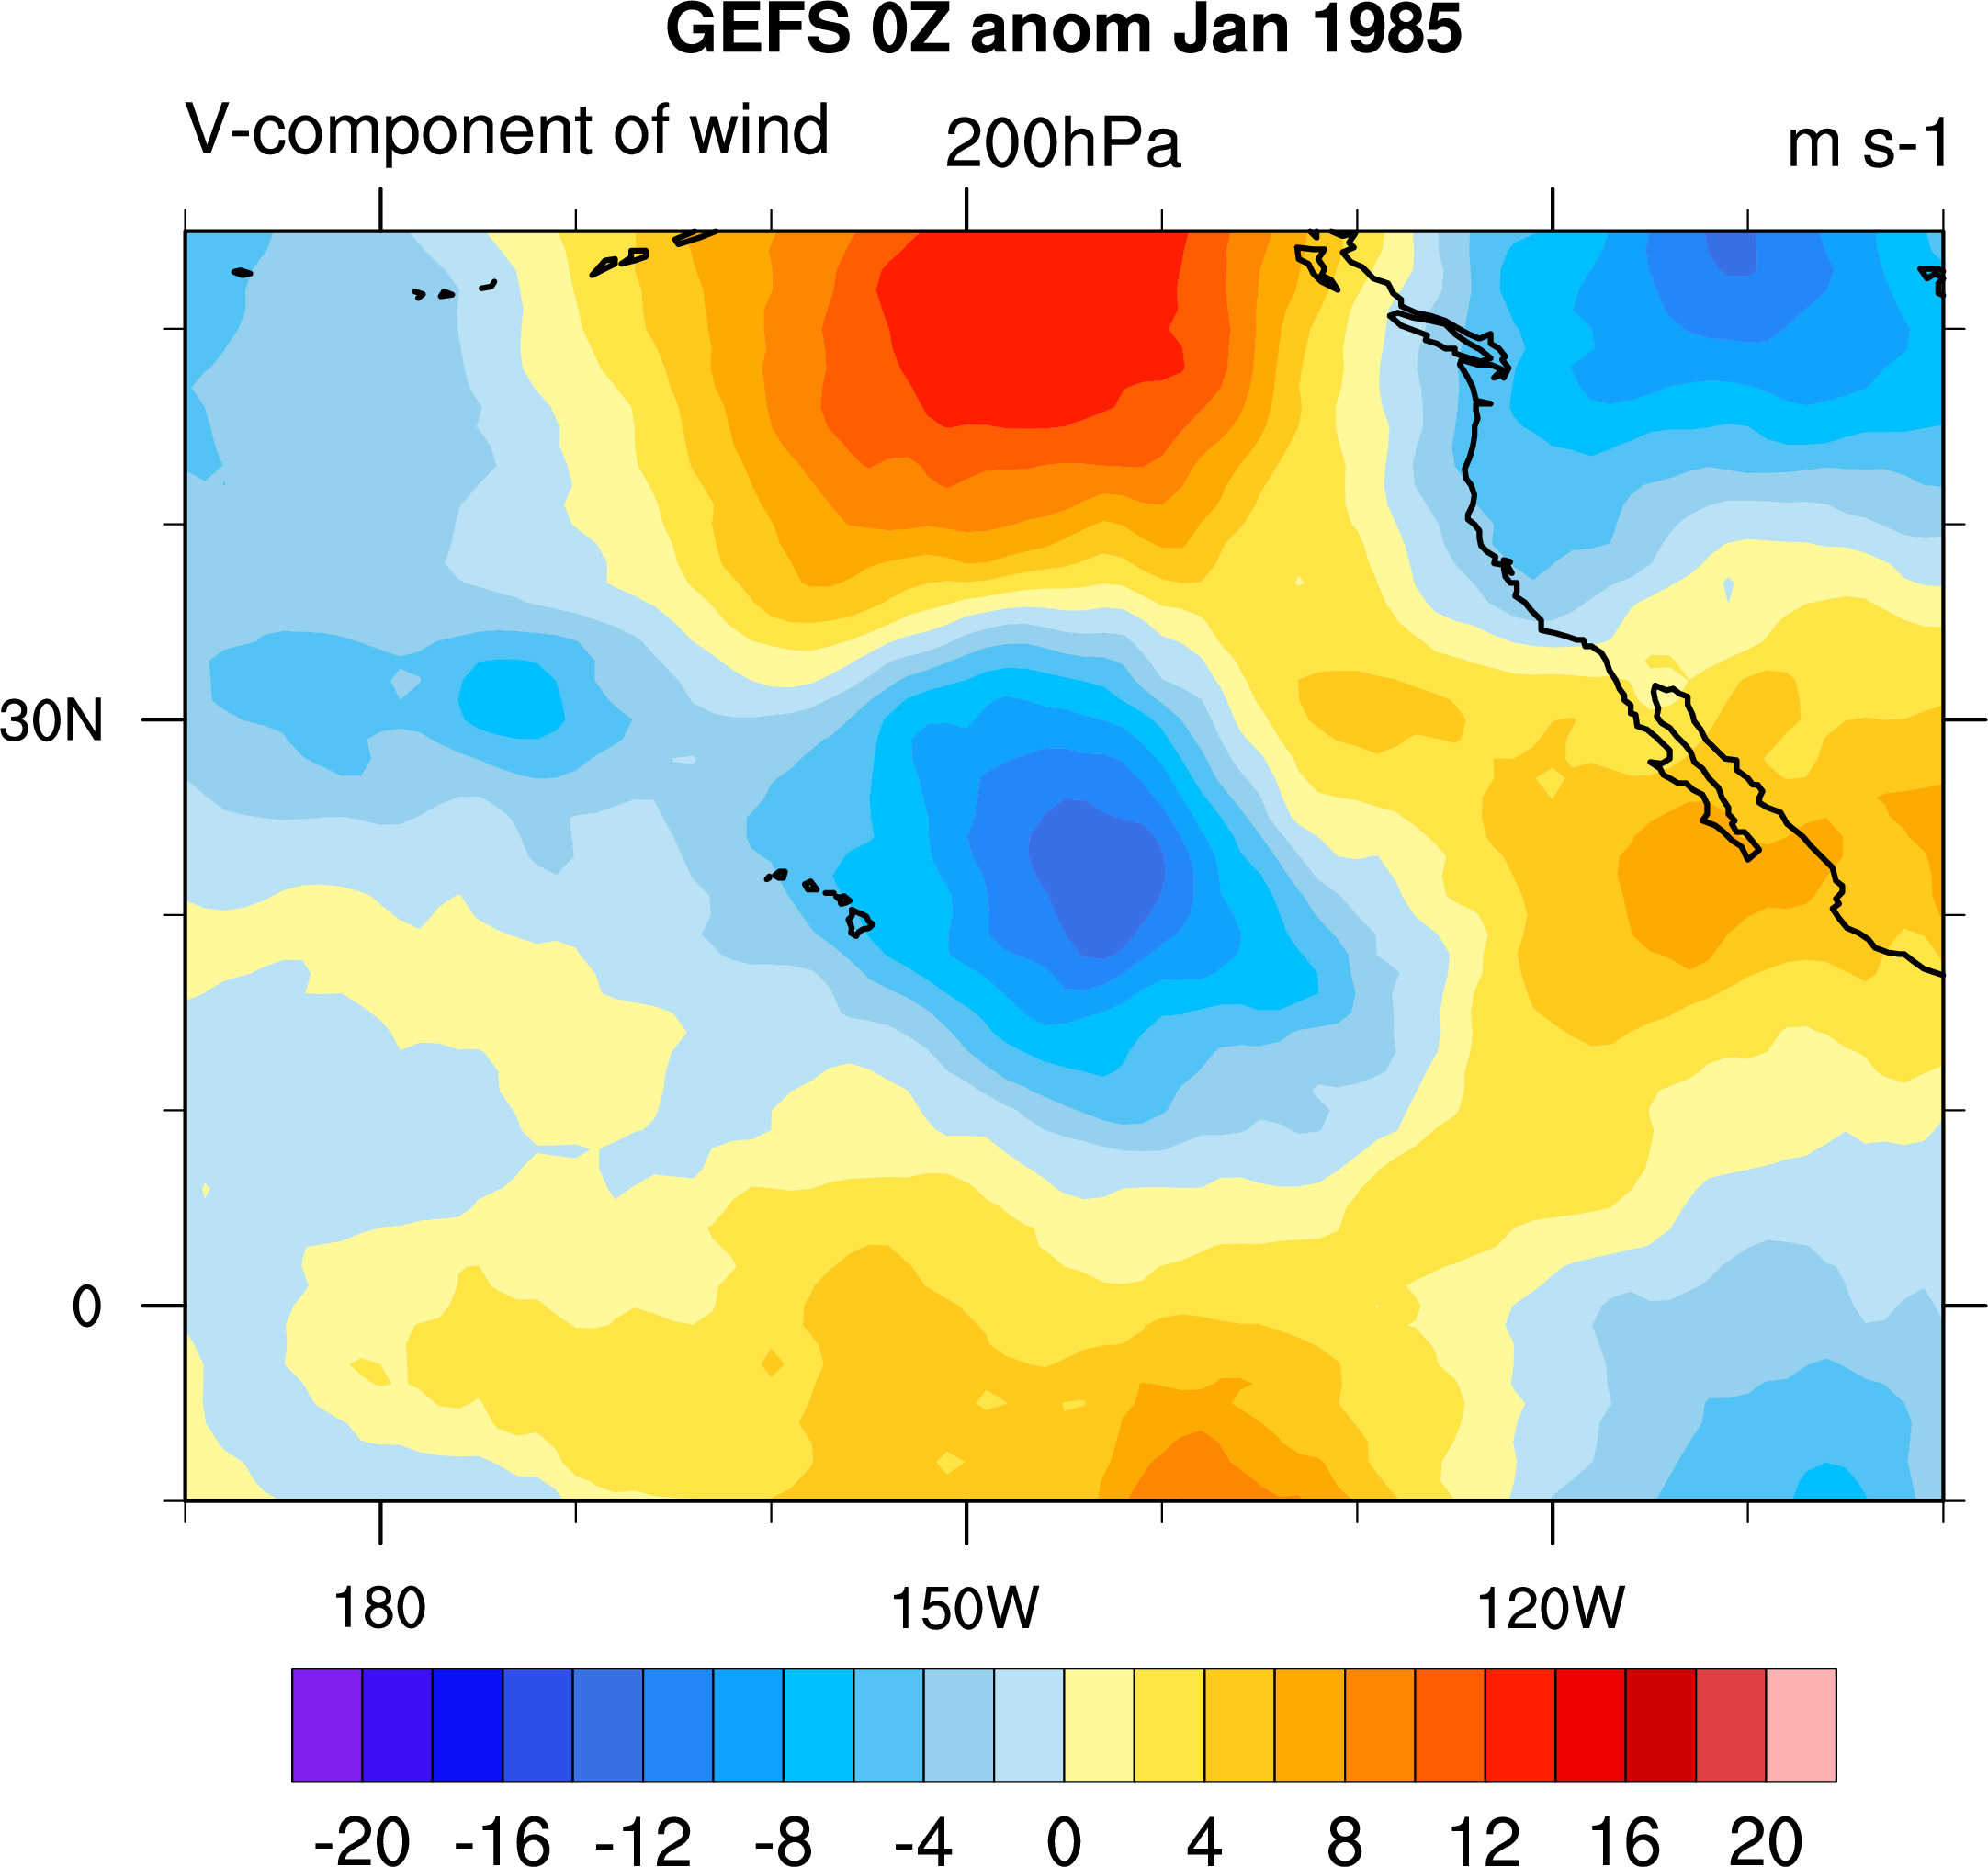
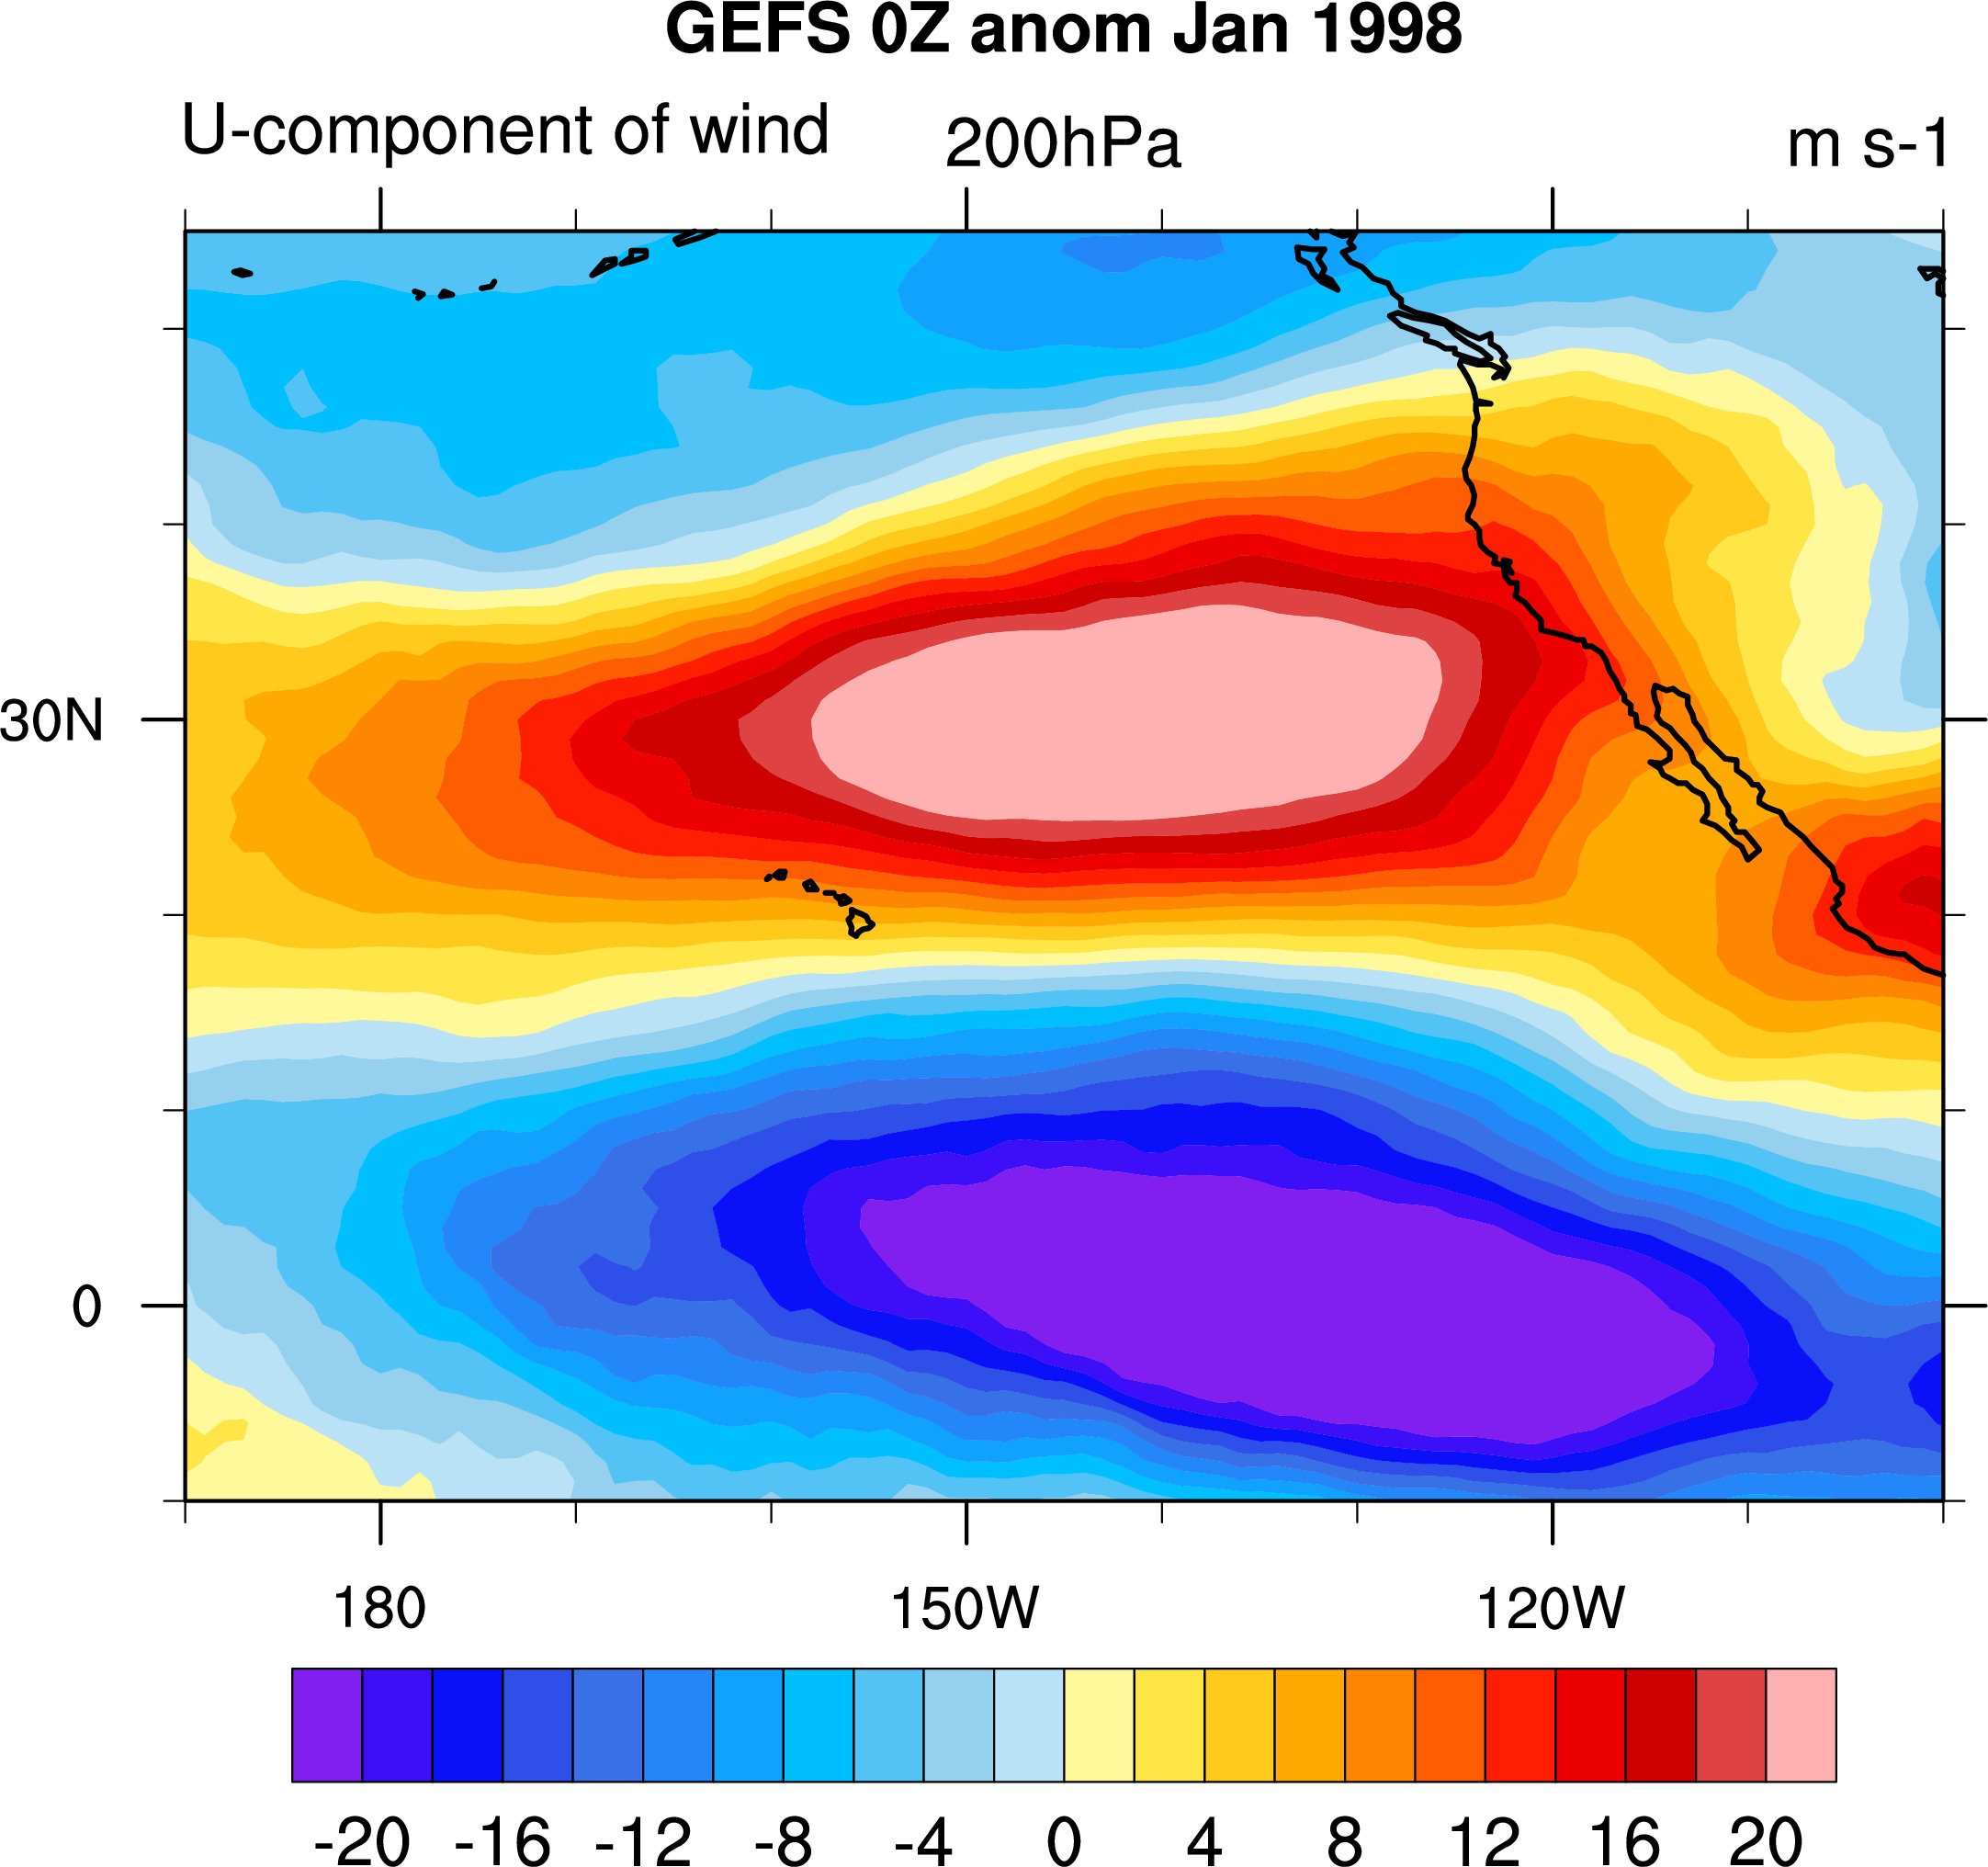
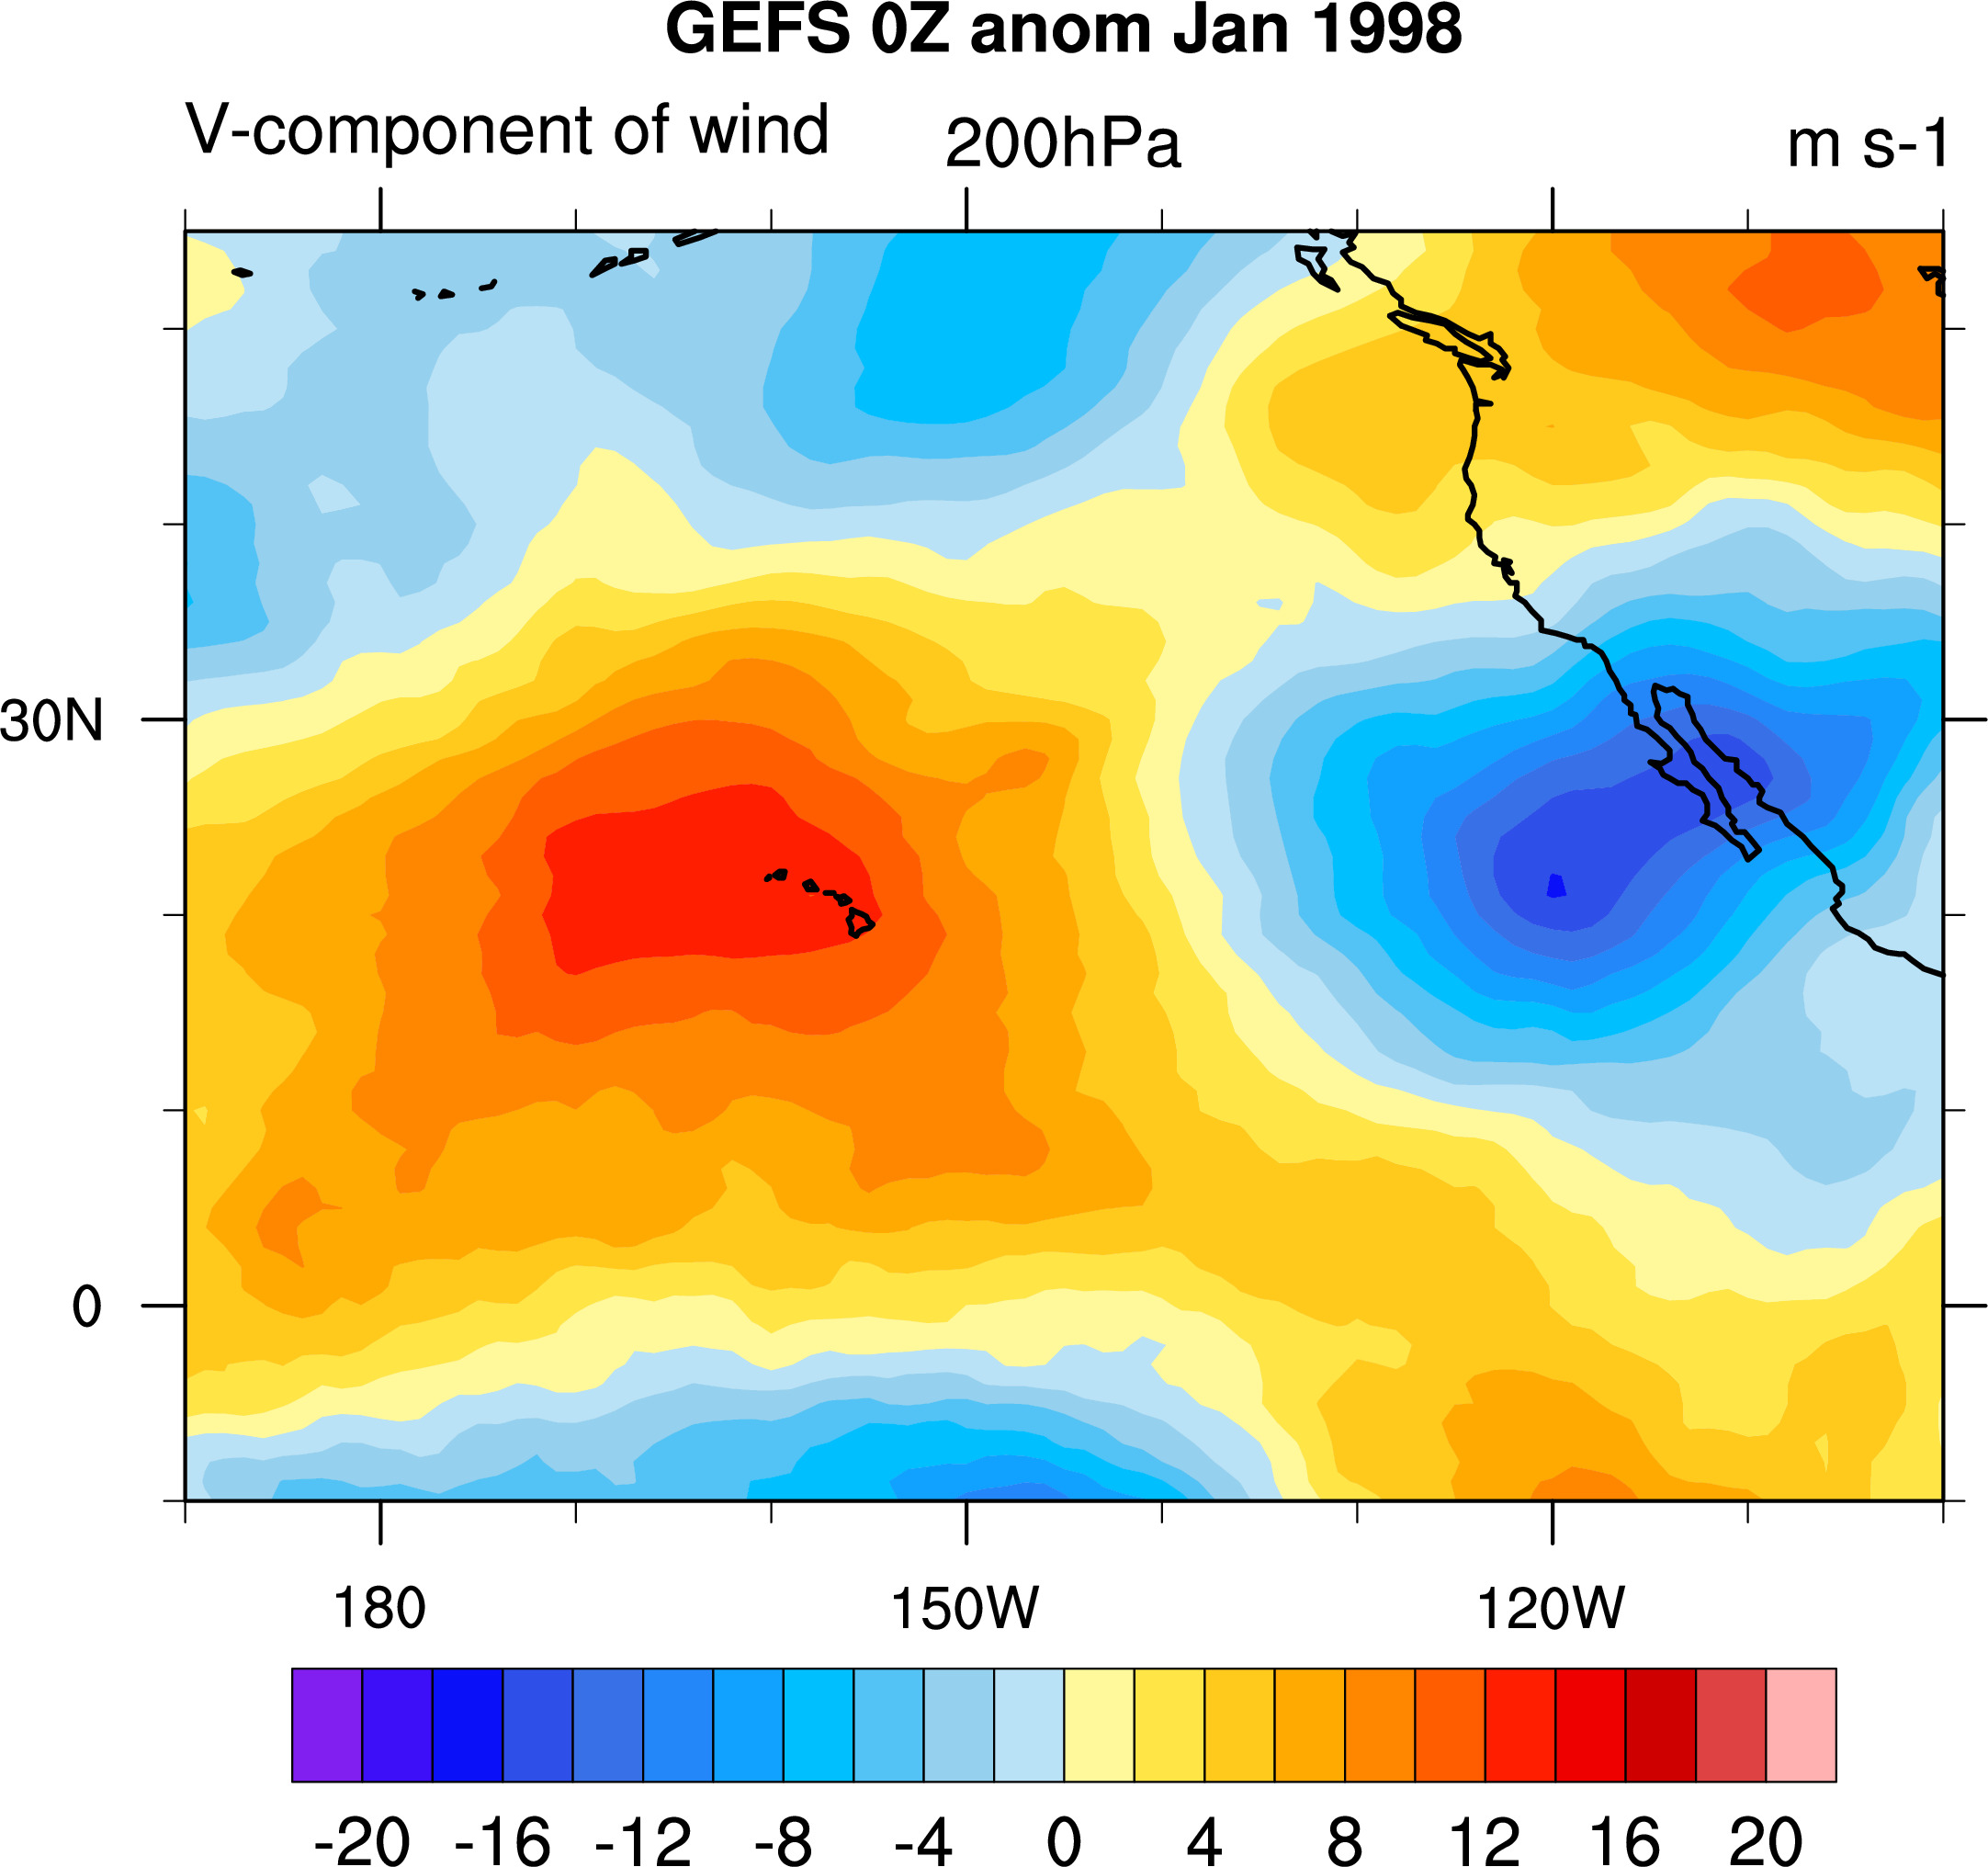
Following calculations all done with monthly means of daily wind anomalies
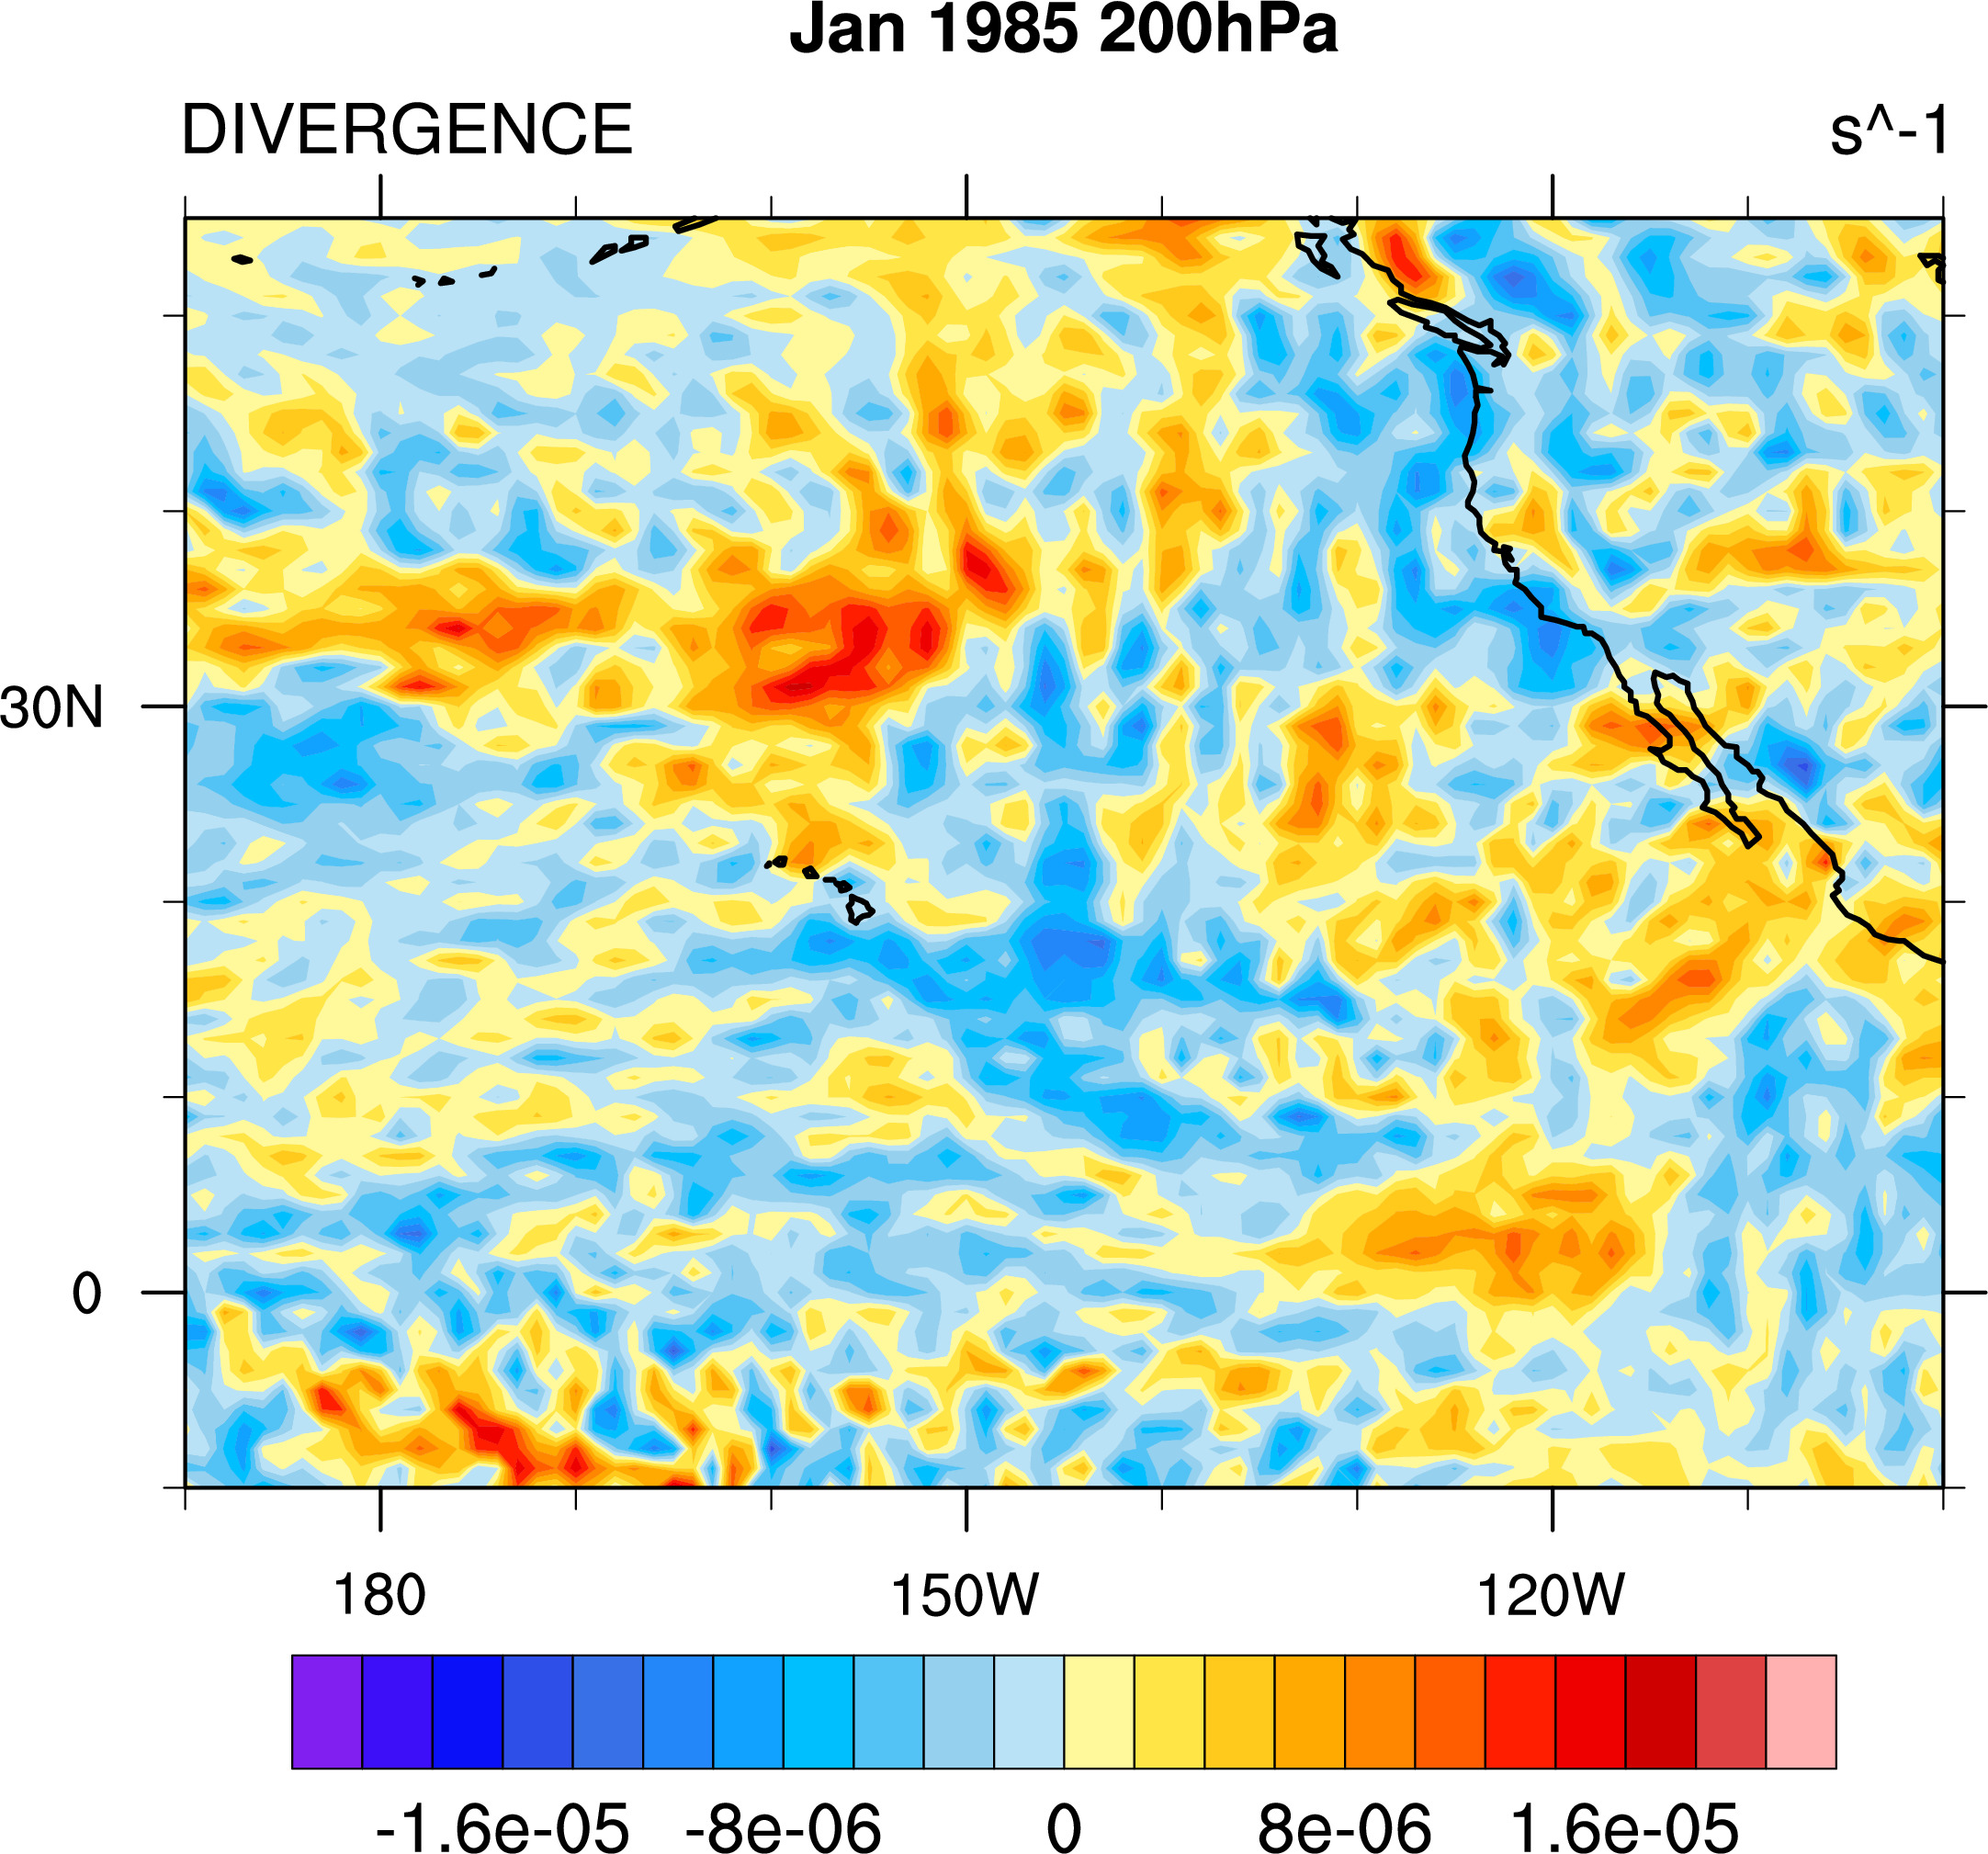
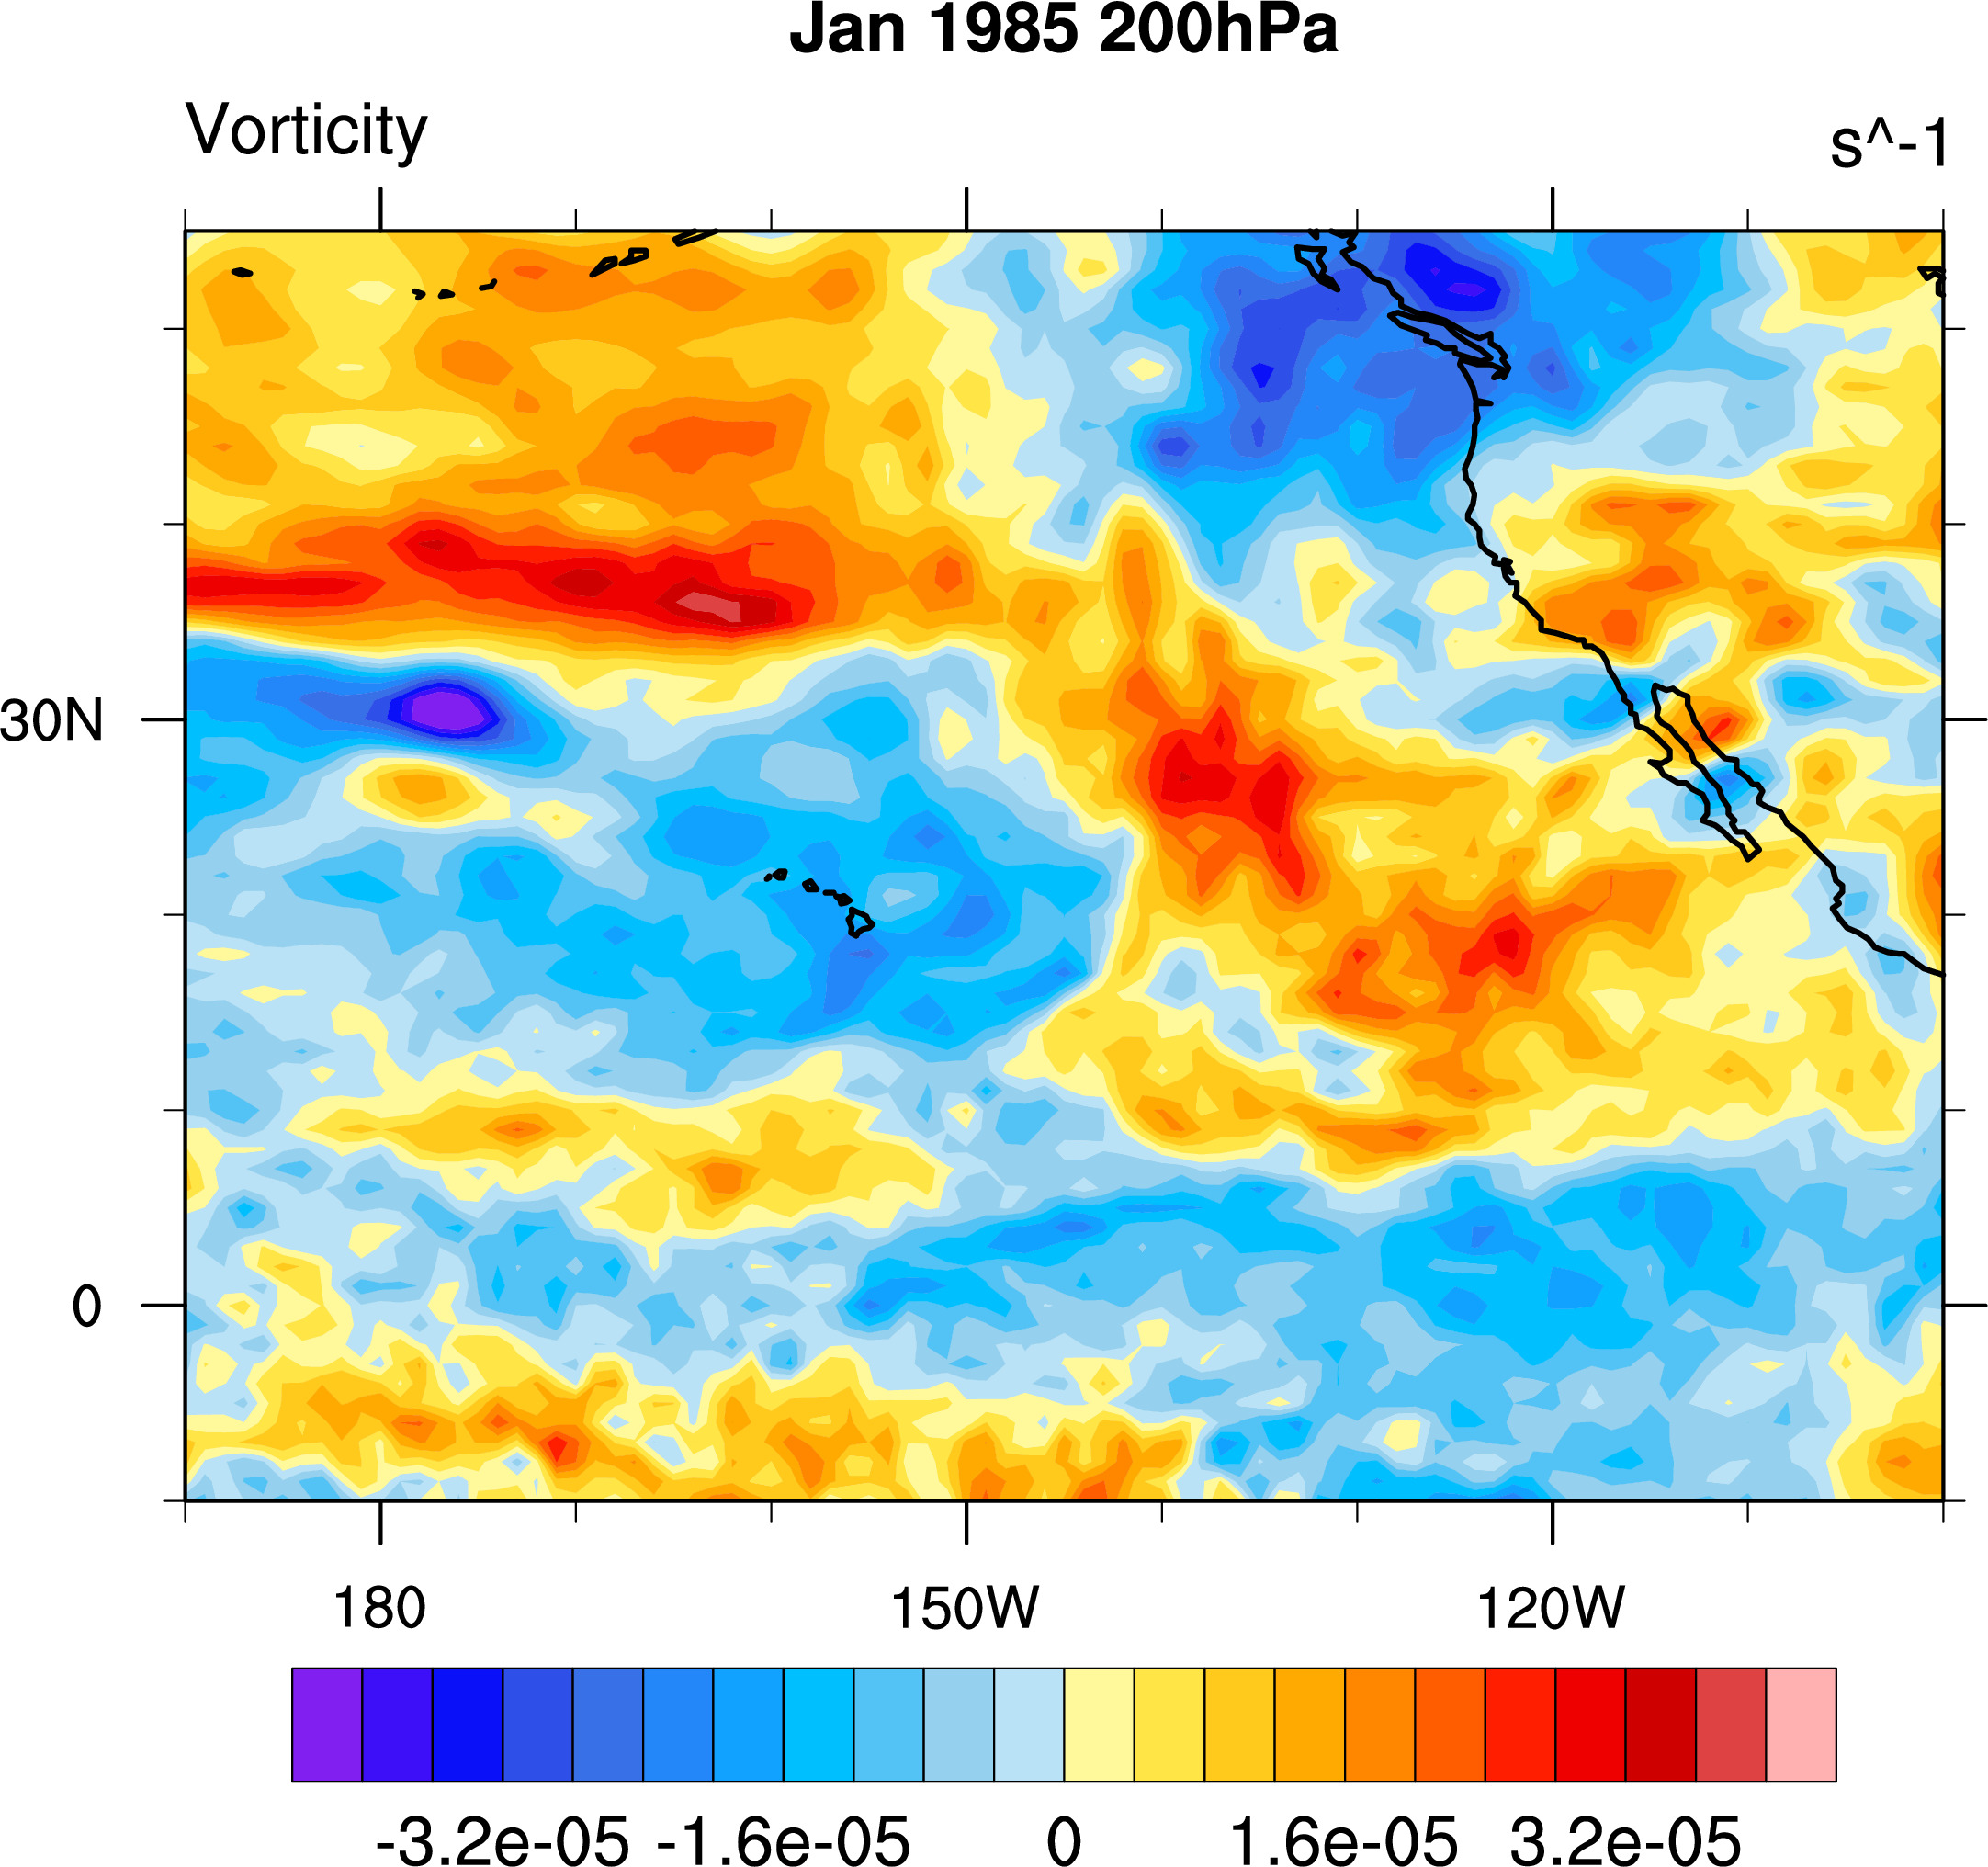
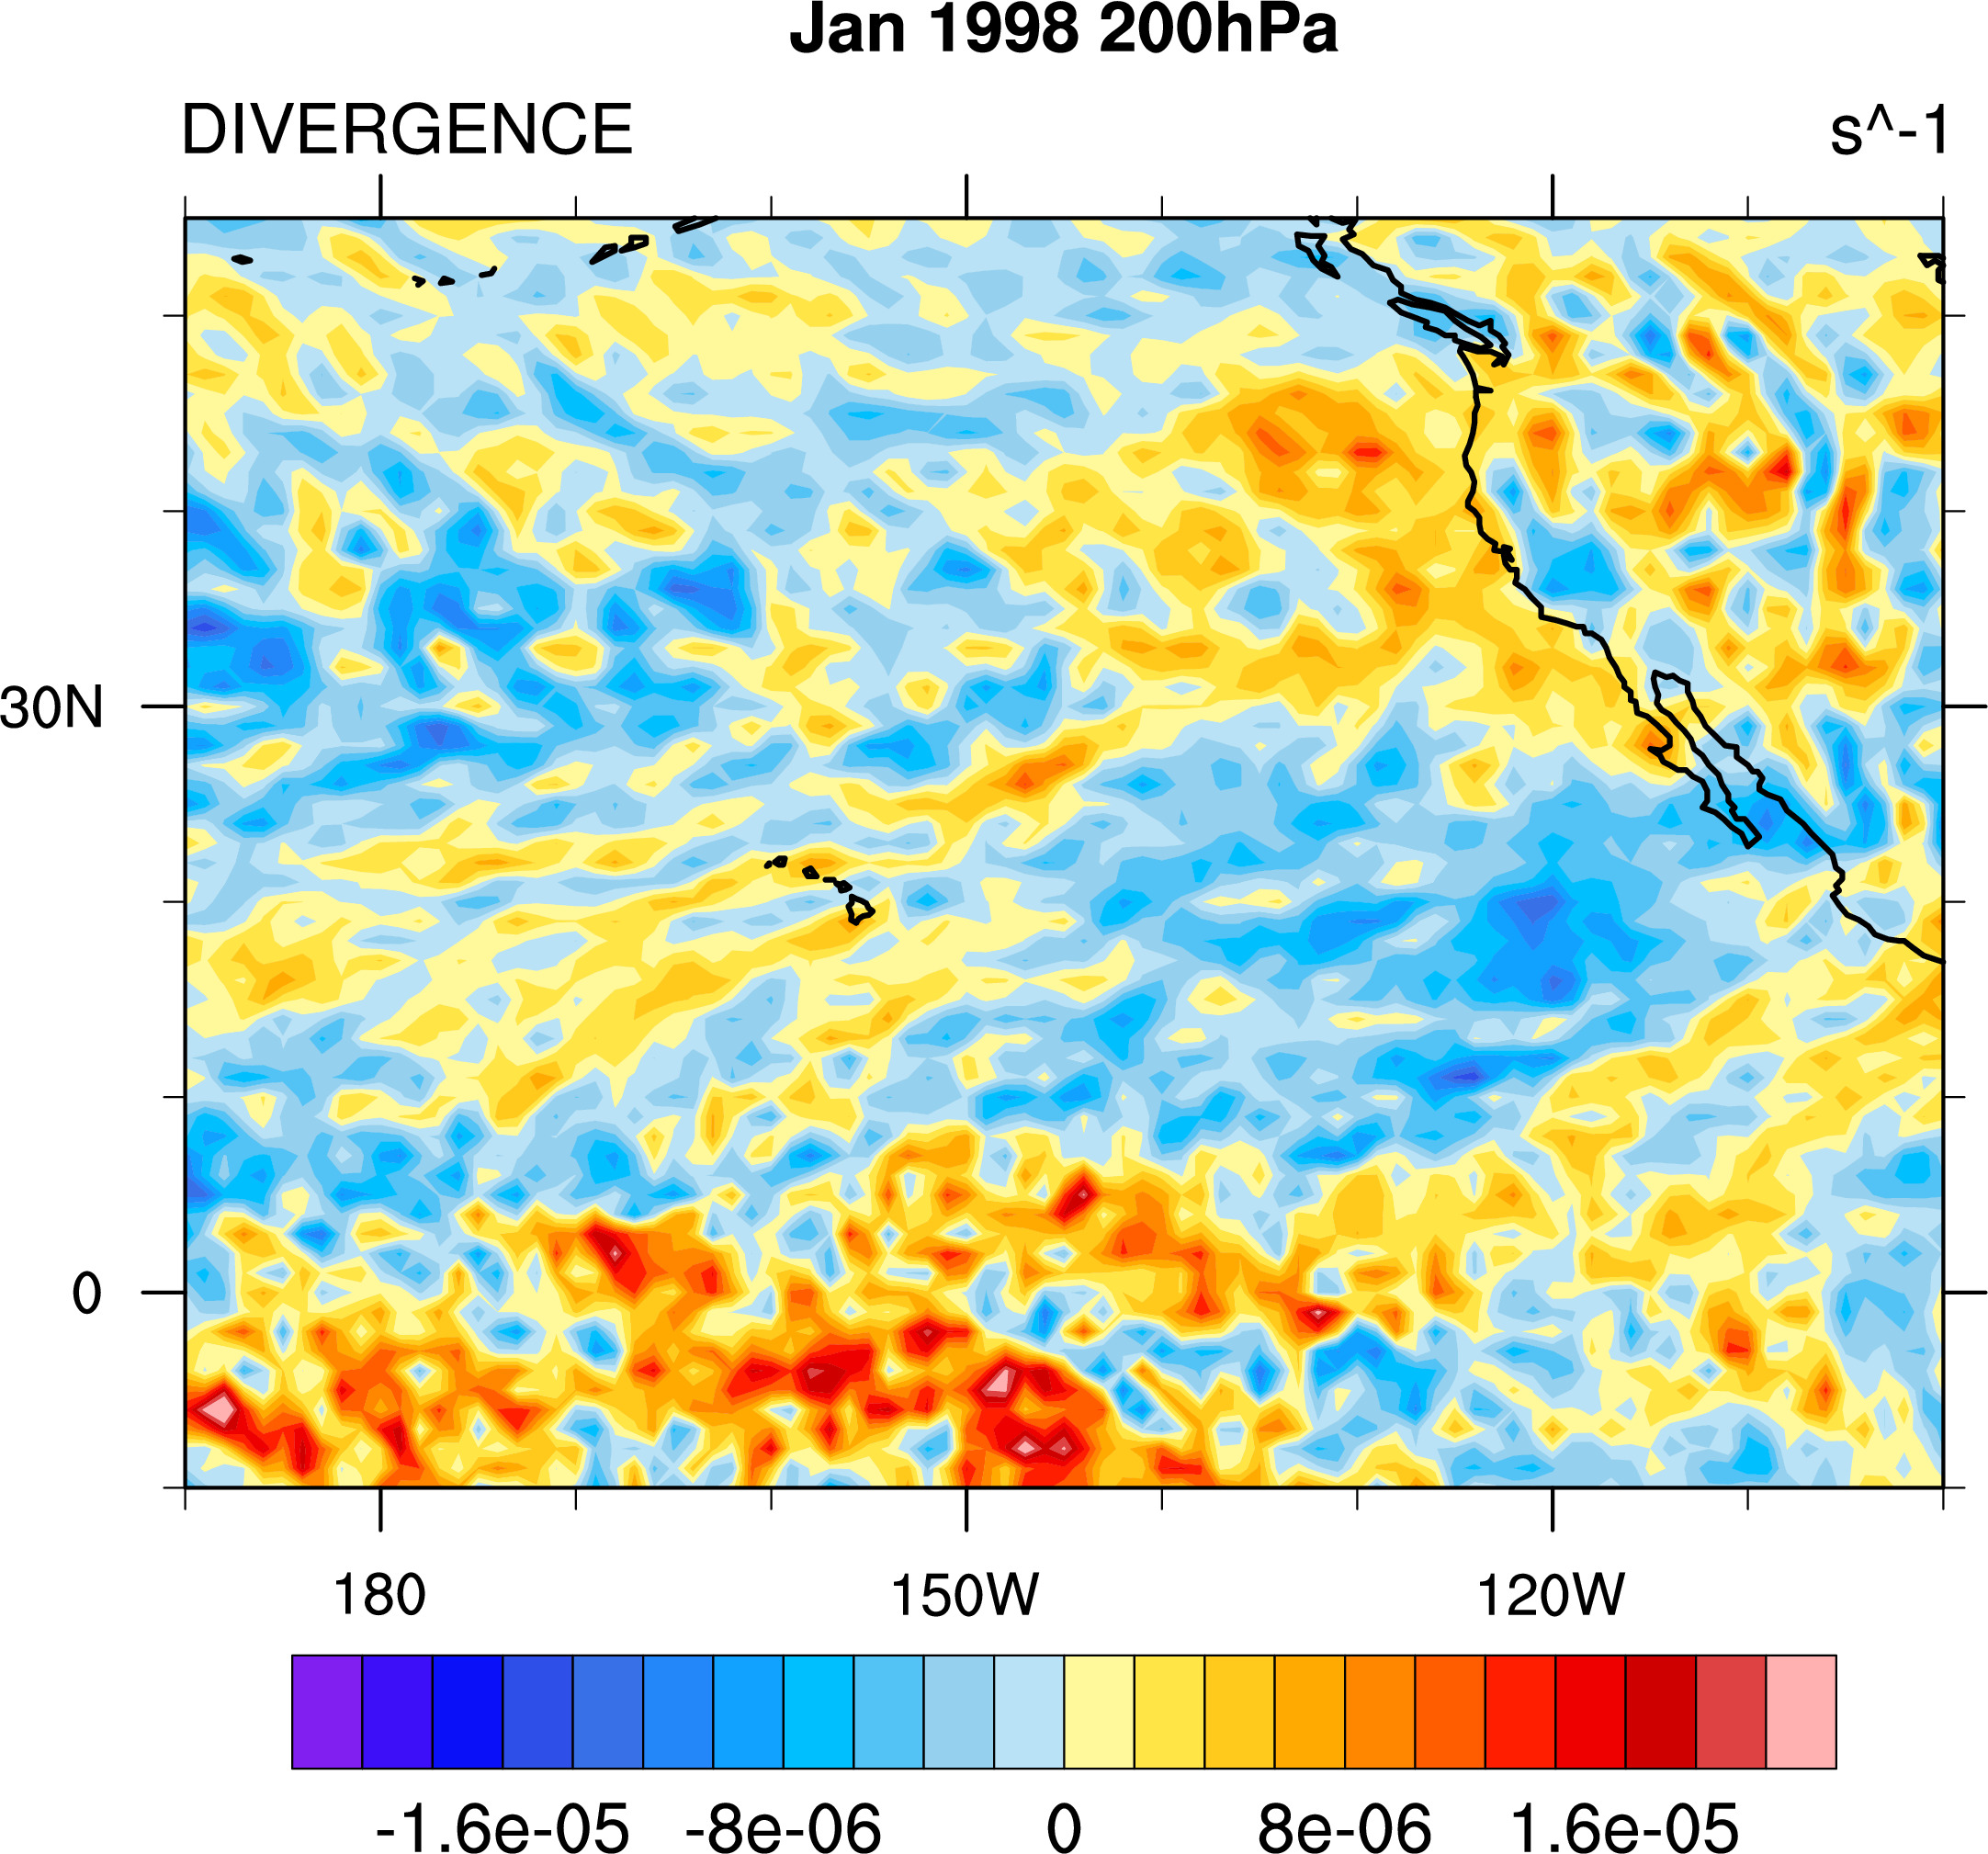
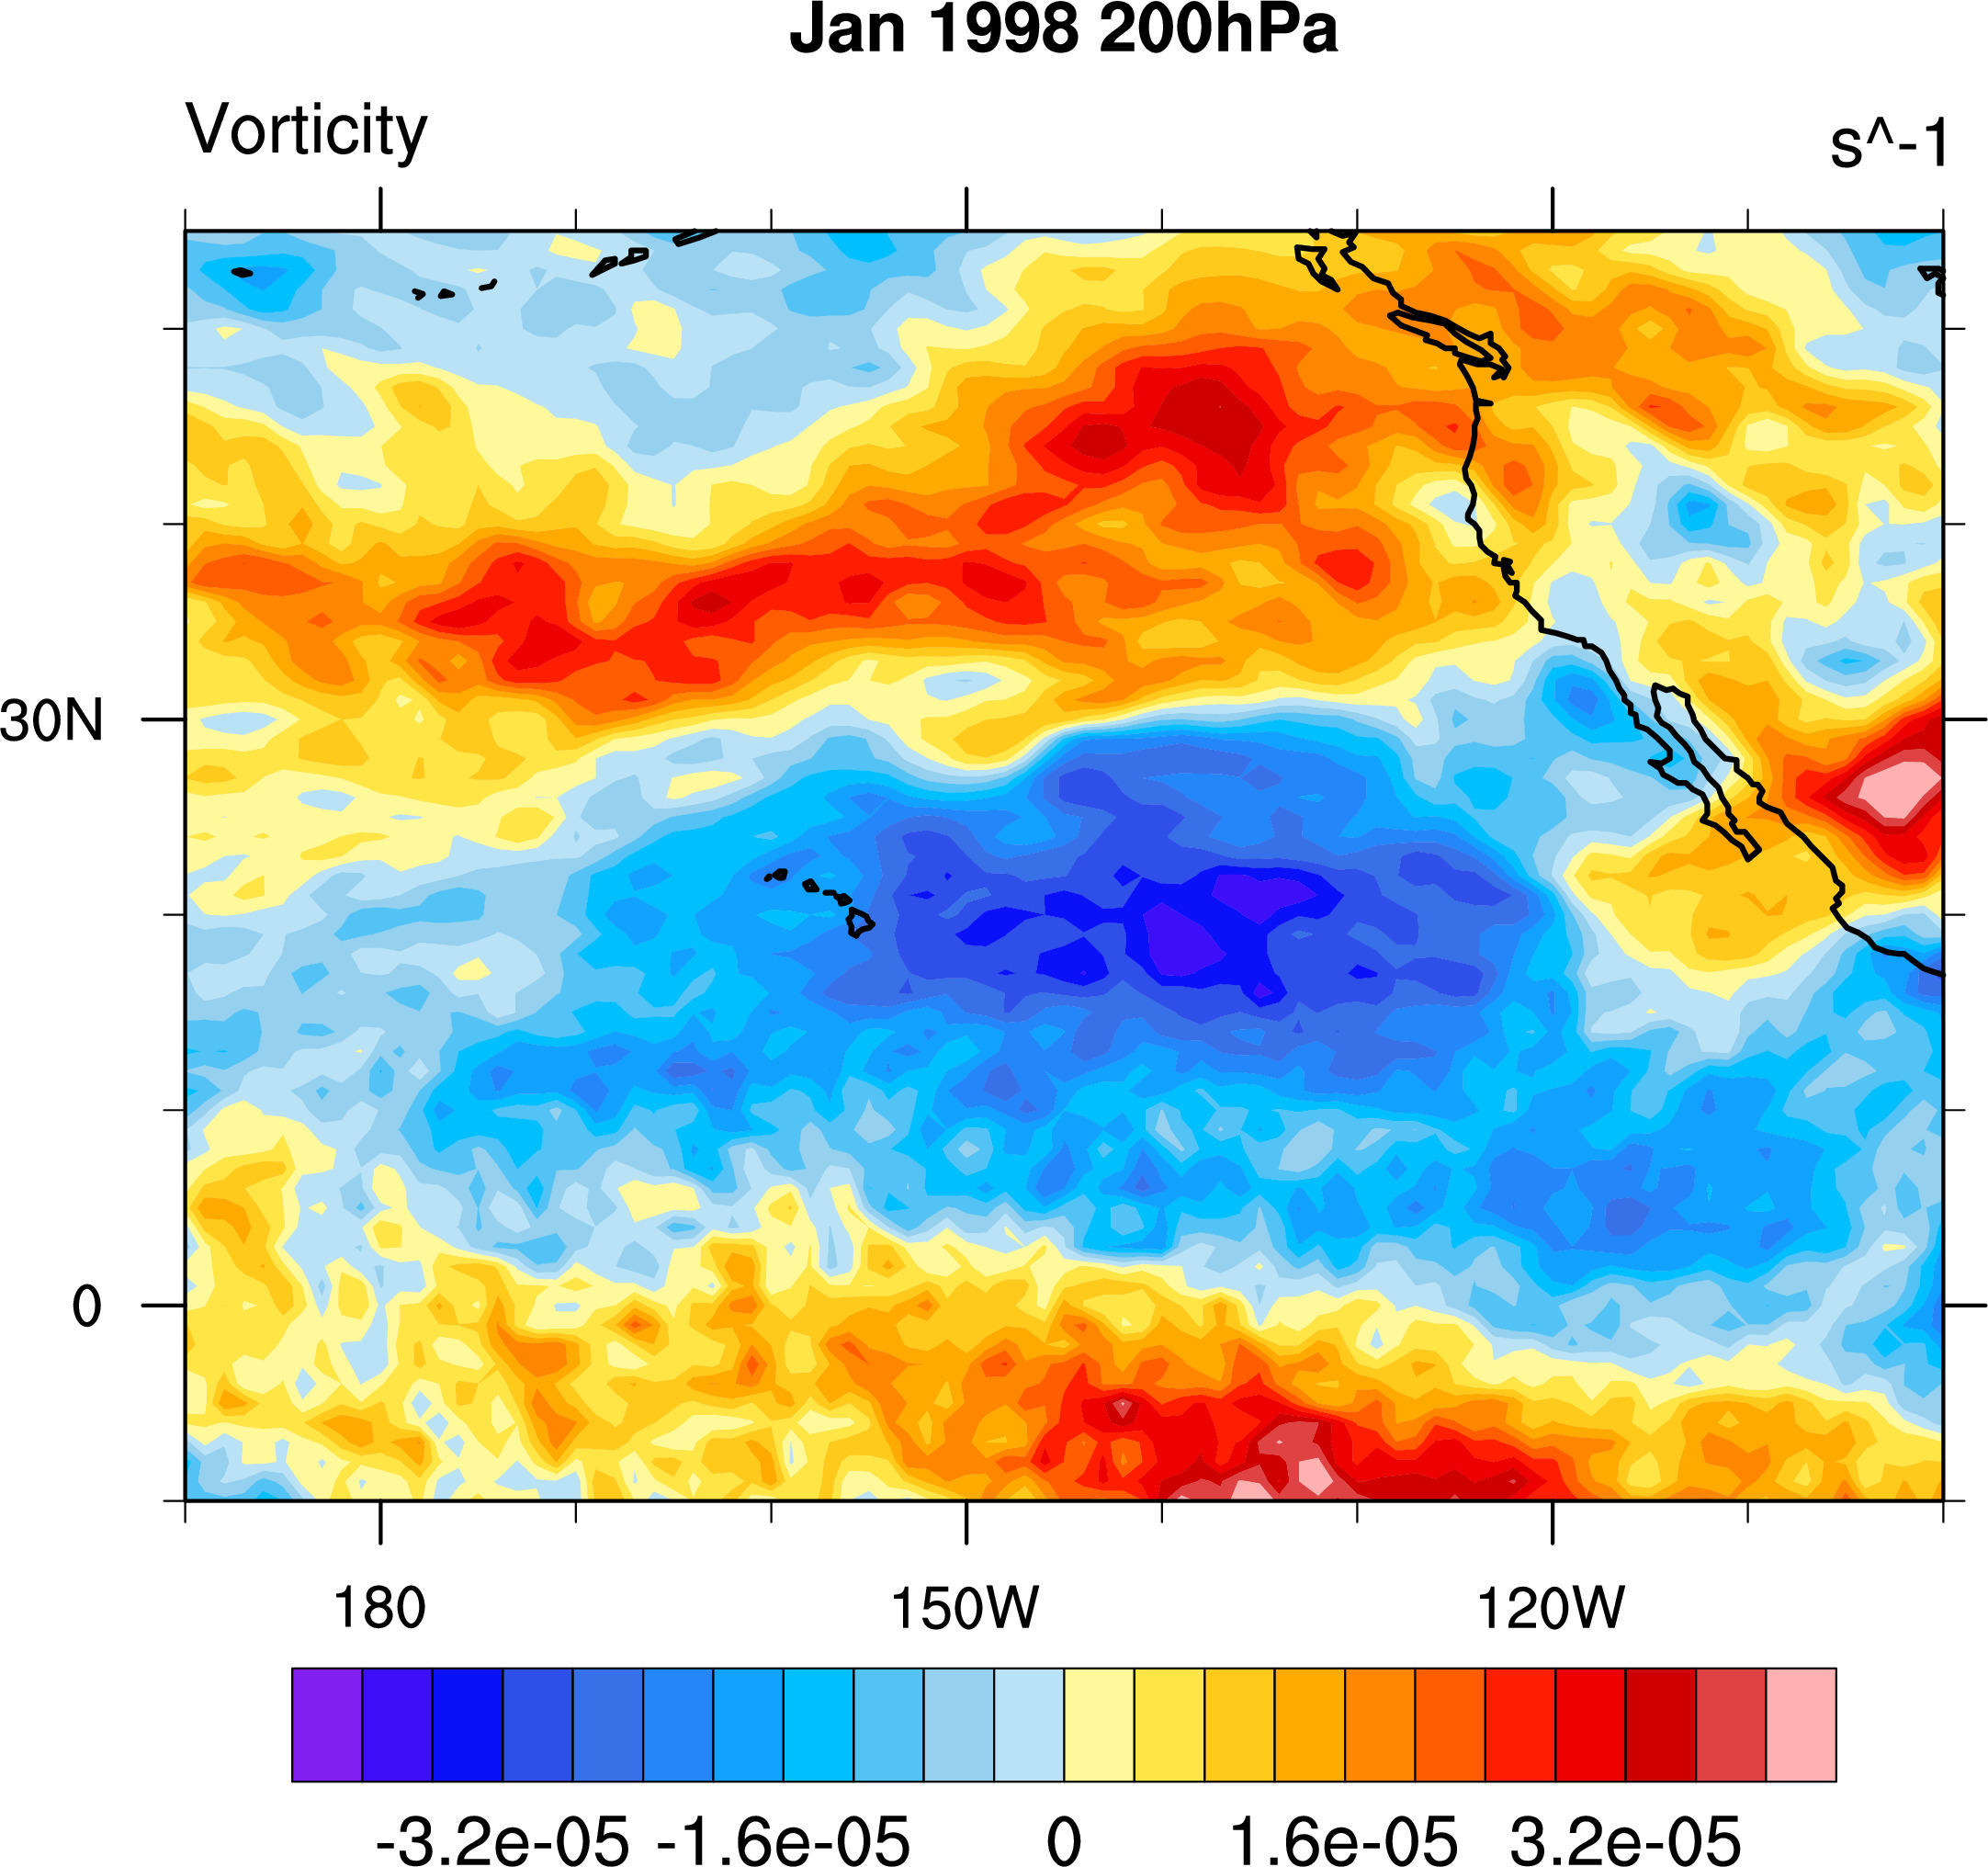
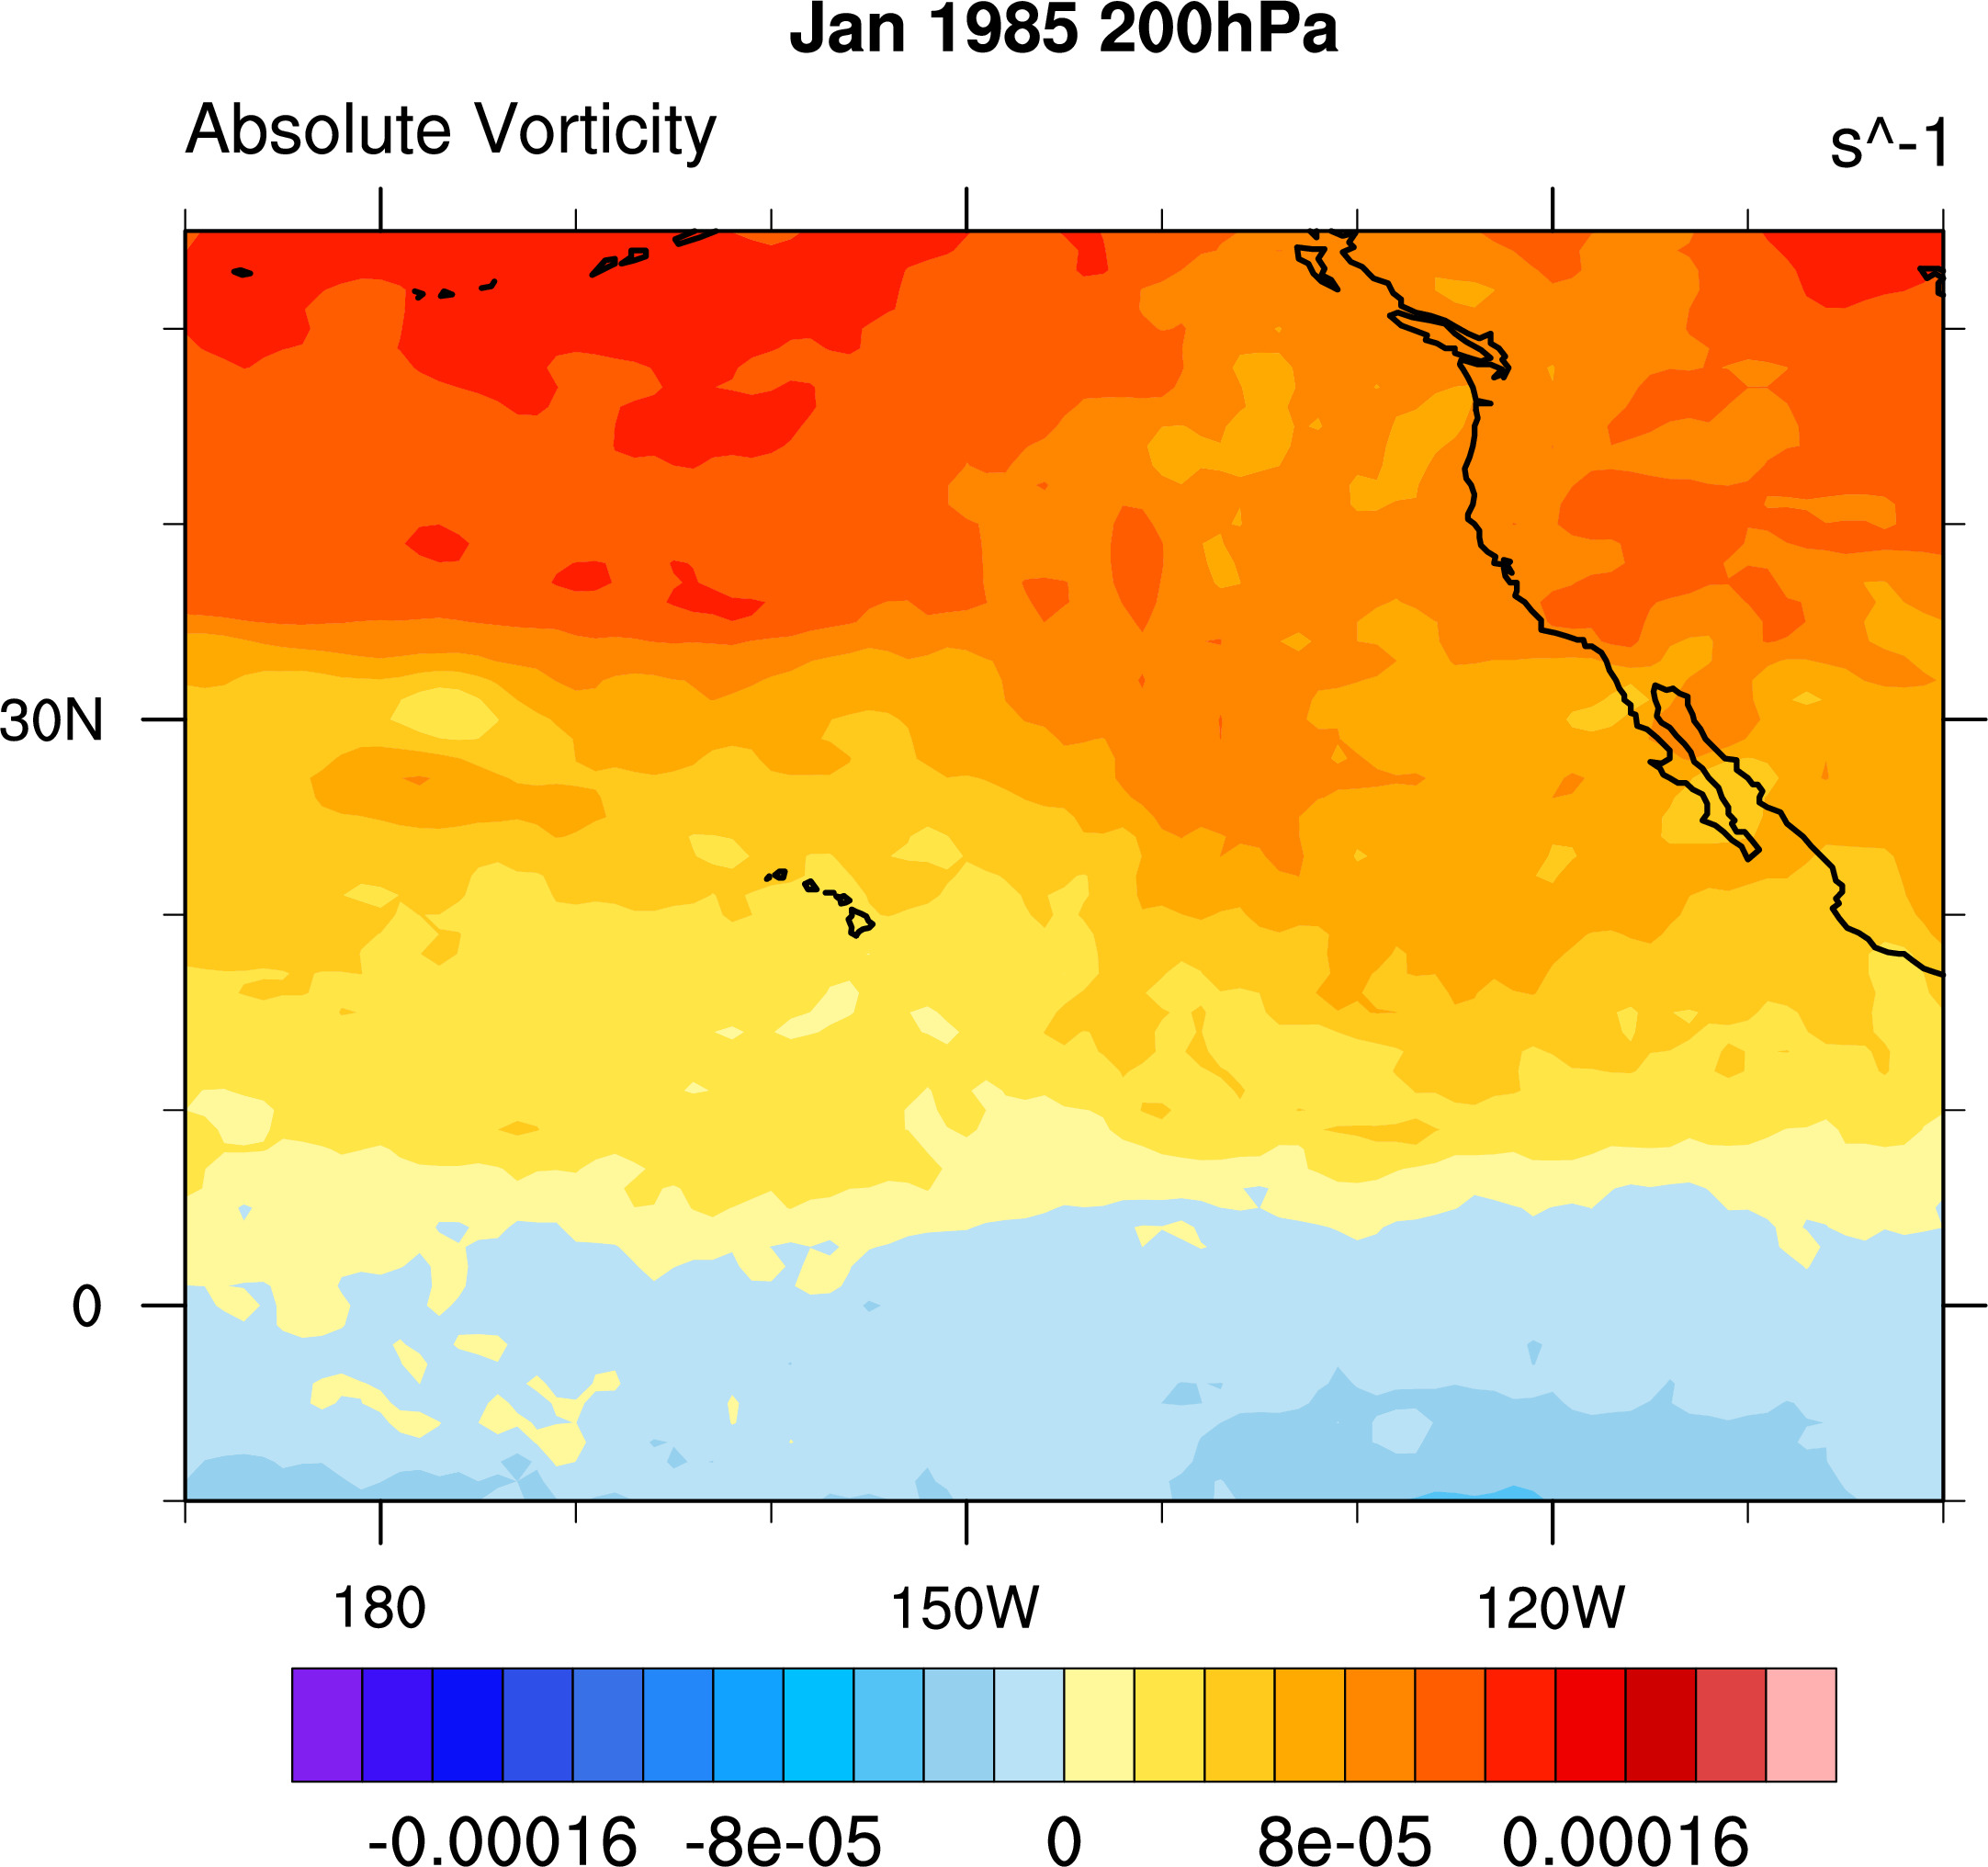
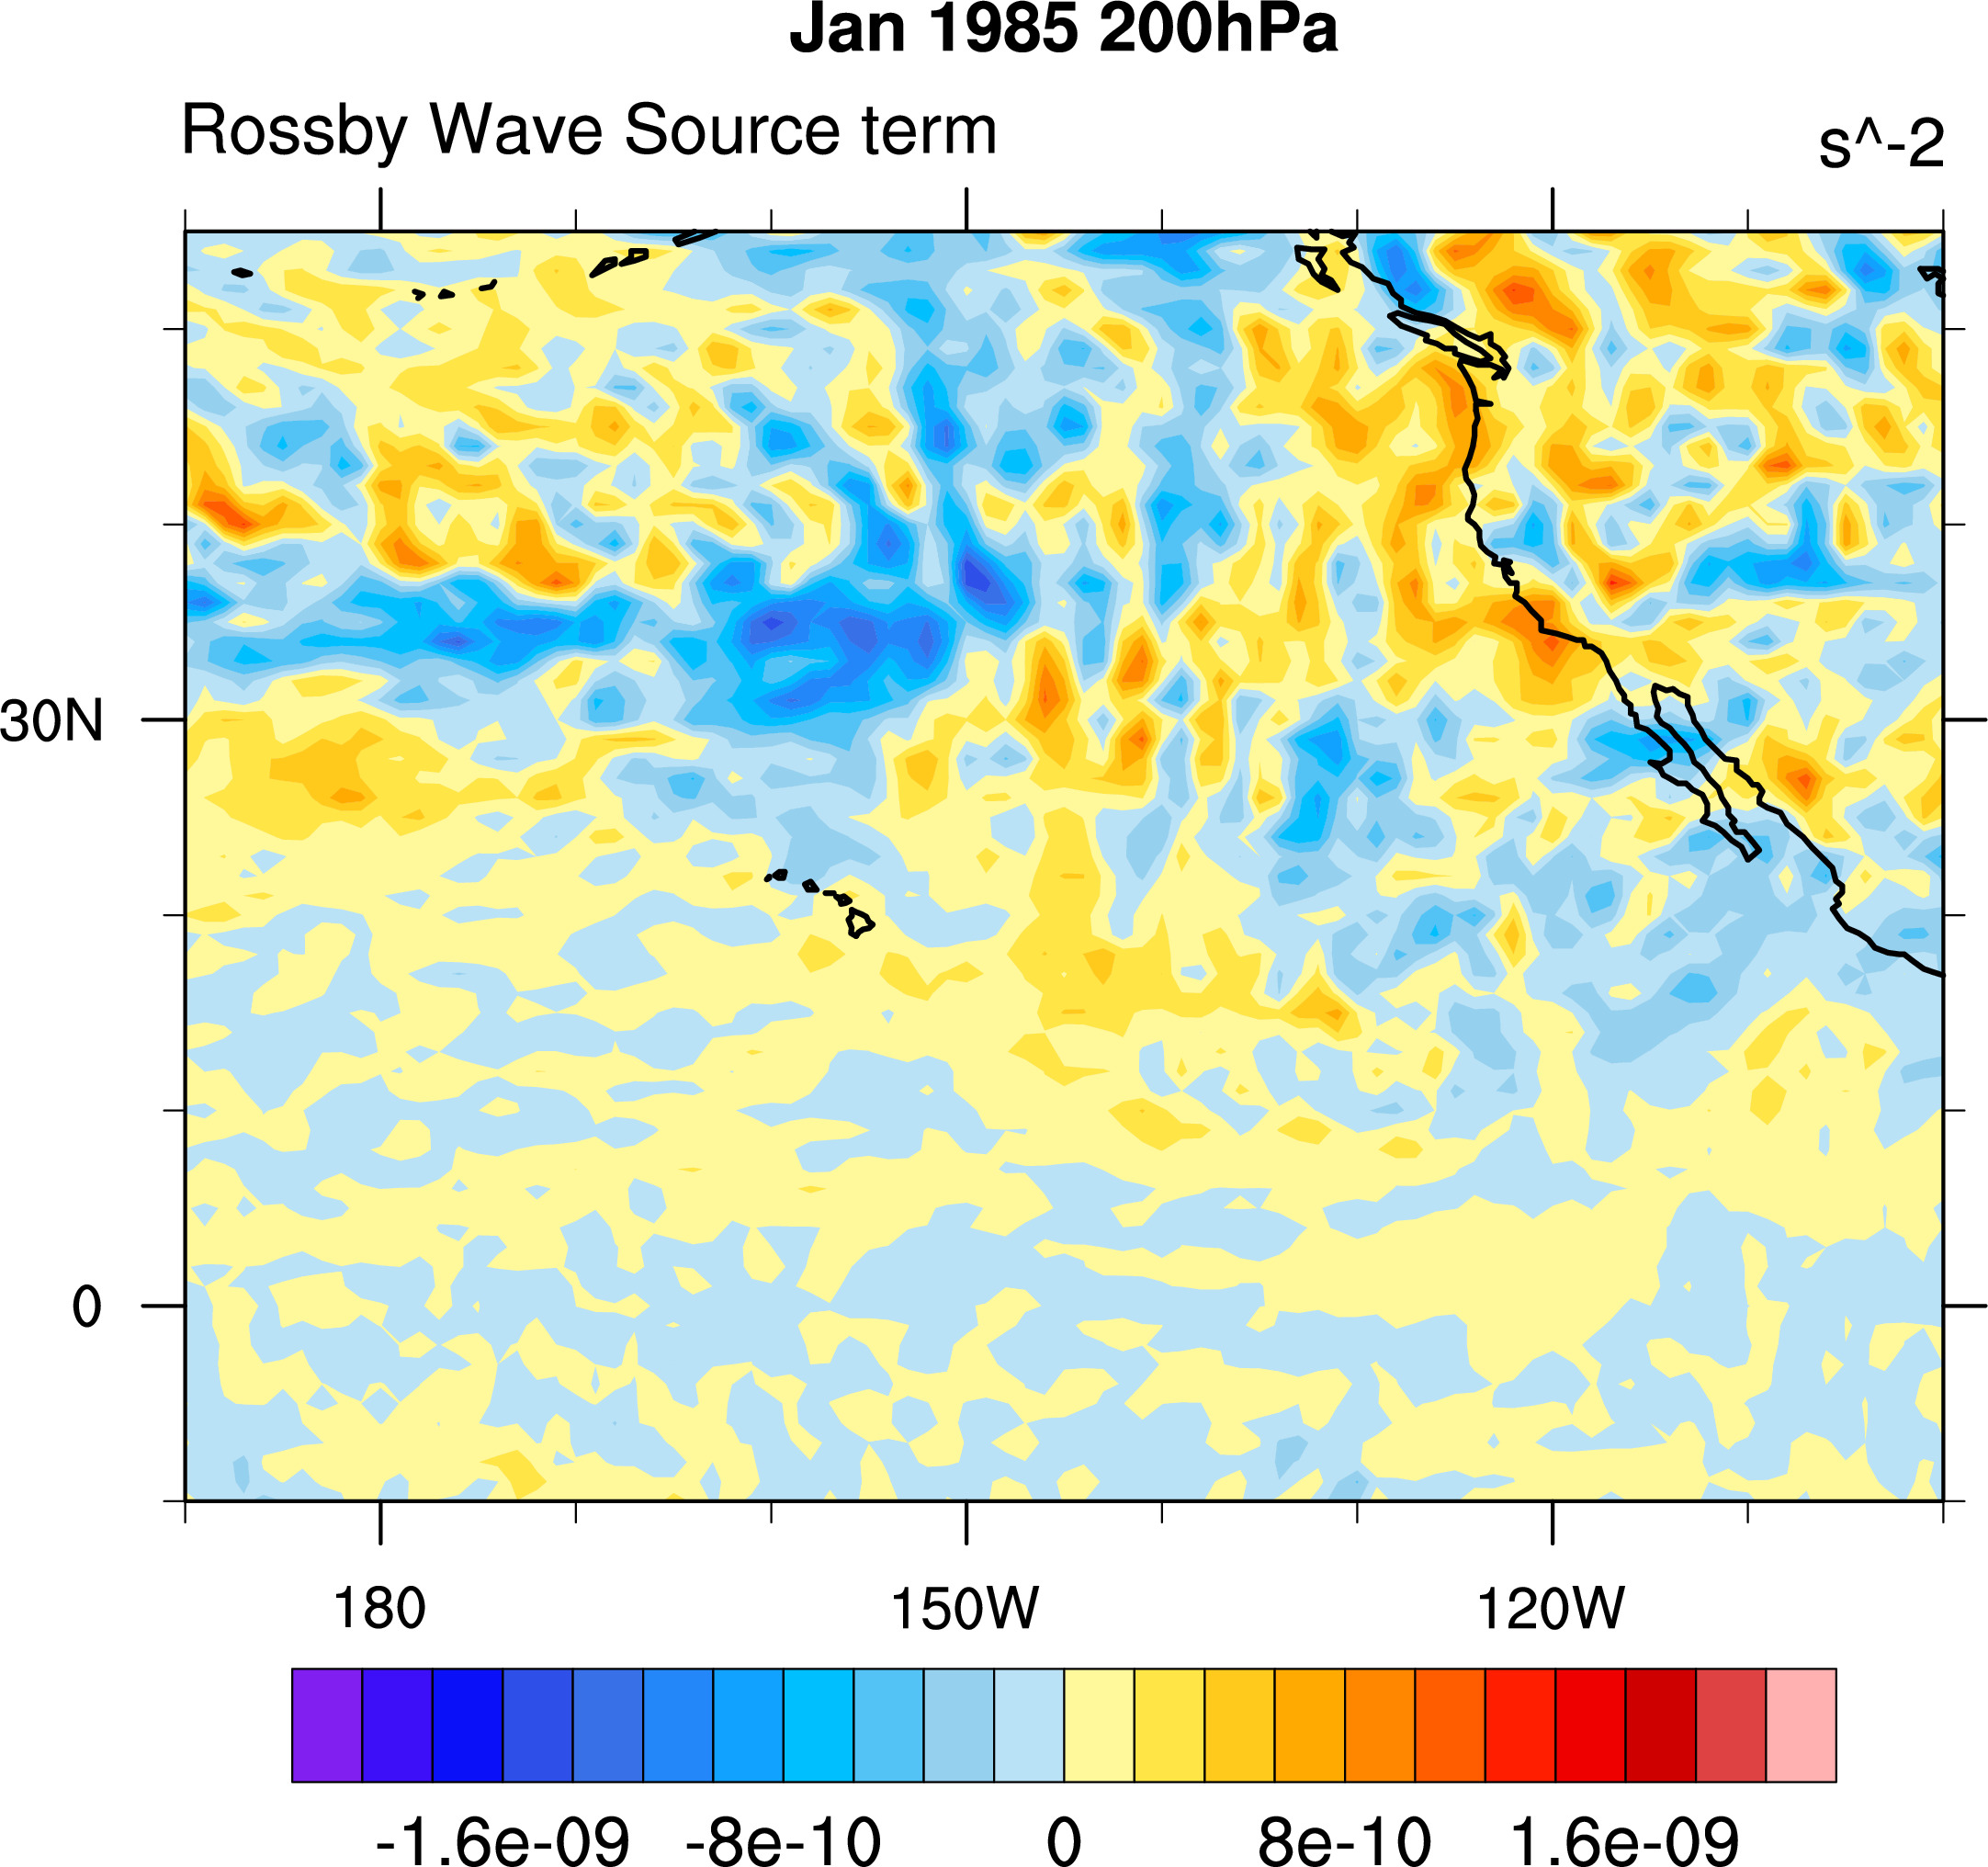
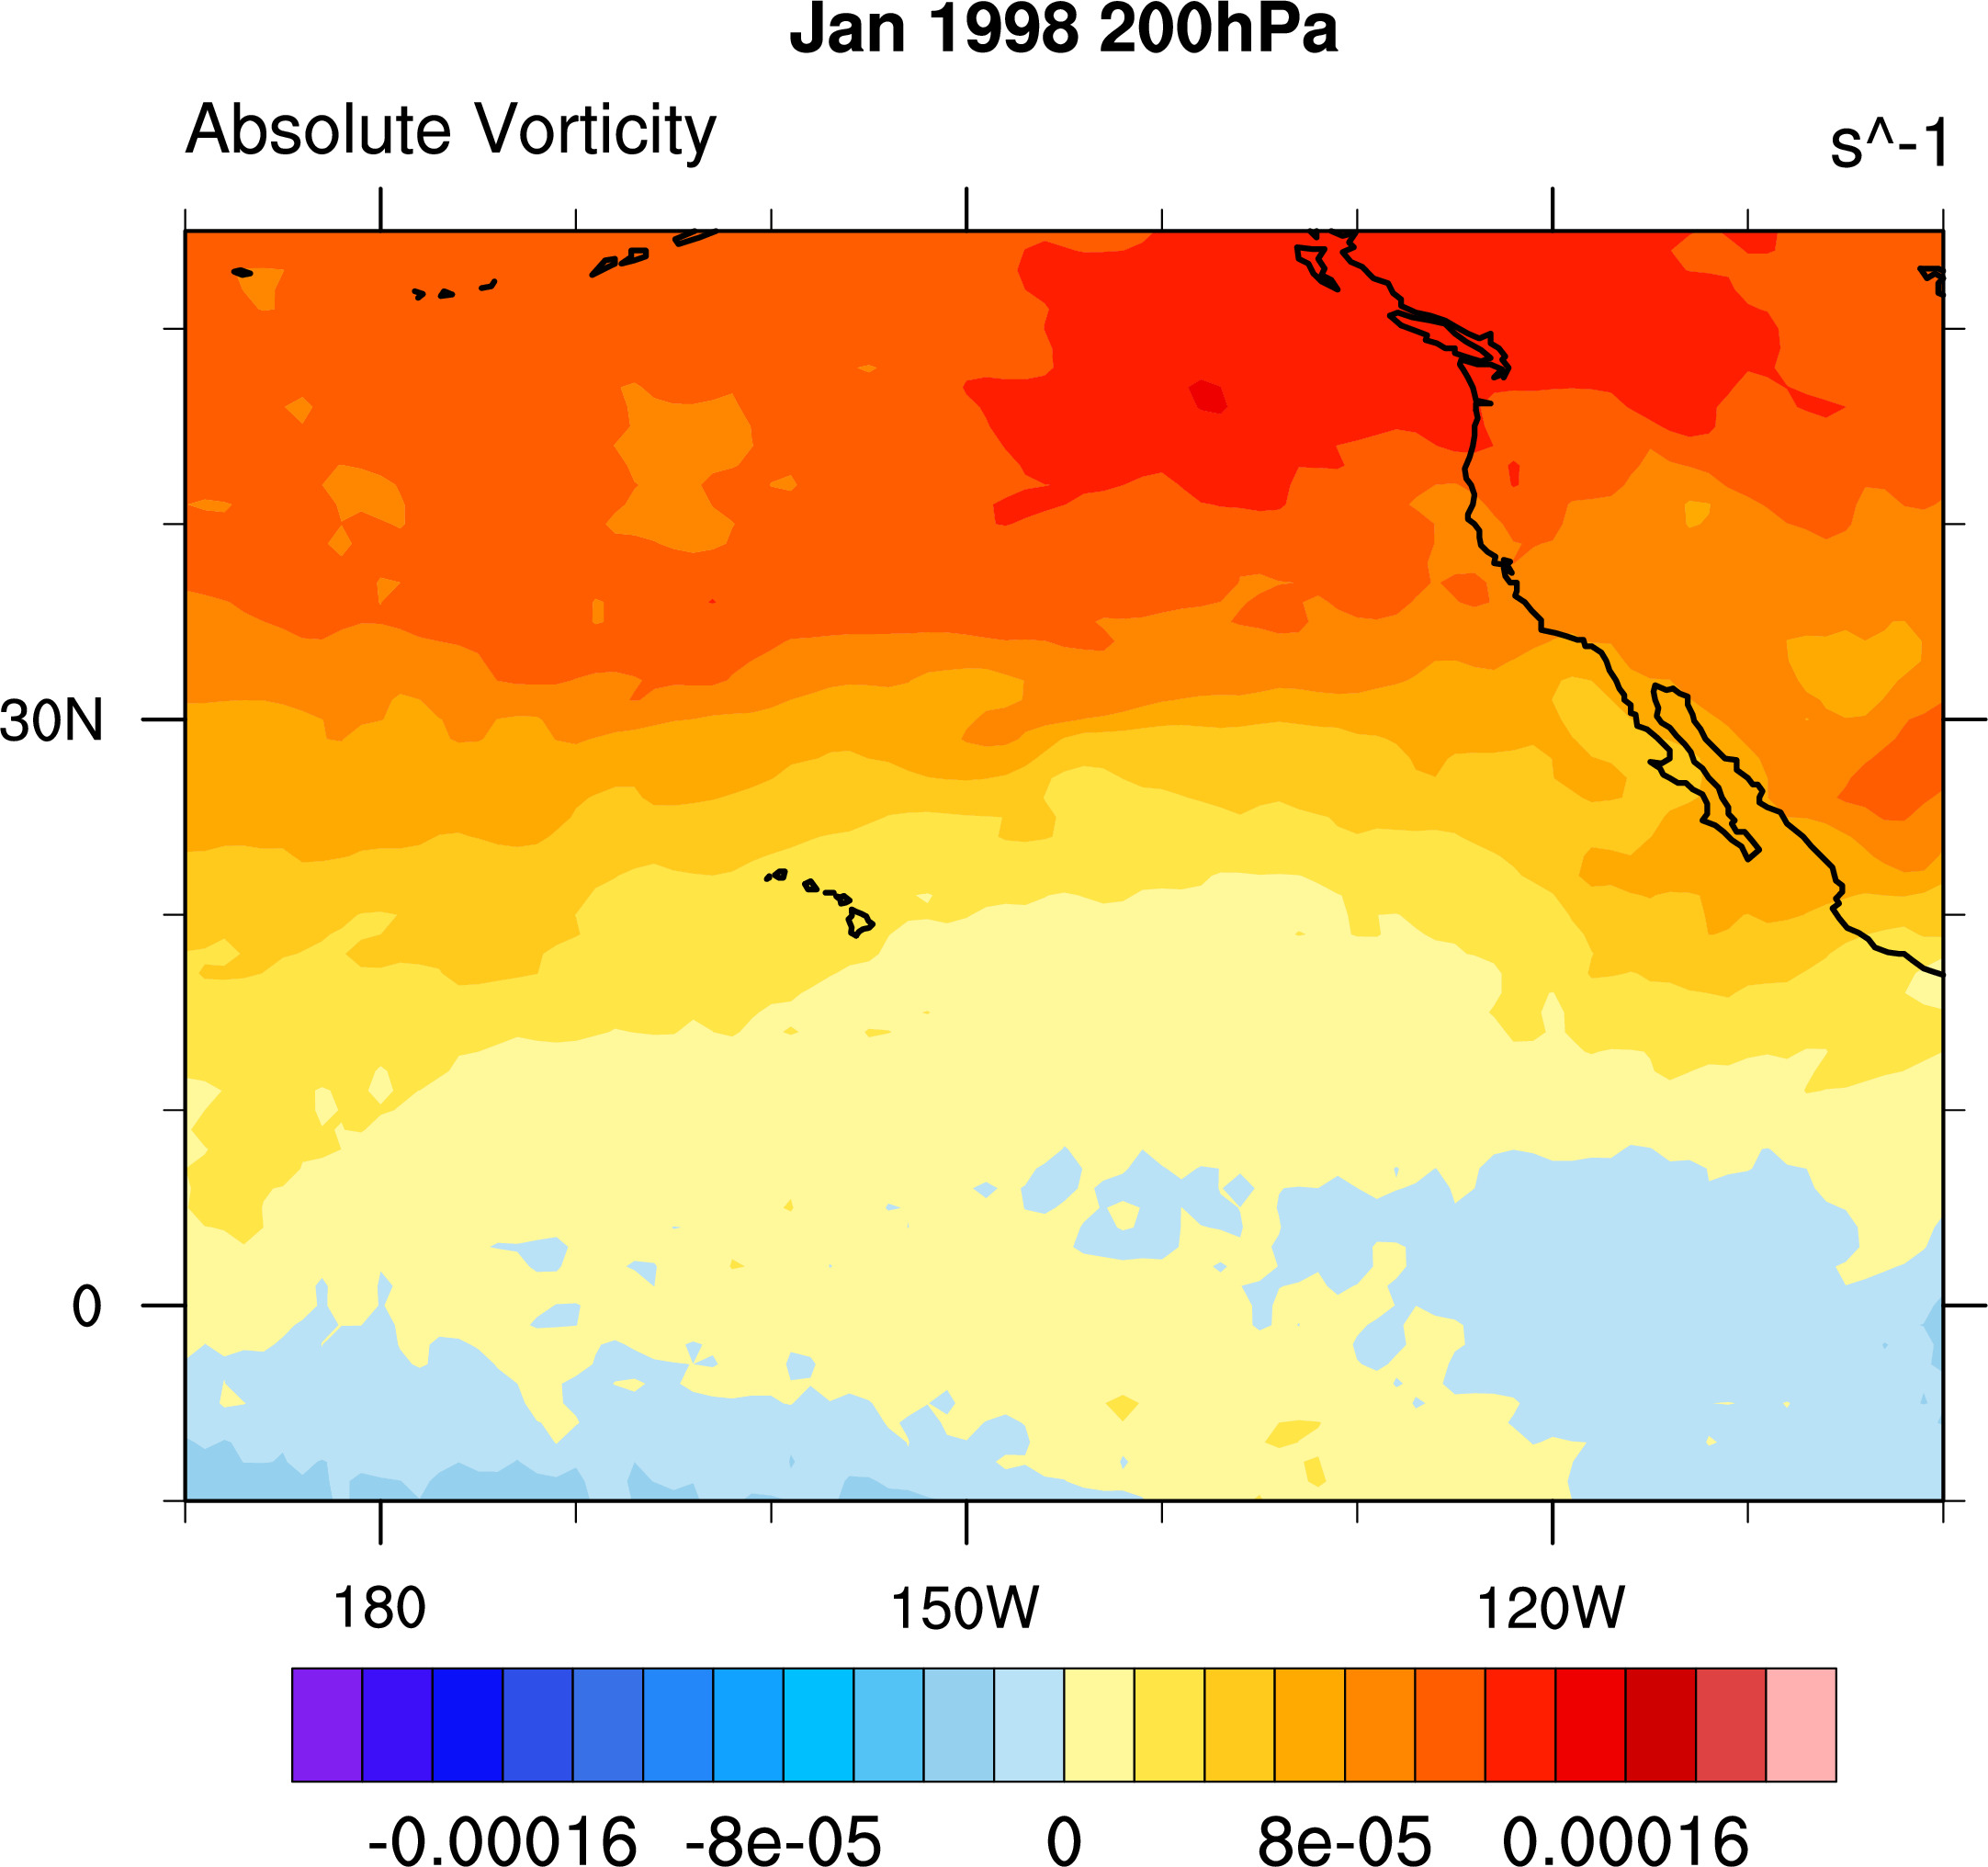
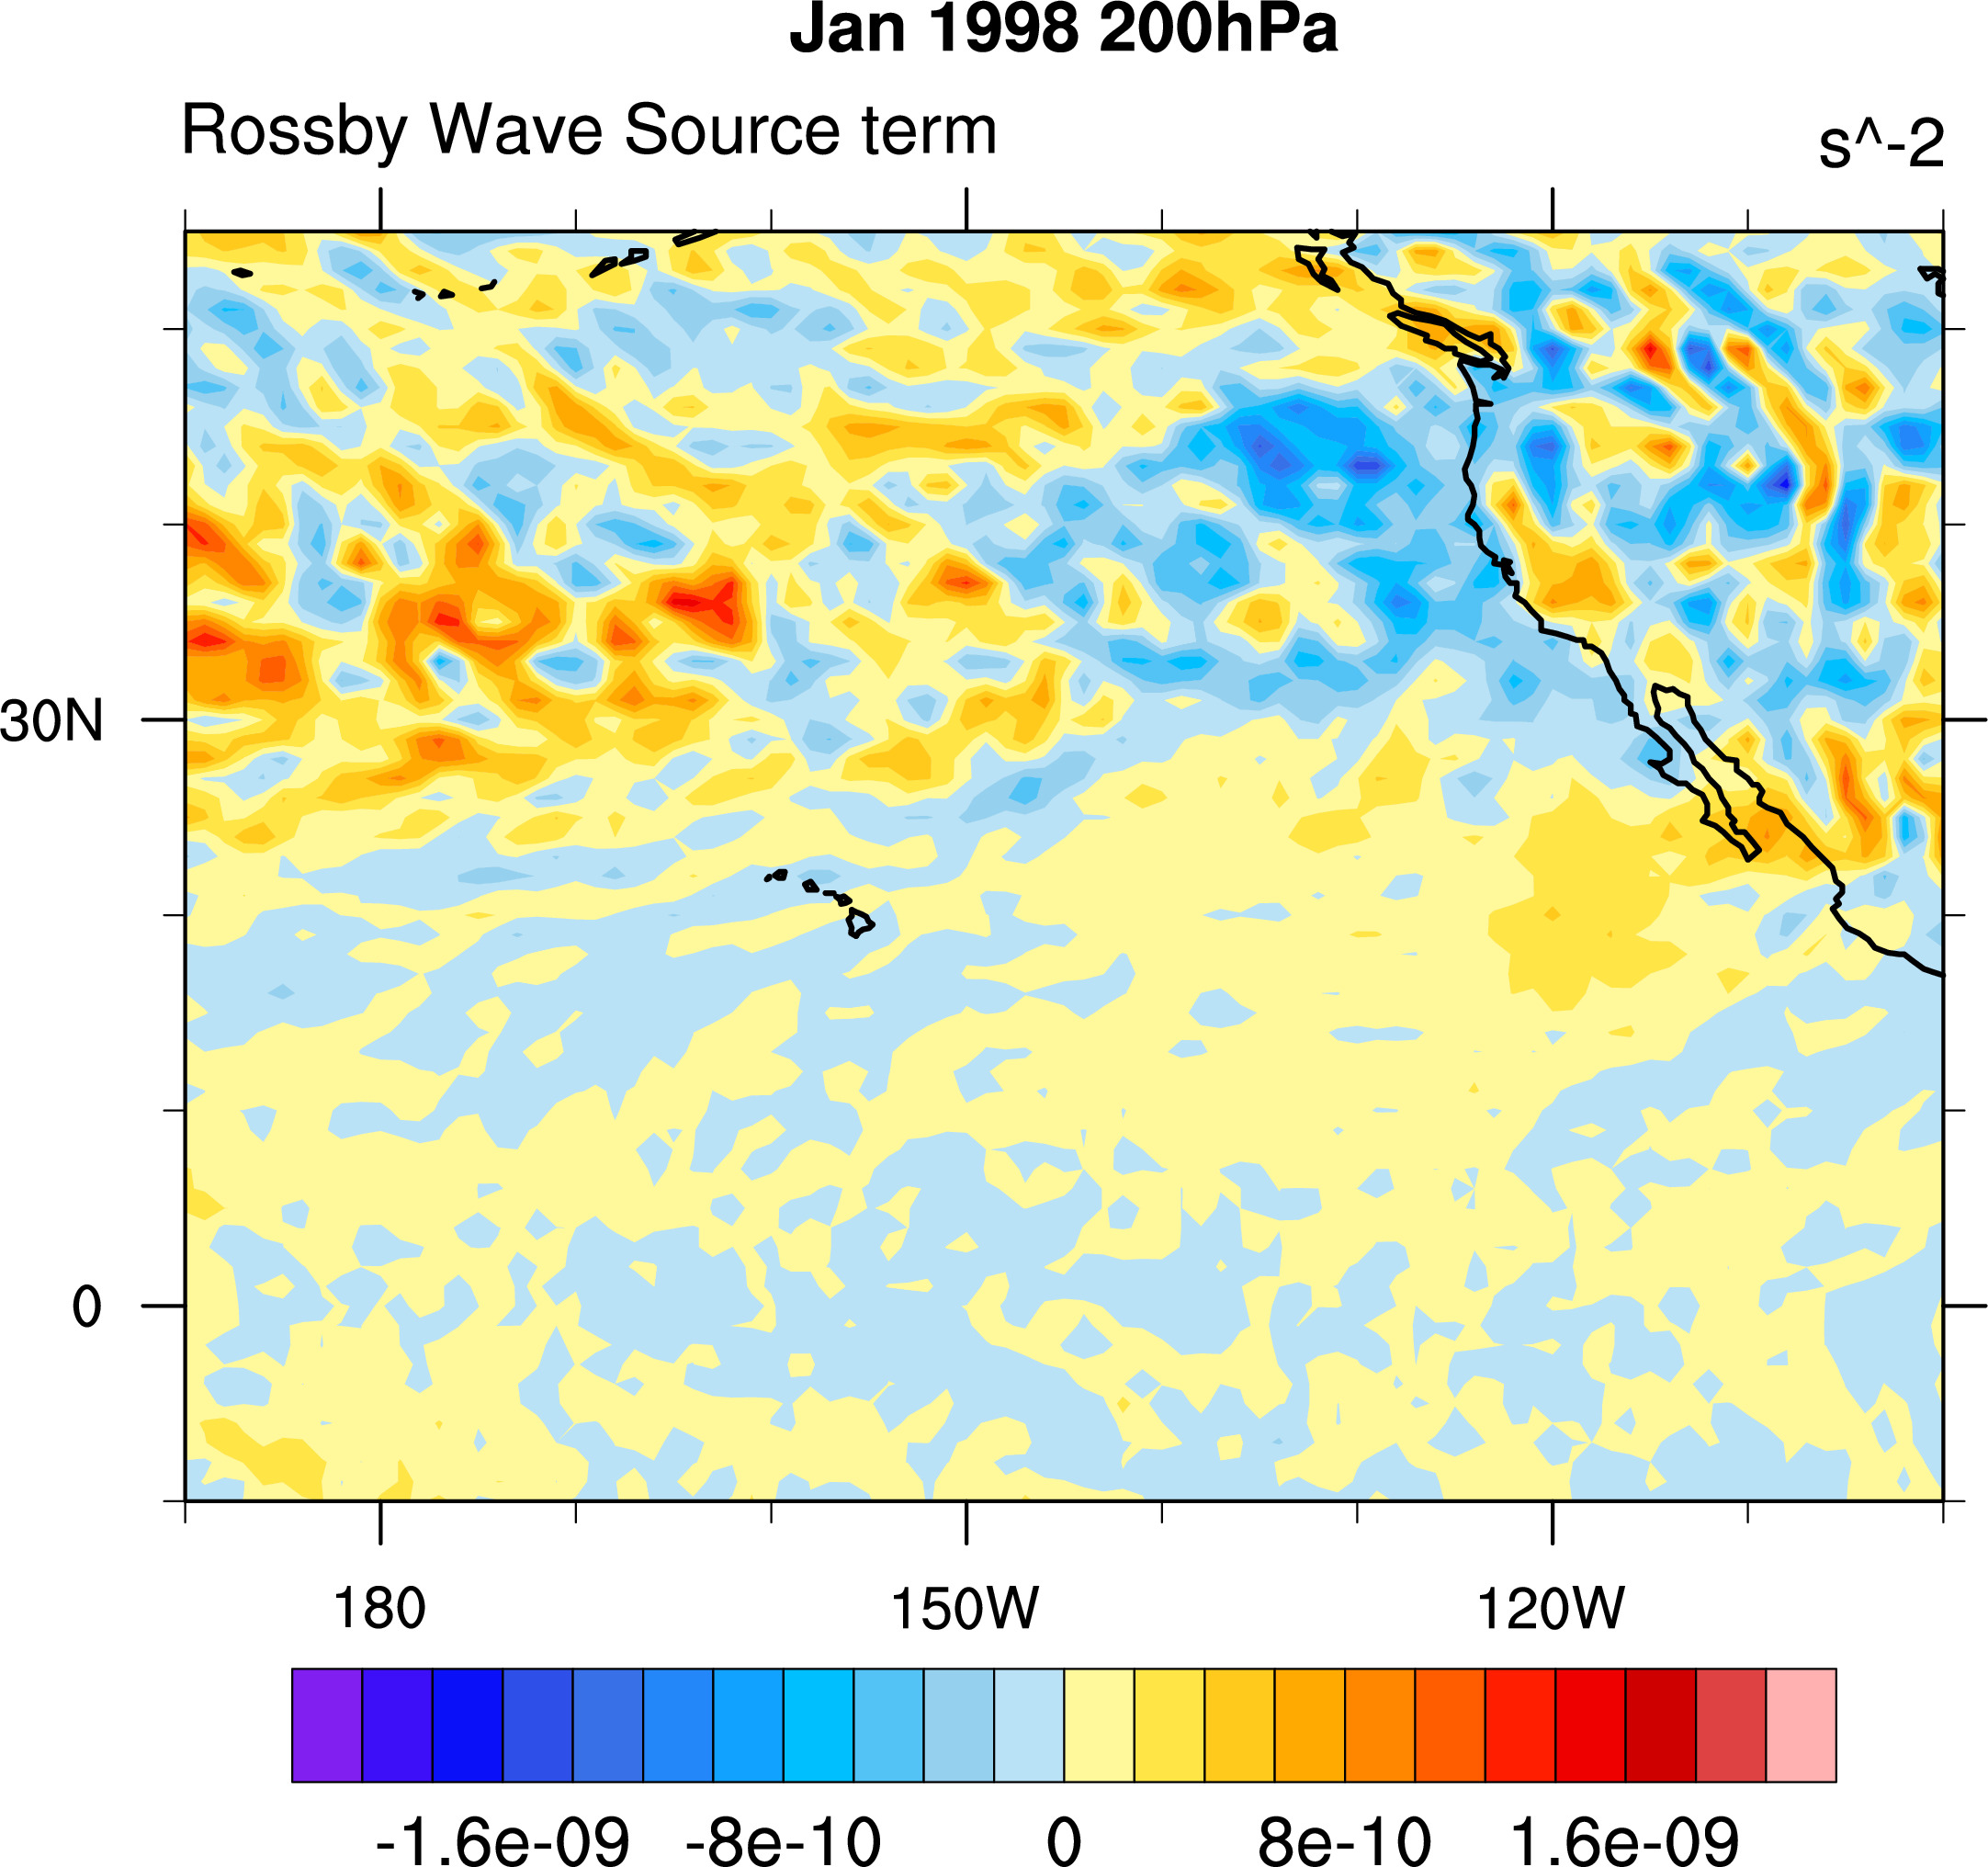
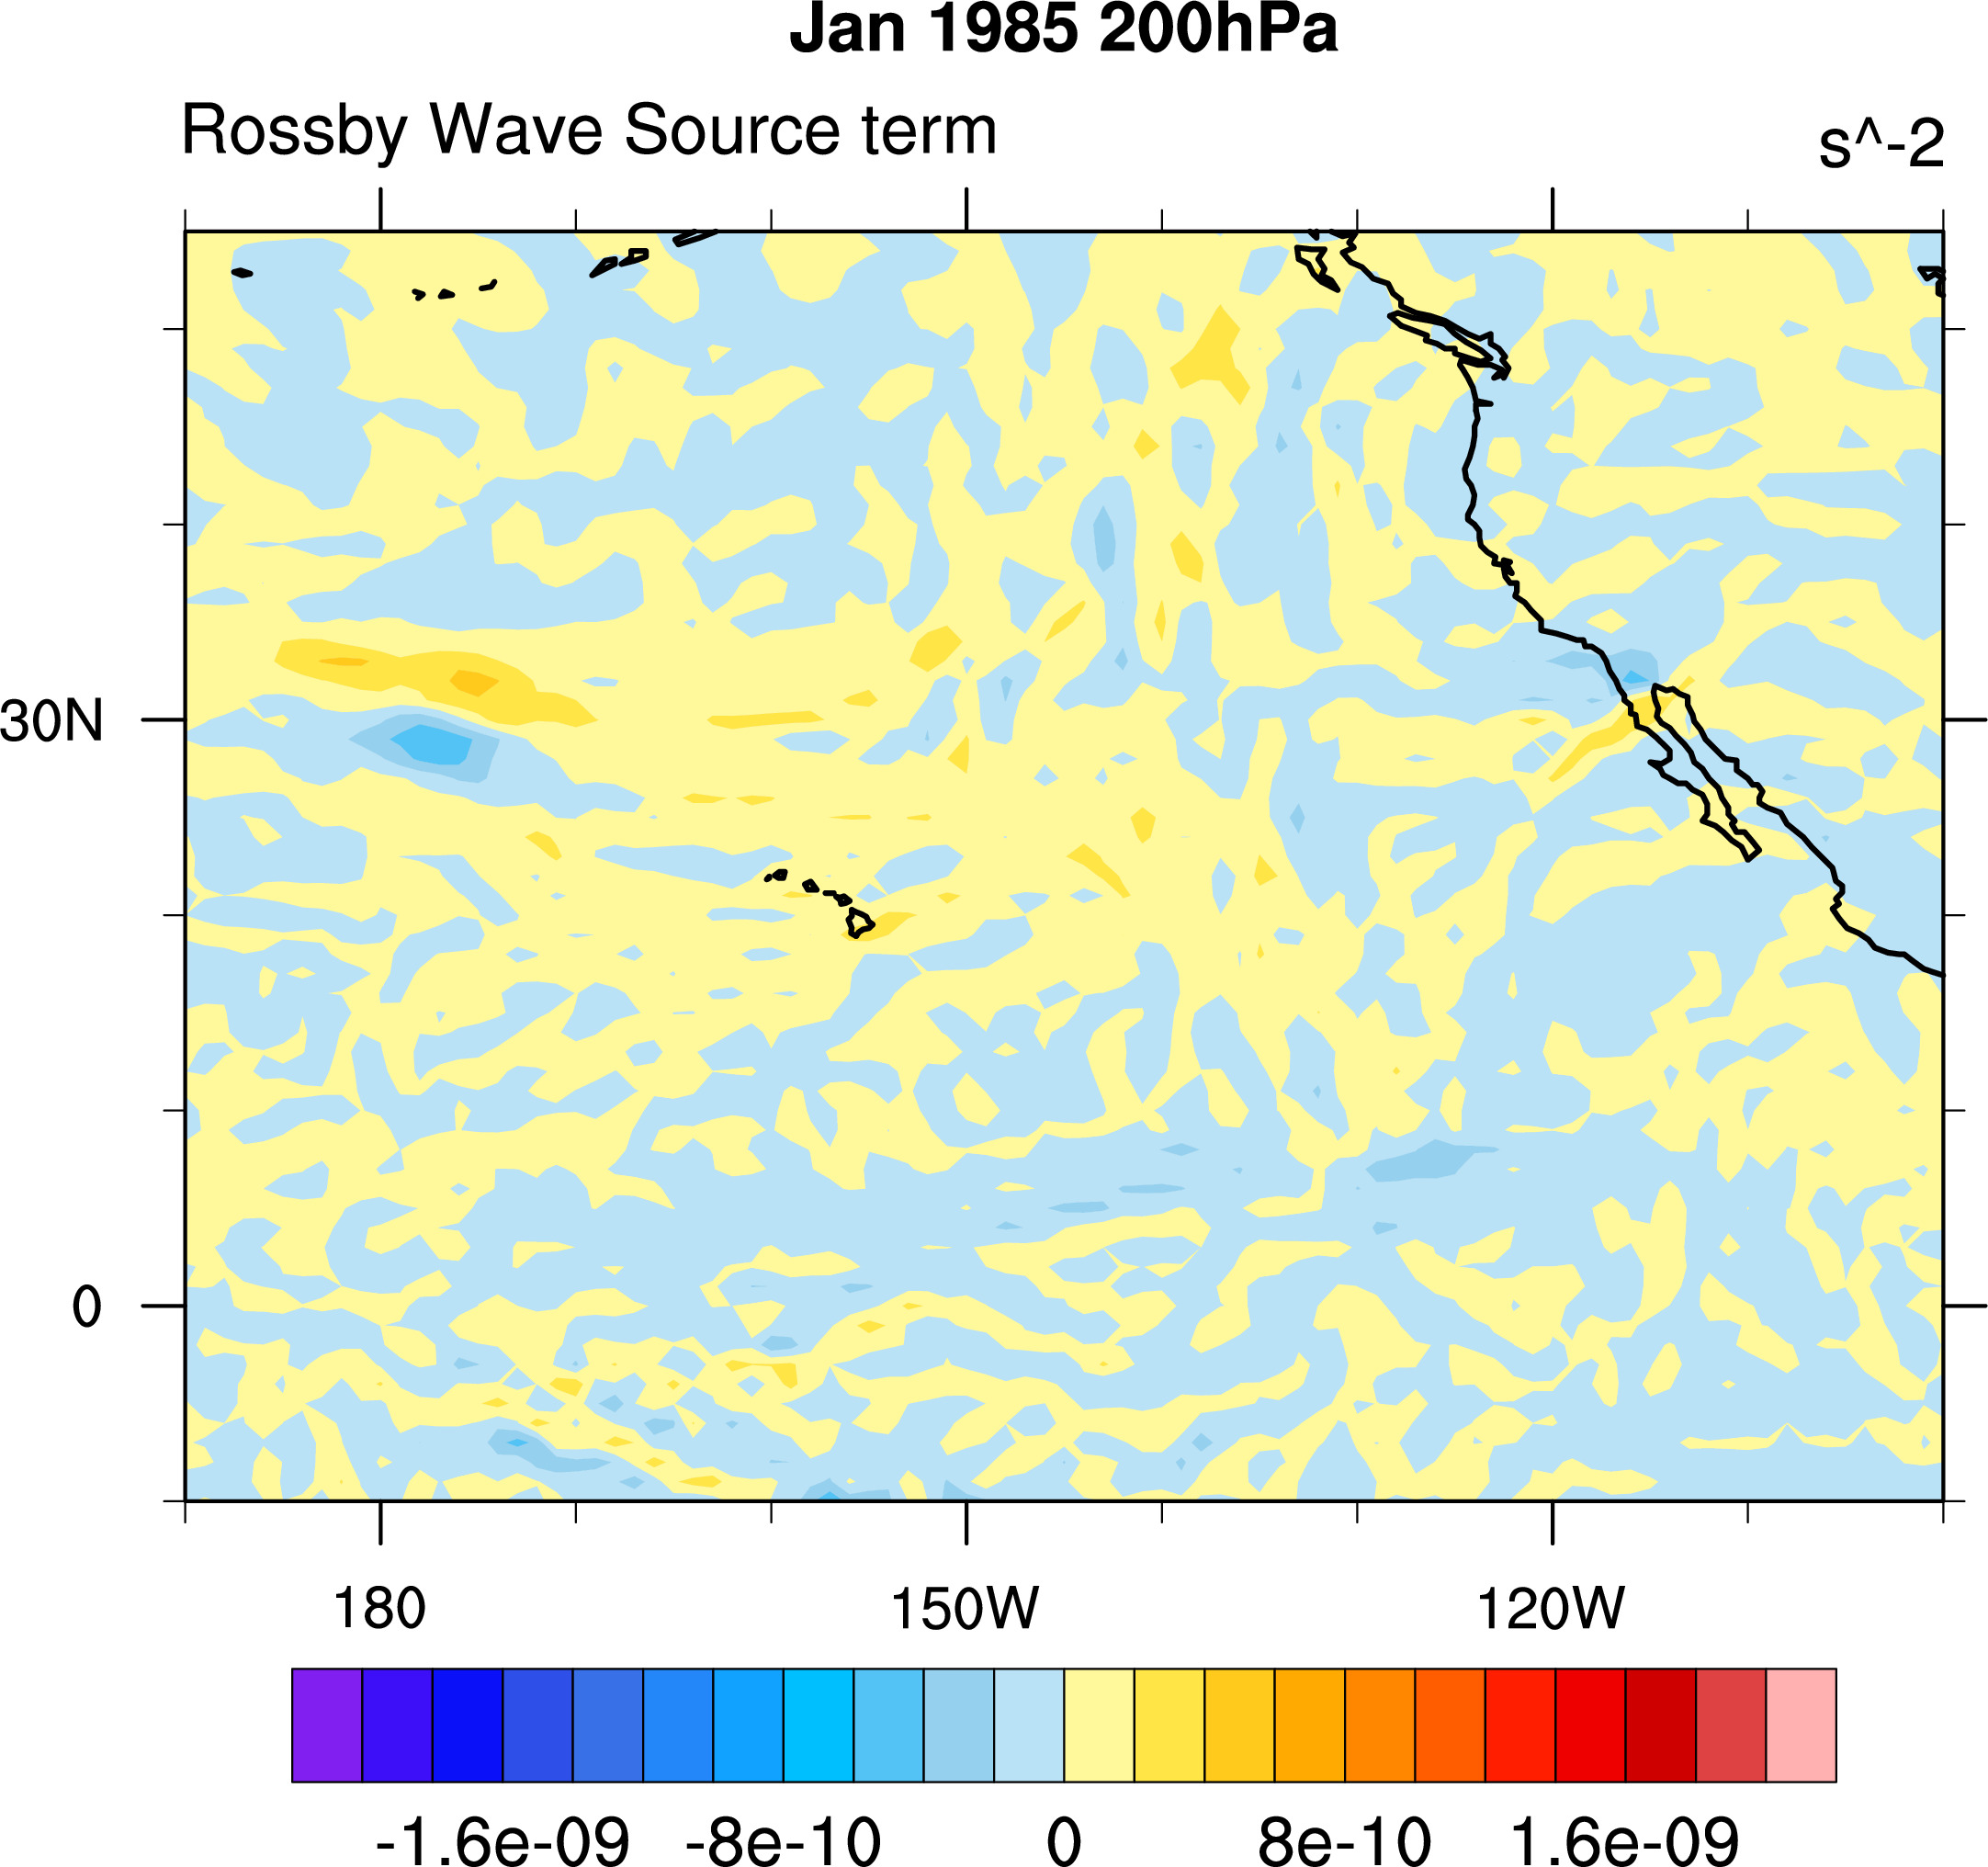
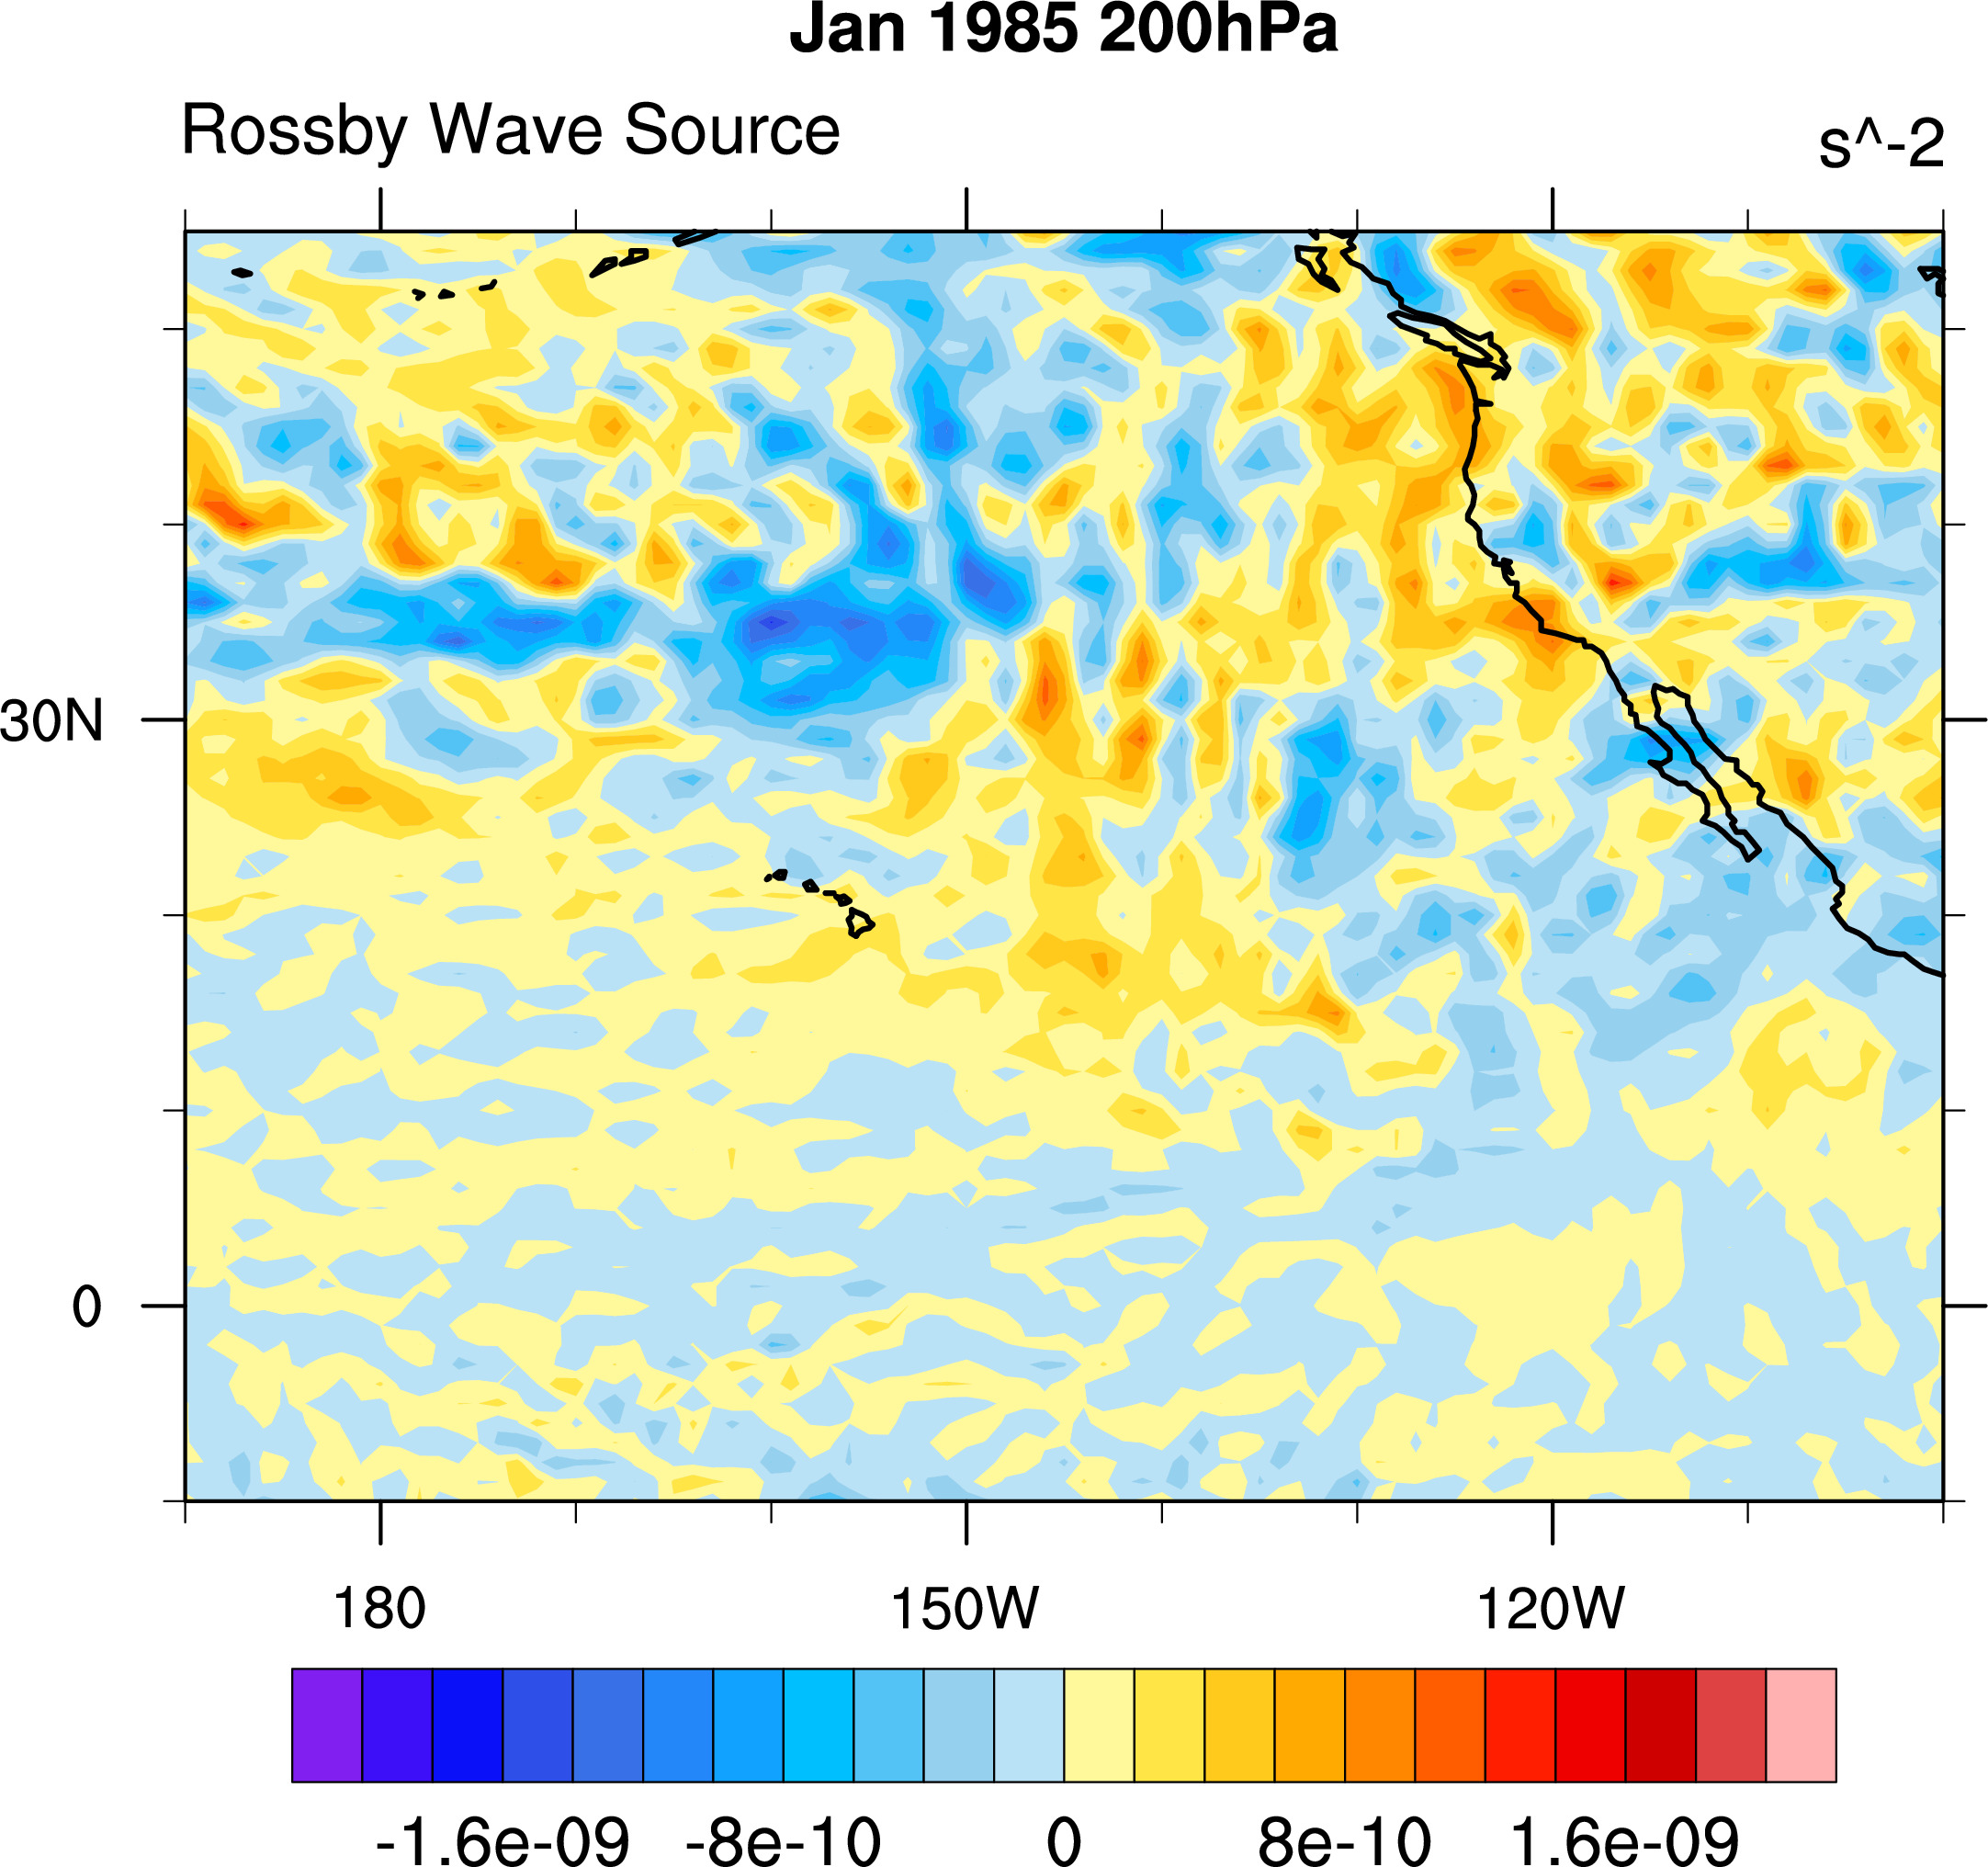
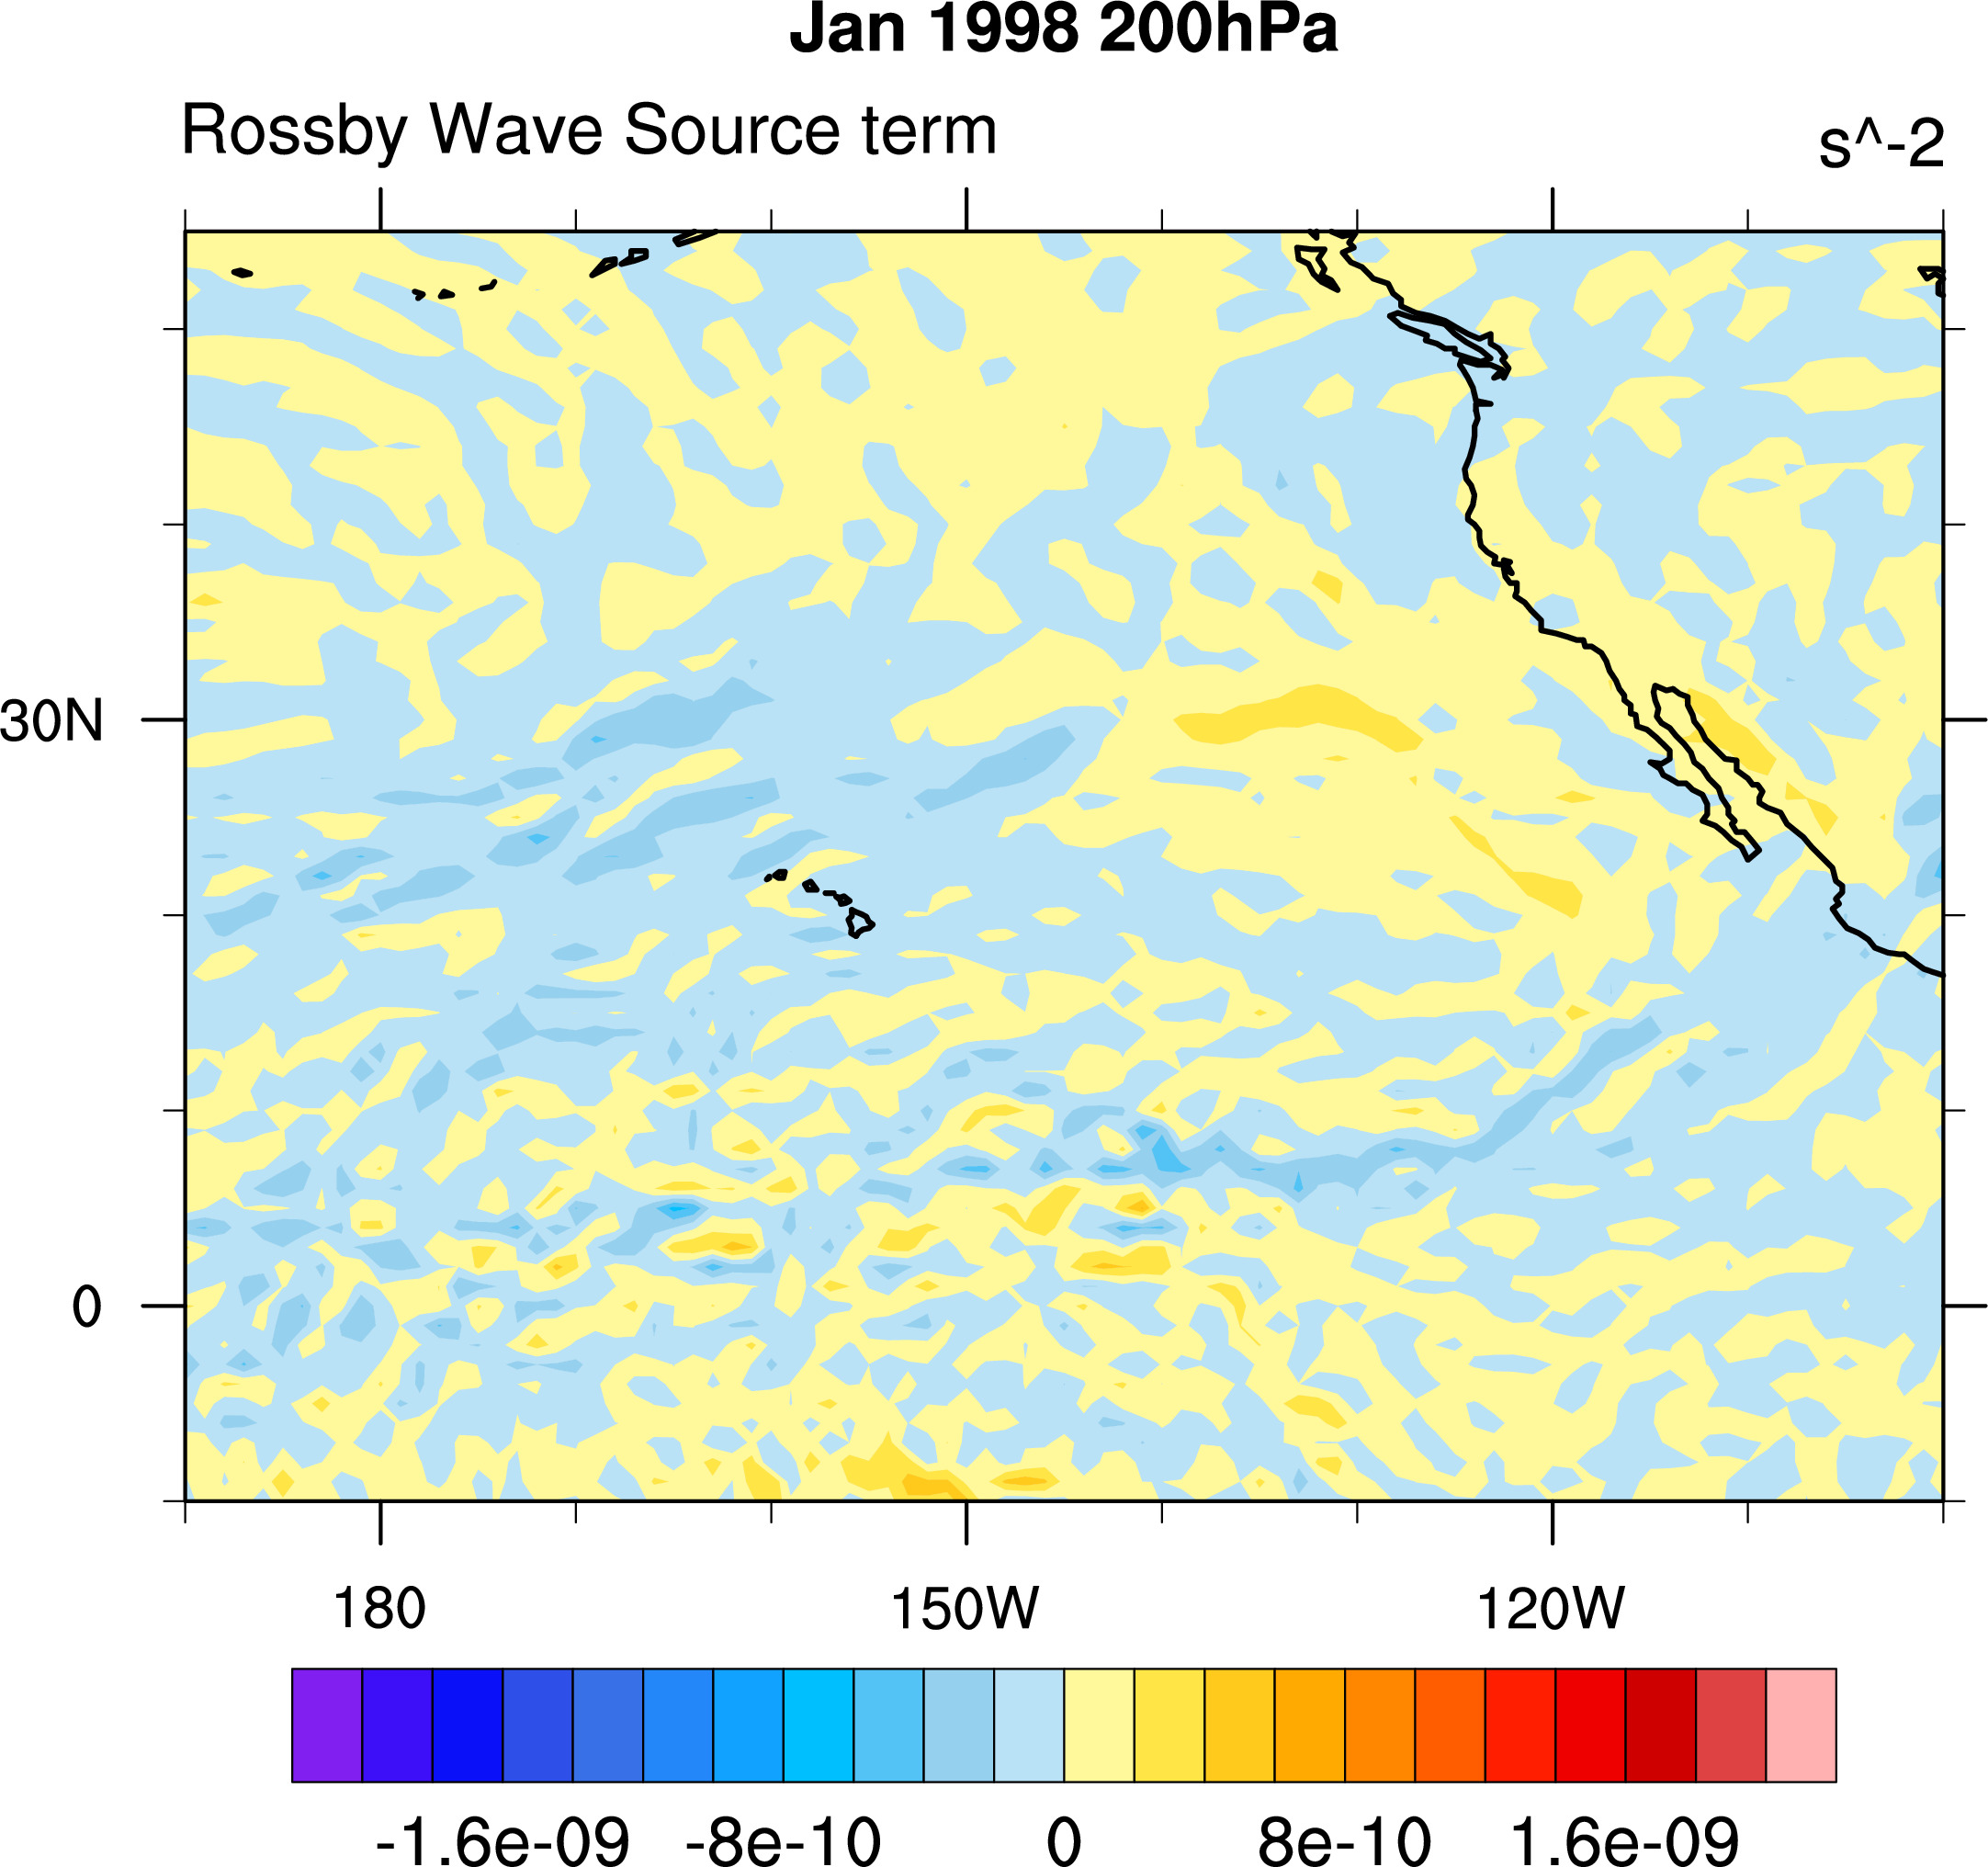
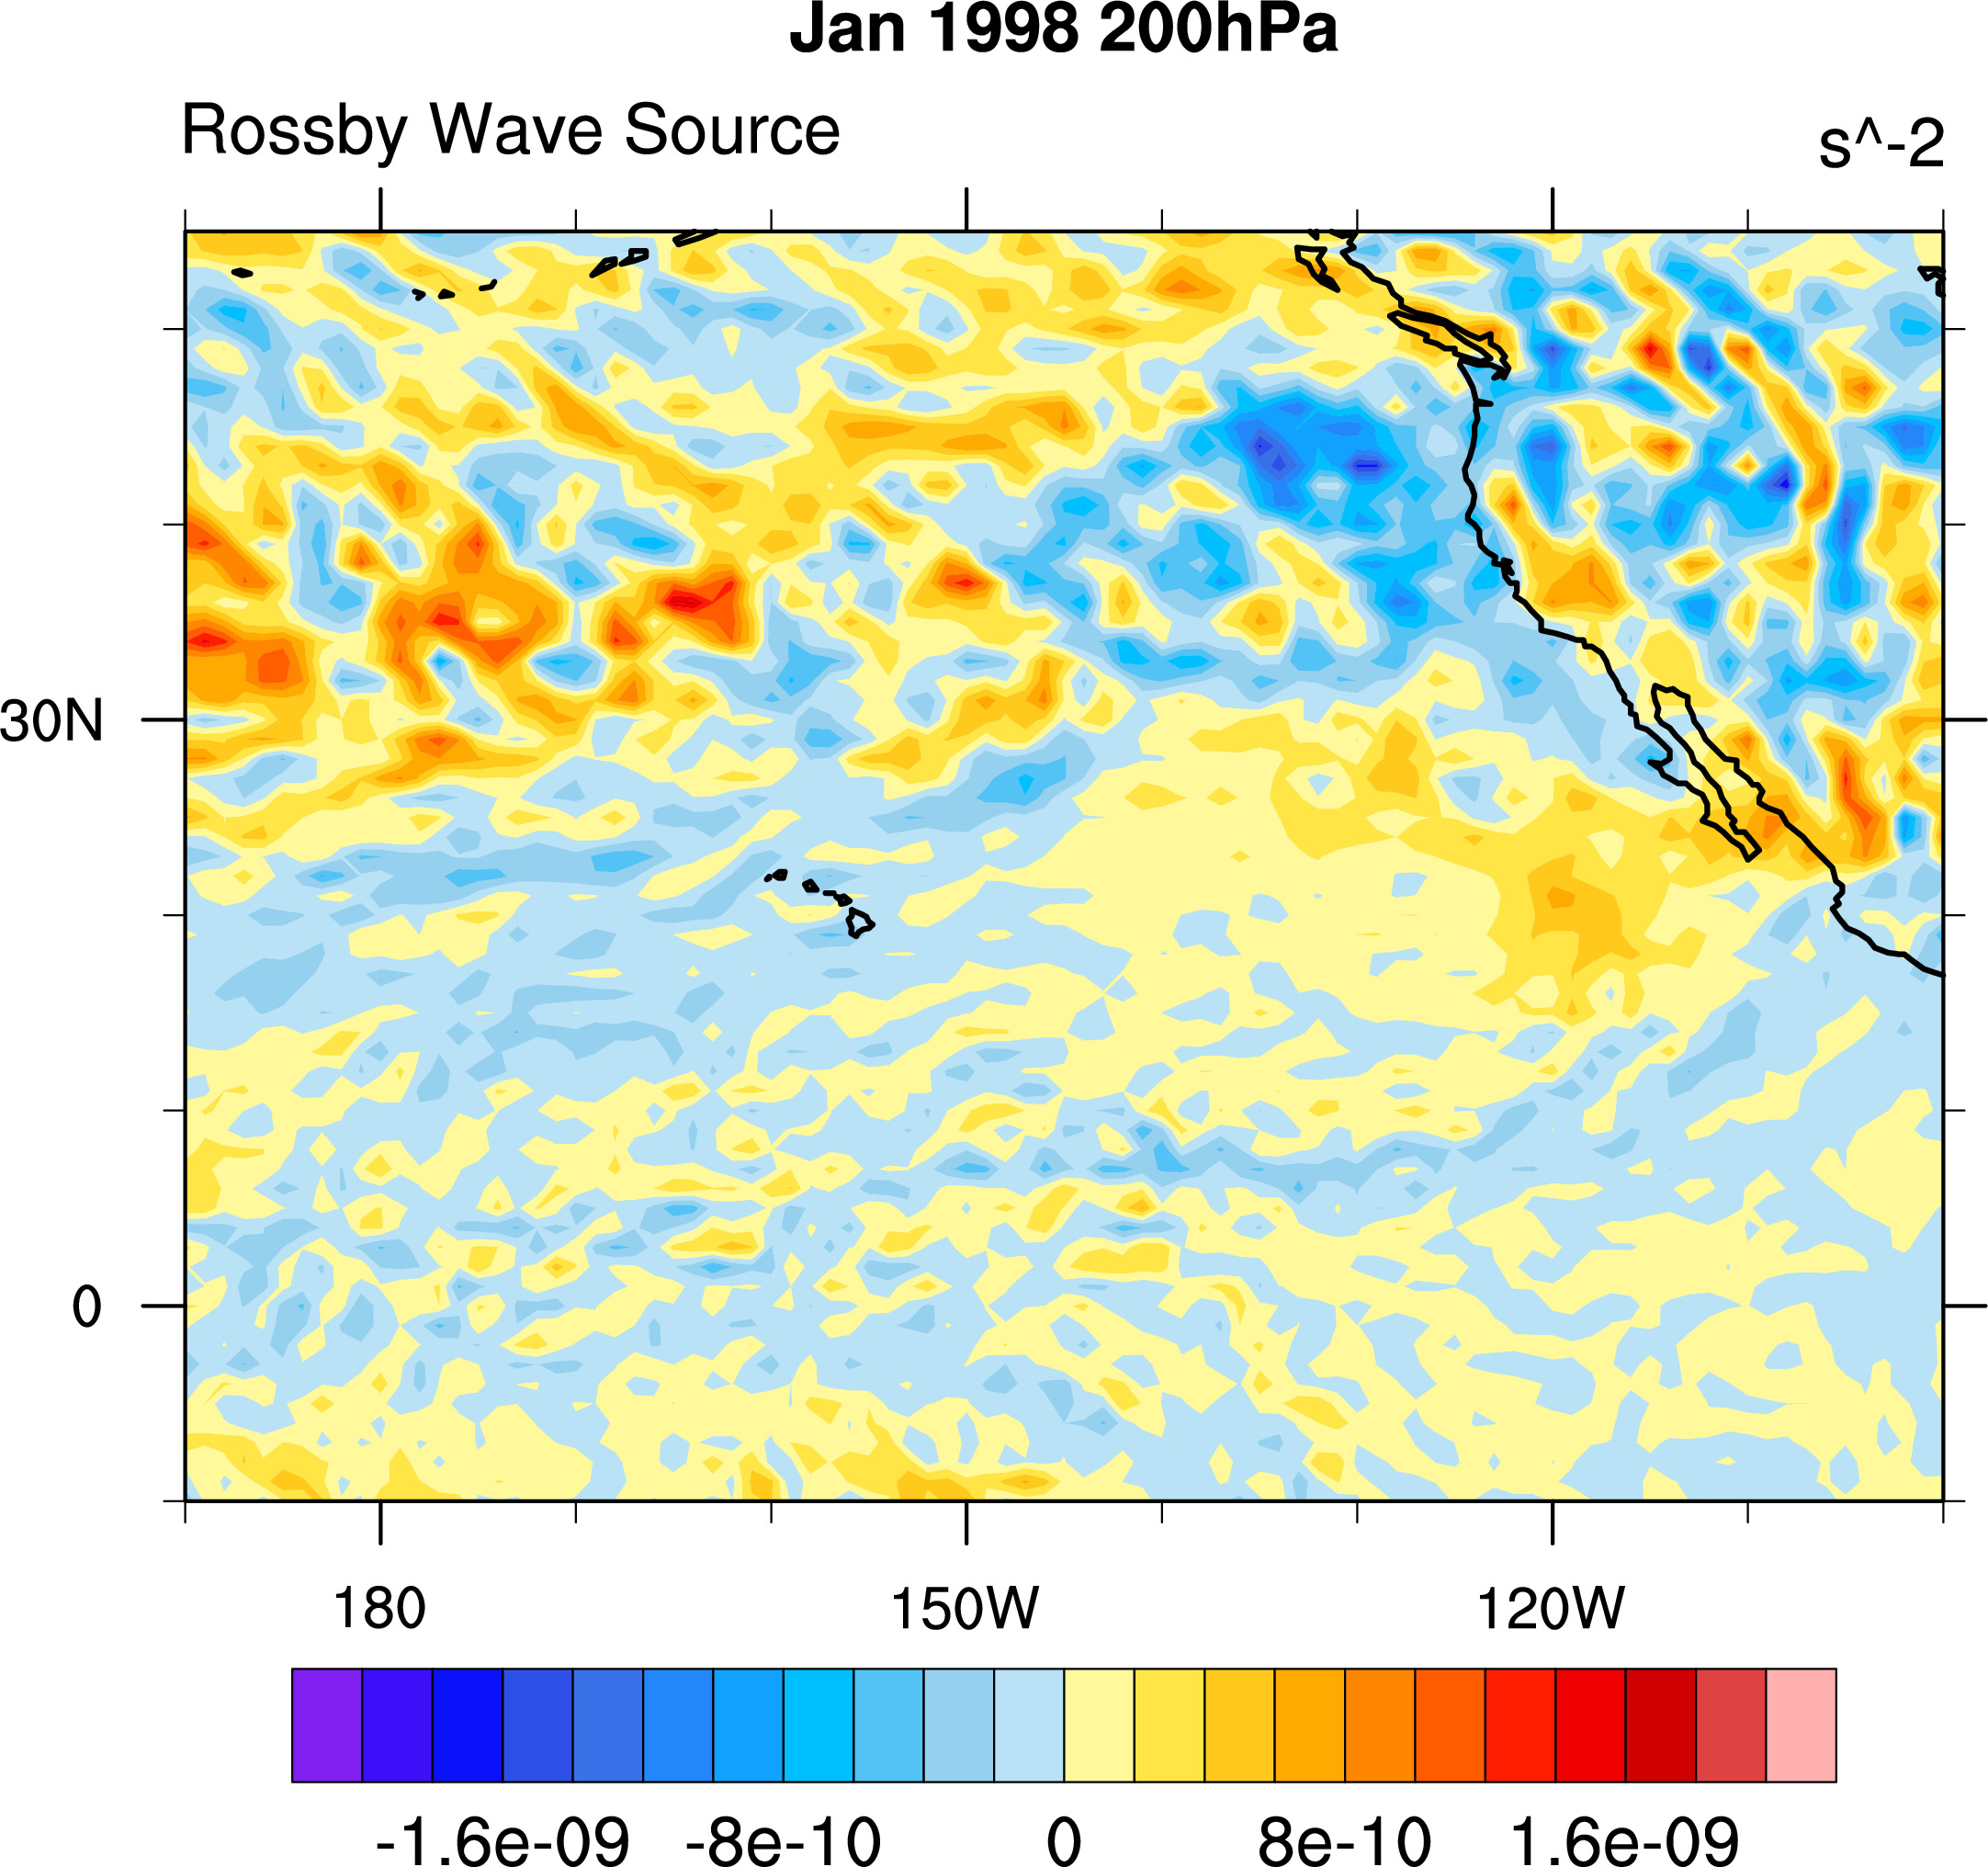
following Sardeshmukh and Hoskins 1998
Rossby wave source terms are minus absolute vorticity times divergence and
minus div winds dot-product gradient absolute vorticity, respectively.