Lesley L. Smith – Western Extreme Precipitation Drought
Extreme Precipitation and Drought in the Western U.S.
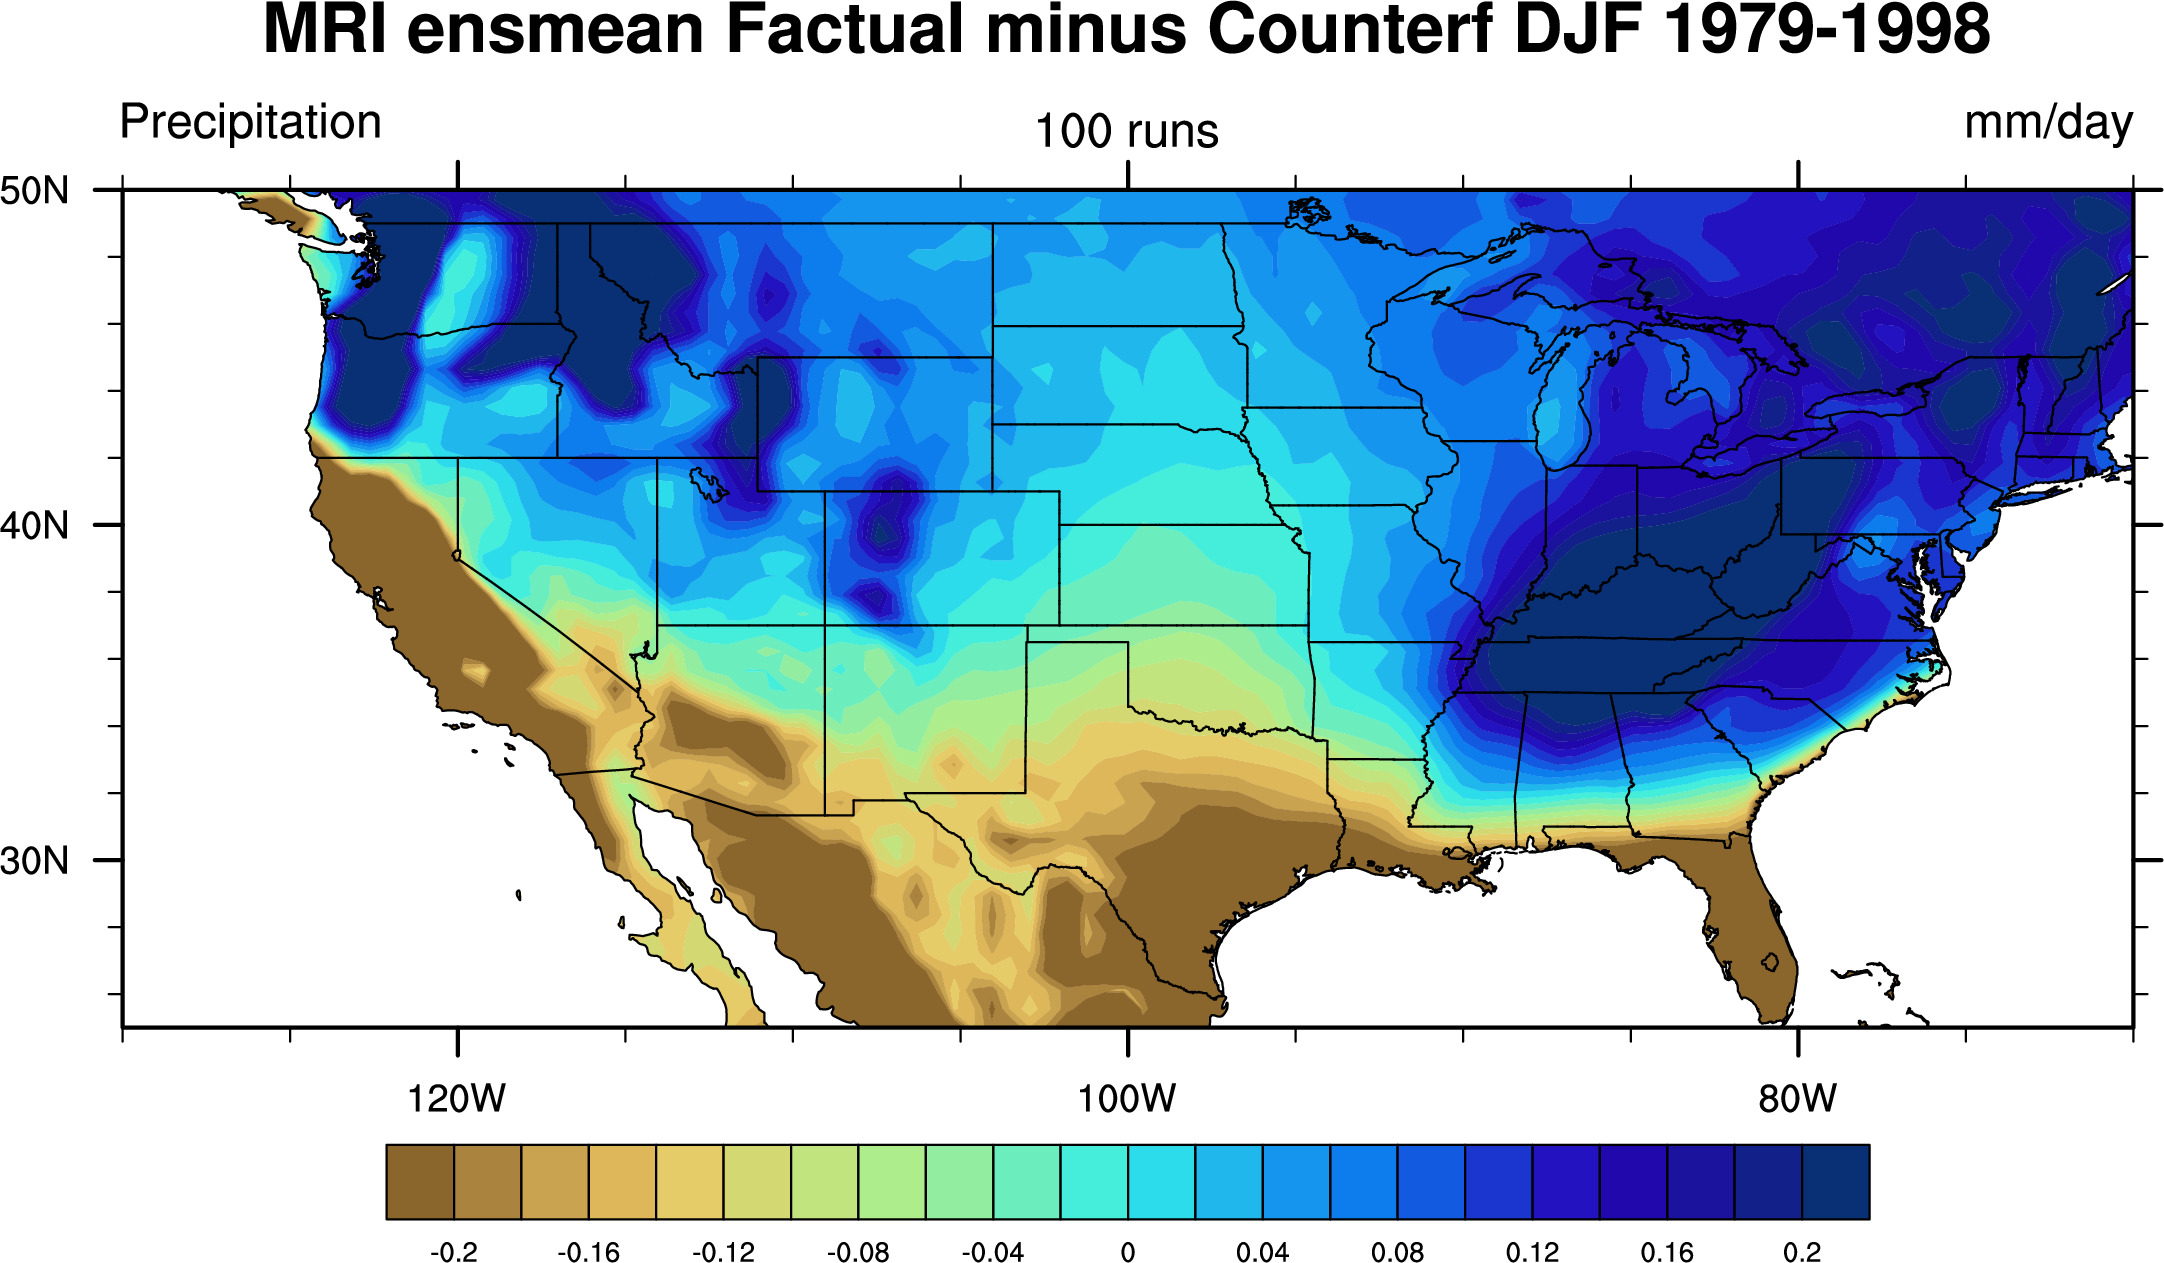
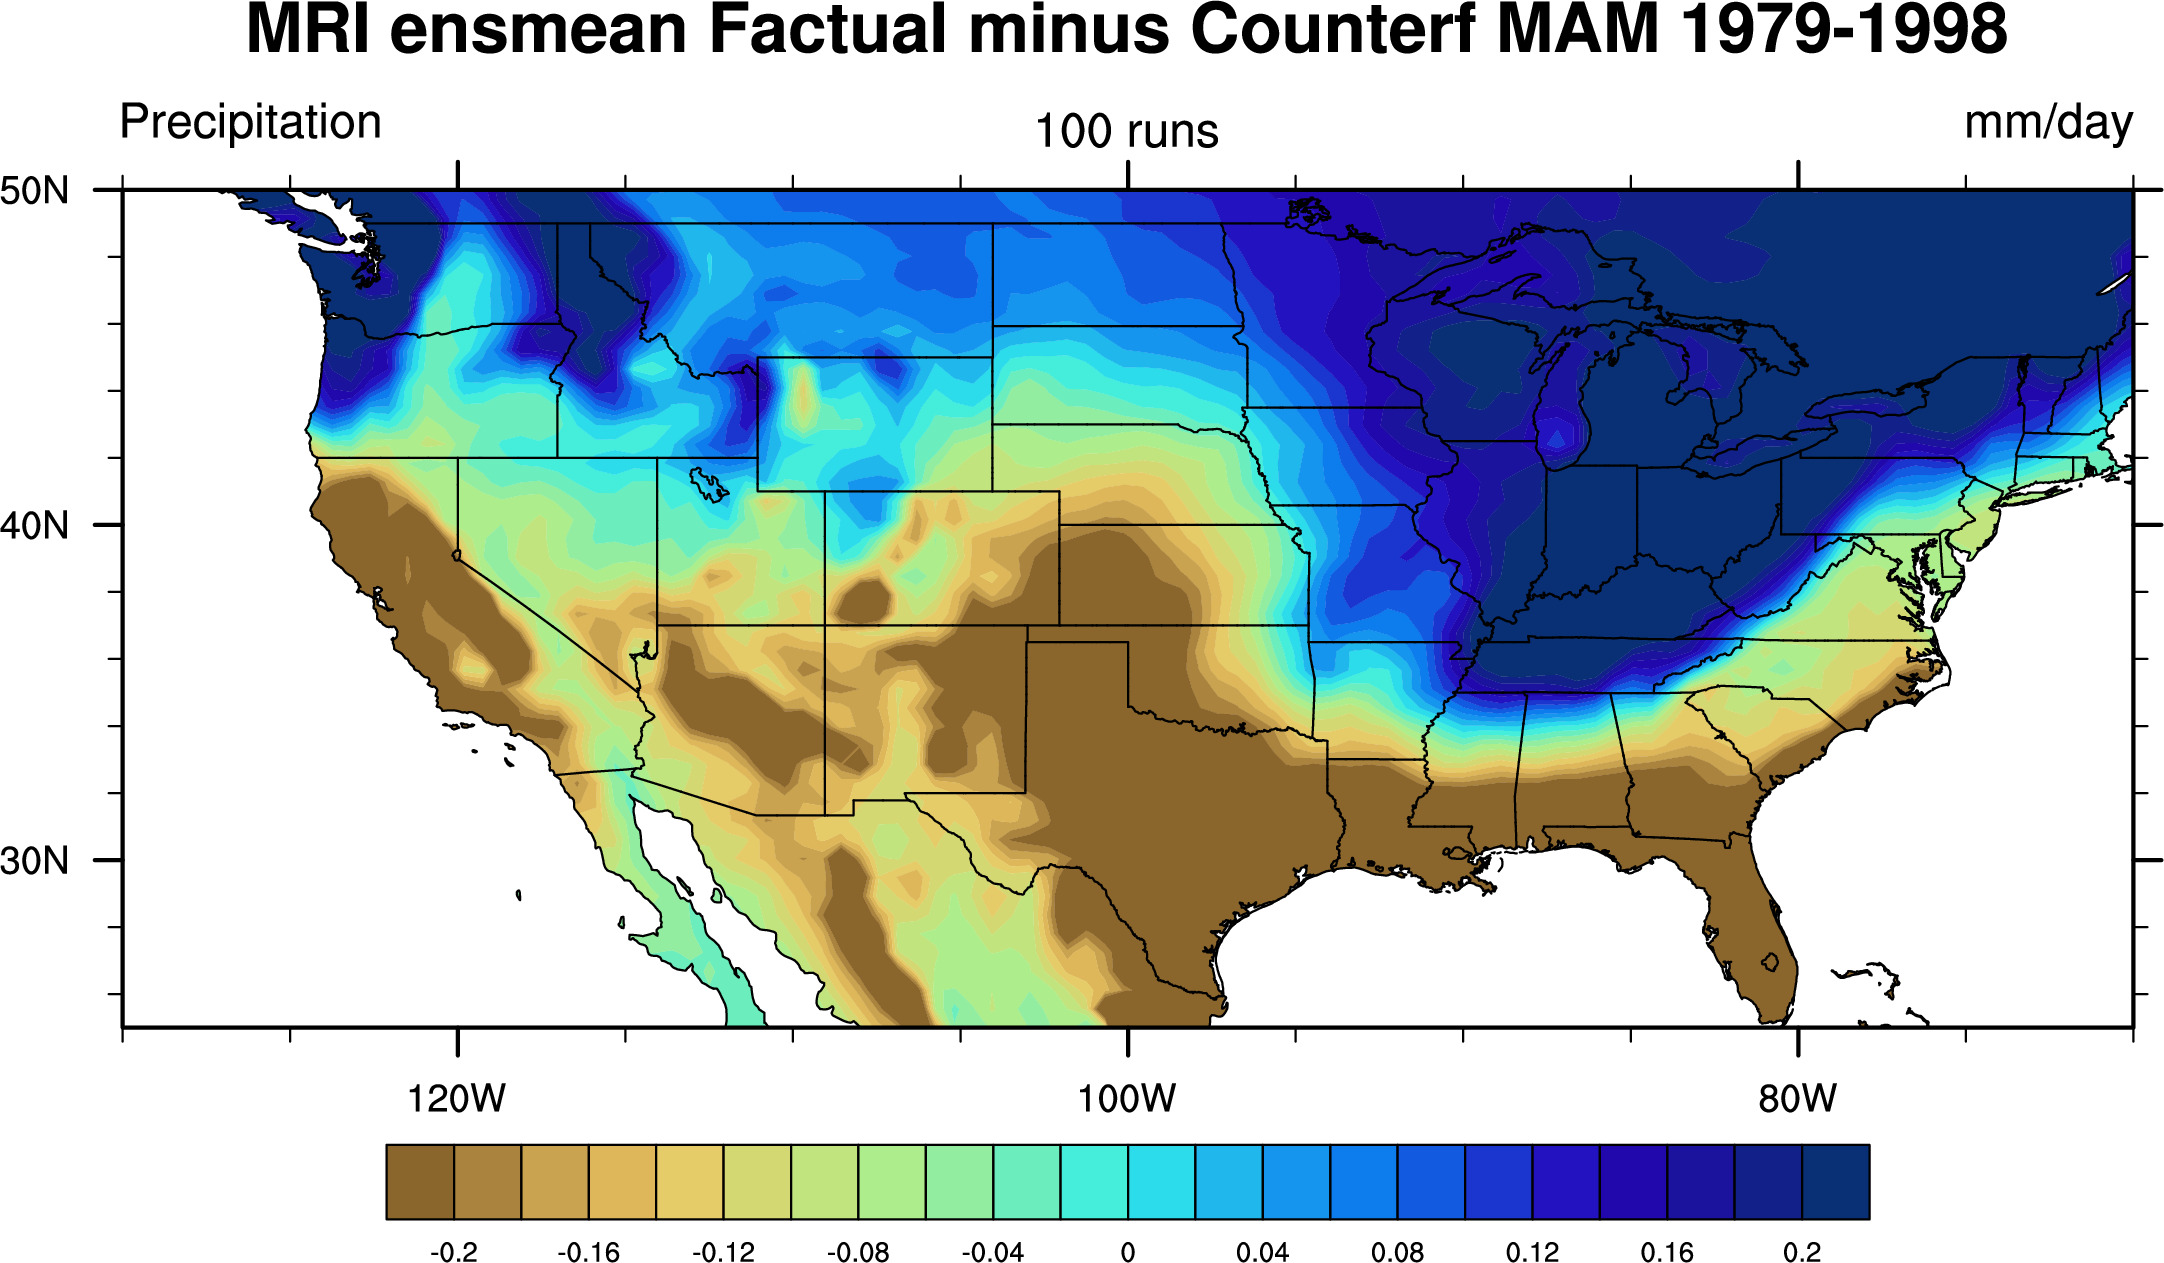
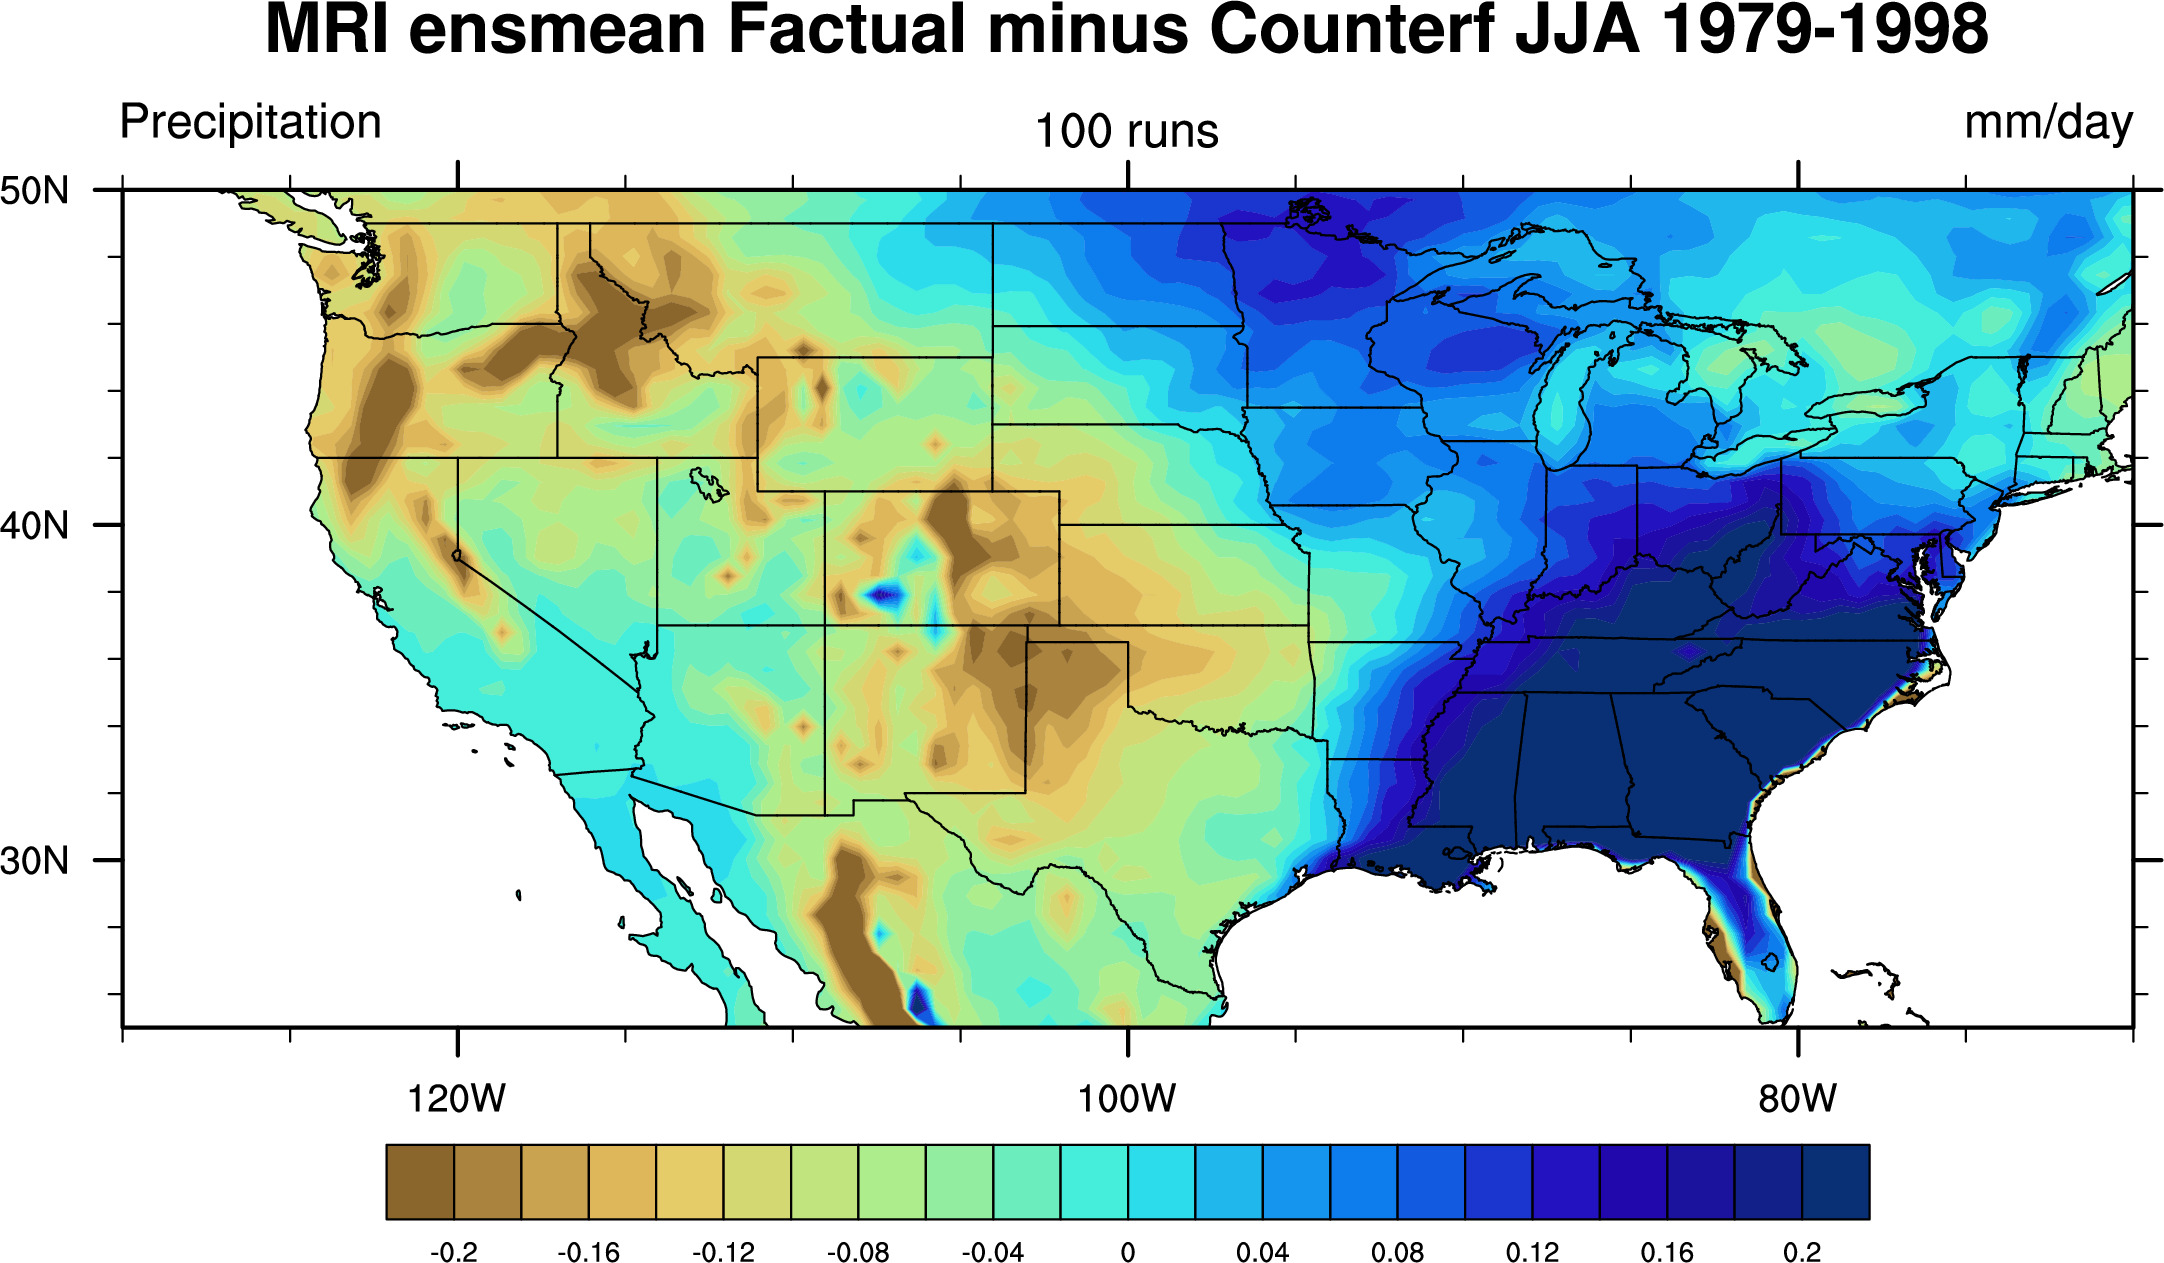
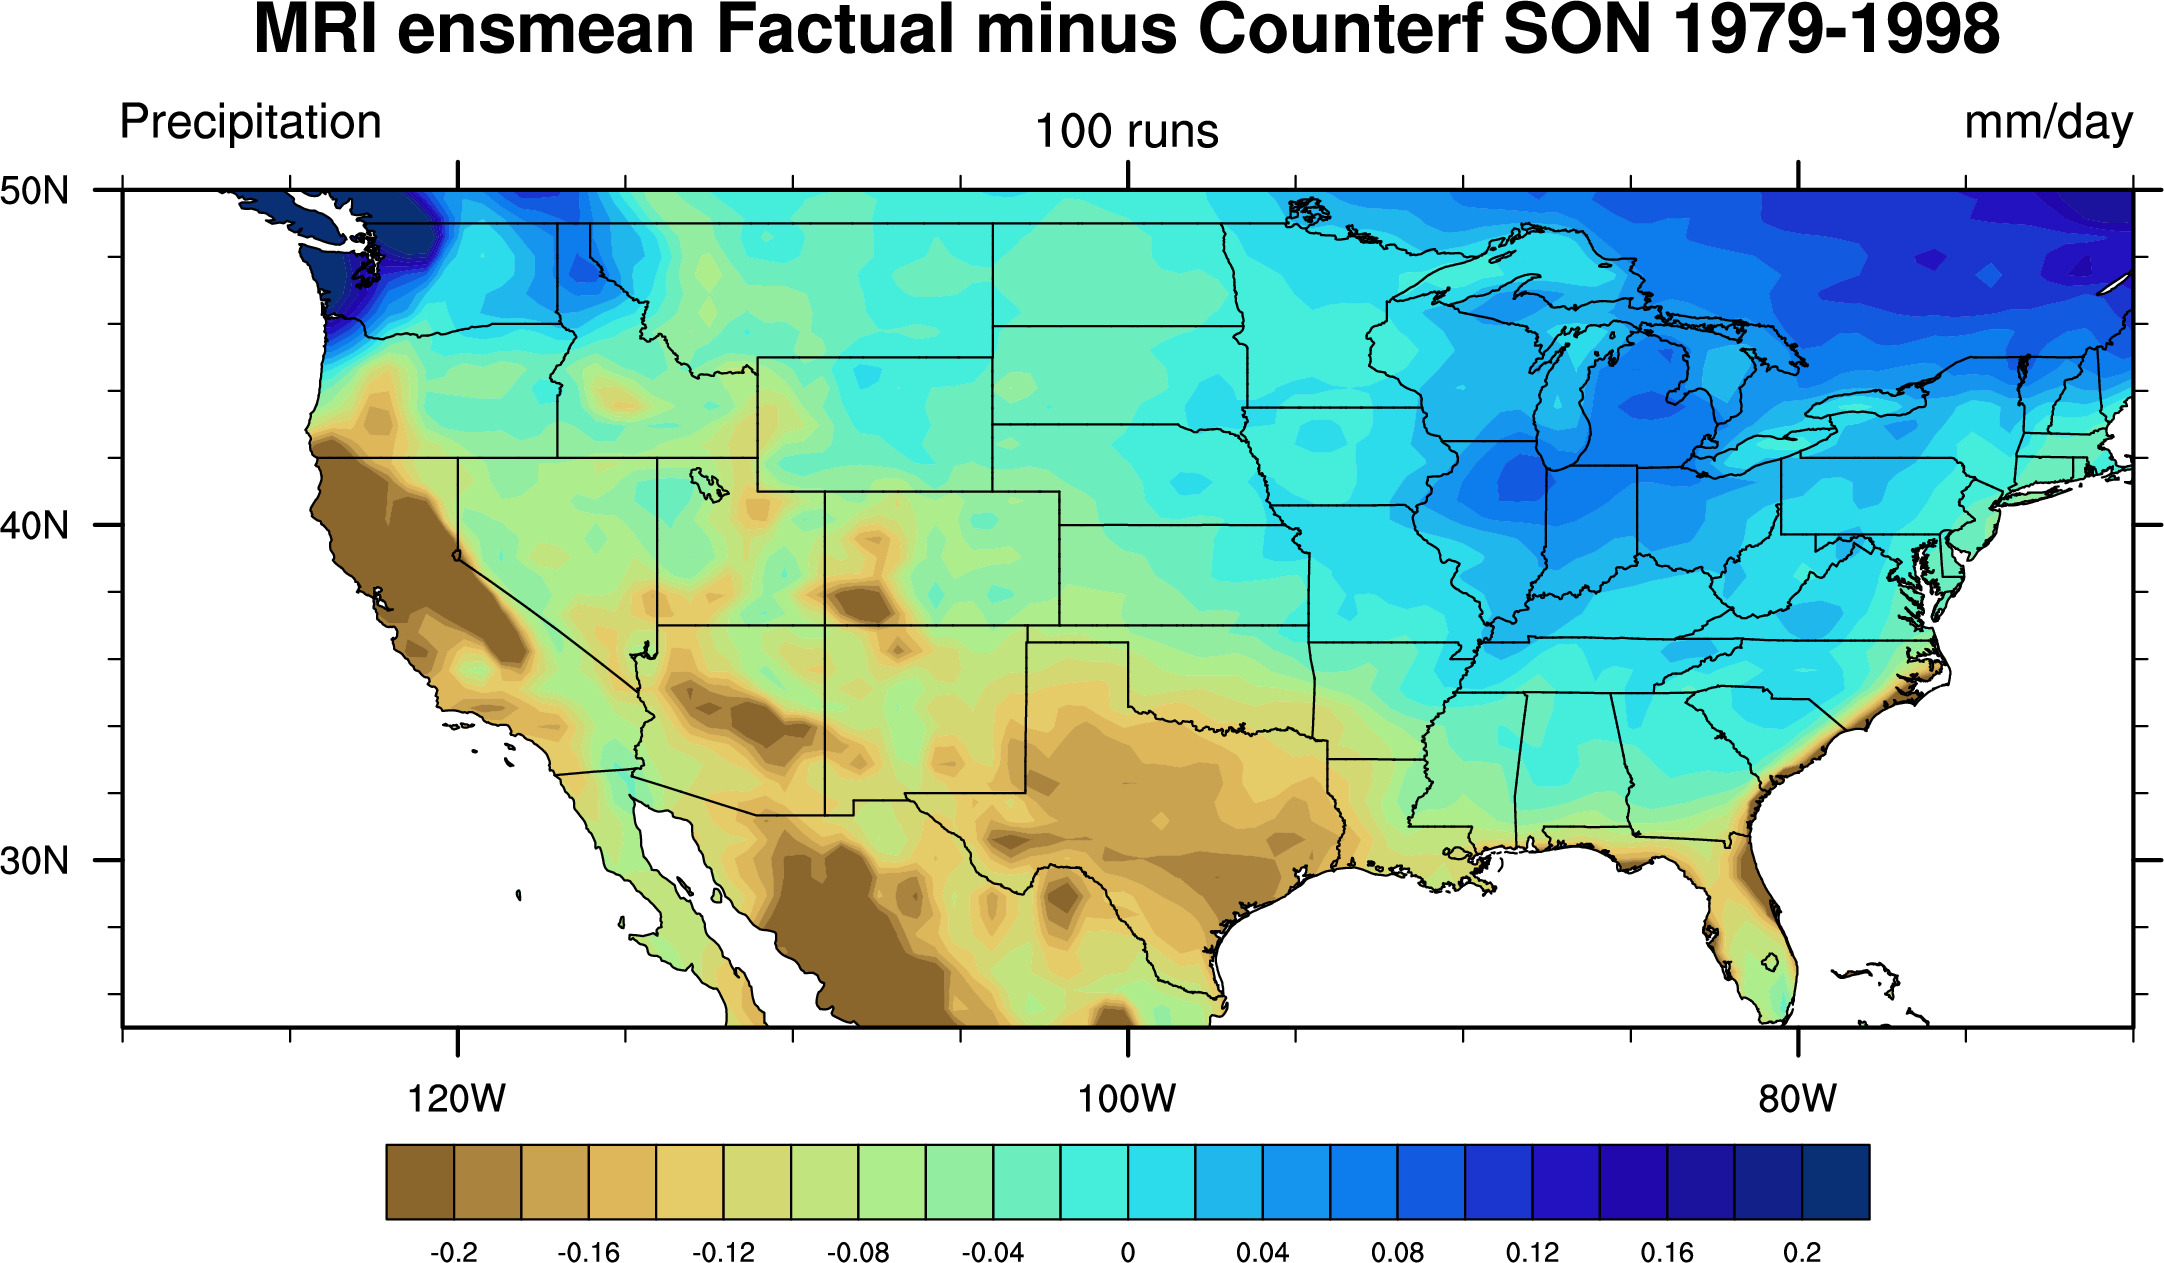
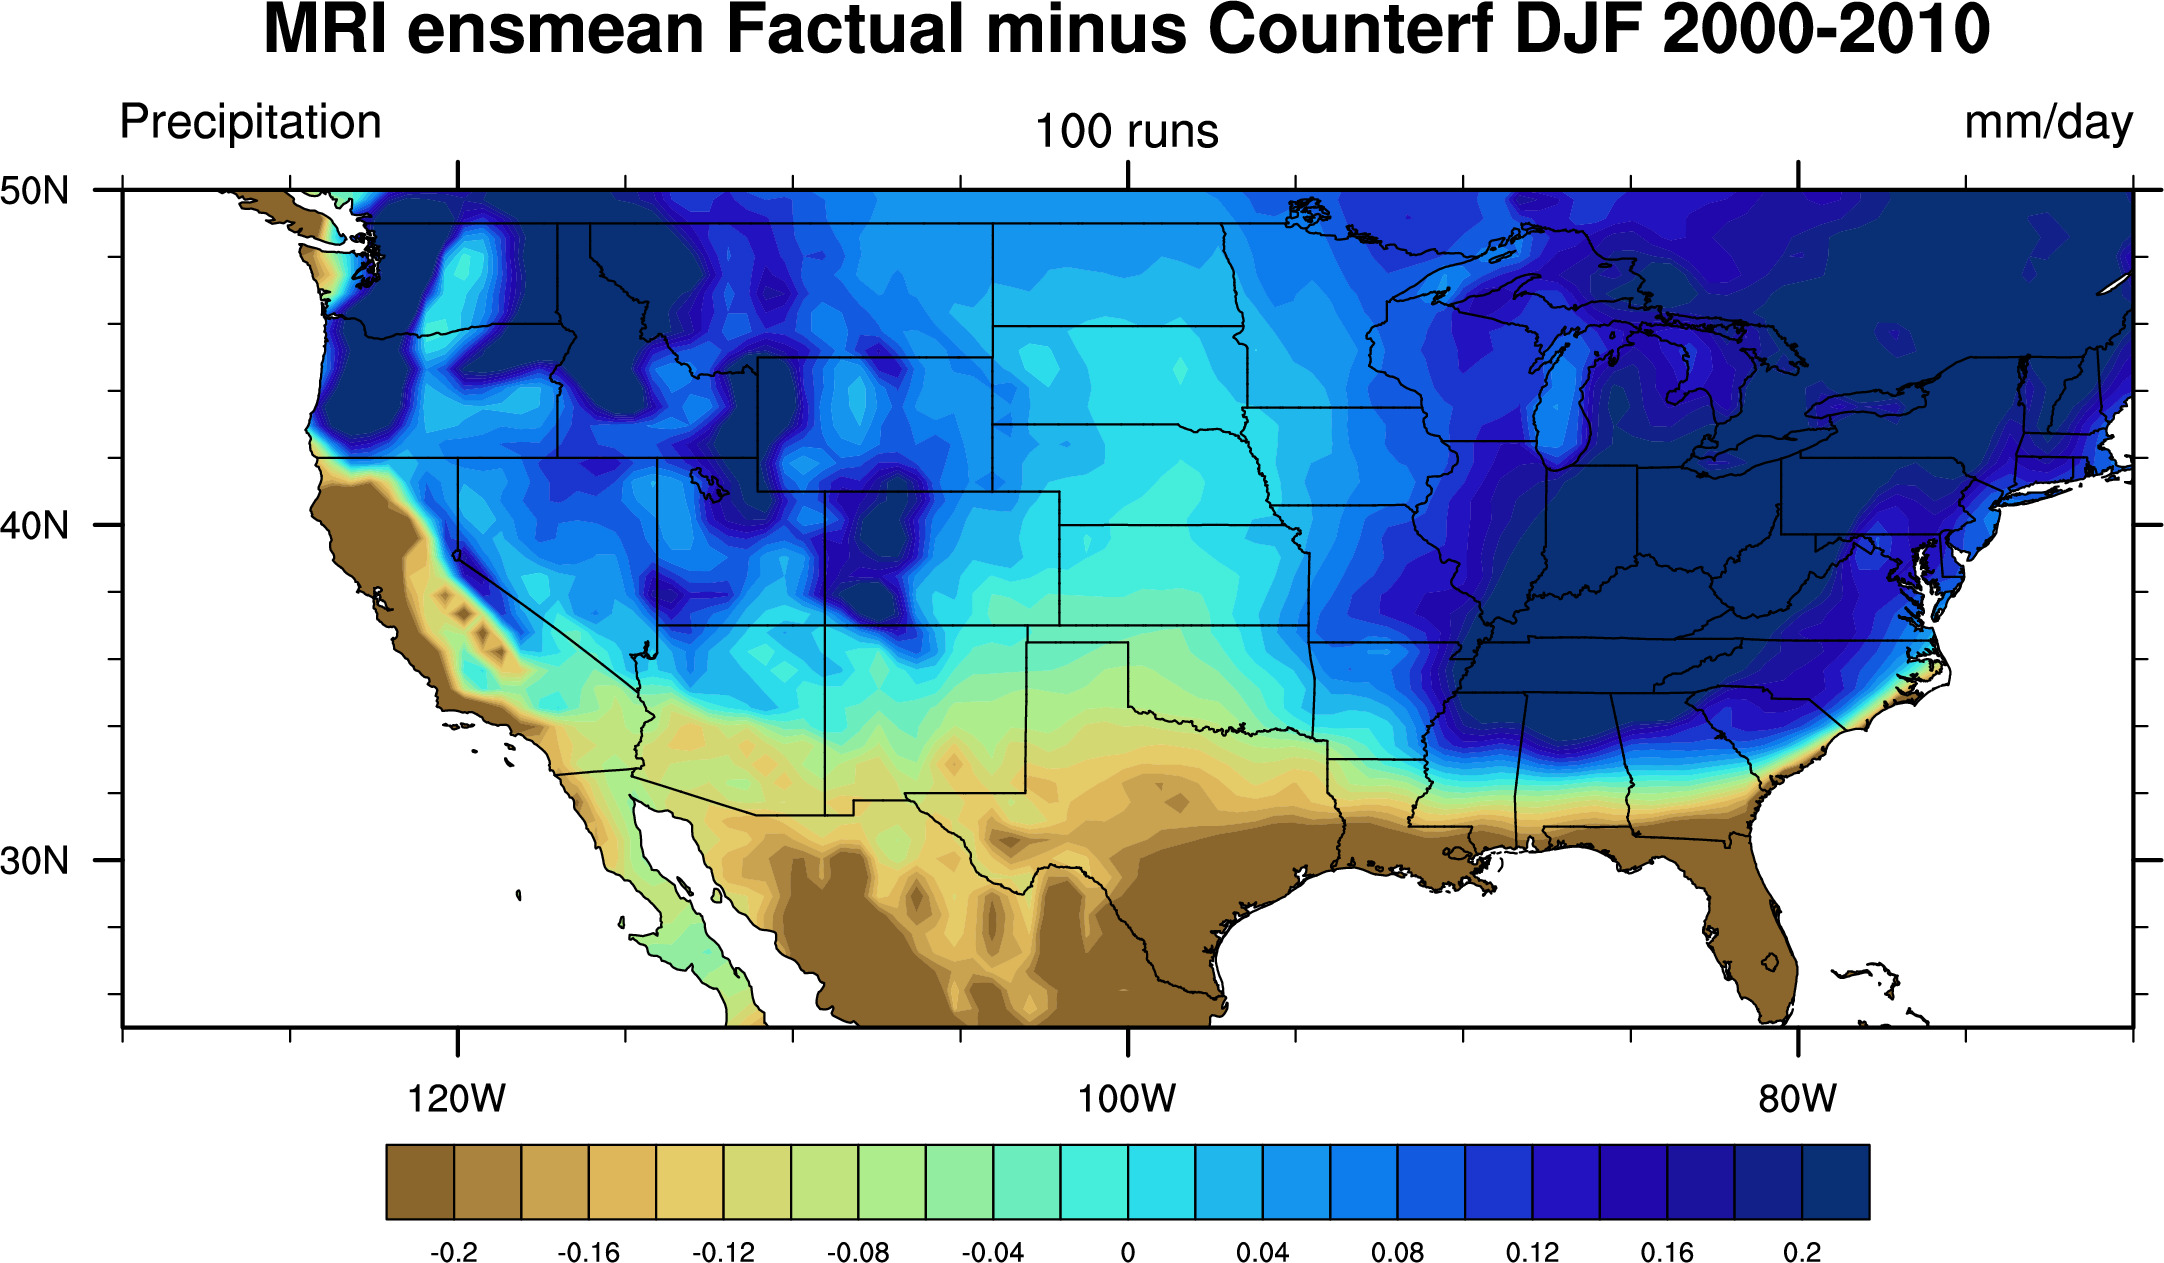
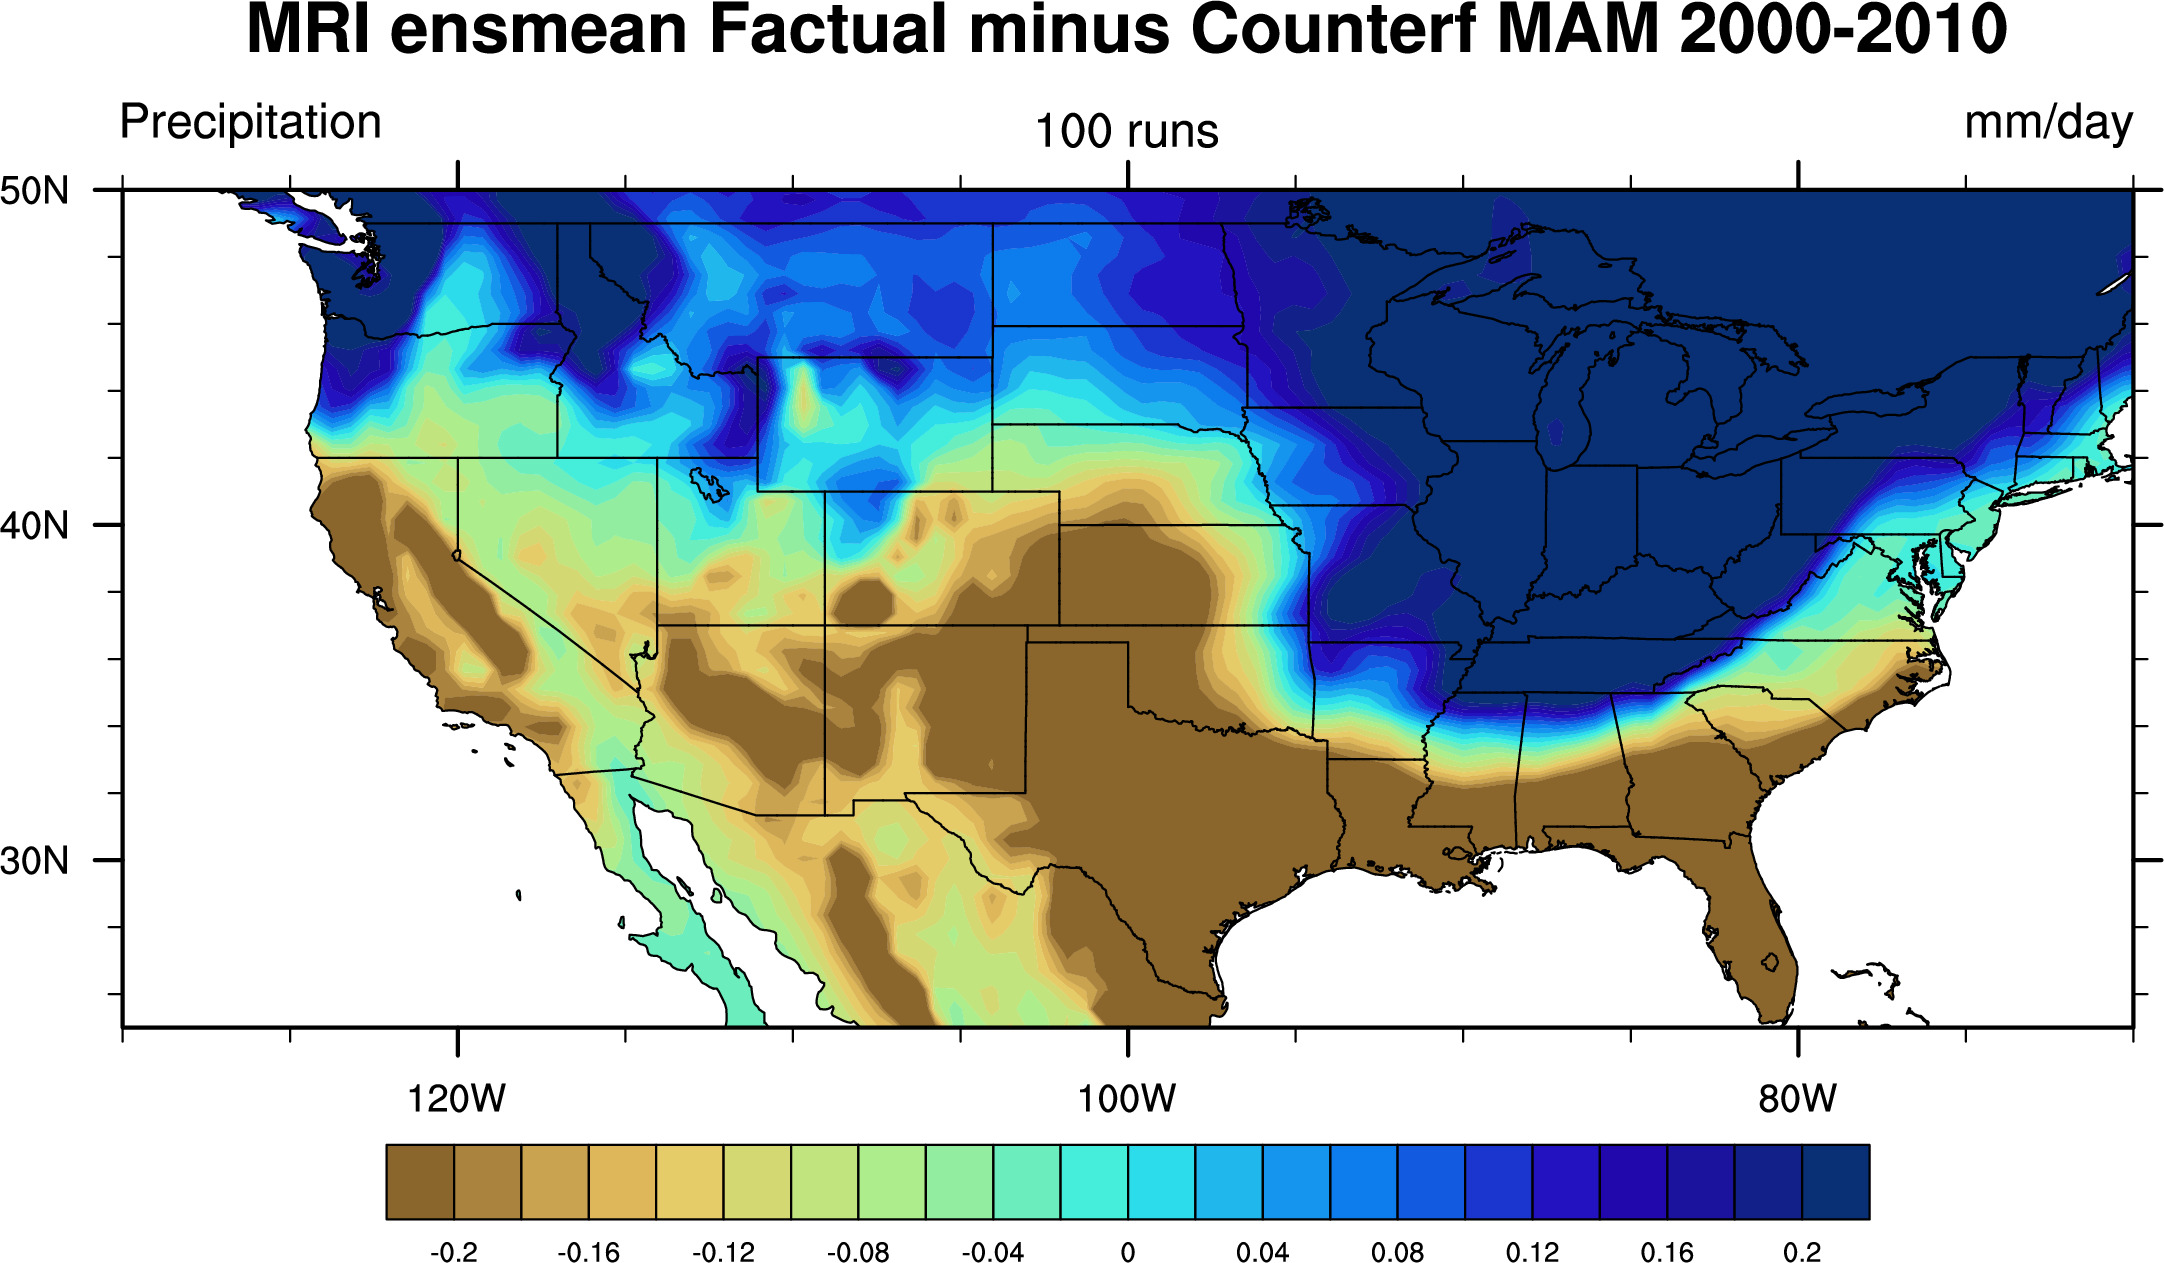
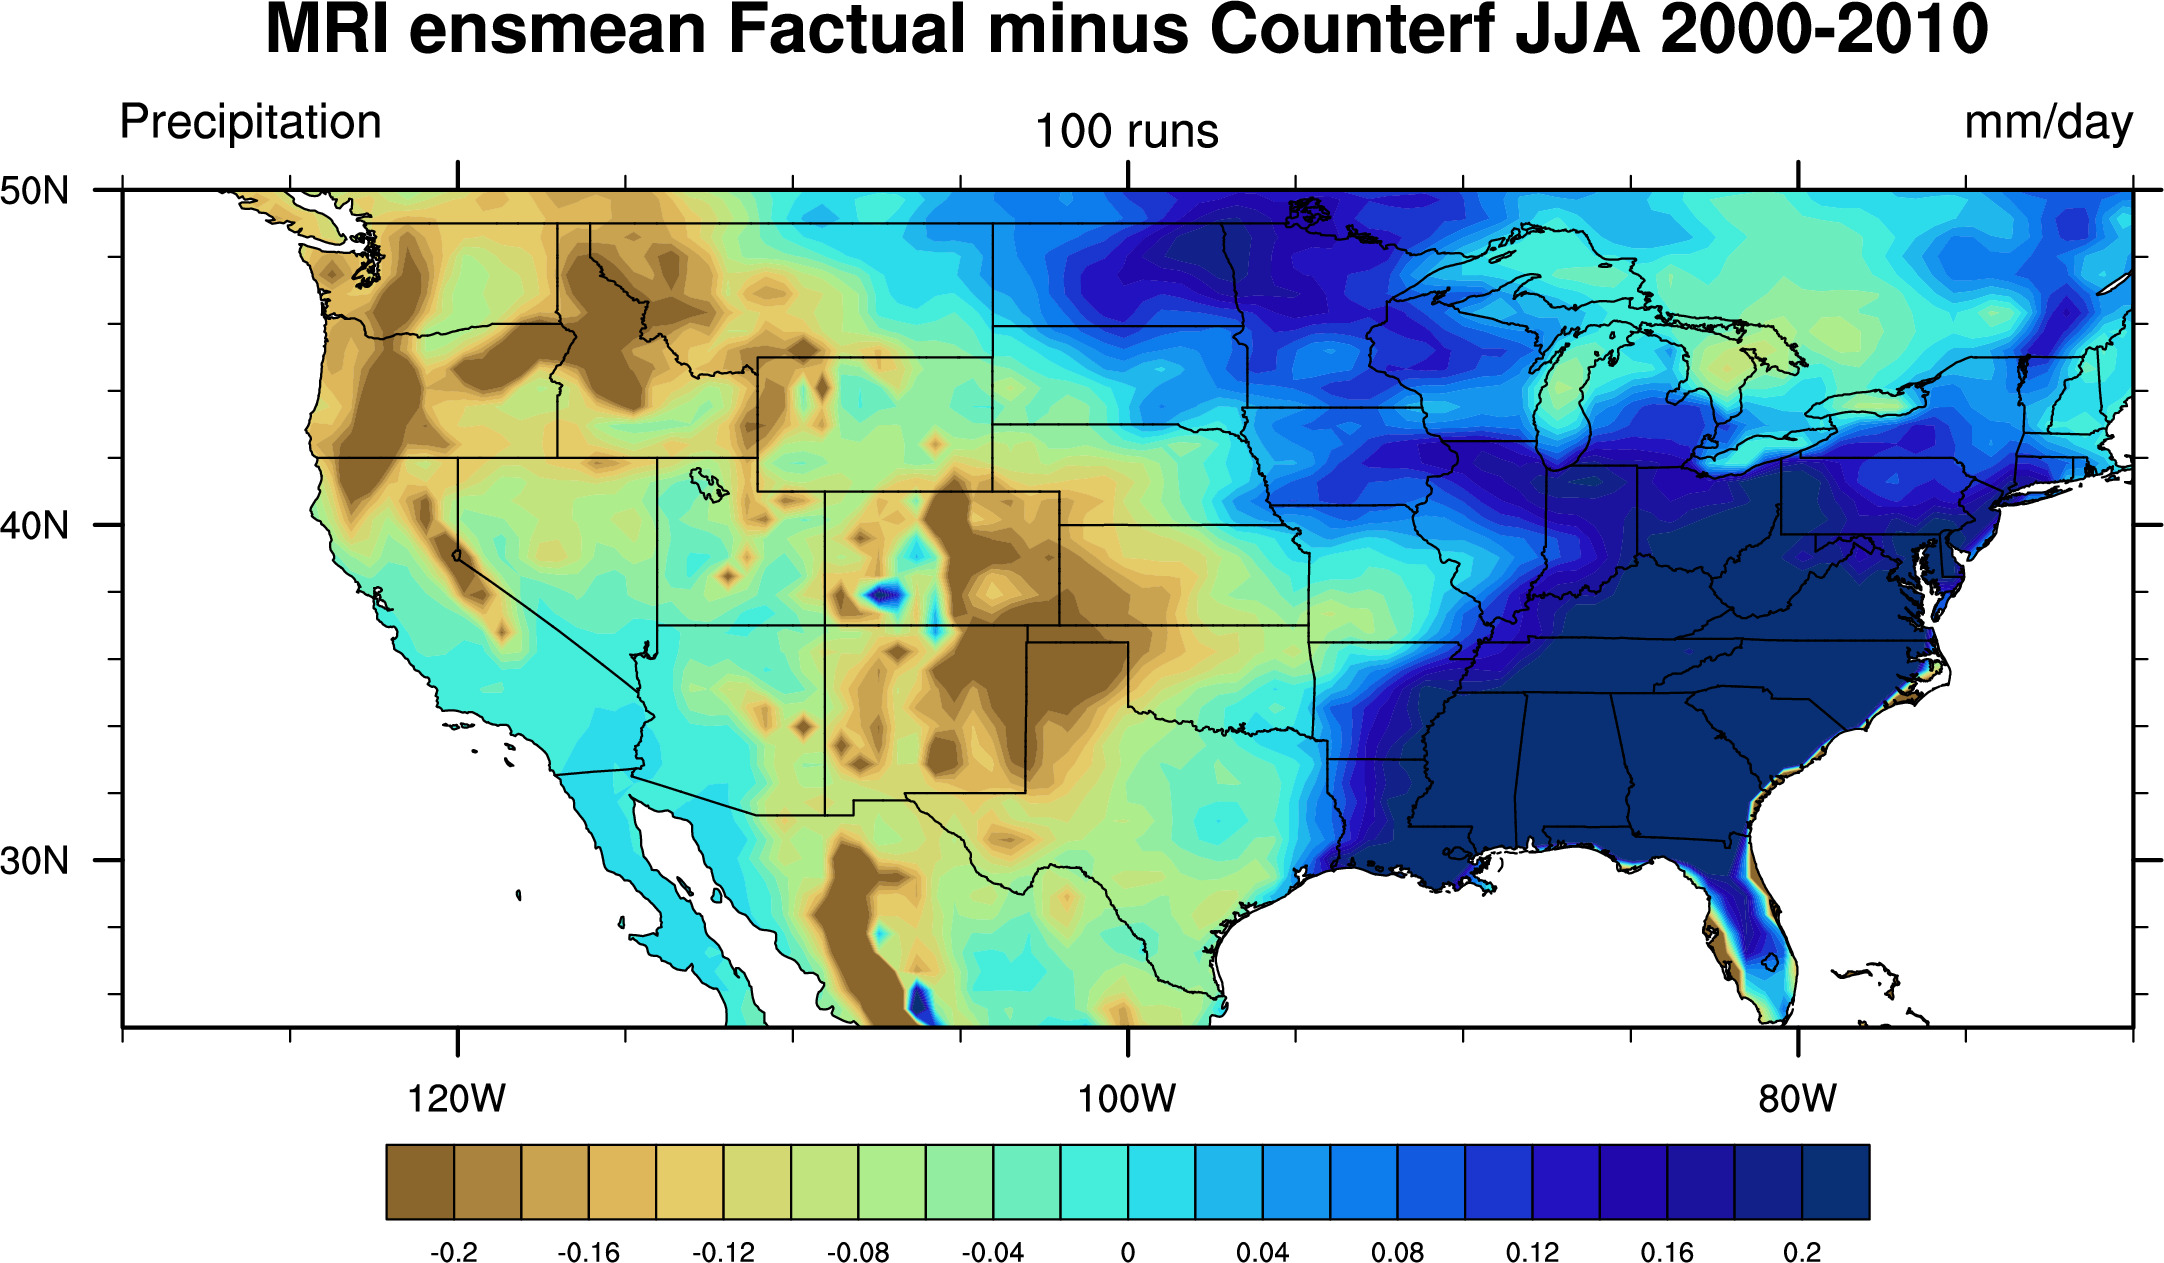
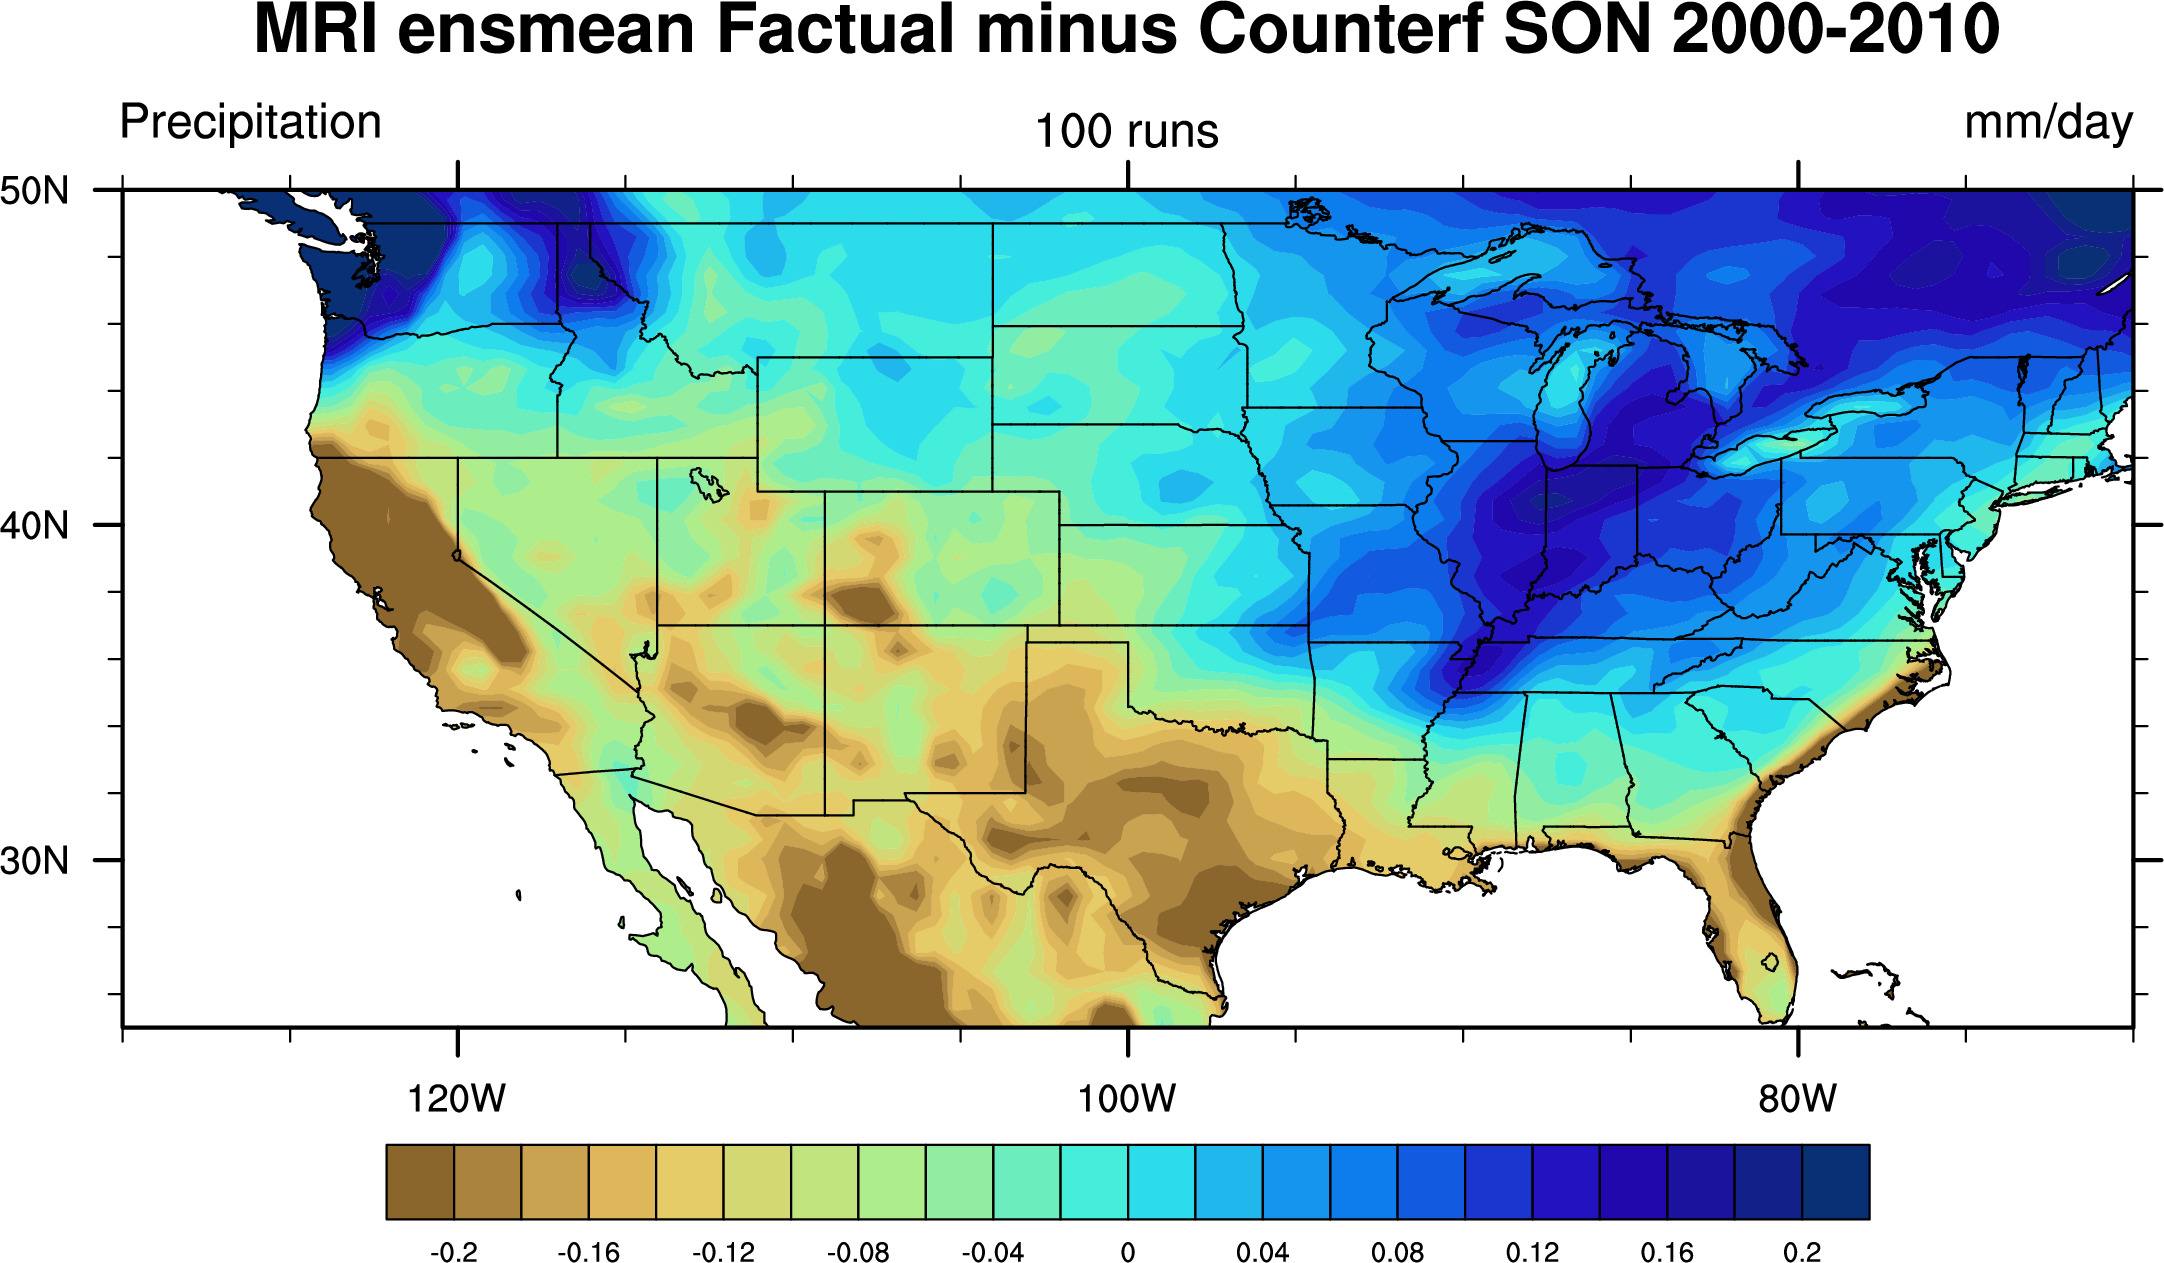
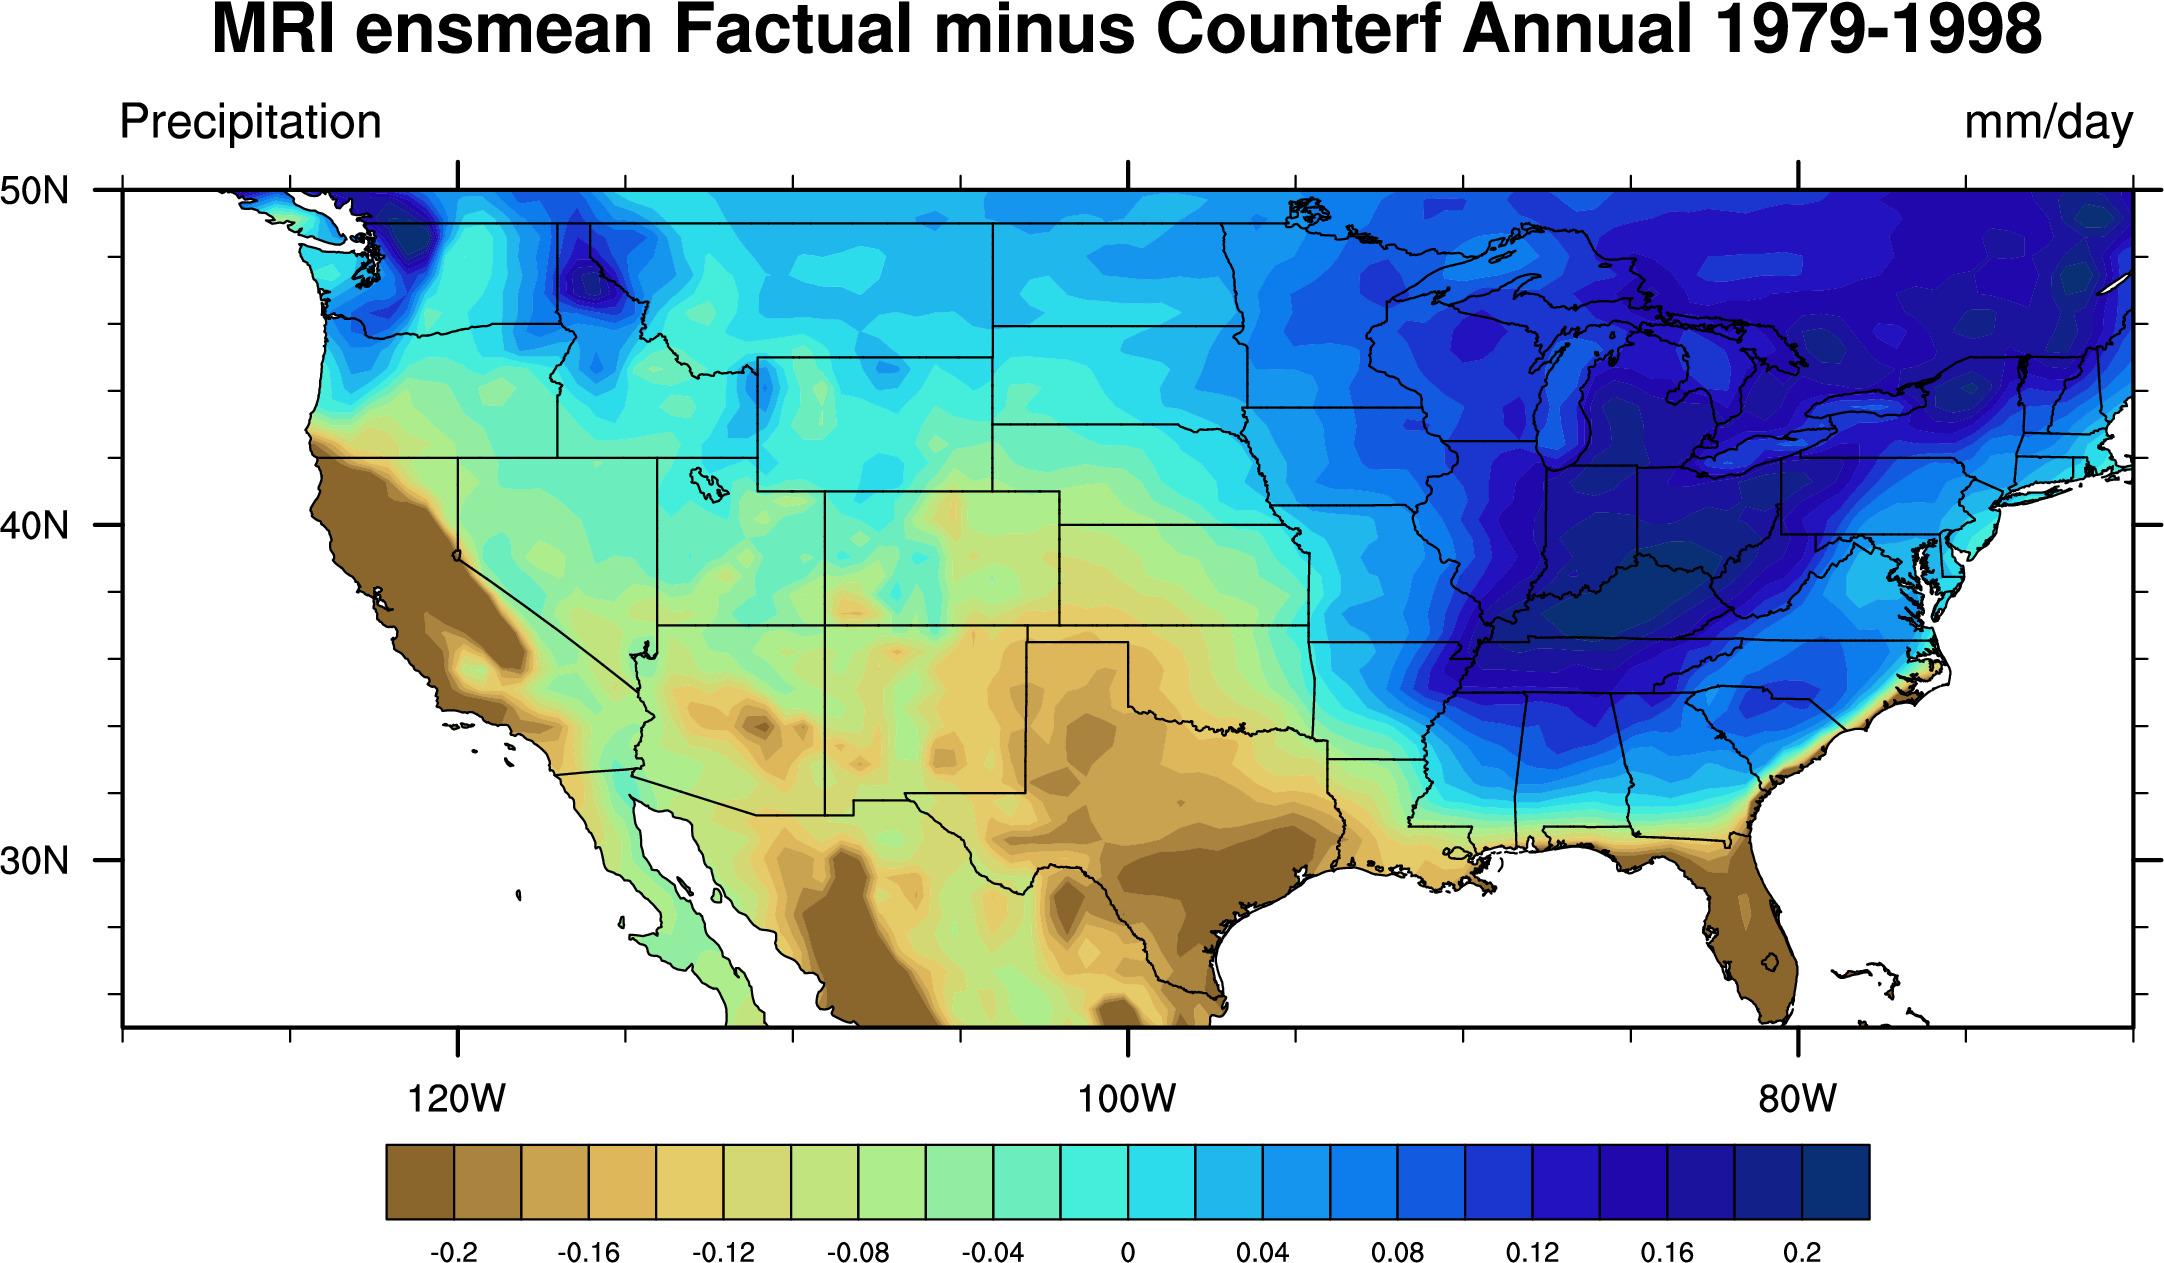
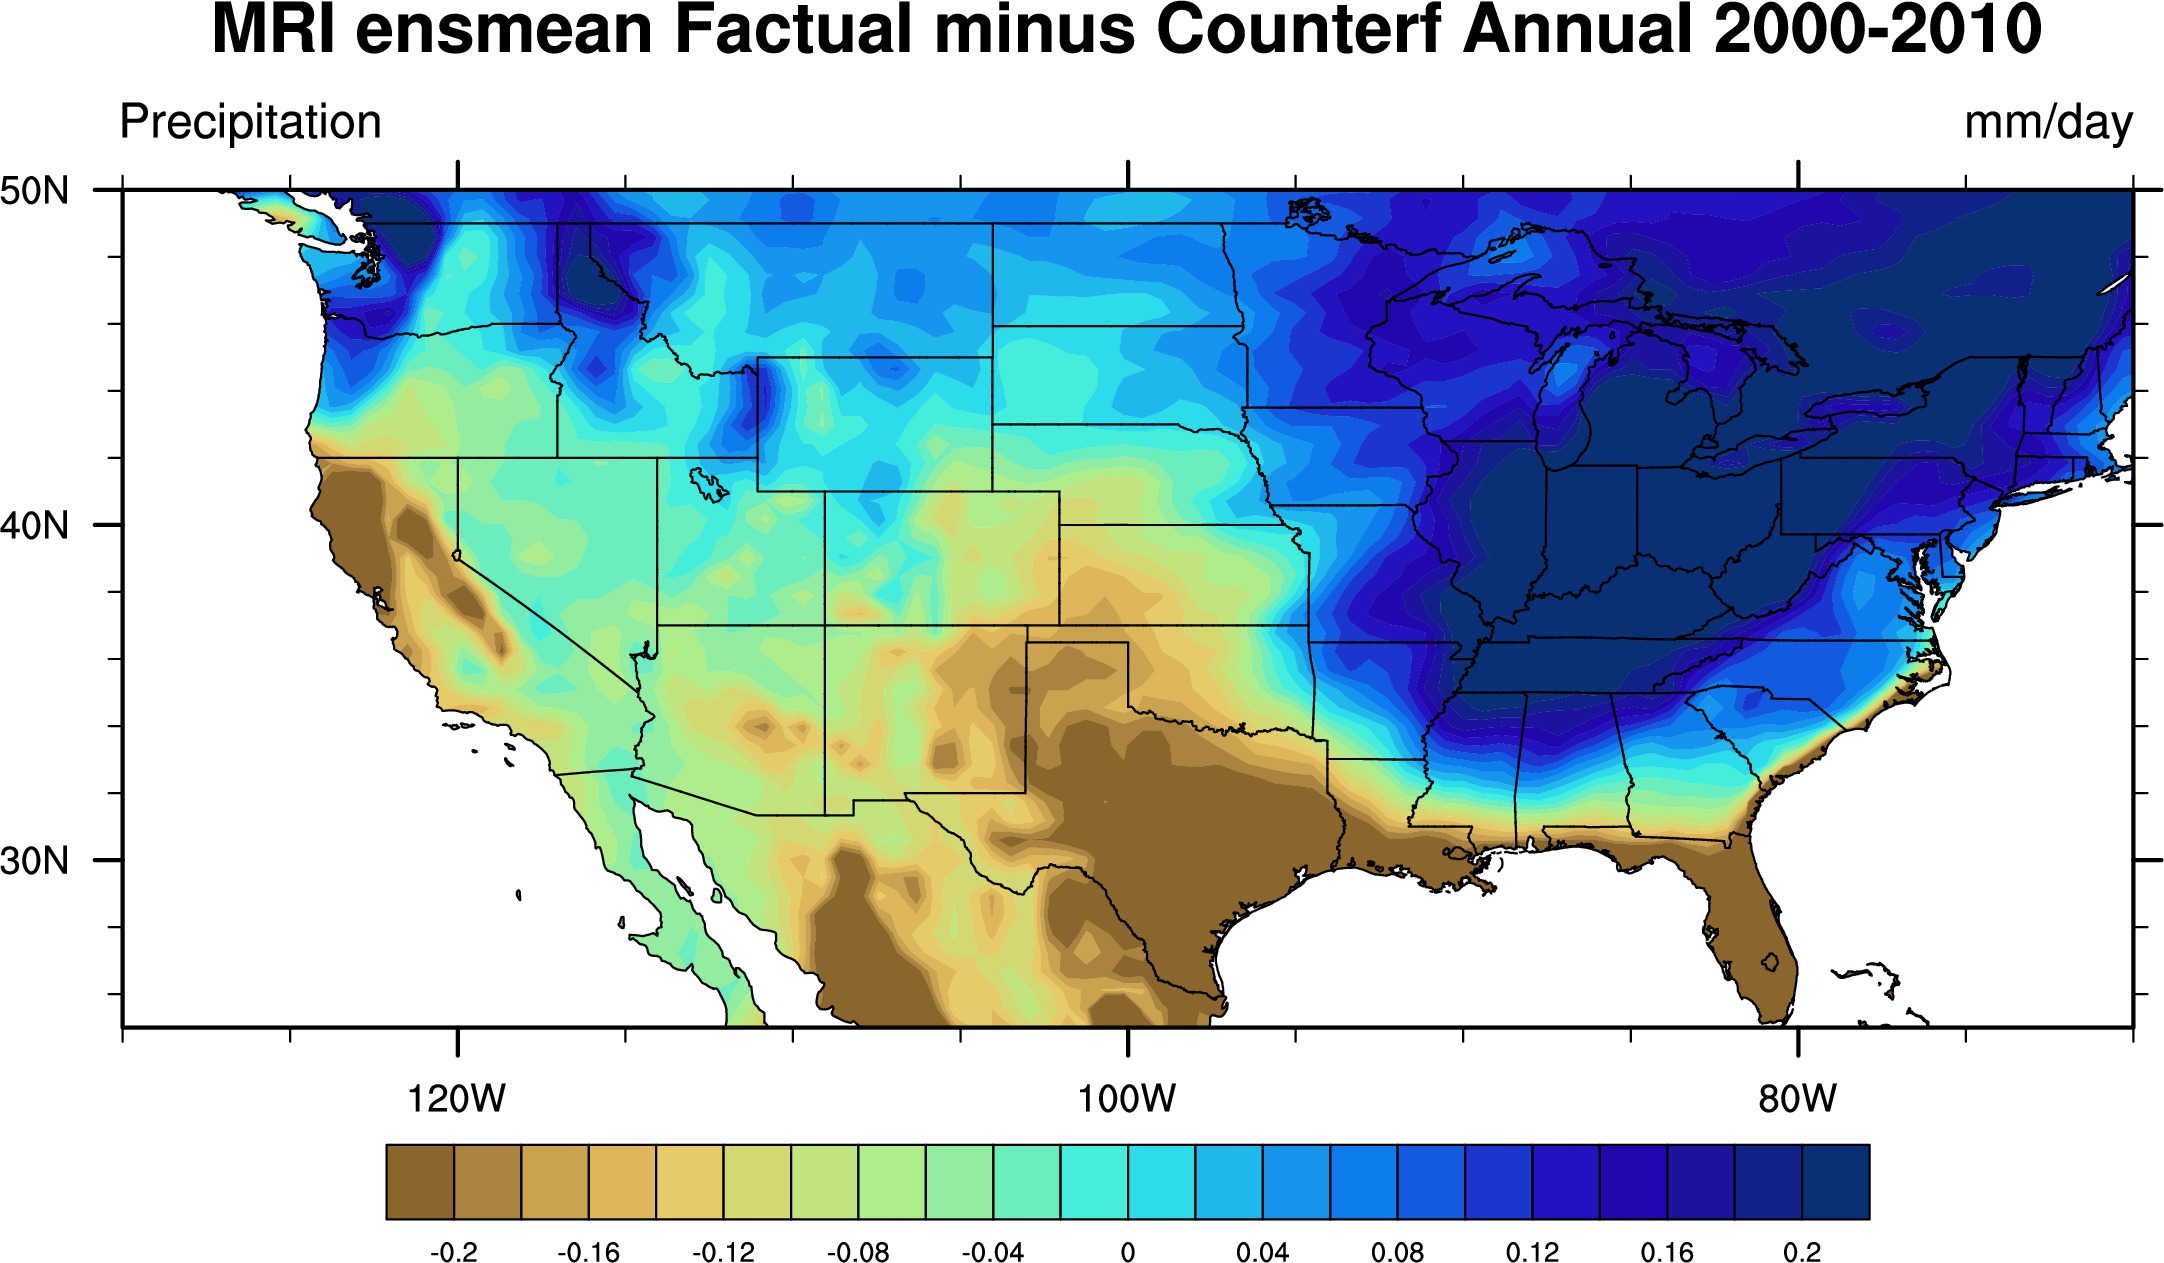
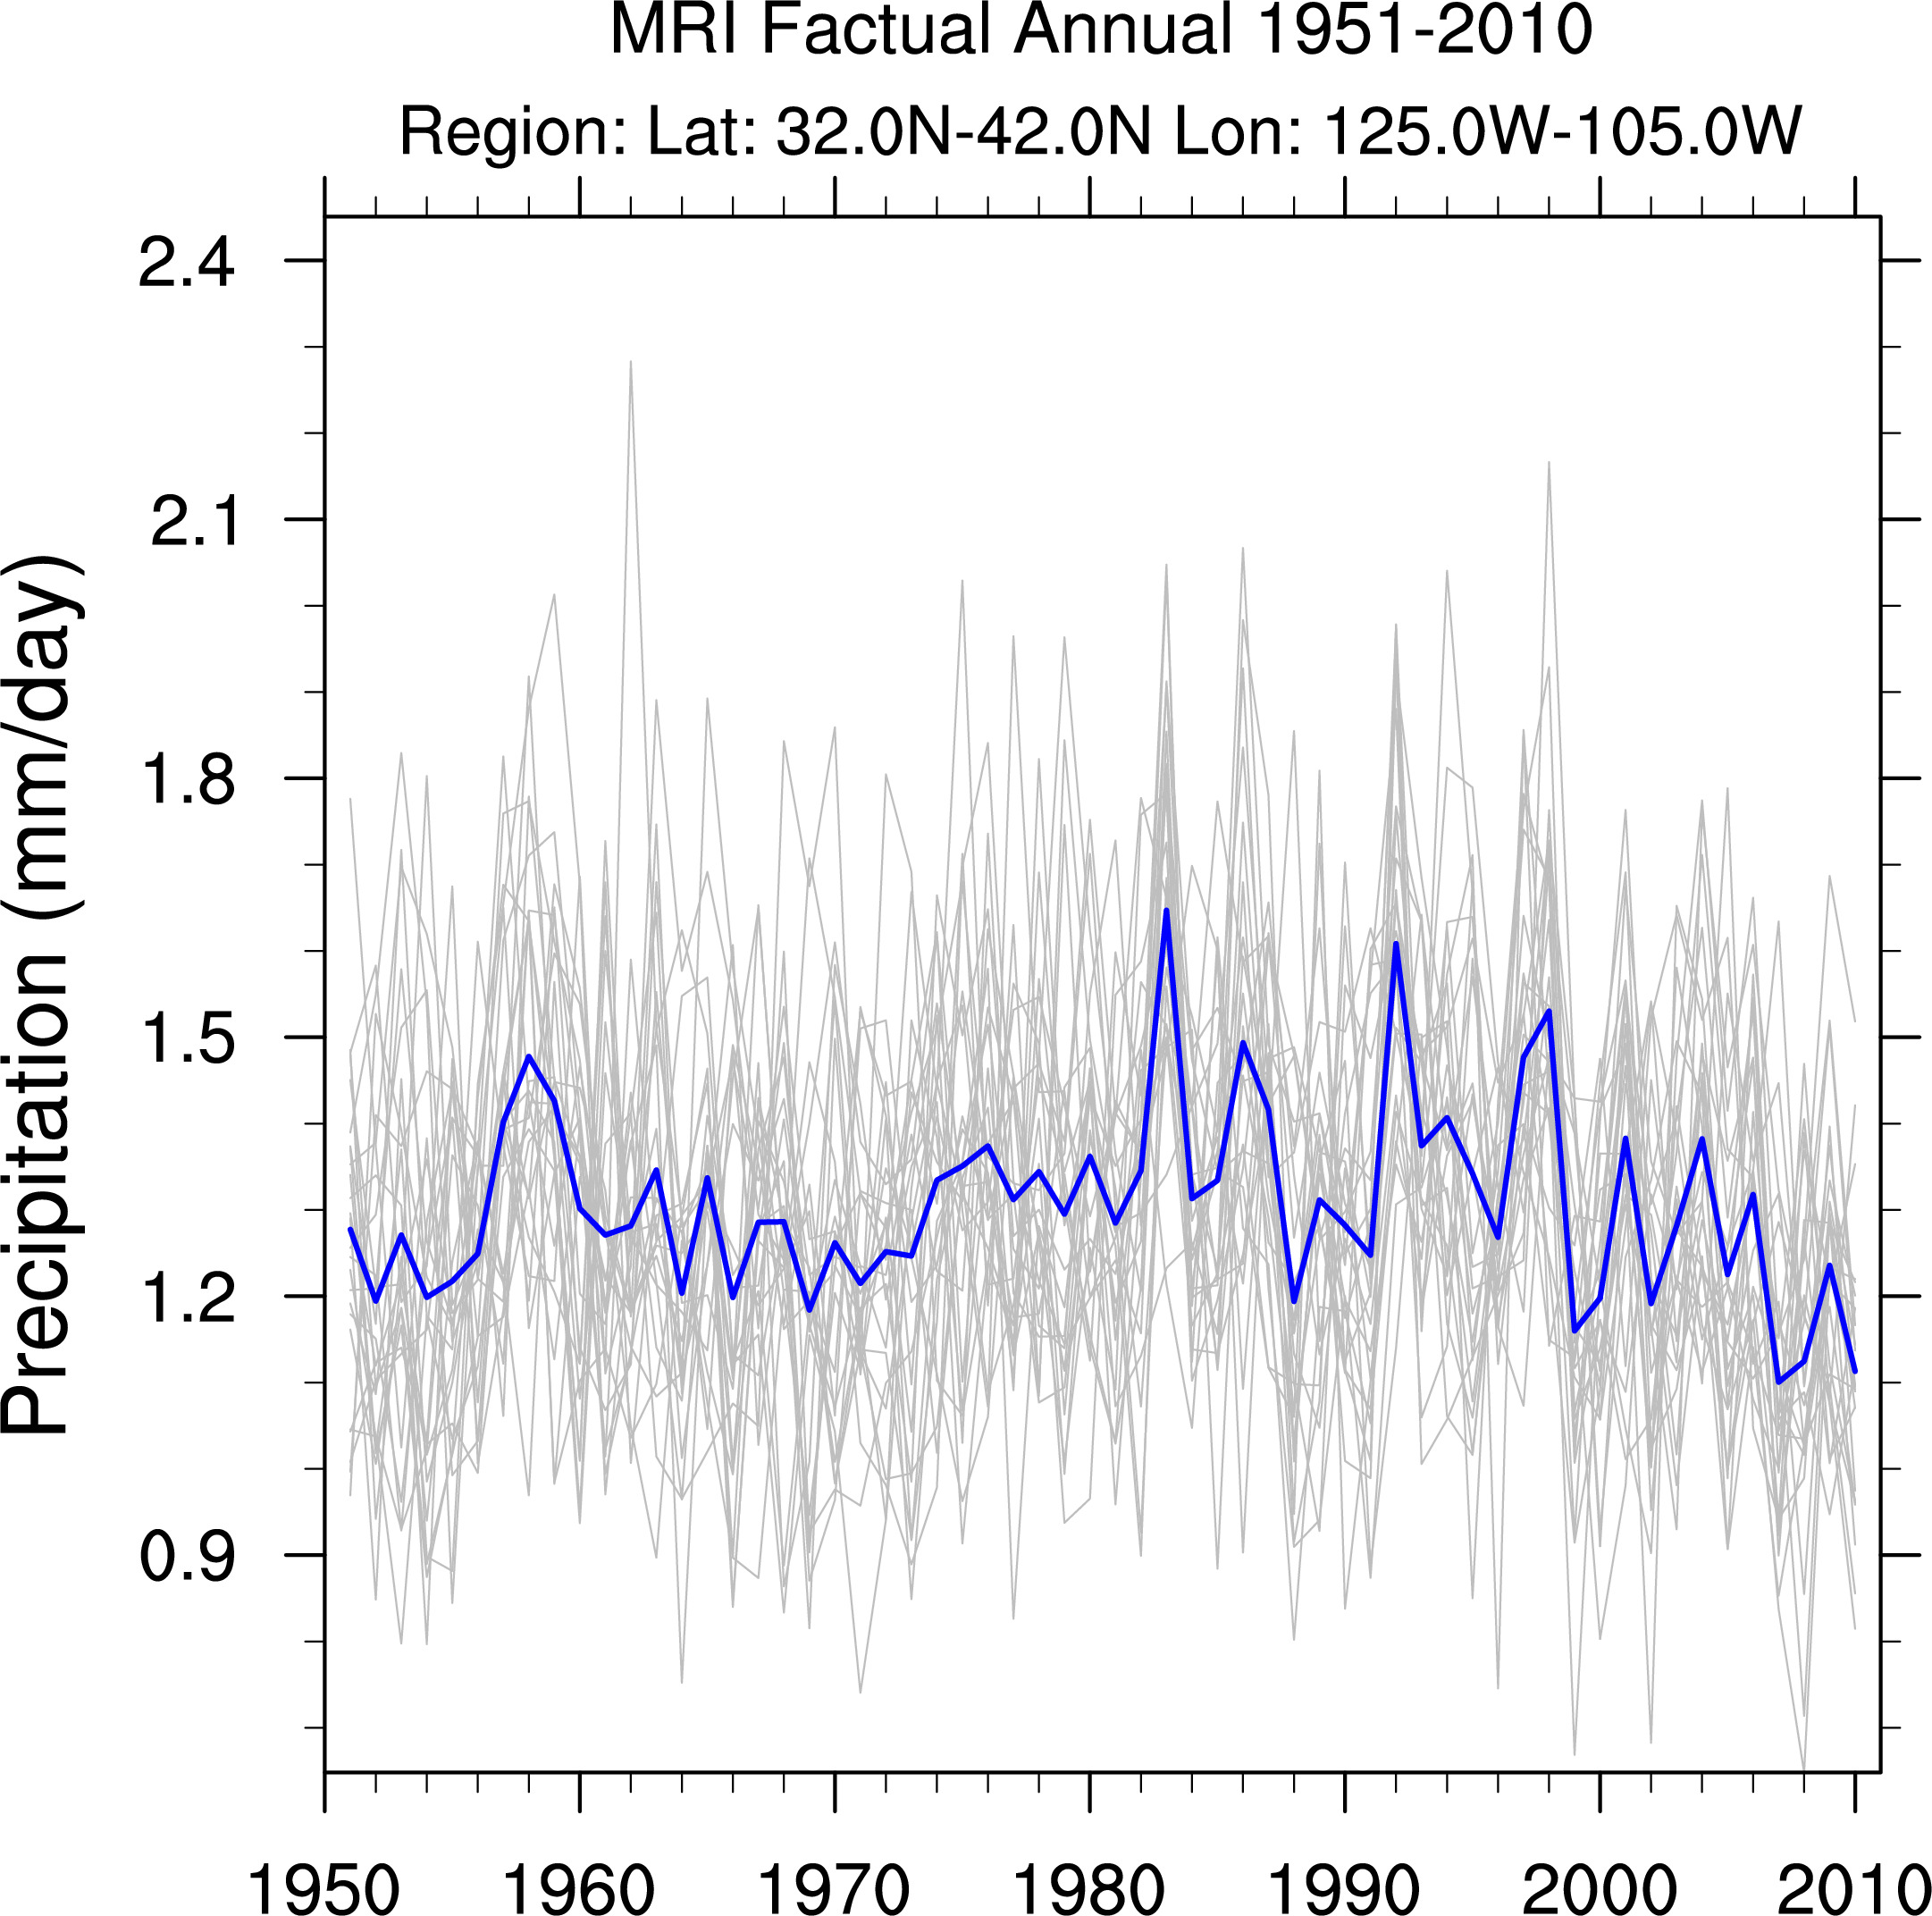
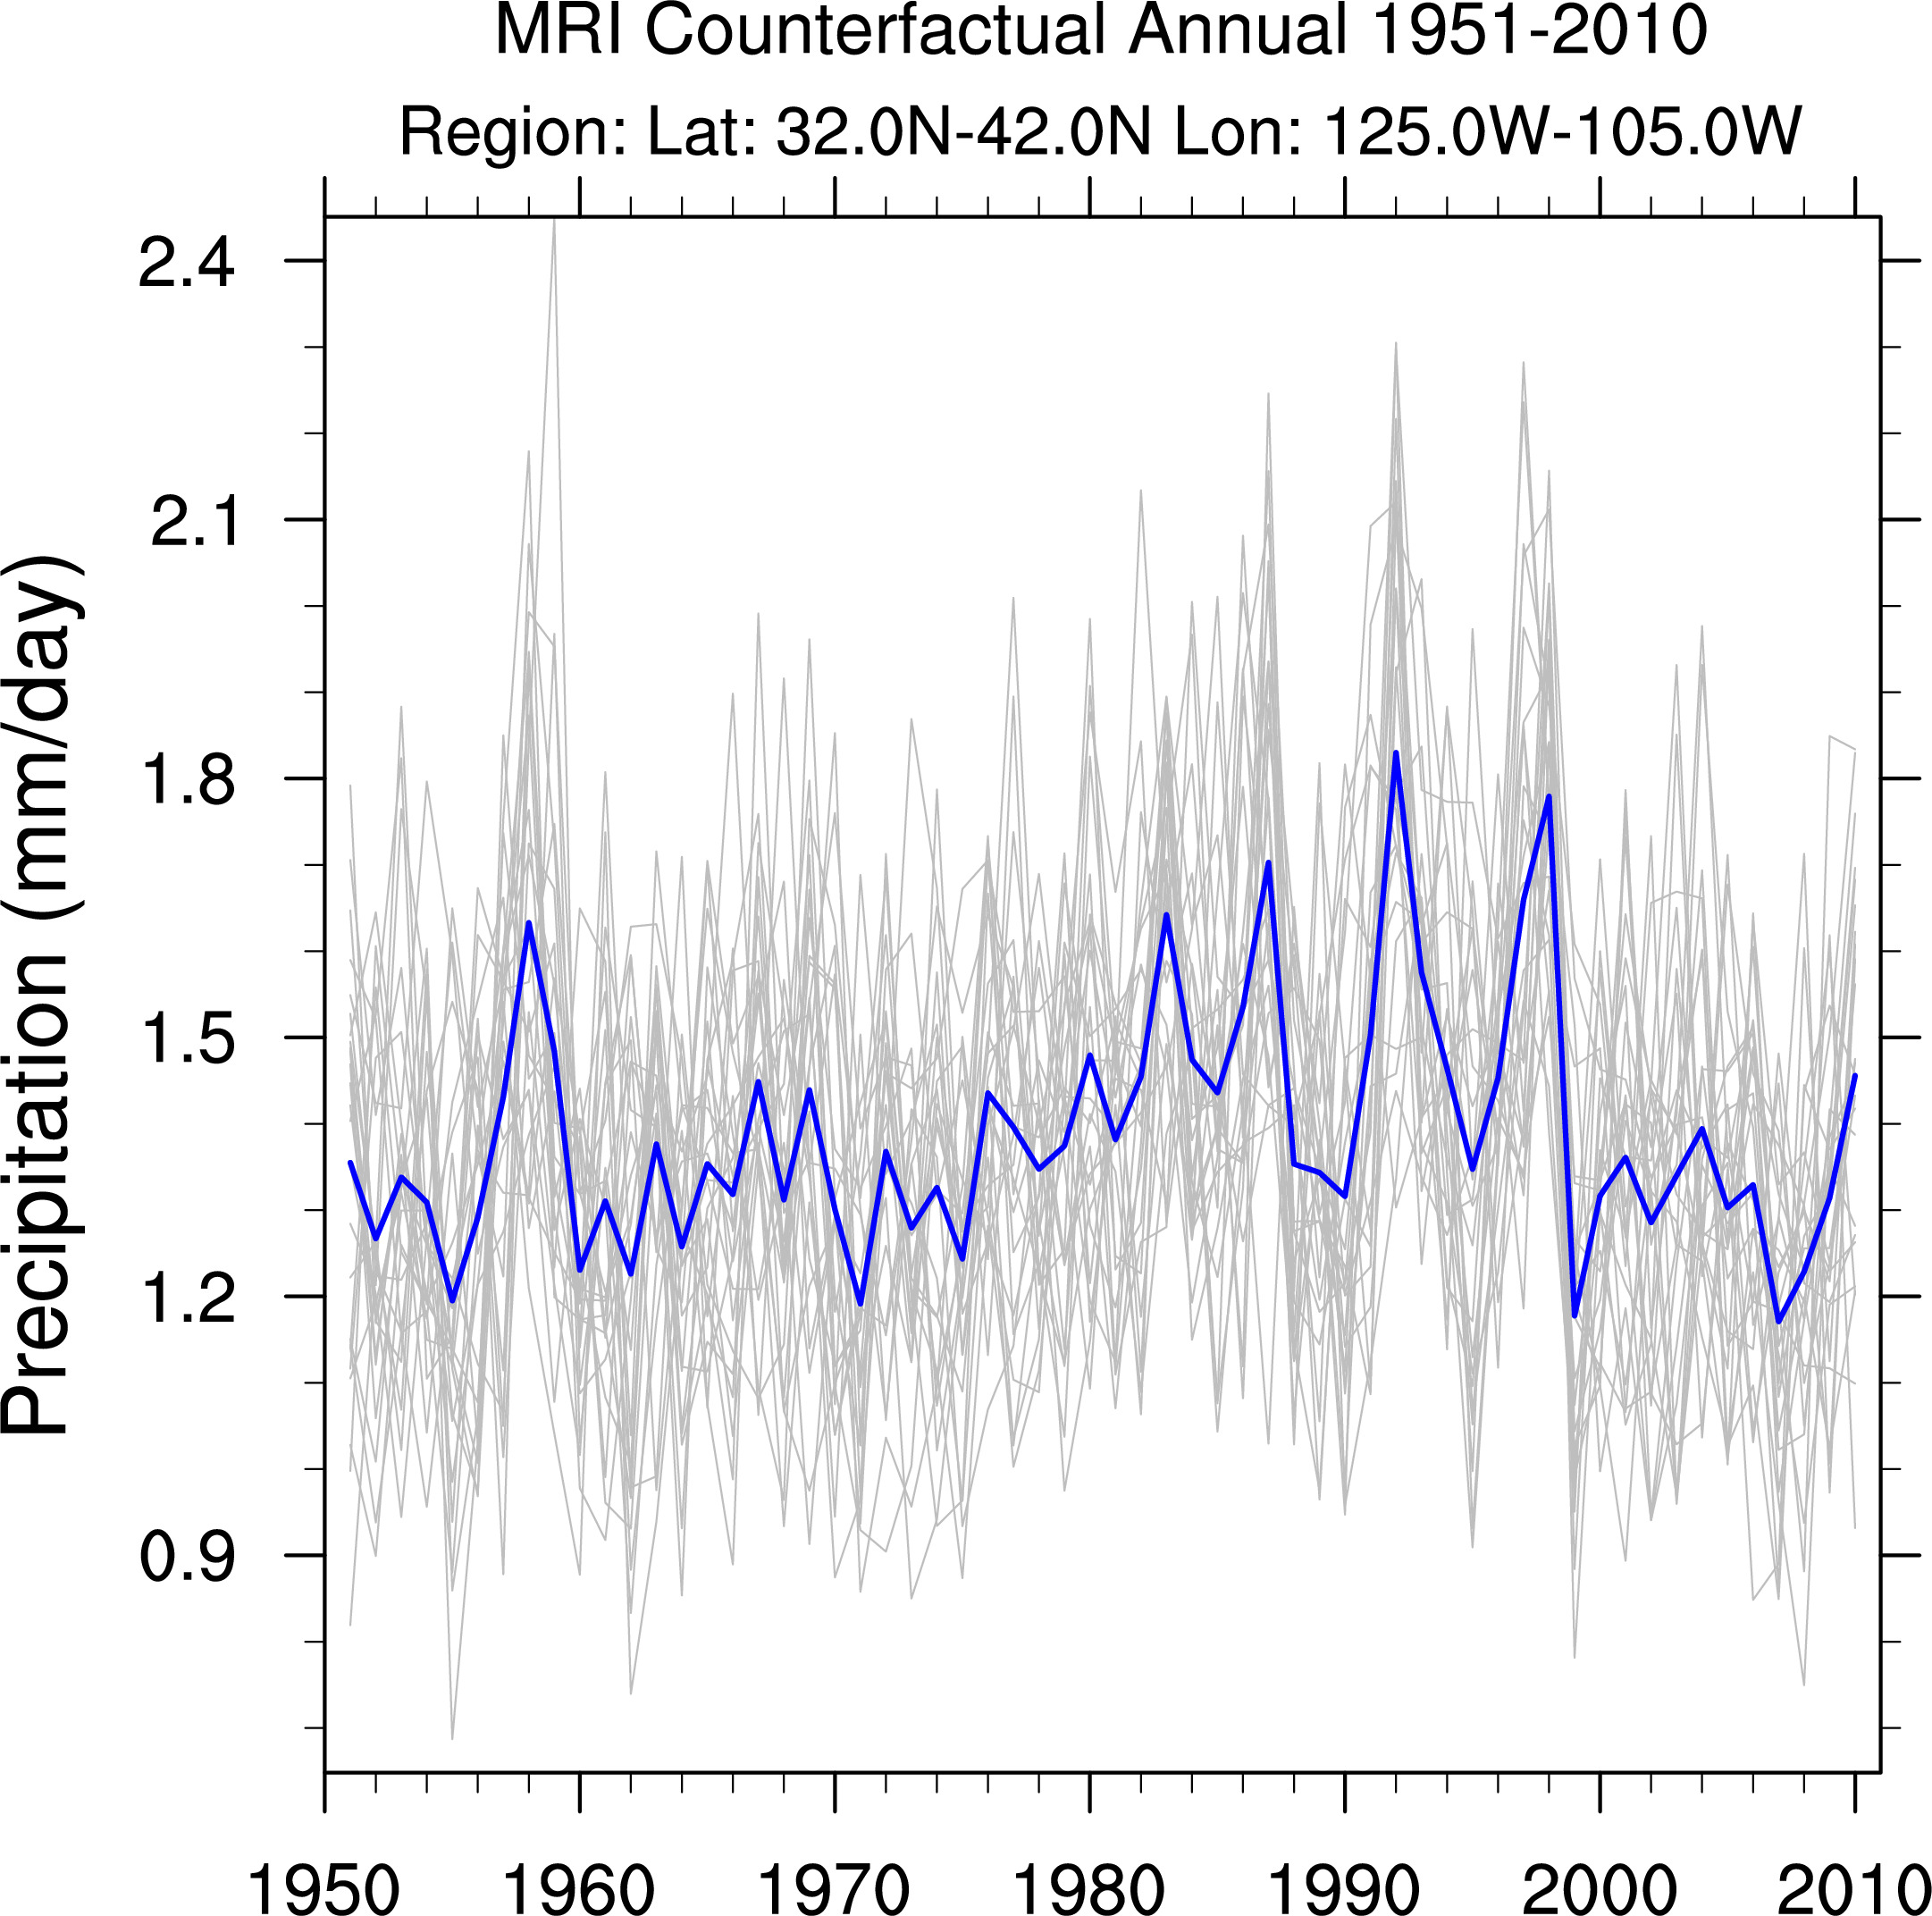
Meteorologic Institute of Japan (MRI) precipitation data:
Seasonal
Annual
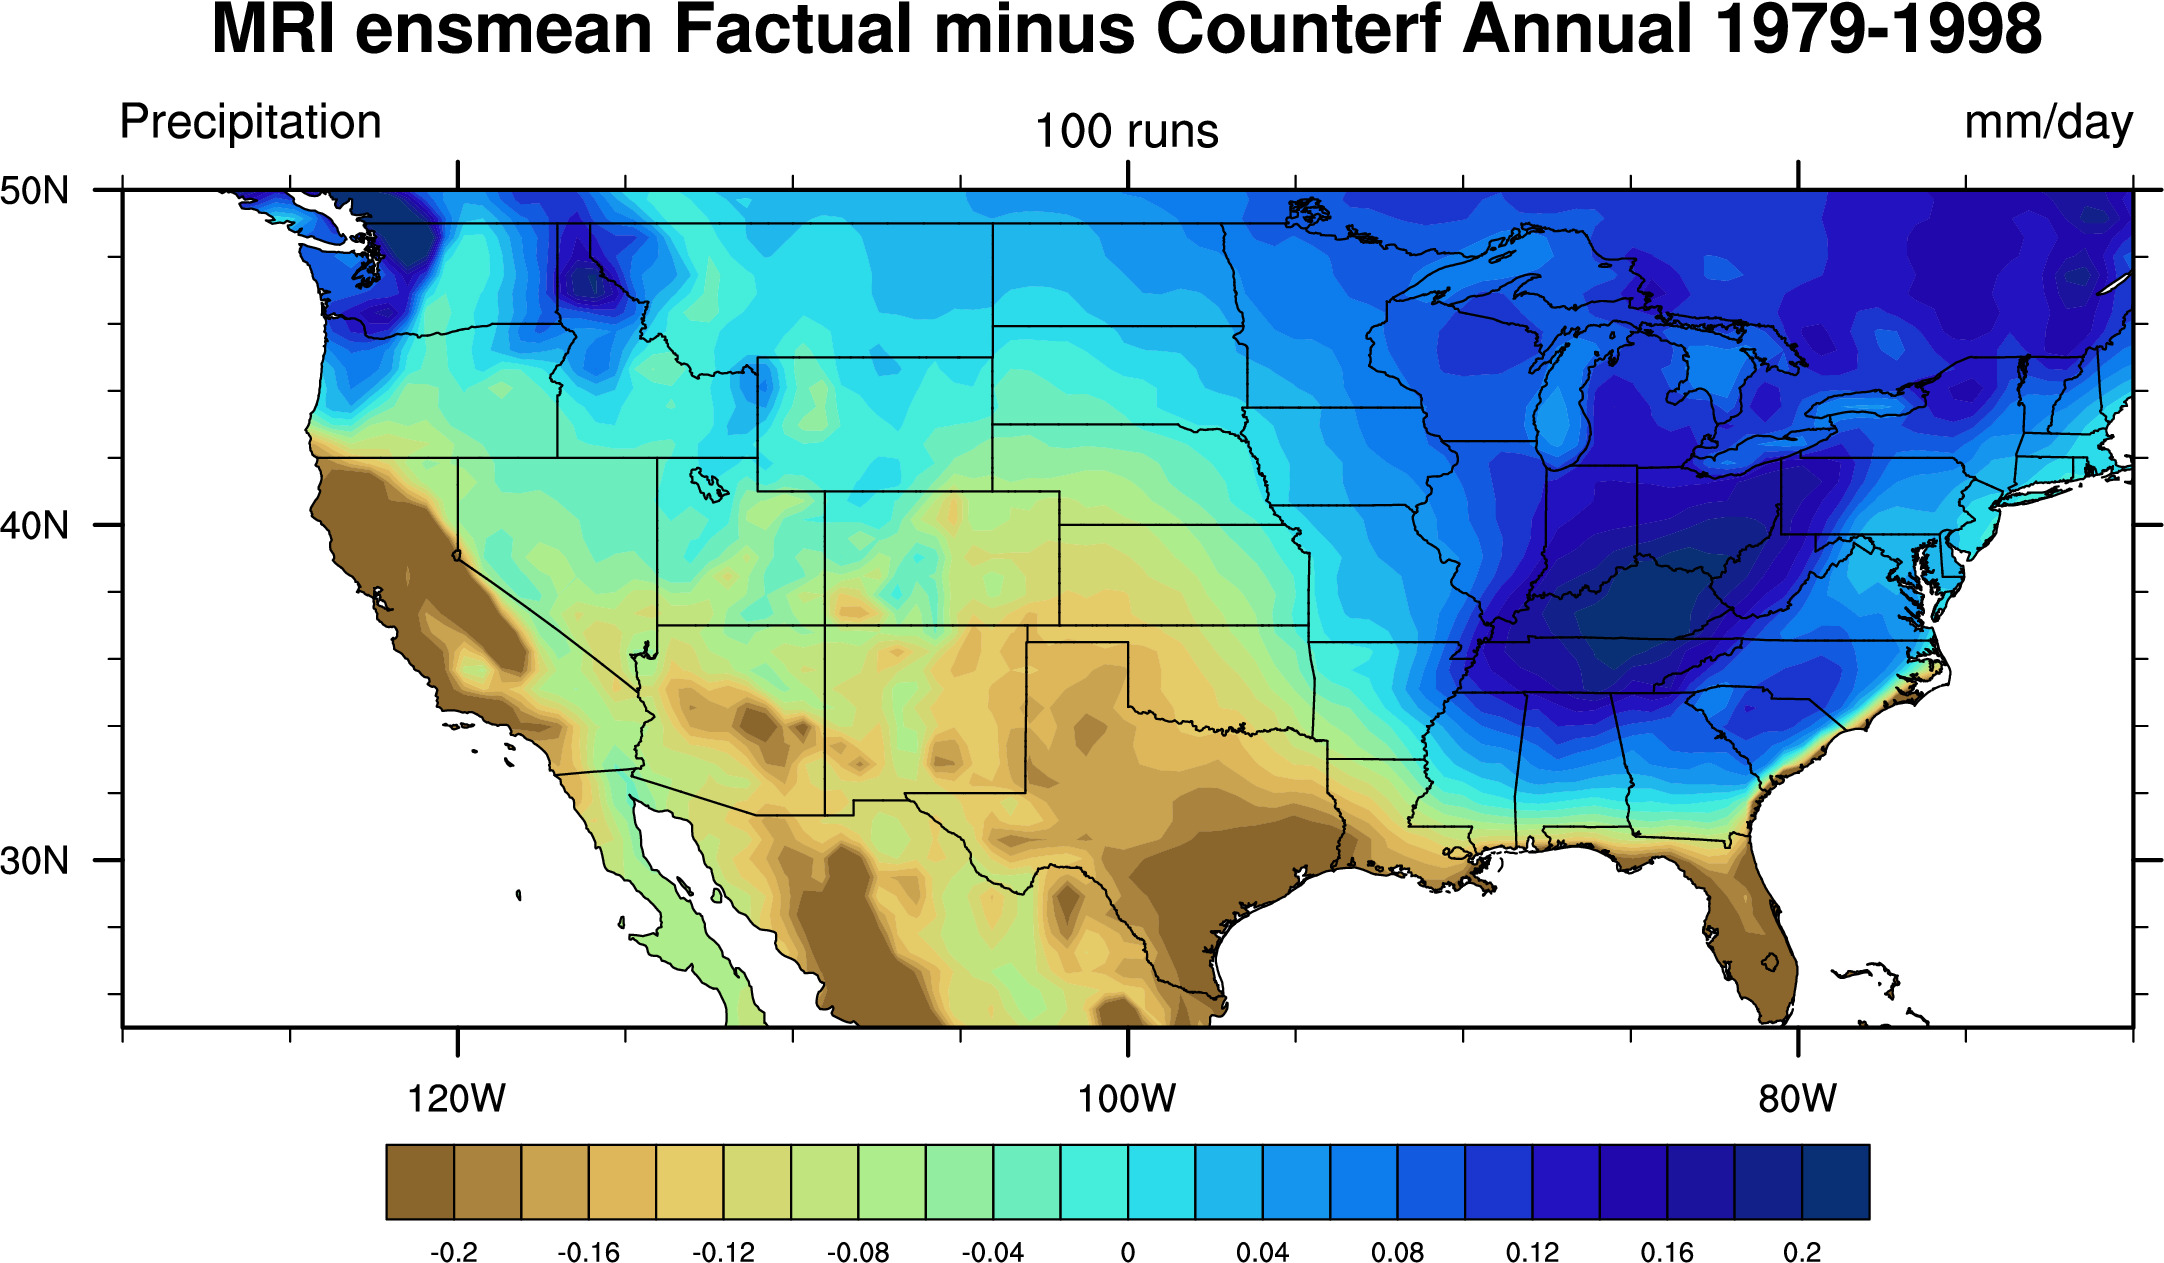
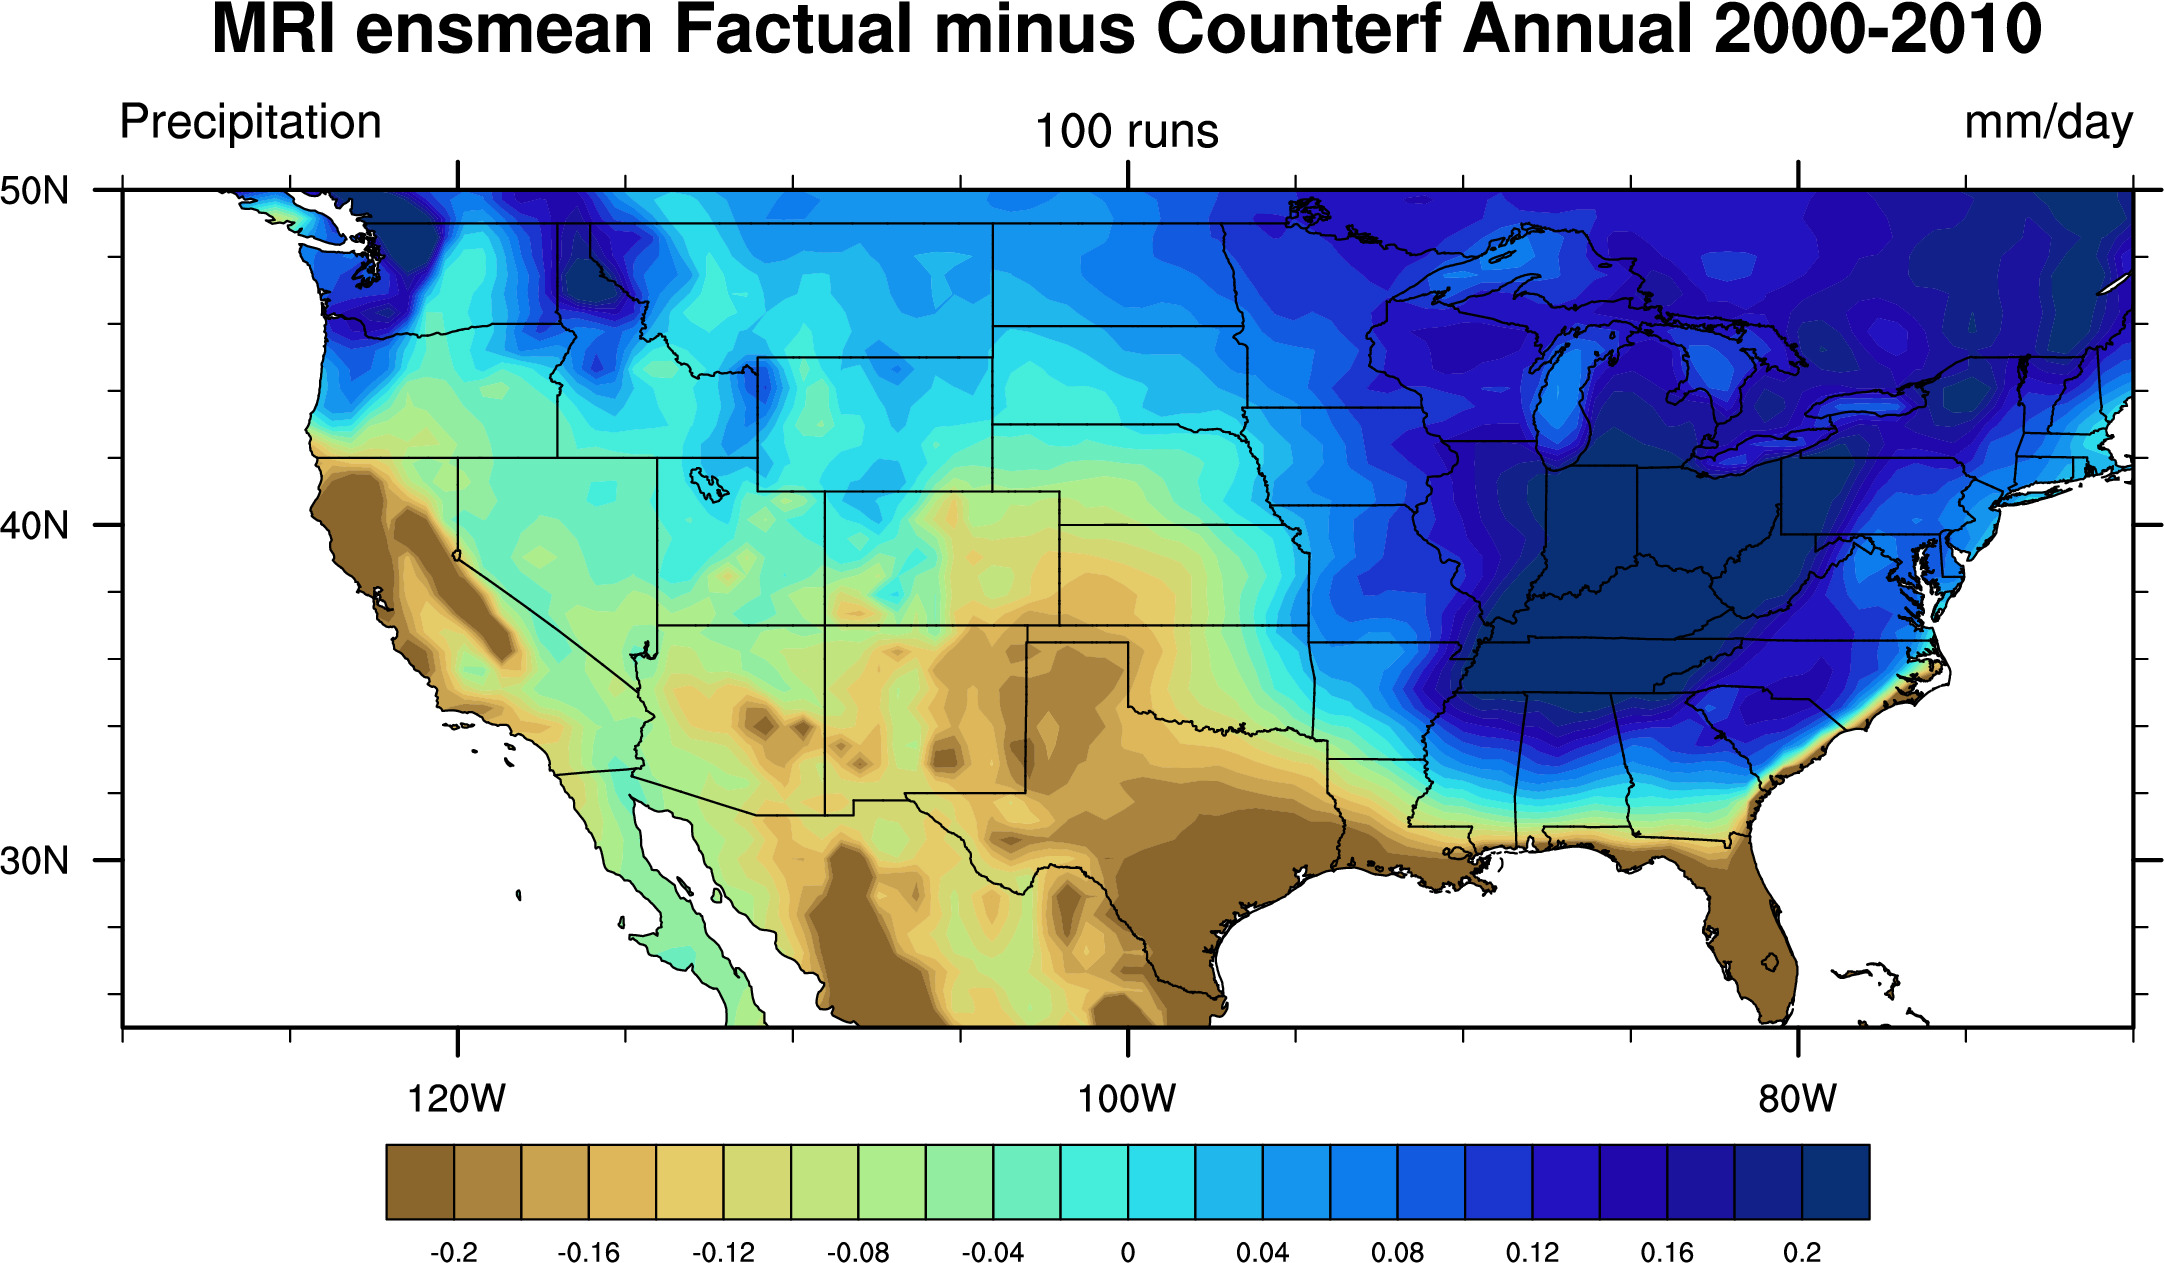
Following plots made with runs 1 through 25:
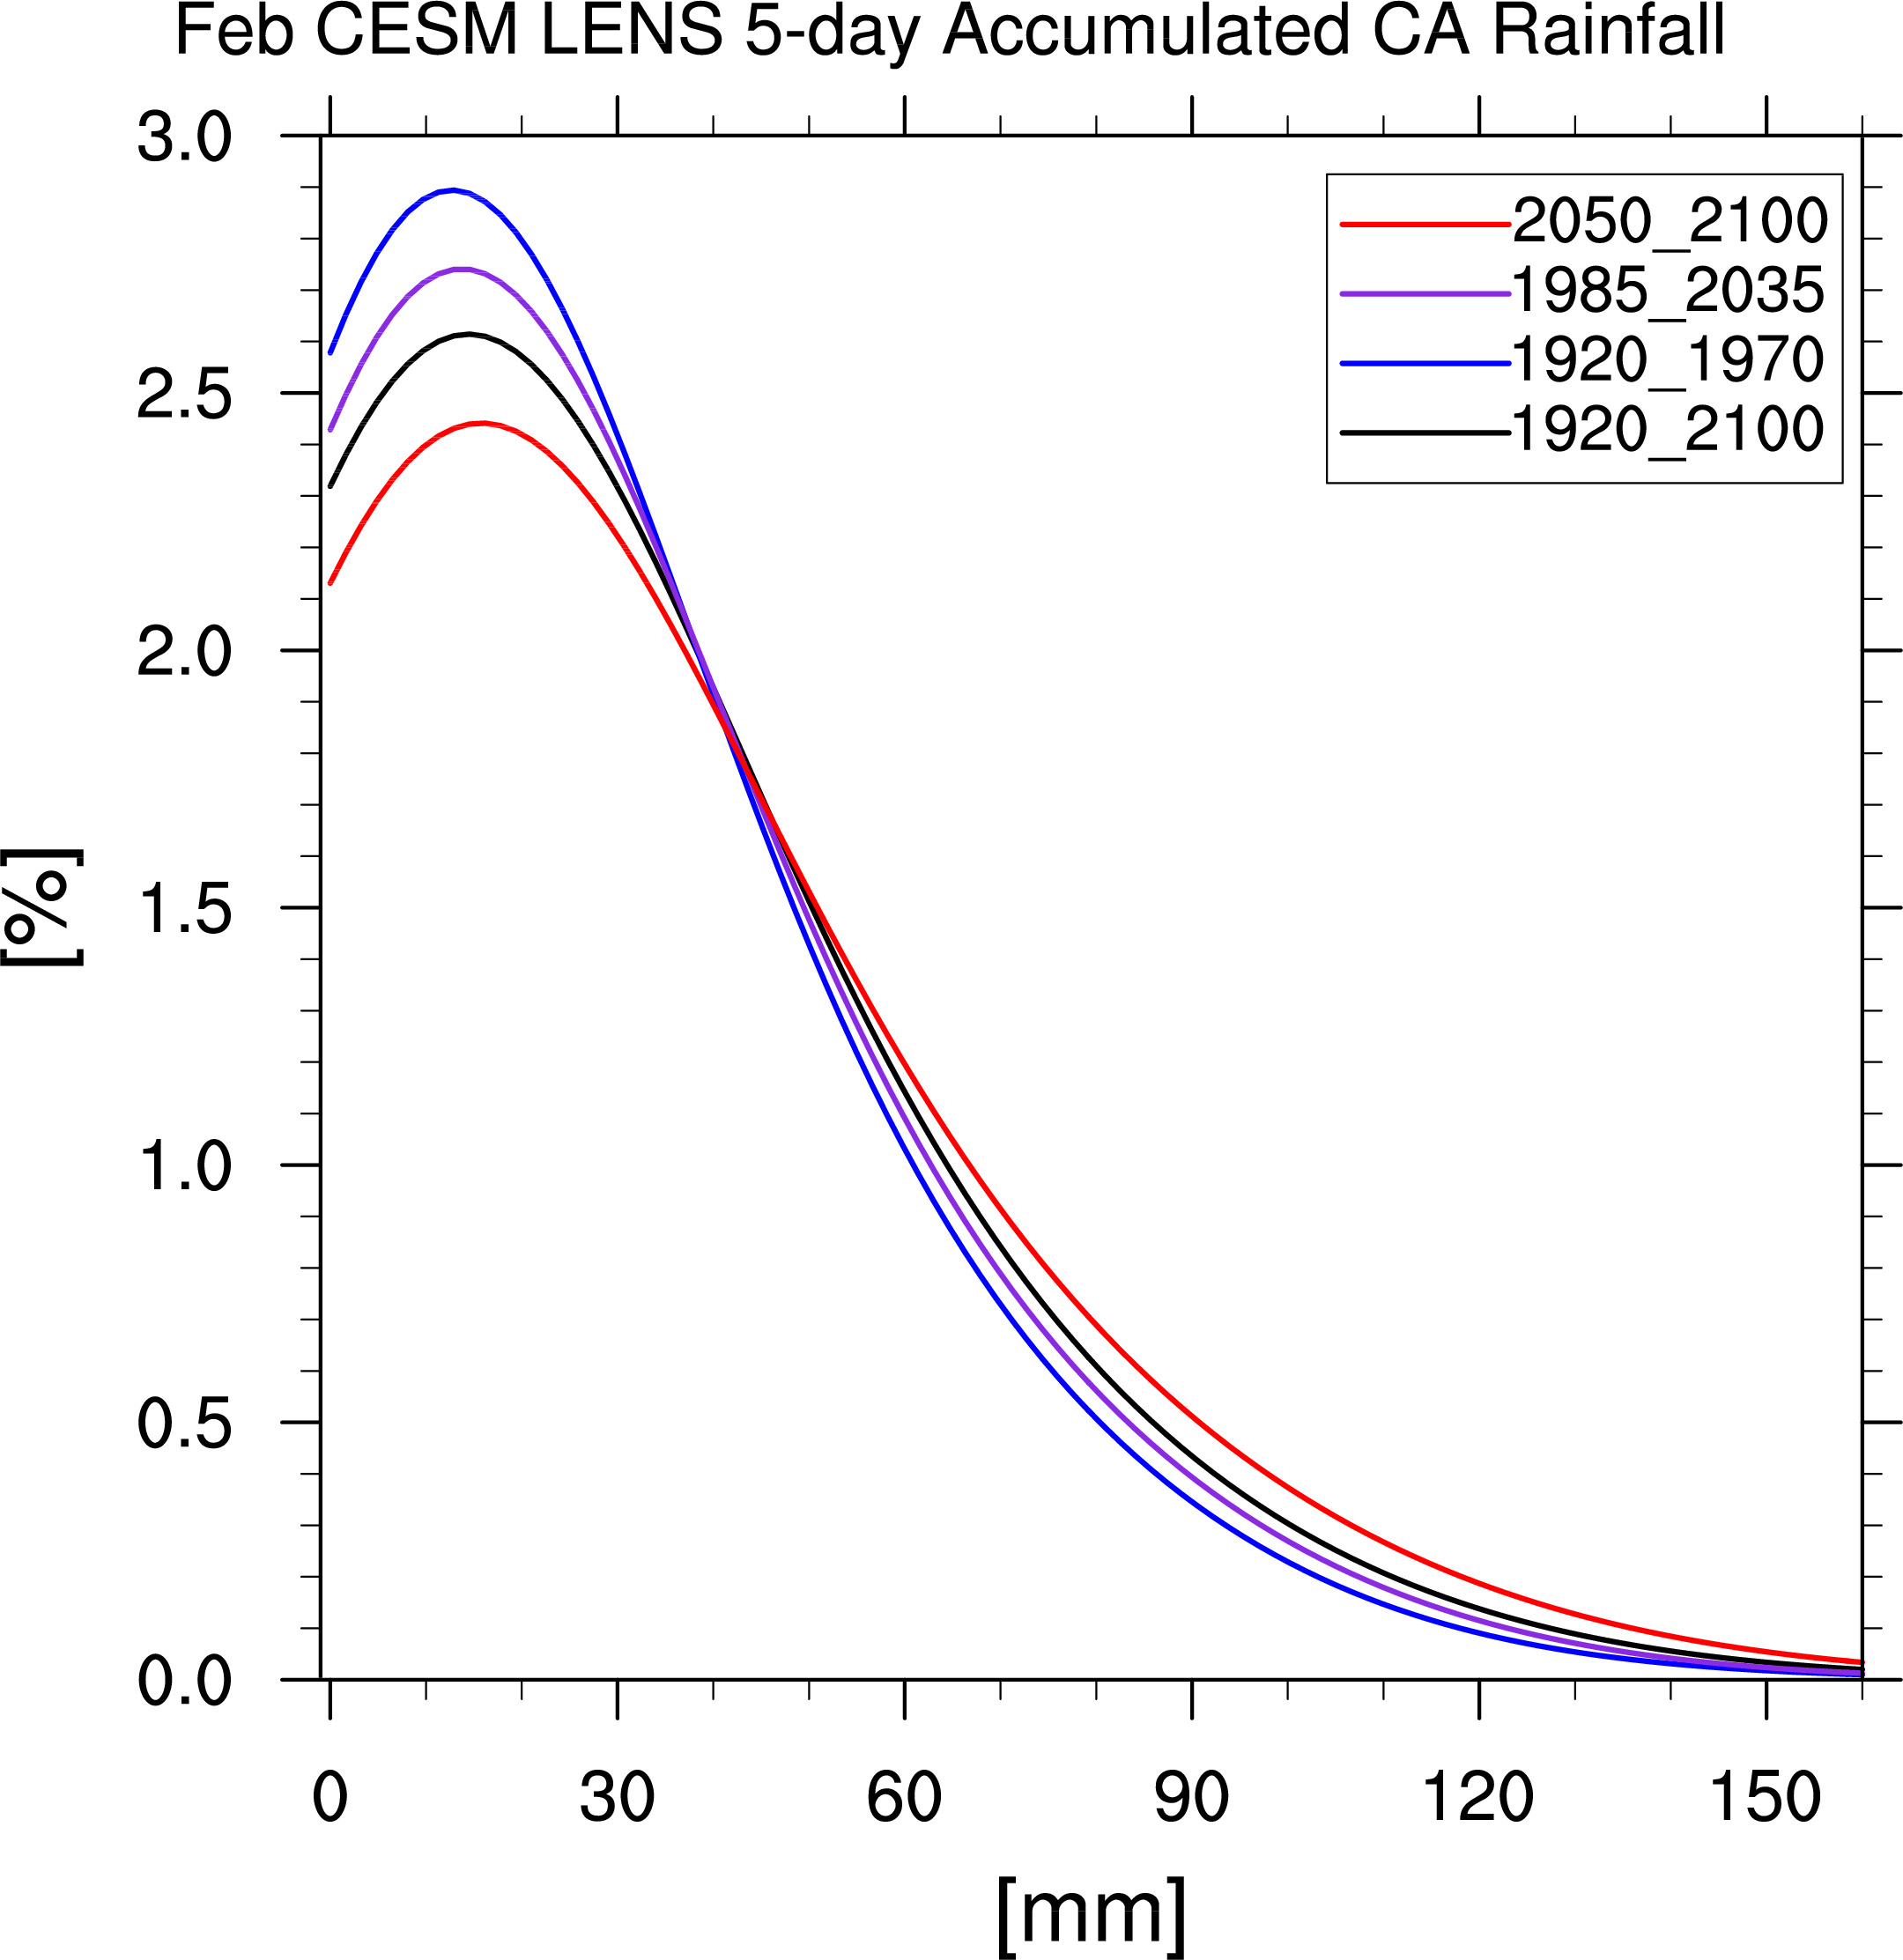
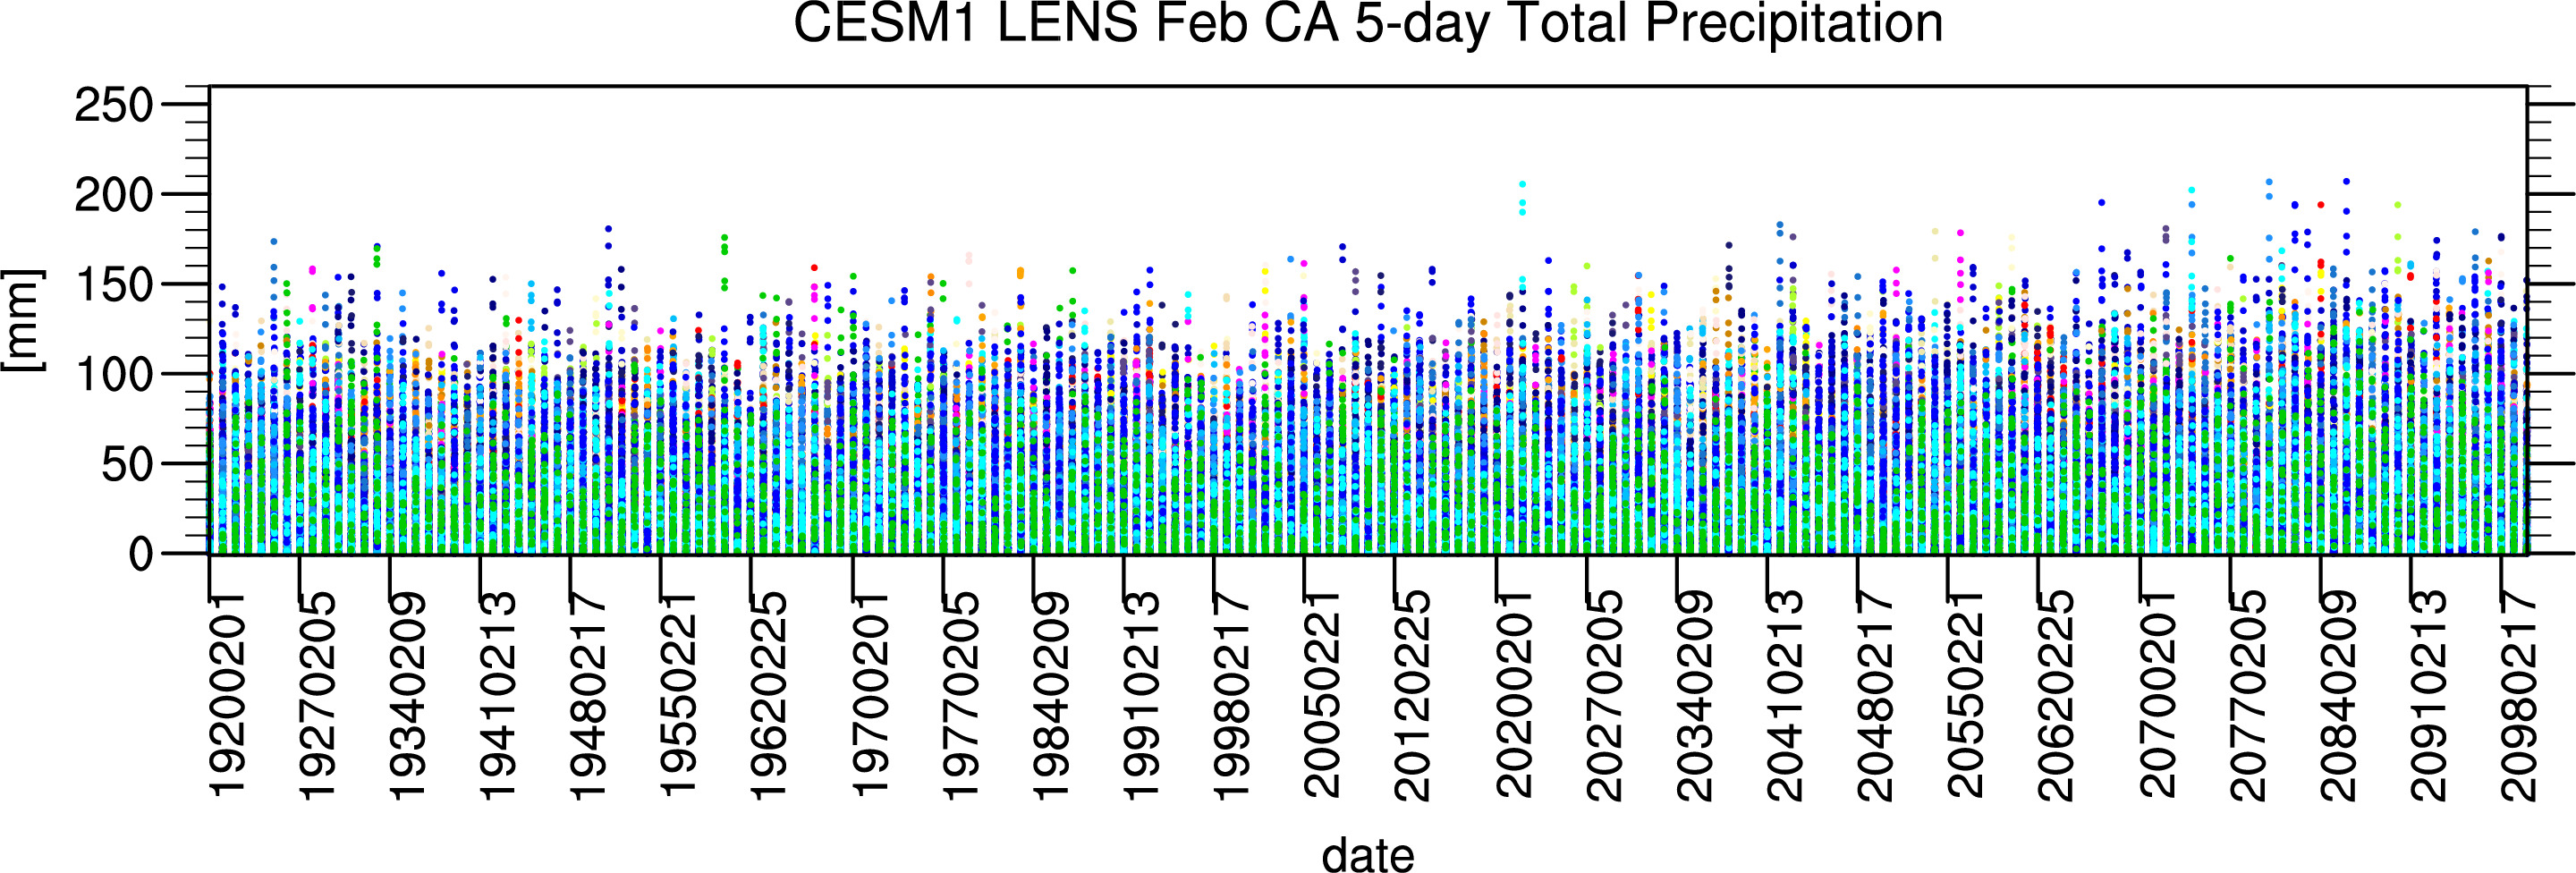
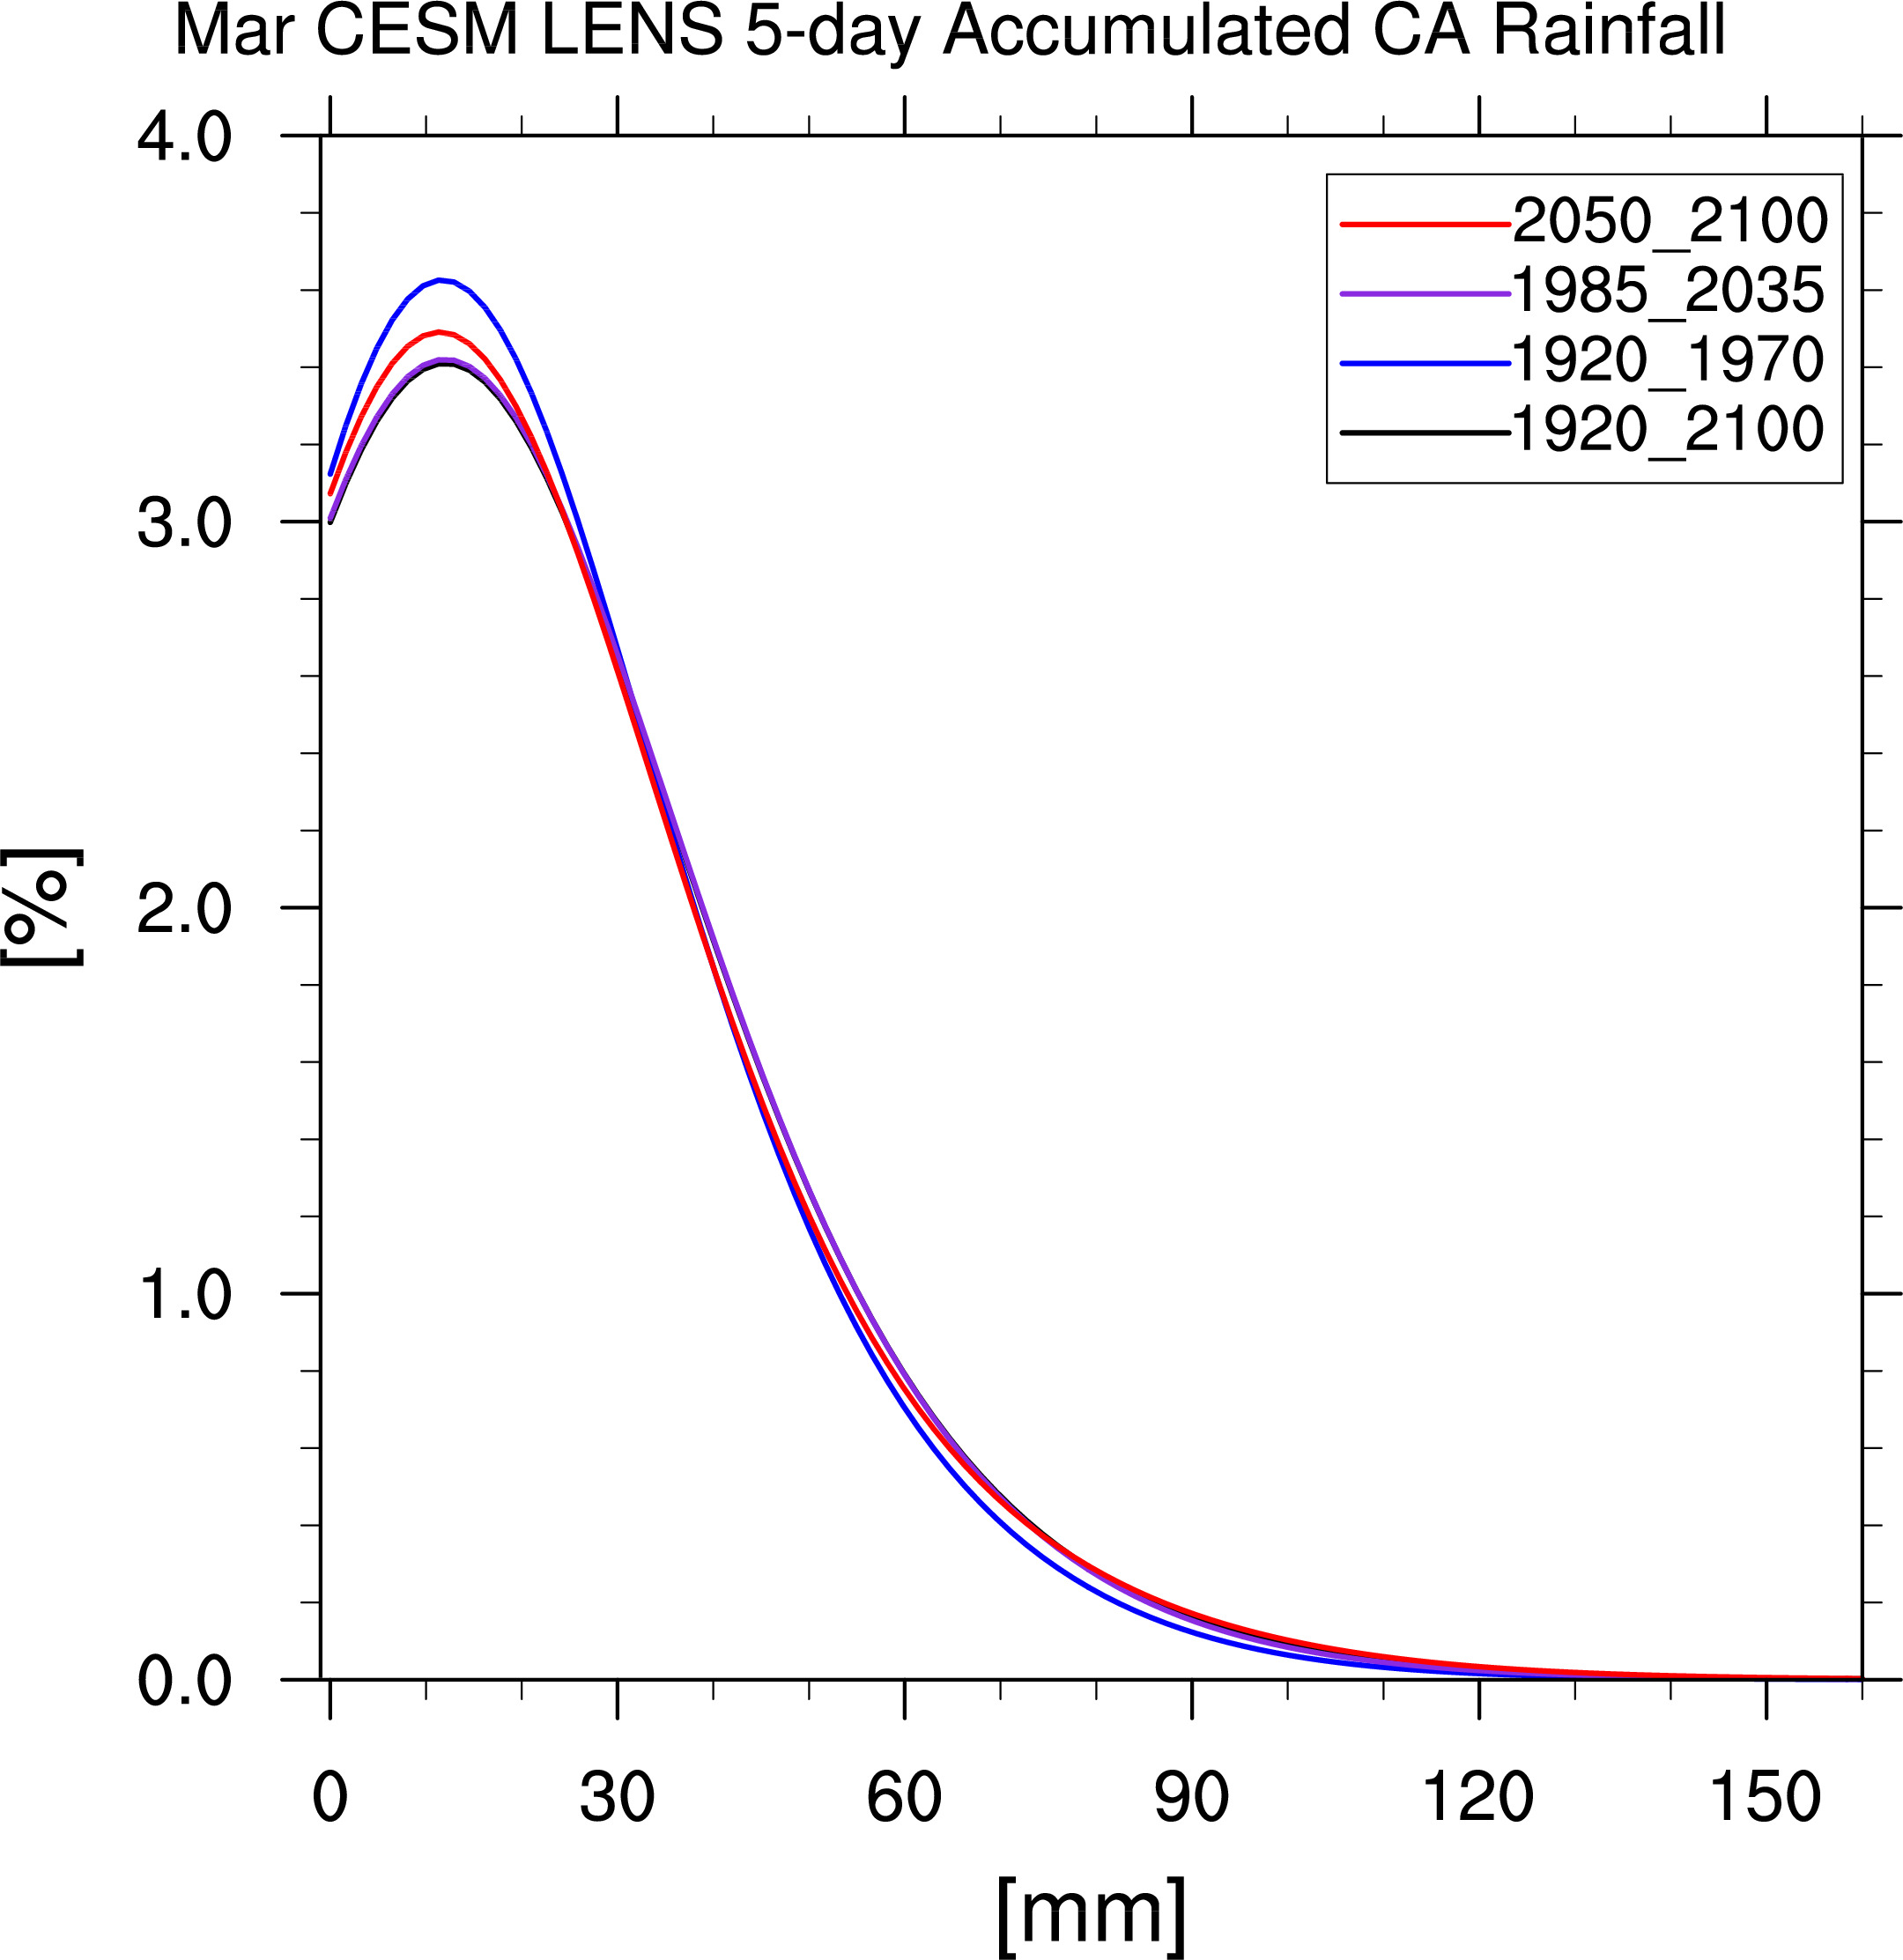
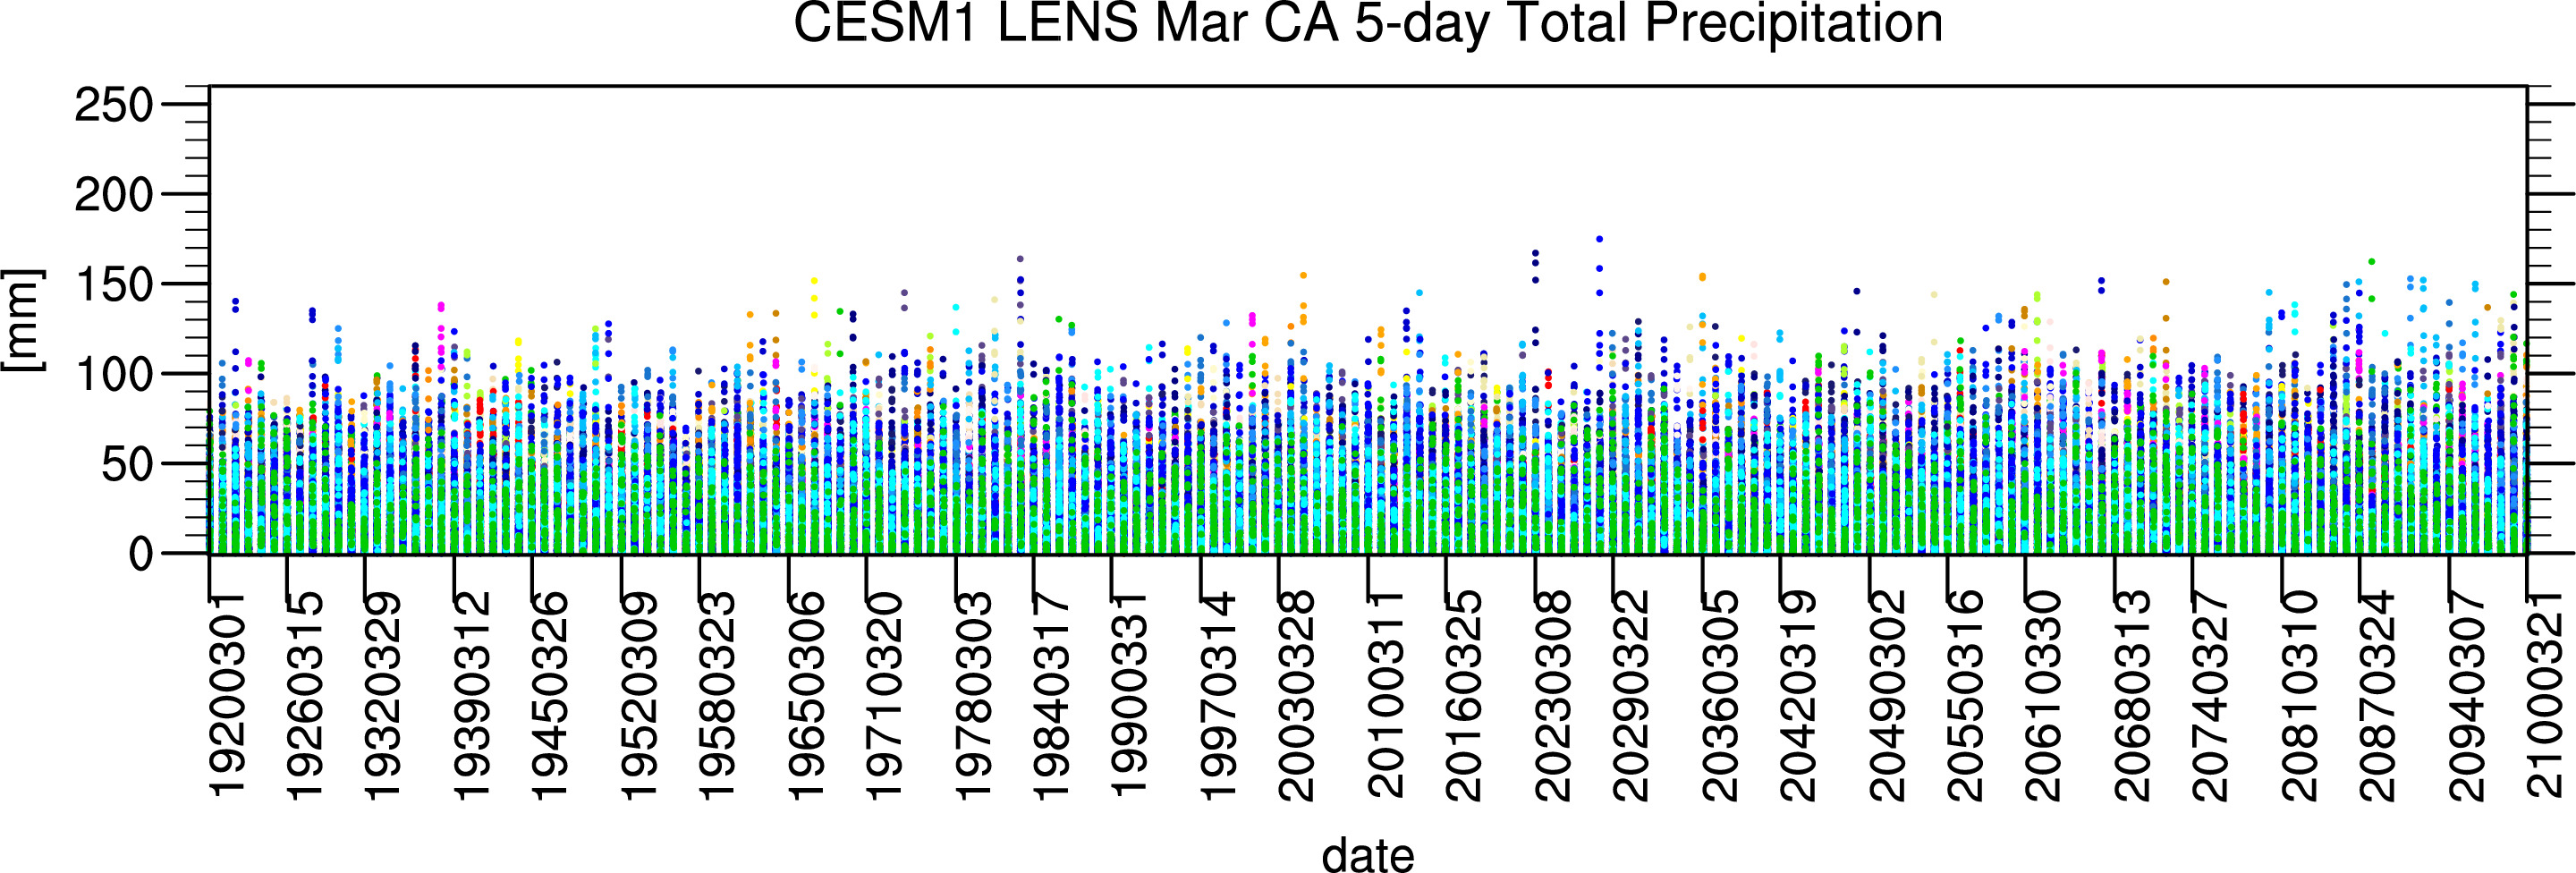
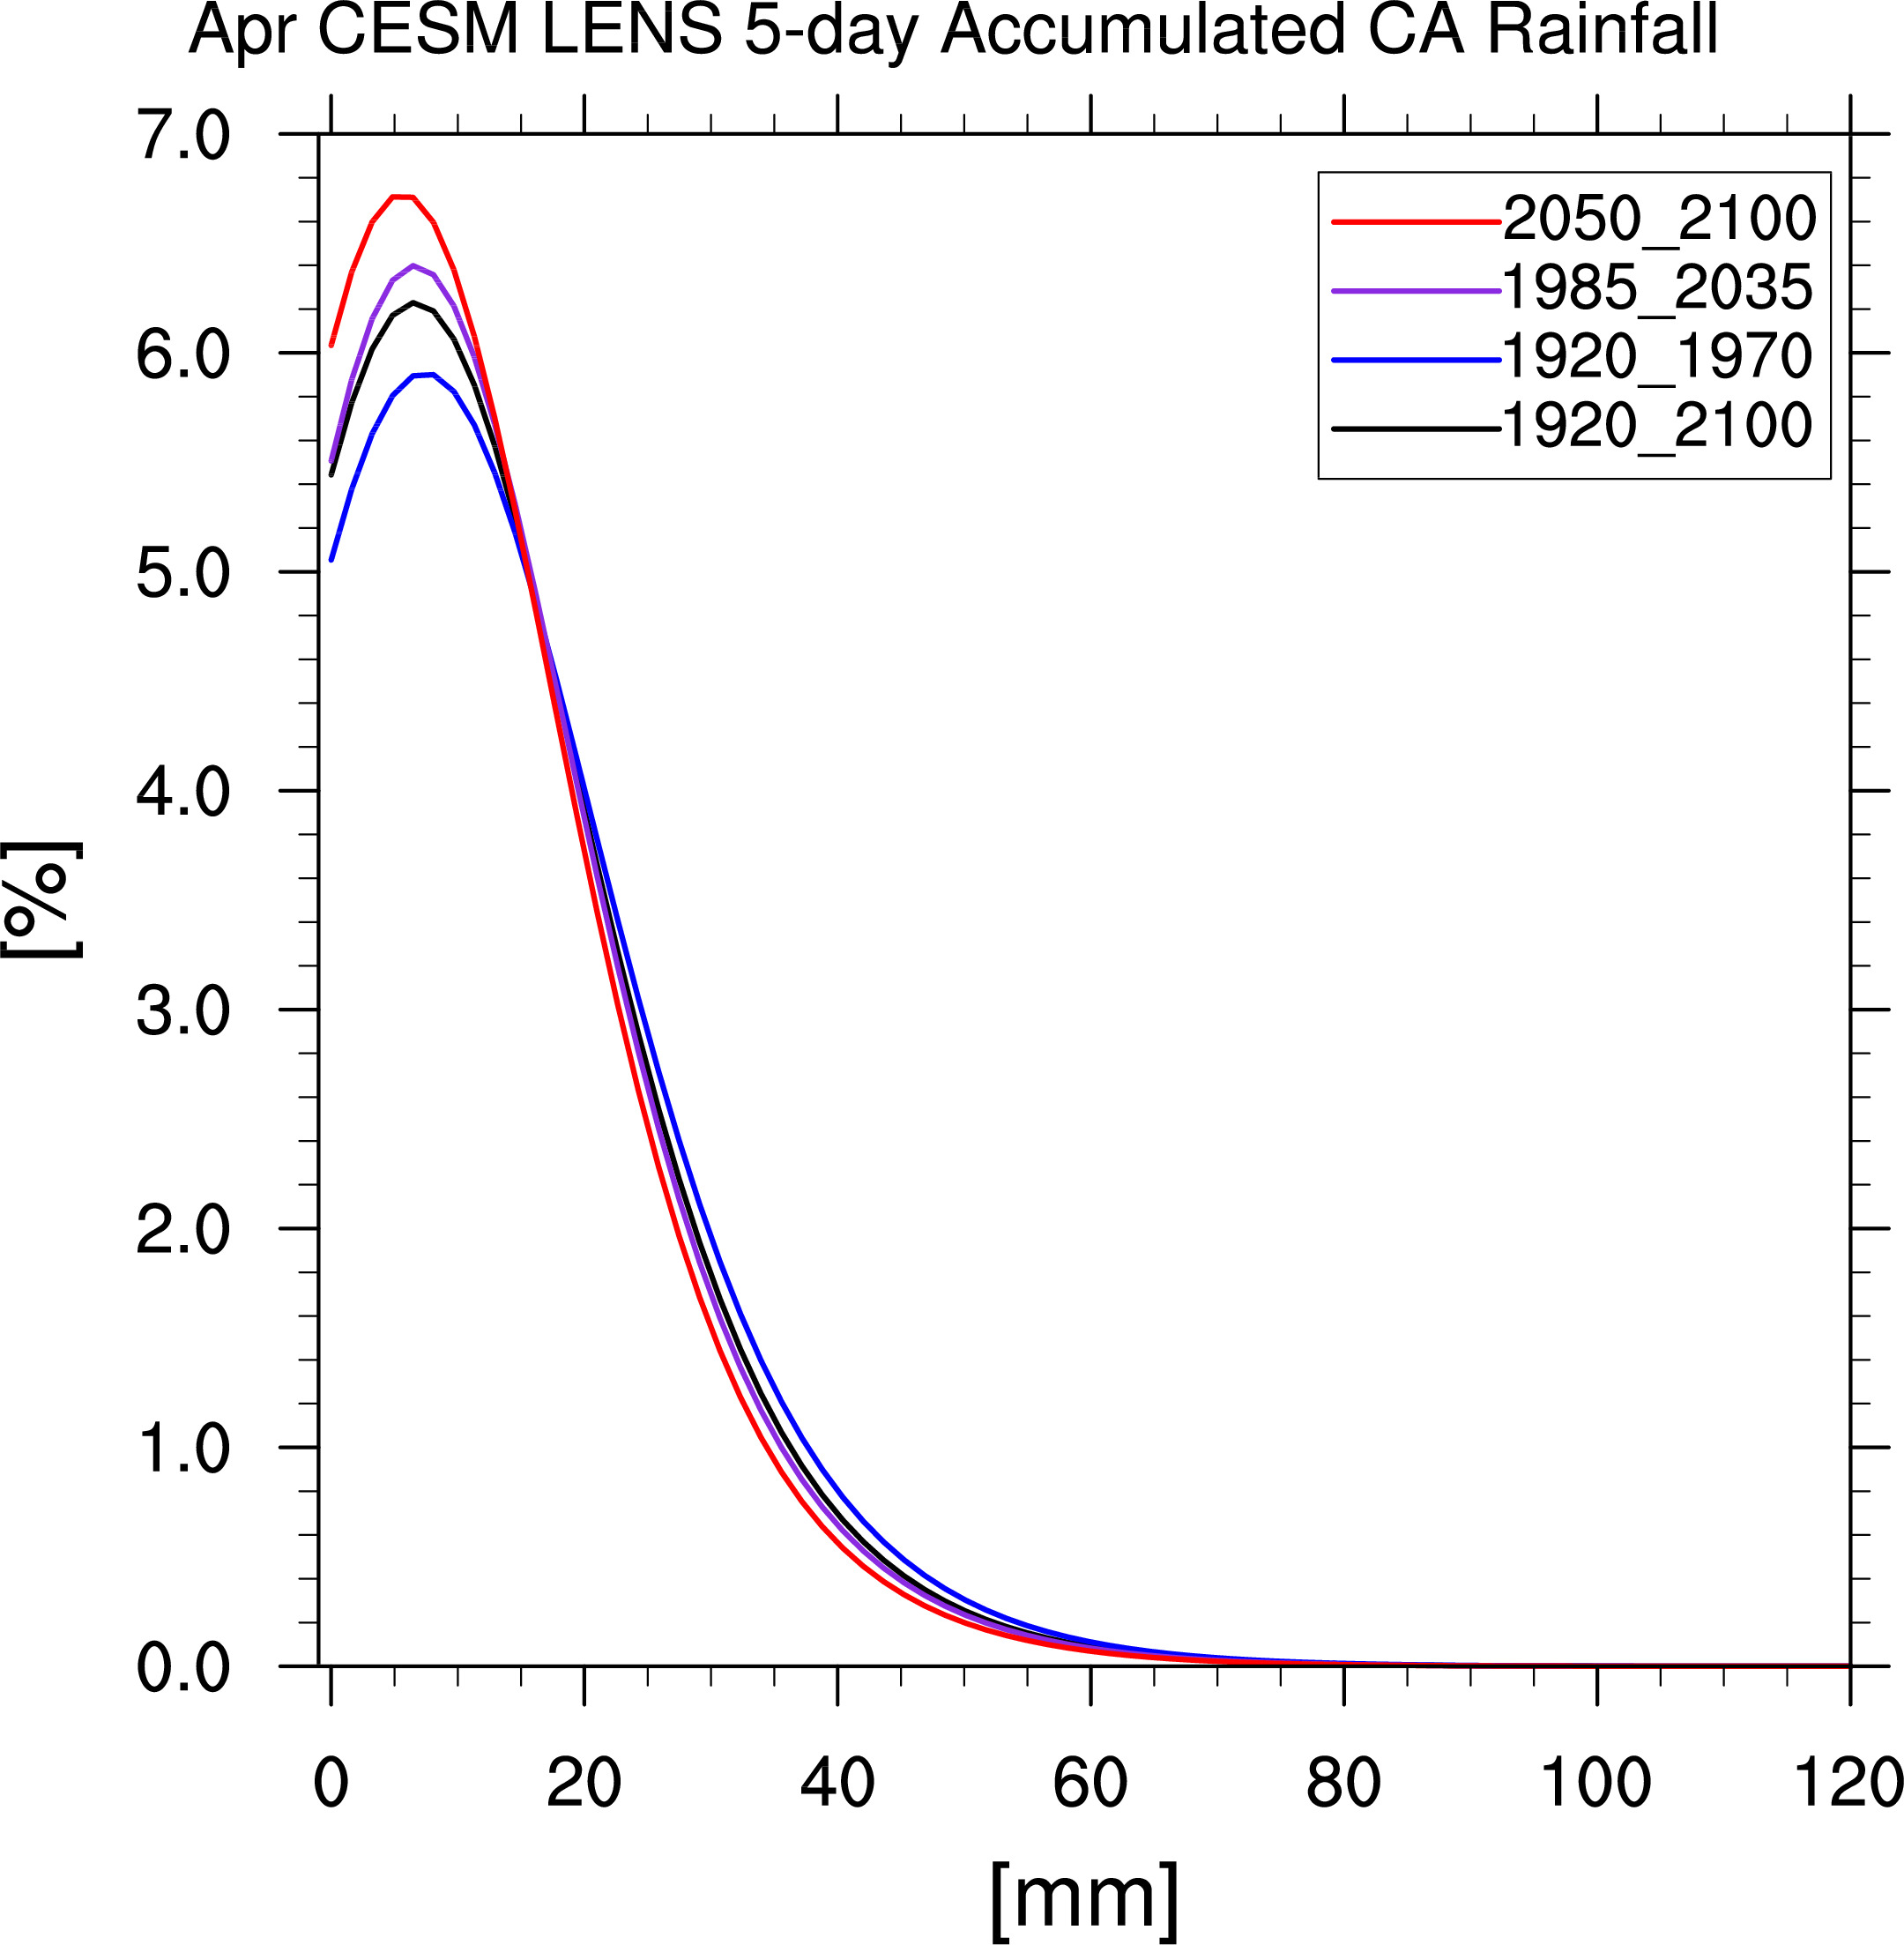
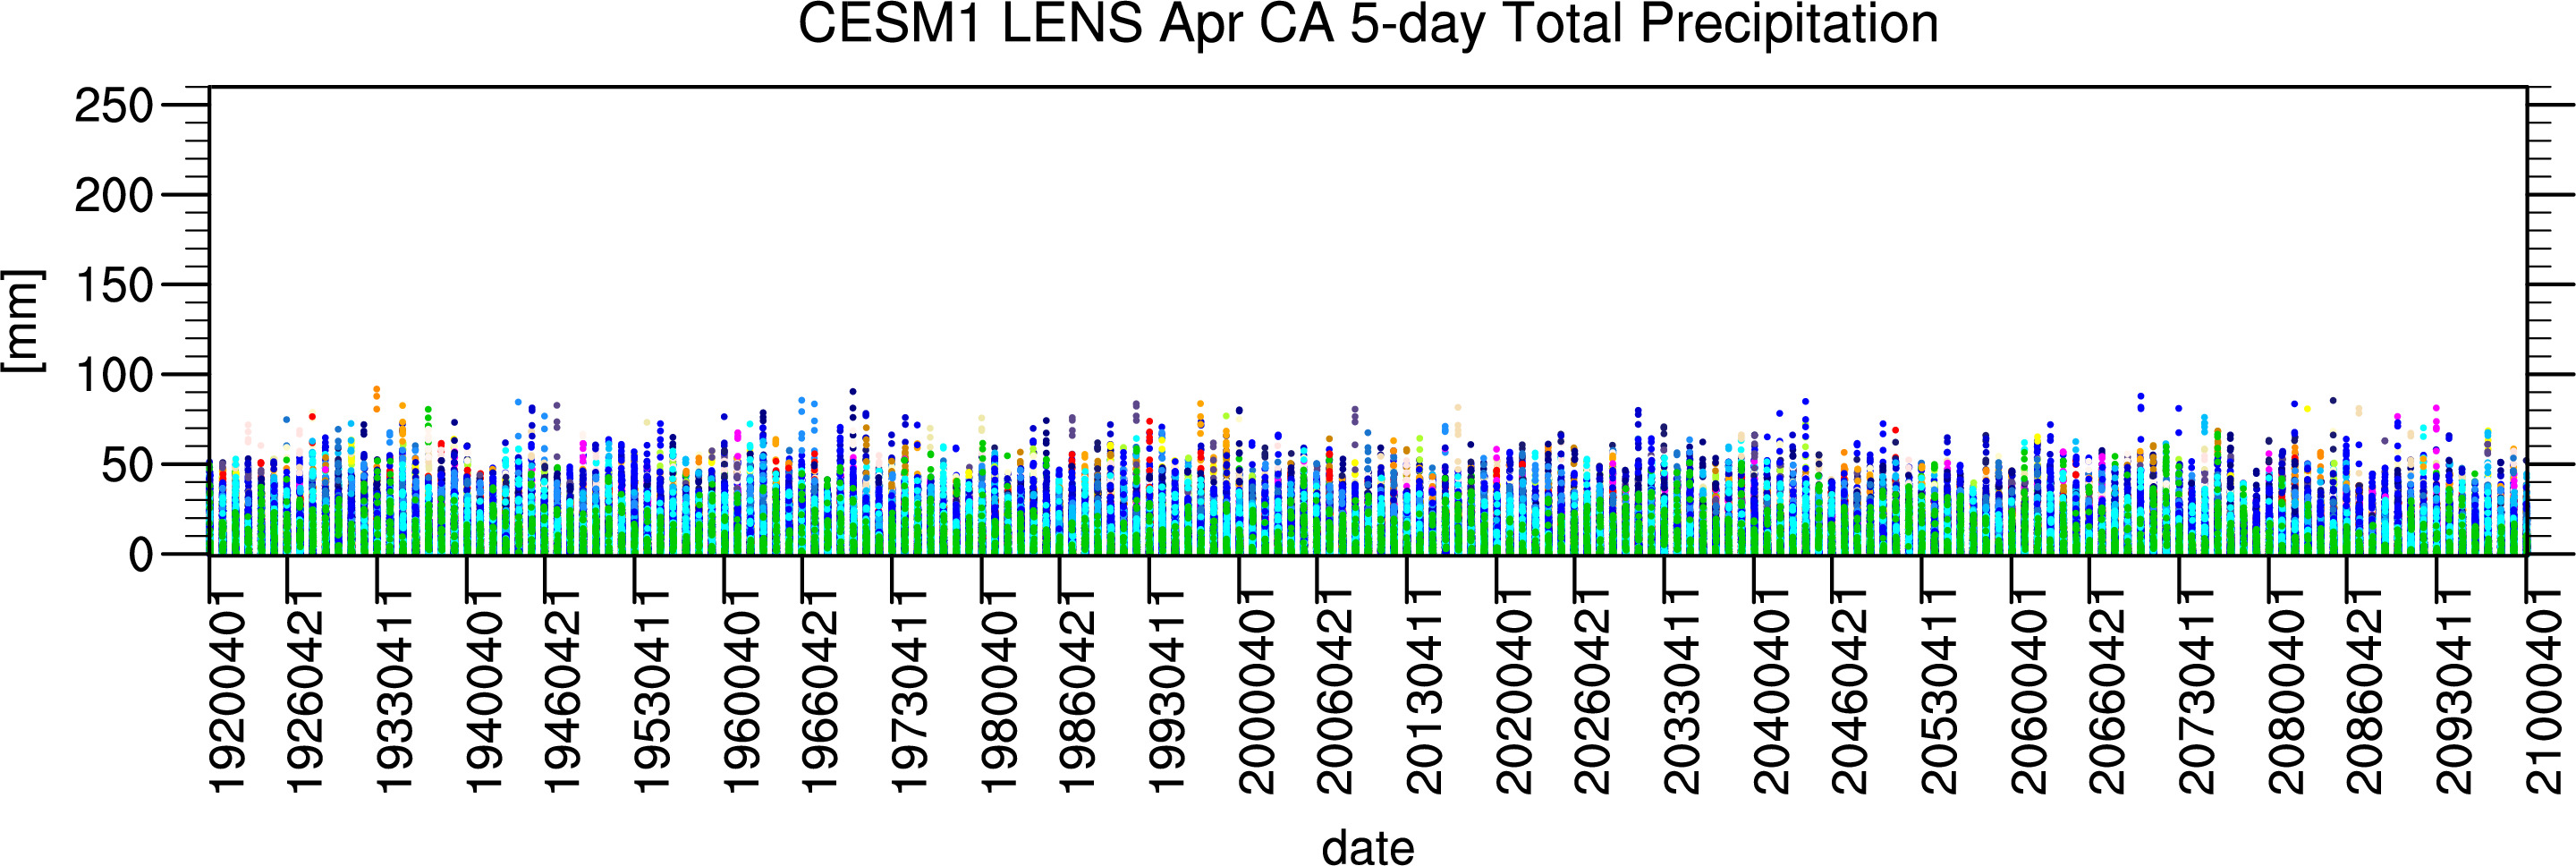
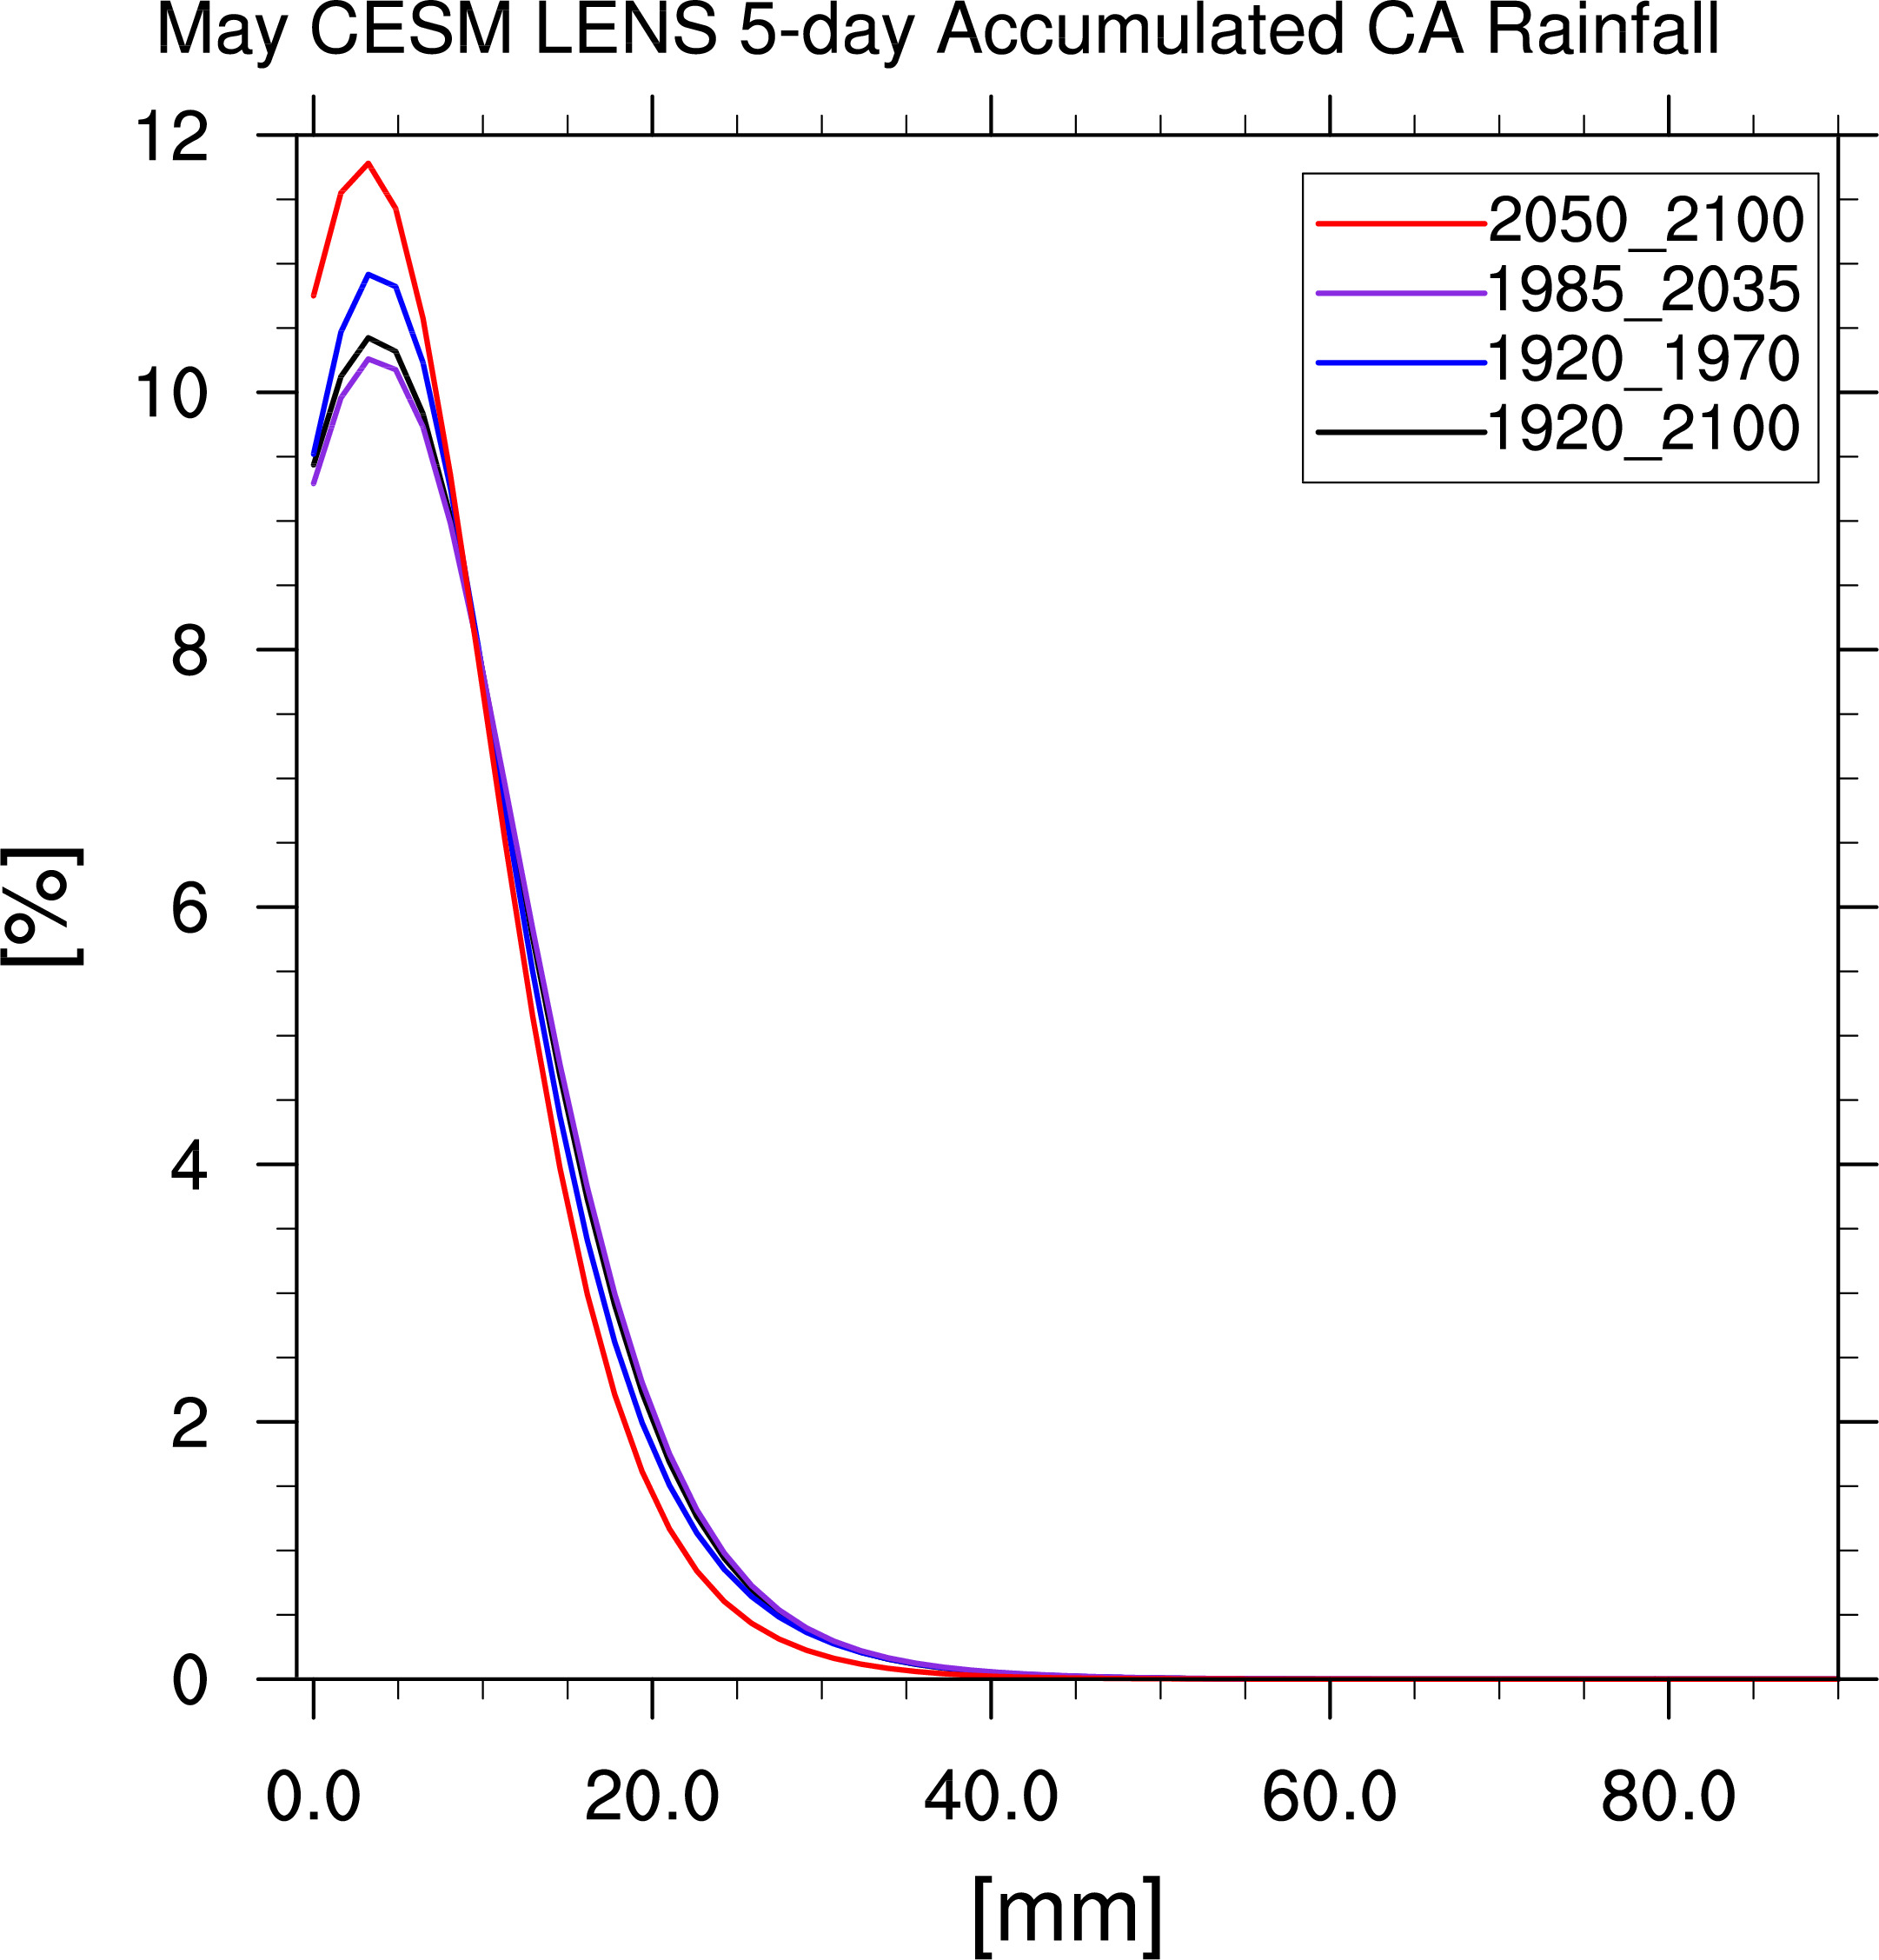
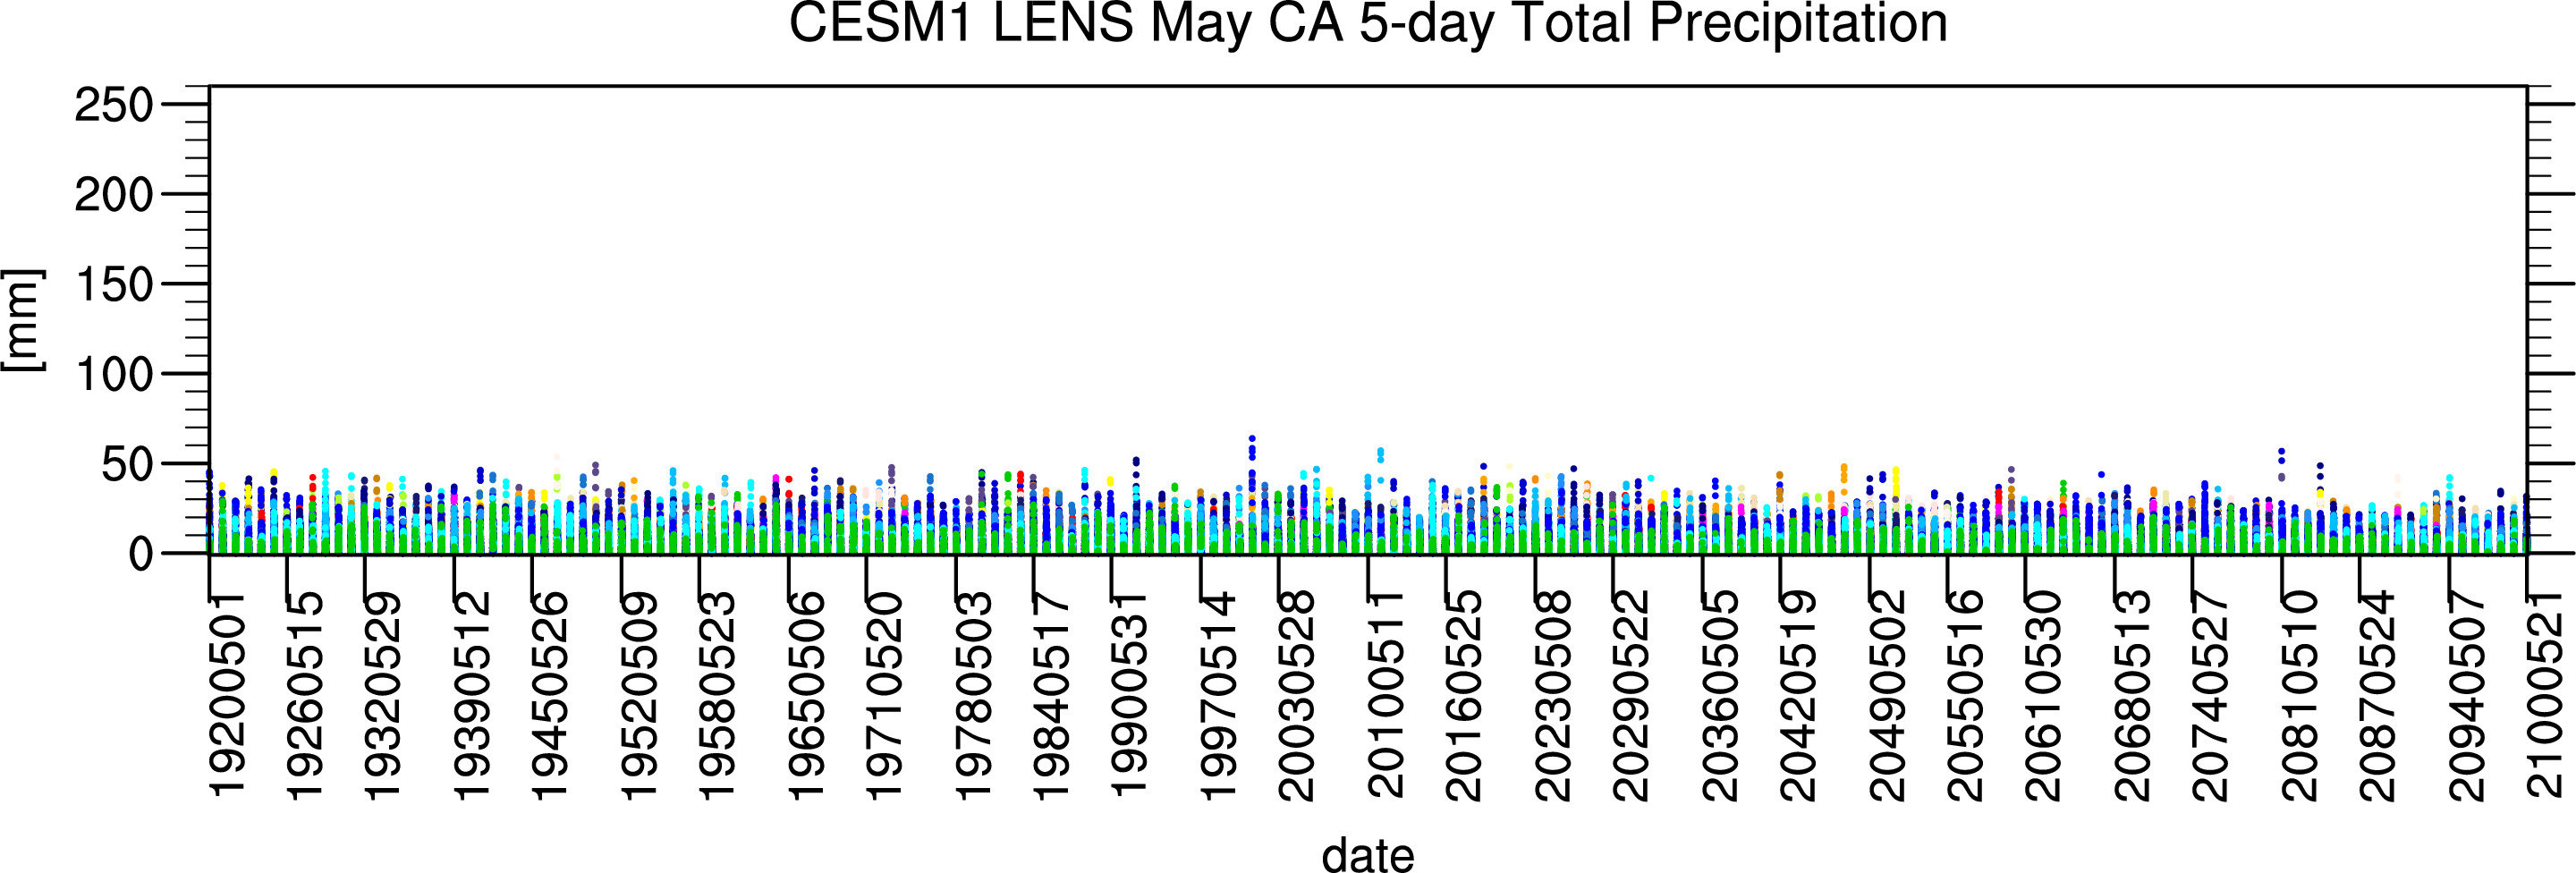
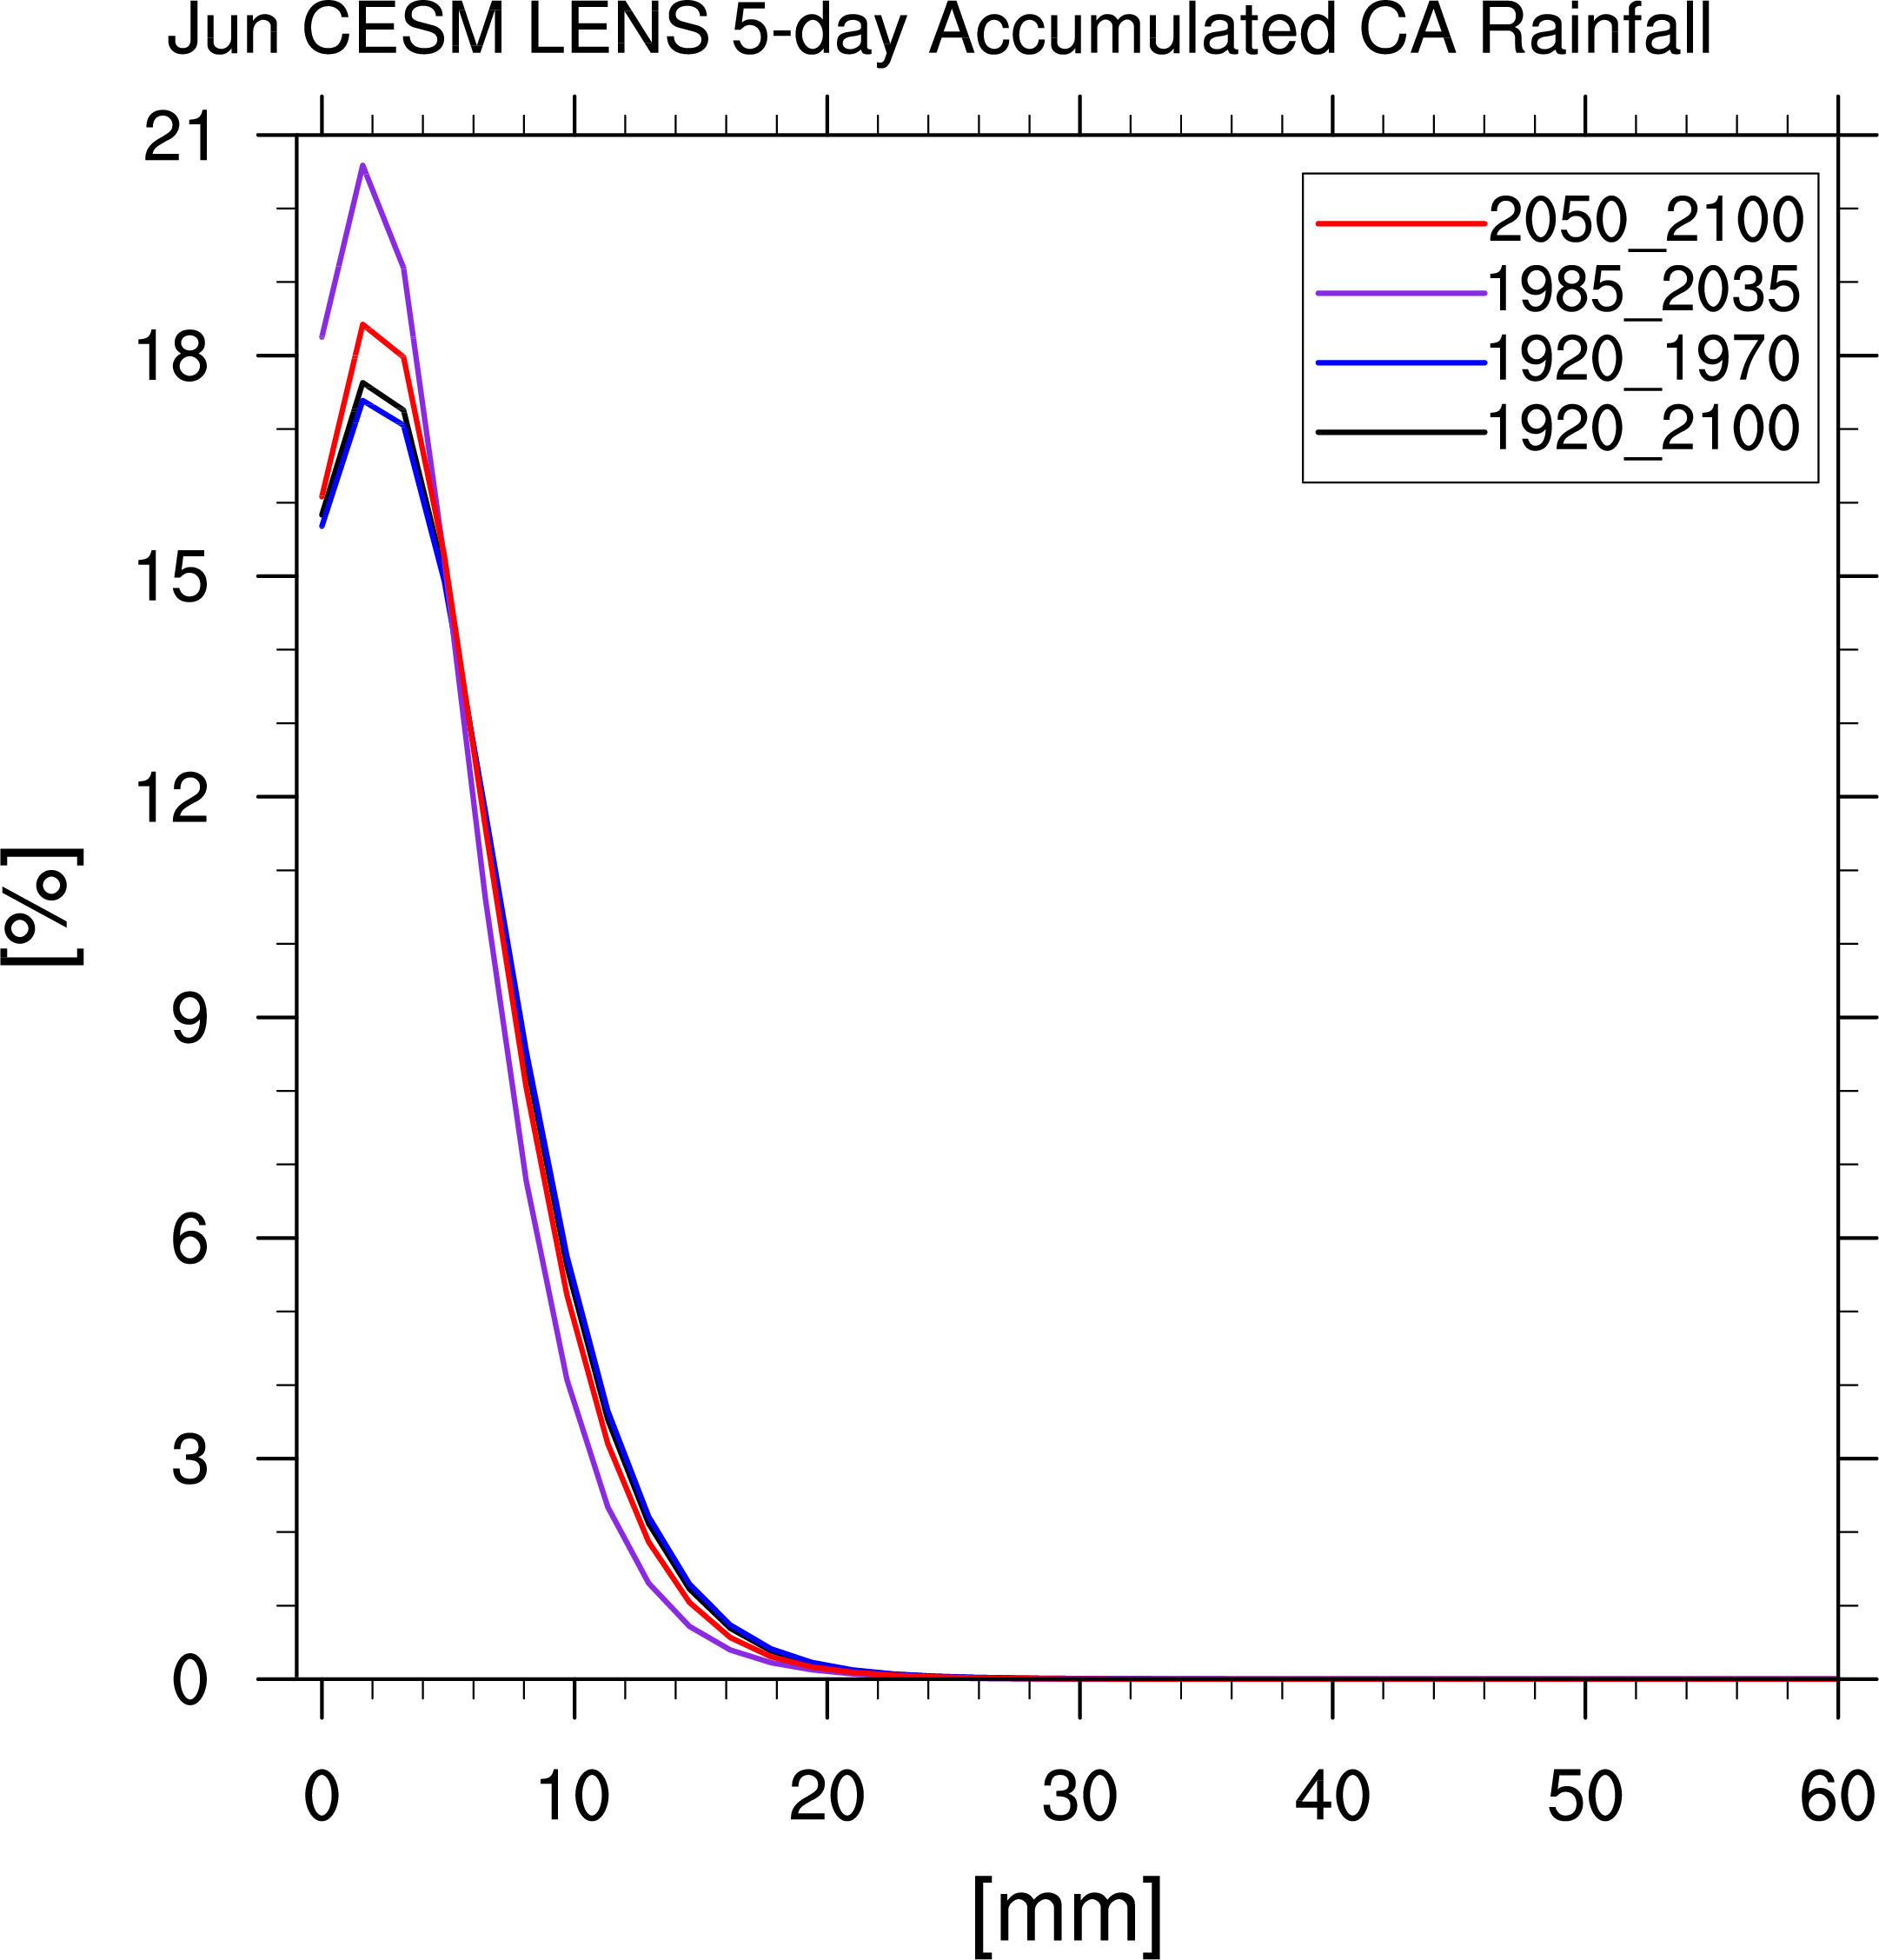
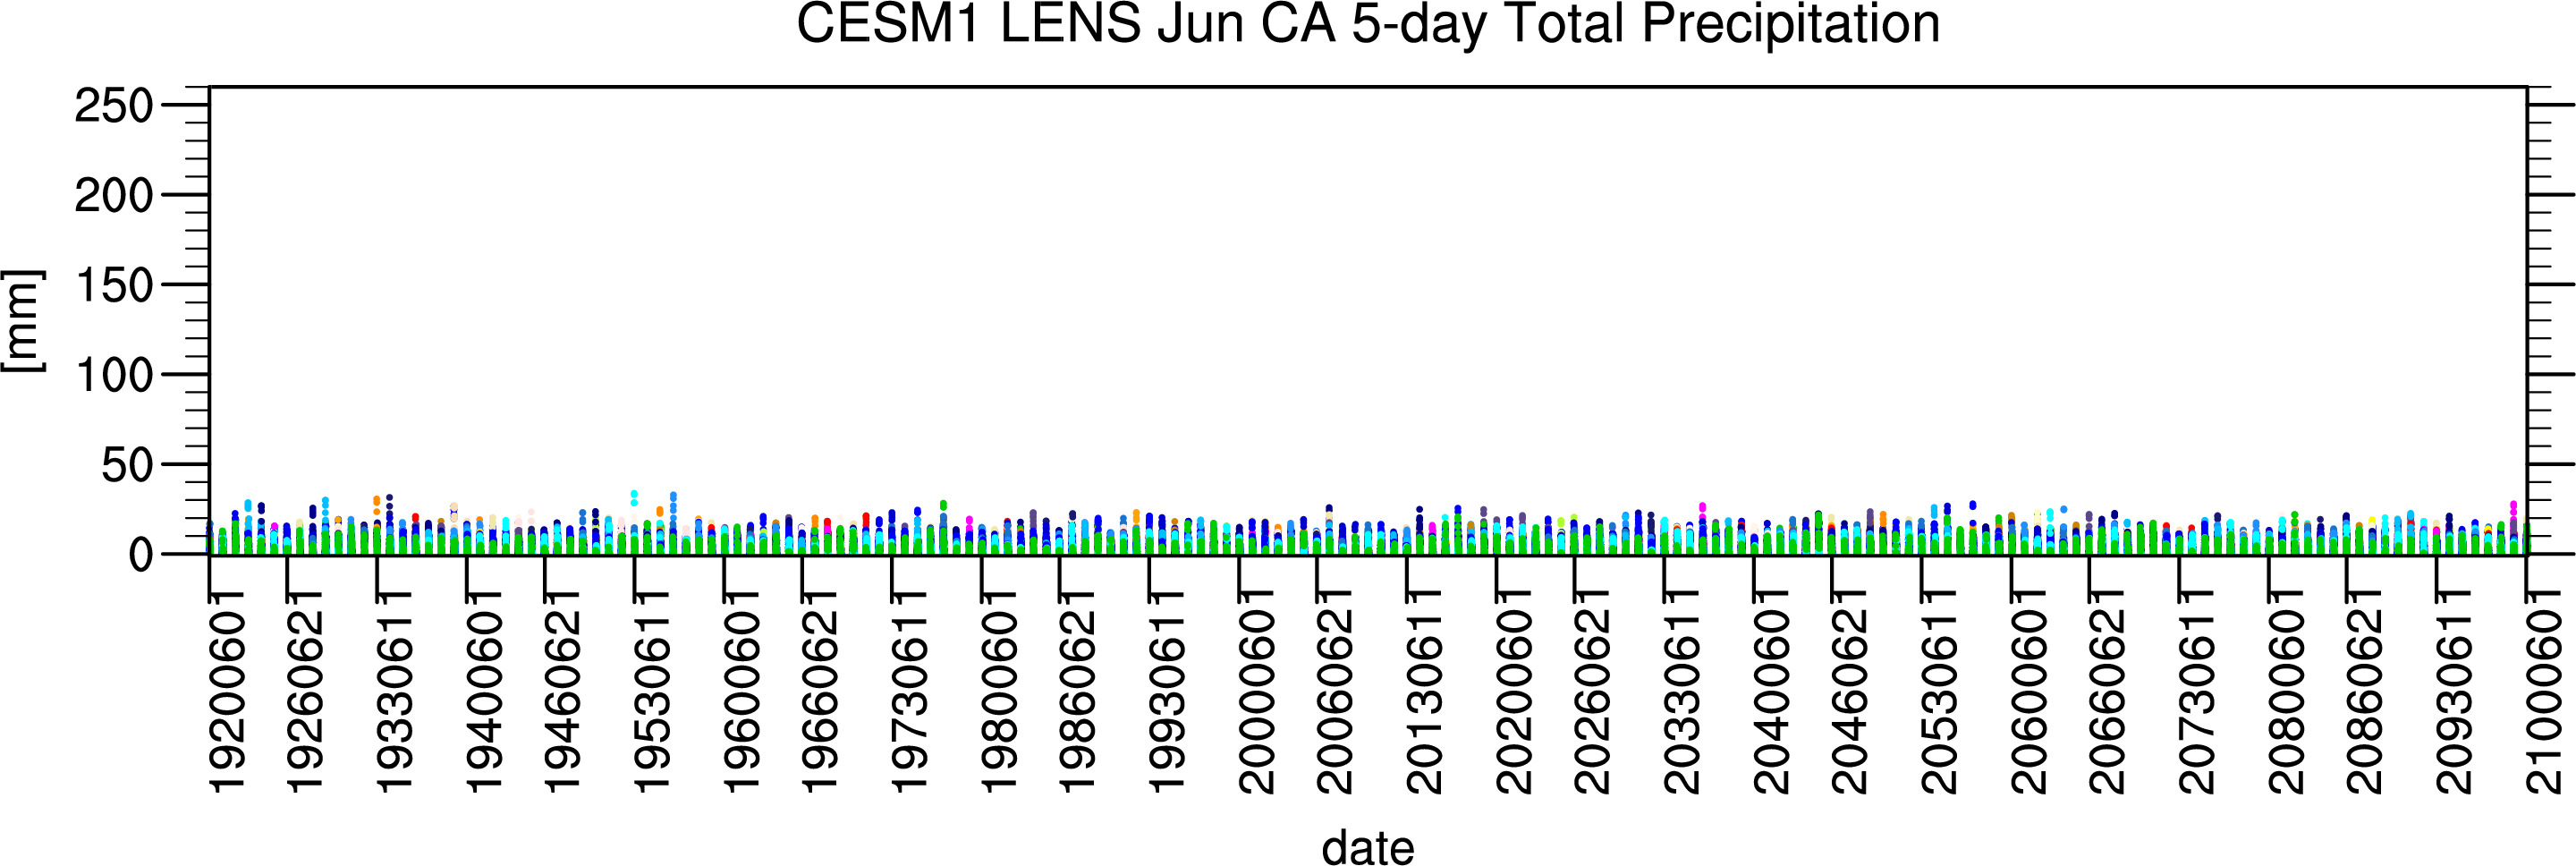
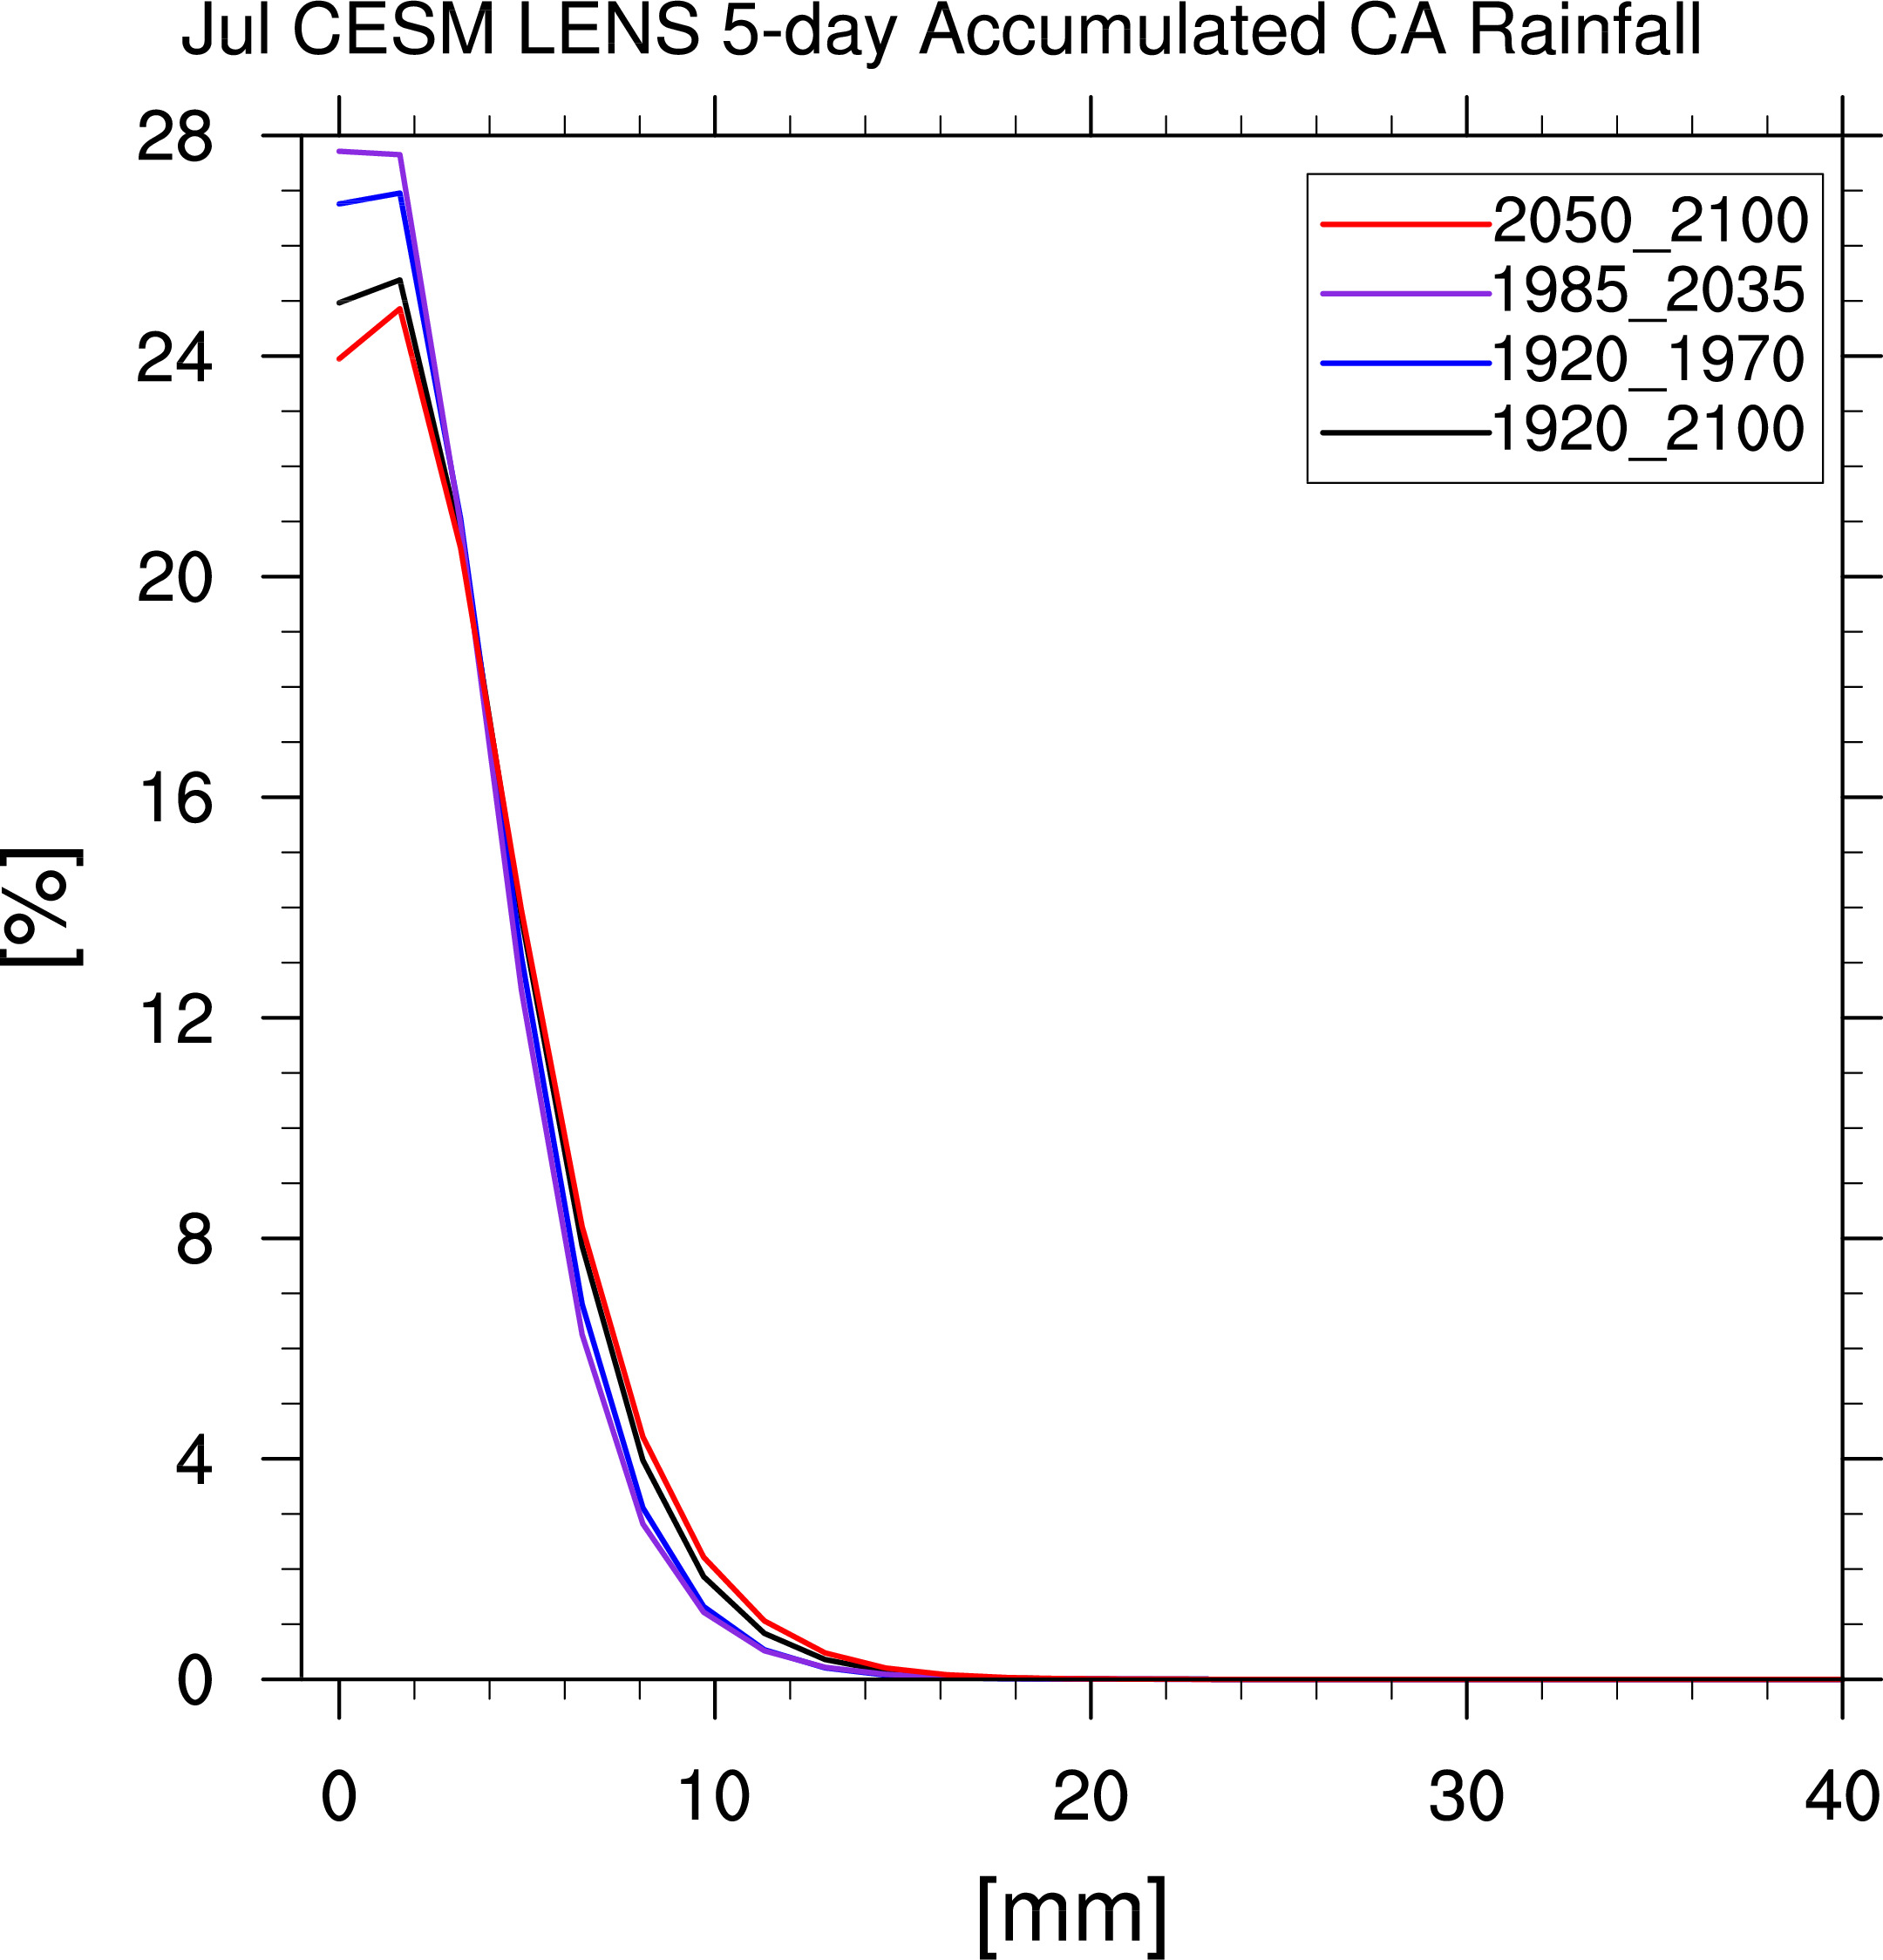
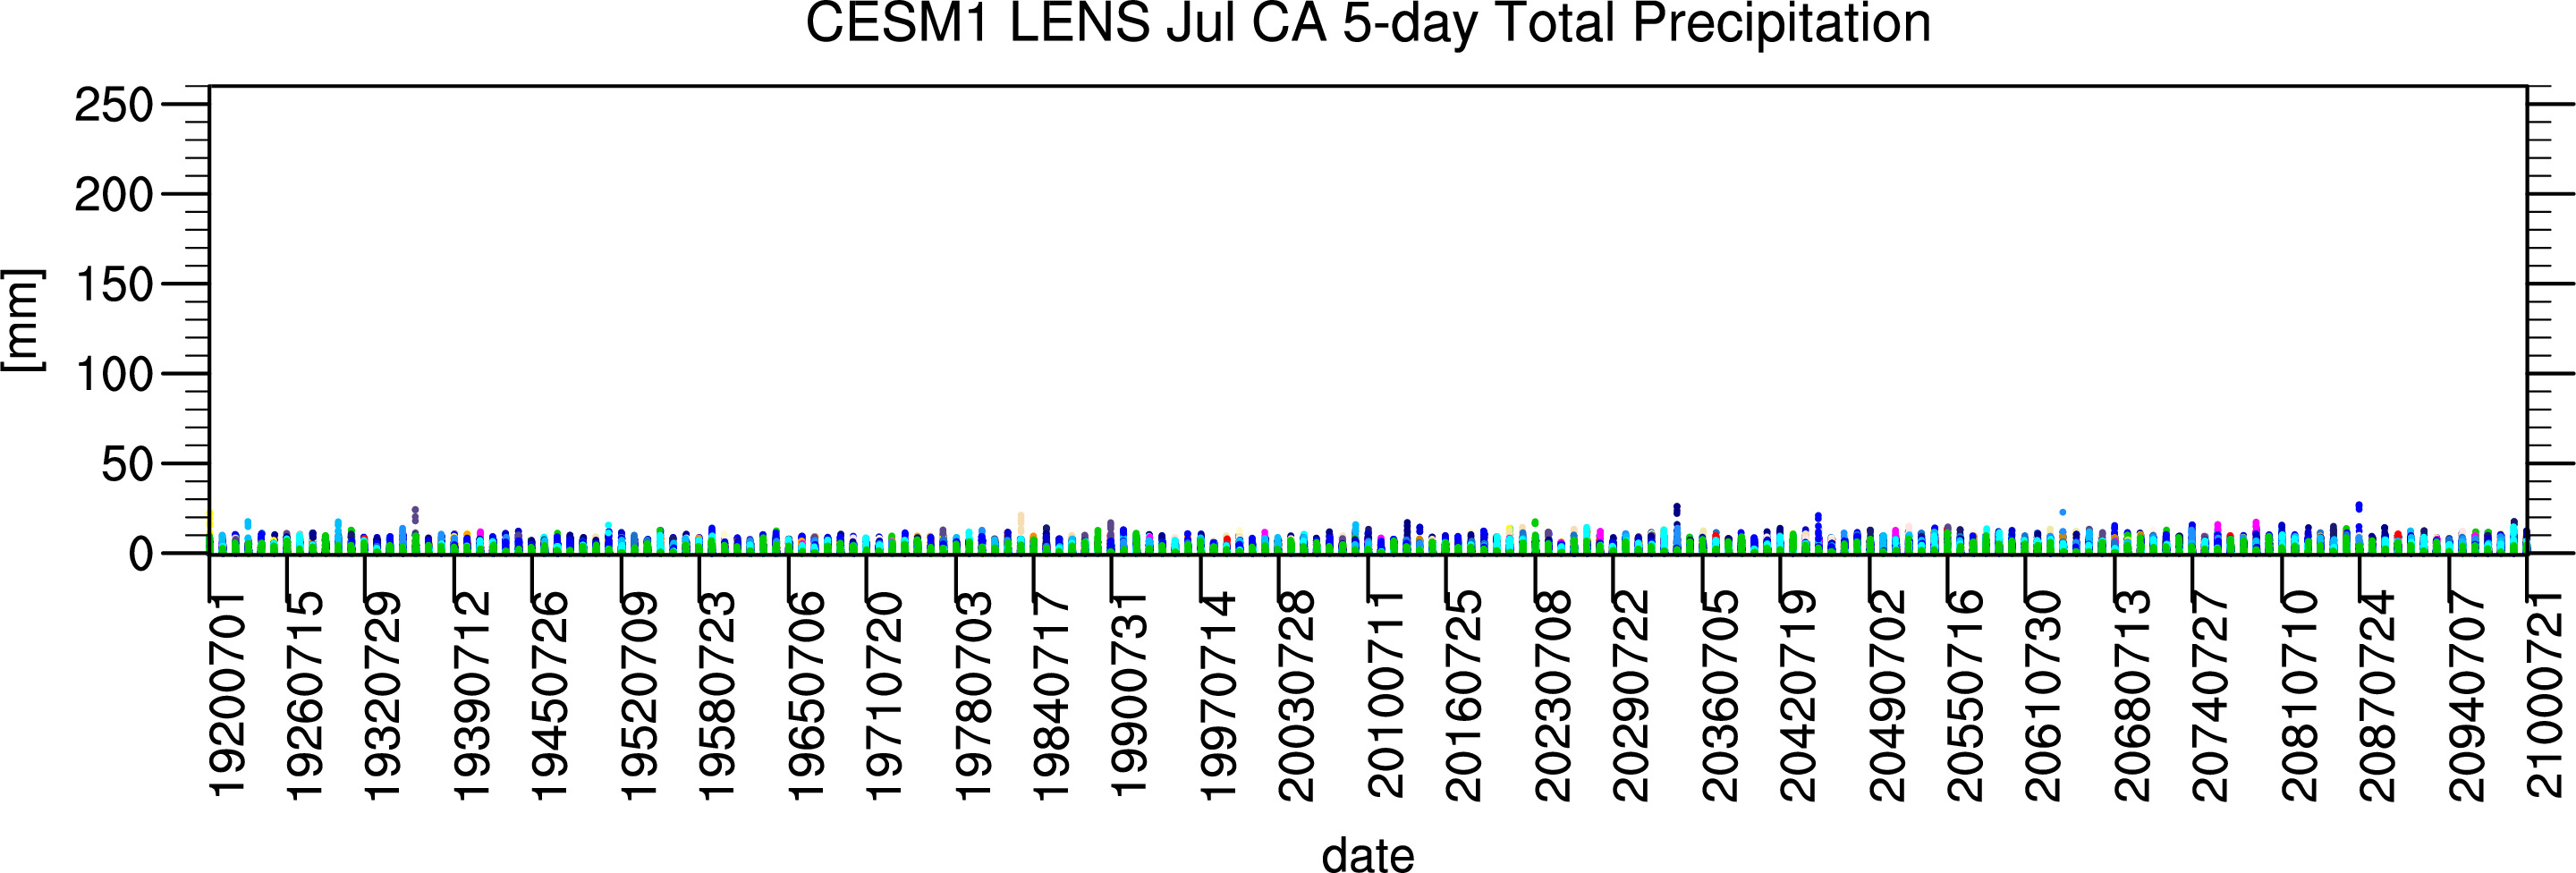
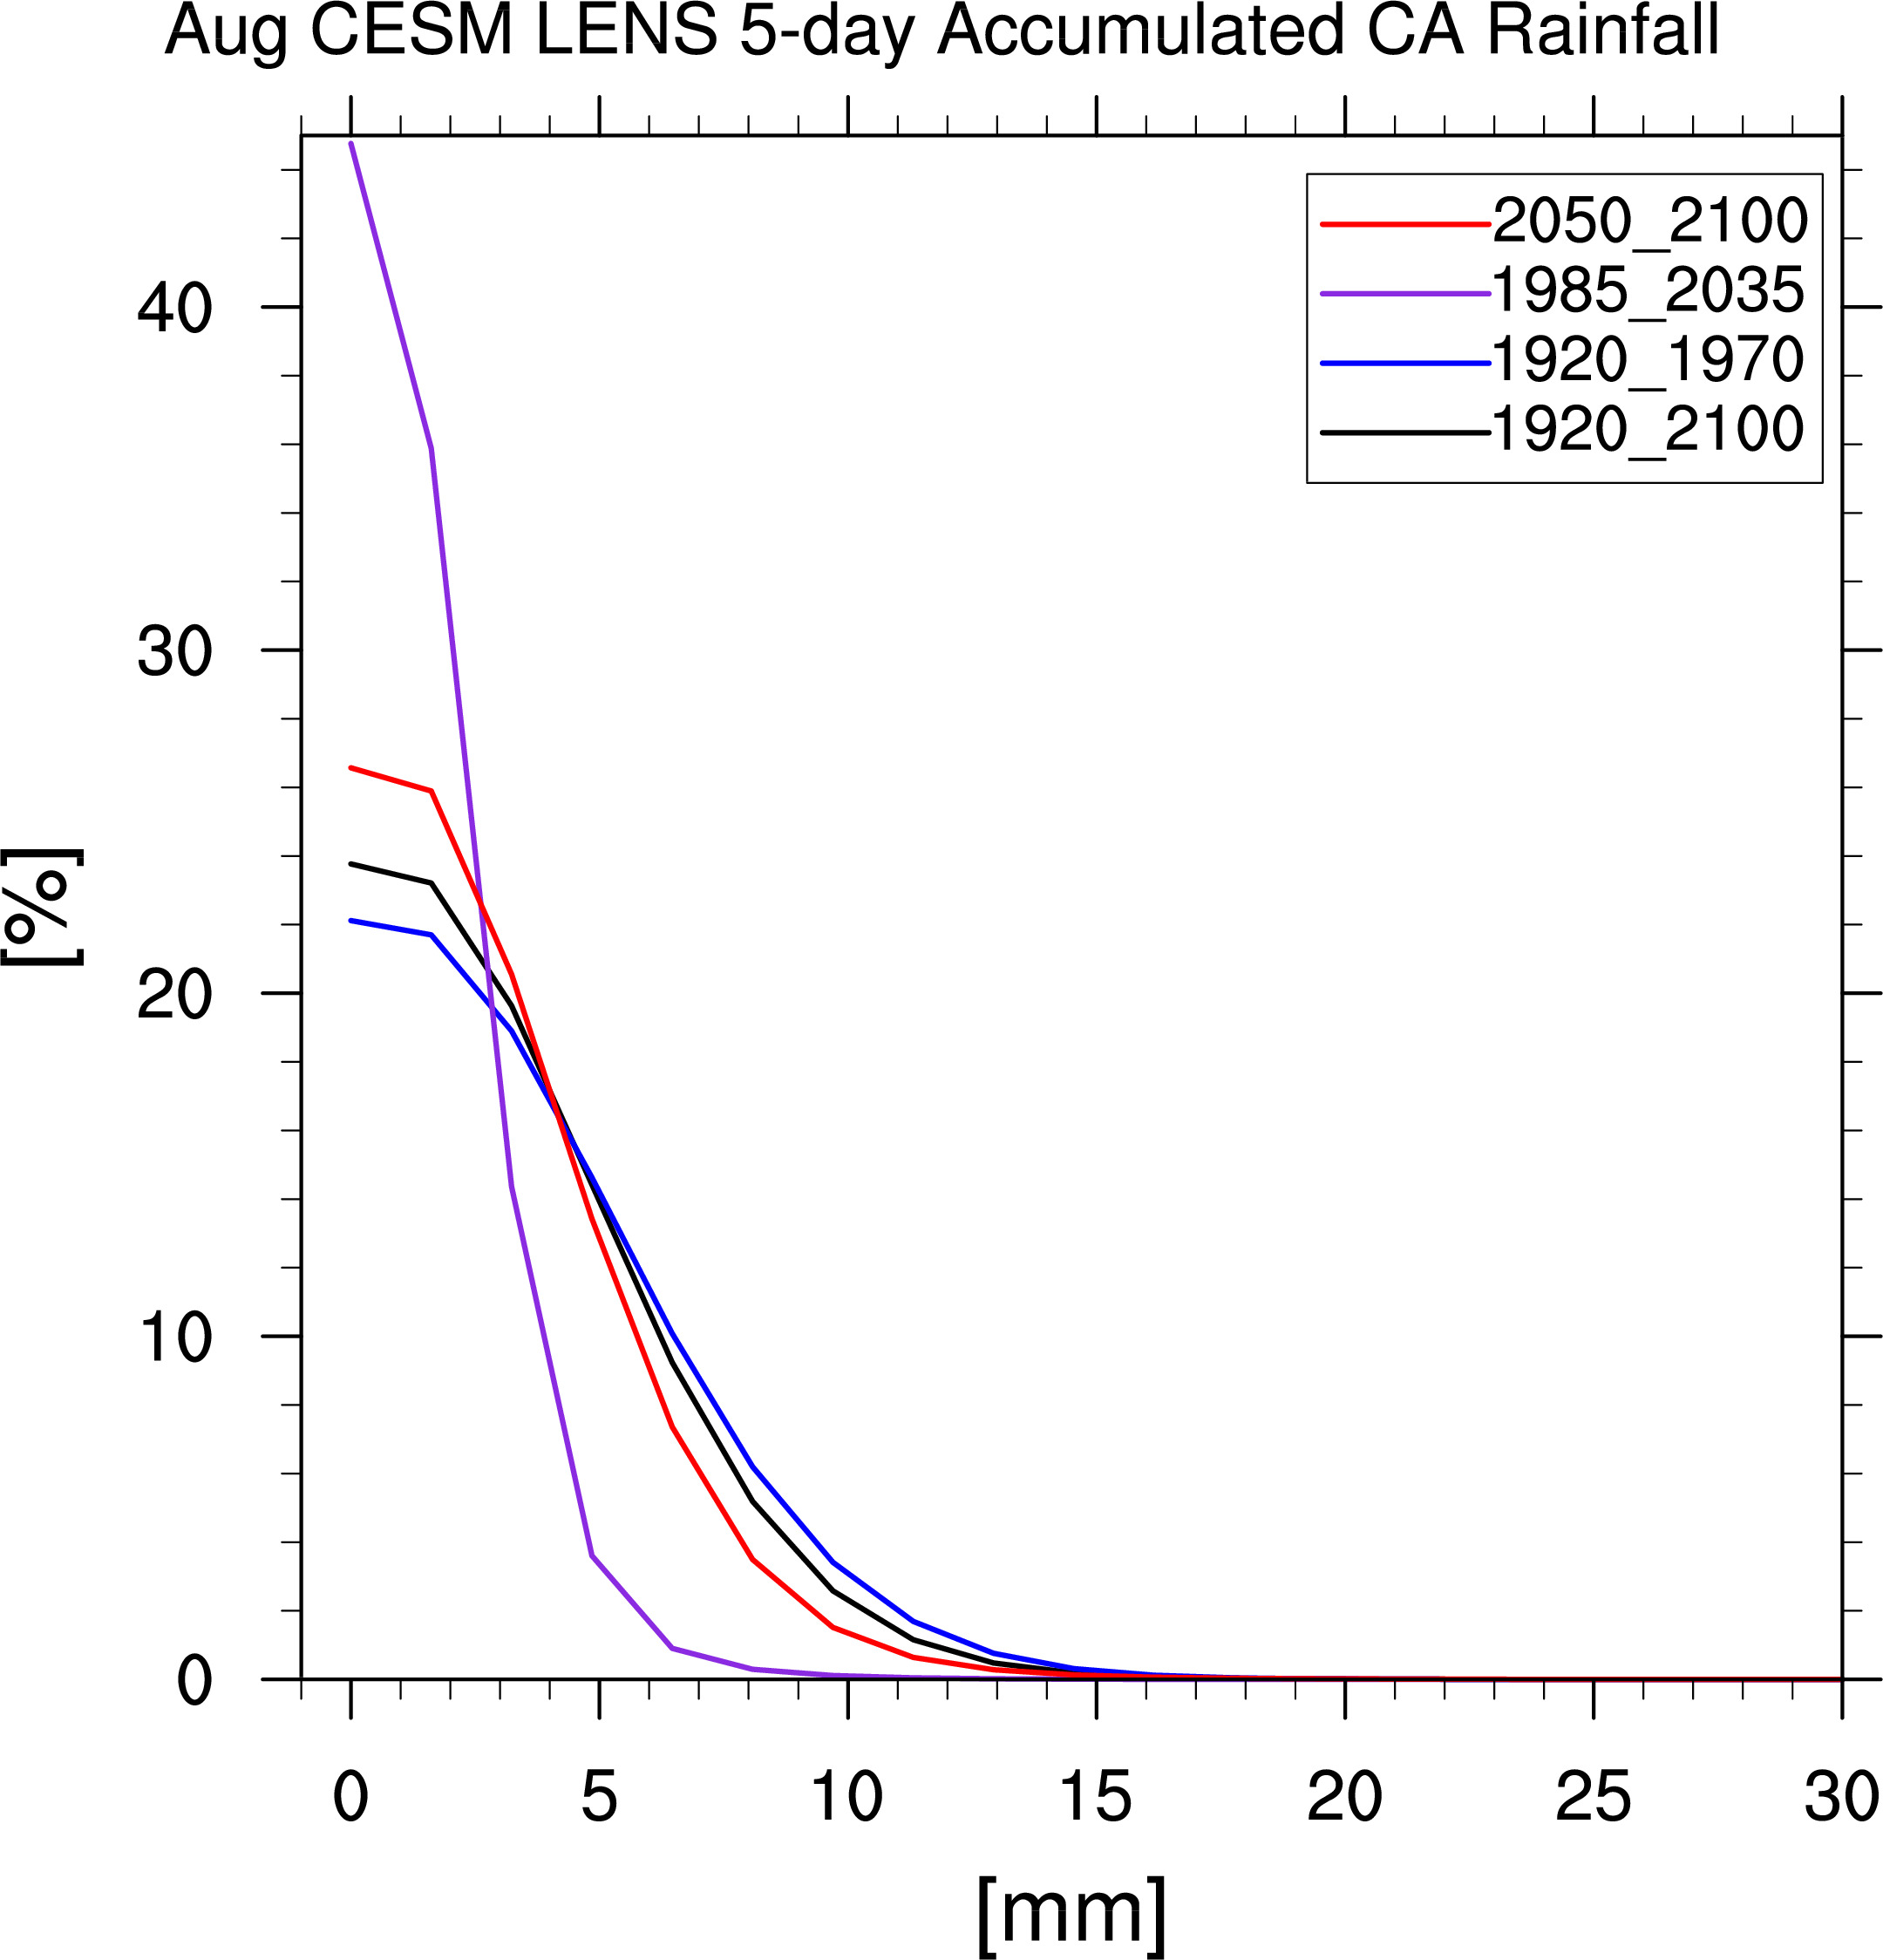
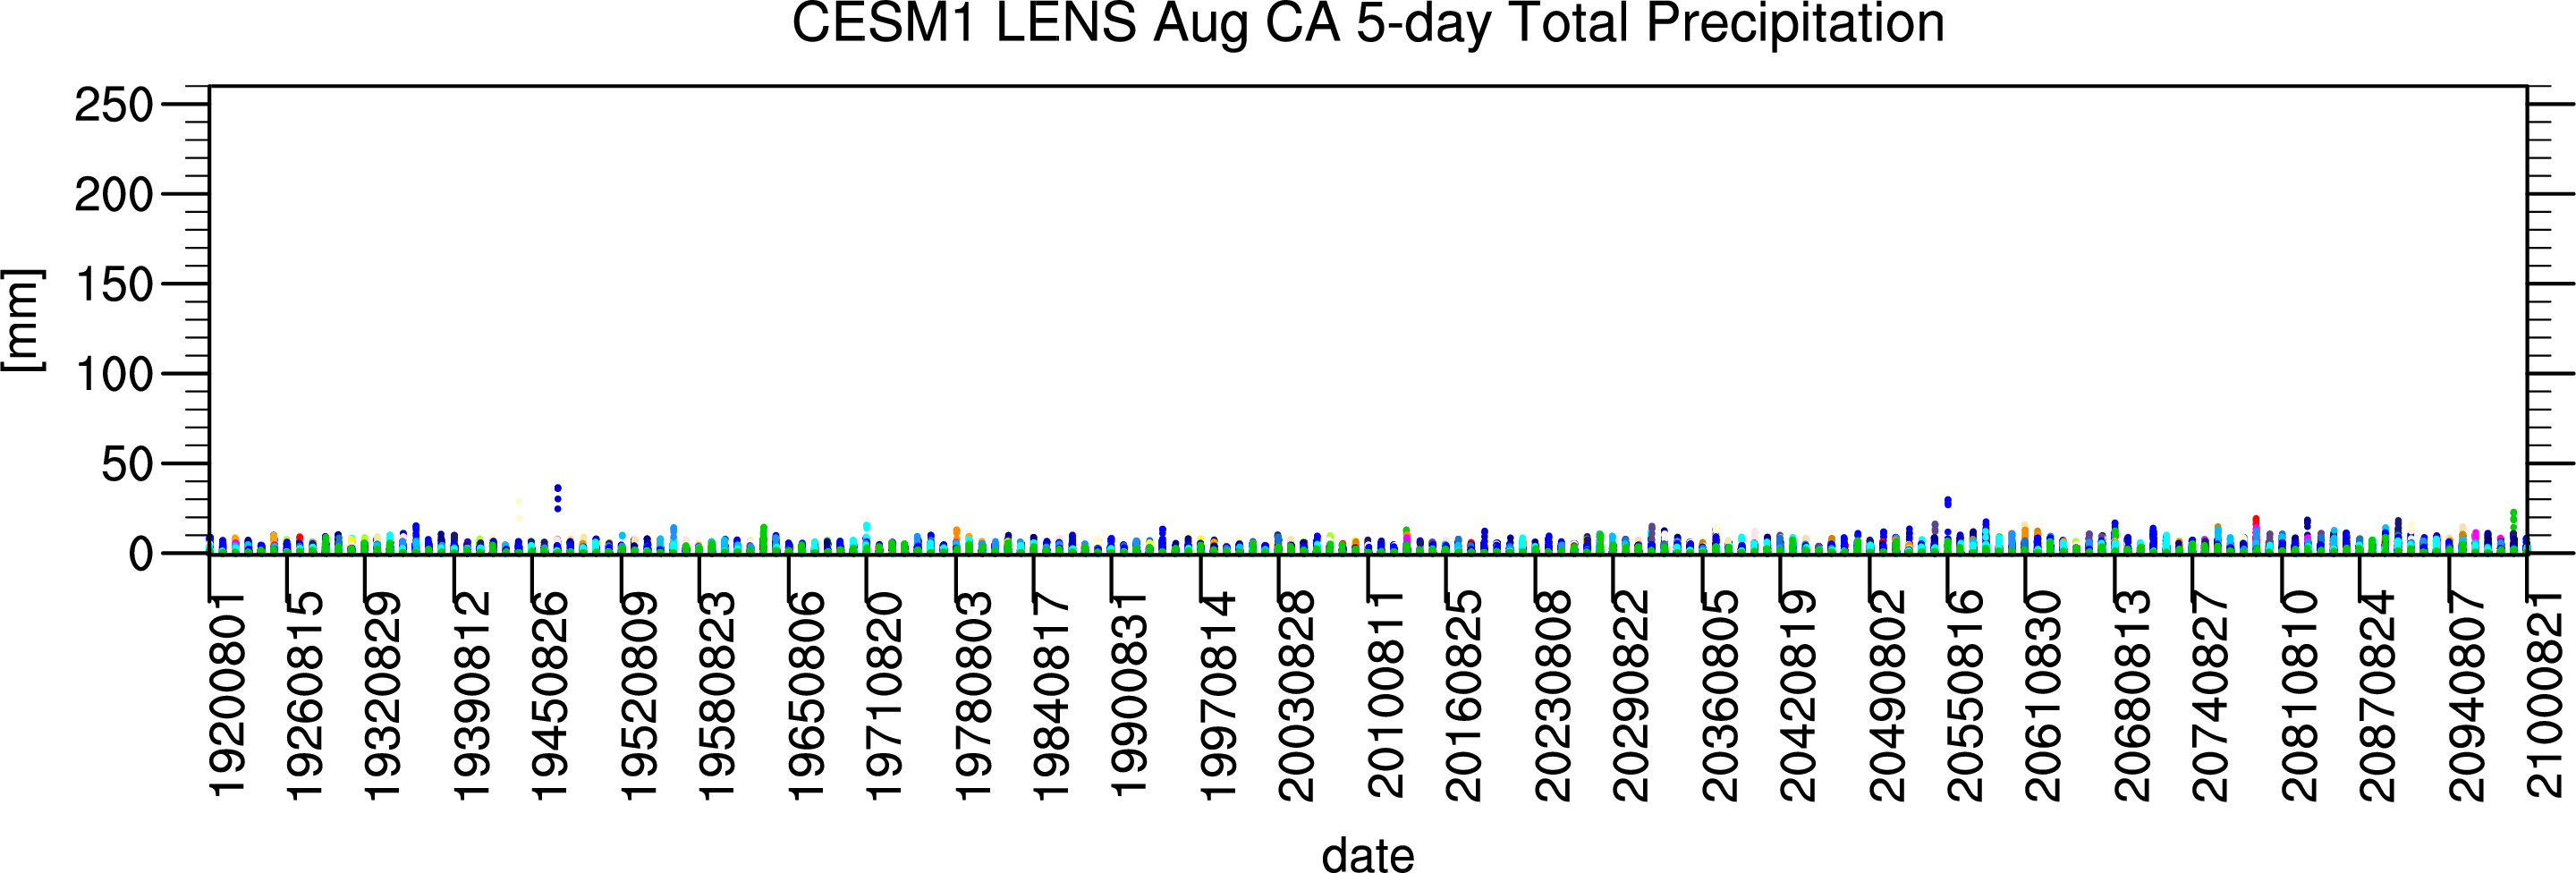
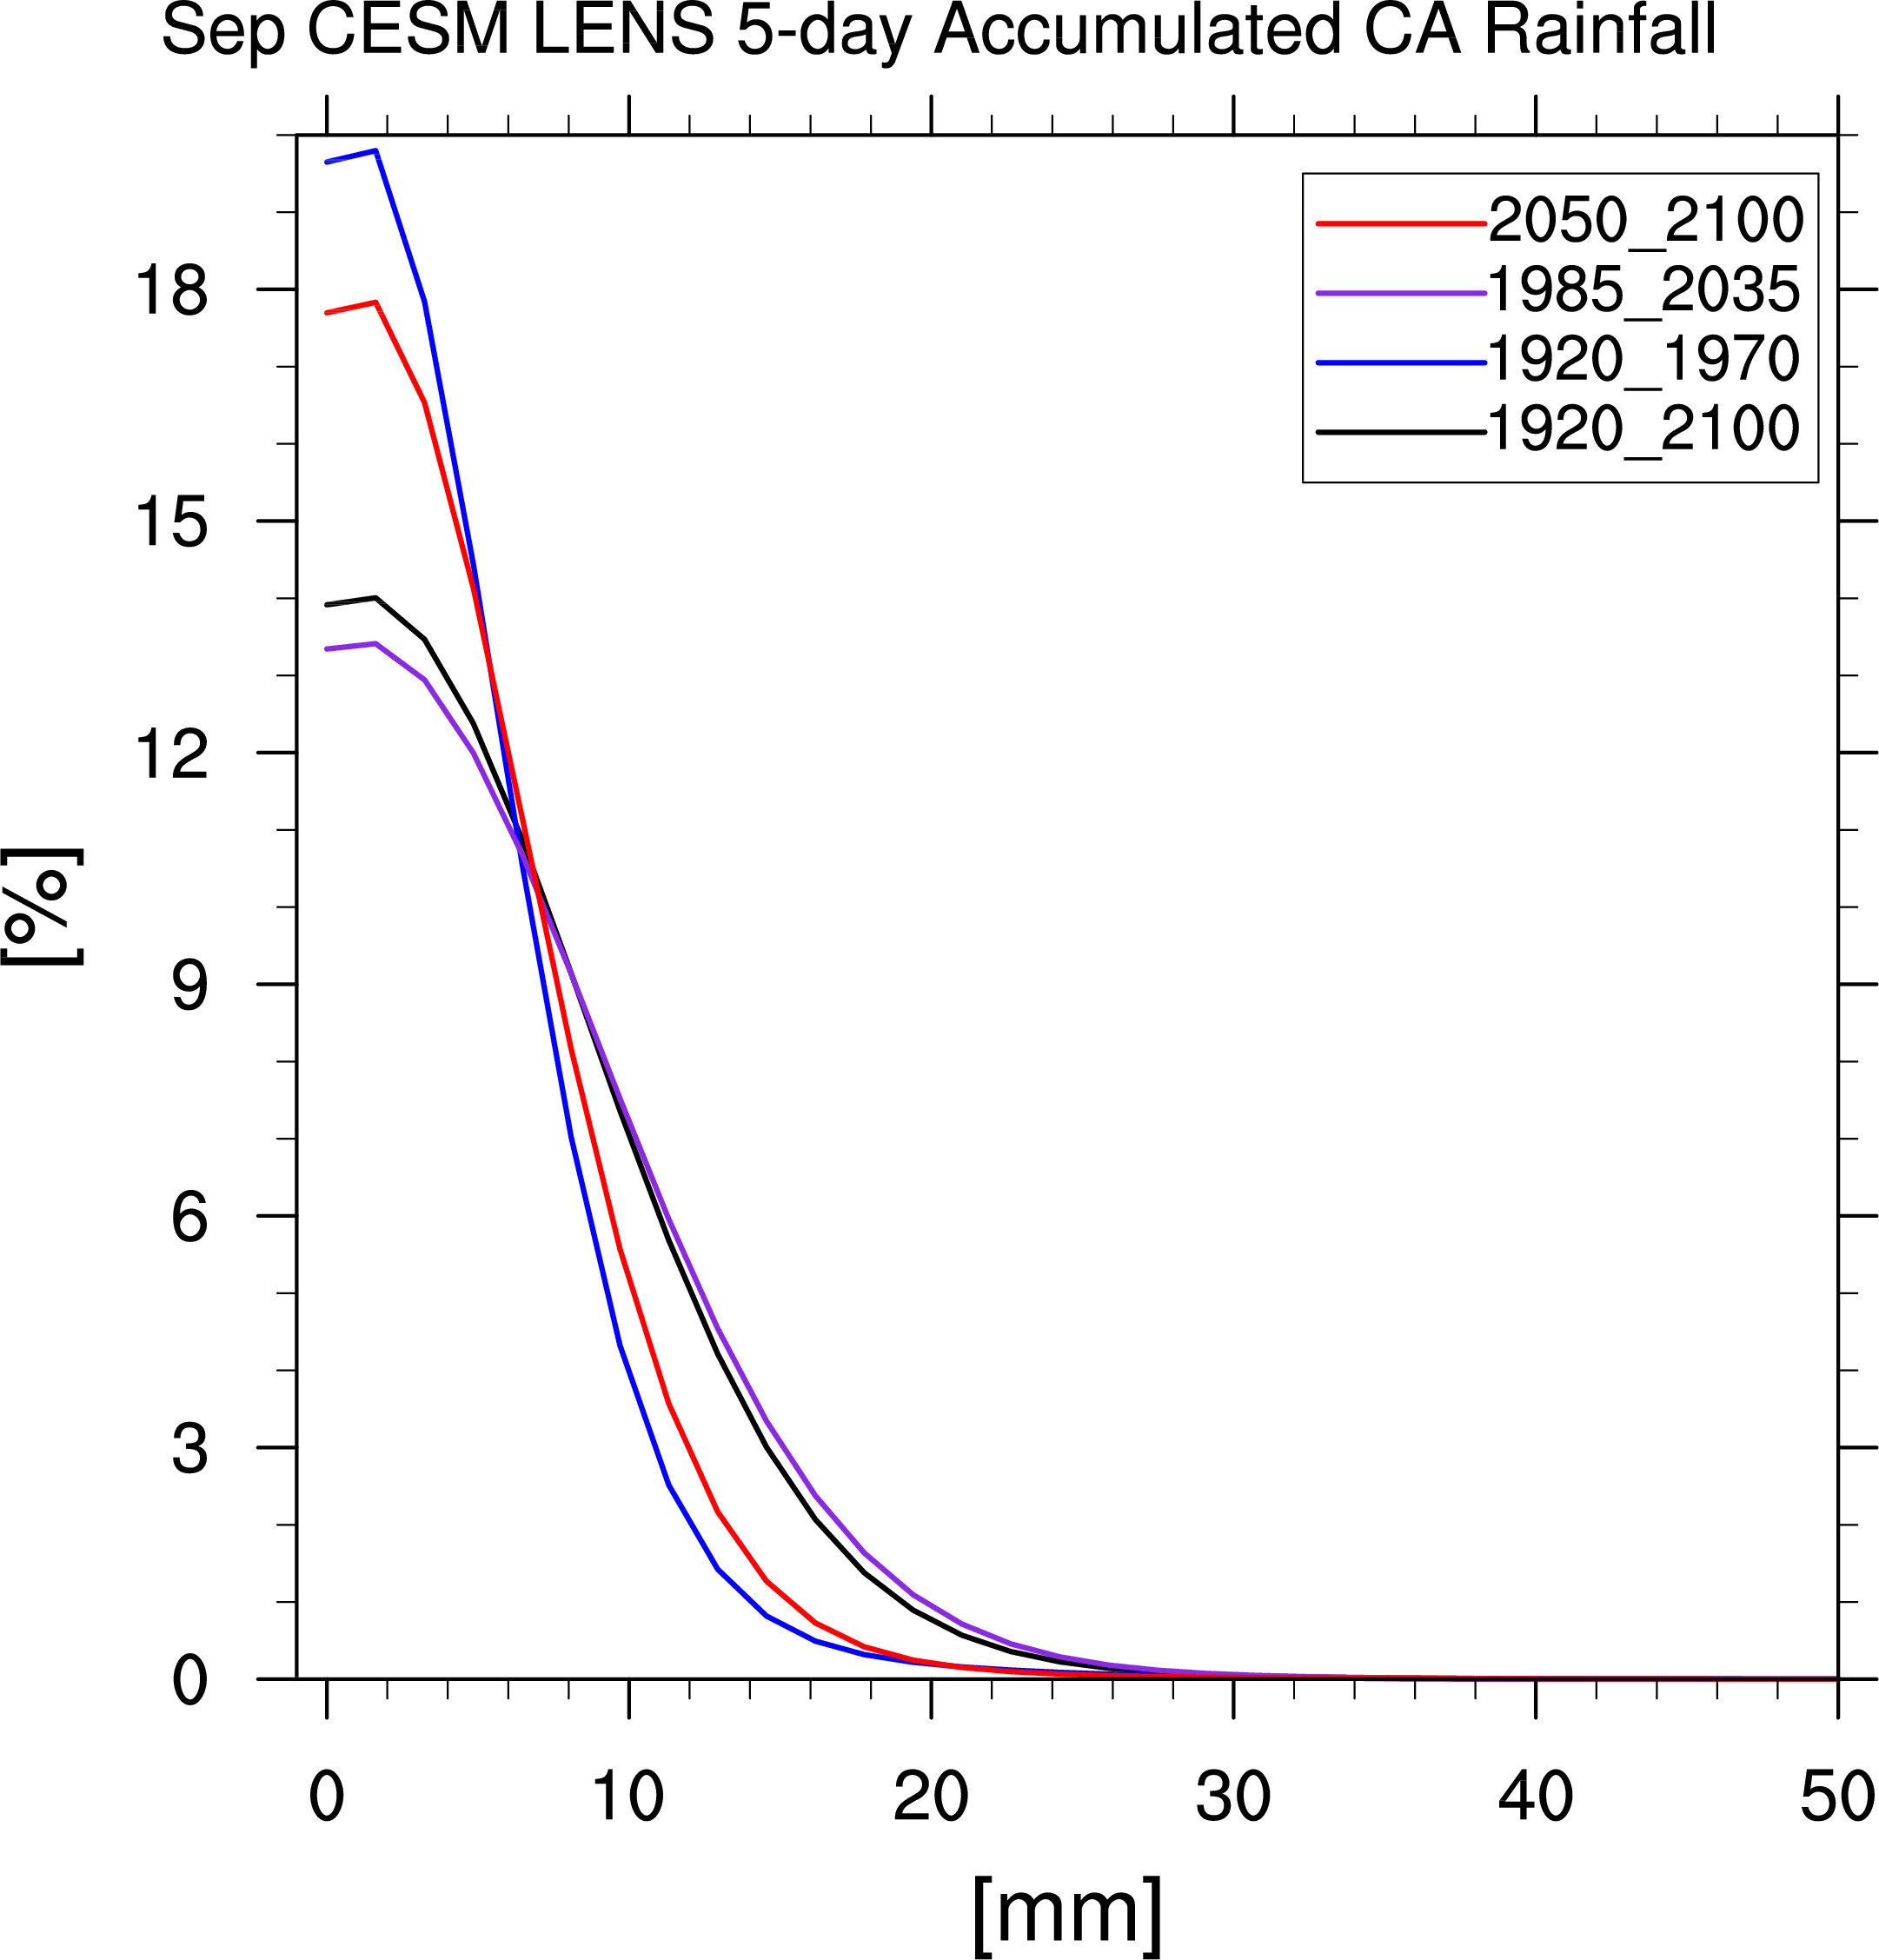
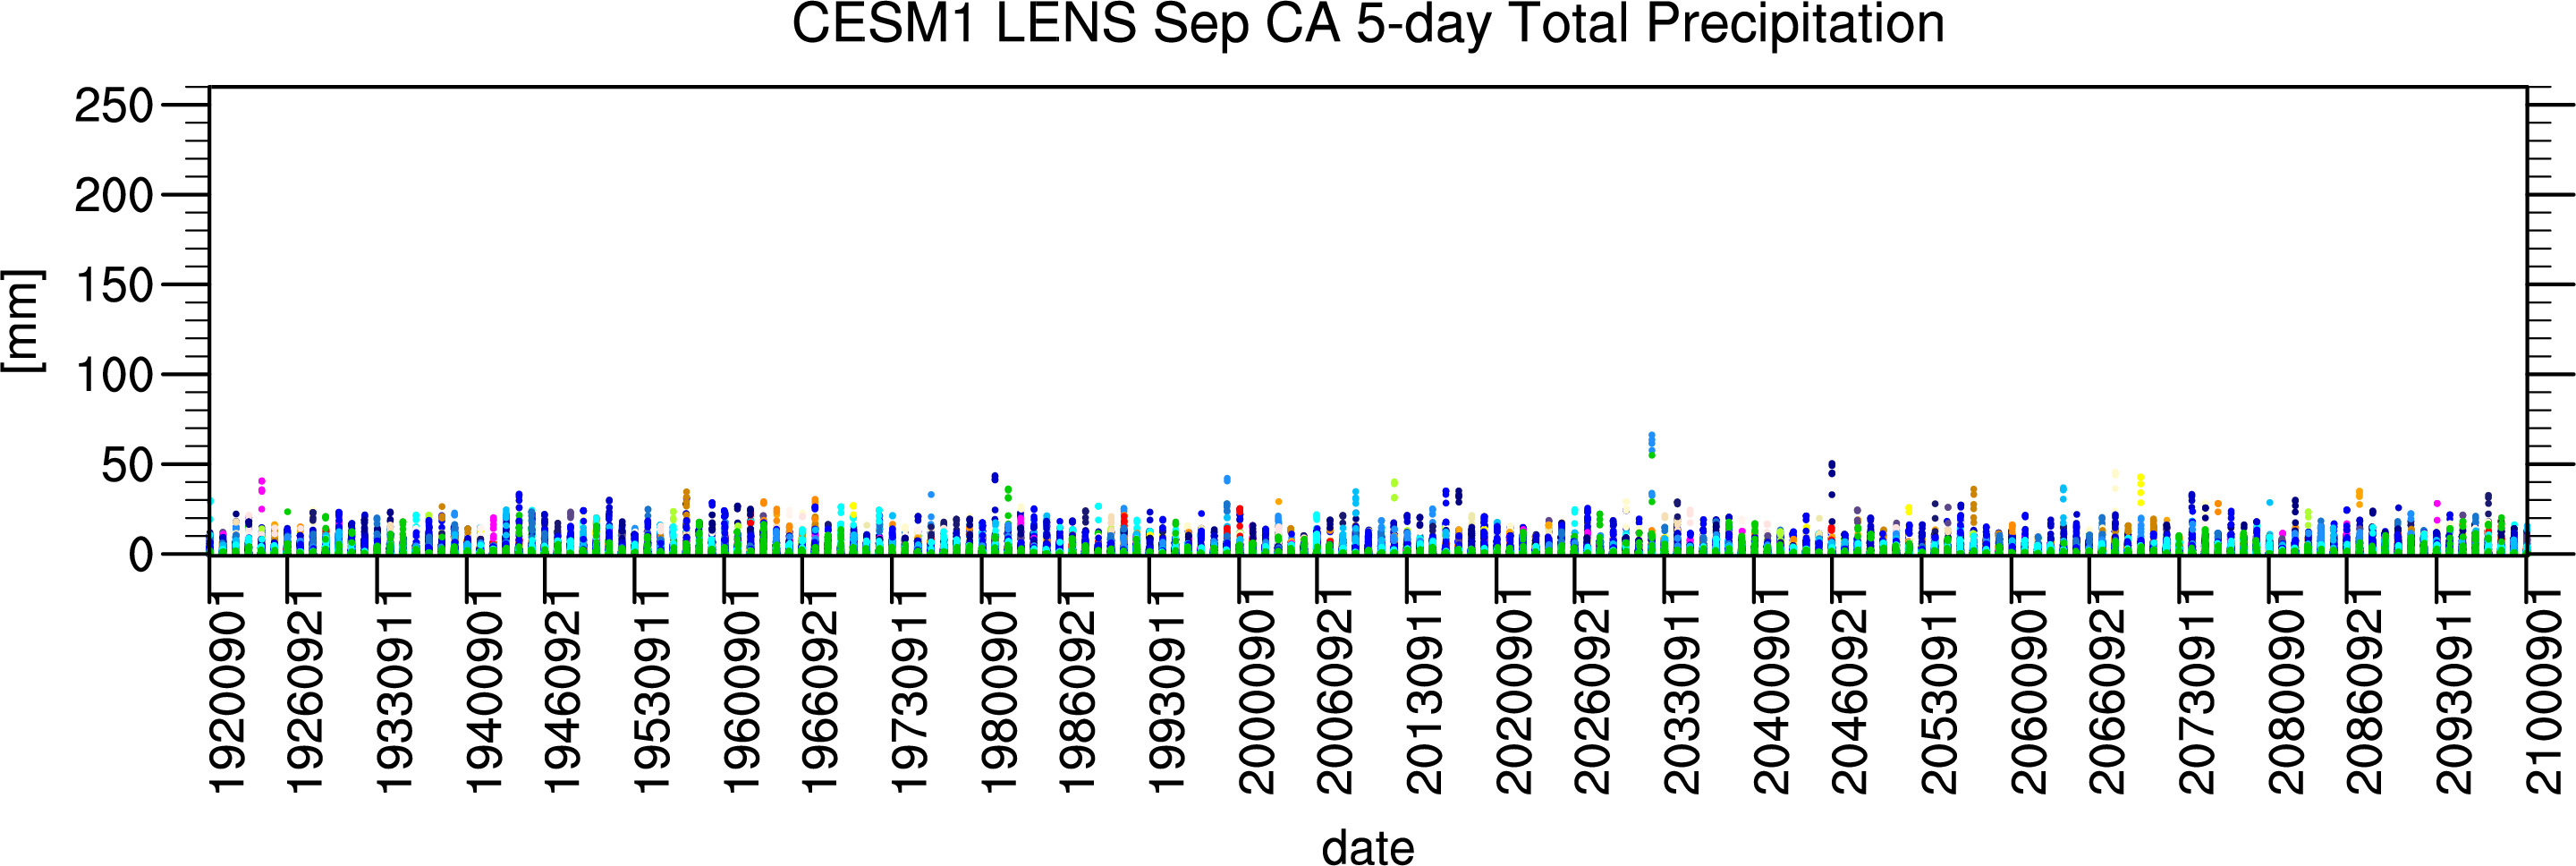
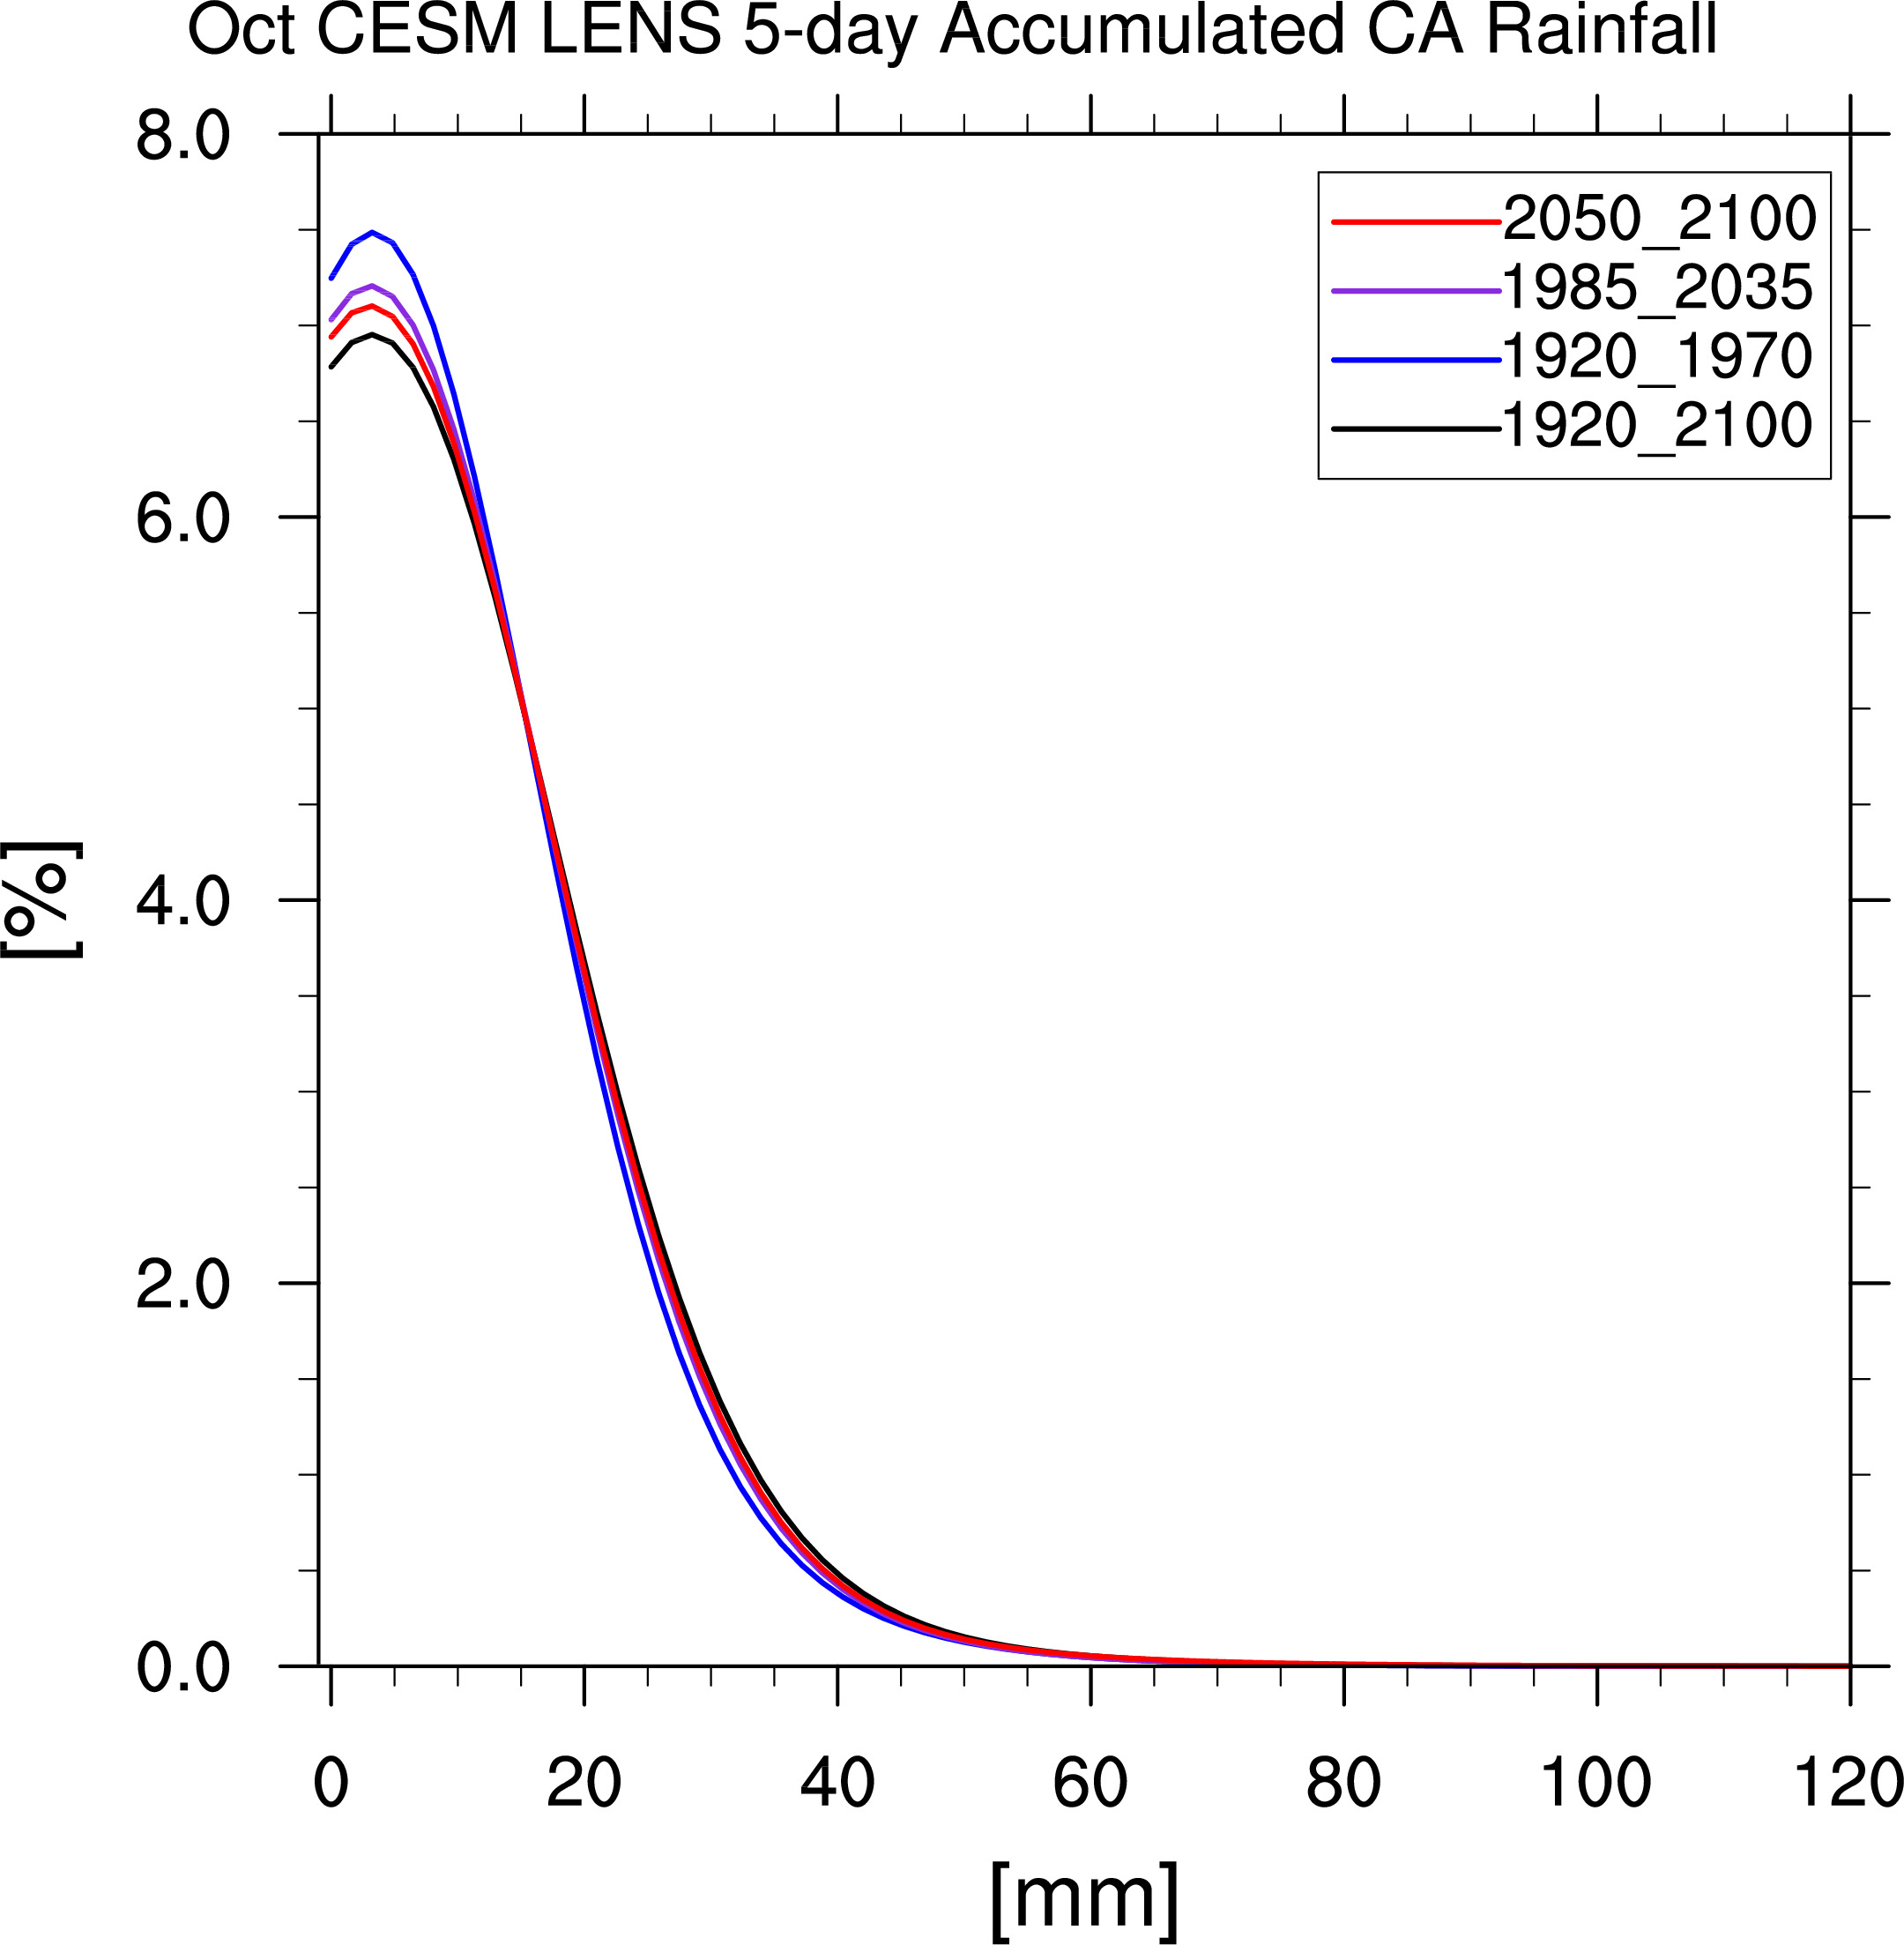
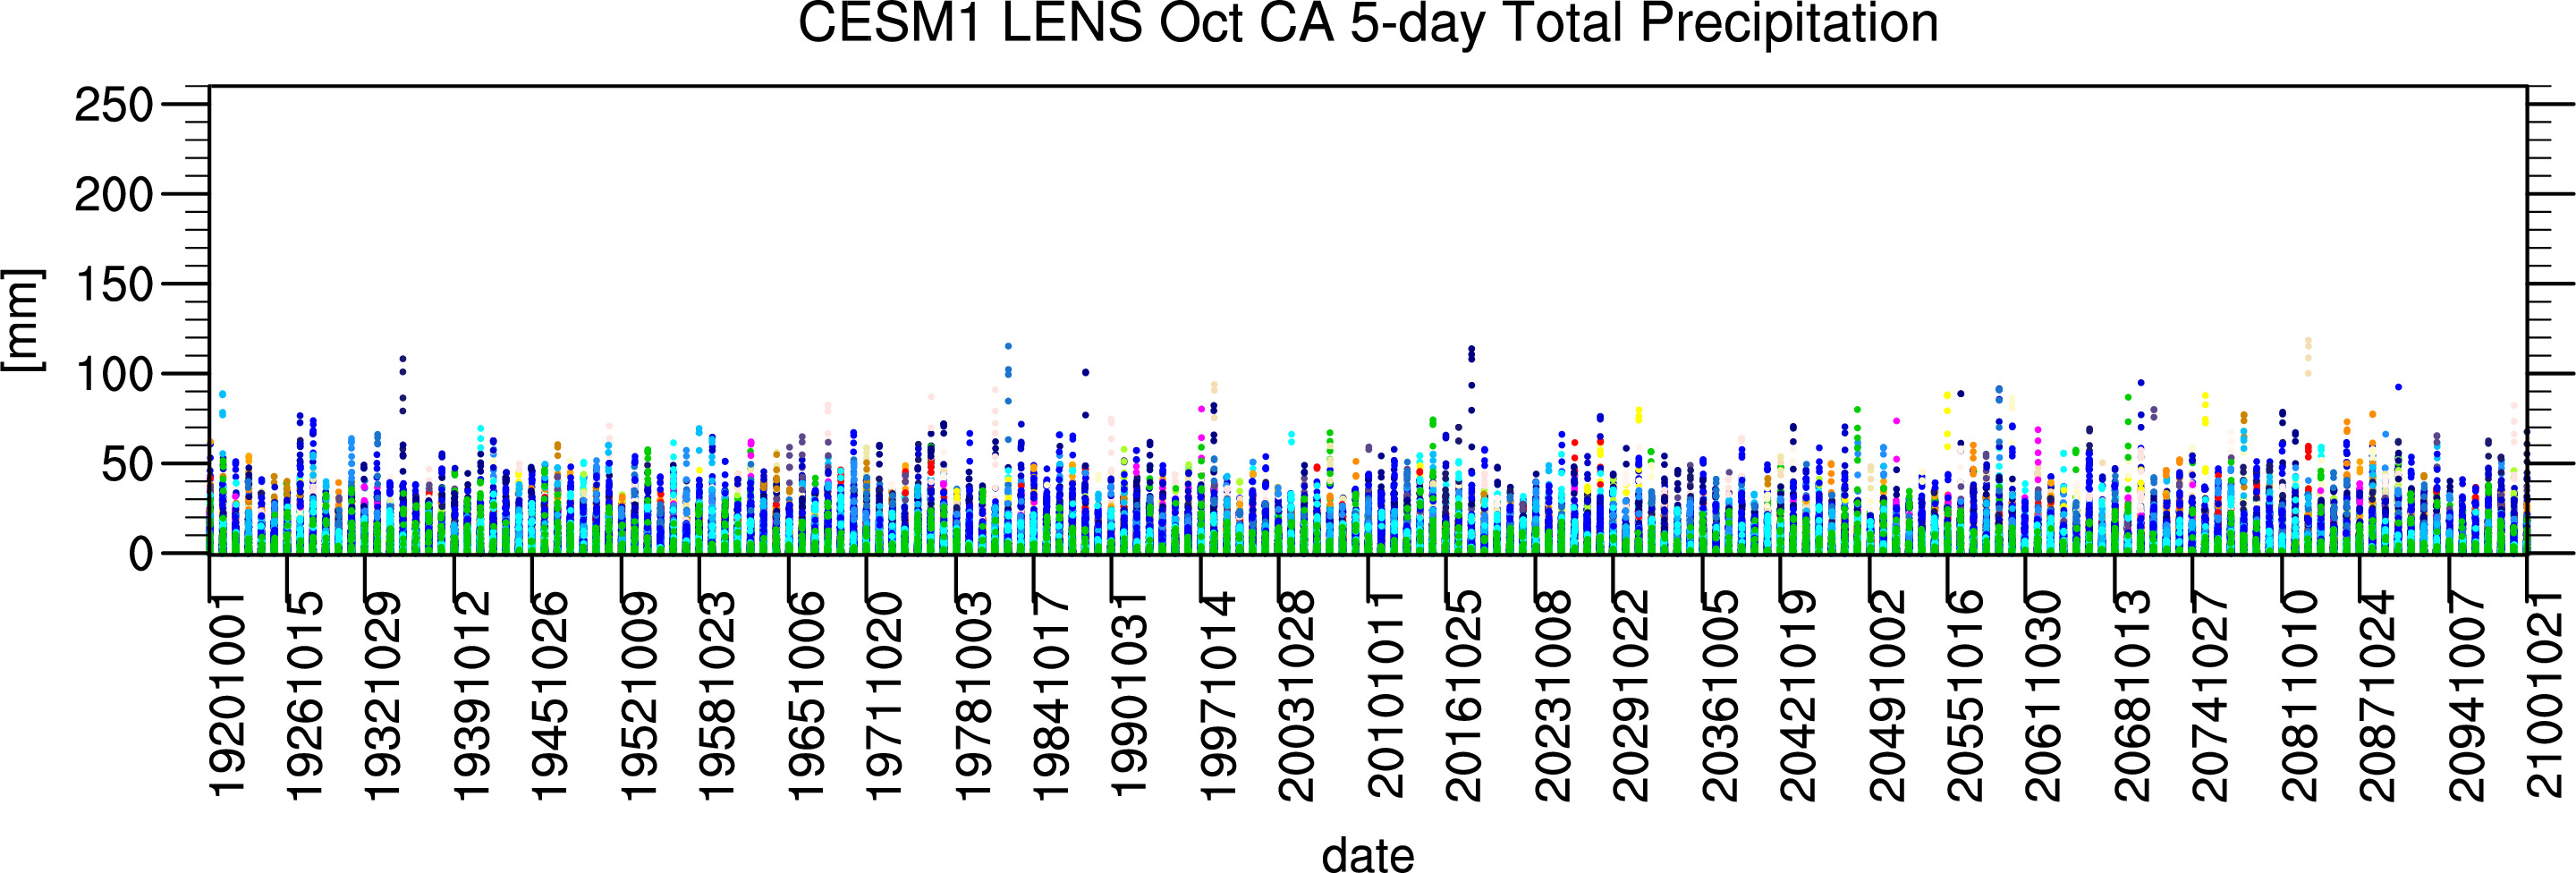
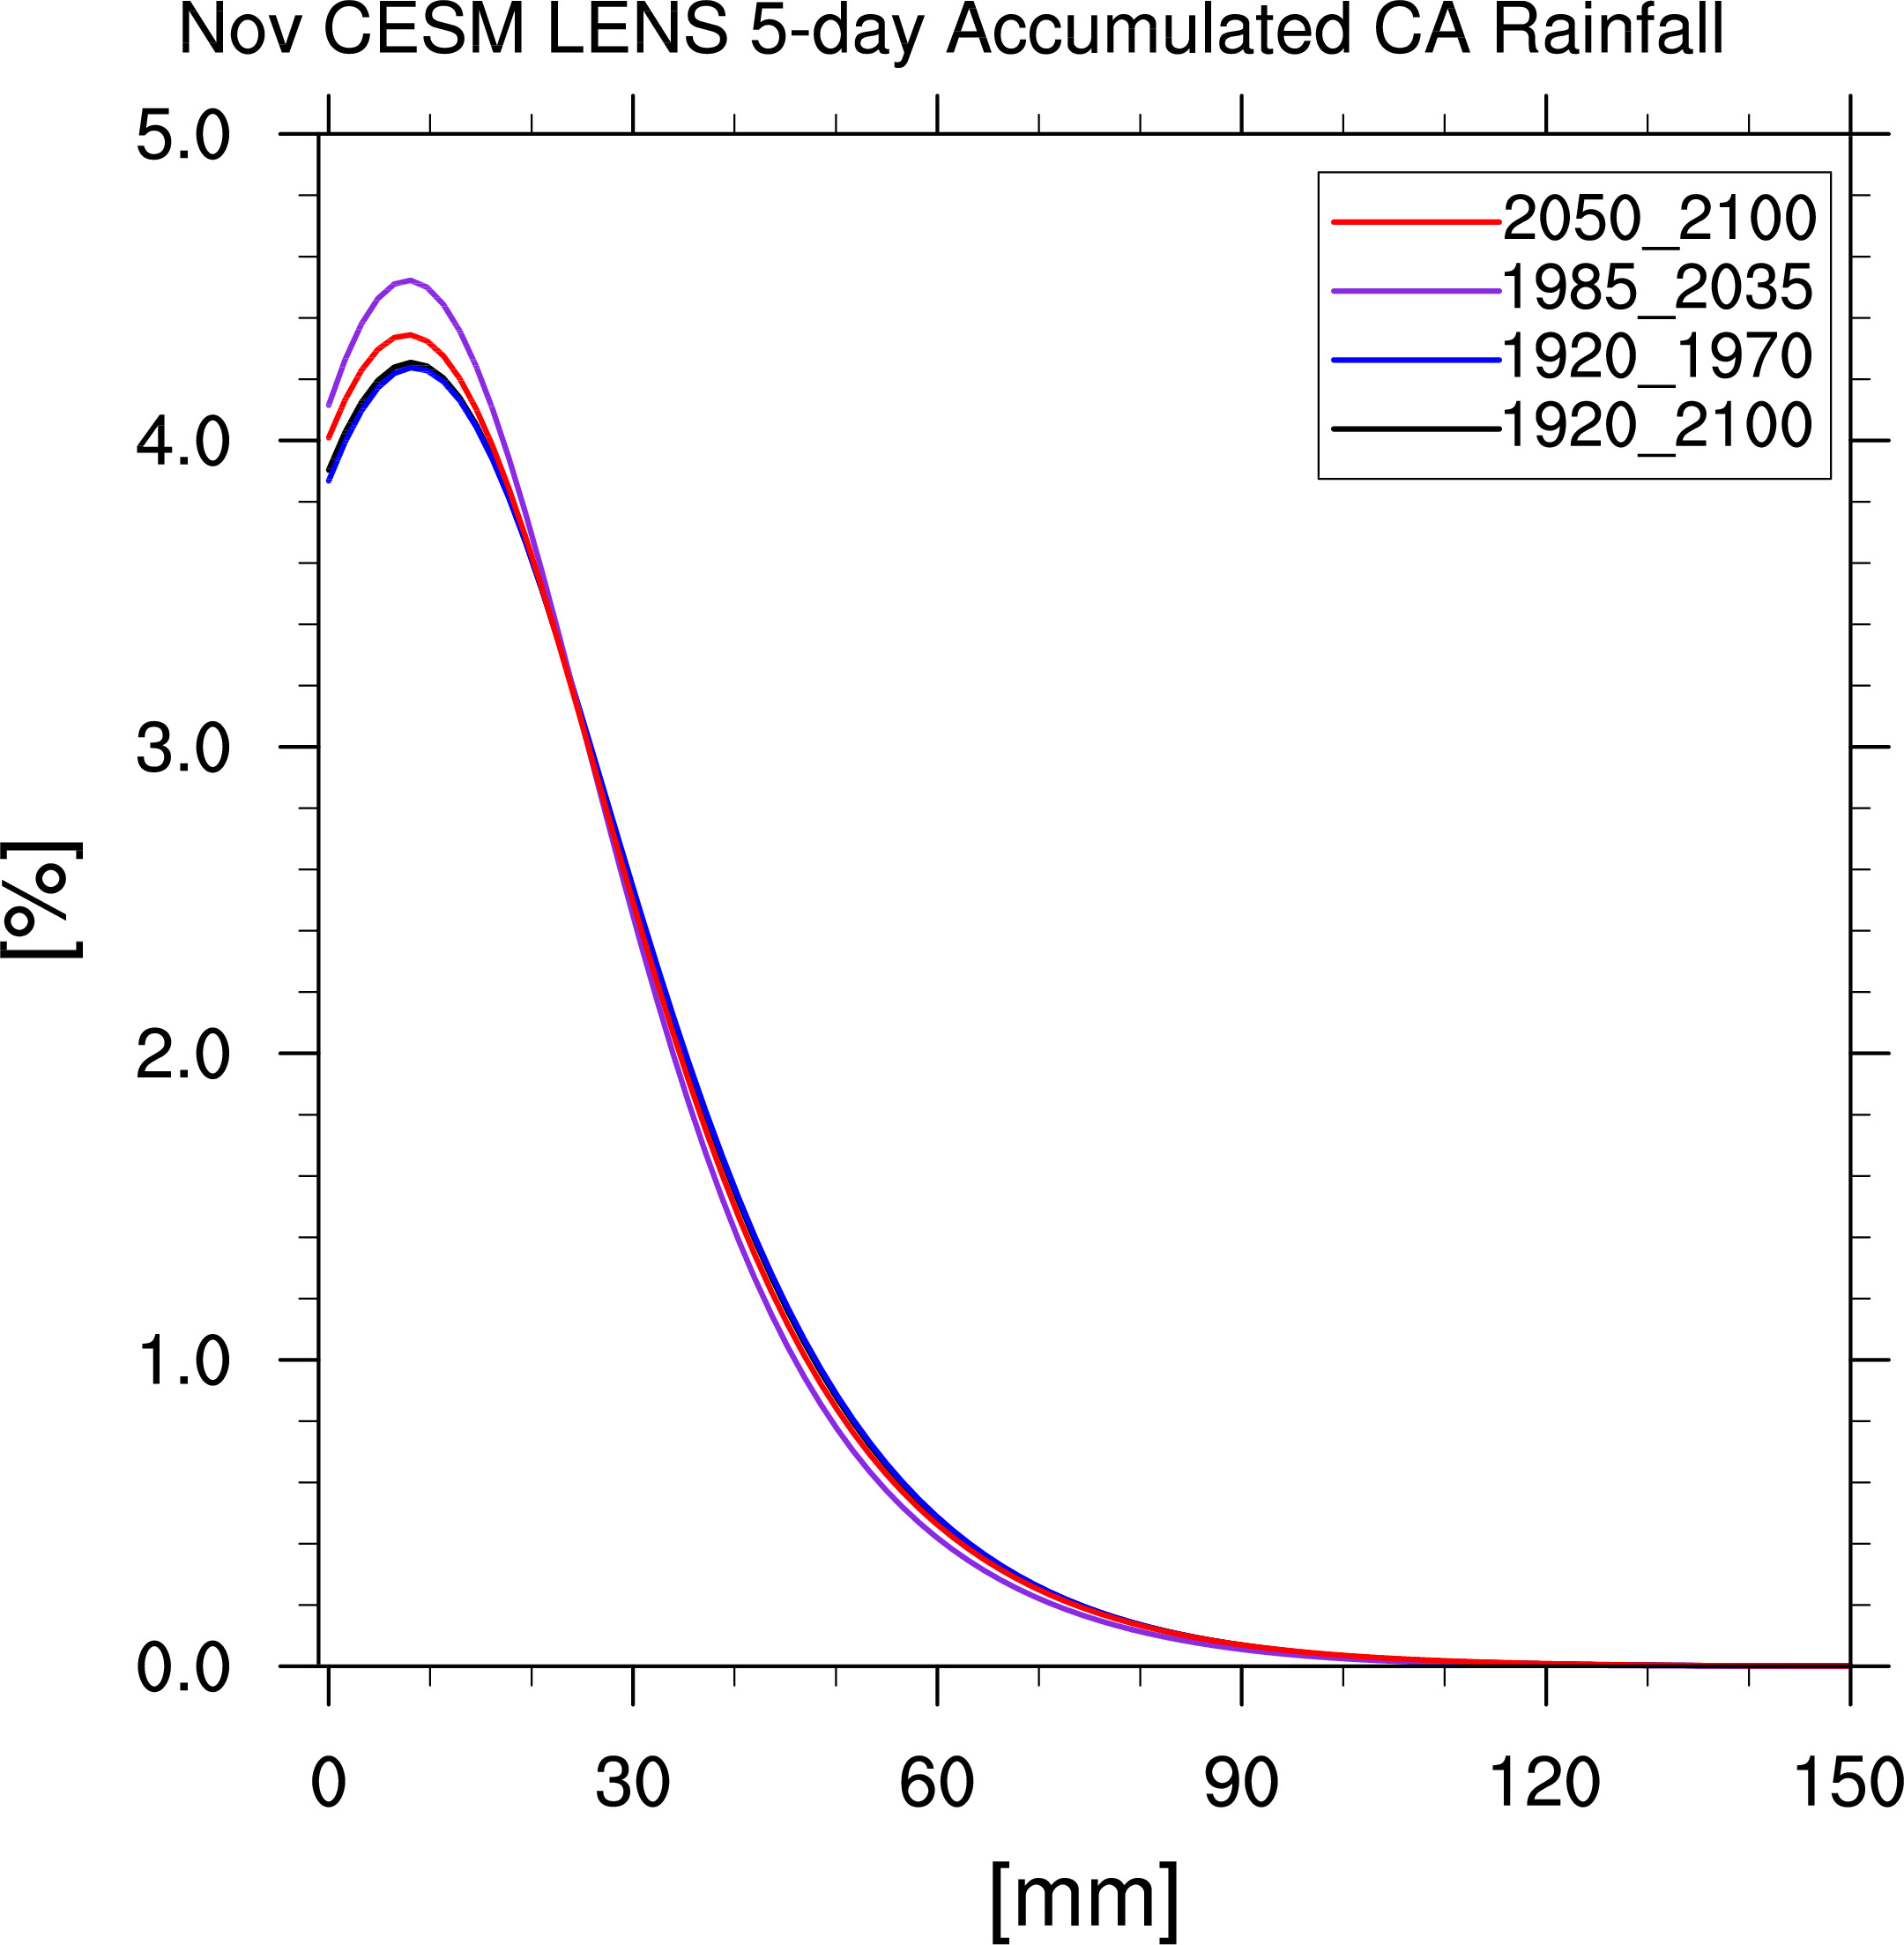
Extreme Precipitation in California
See also the preliminary 2016/2017 California Rainy Season analysis
All plots here are preliminary.
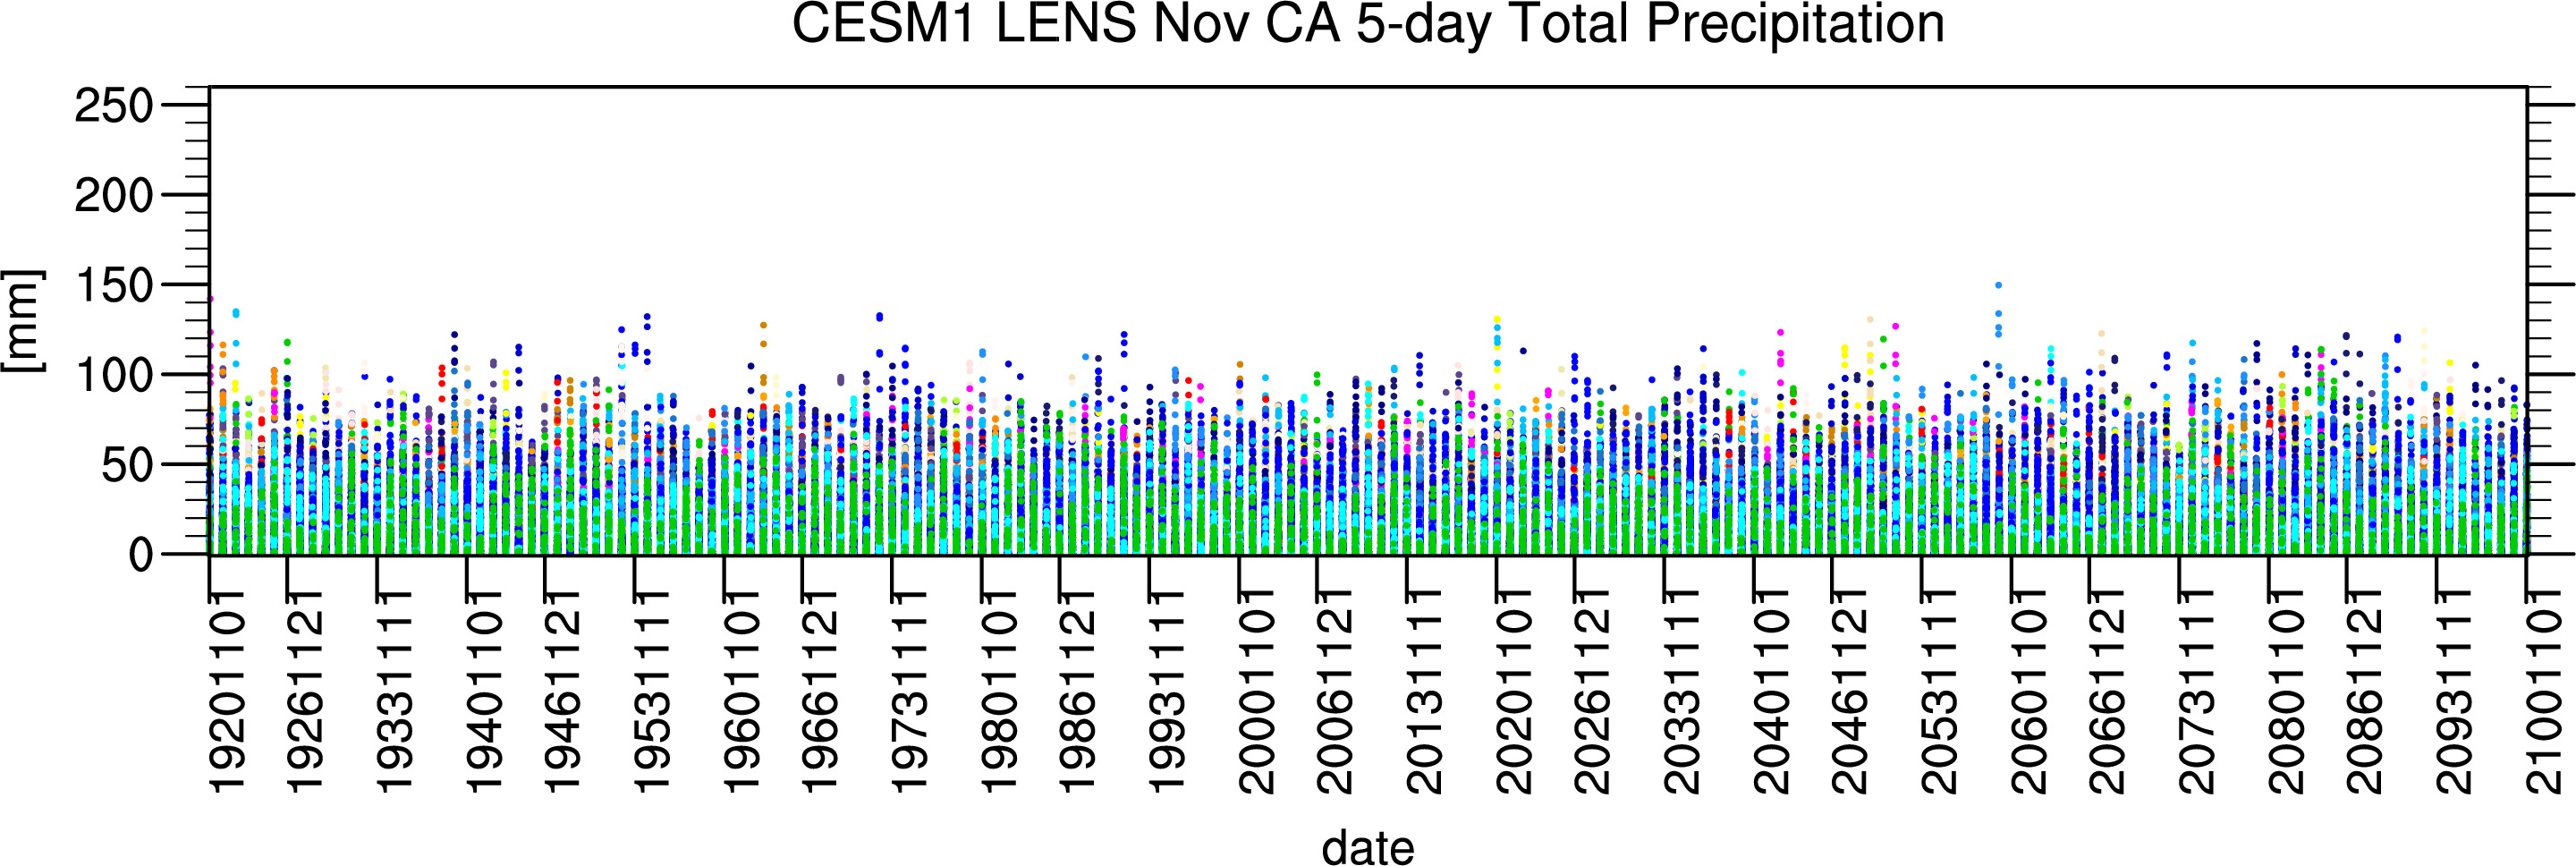
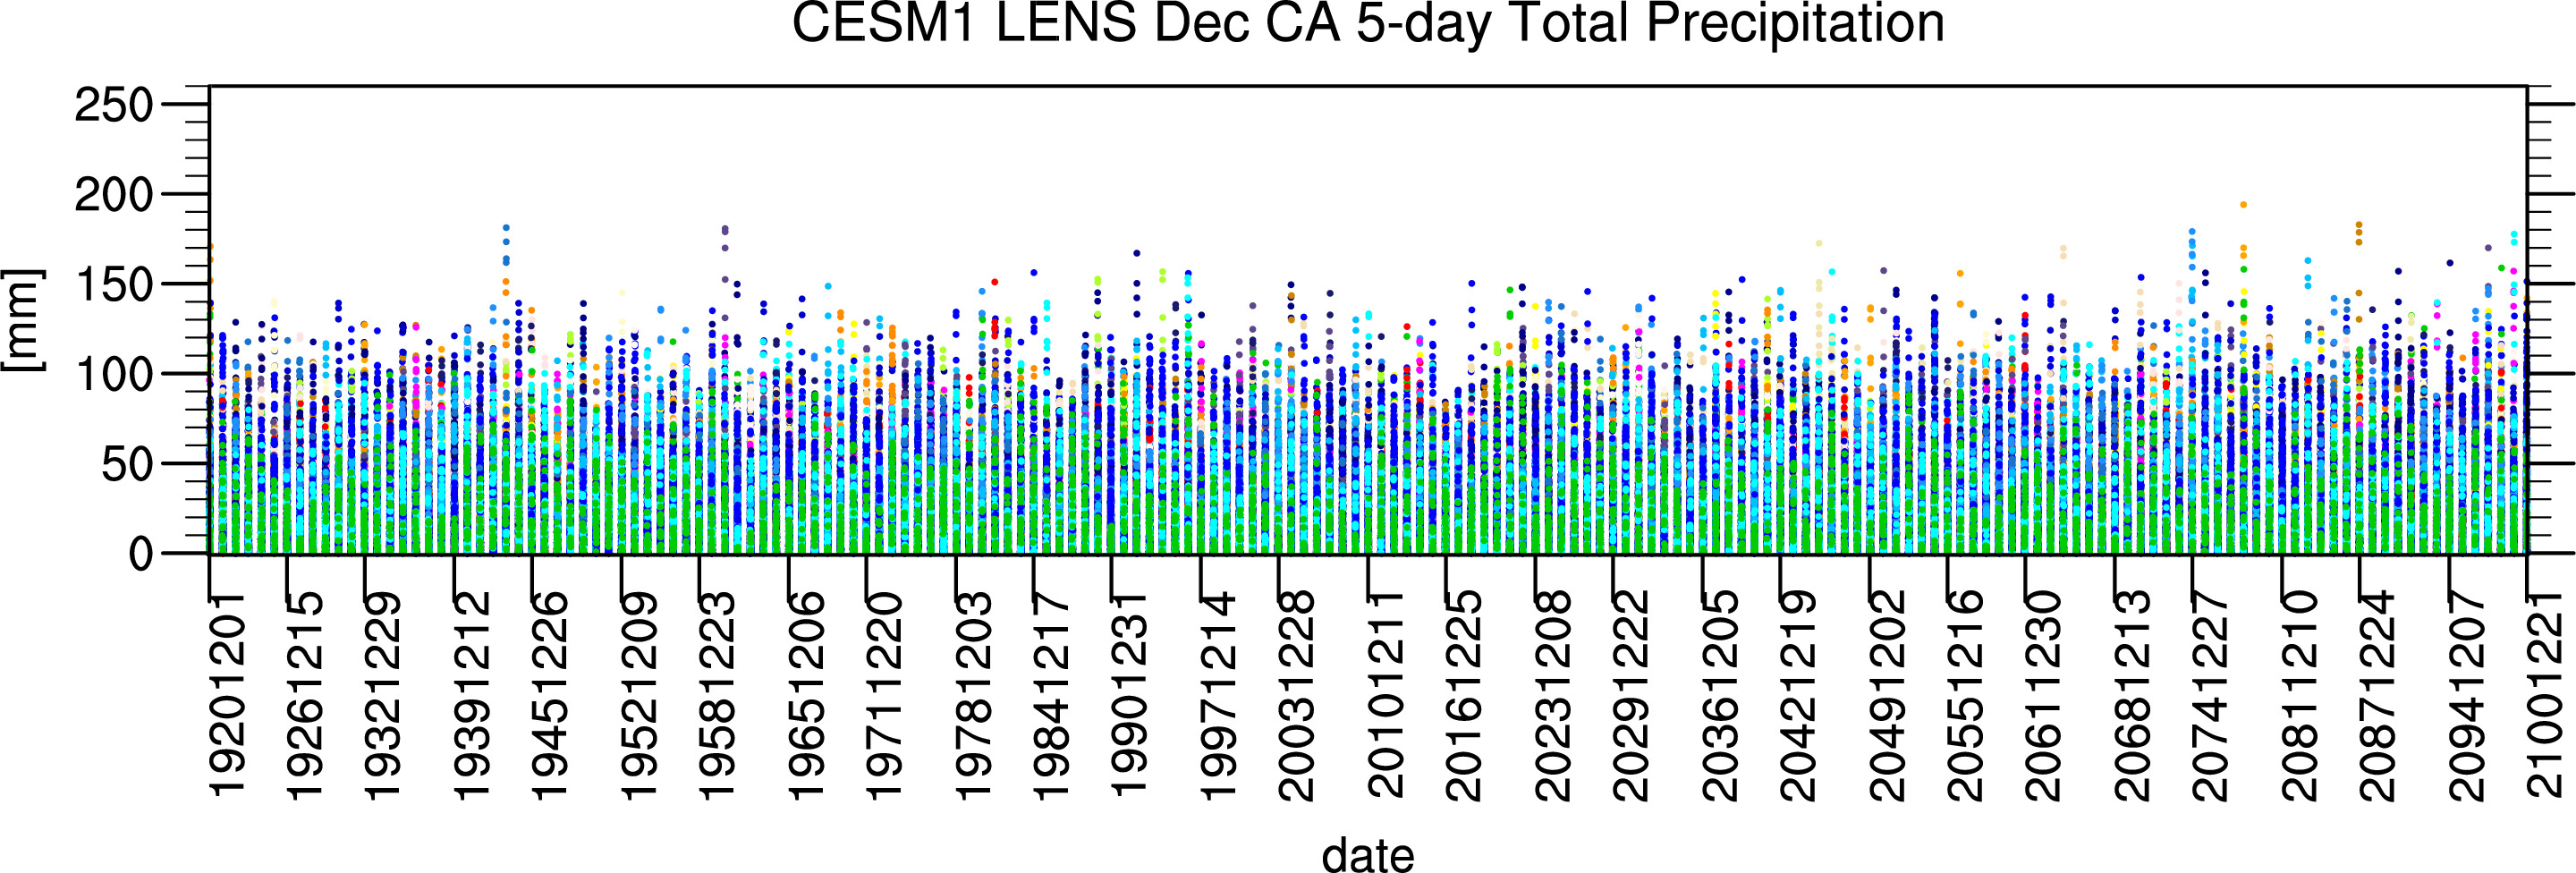
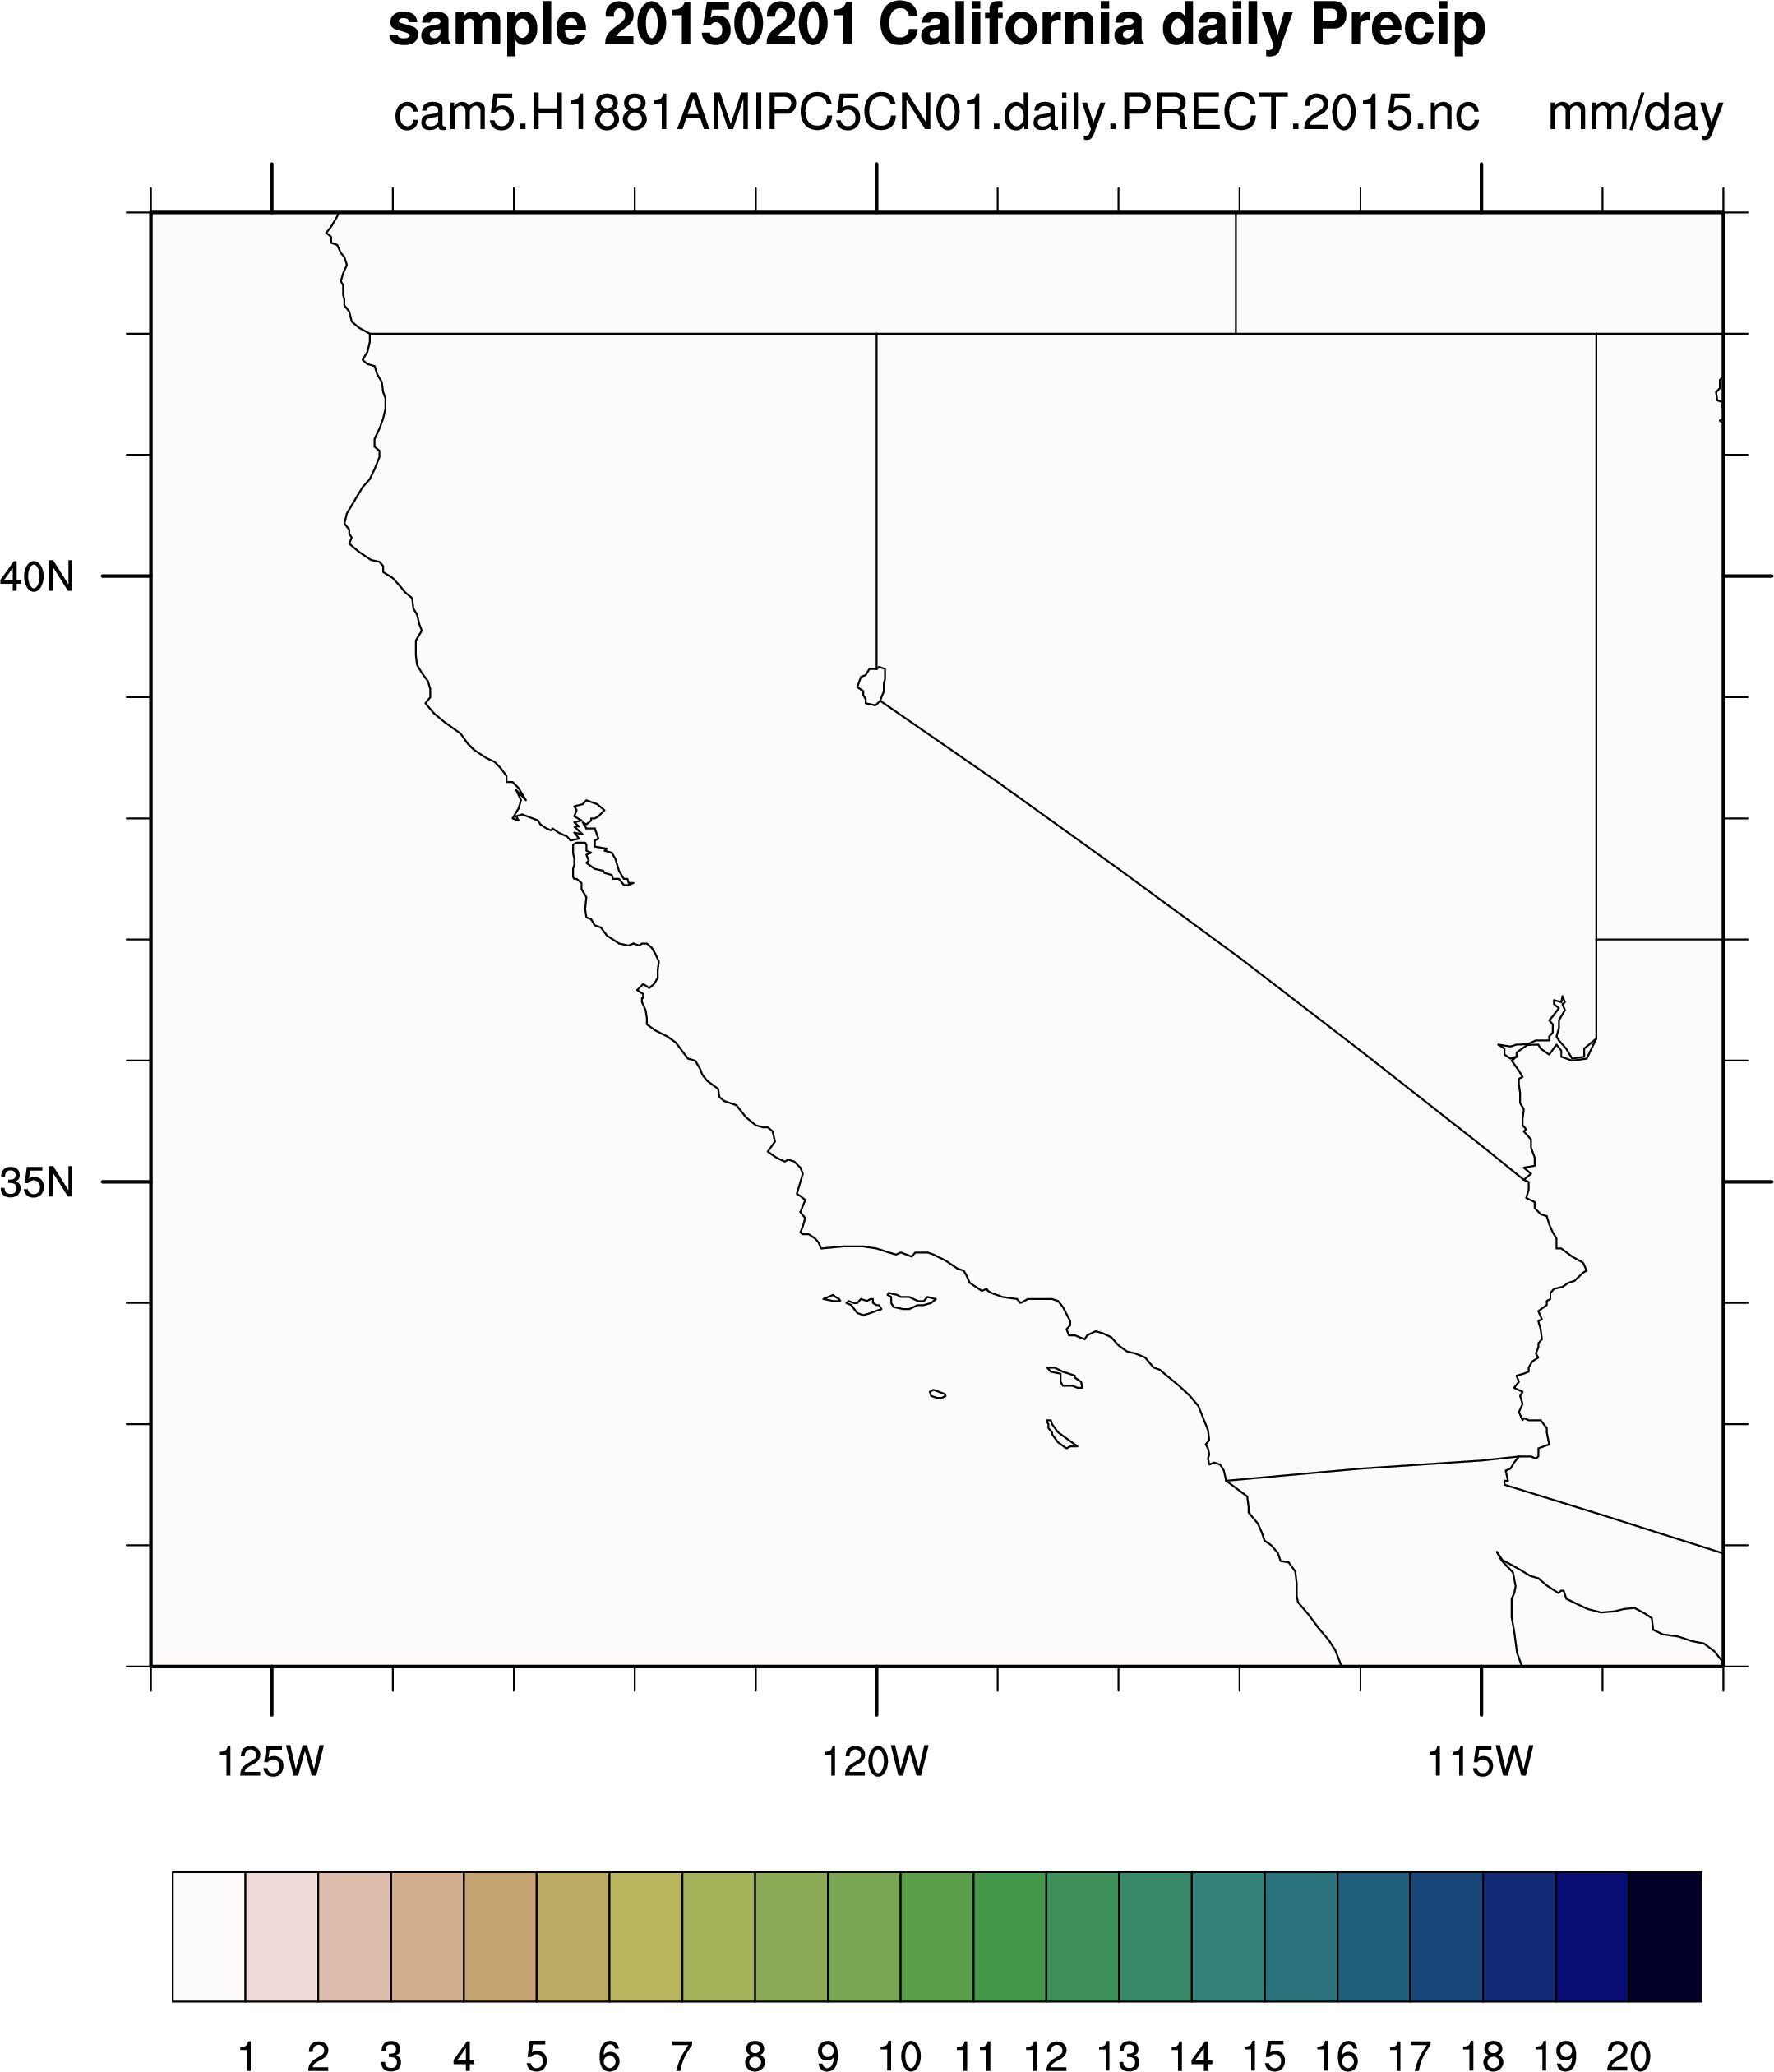
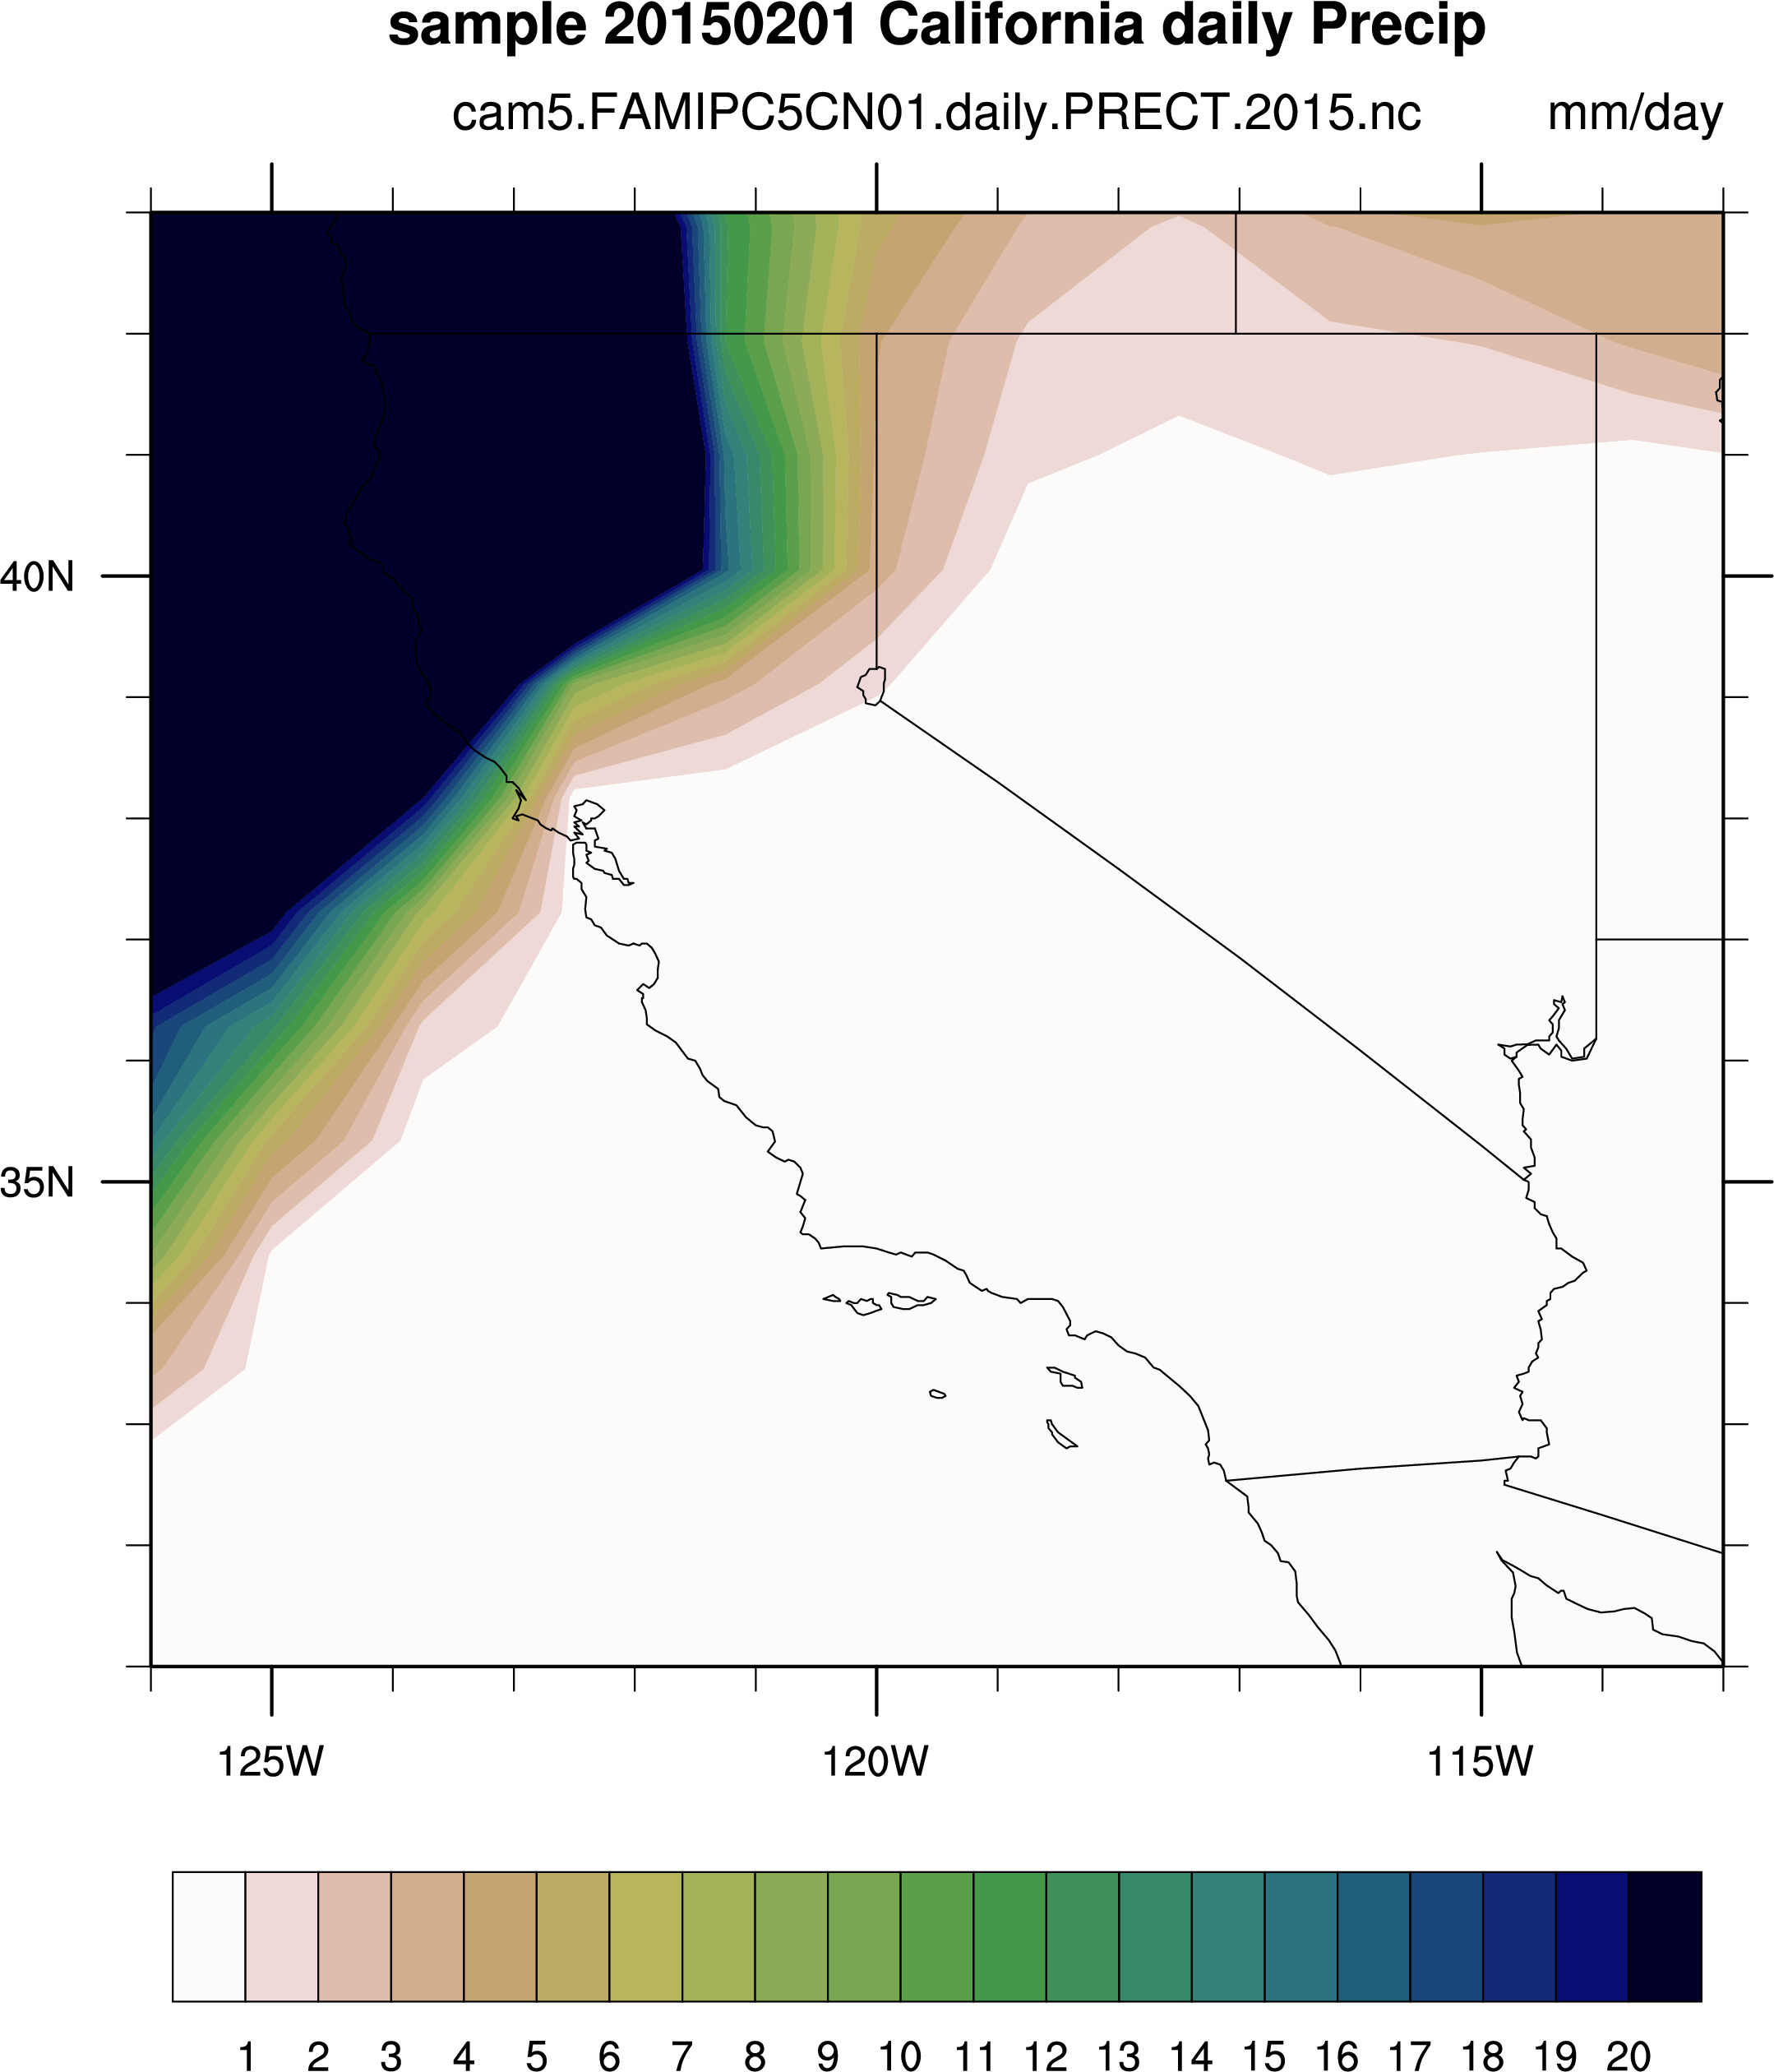
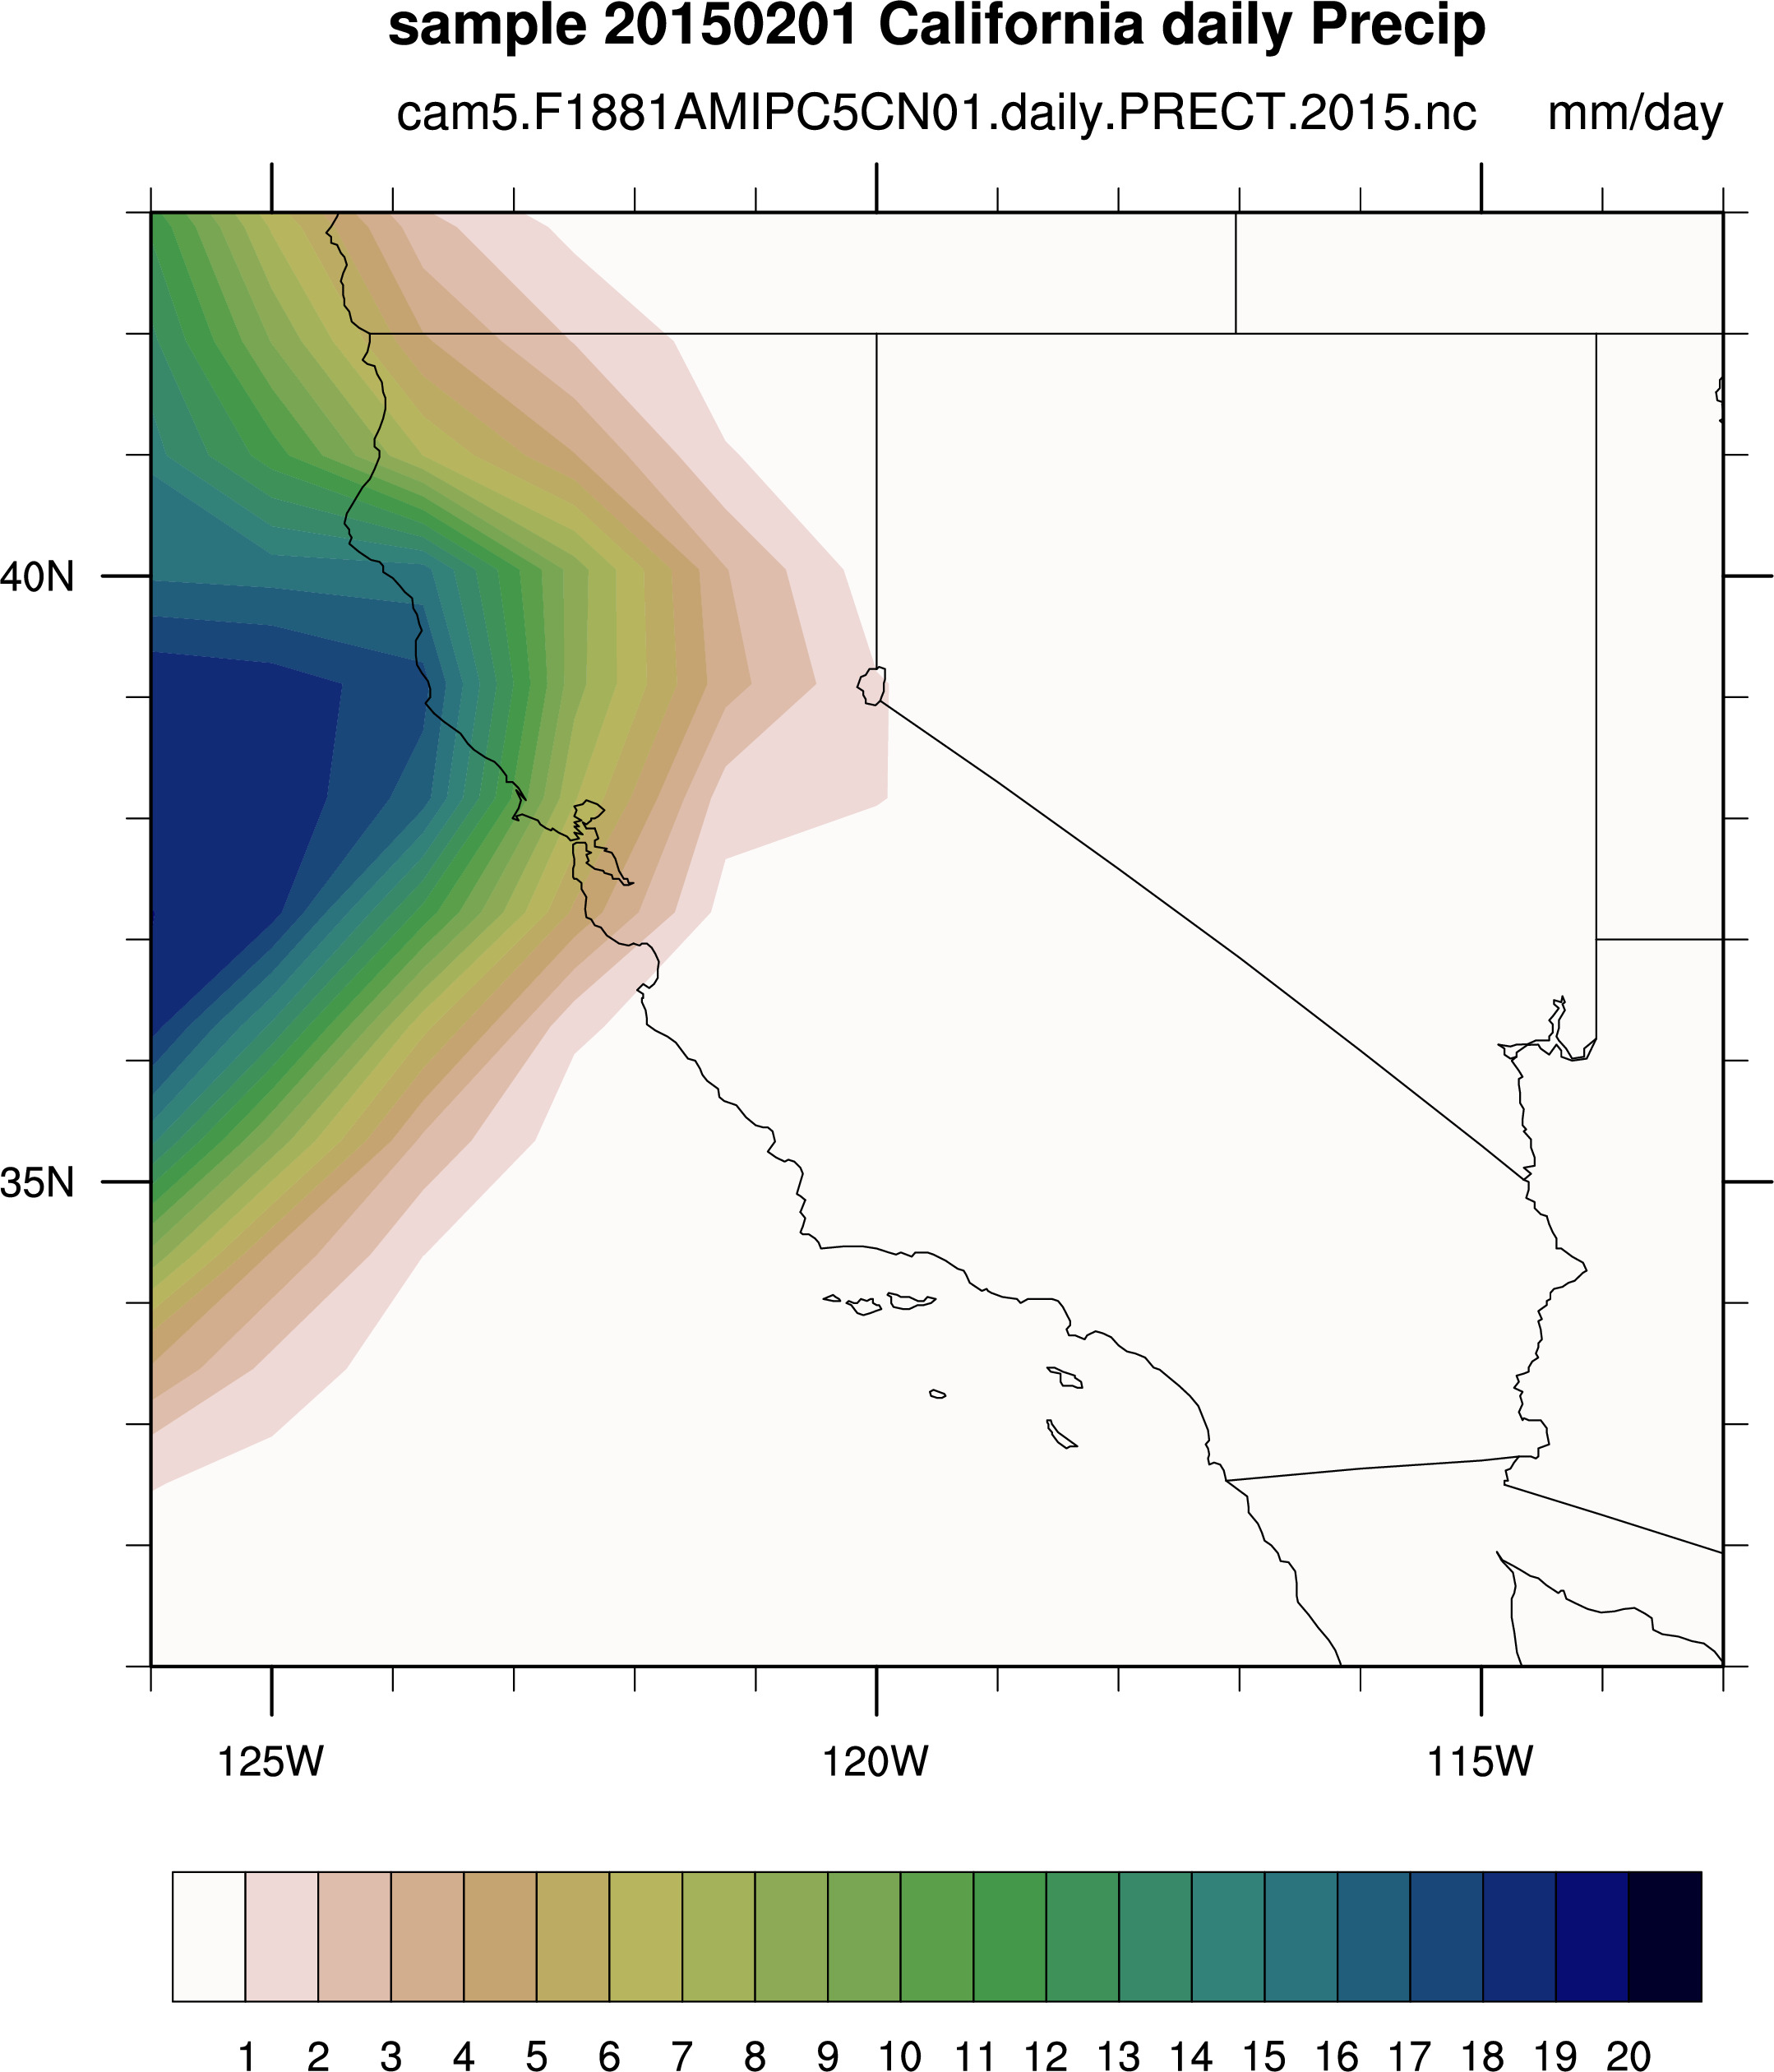
Daily Precipitation
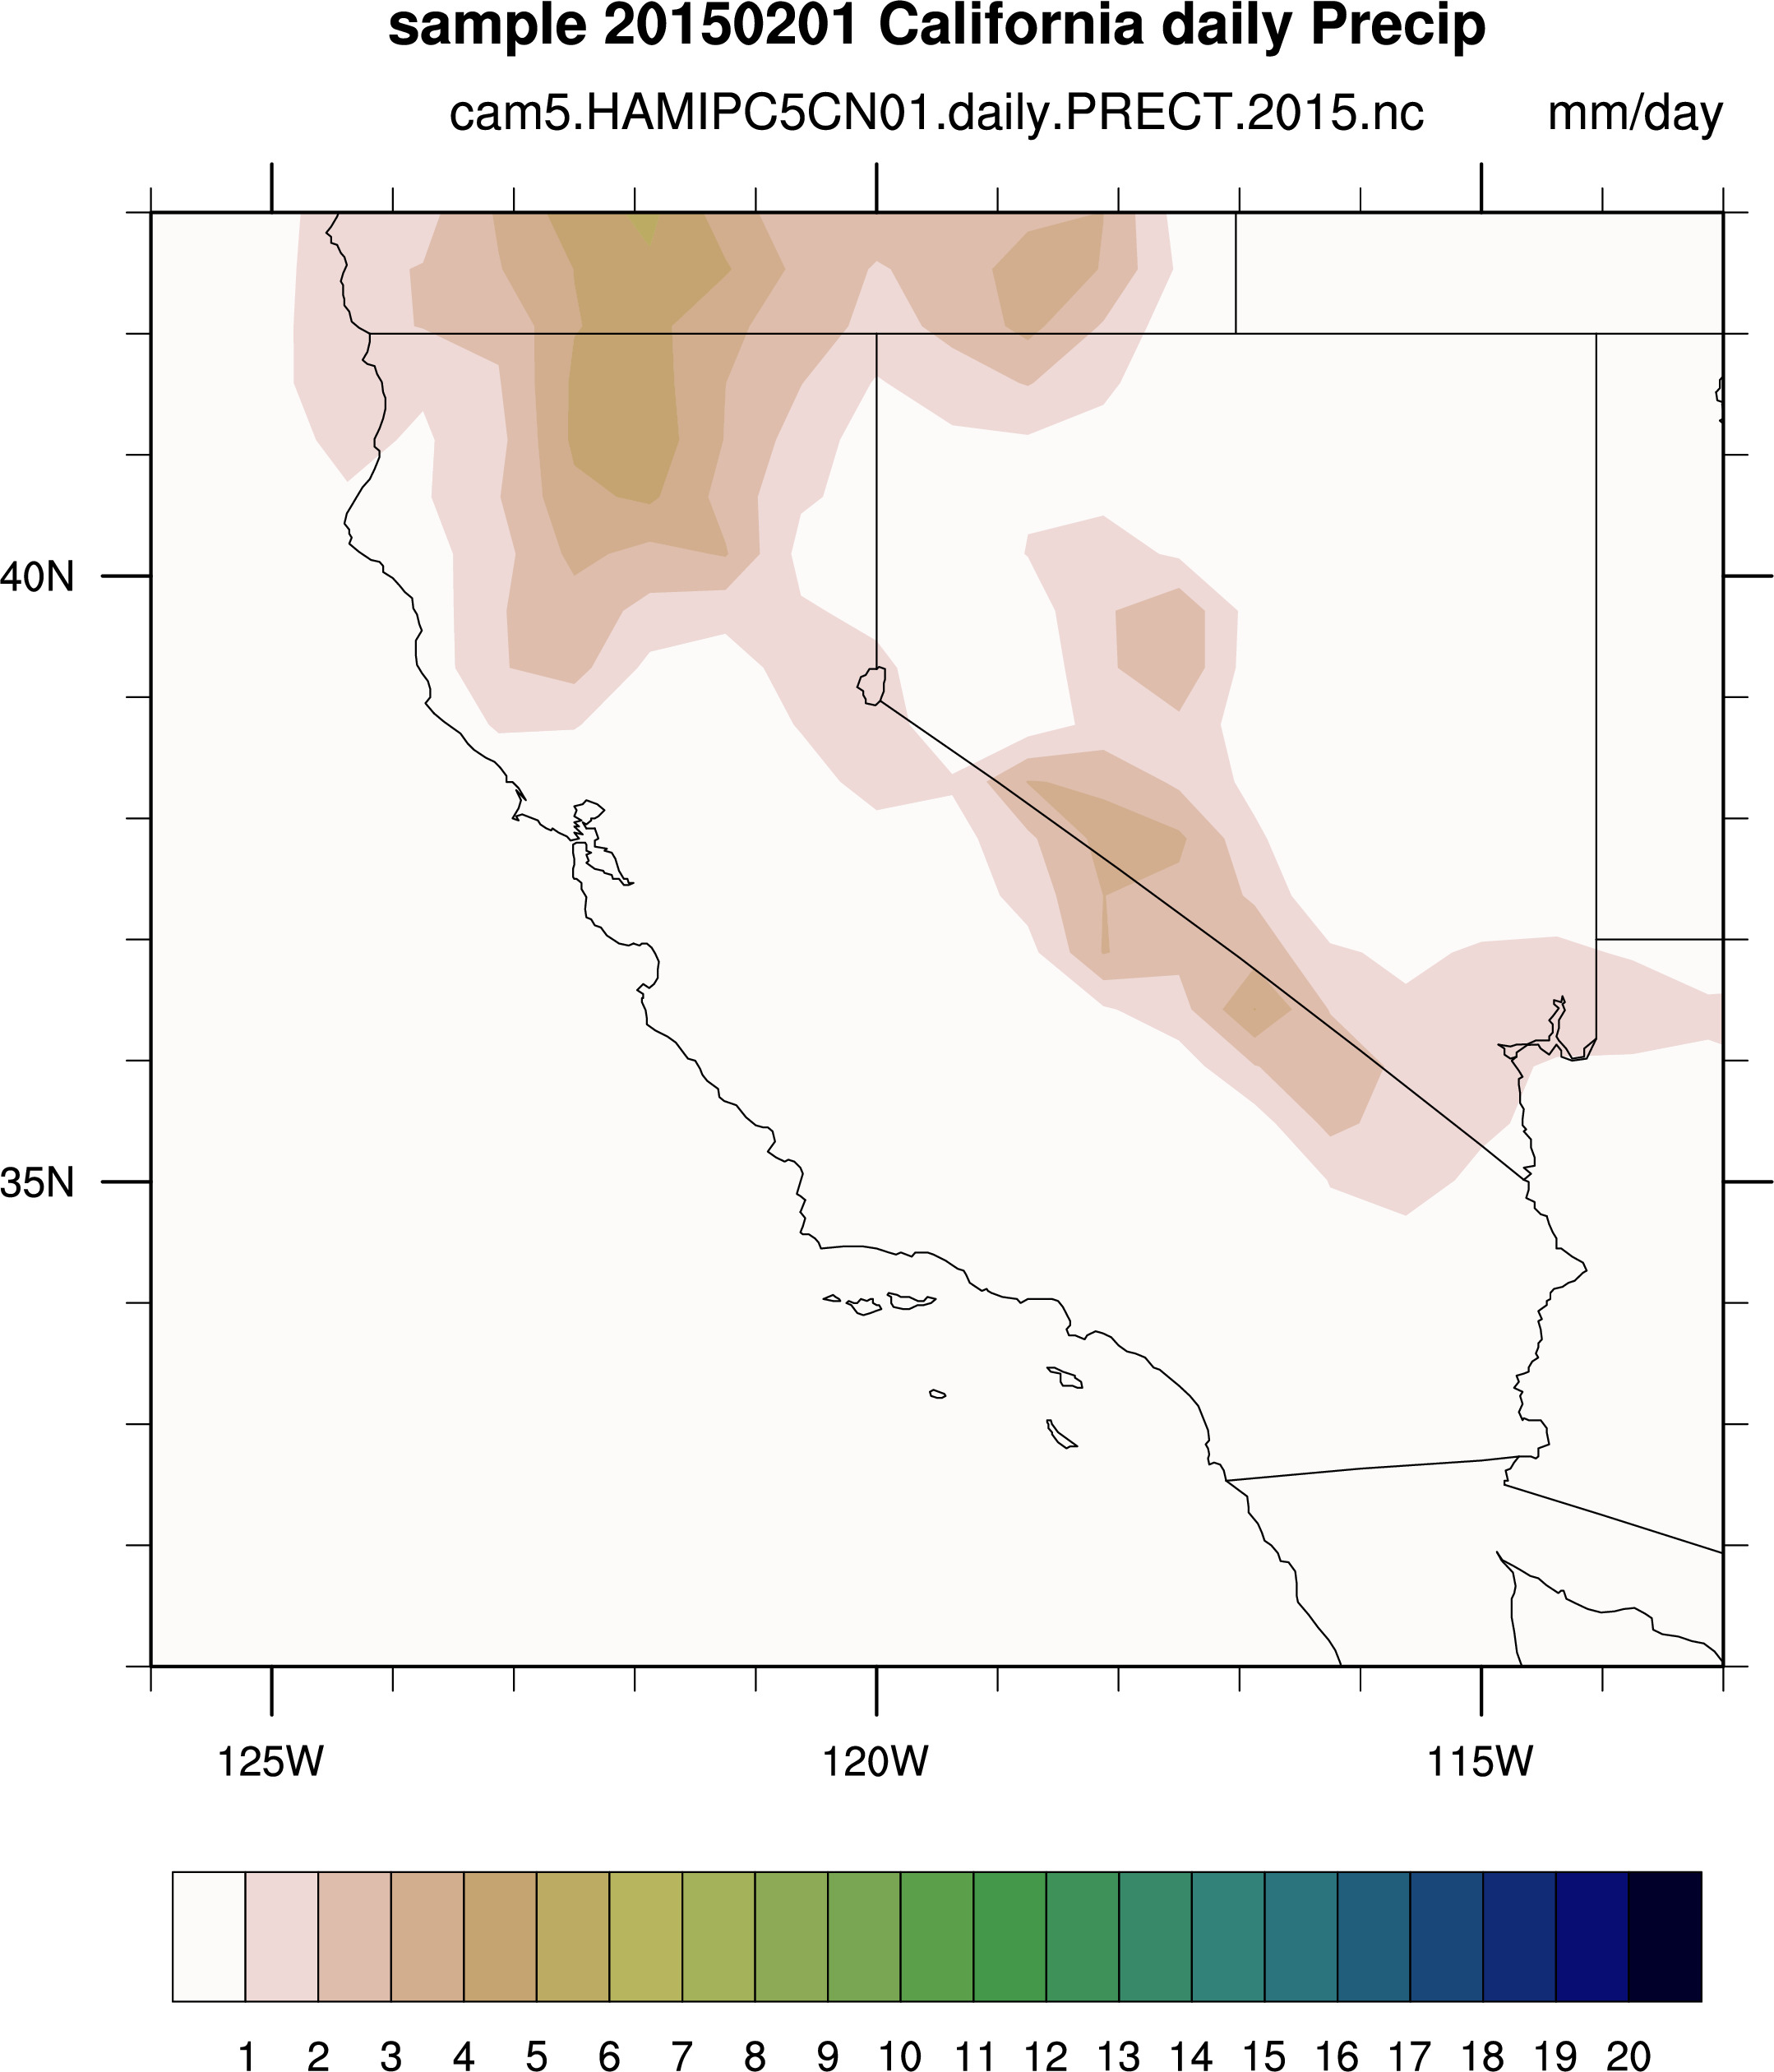
Model Experiments
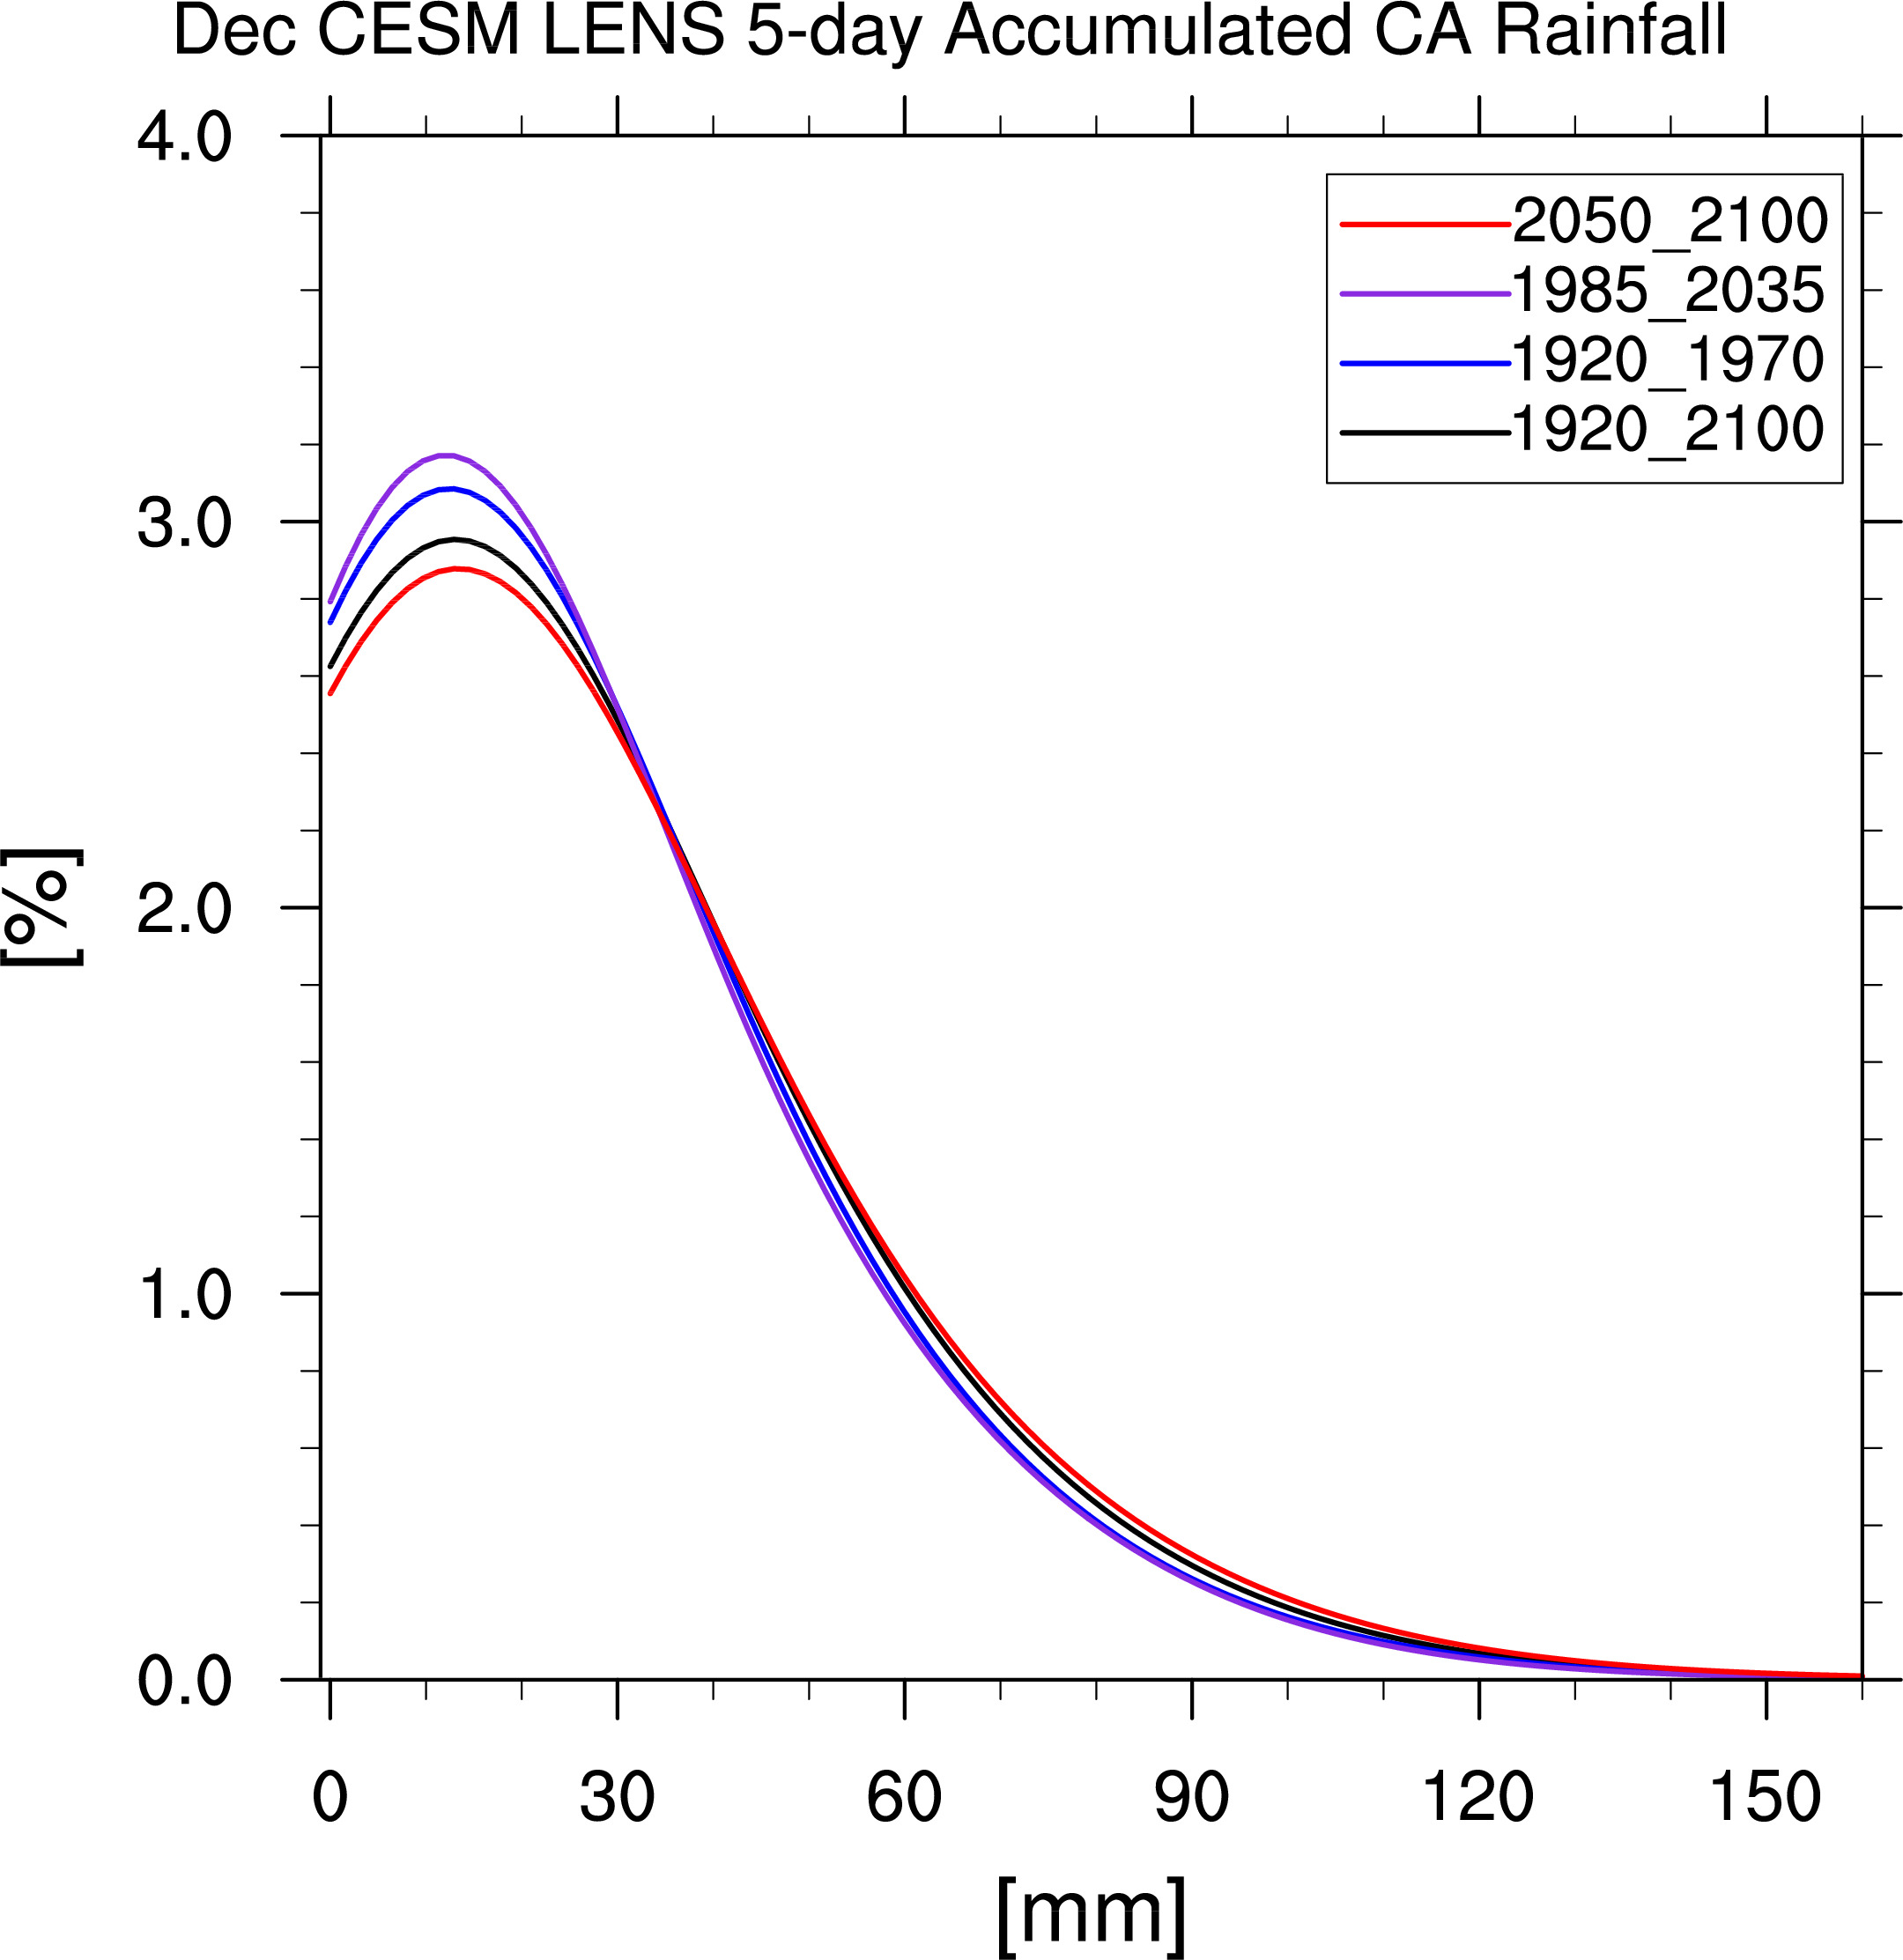
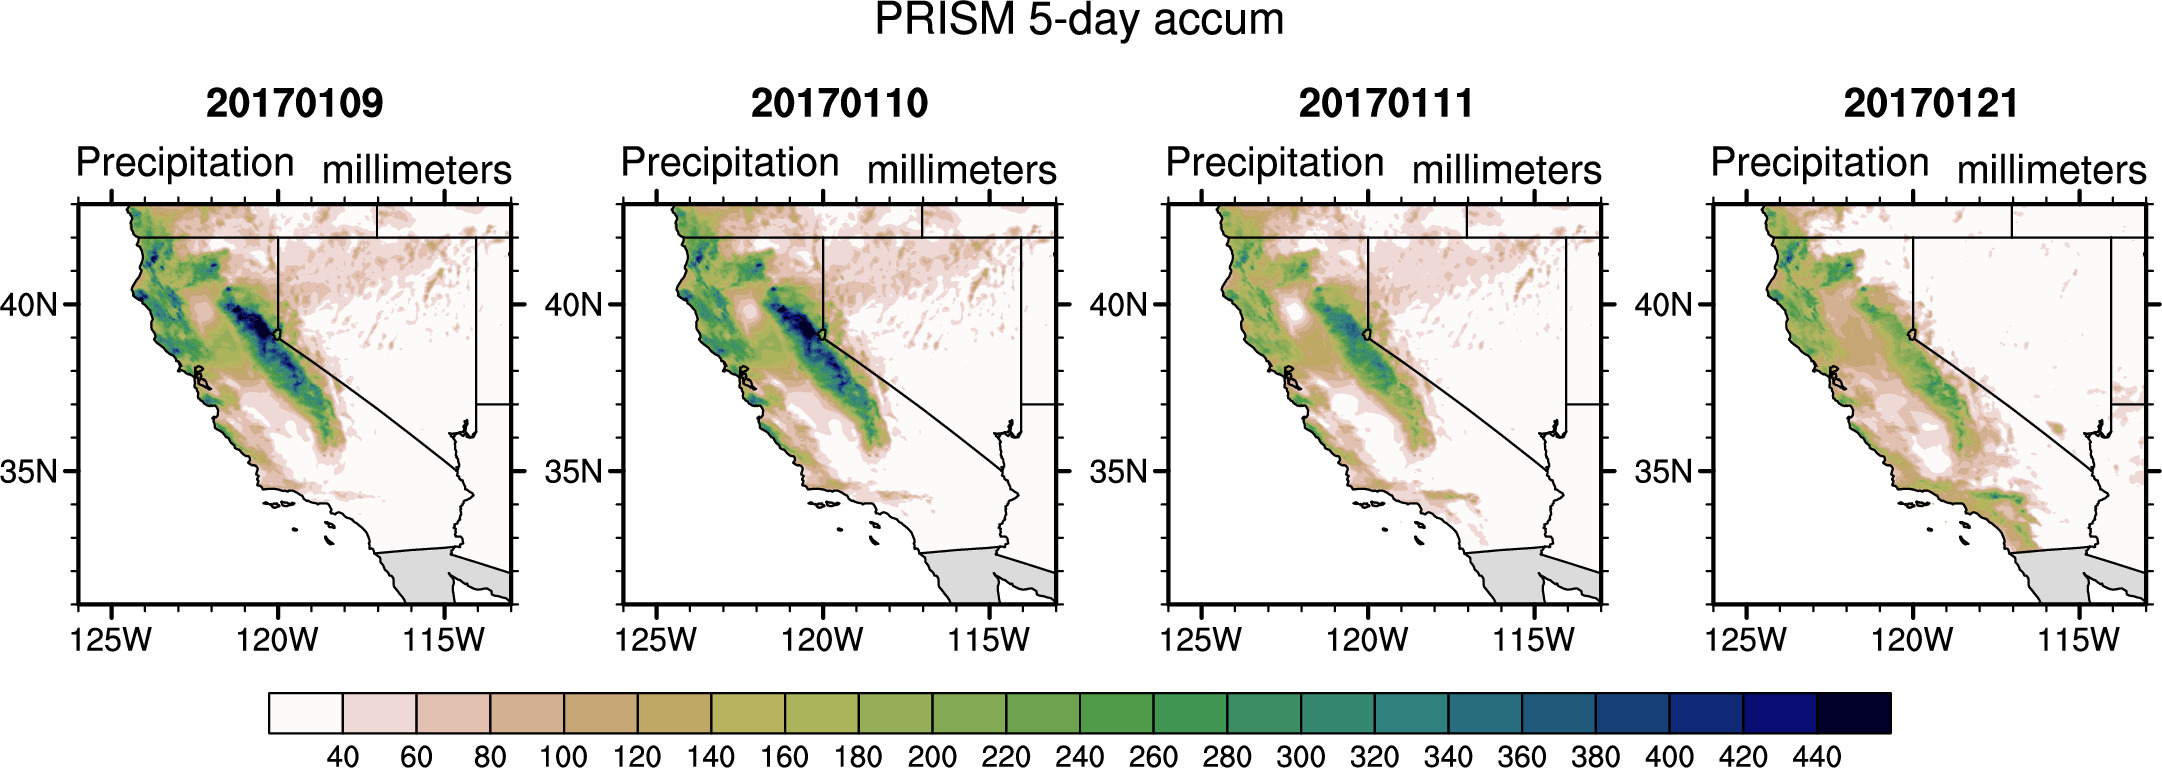
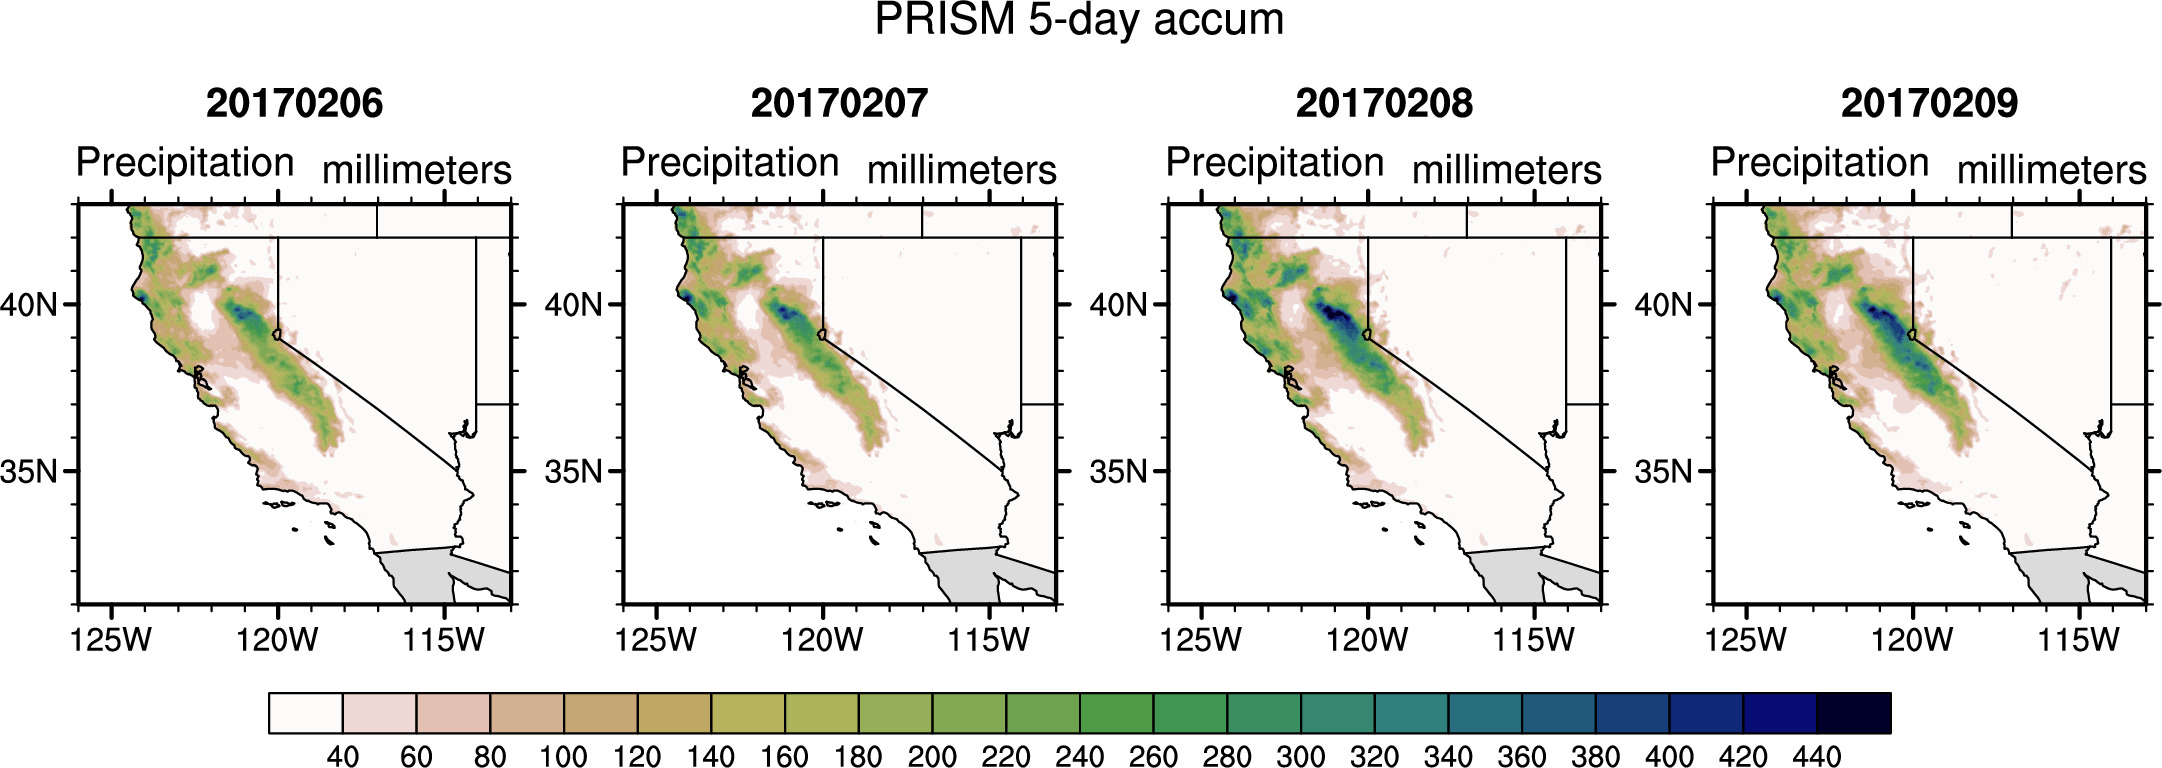
Running 5-day Accumulations
NCAR CESM1 Large Ensemble Data
Probability Density Functions
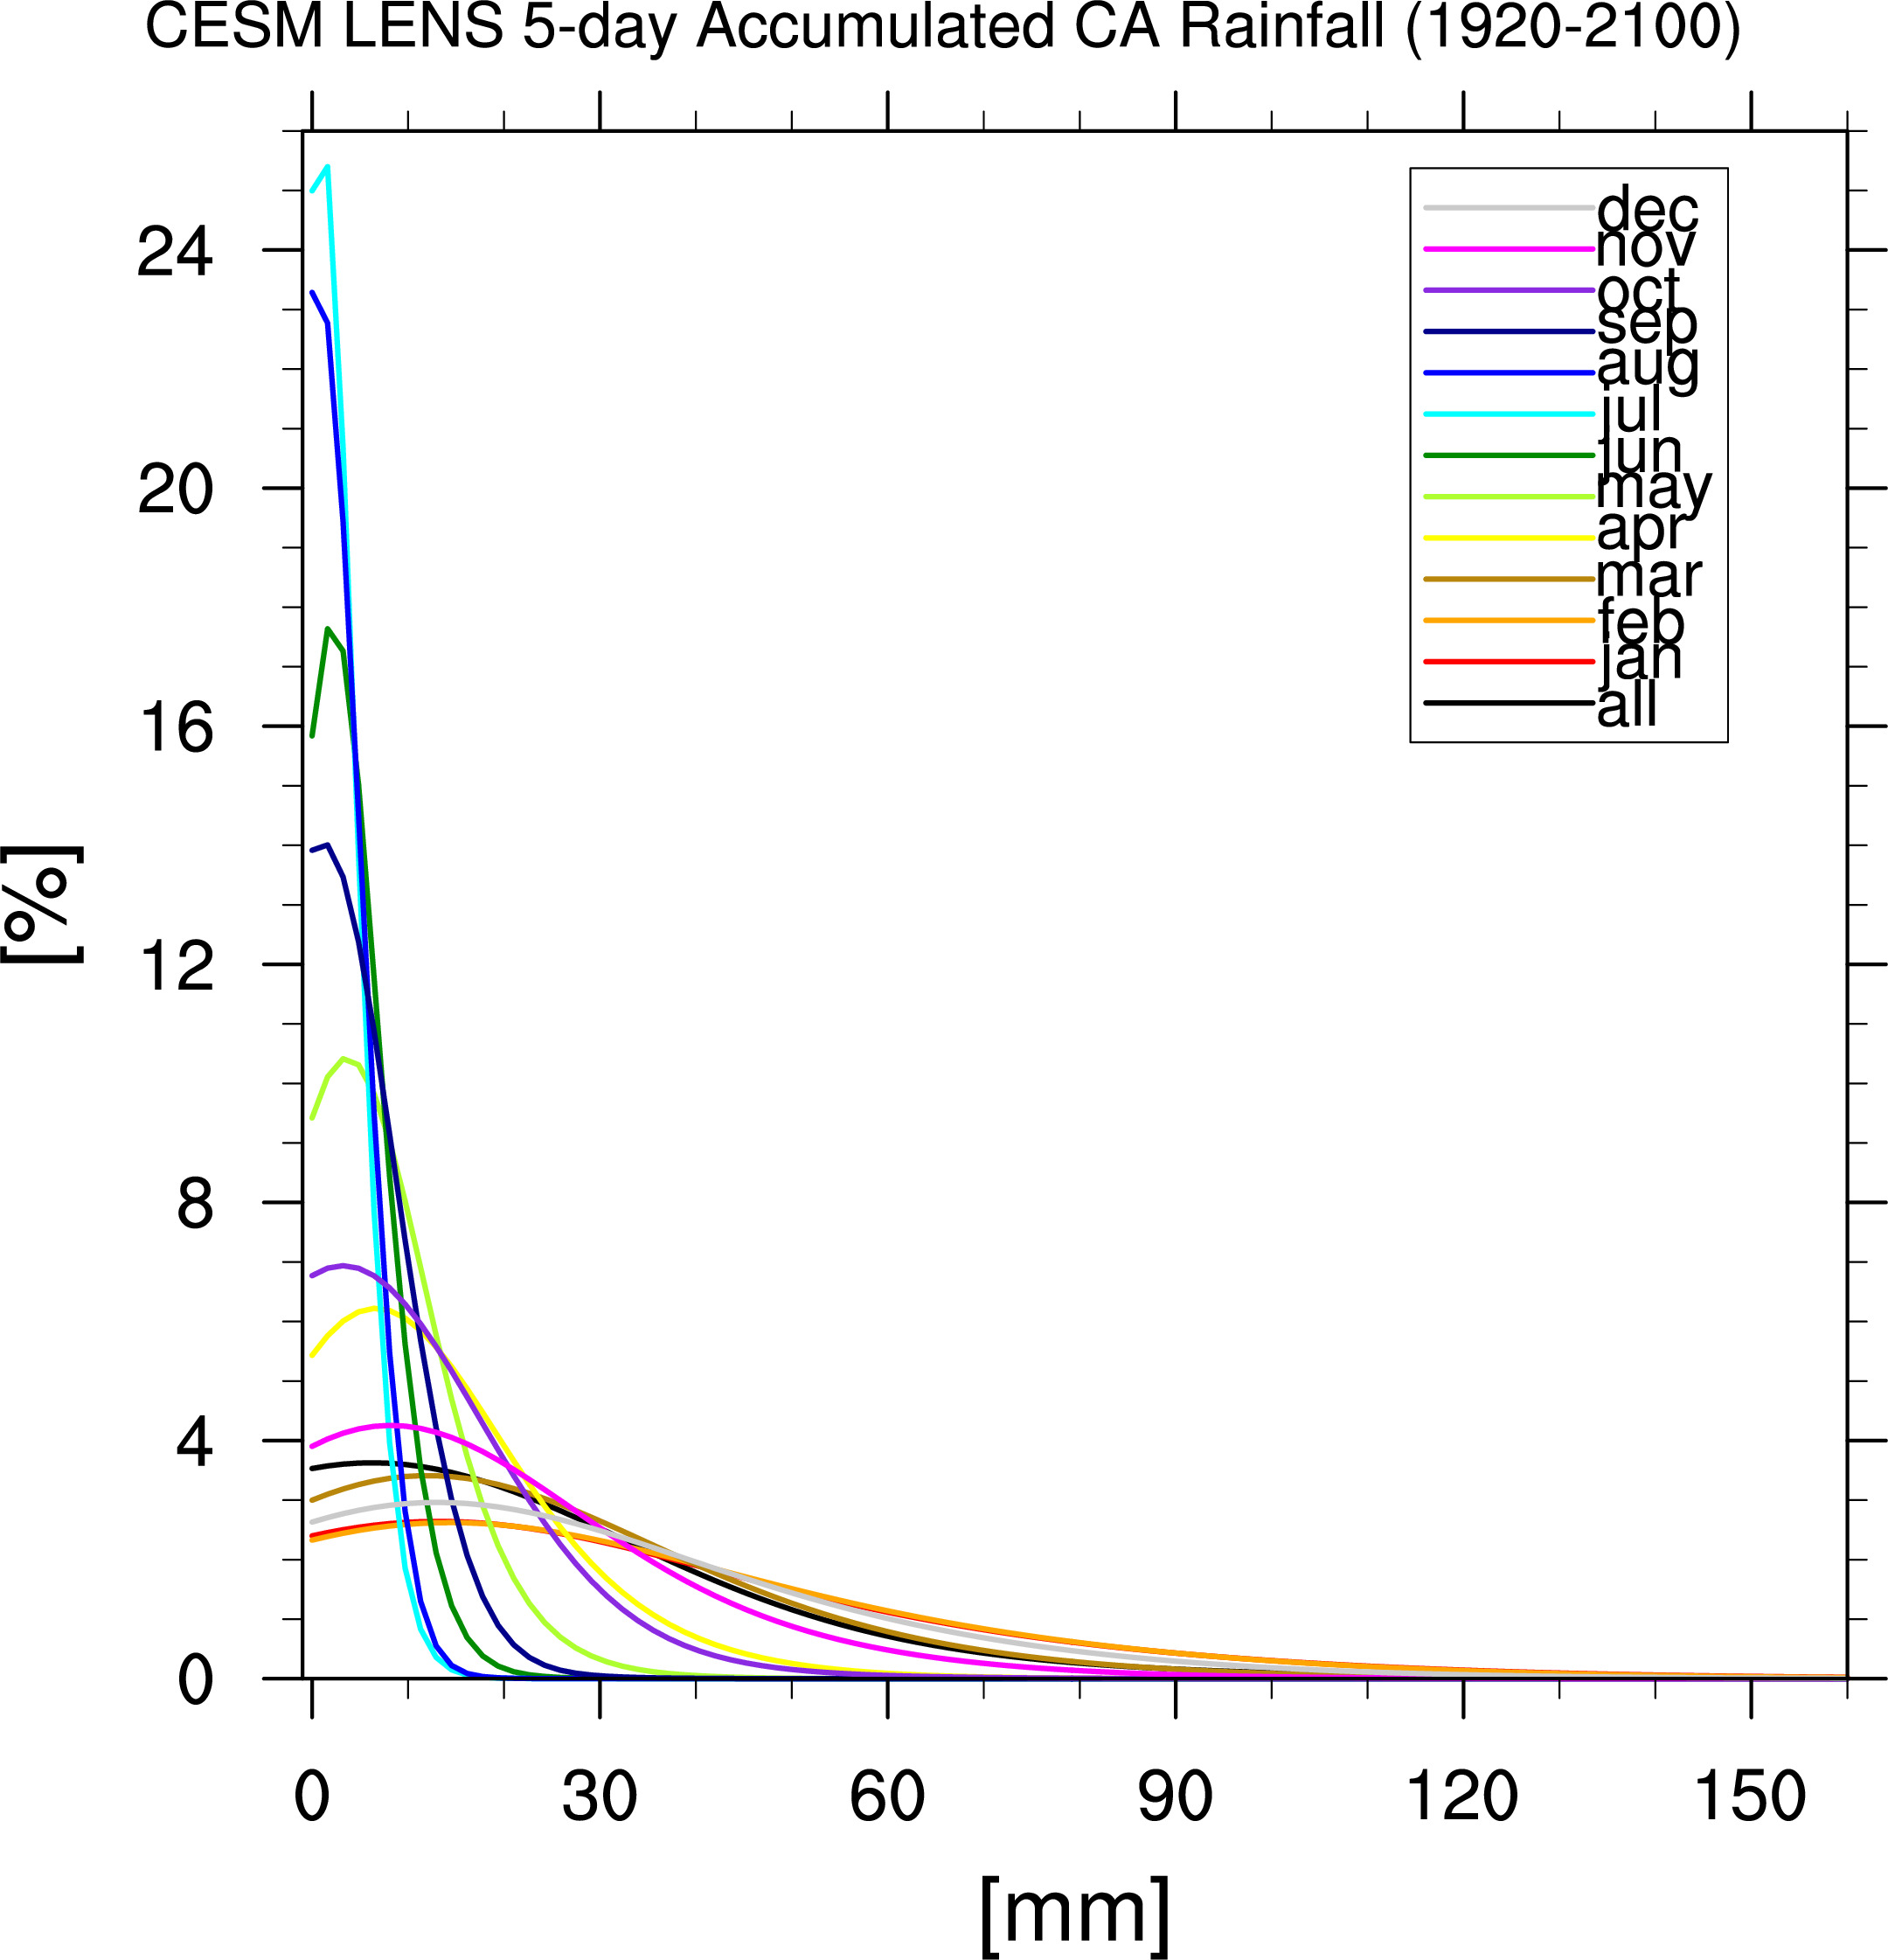
Above, black curve = 181 years x 365 days/yr x 40 runs = 2,642,600 data points
Colored curves = 181 years x ~30days/month x 40 runs = 217,200 data points
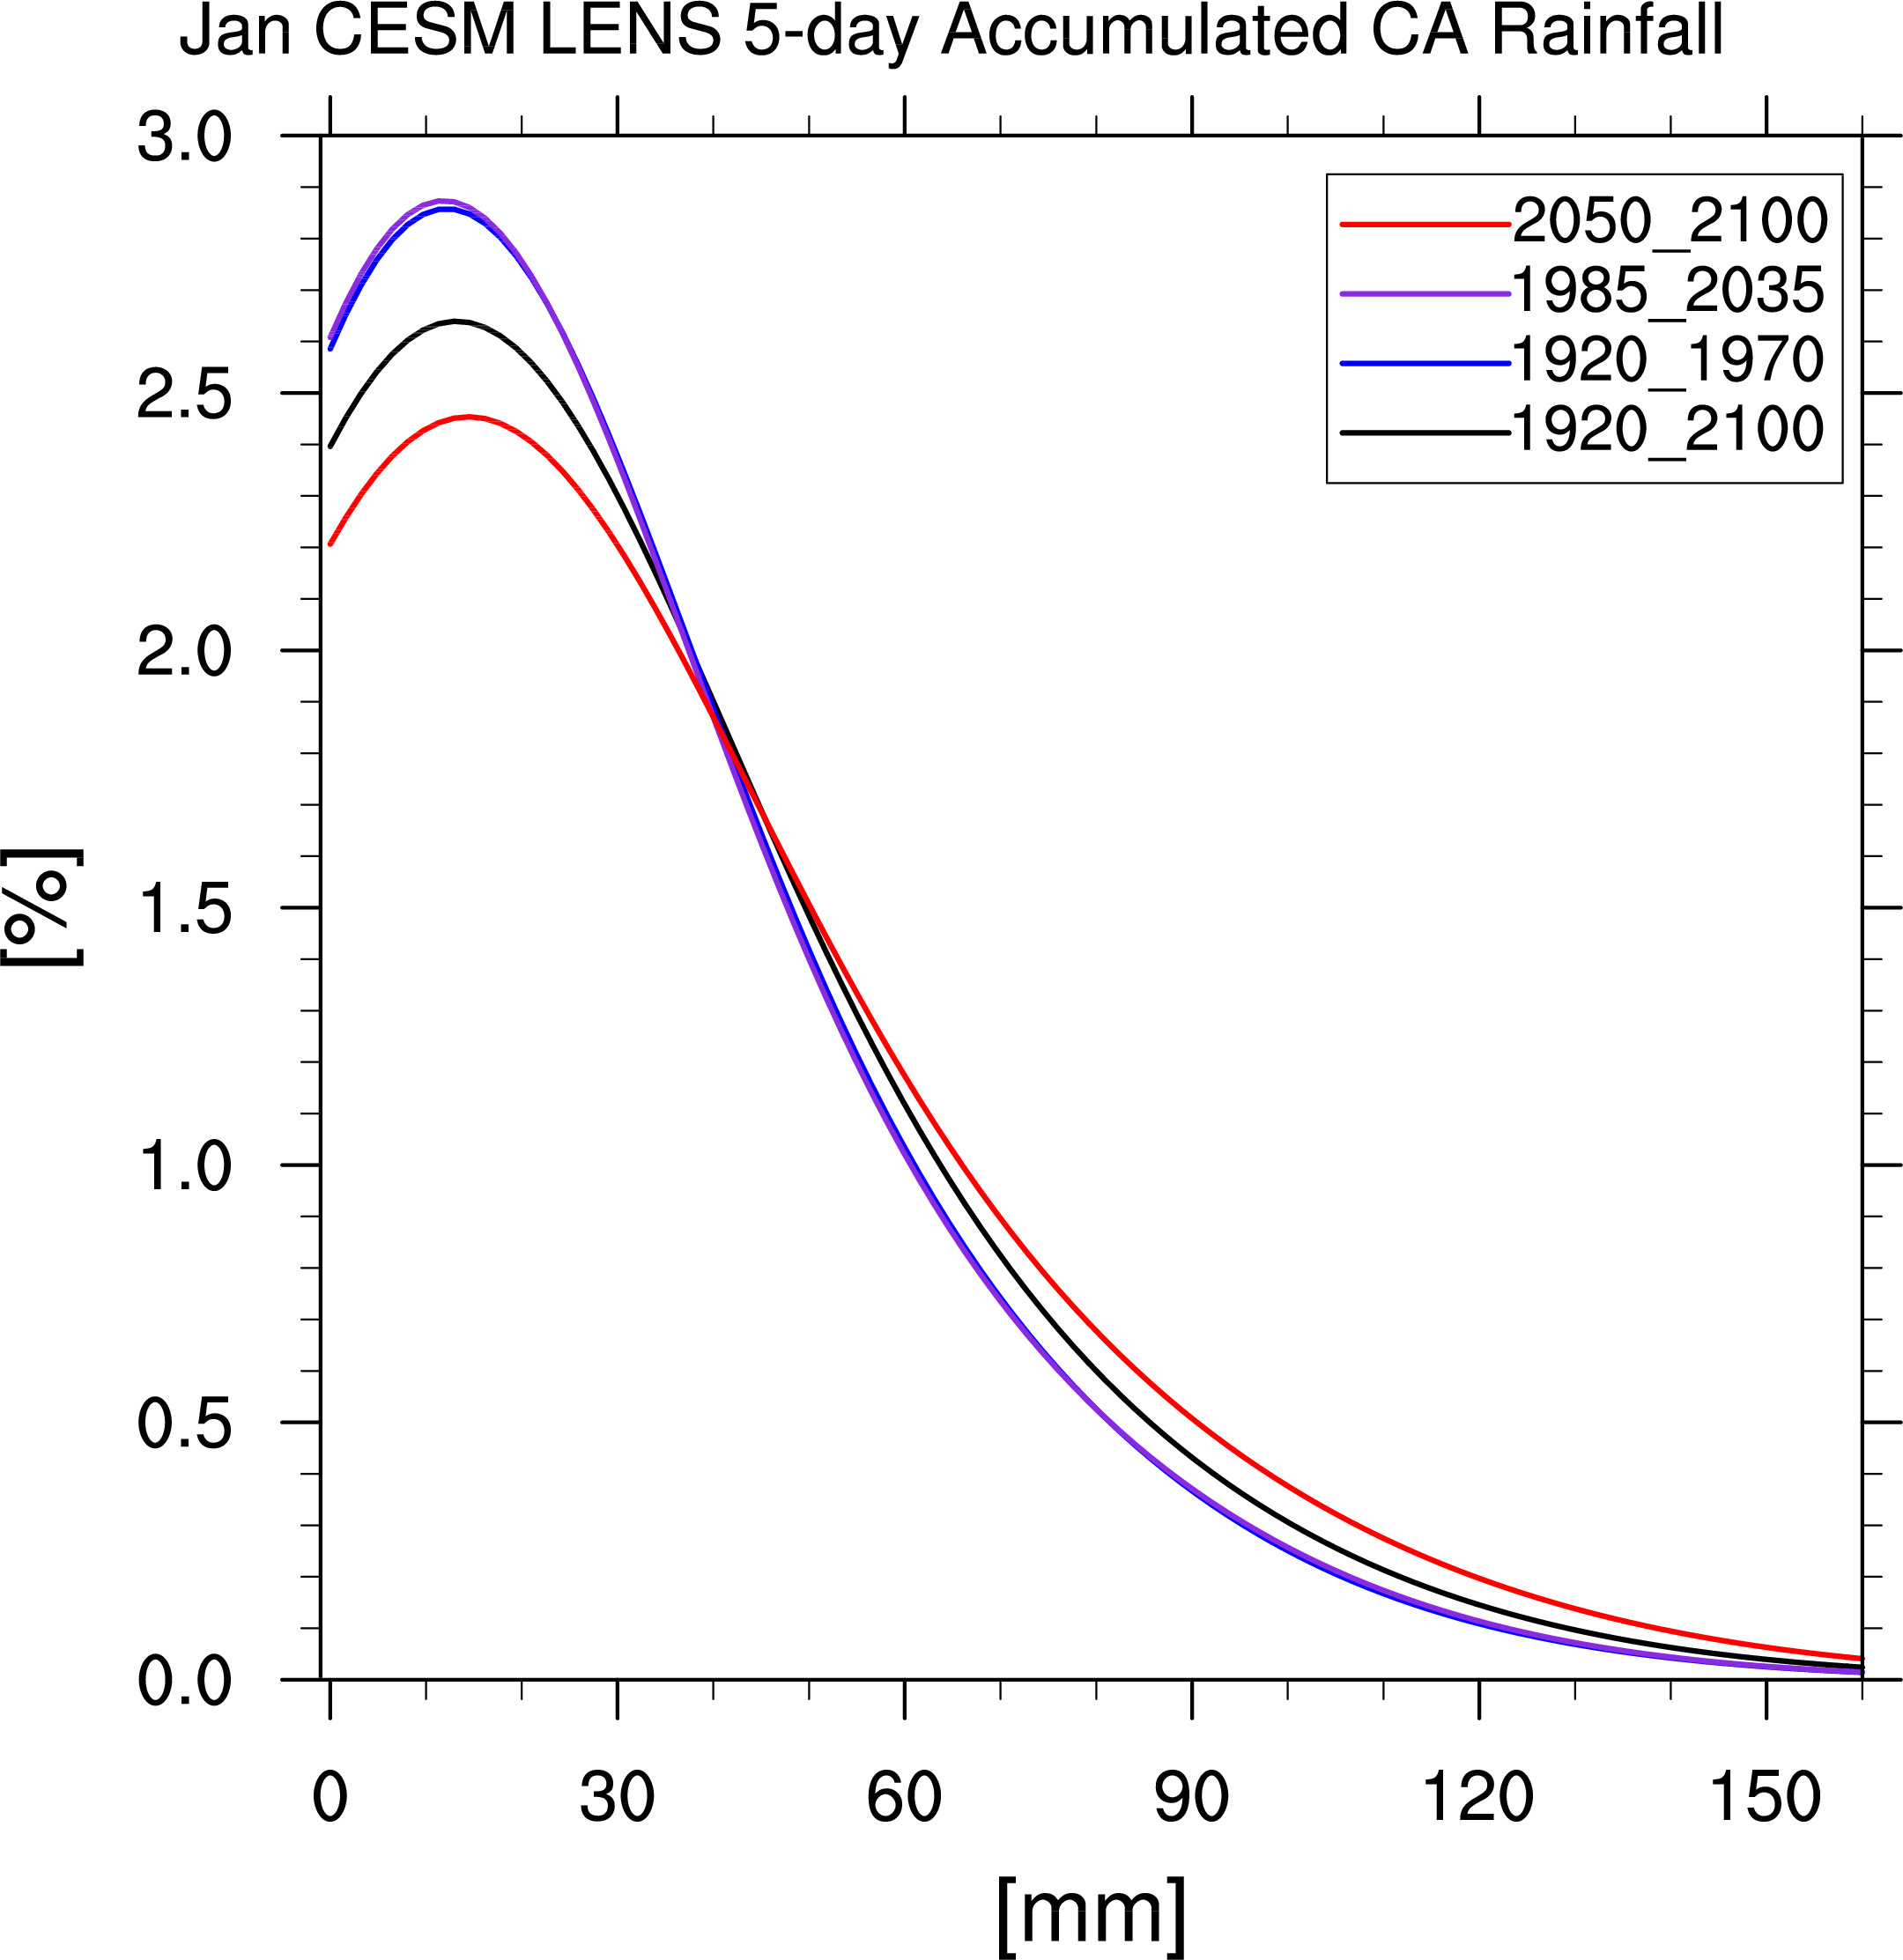
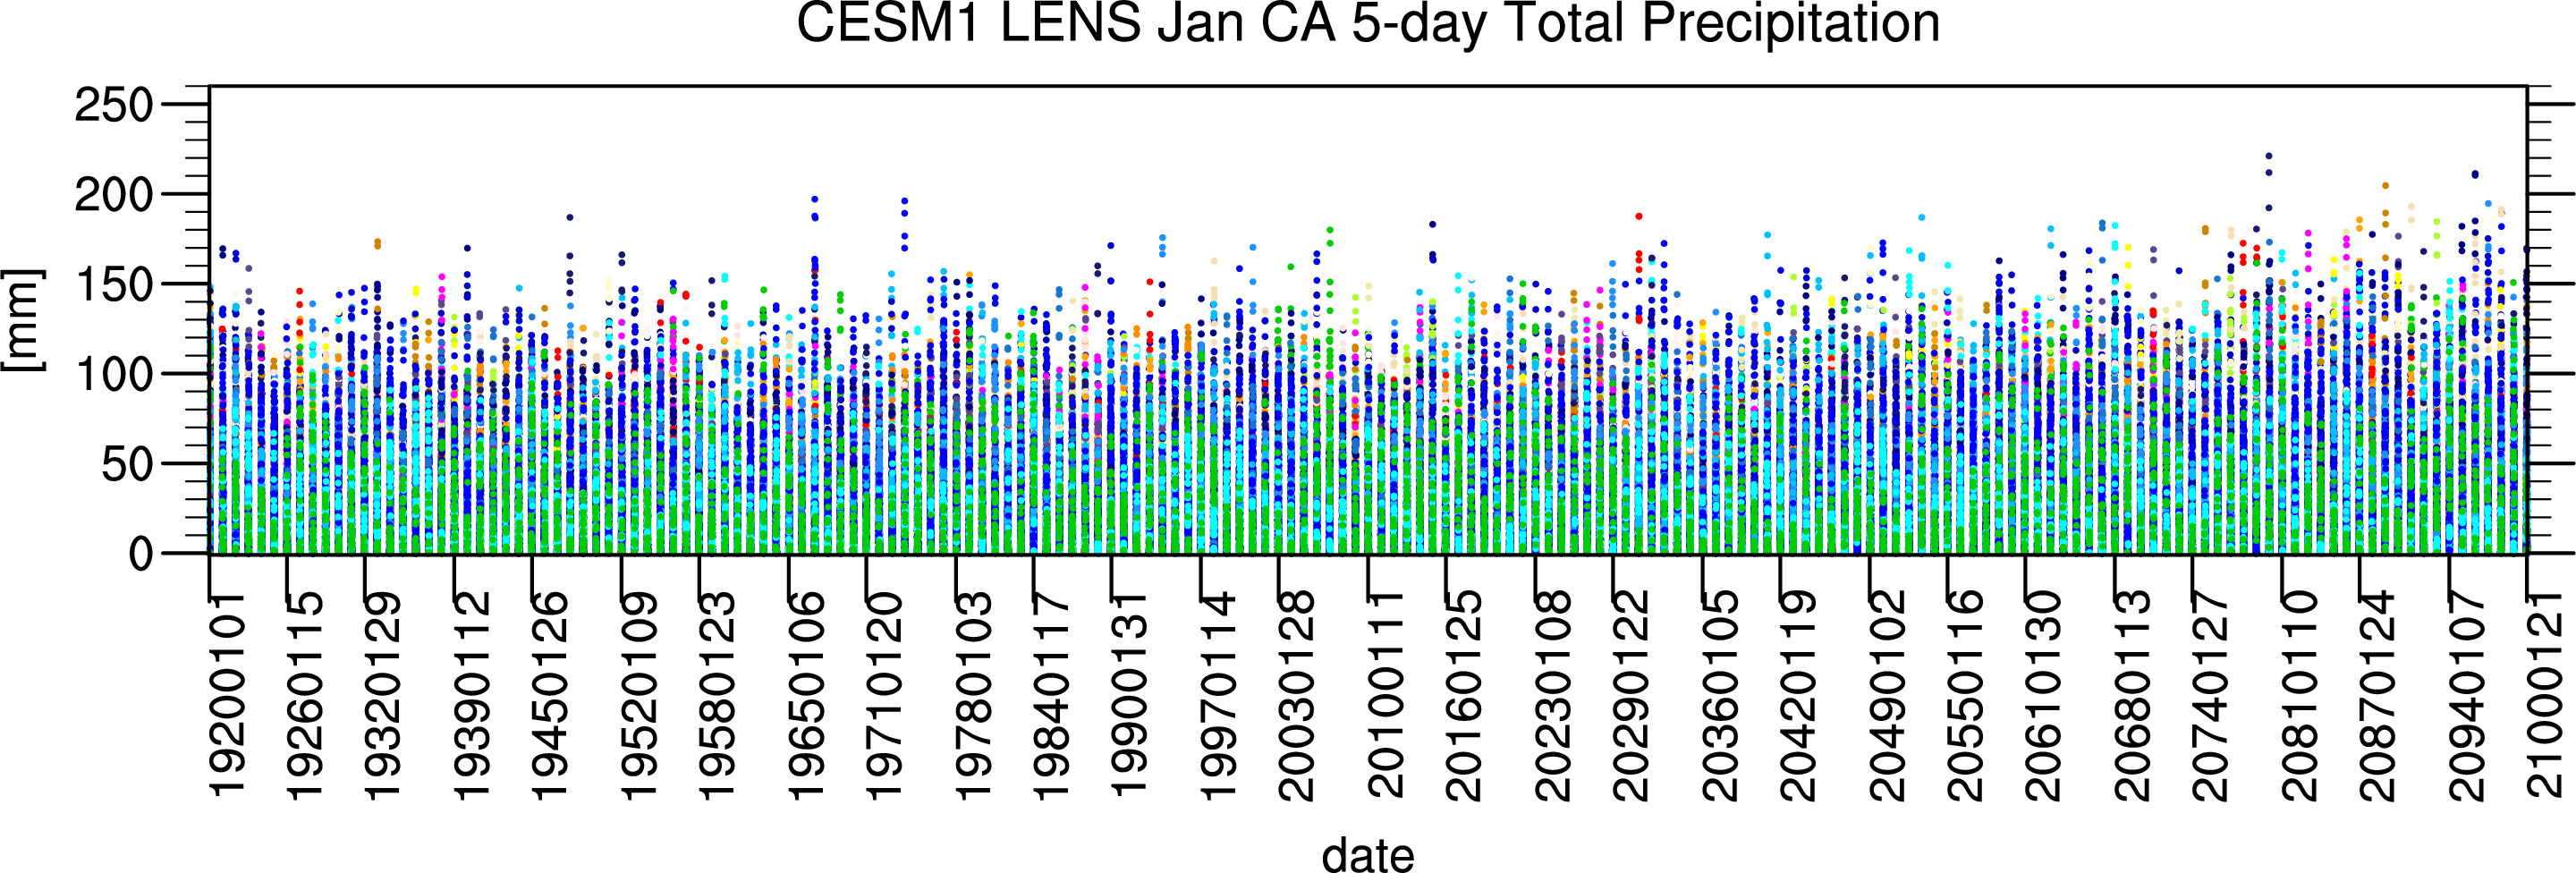
Above, black curve = 181 years x 31 days/month x 40 runs = 217,200 data points
Colored curves = 50 years x 31days/month x 40 runs = 62,000 data points
----------------------------------------------------------------------------------------------------------
-------------------------------------------------------------------
Other Models
-----------------------------------------------------------------------------------------------------------------------------------
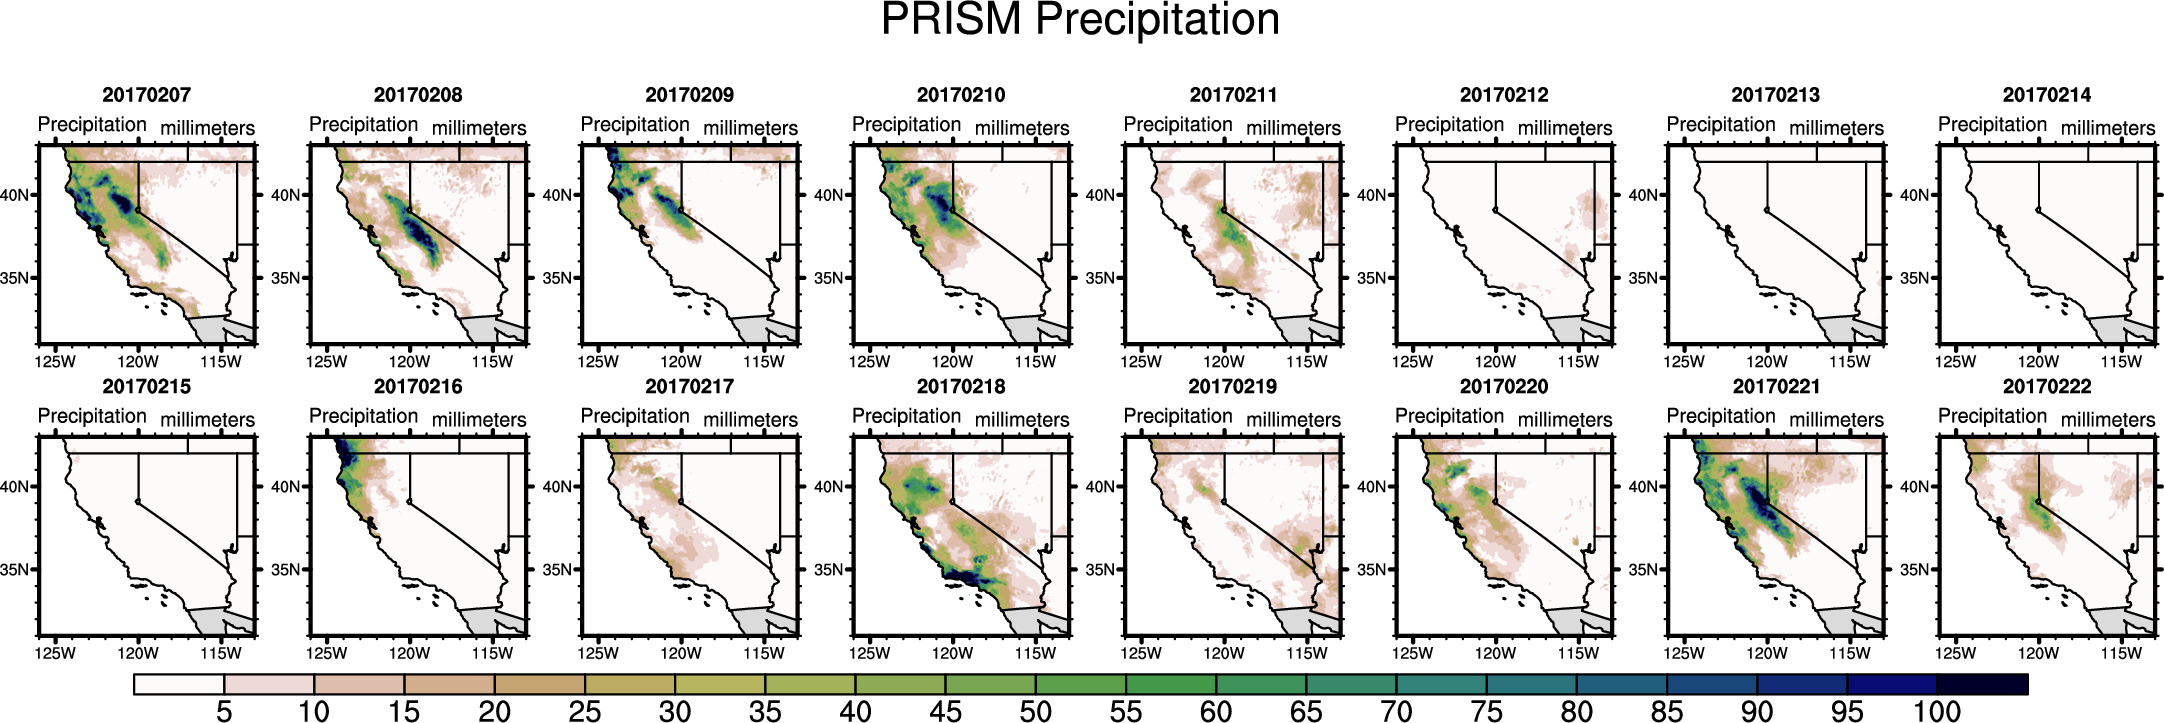
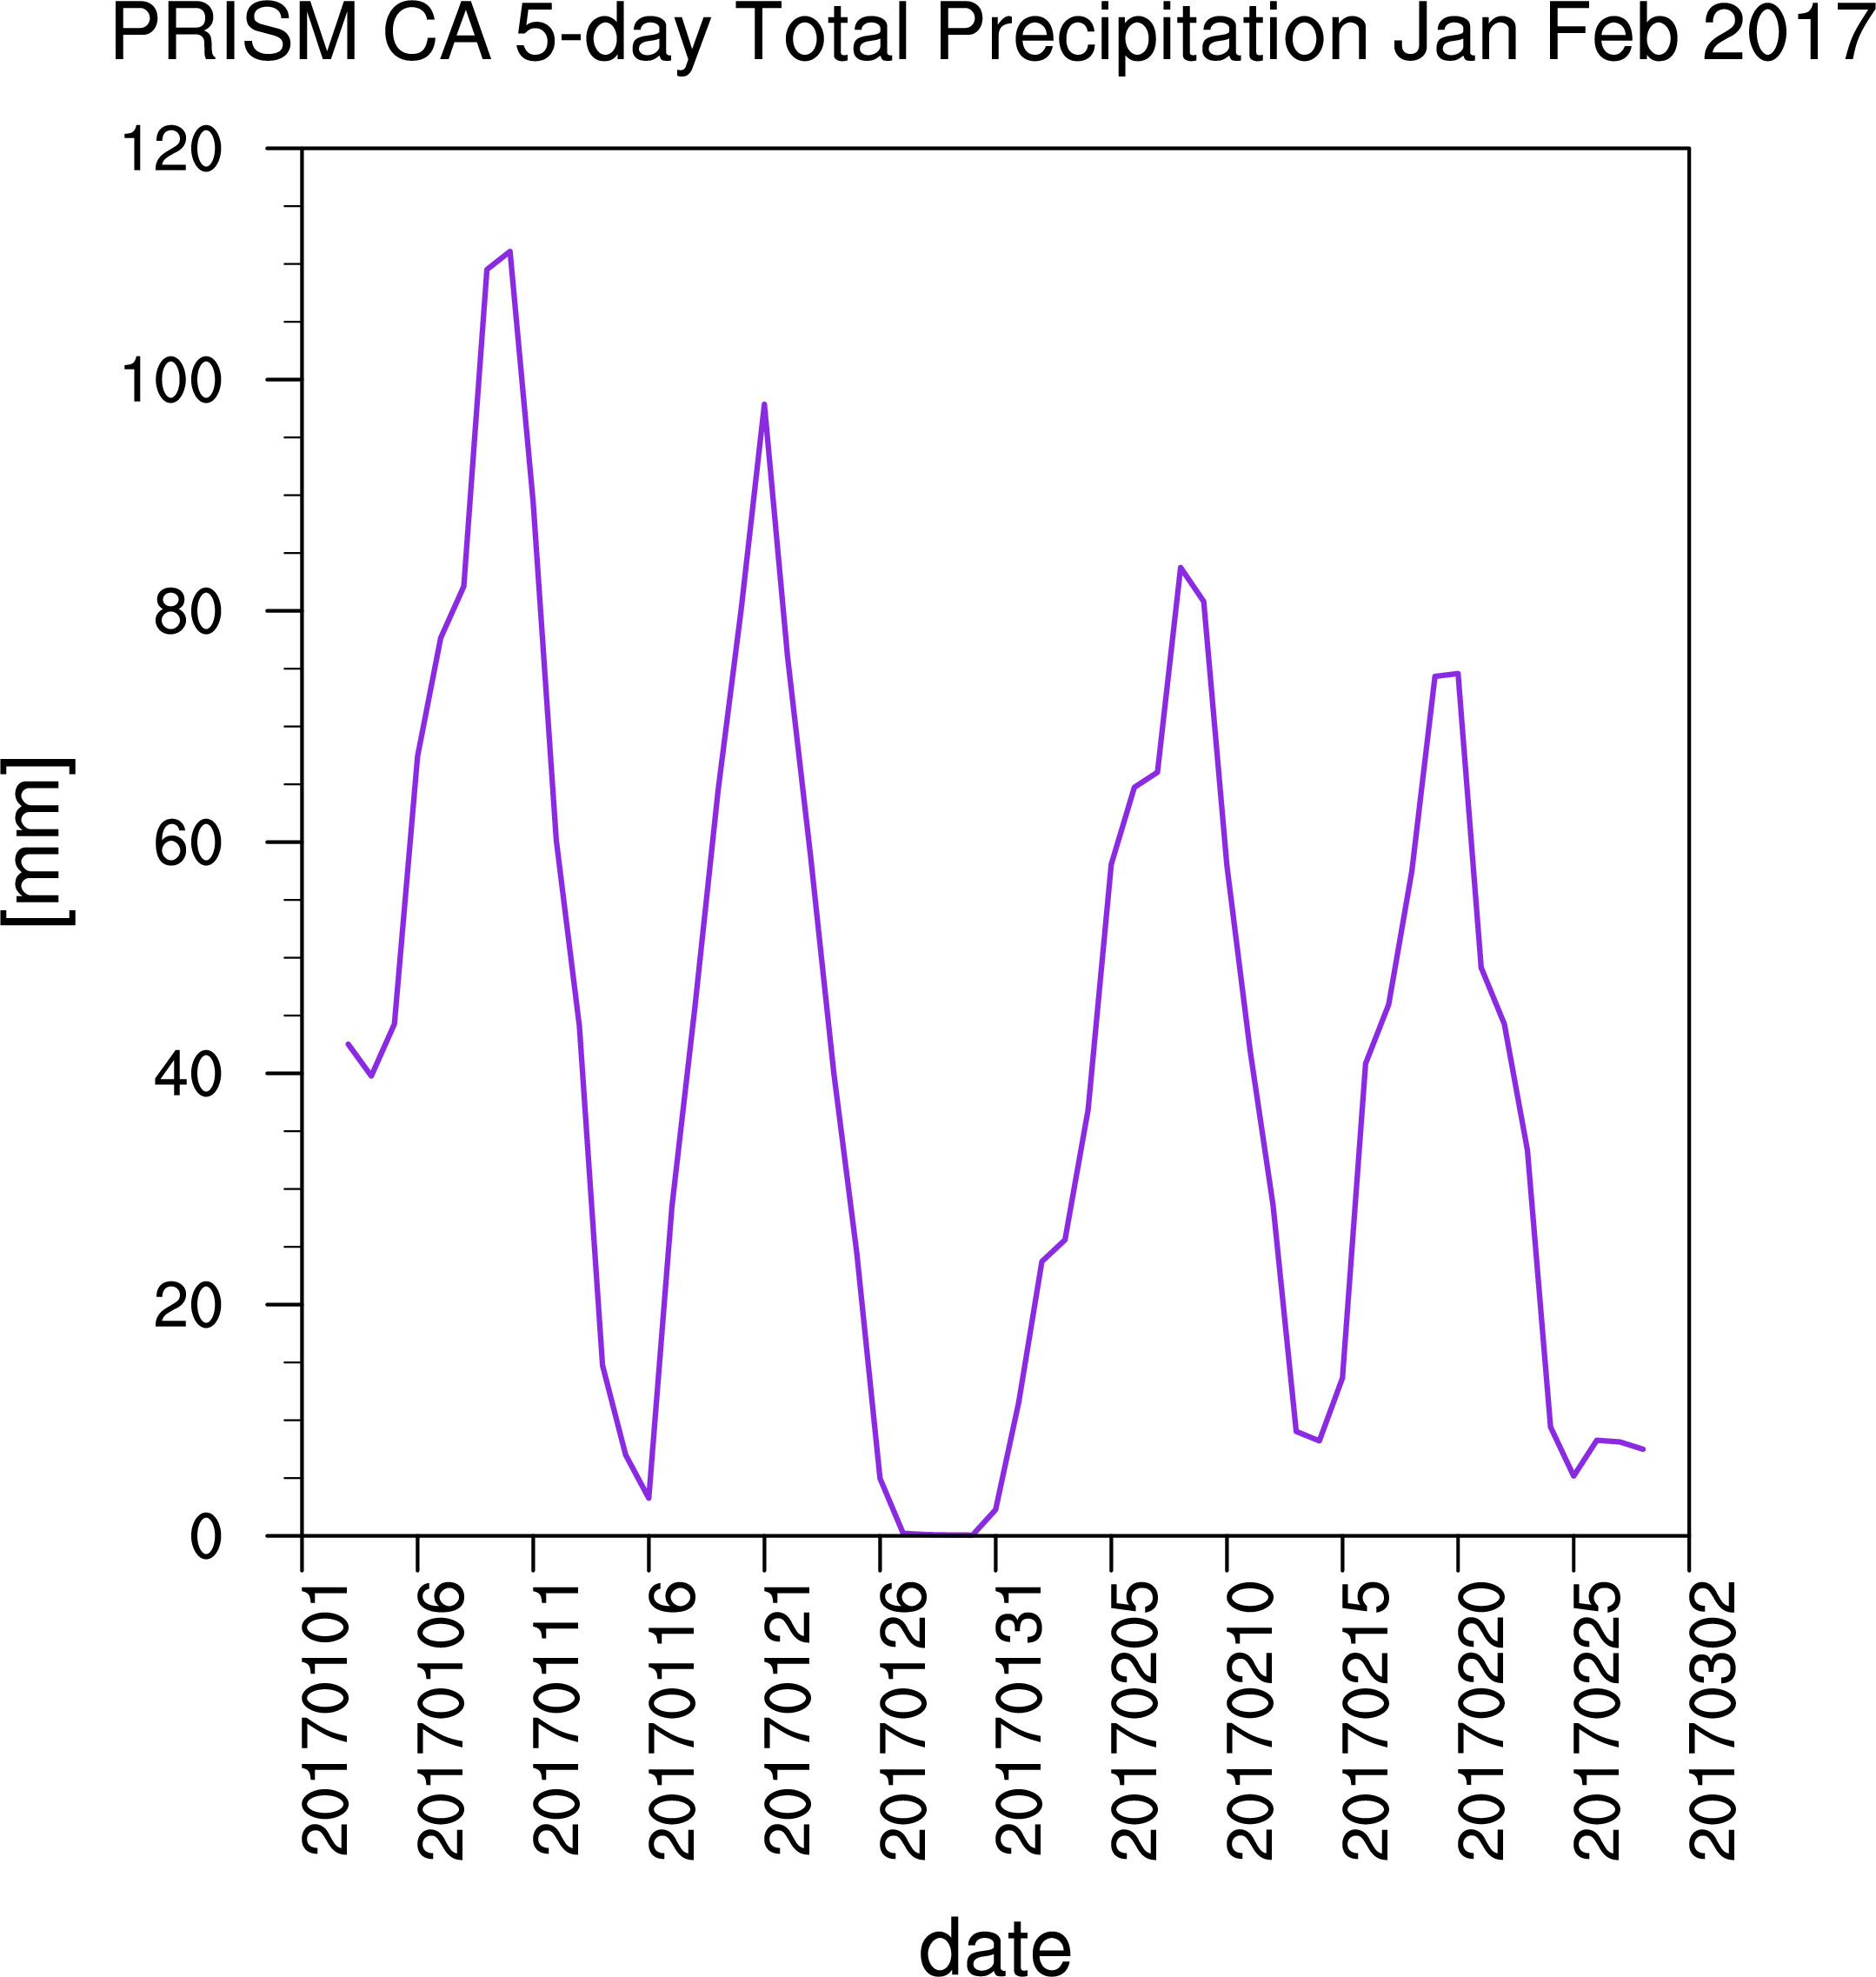
PRISM Data
-----------------------------------------------------------------------------------------------------------------------------------
winter 2016-2017 season
------------------------------------------------------------------------------------------------------------------------------------------------------------------------------------------------------------
analysis from 2014:
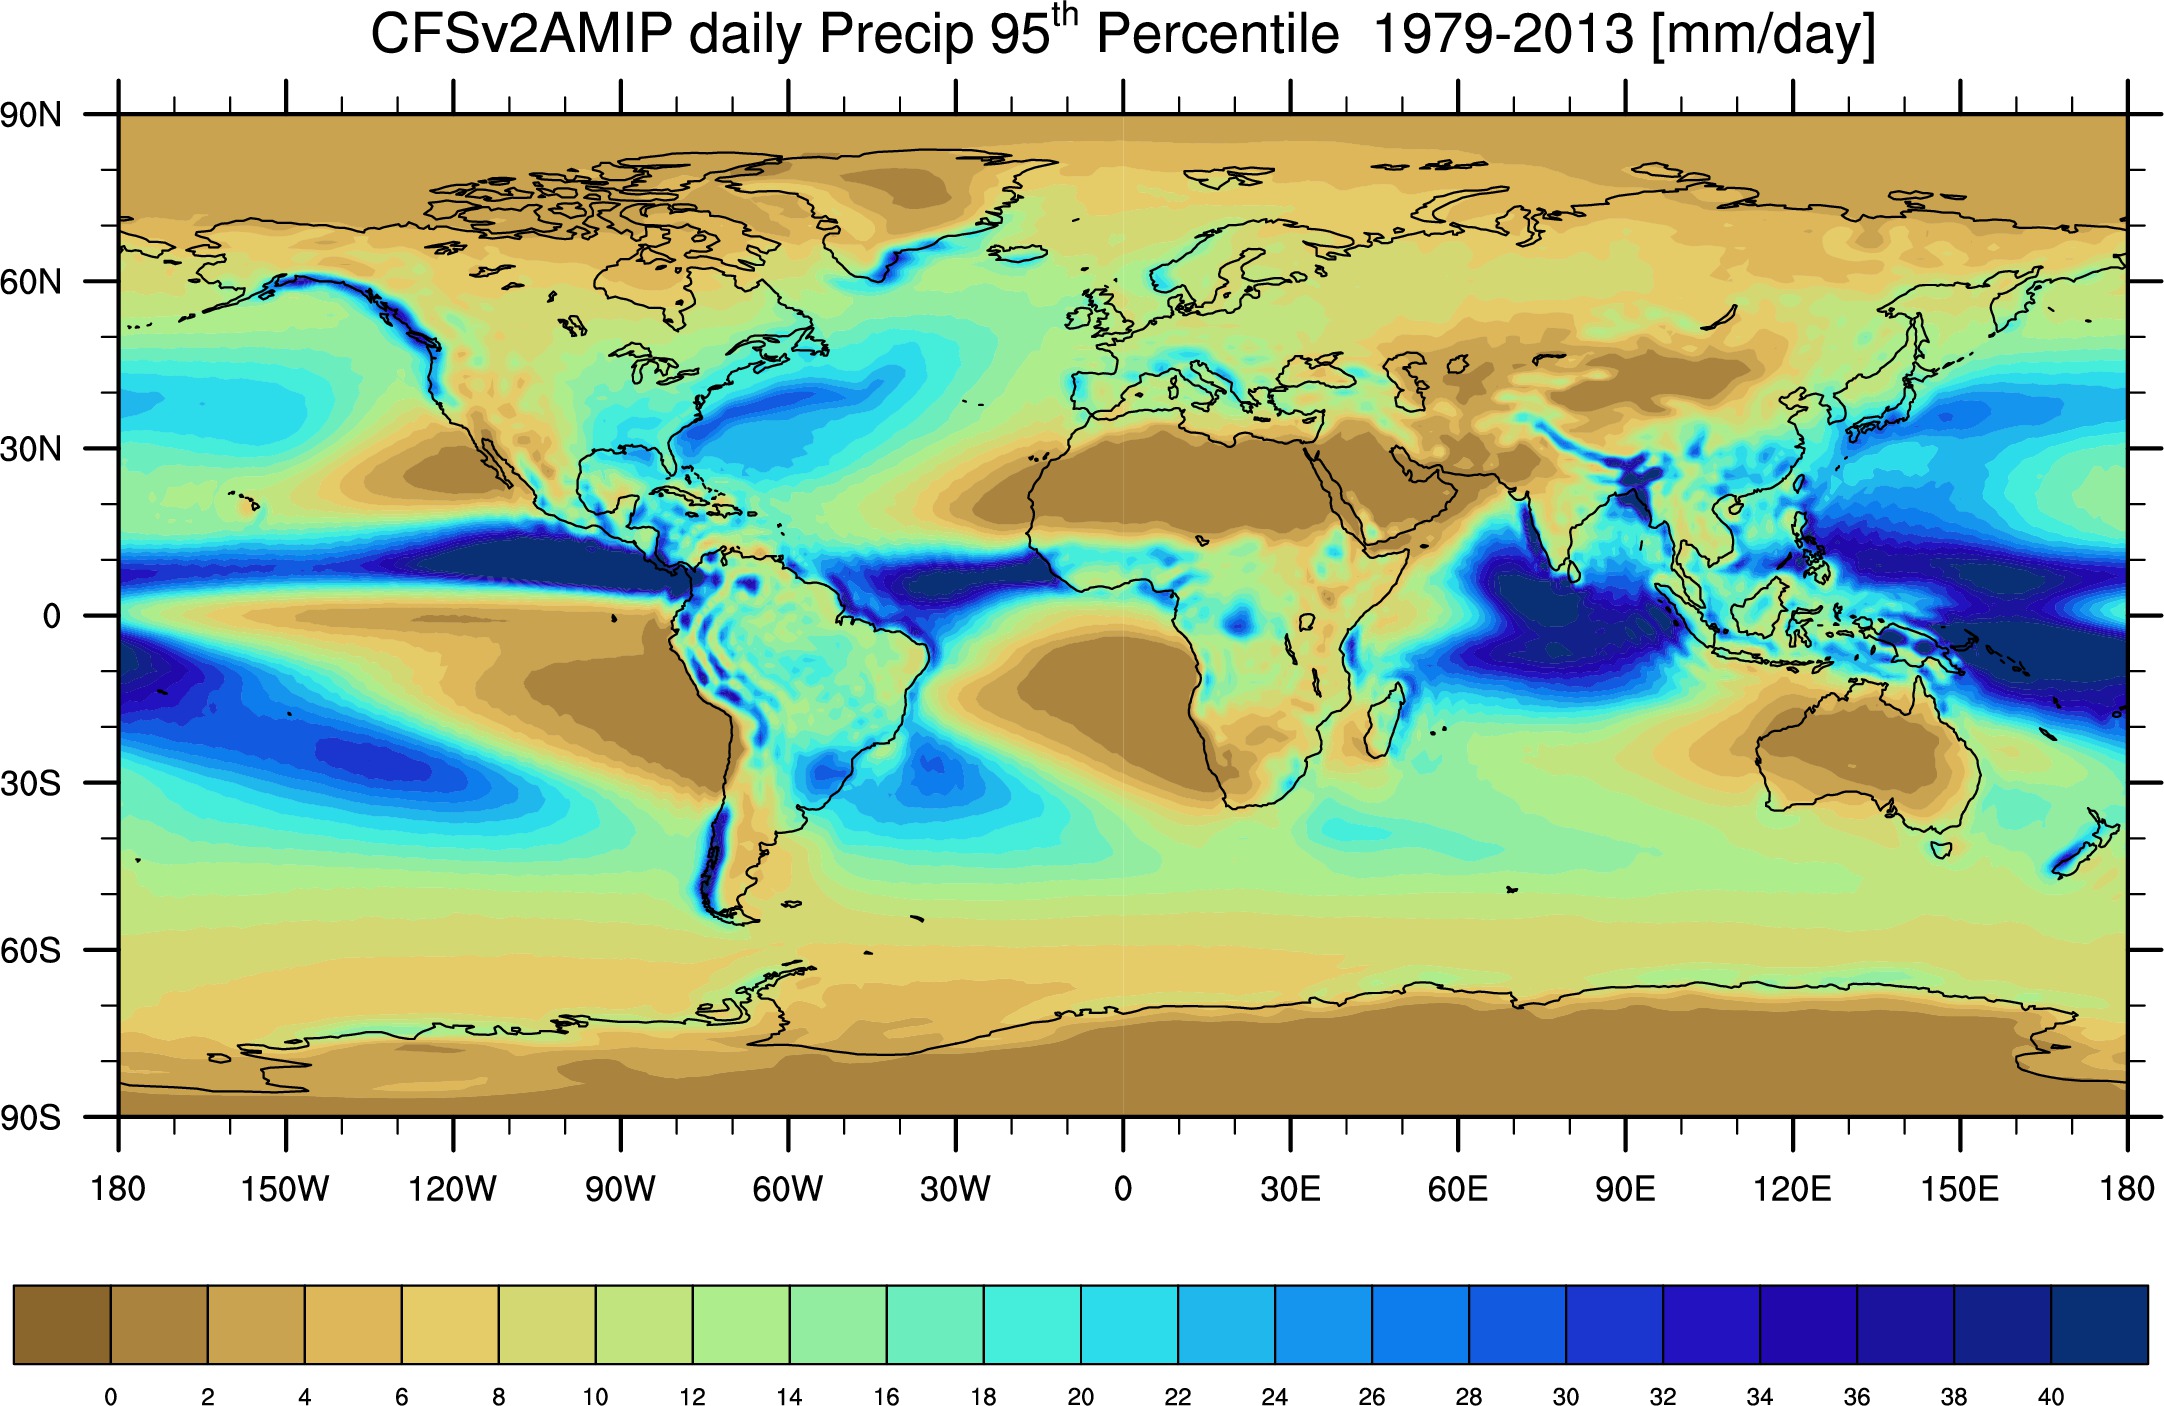
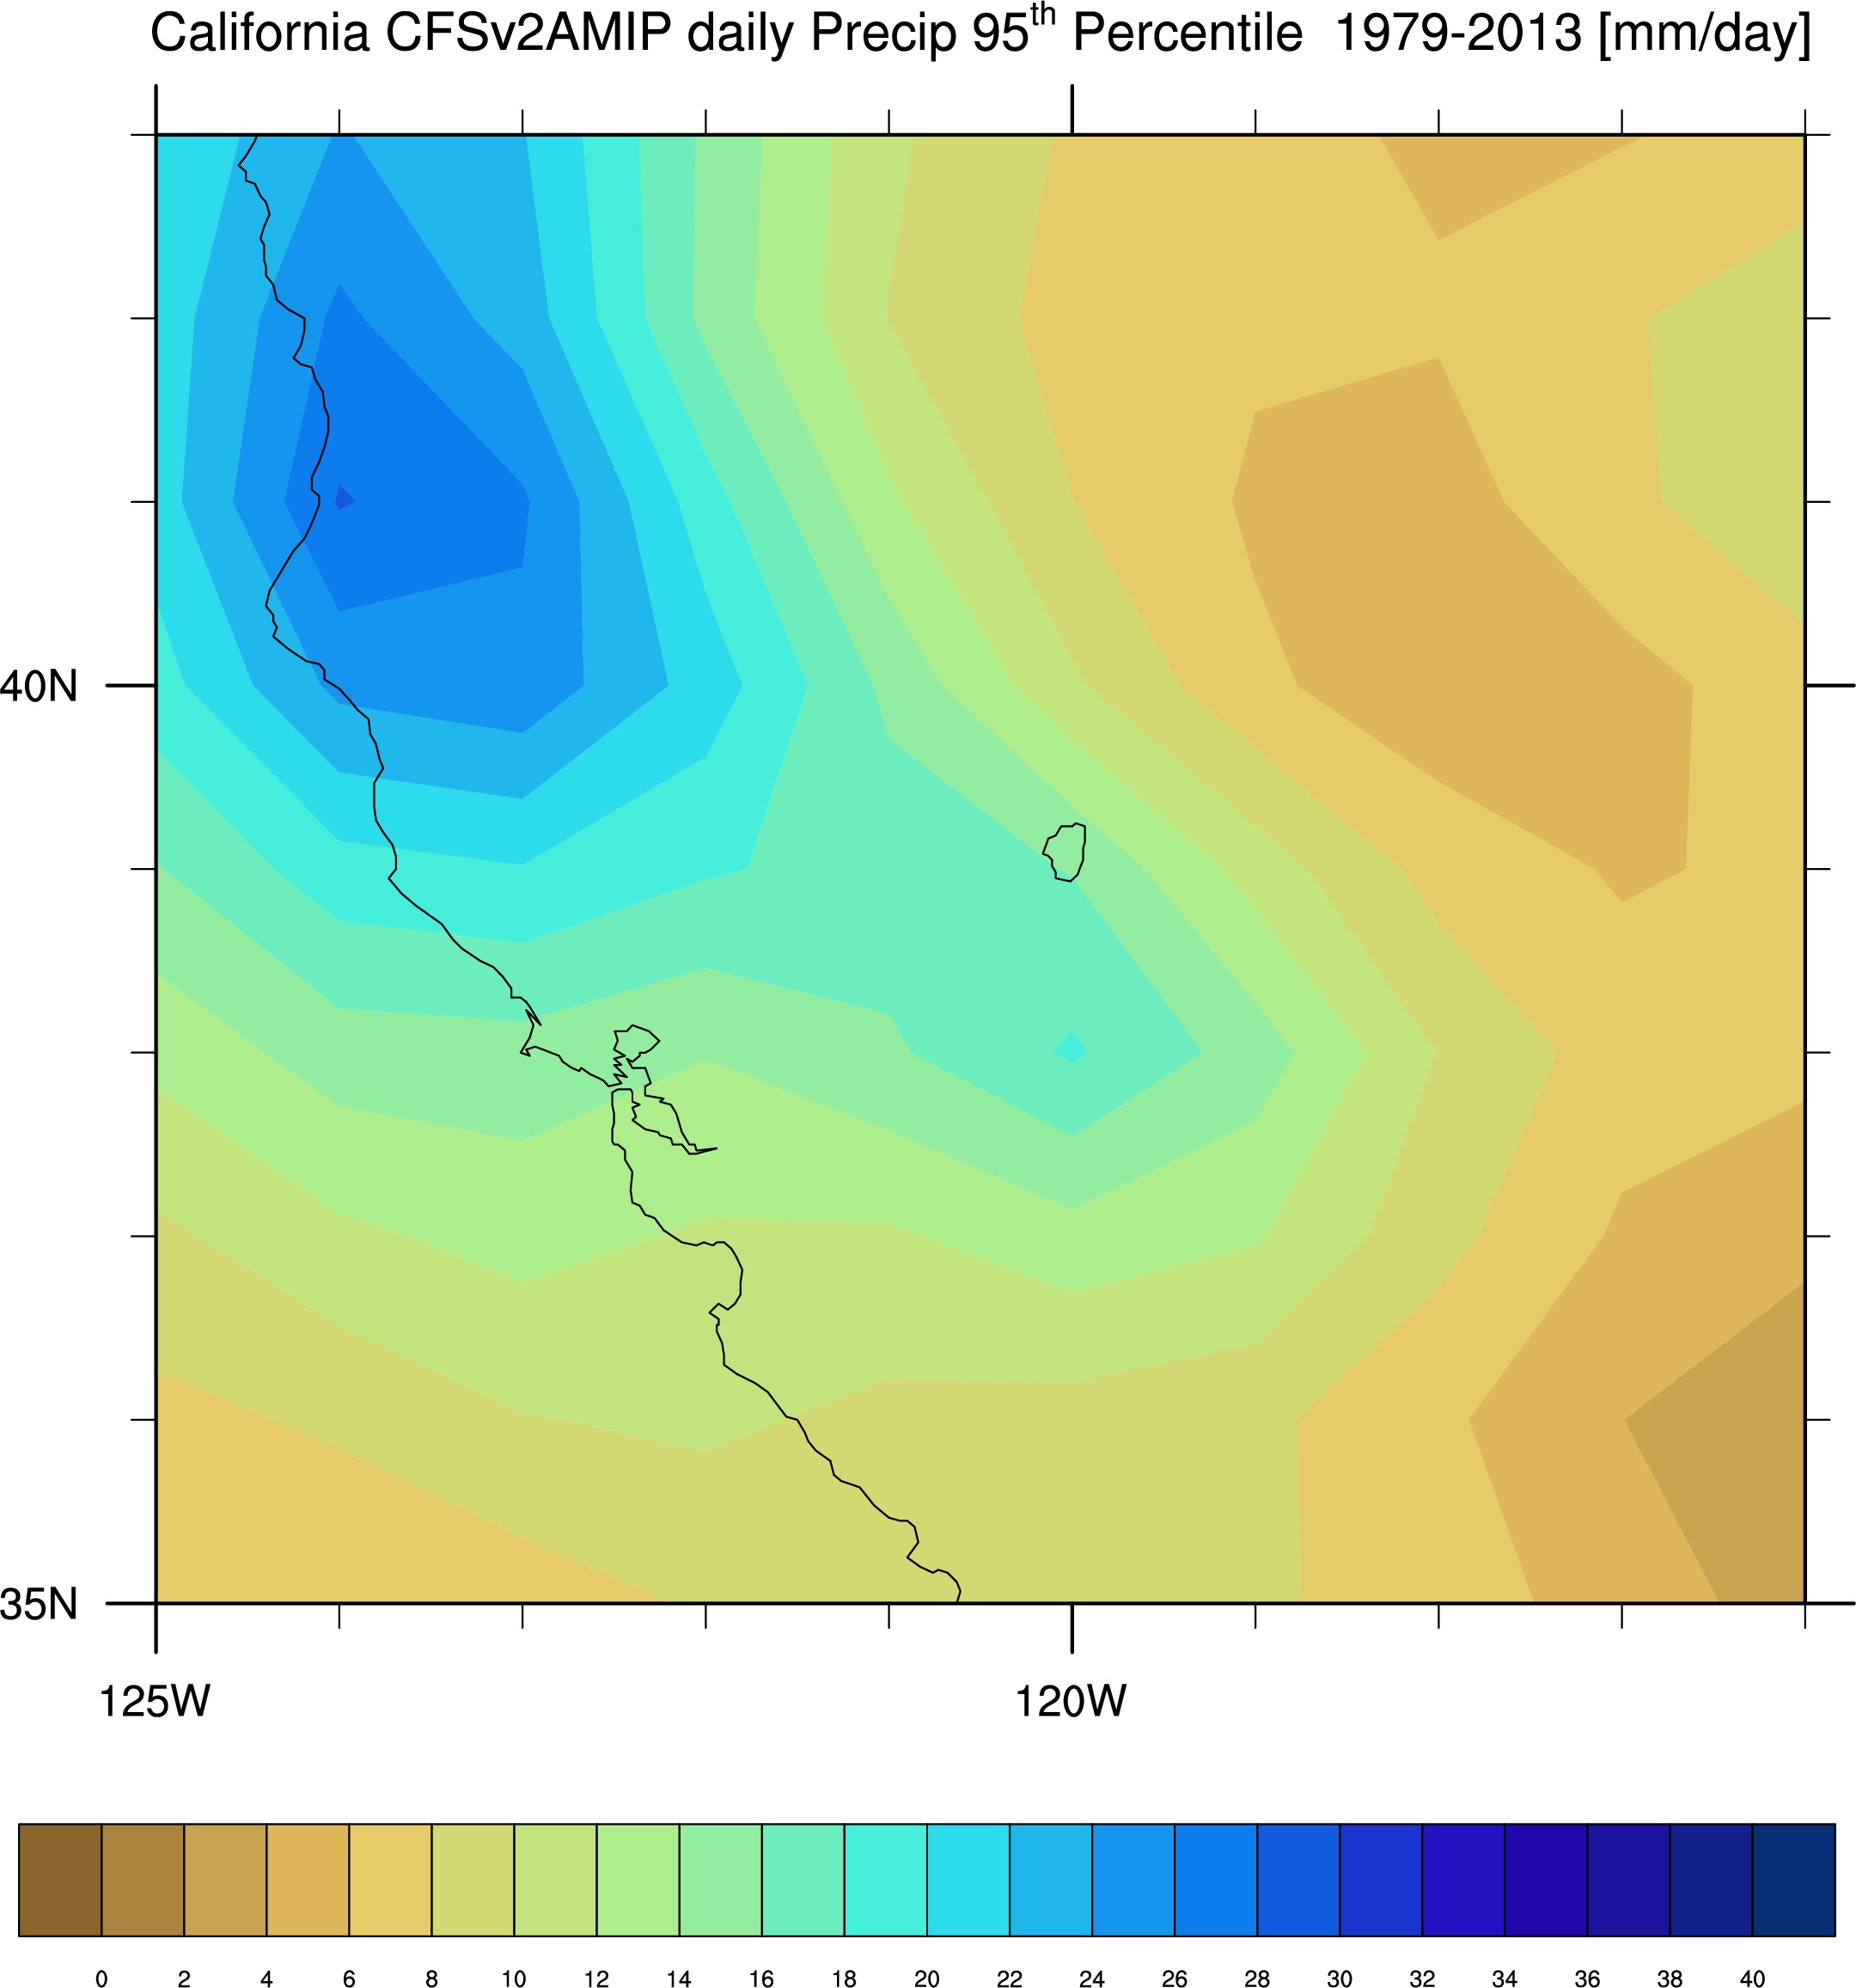
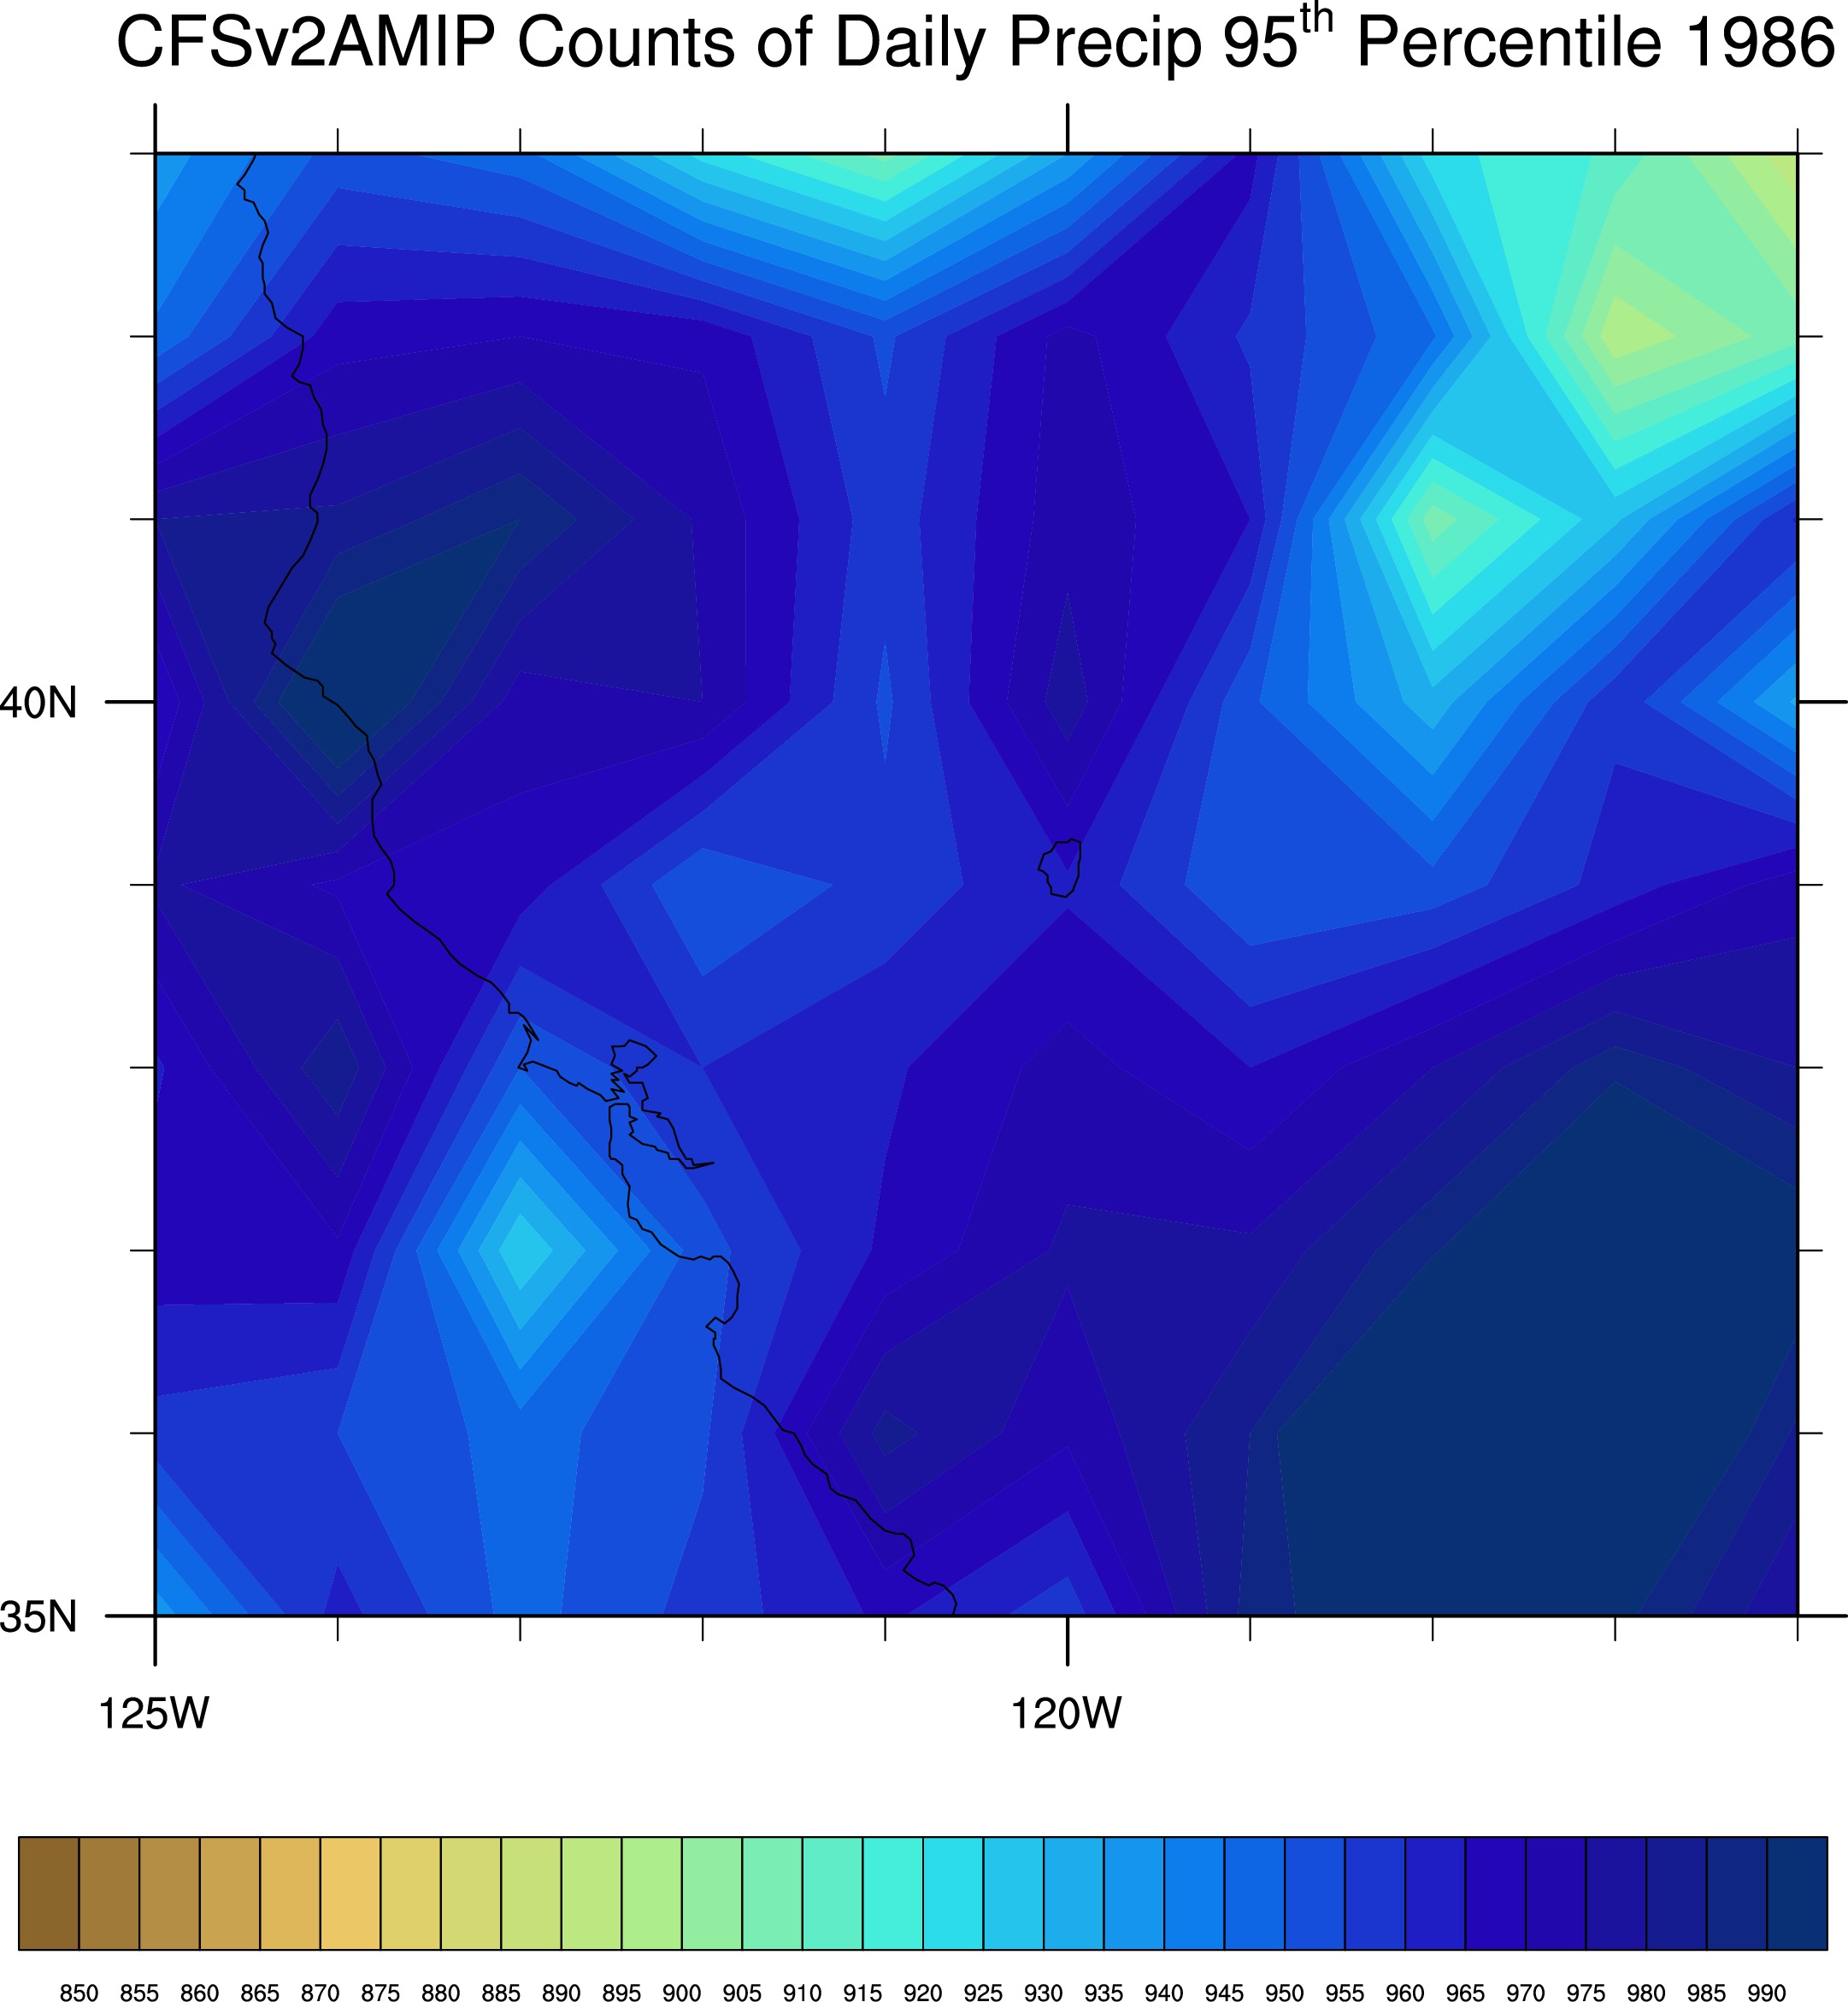
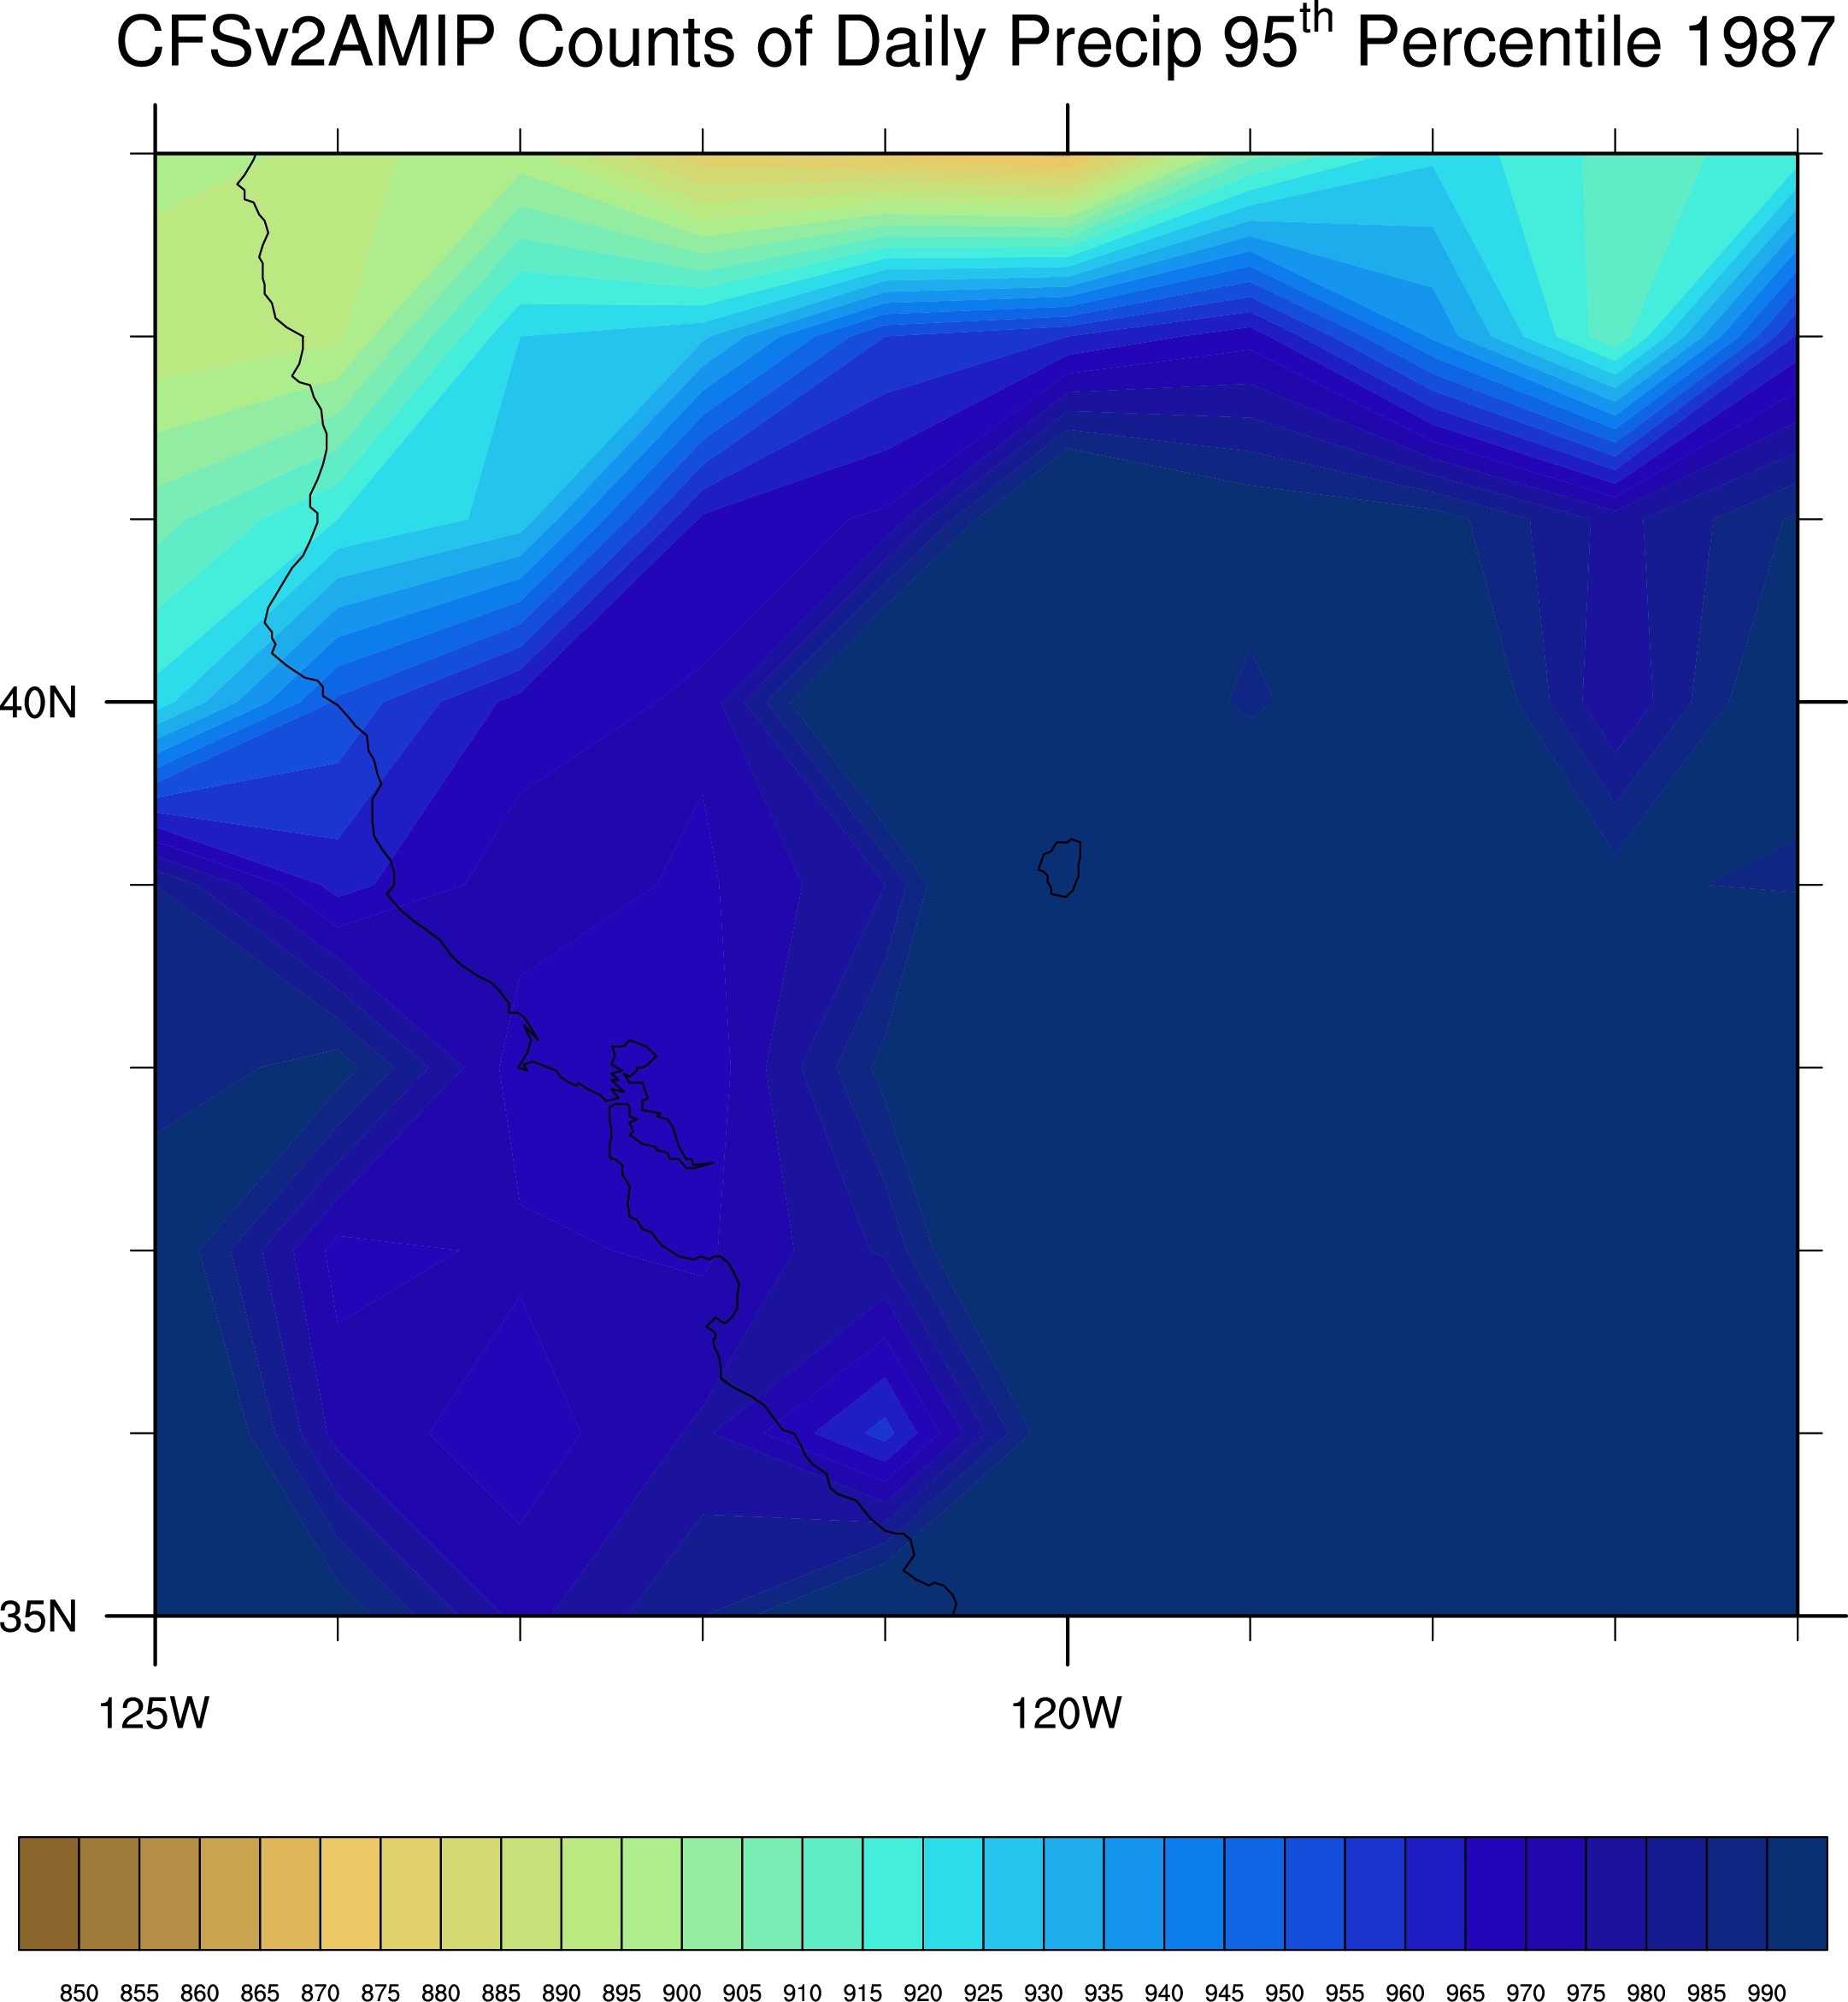
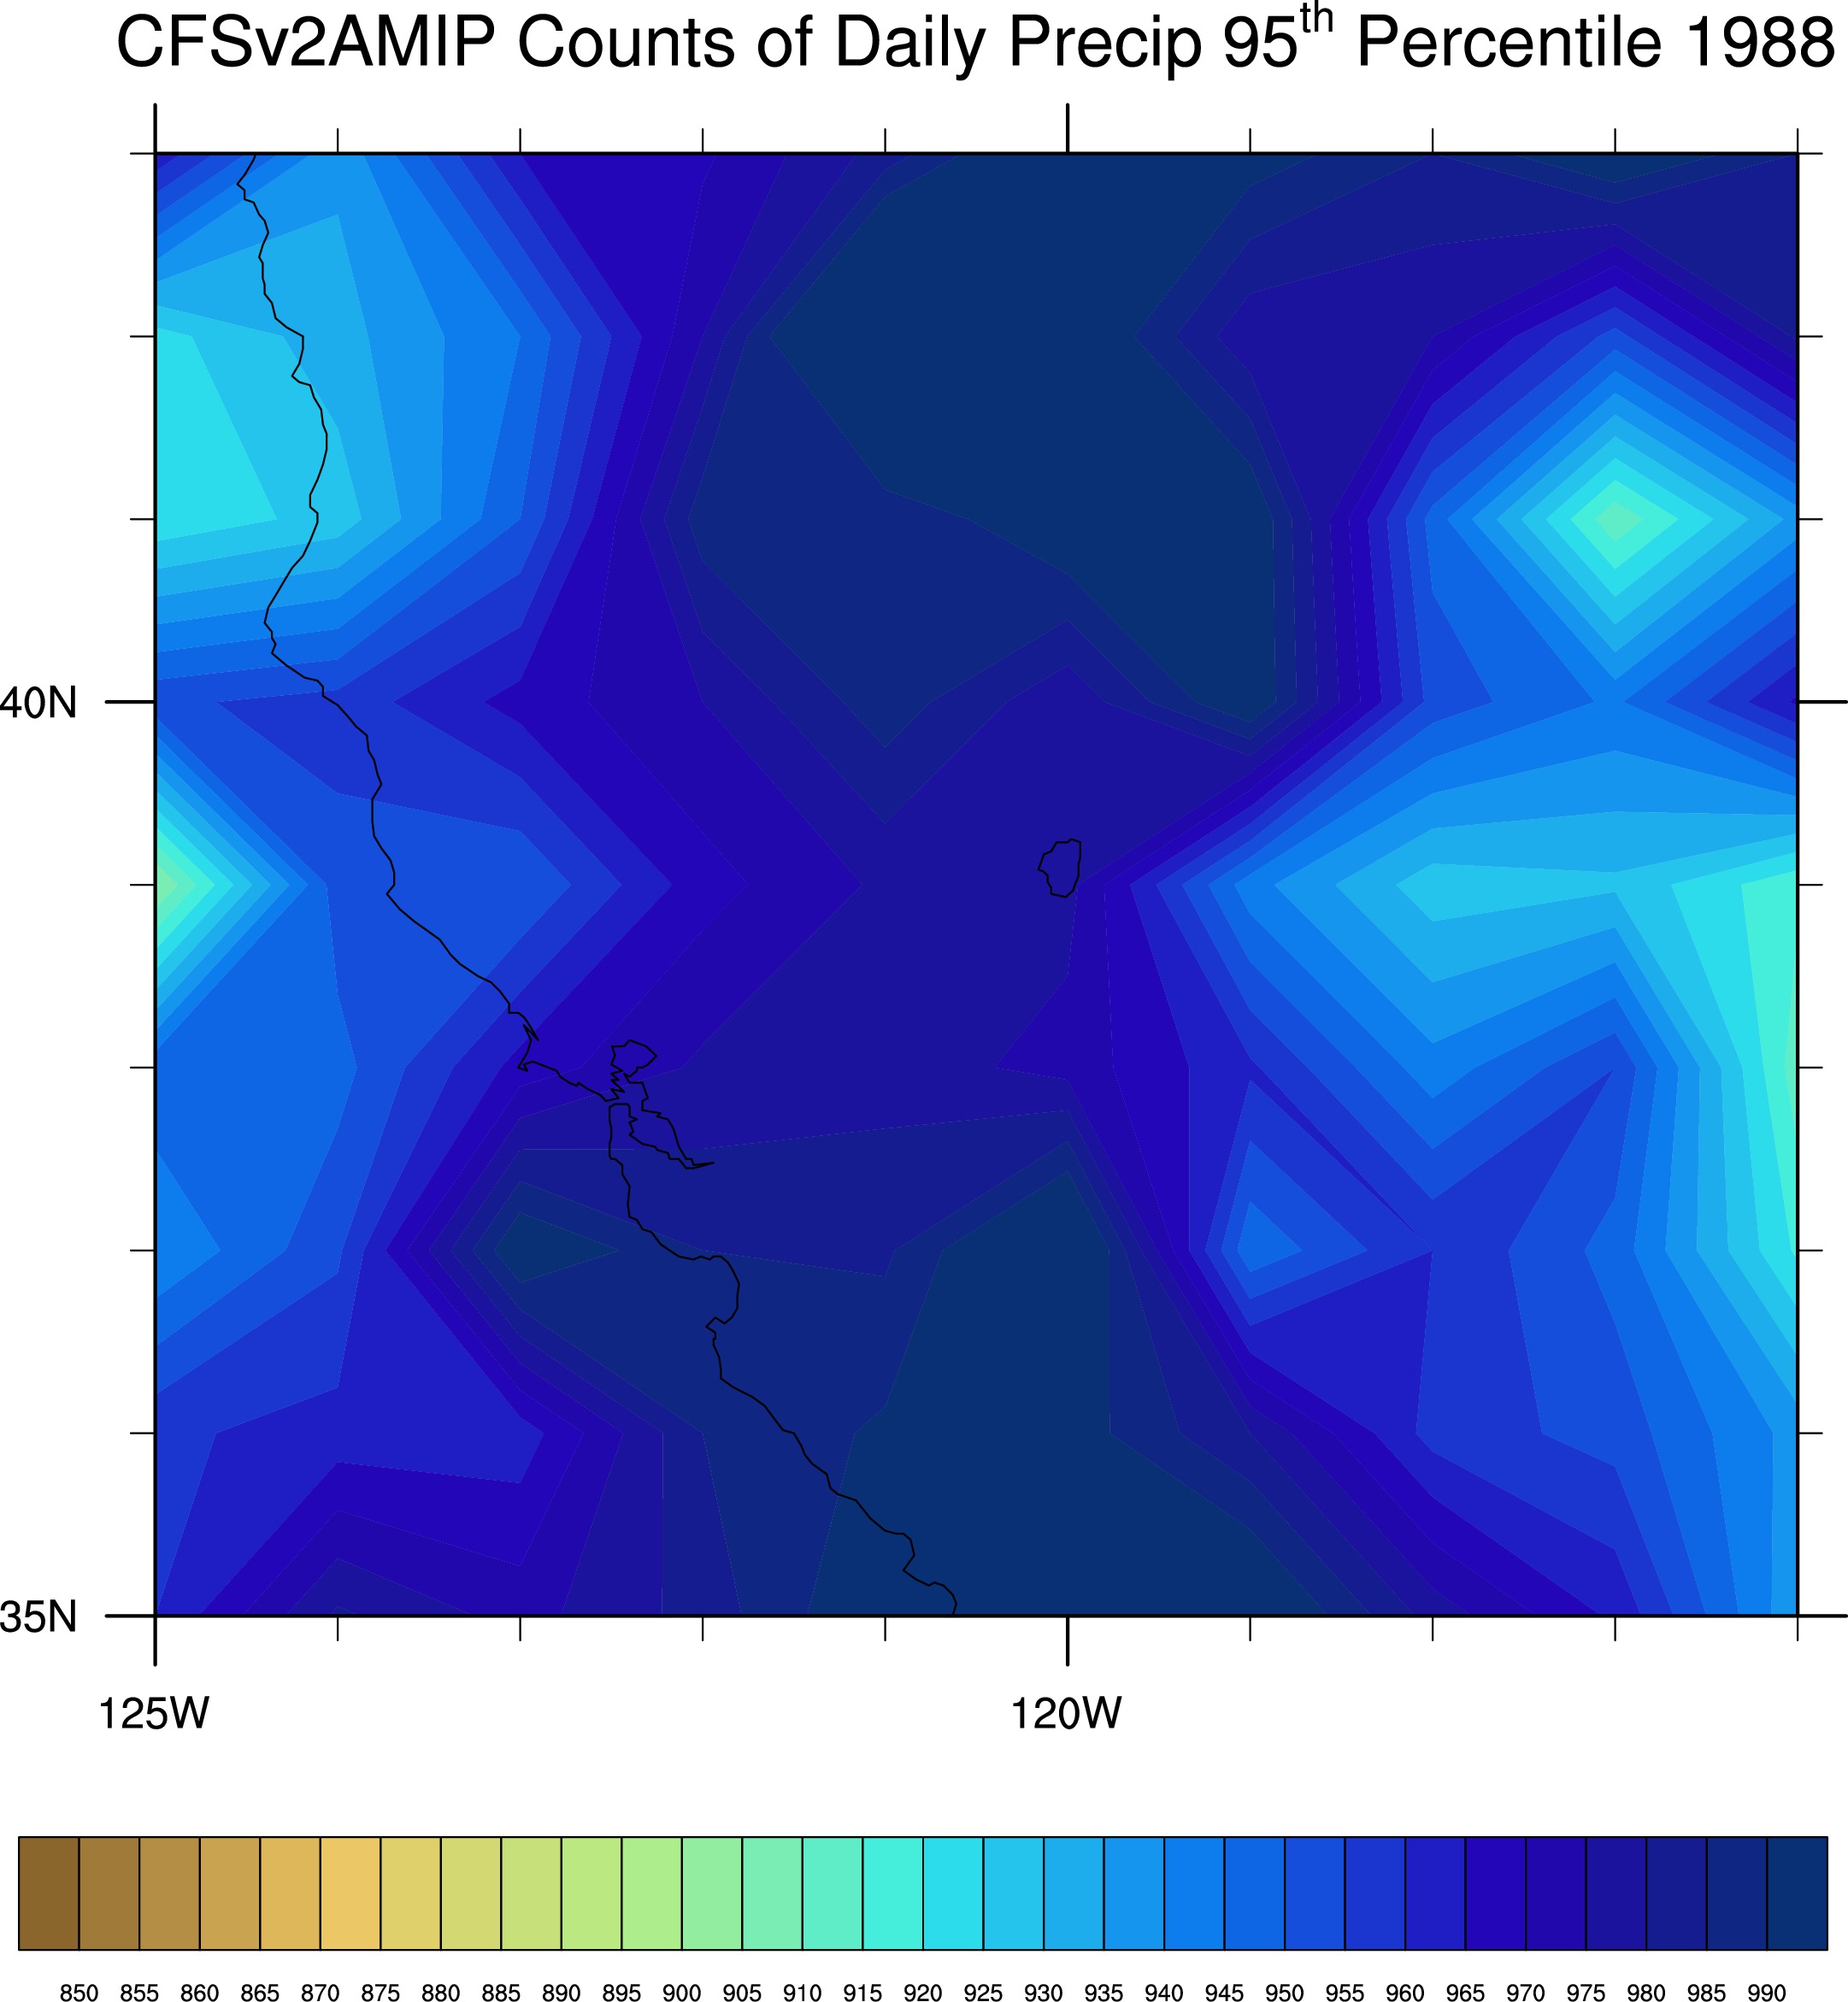
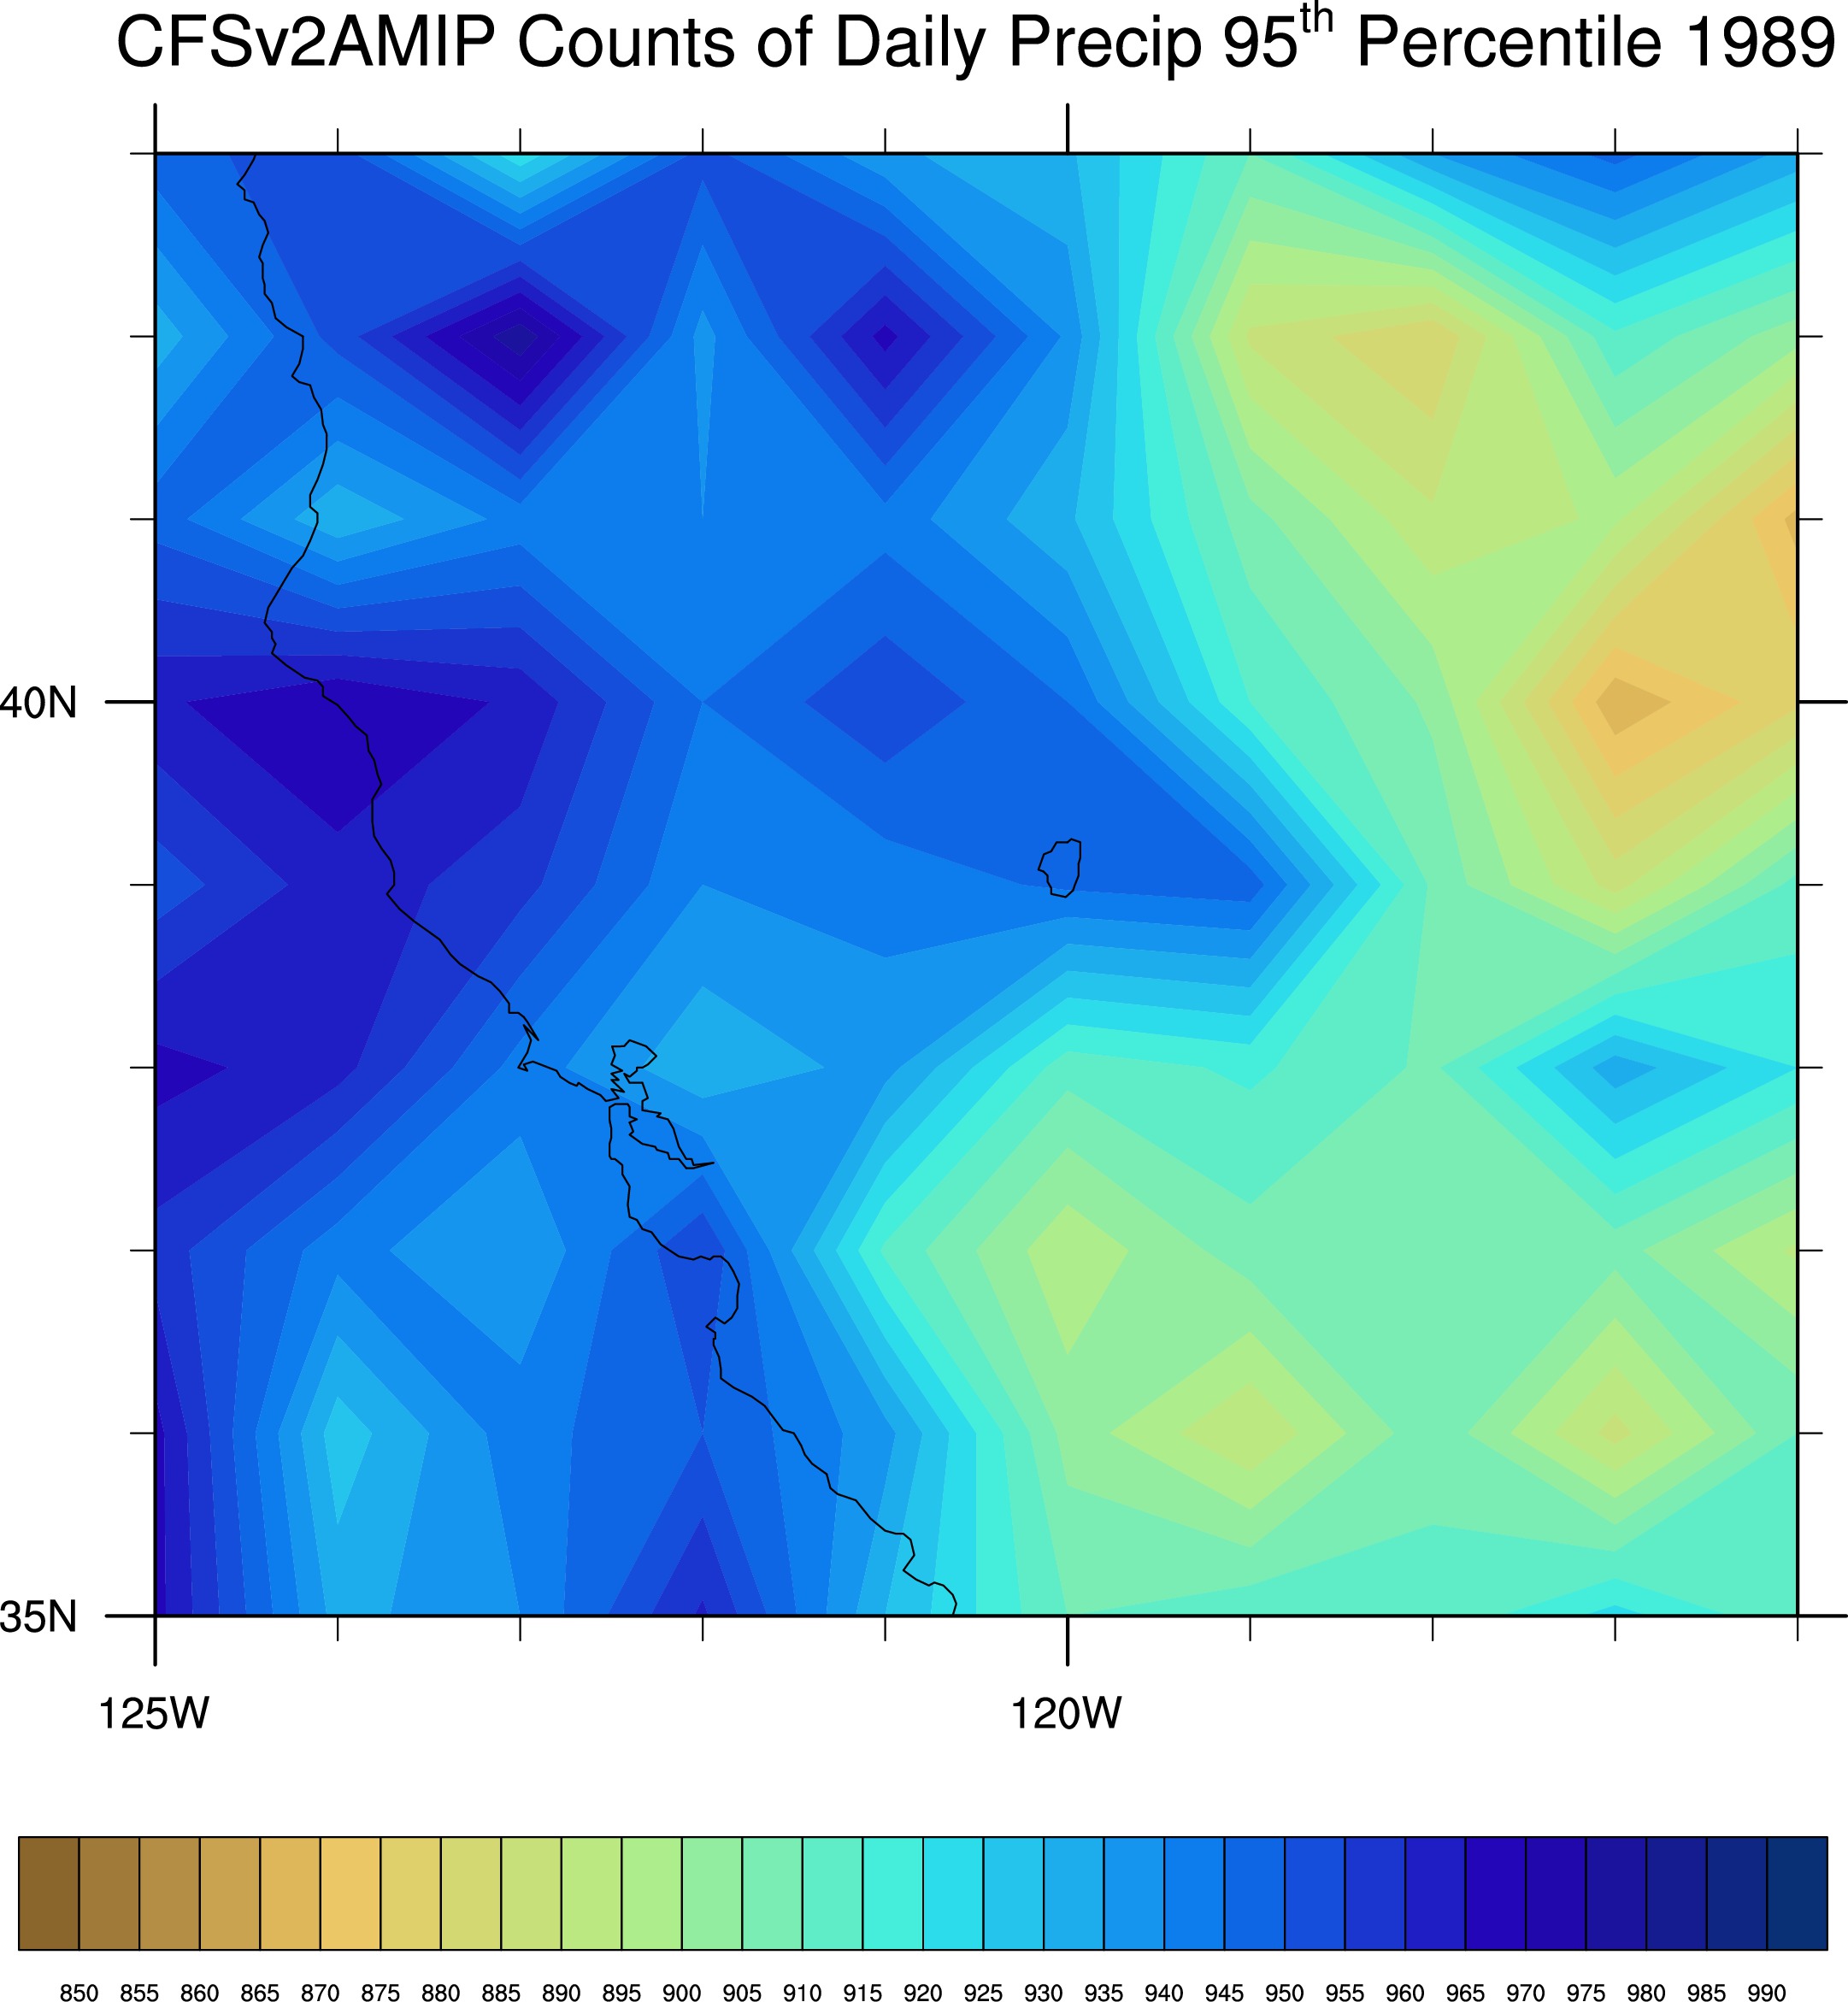
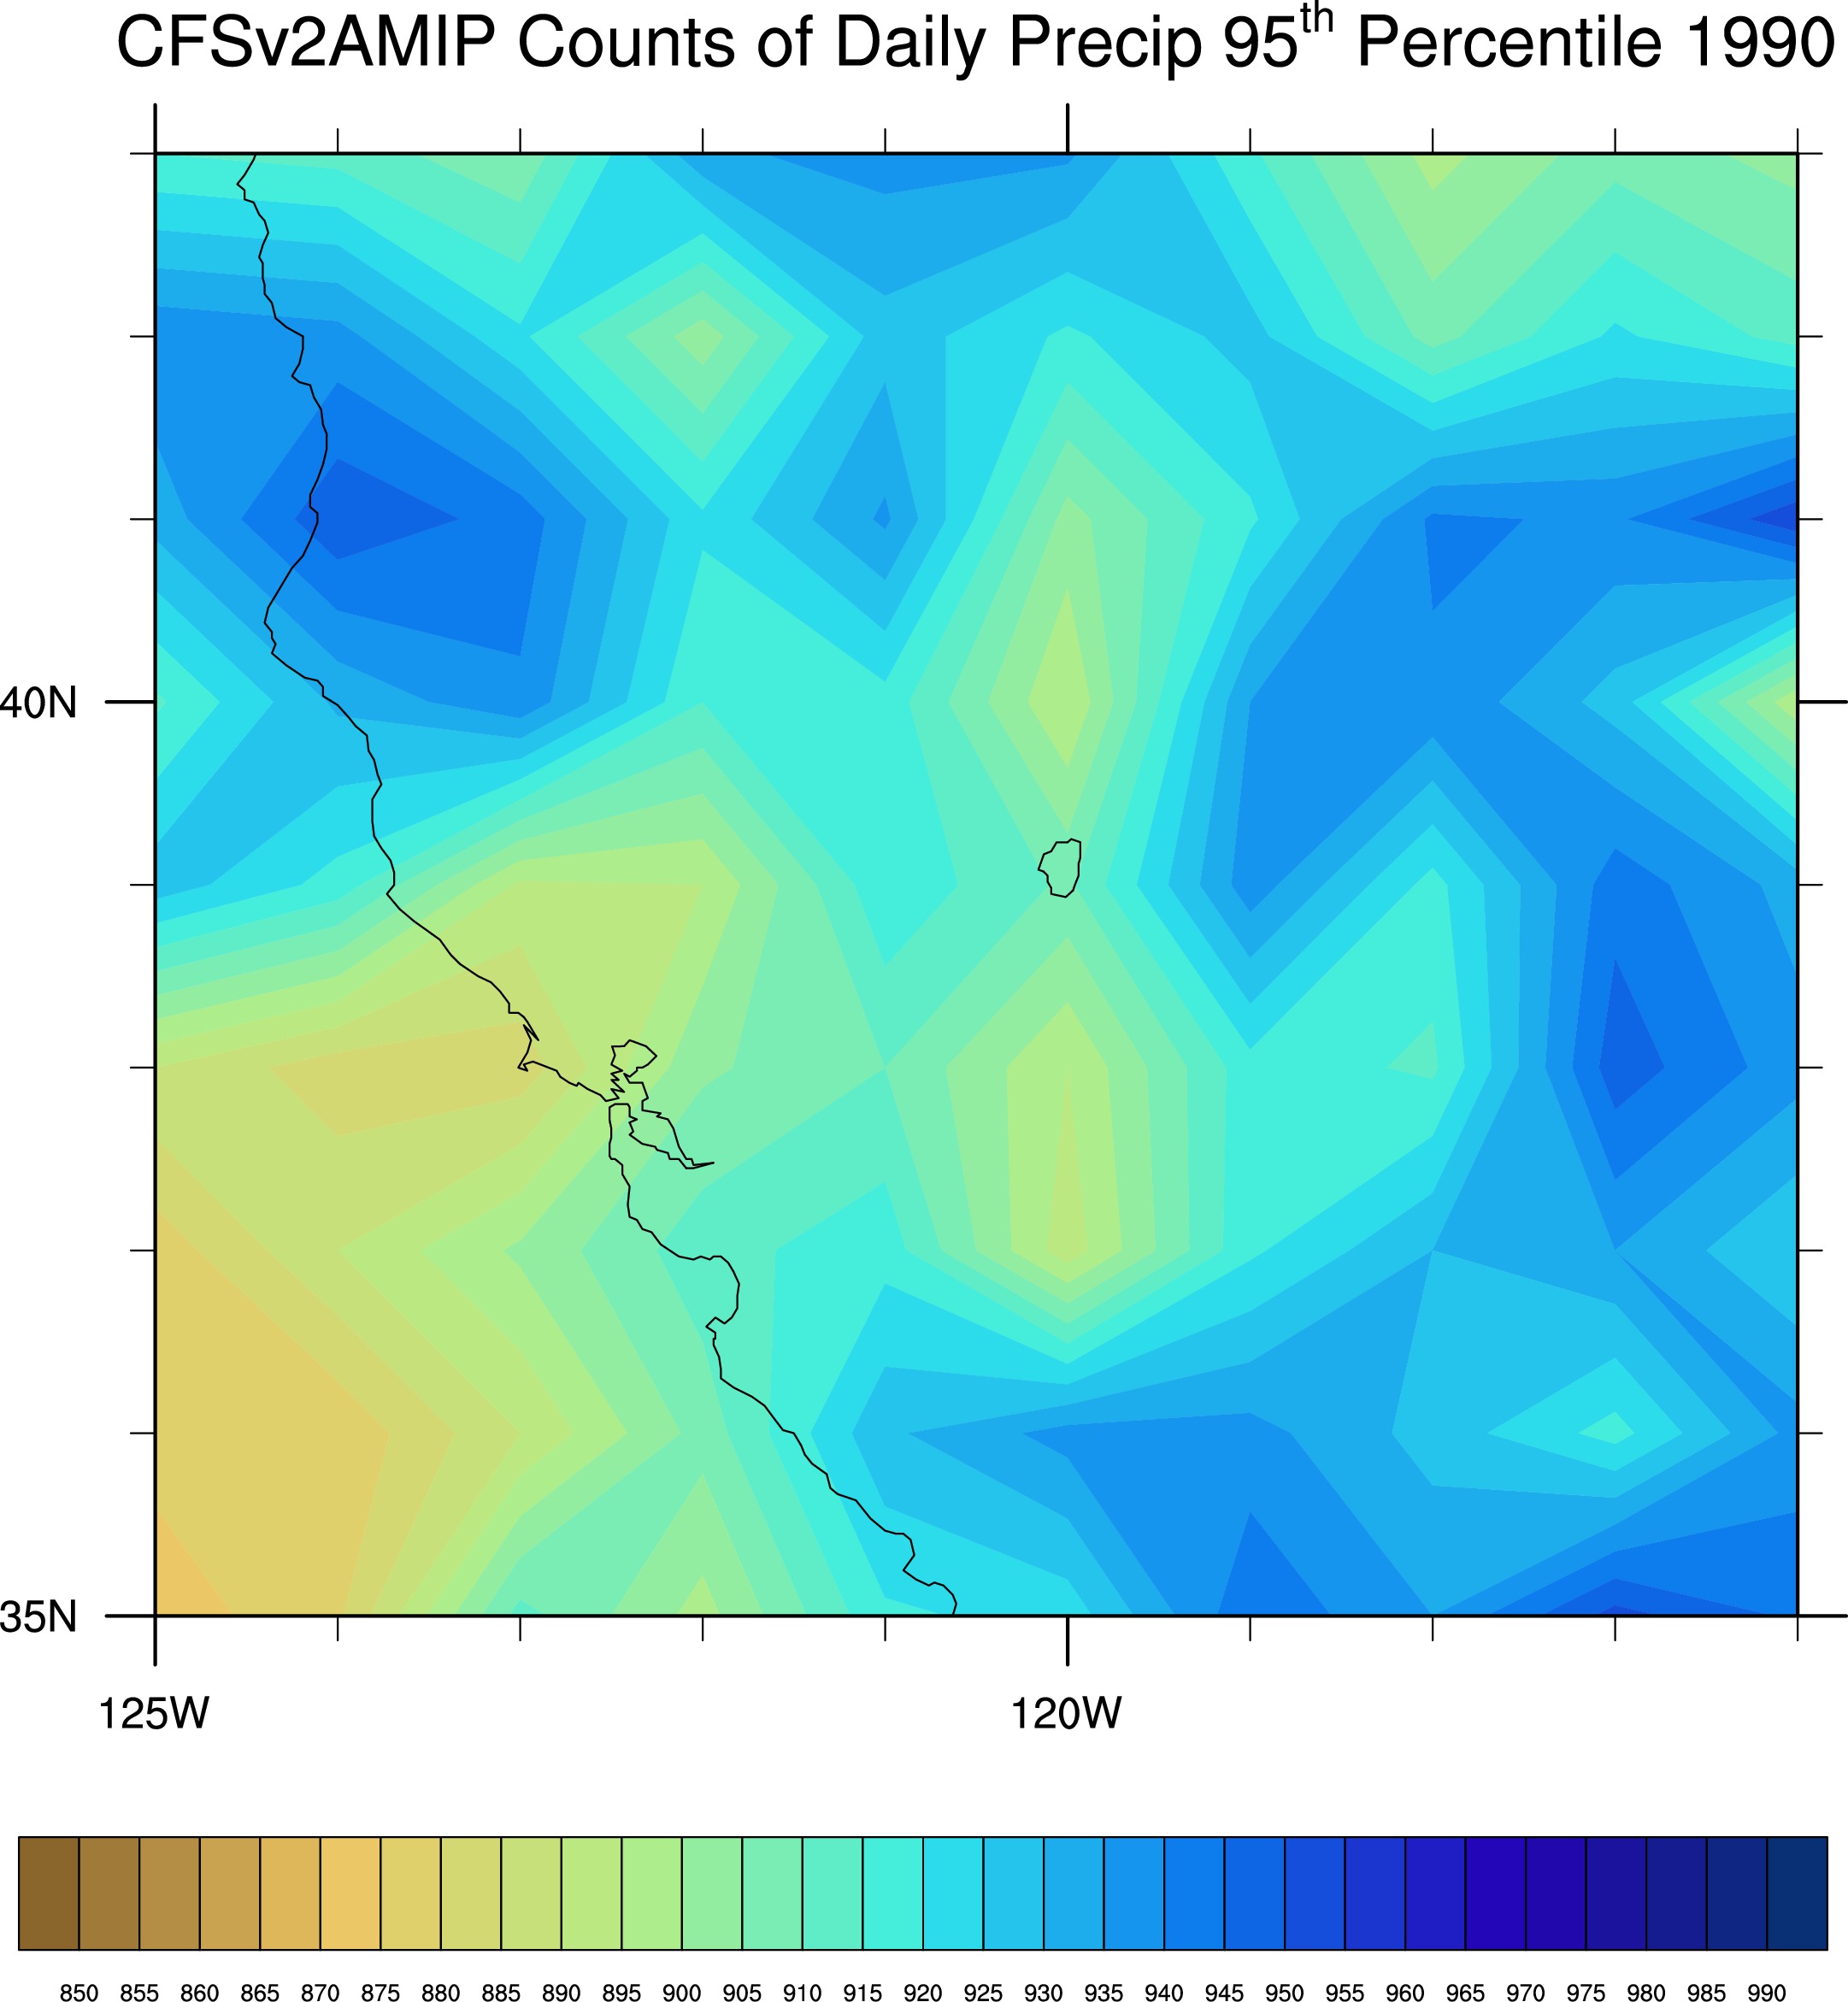
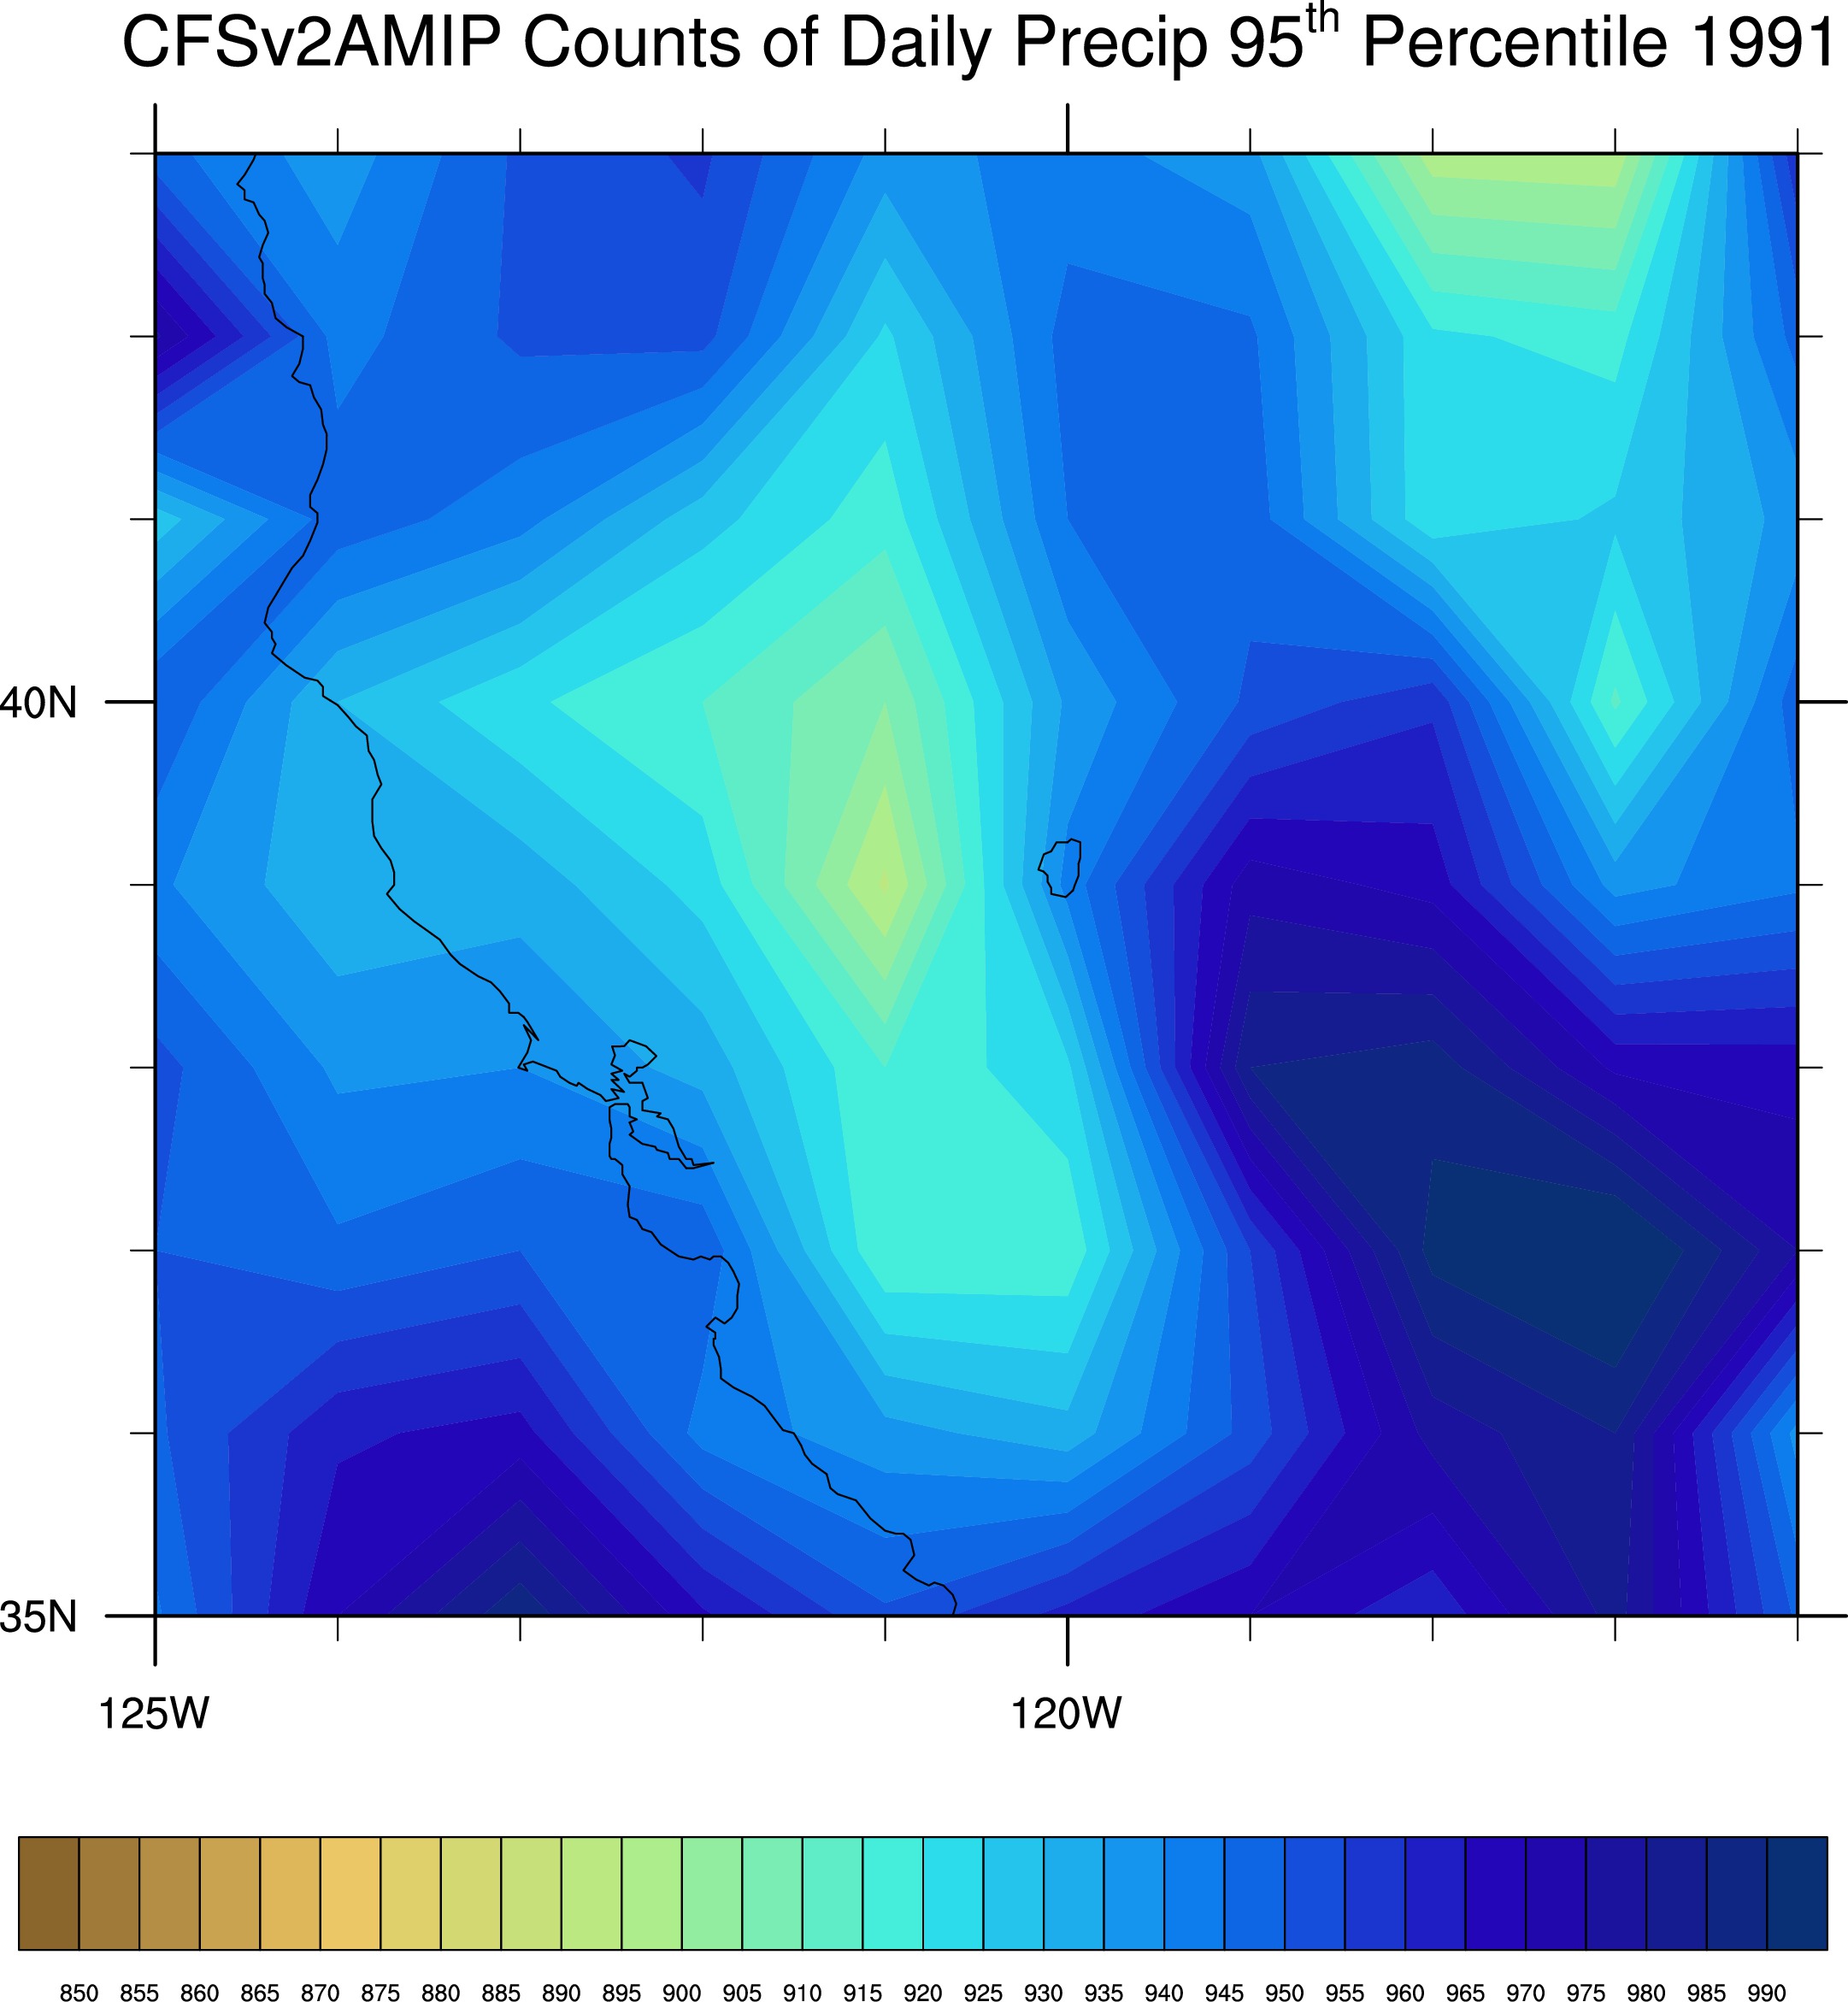
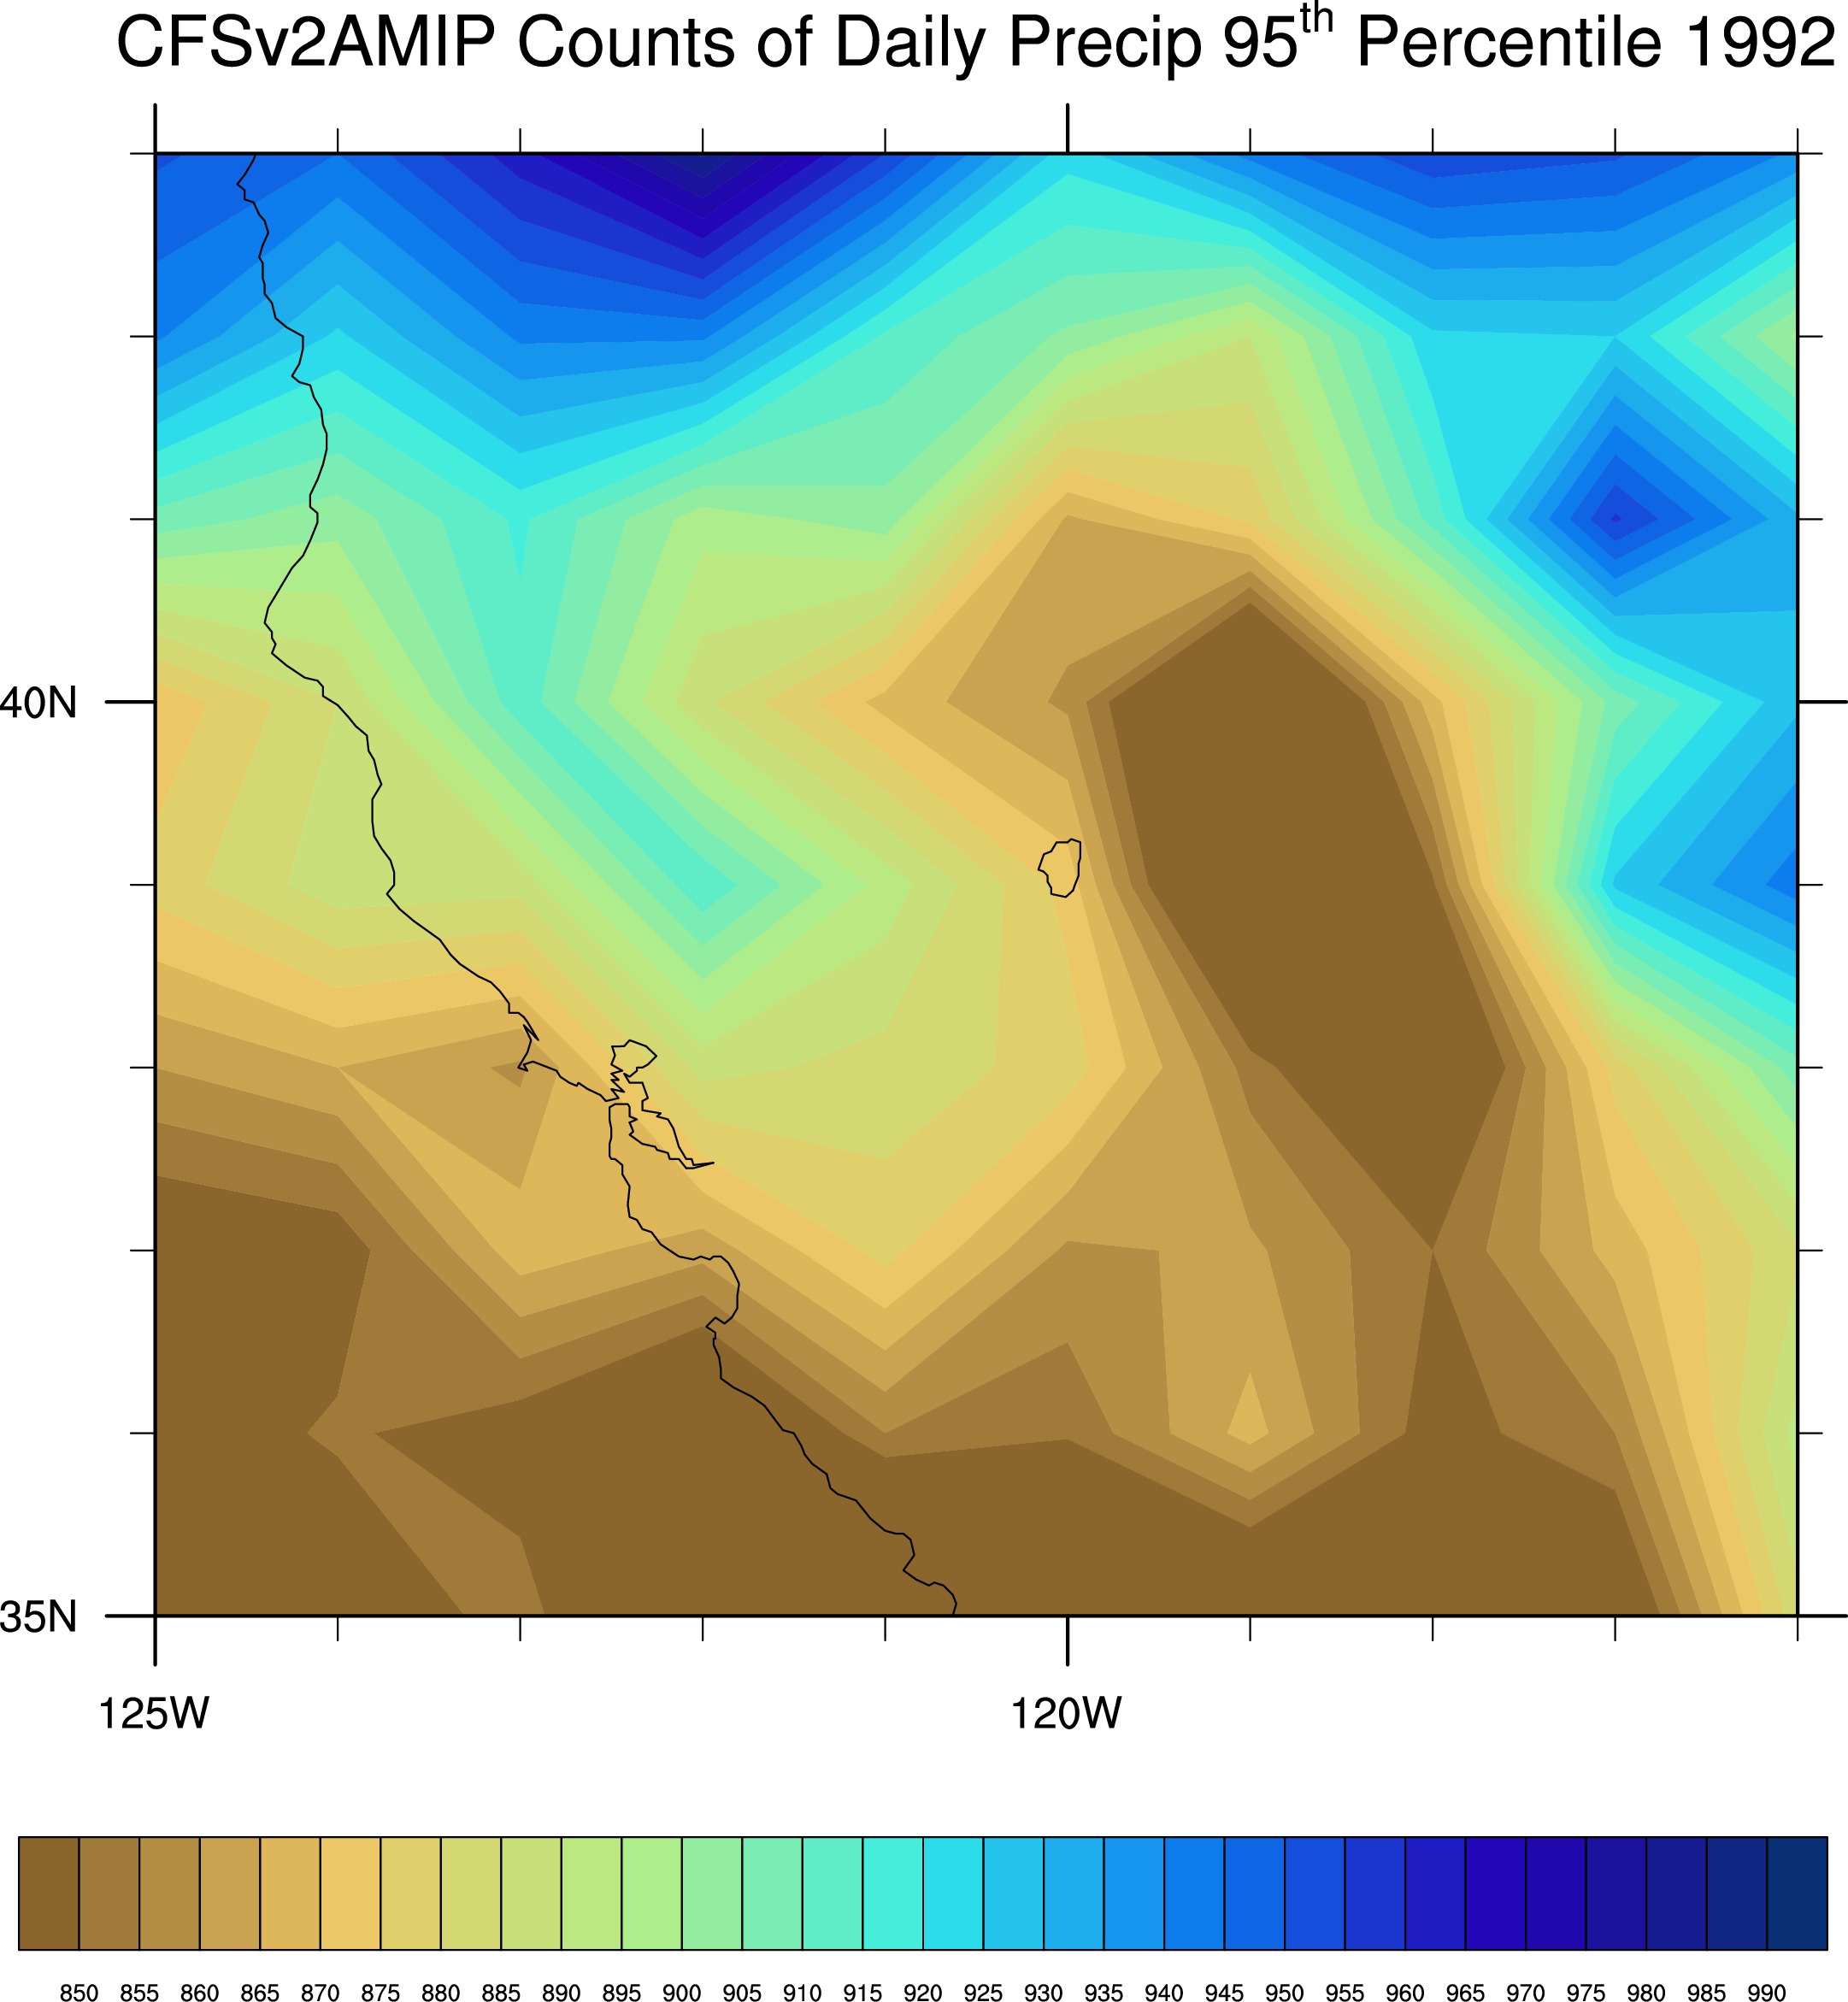
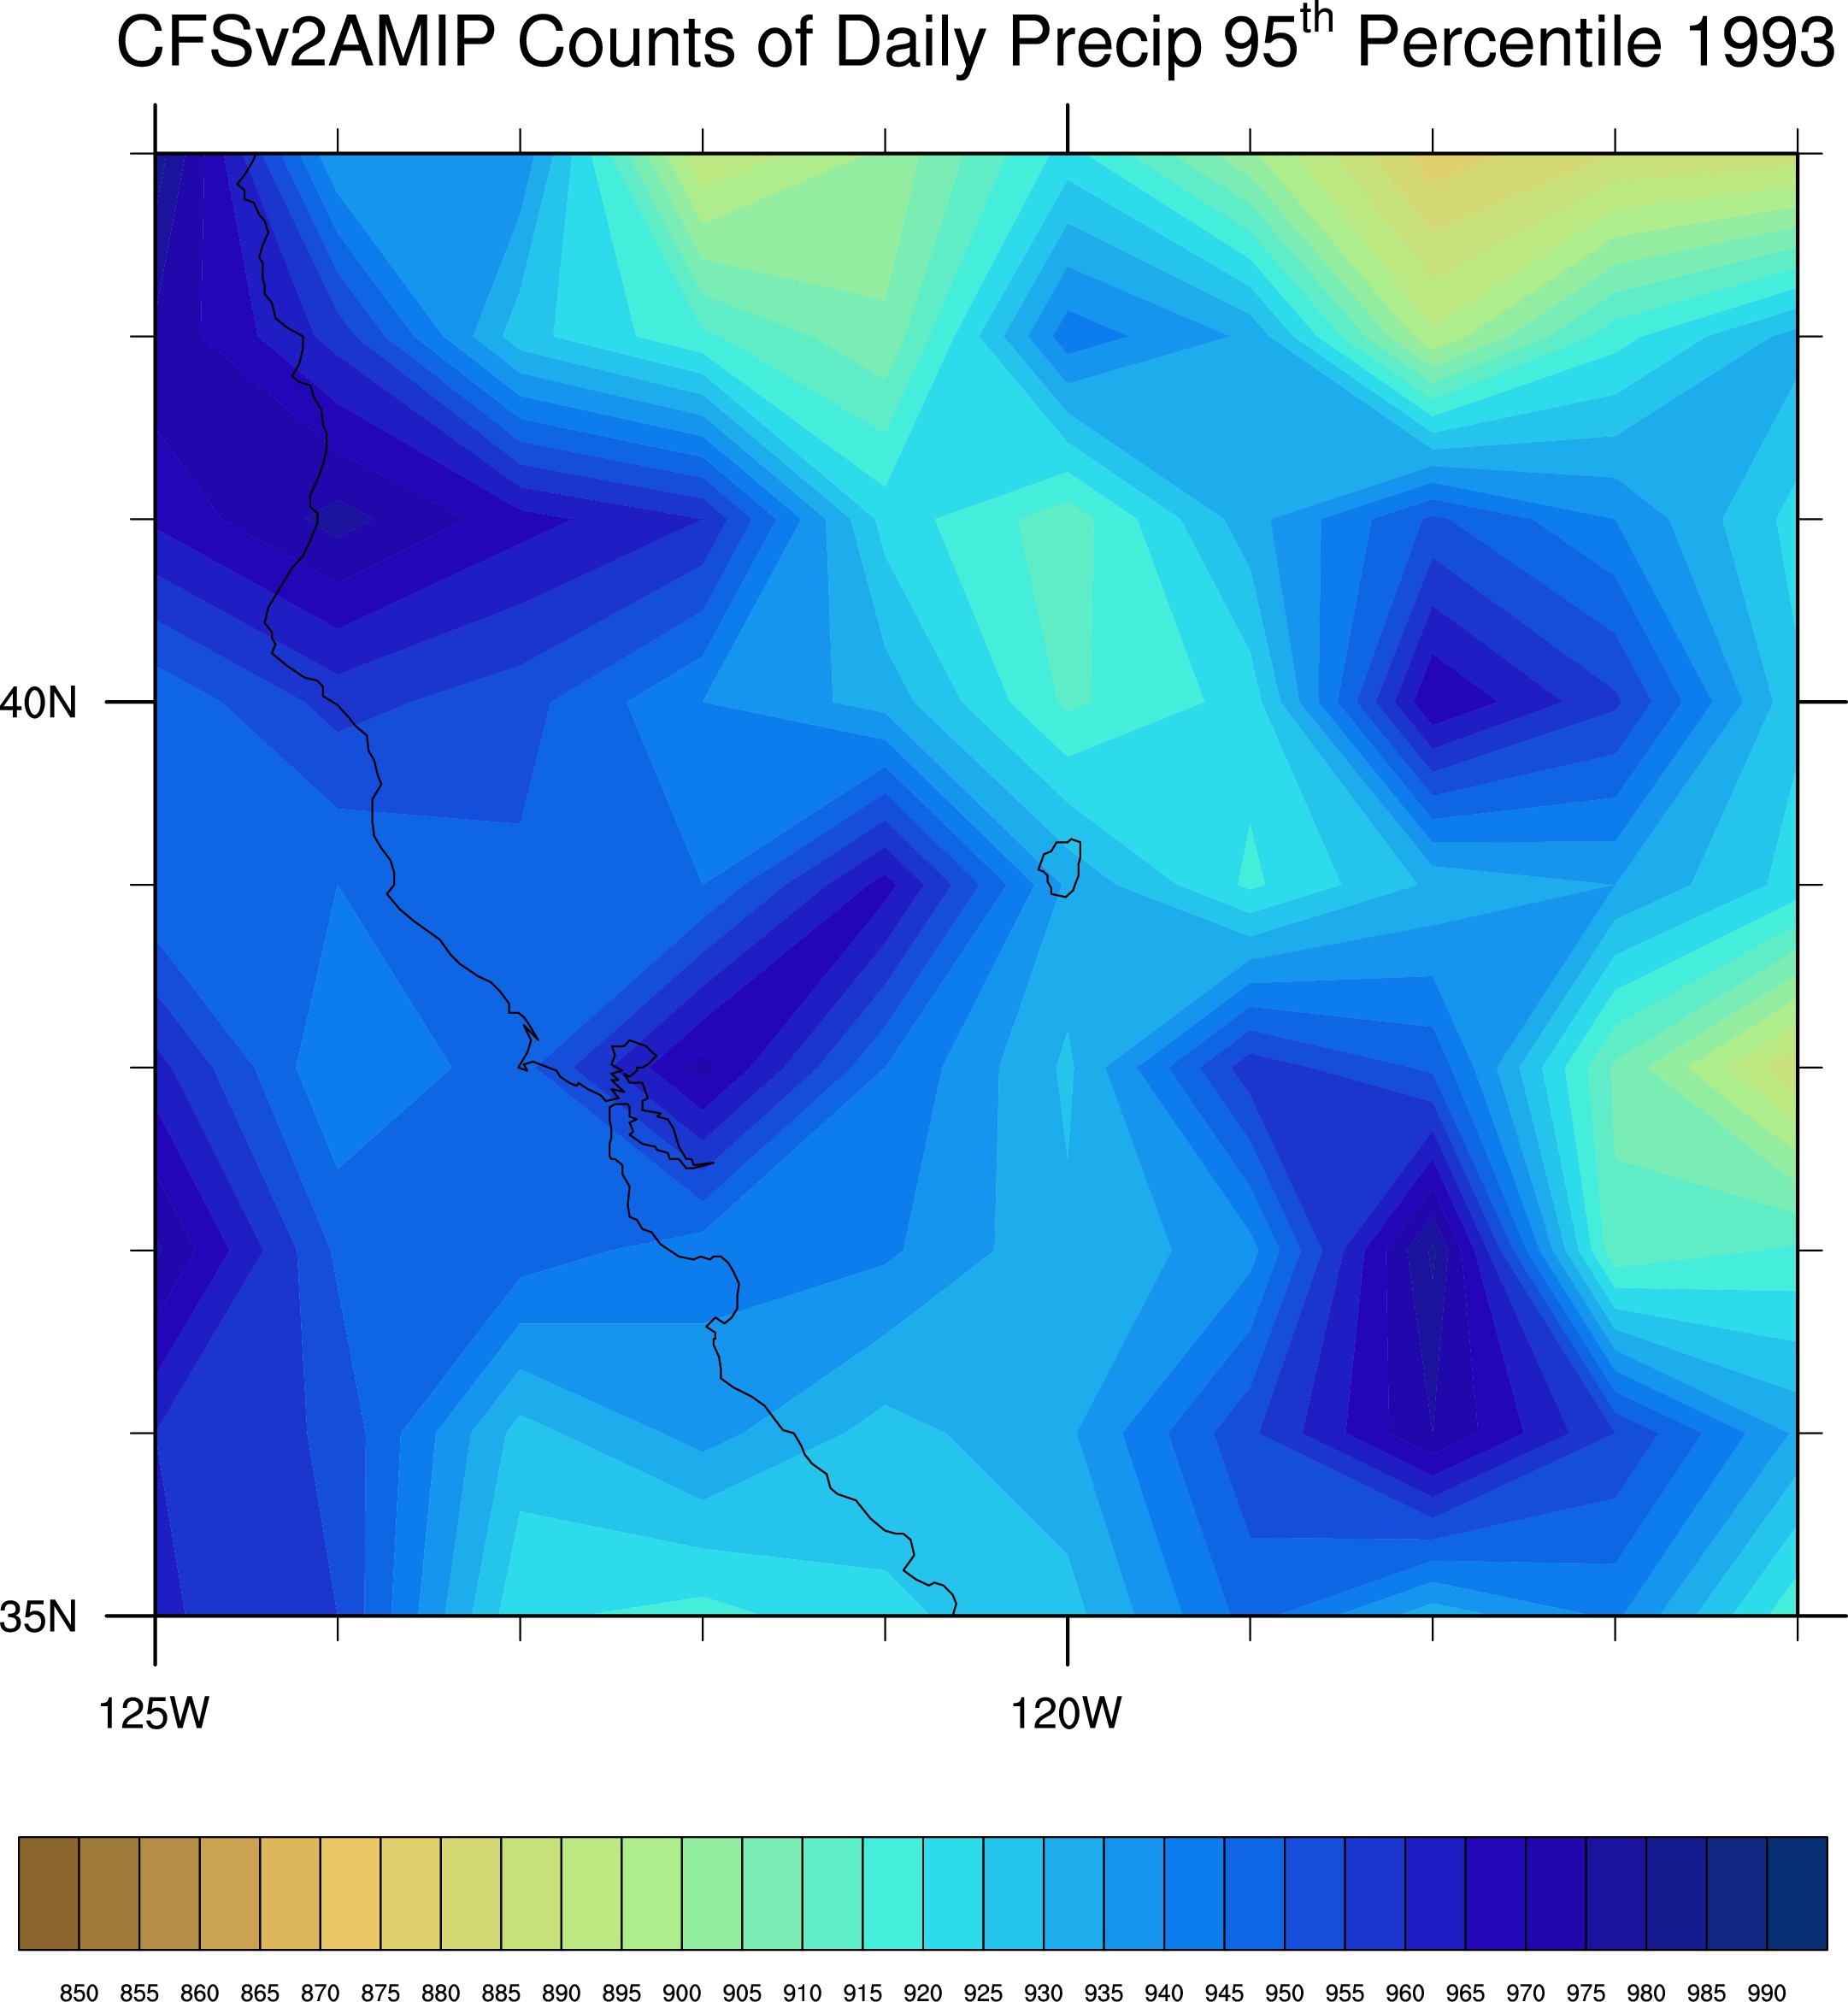
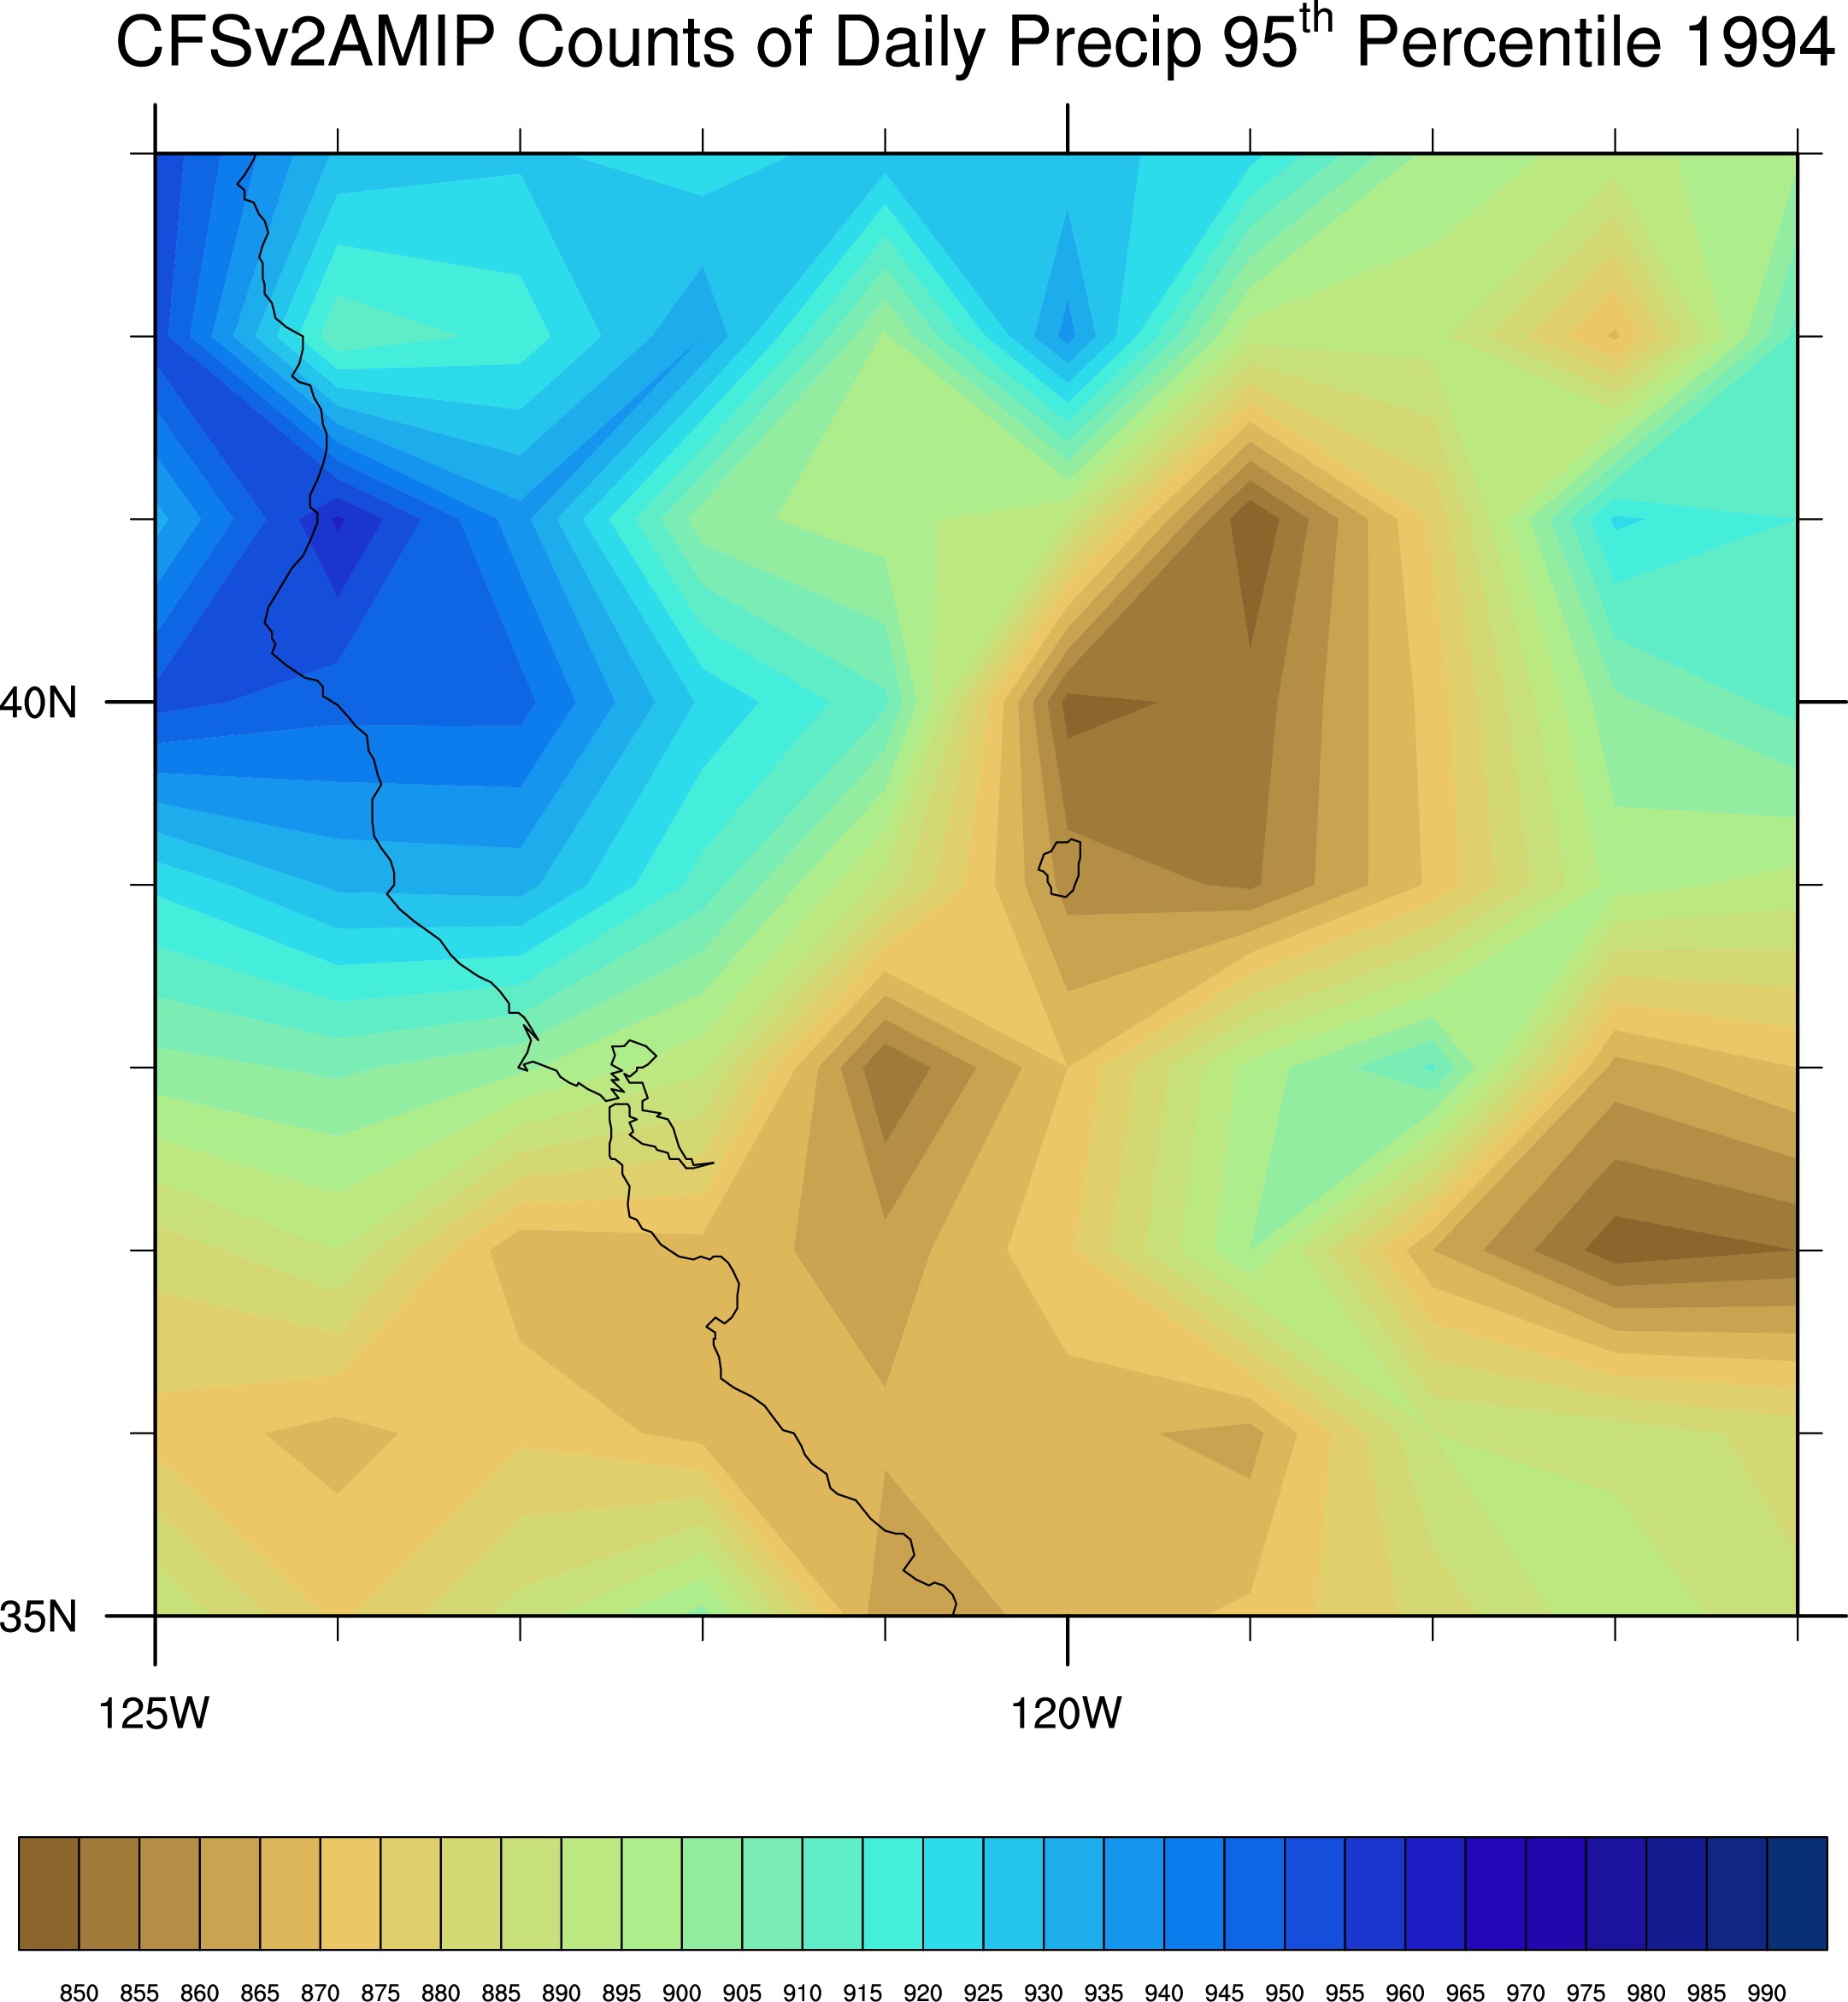
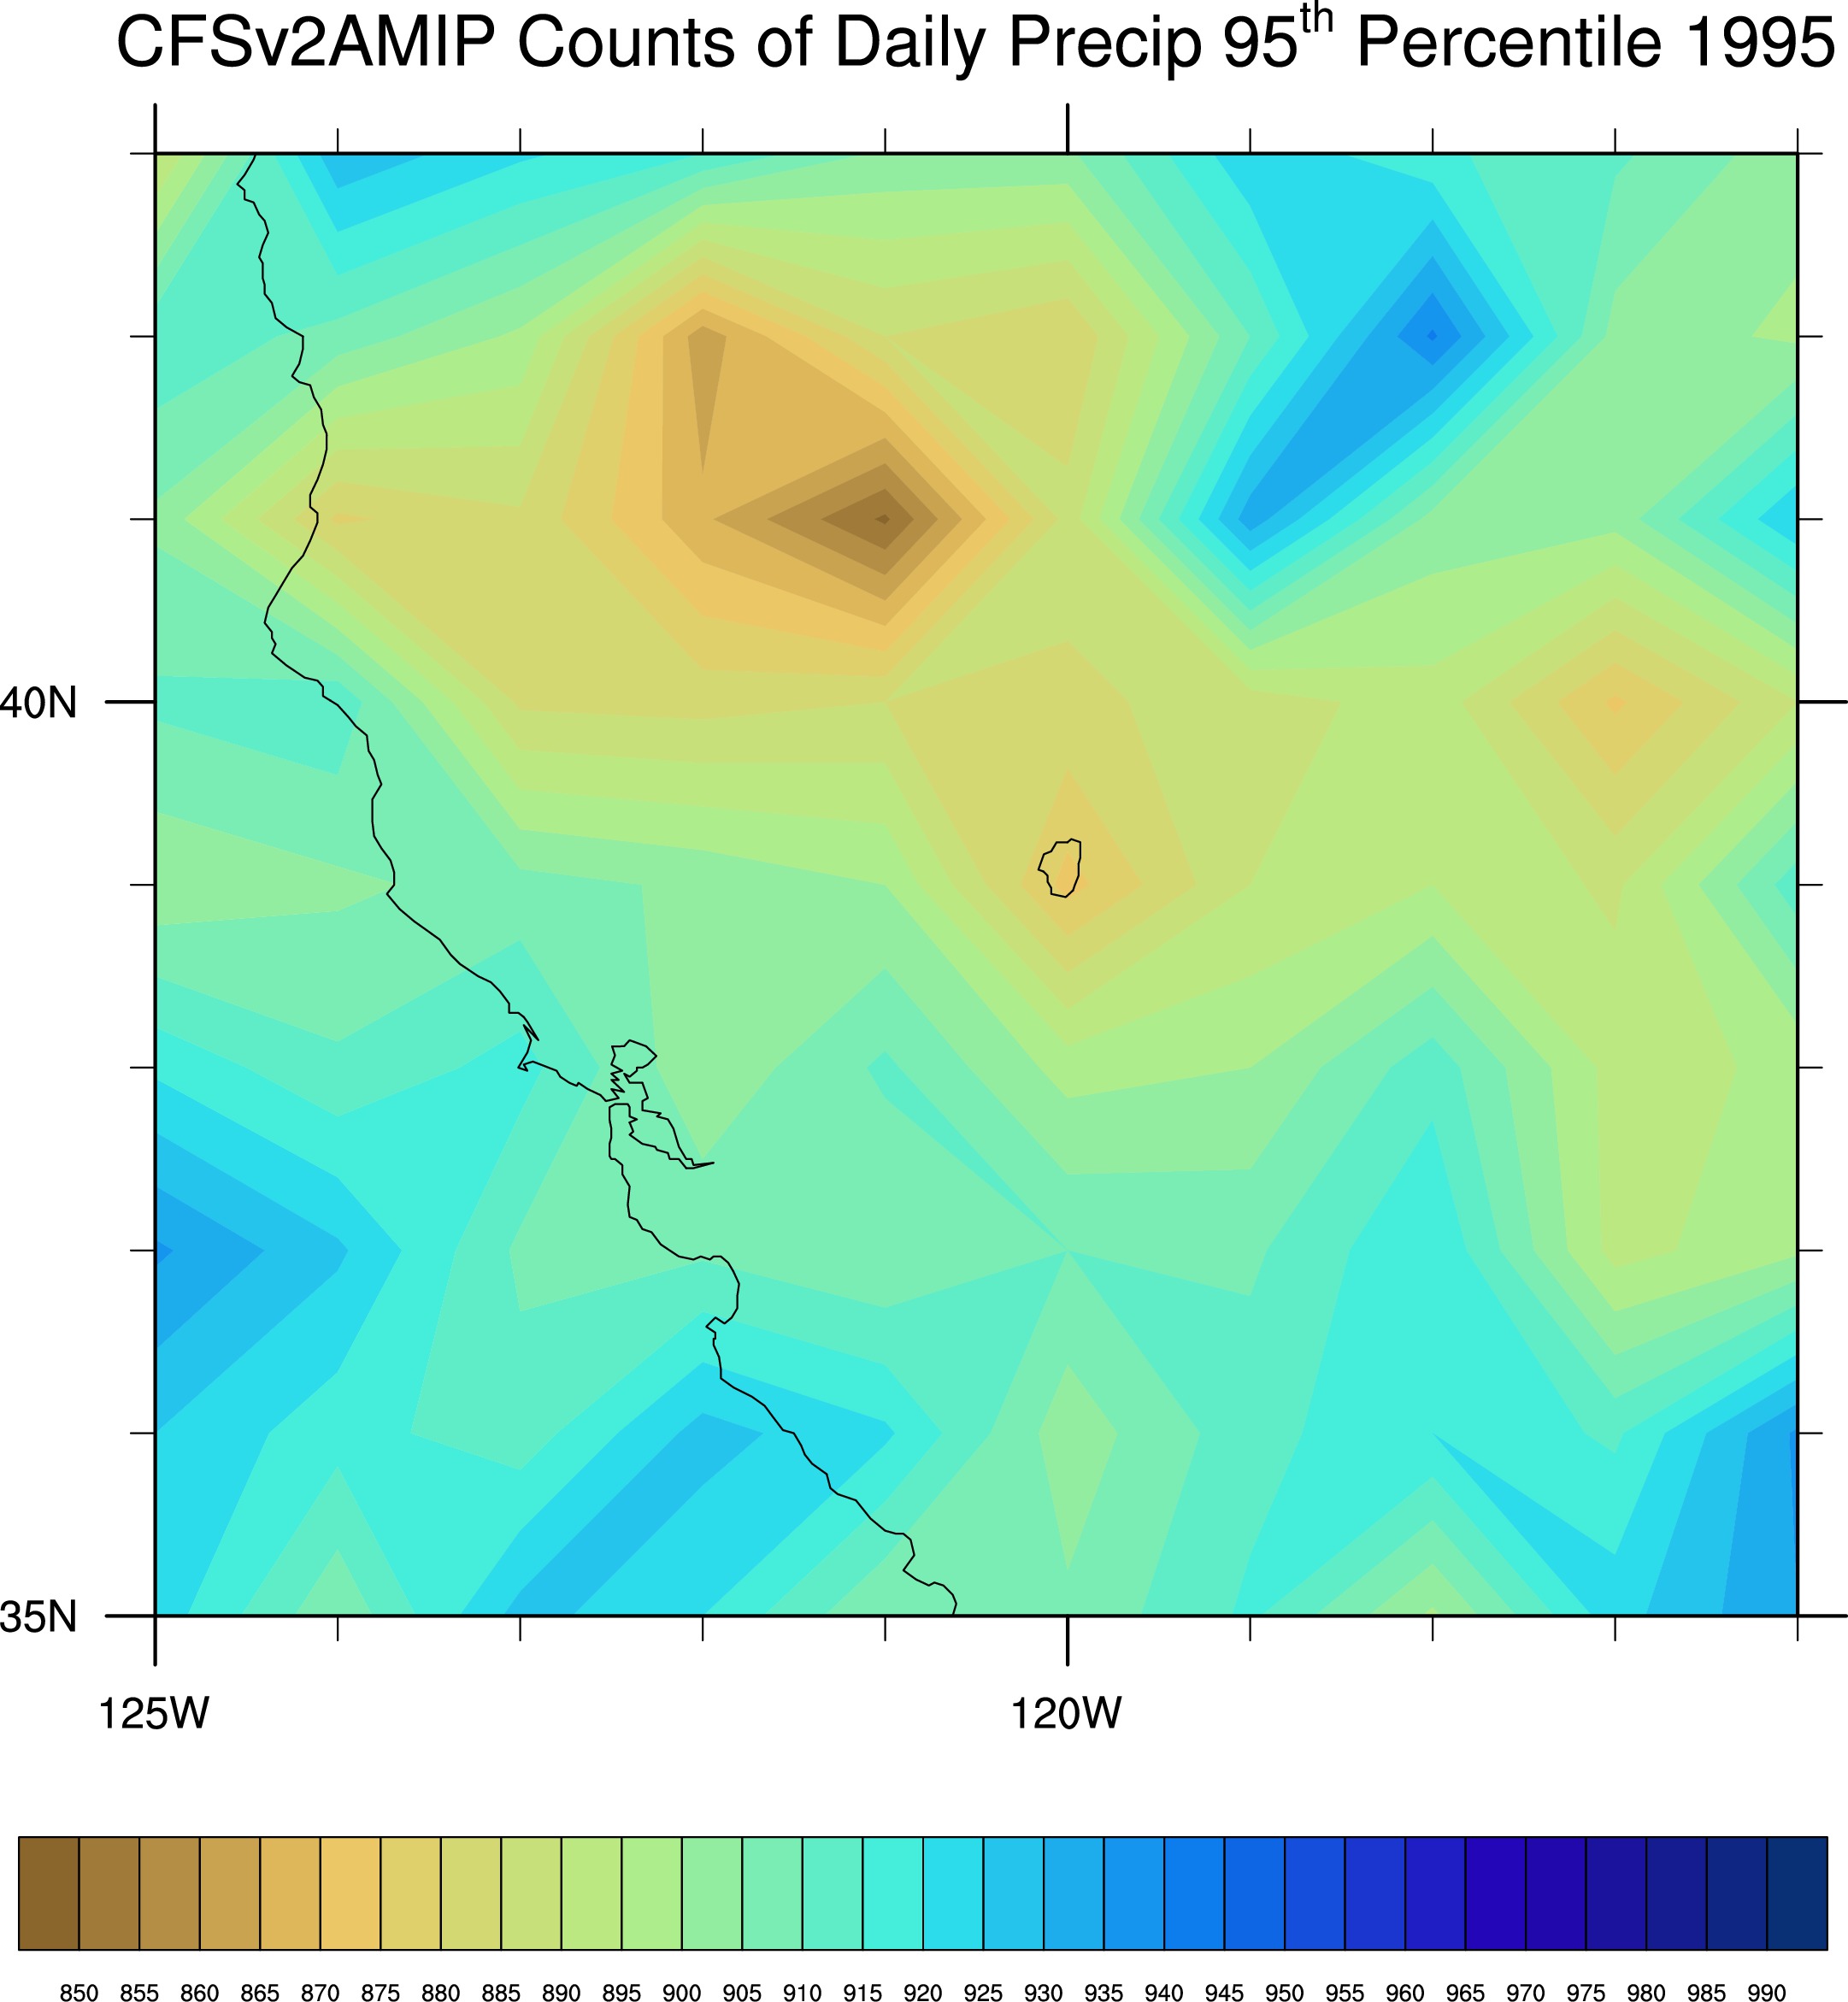
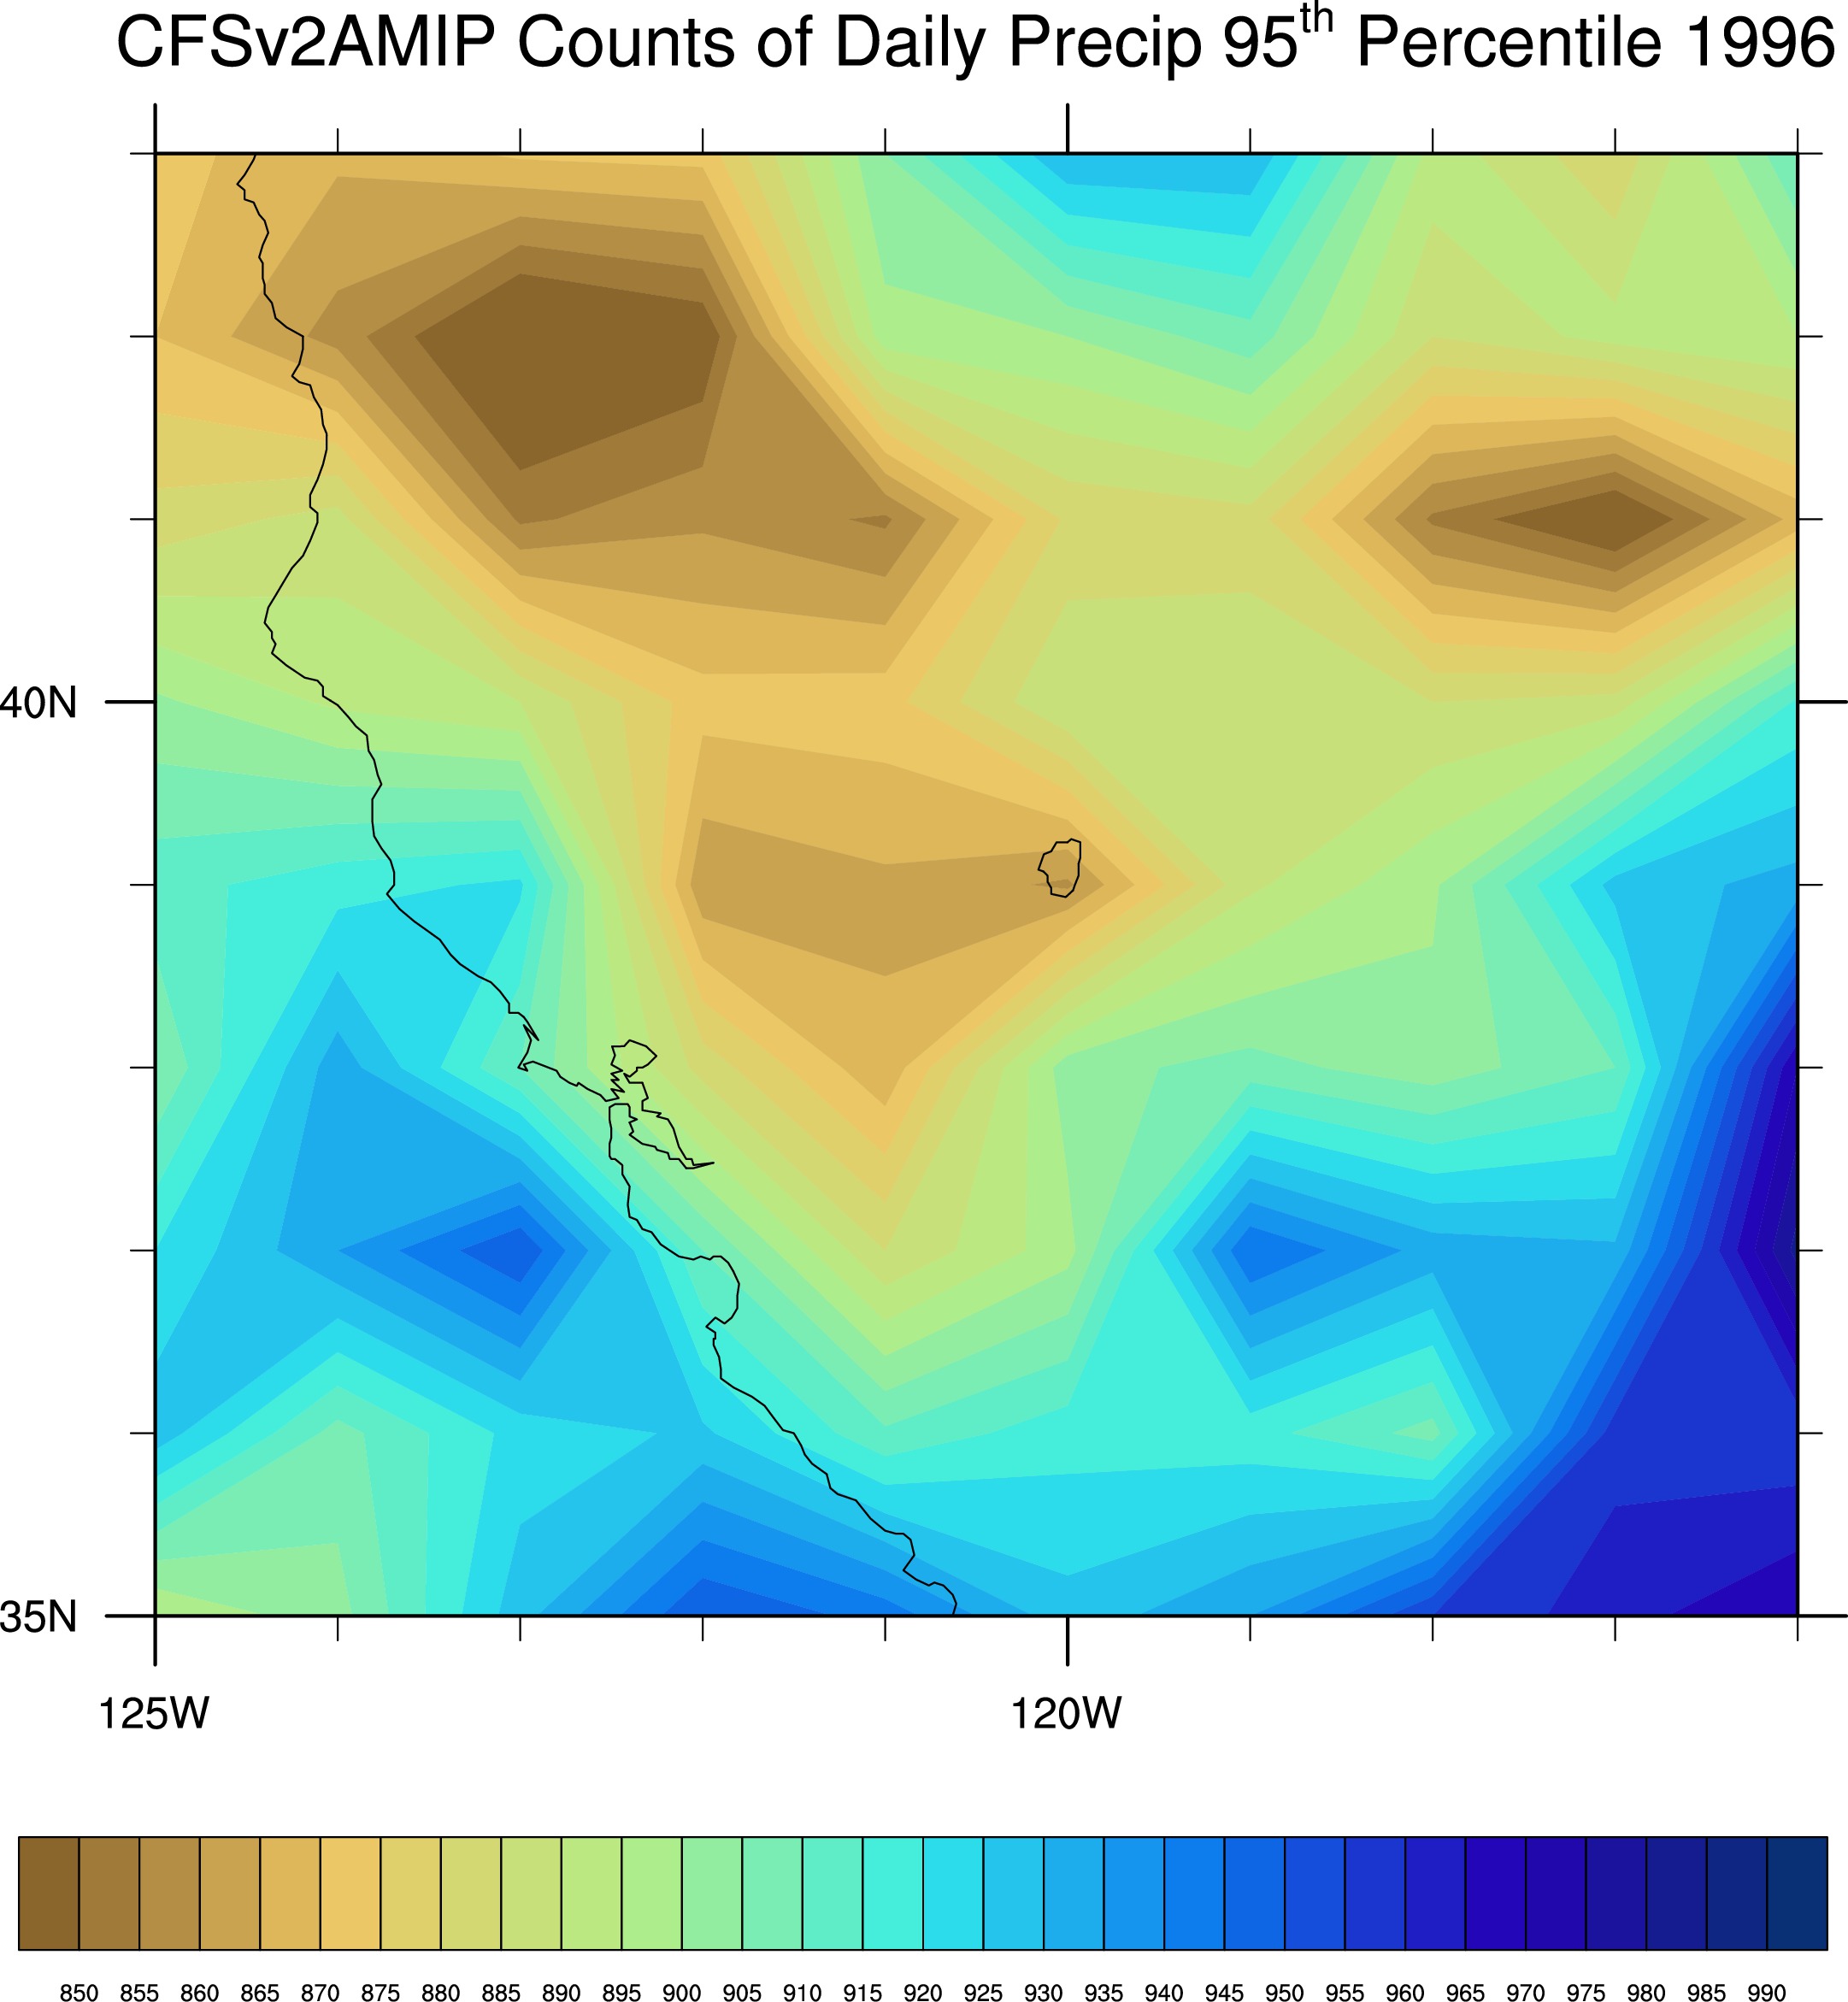
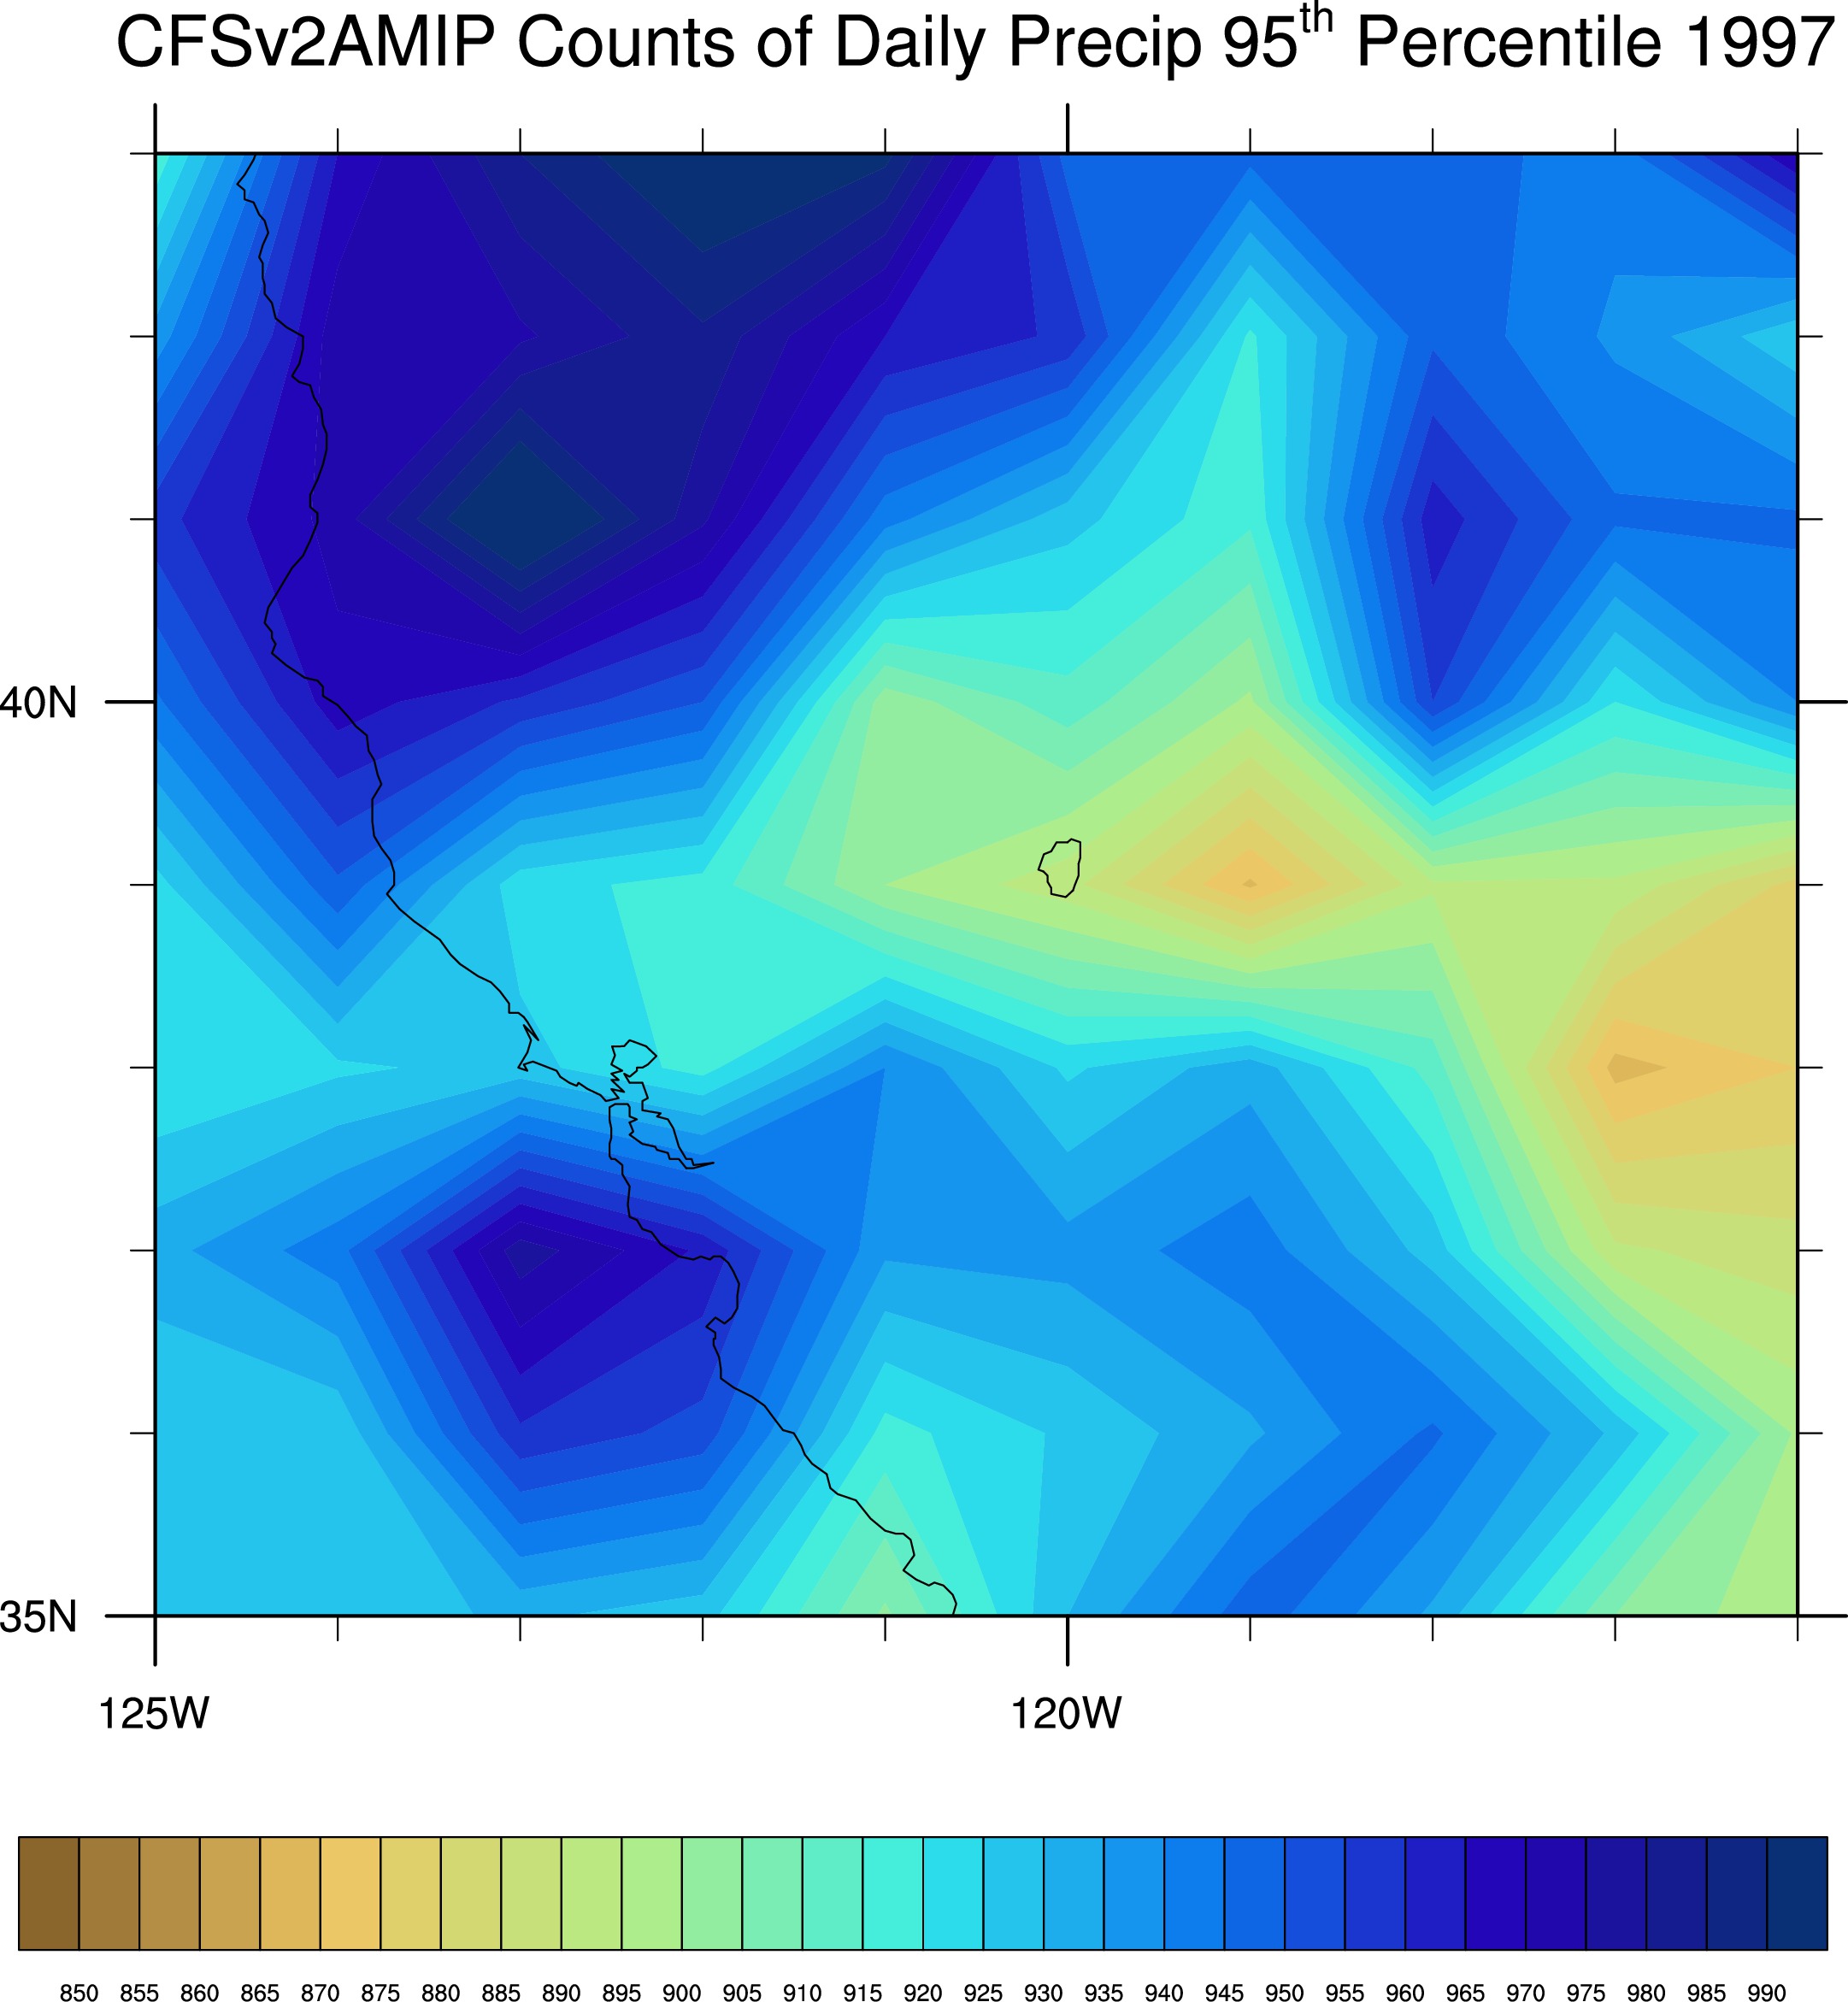
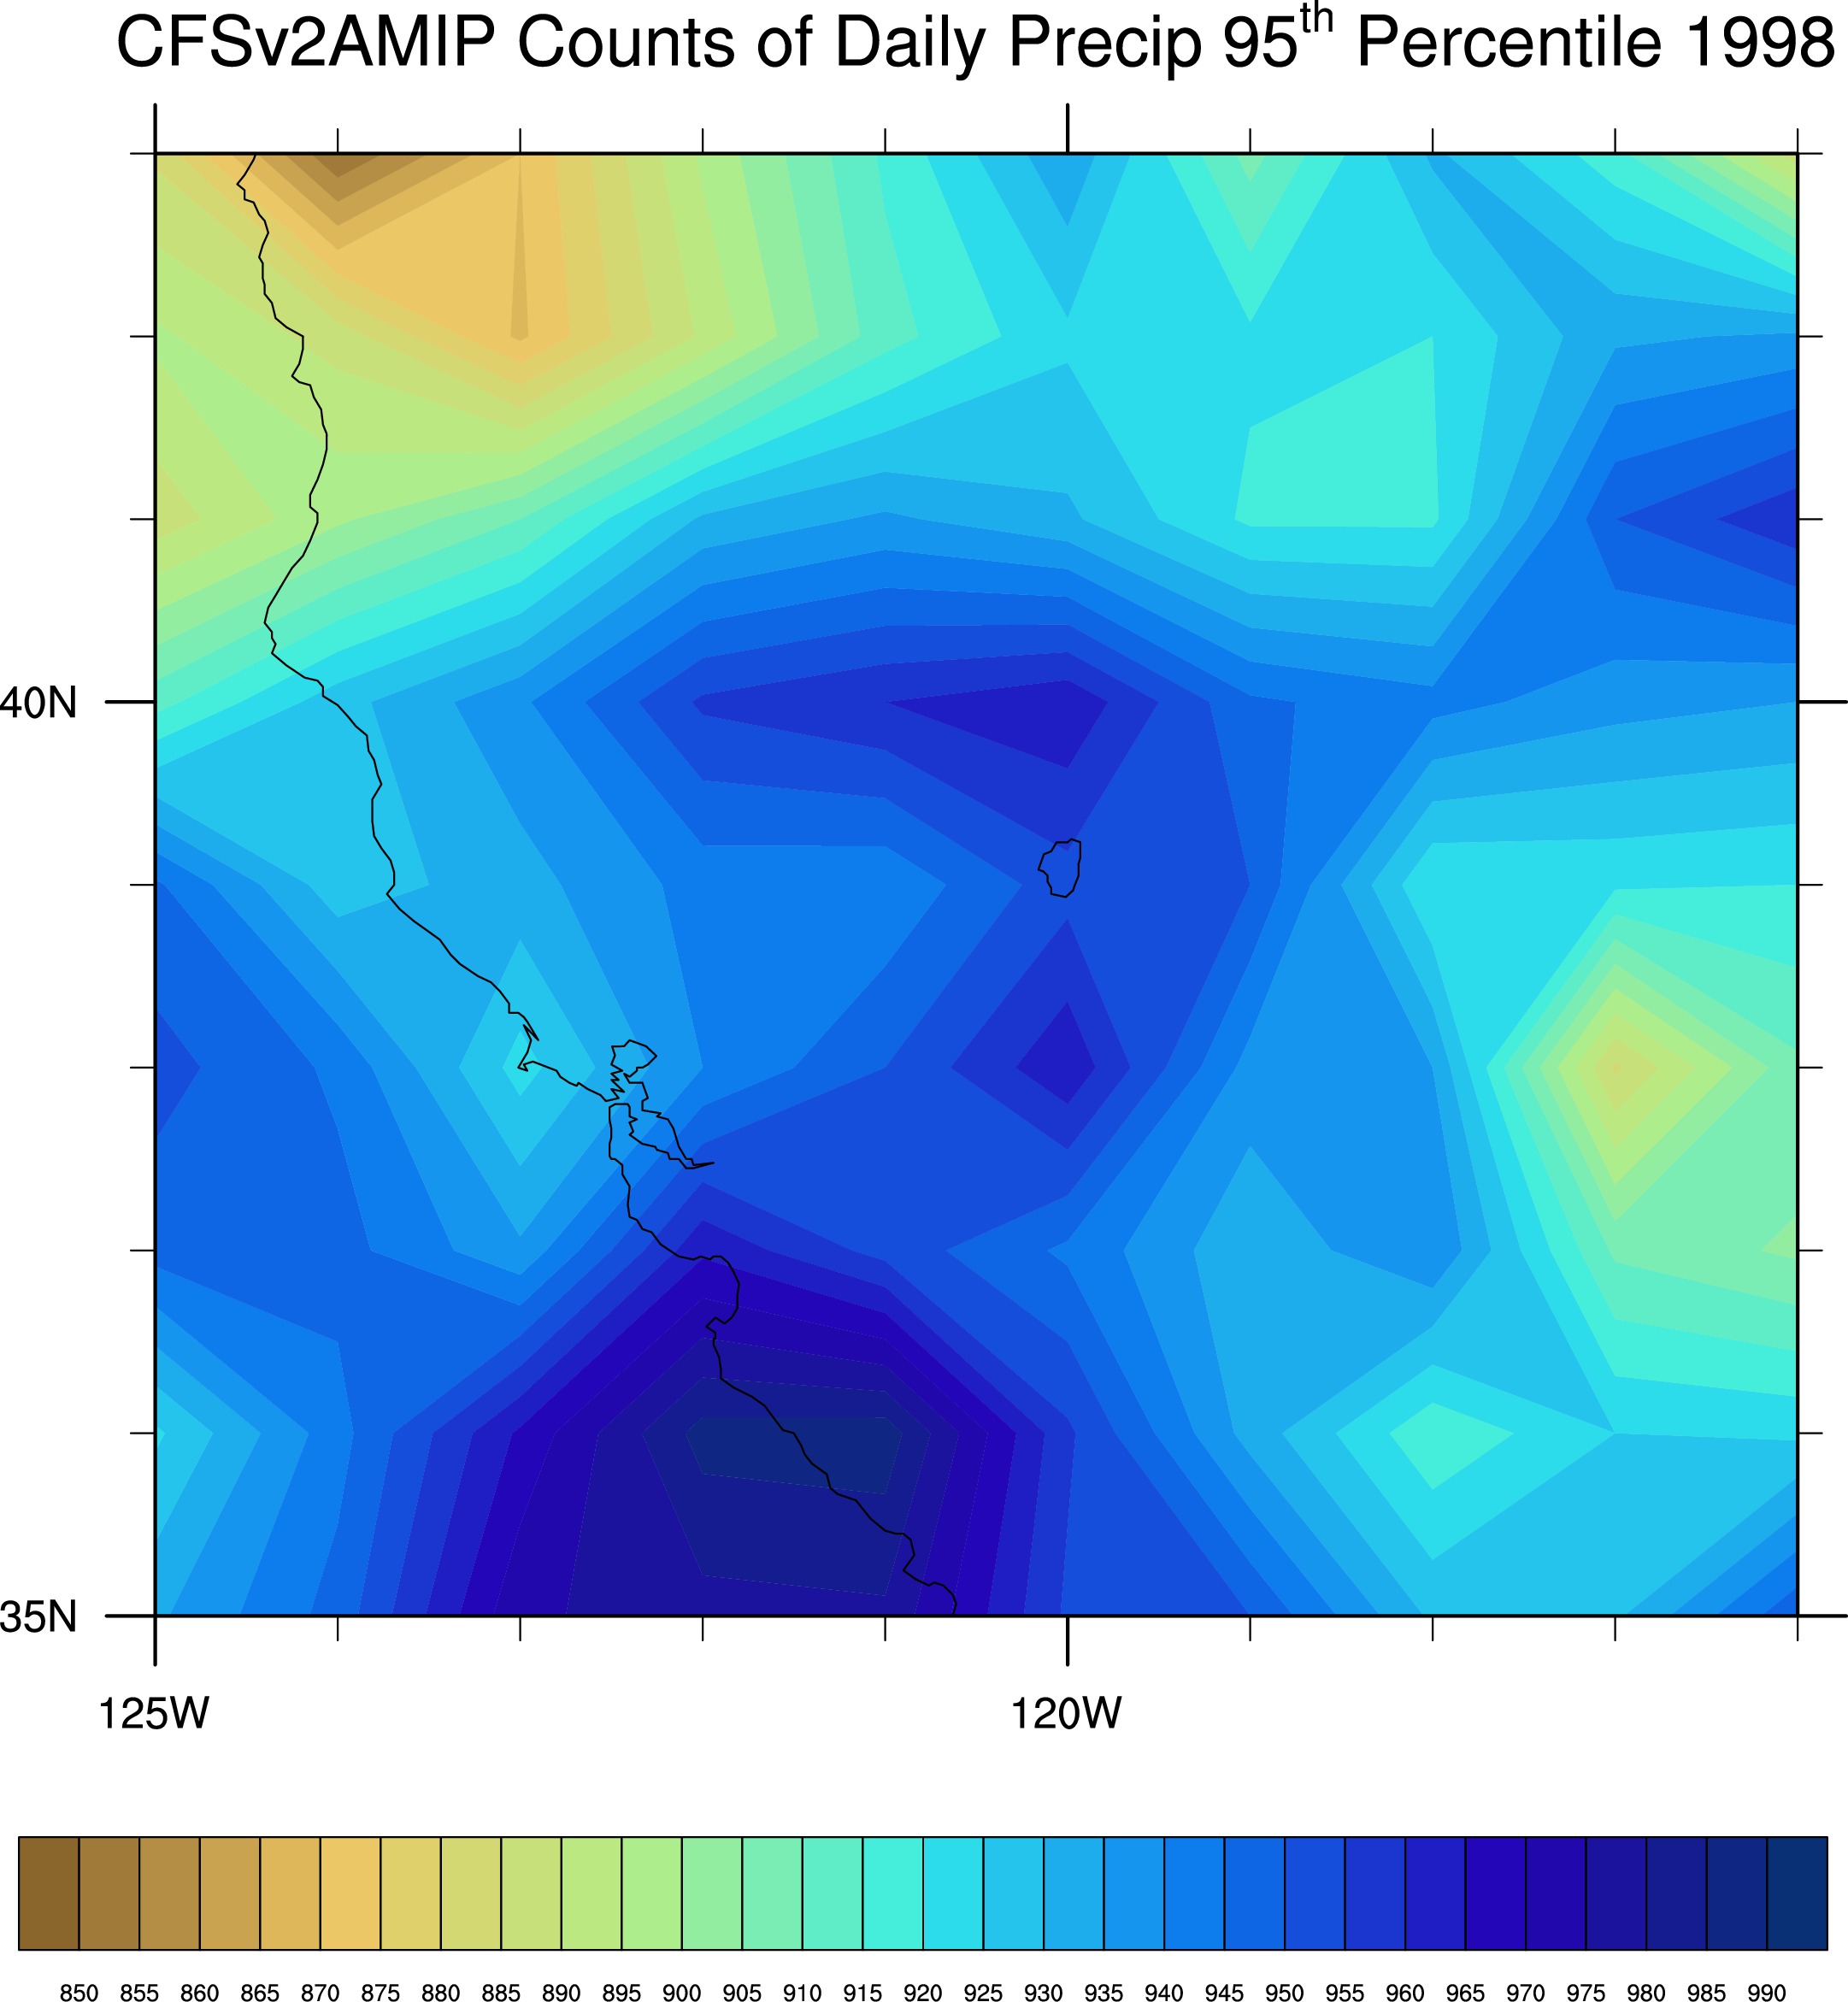
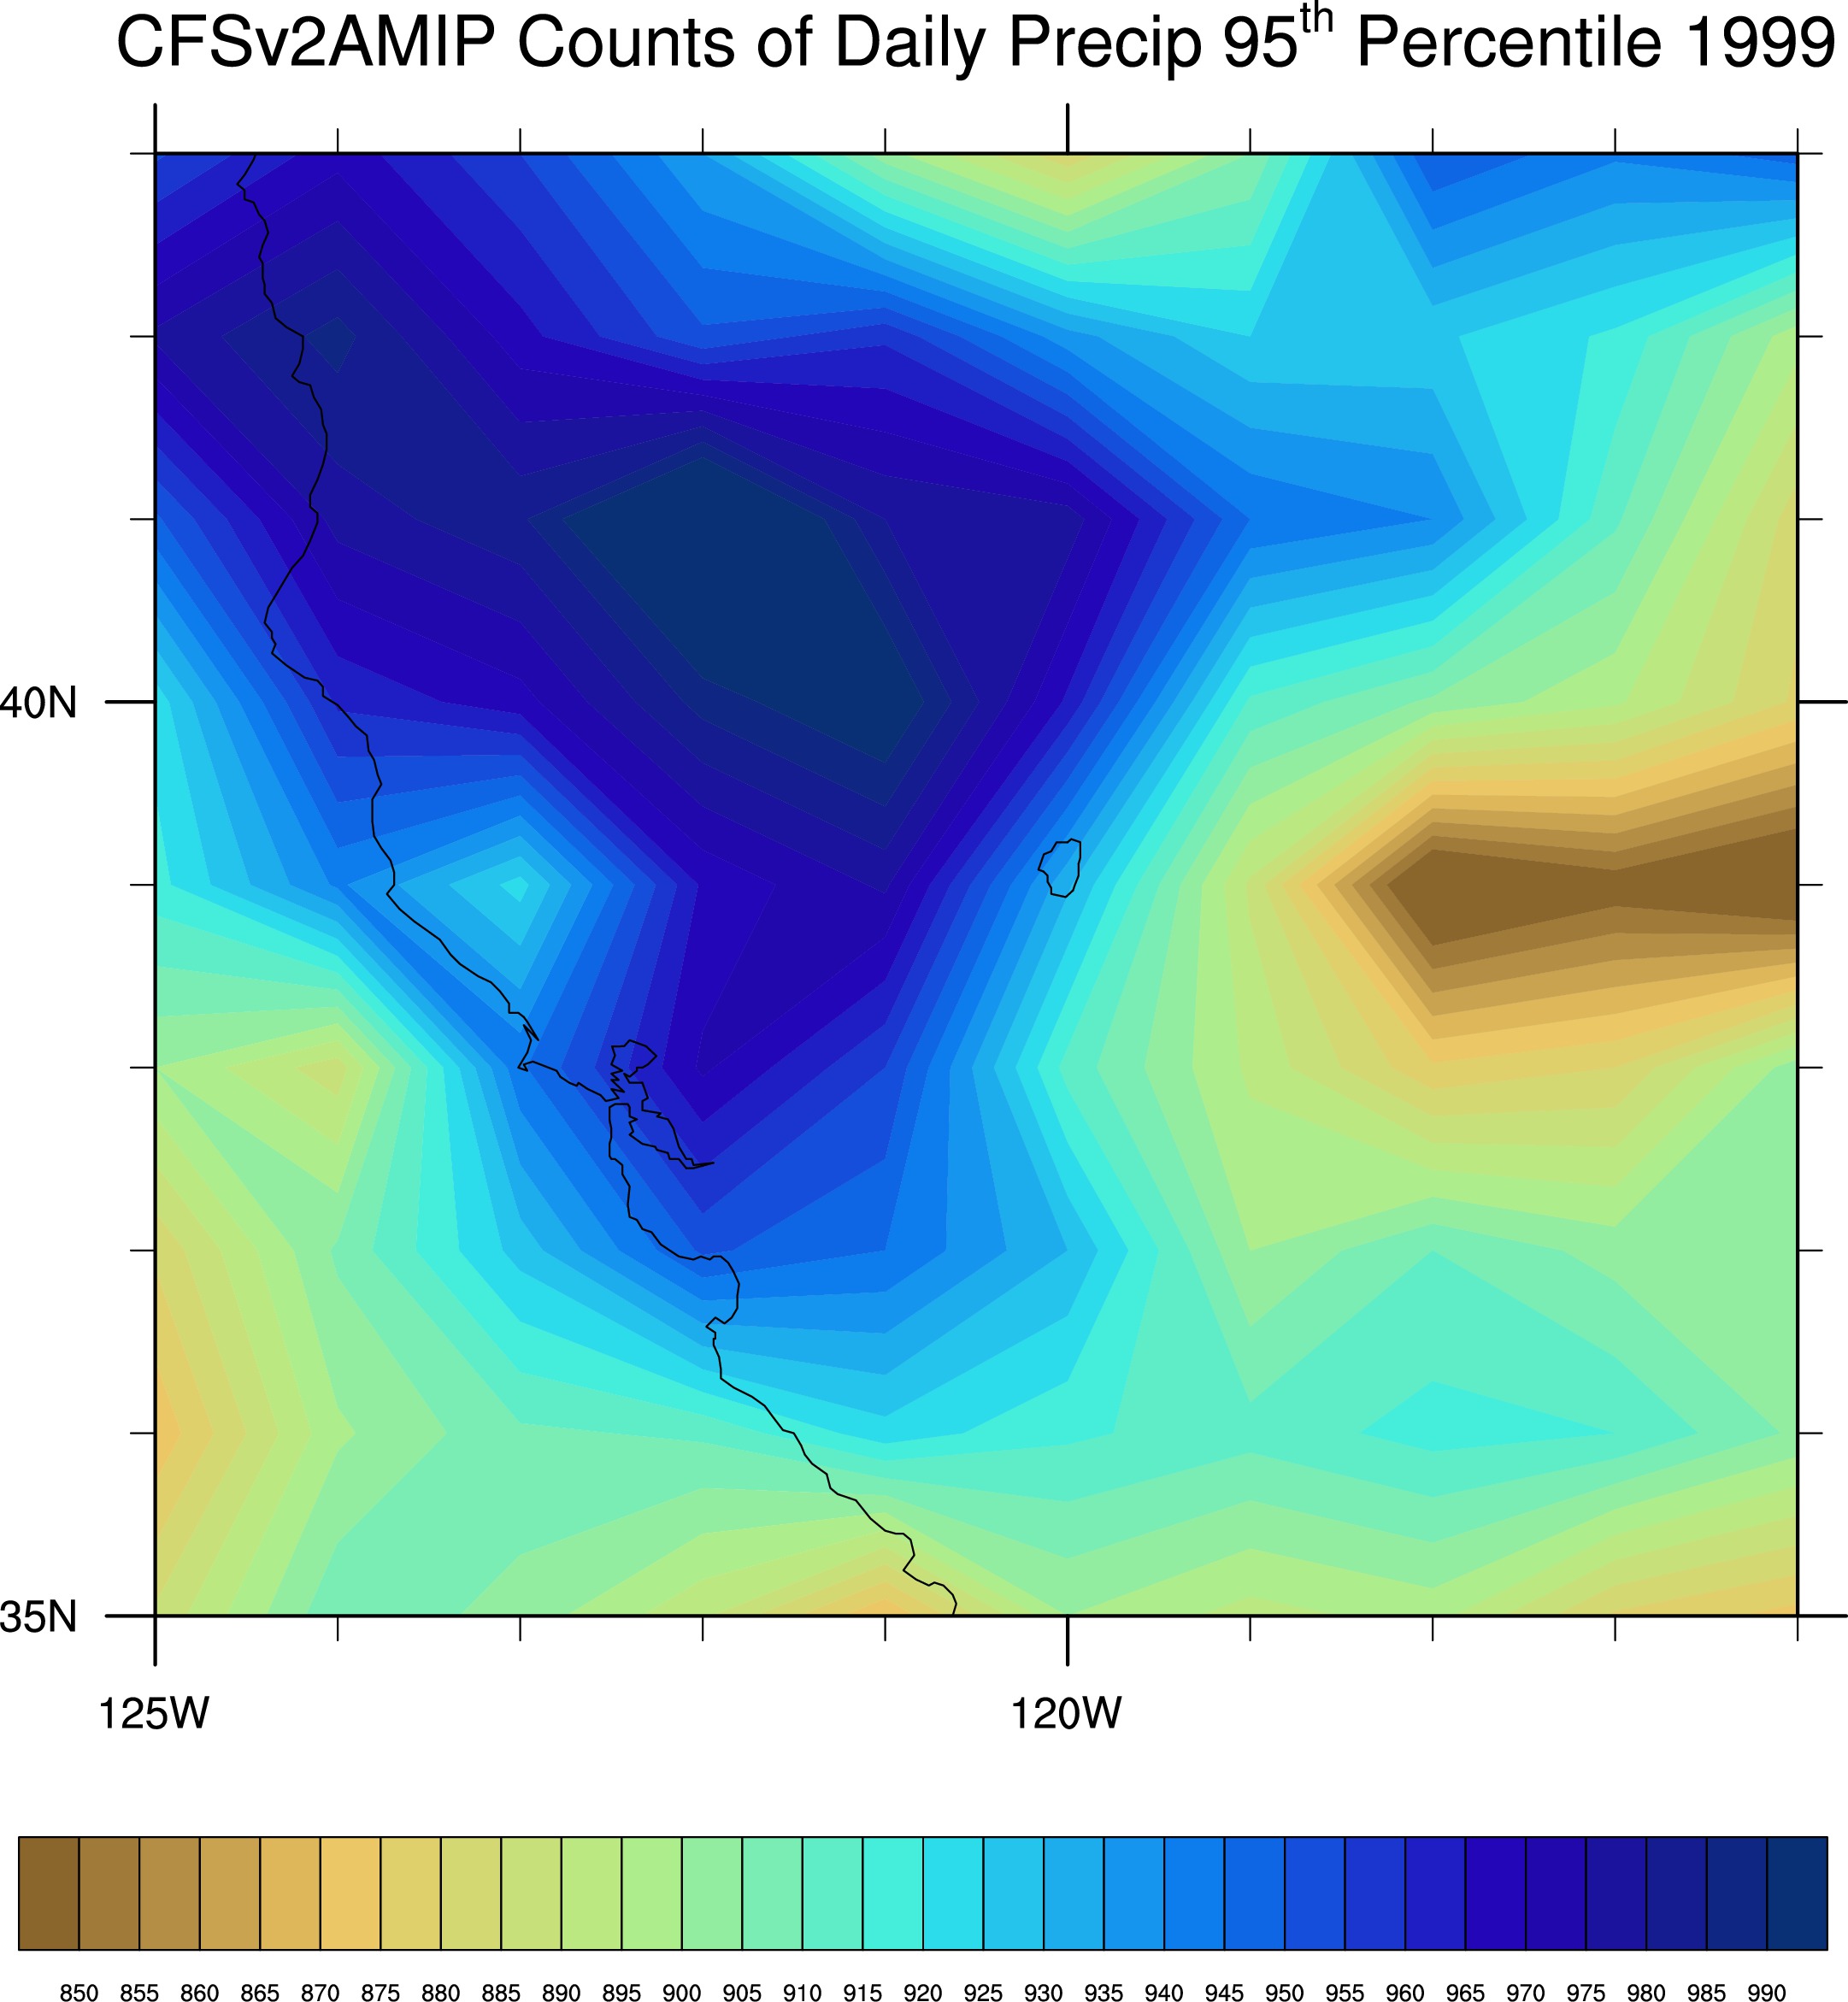
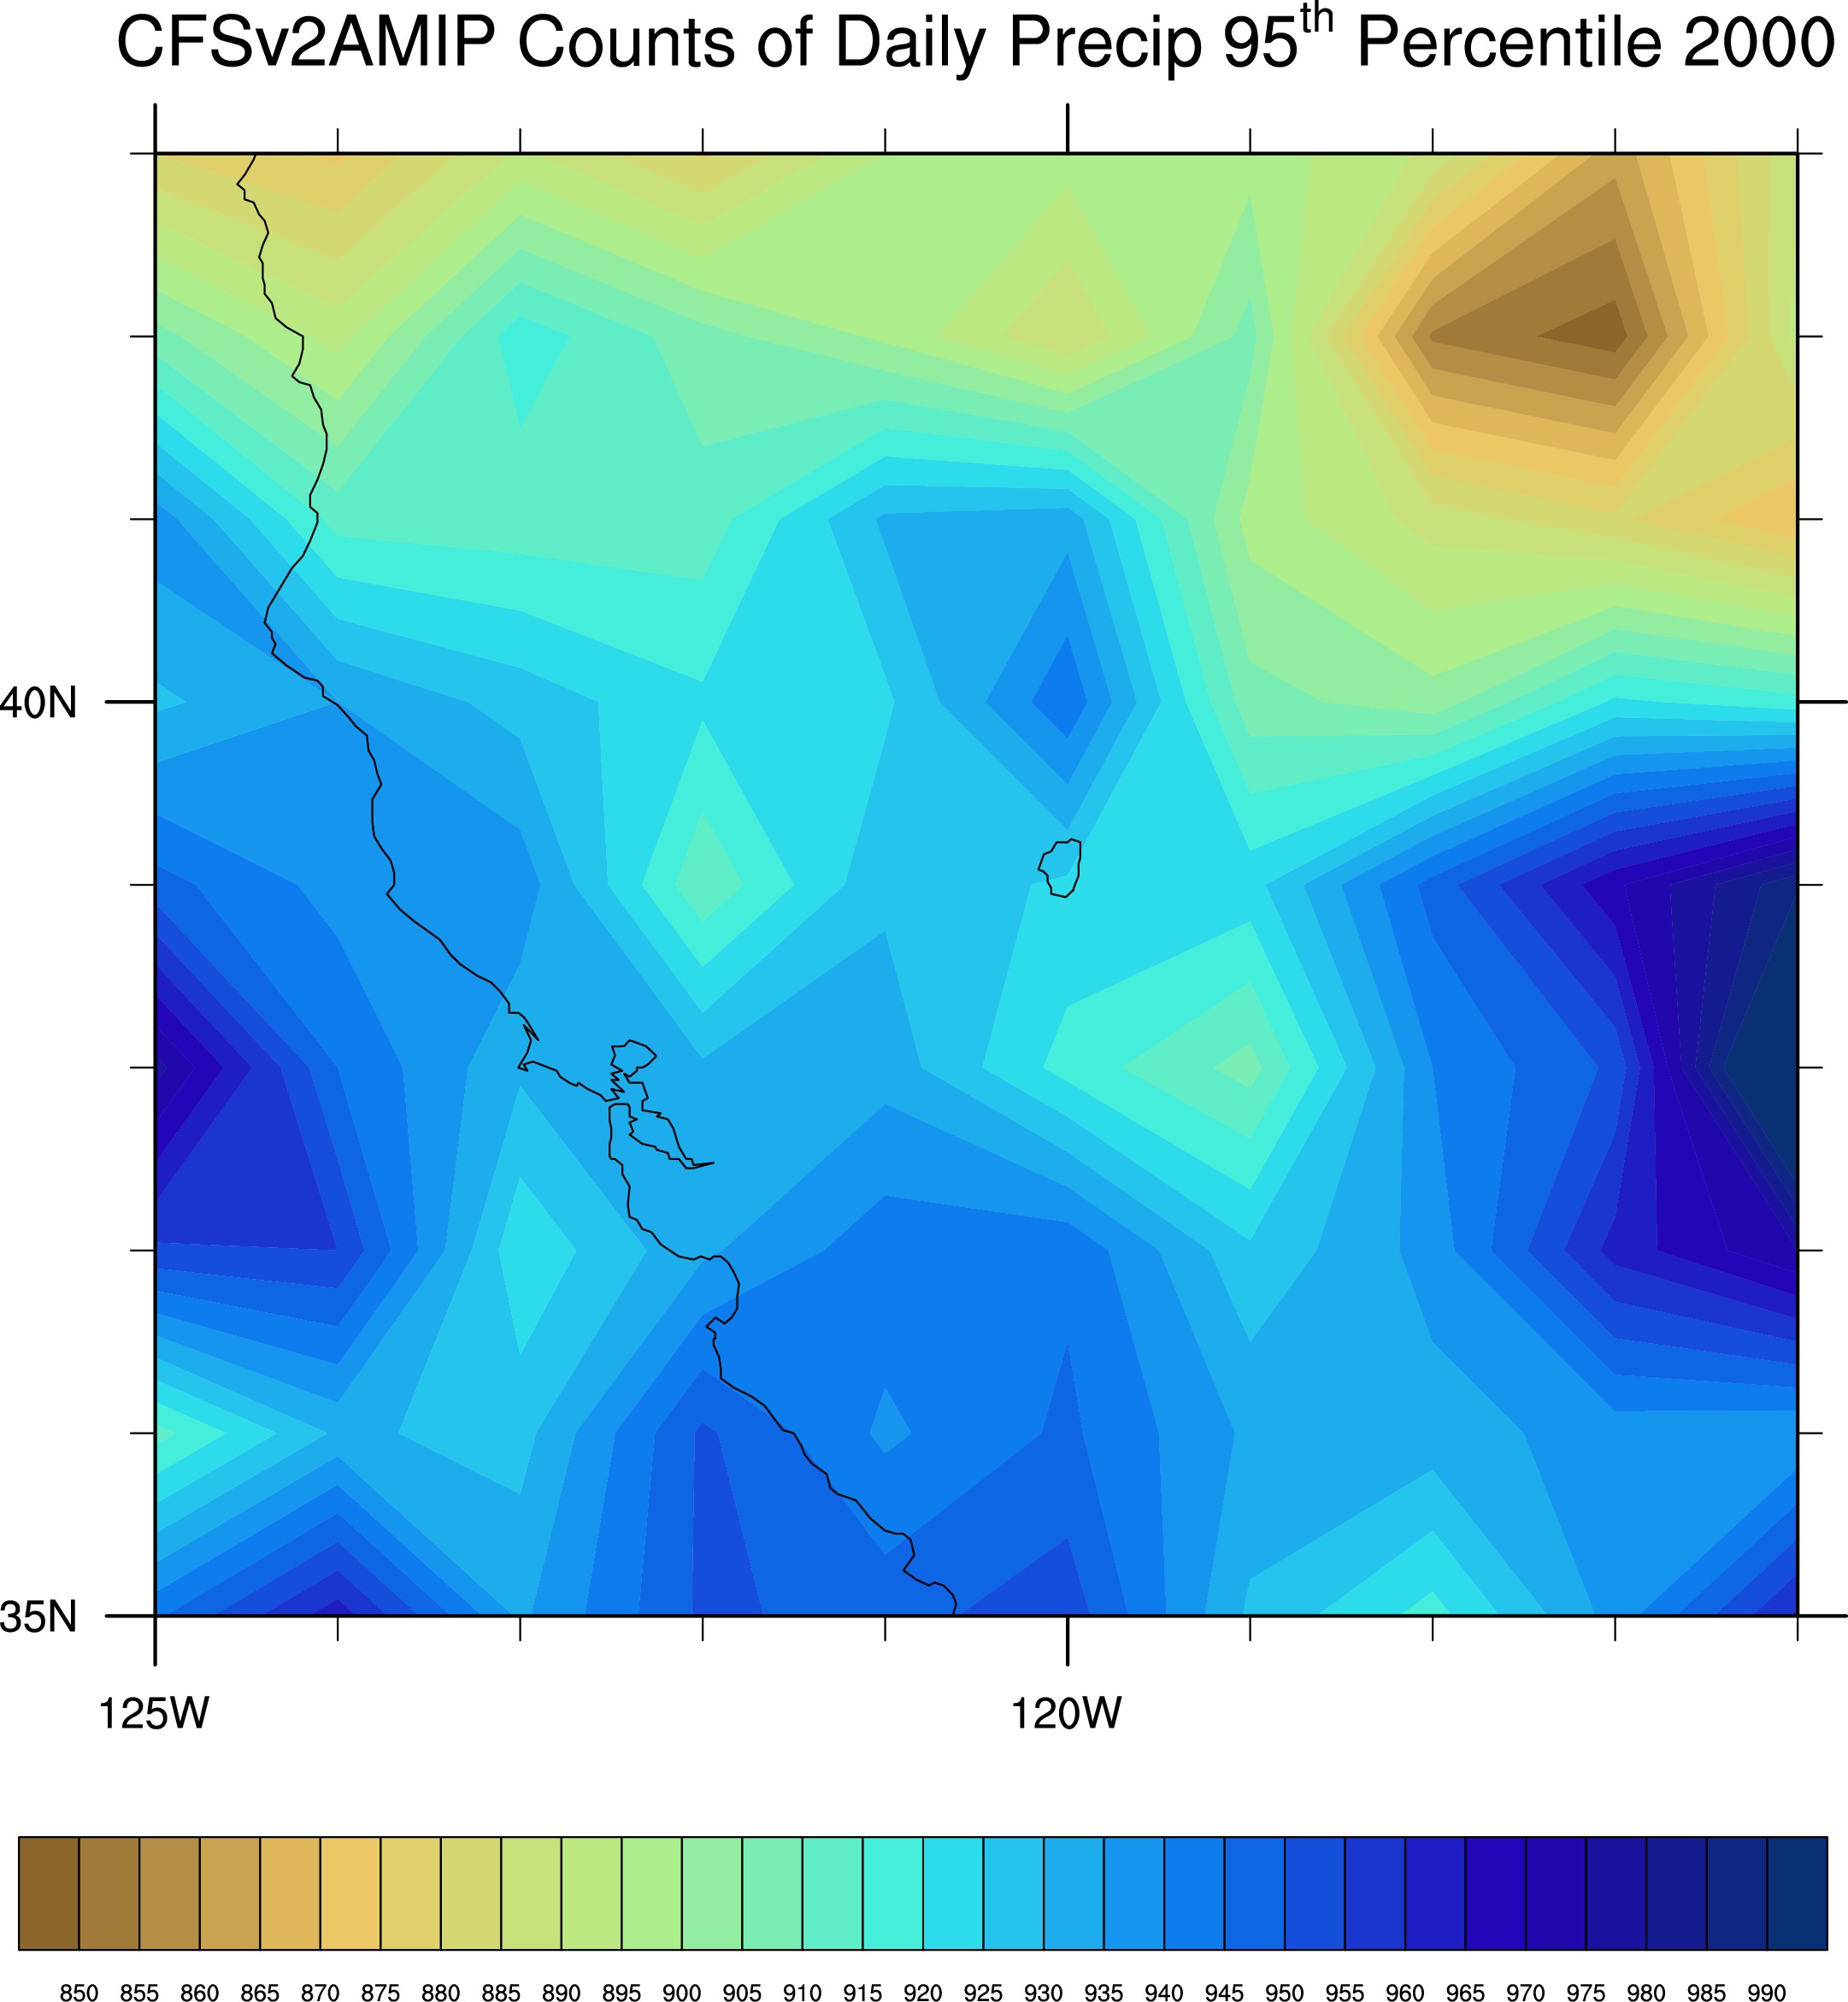
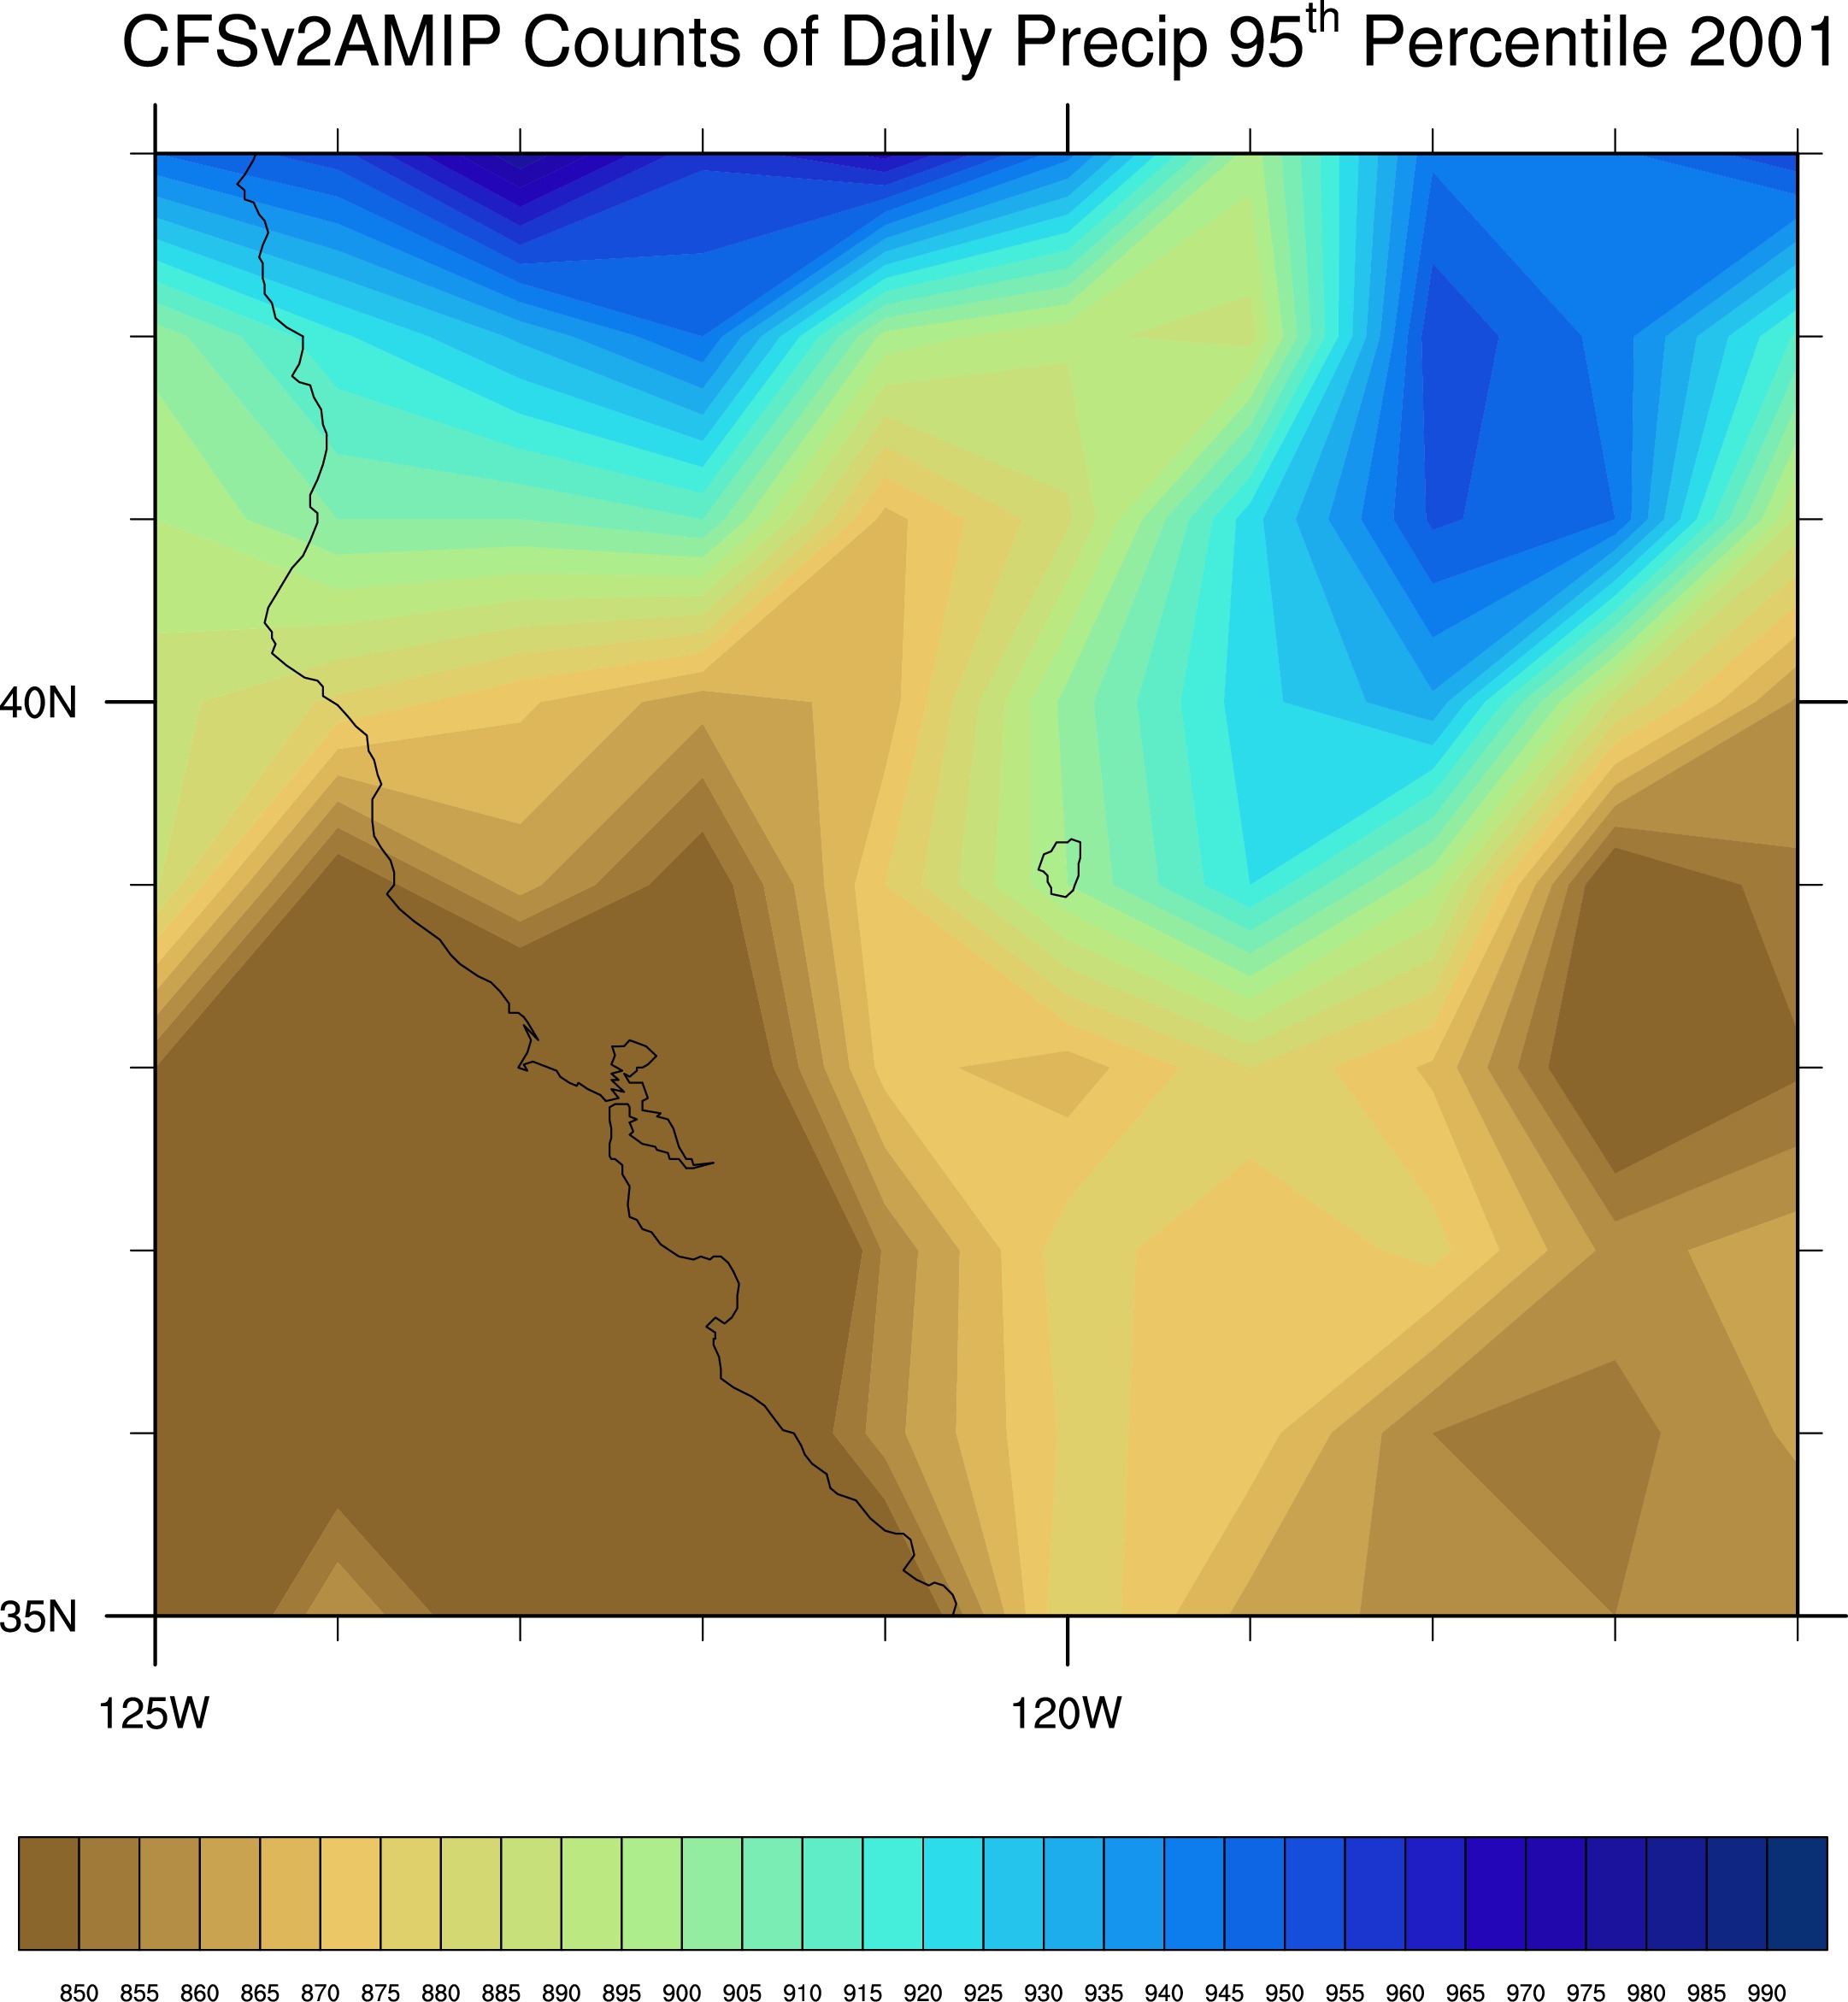
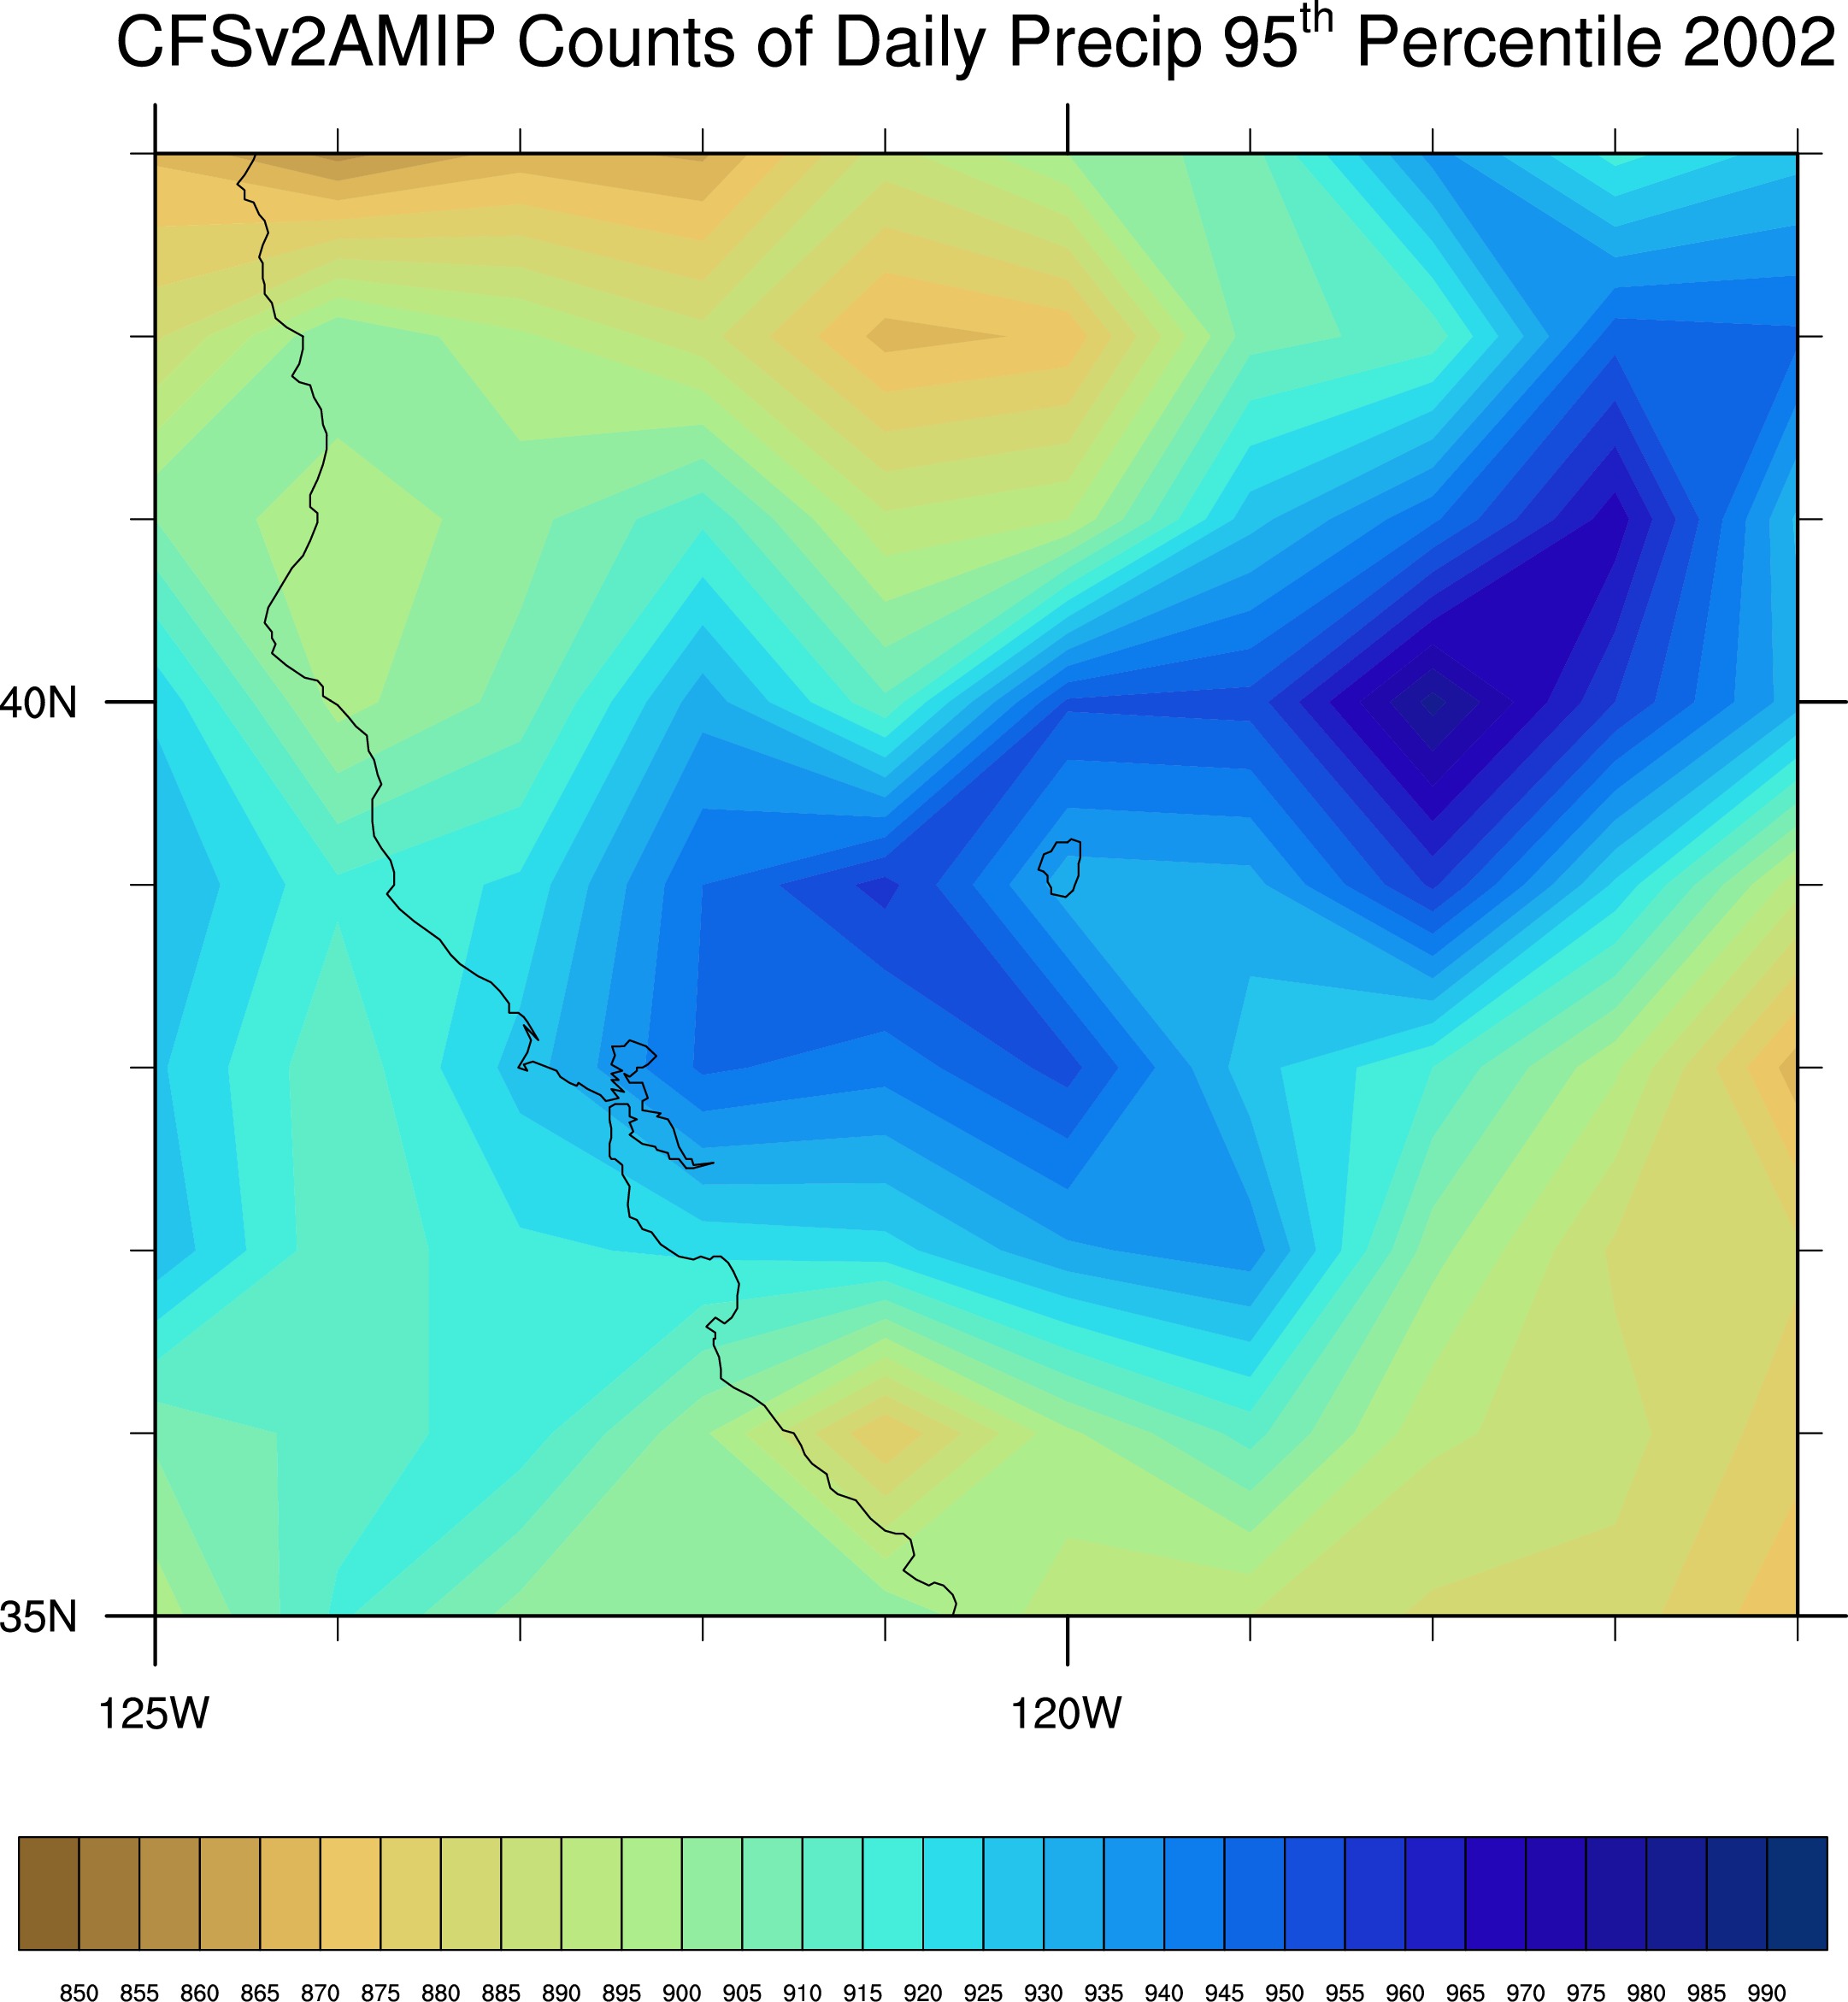
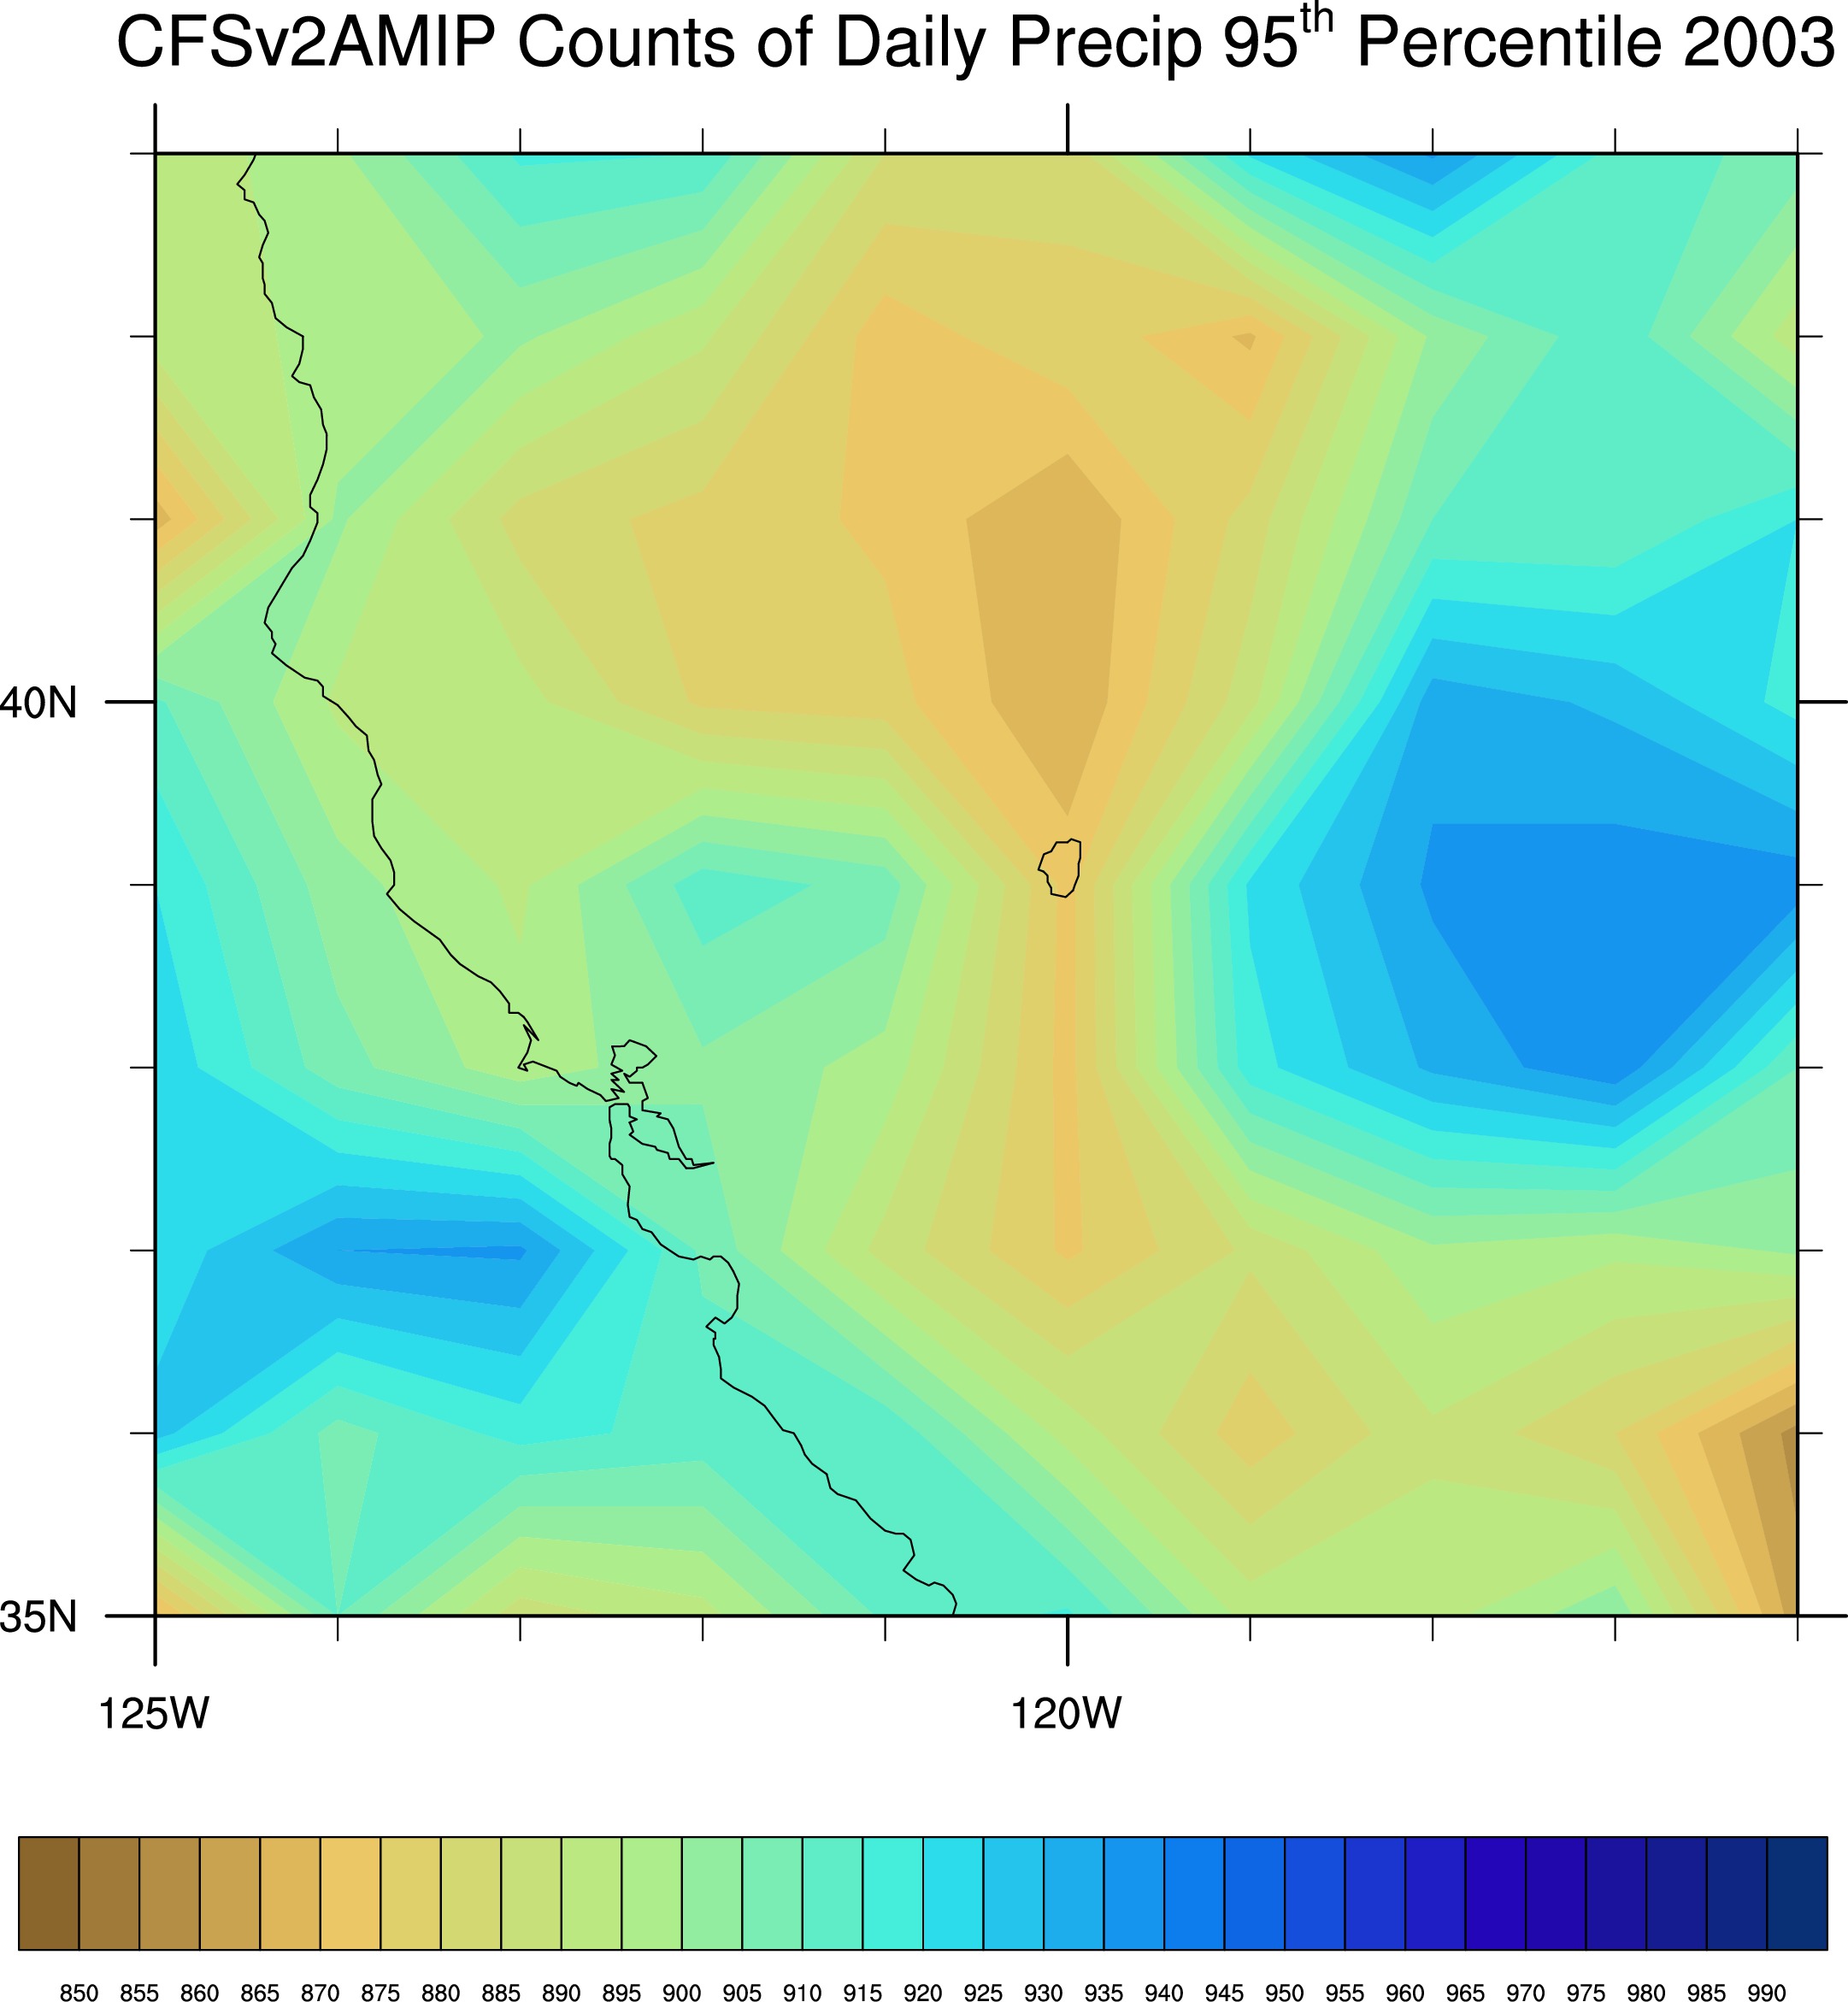
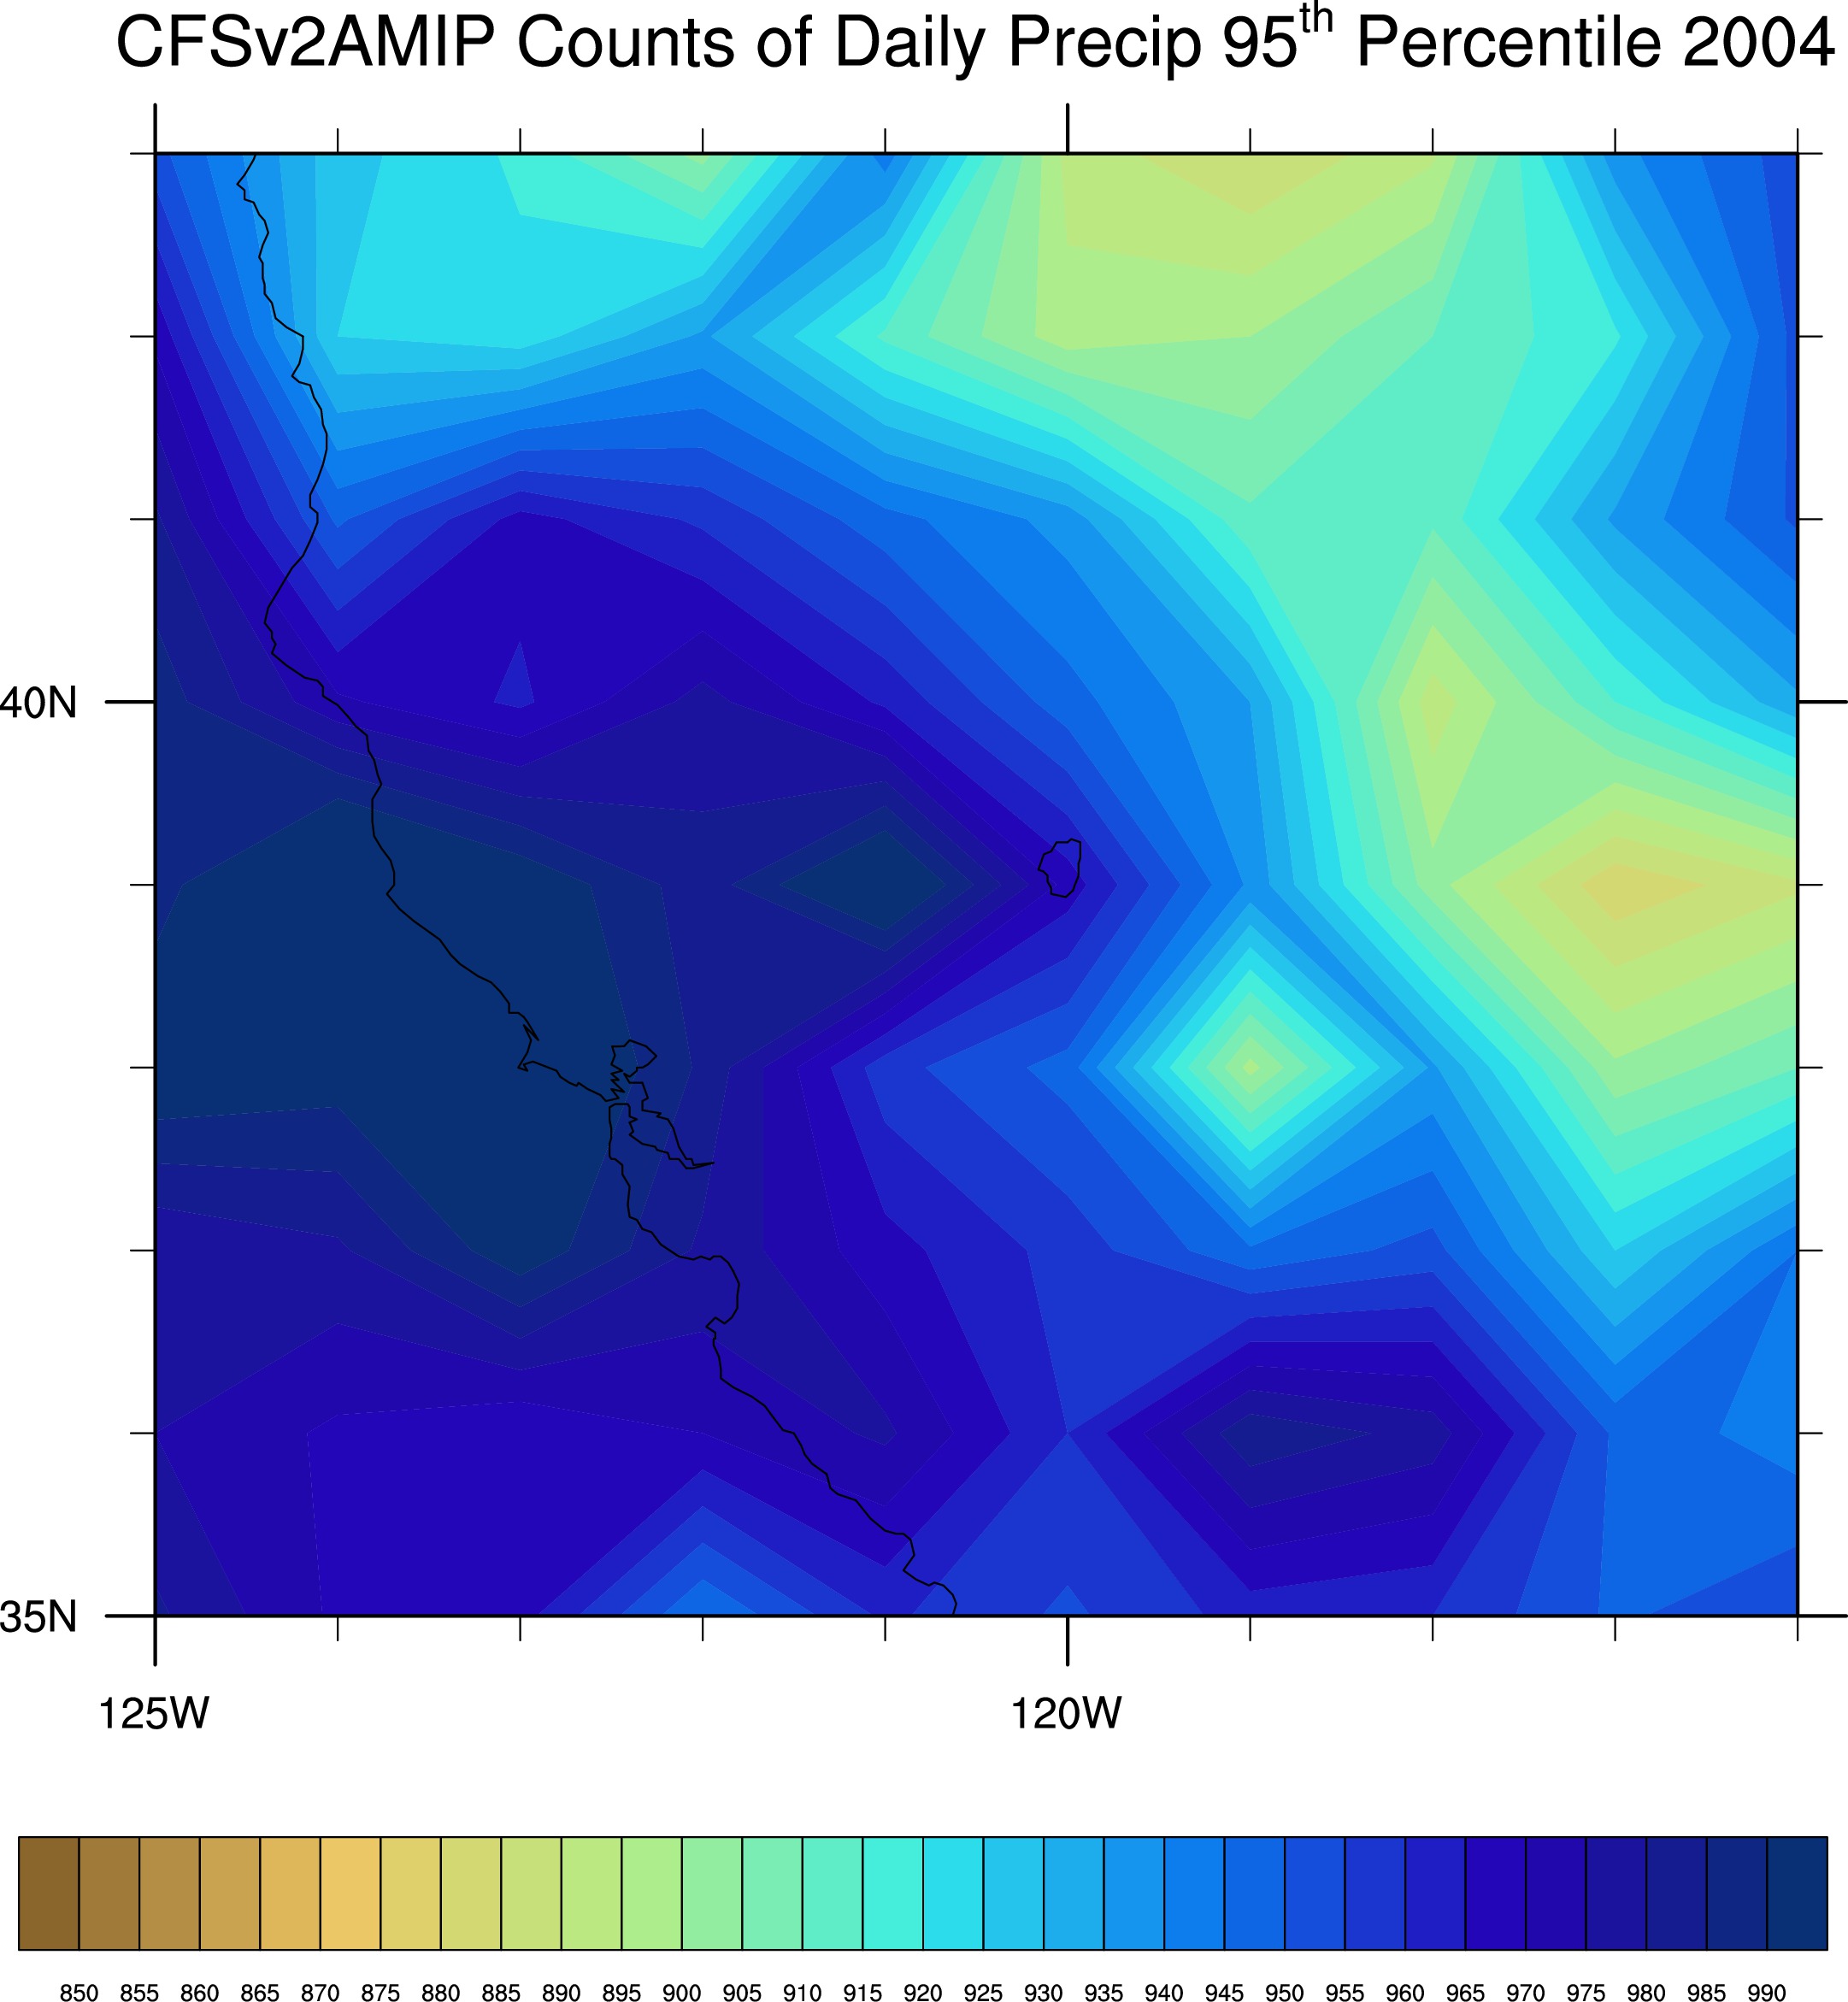
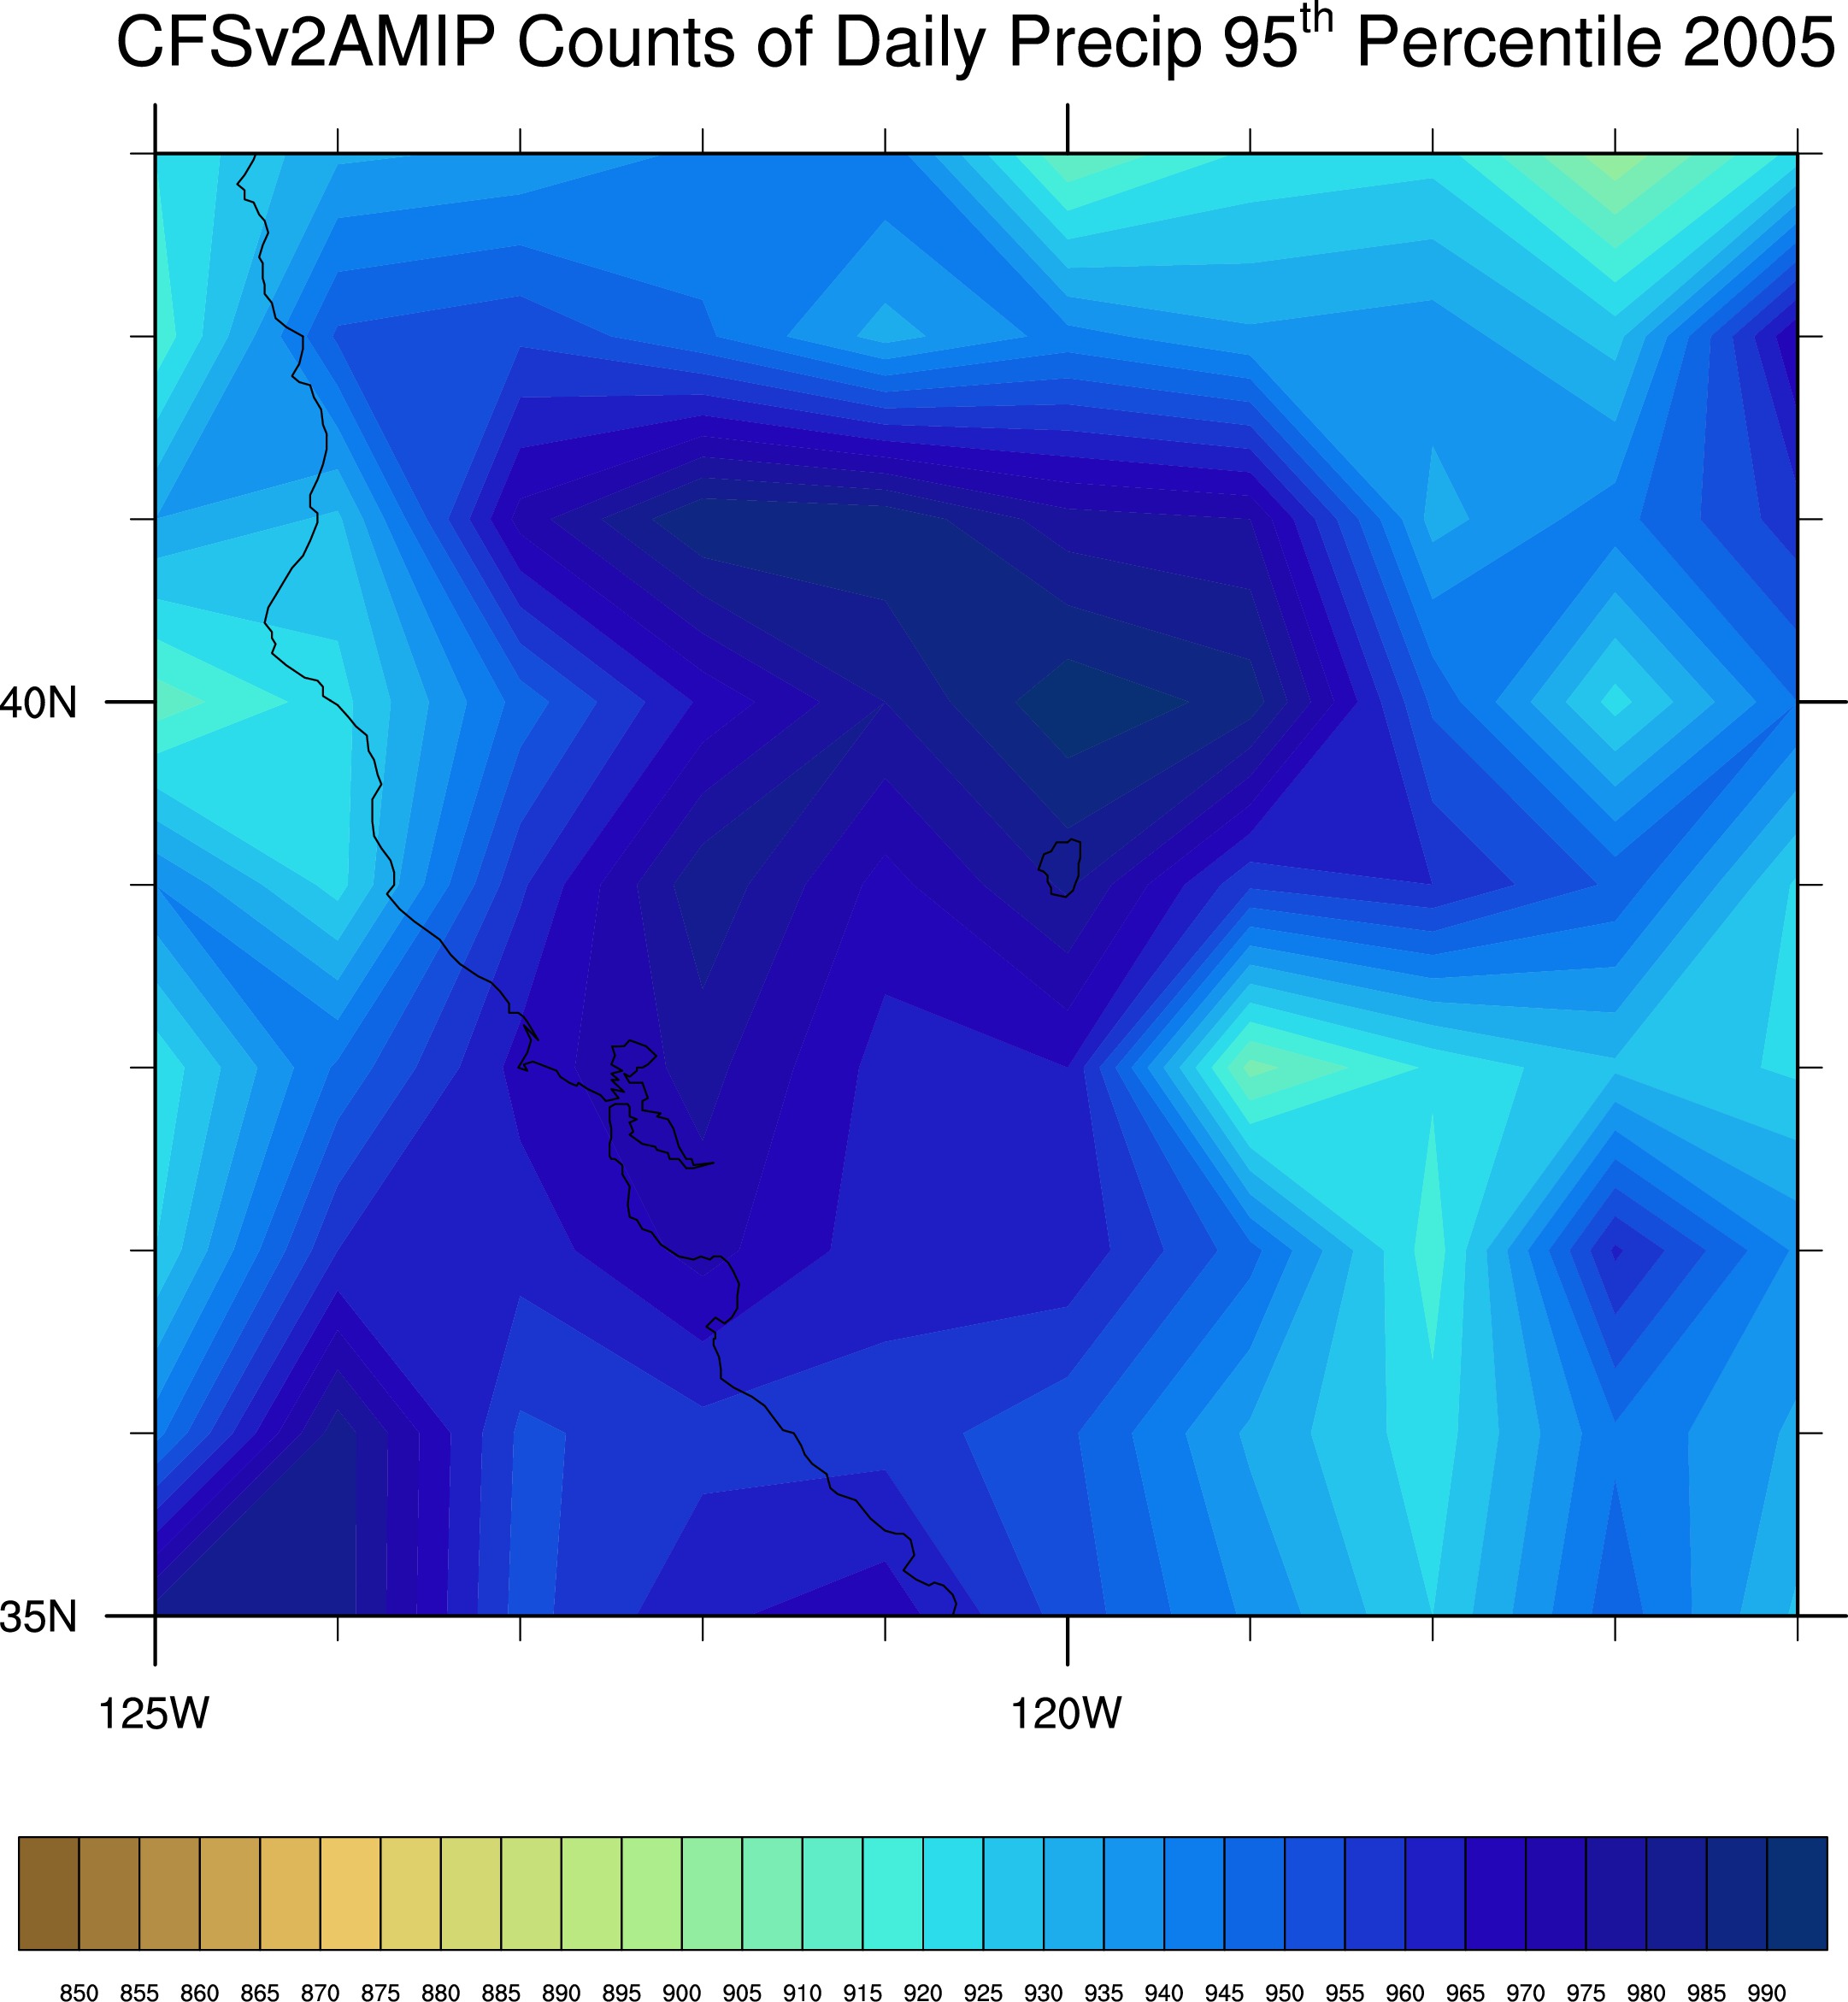
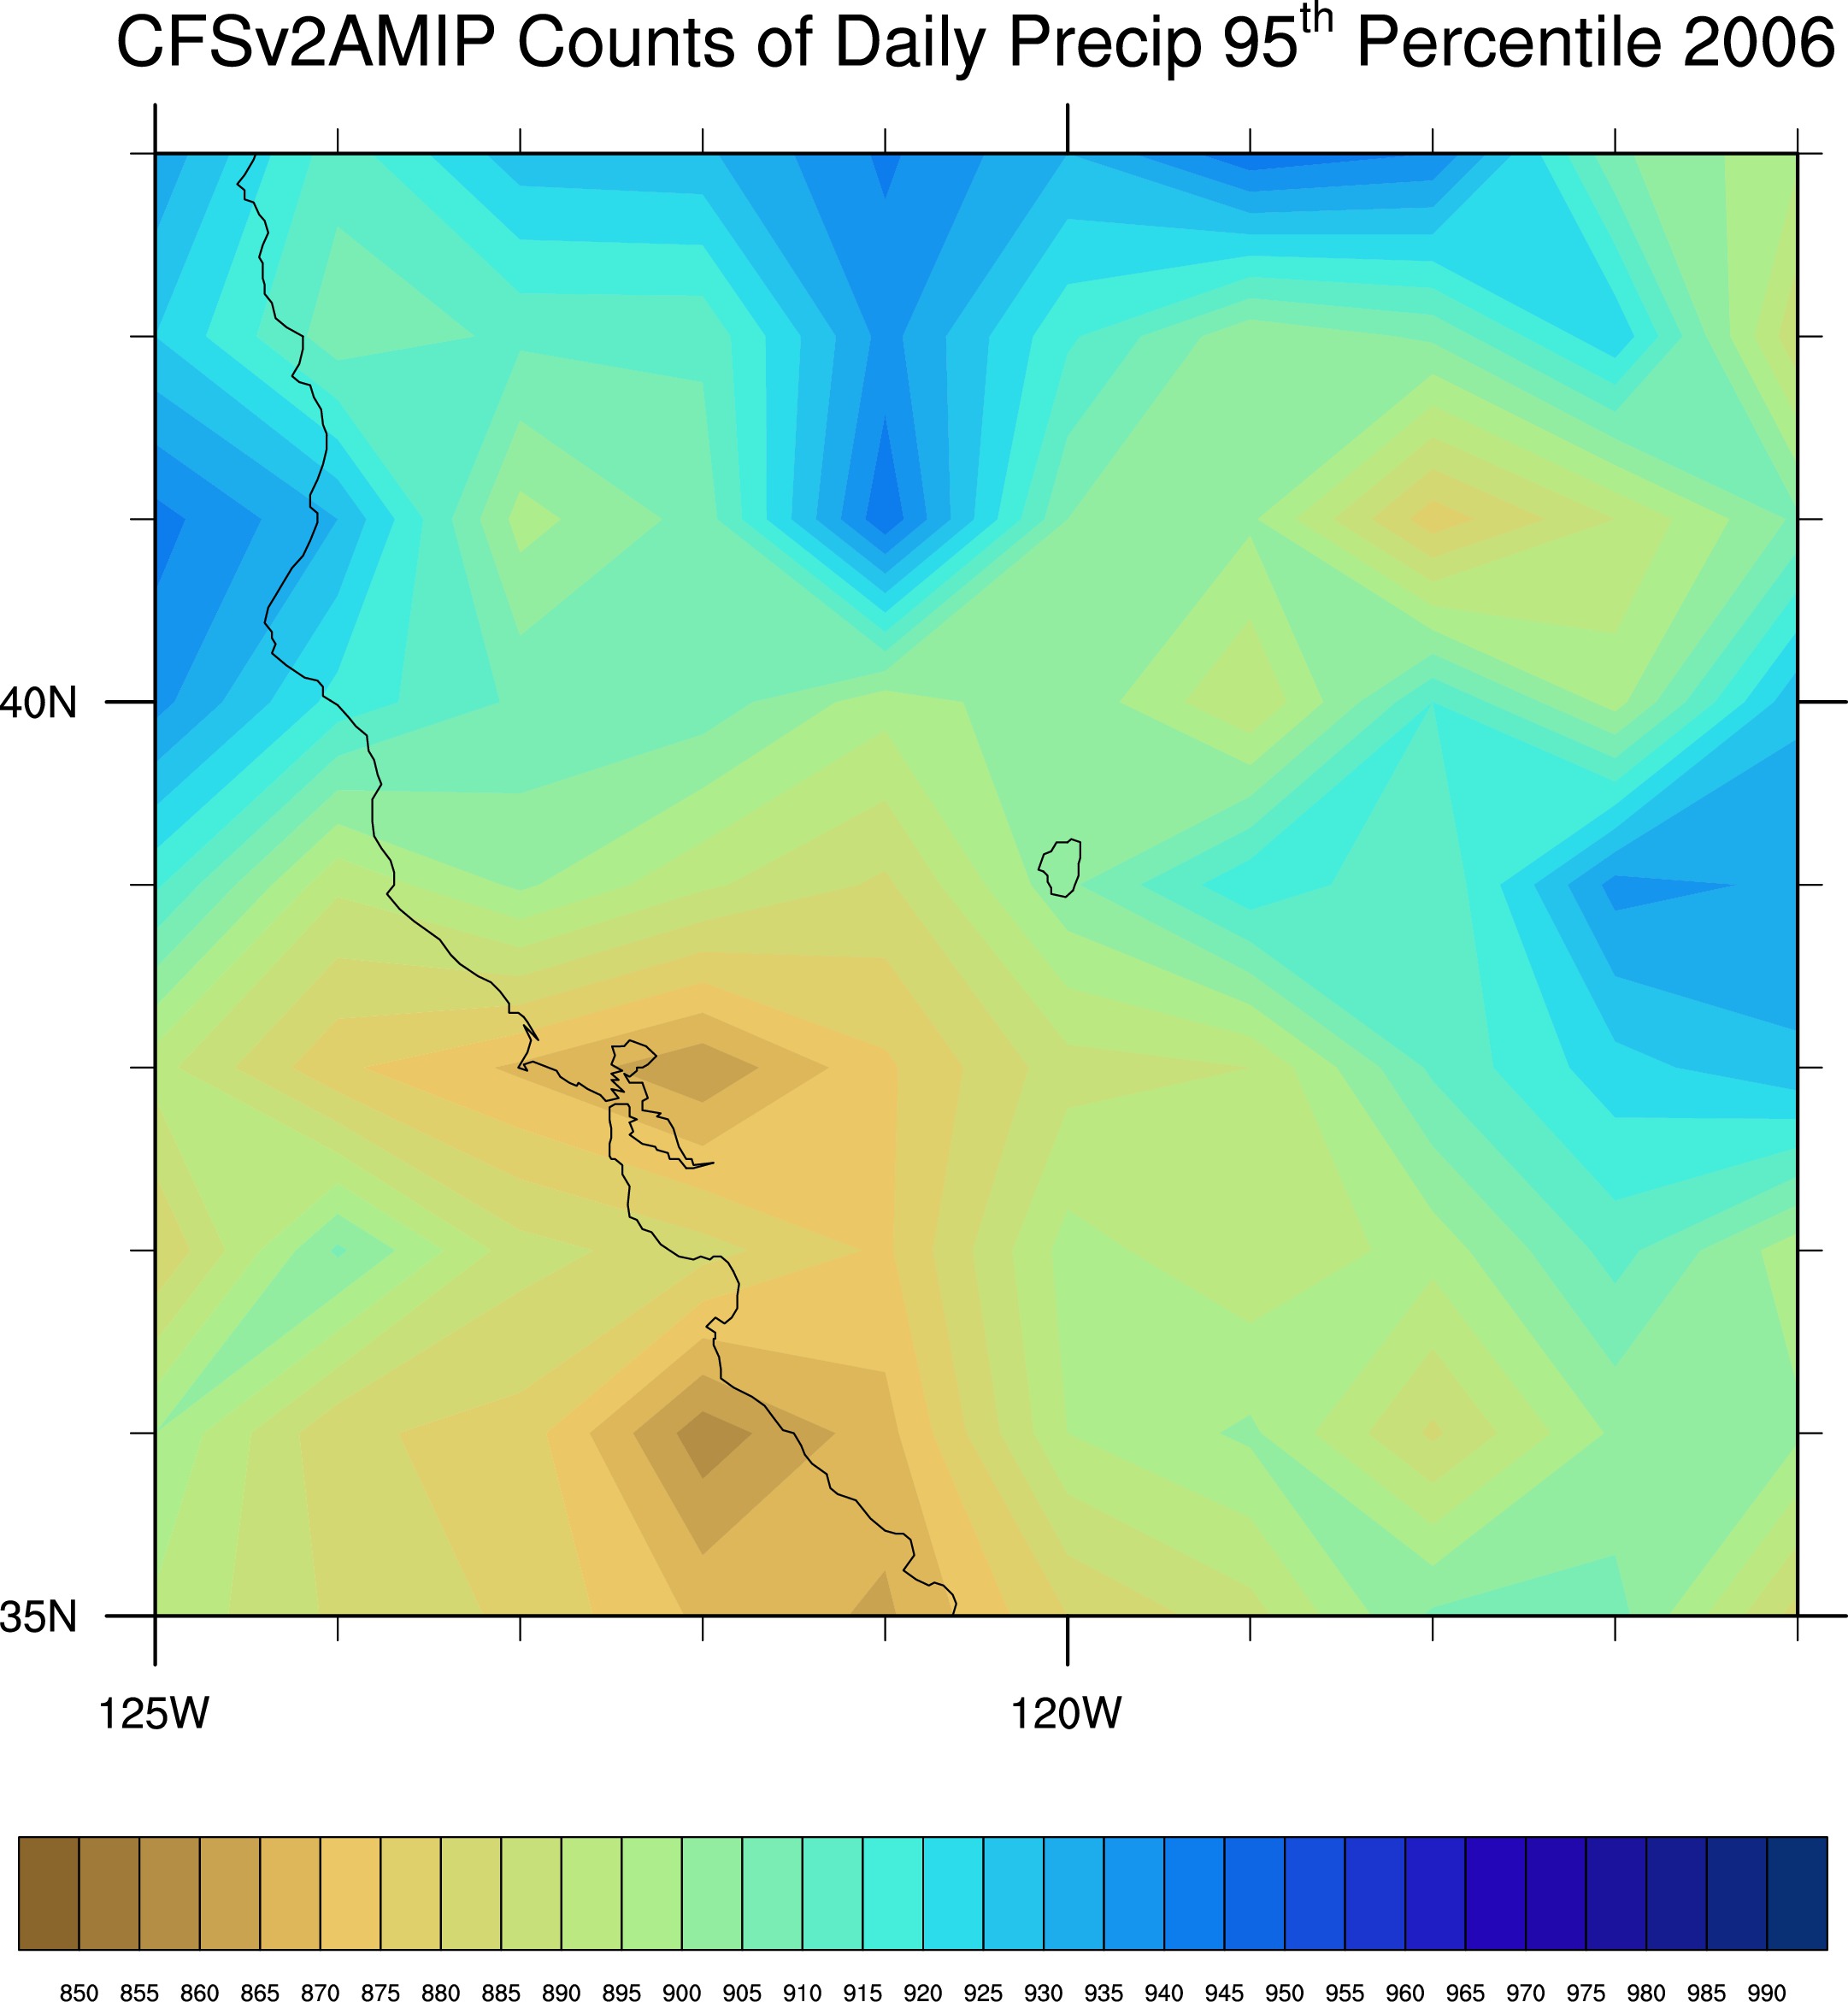
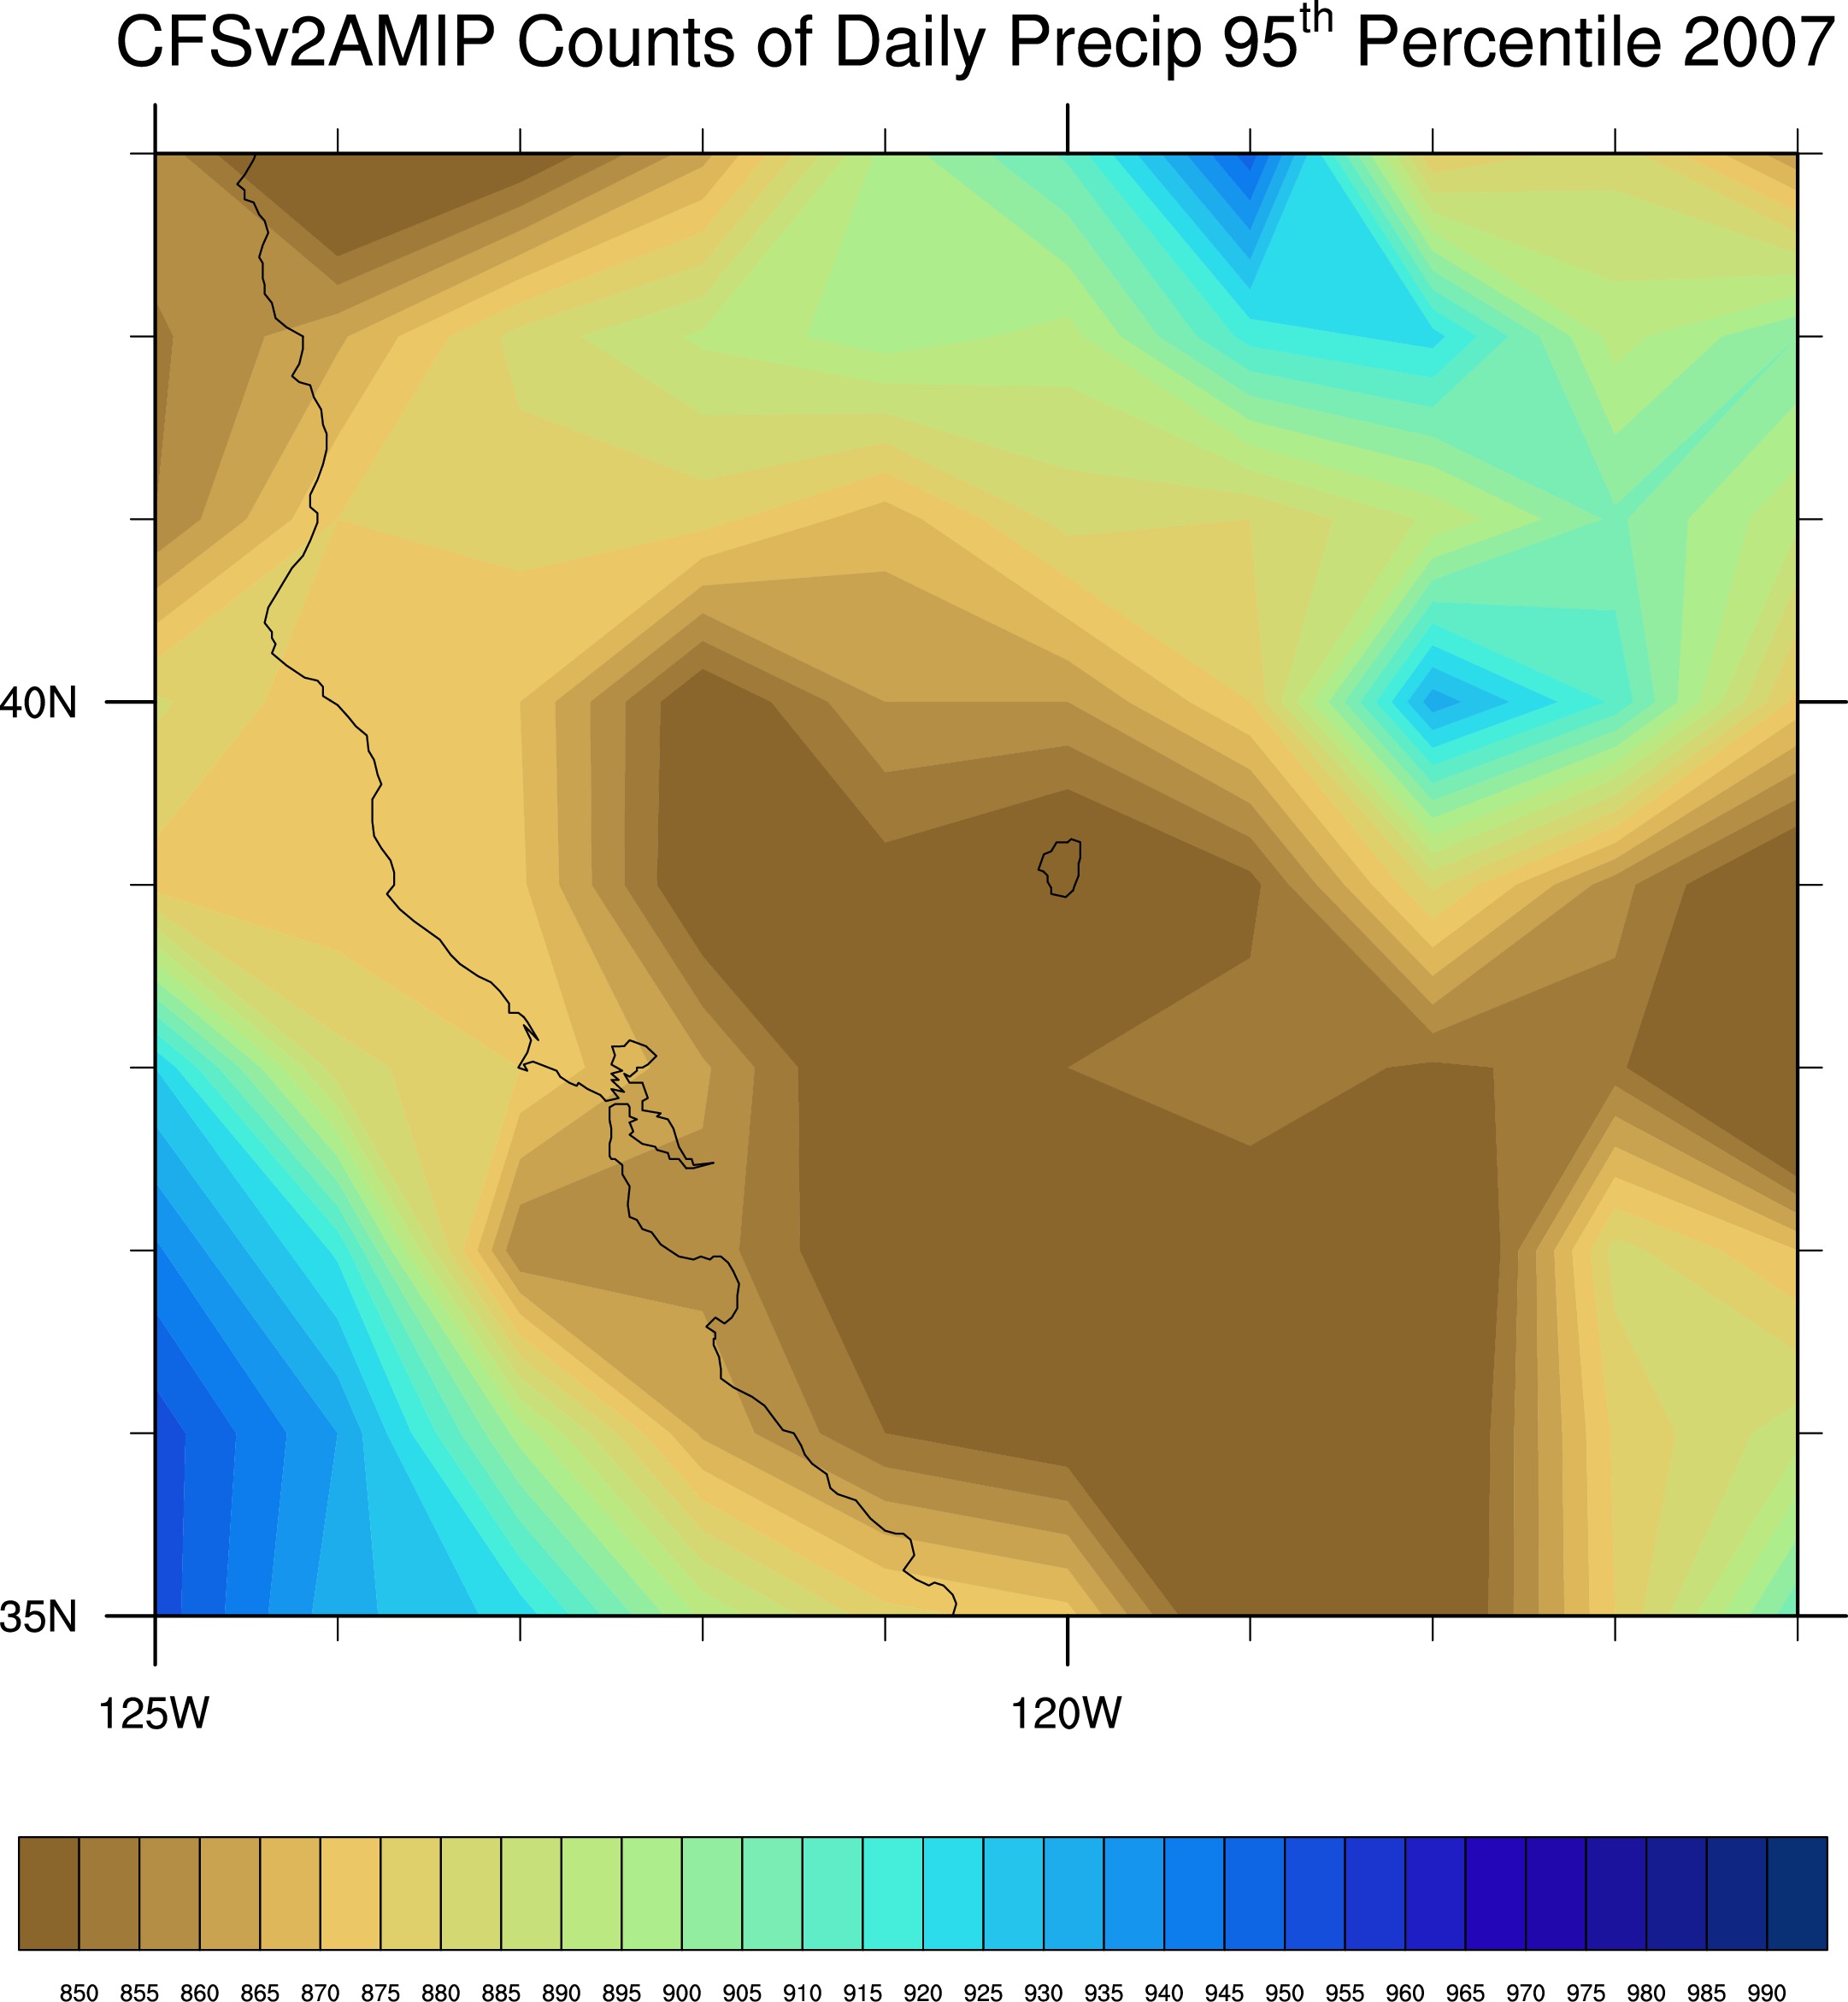
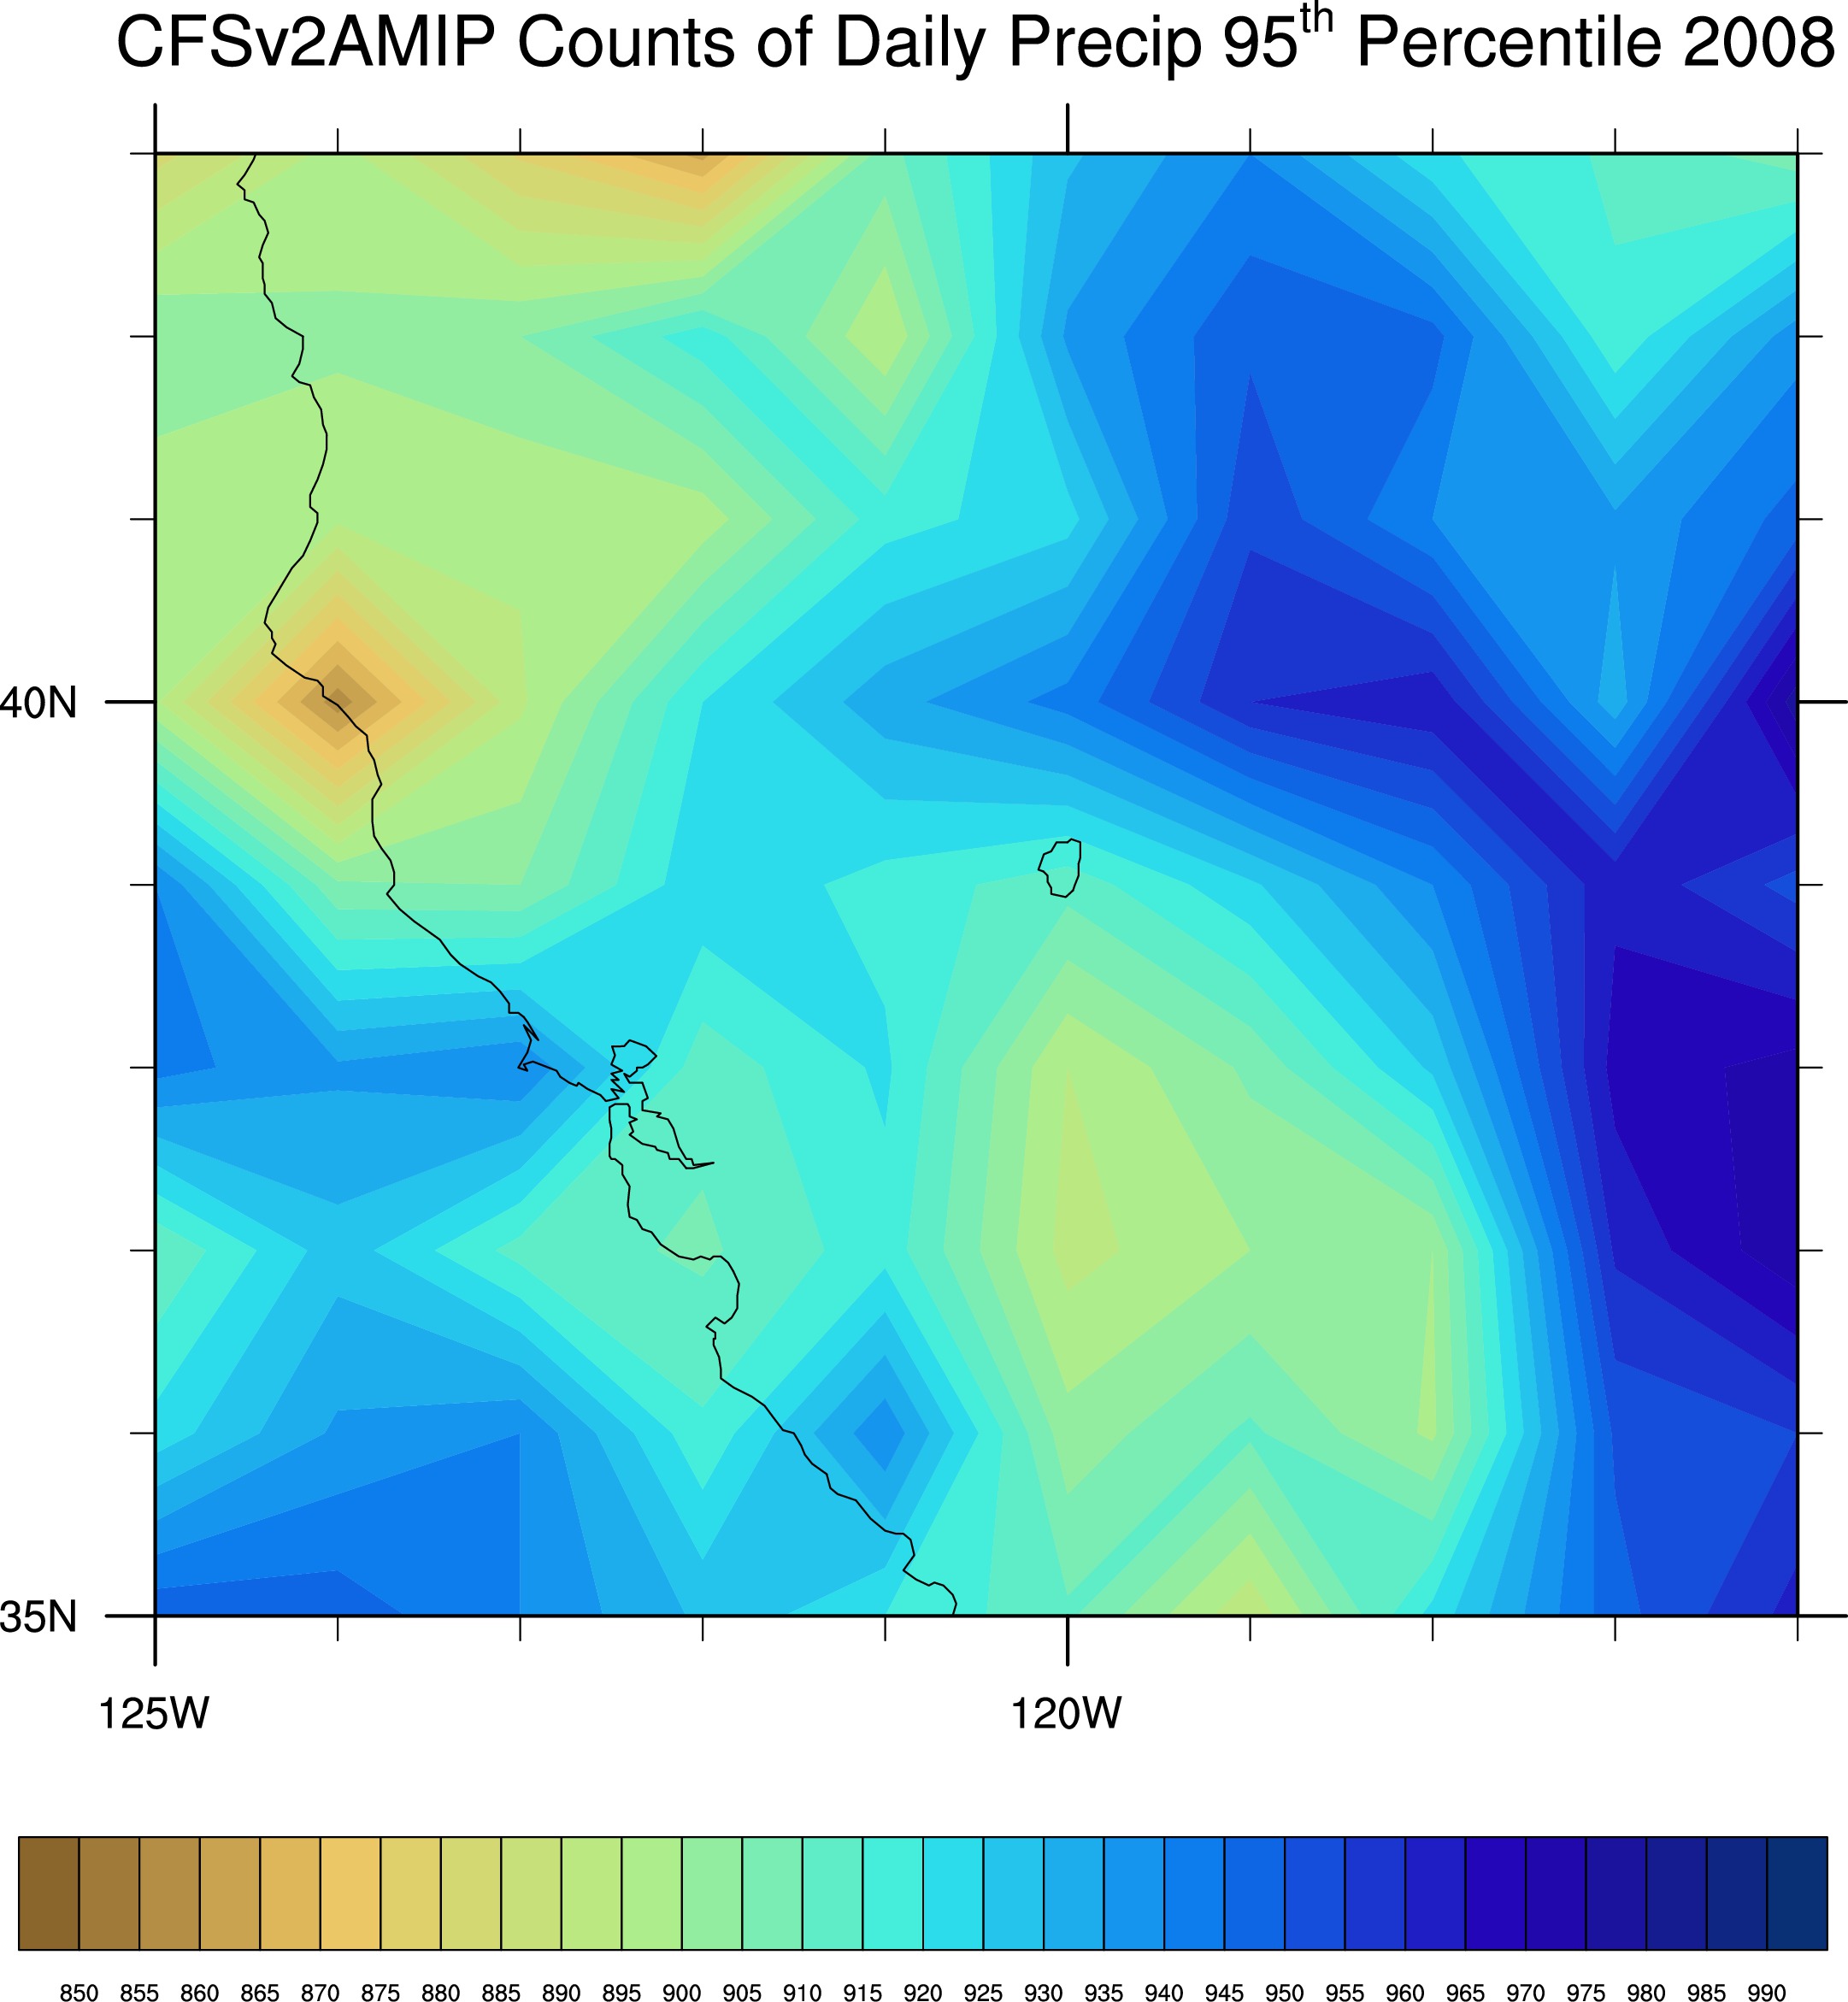
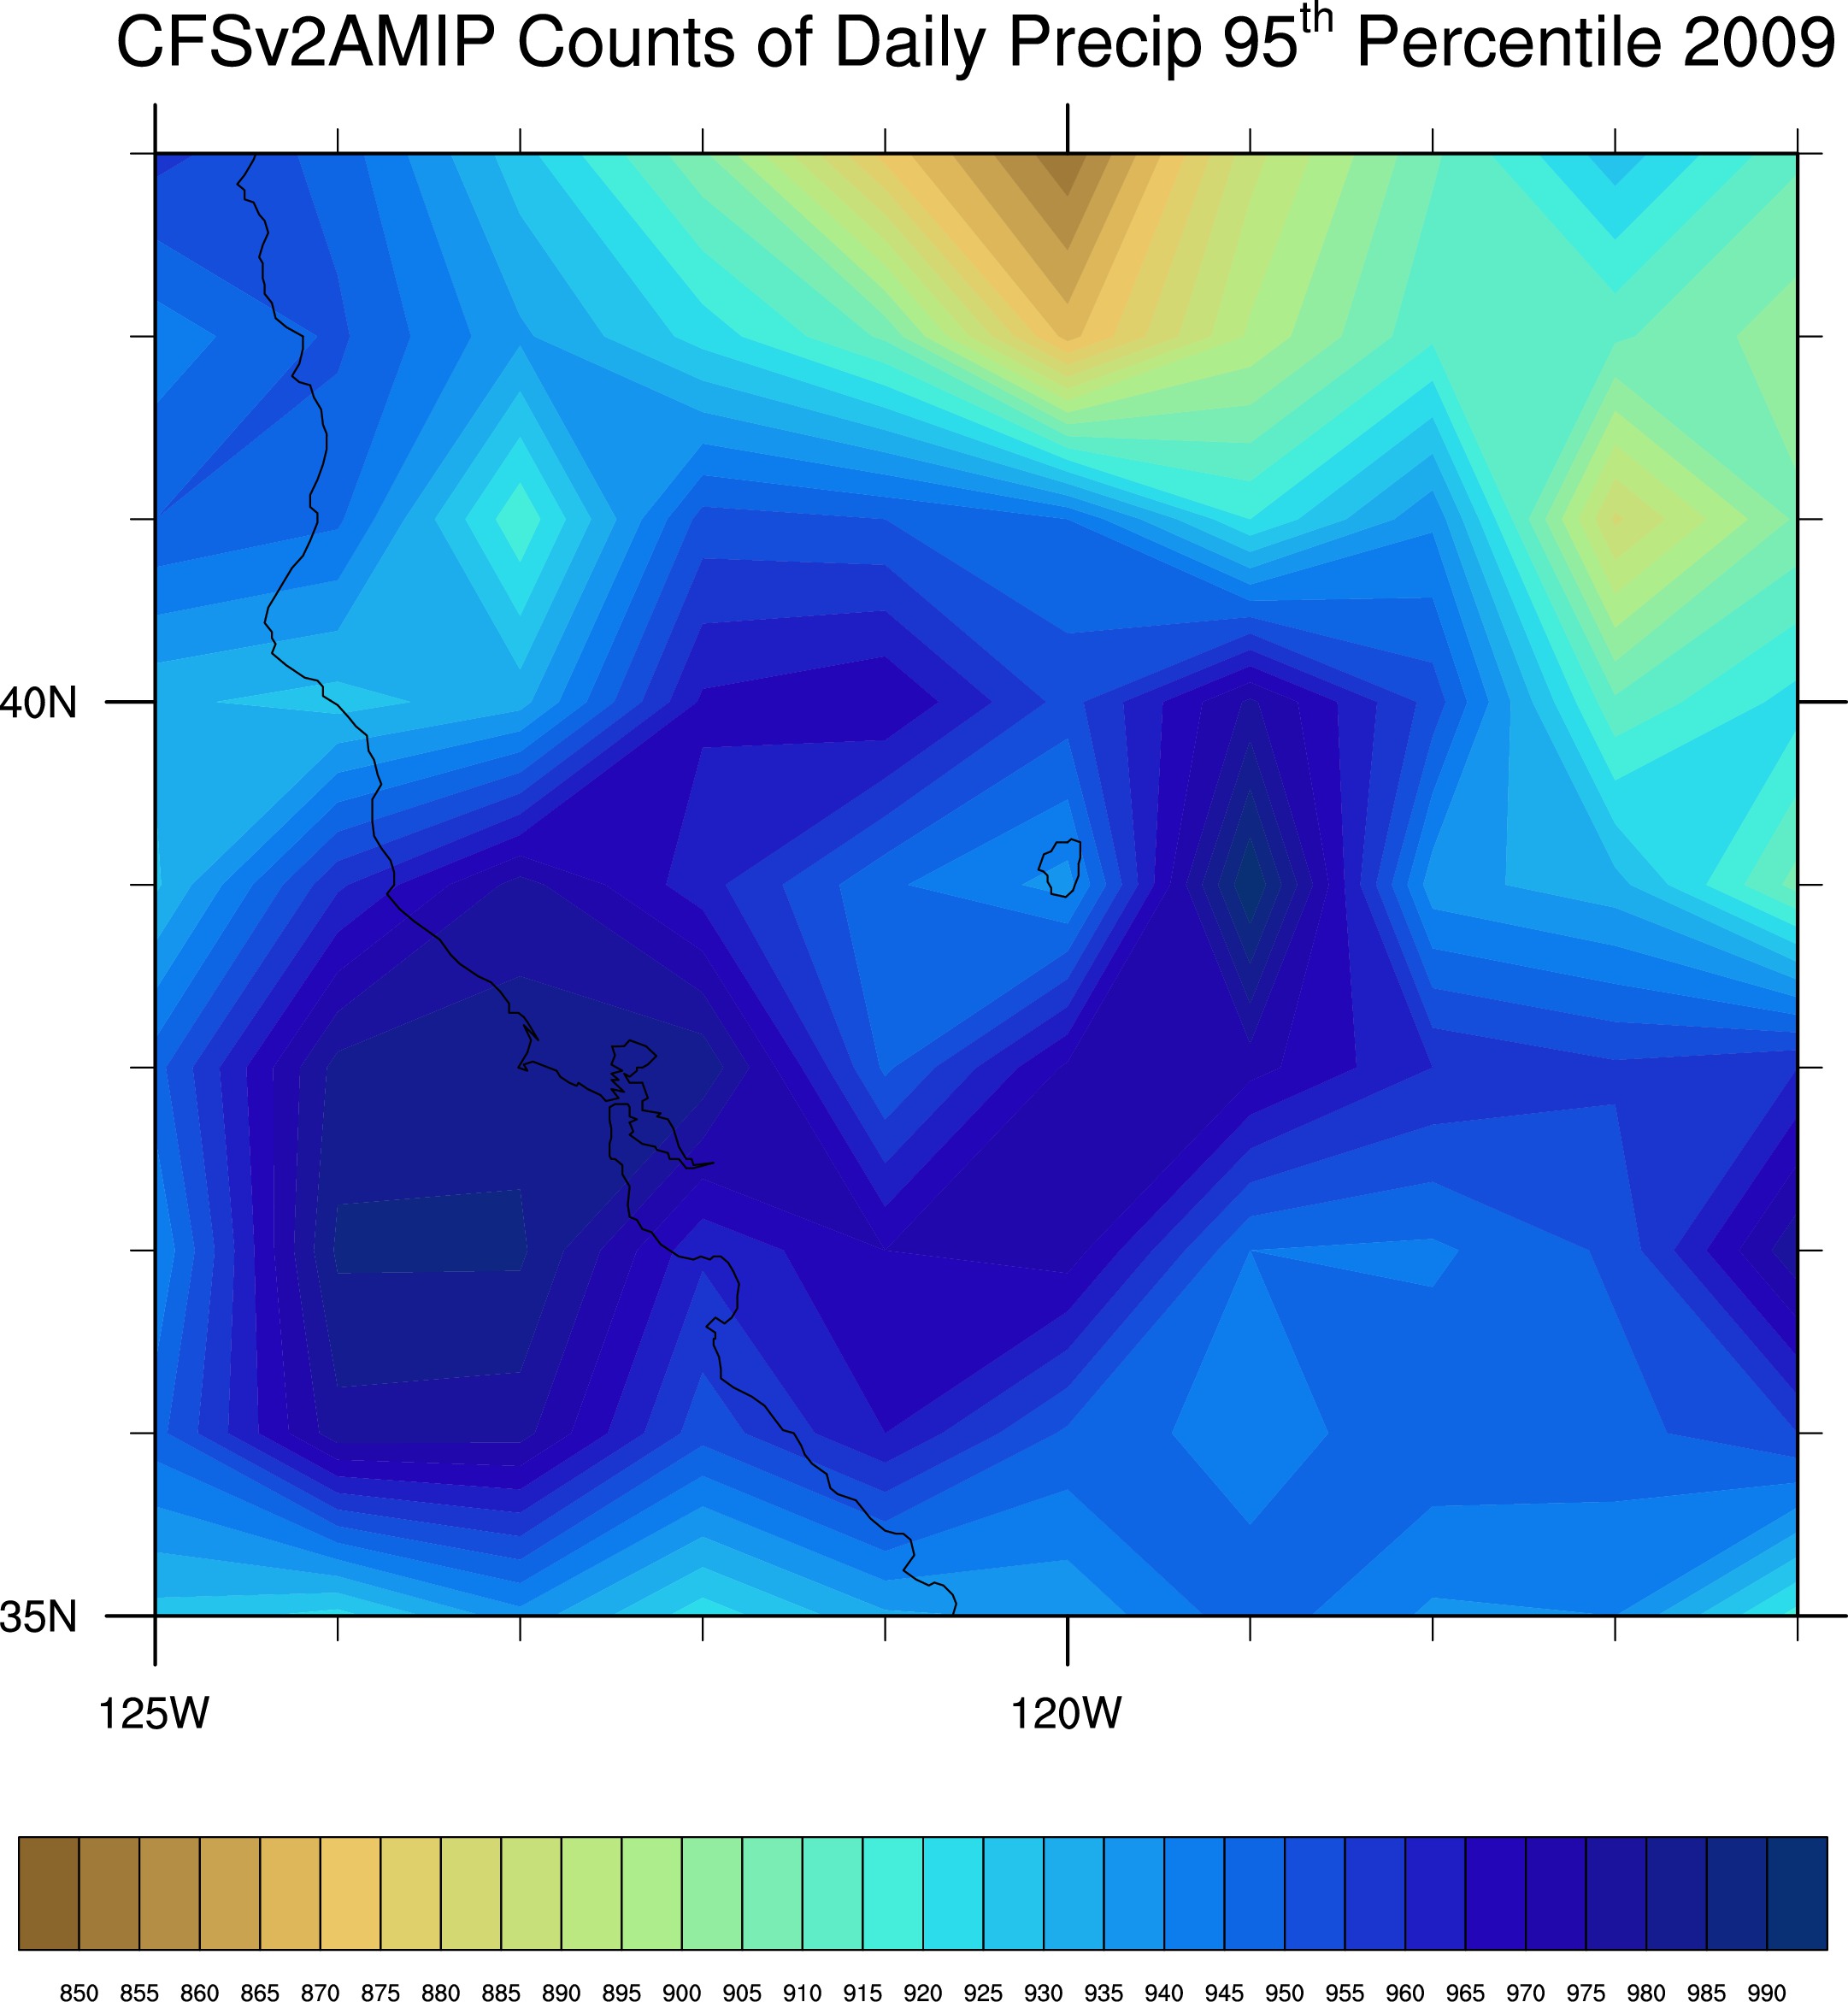
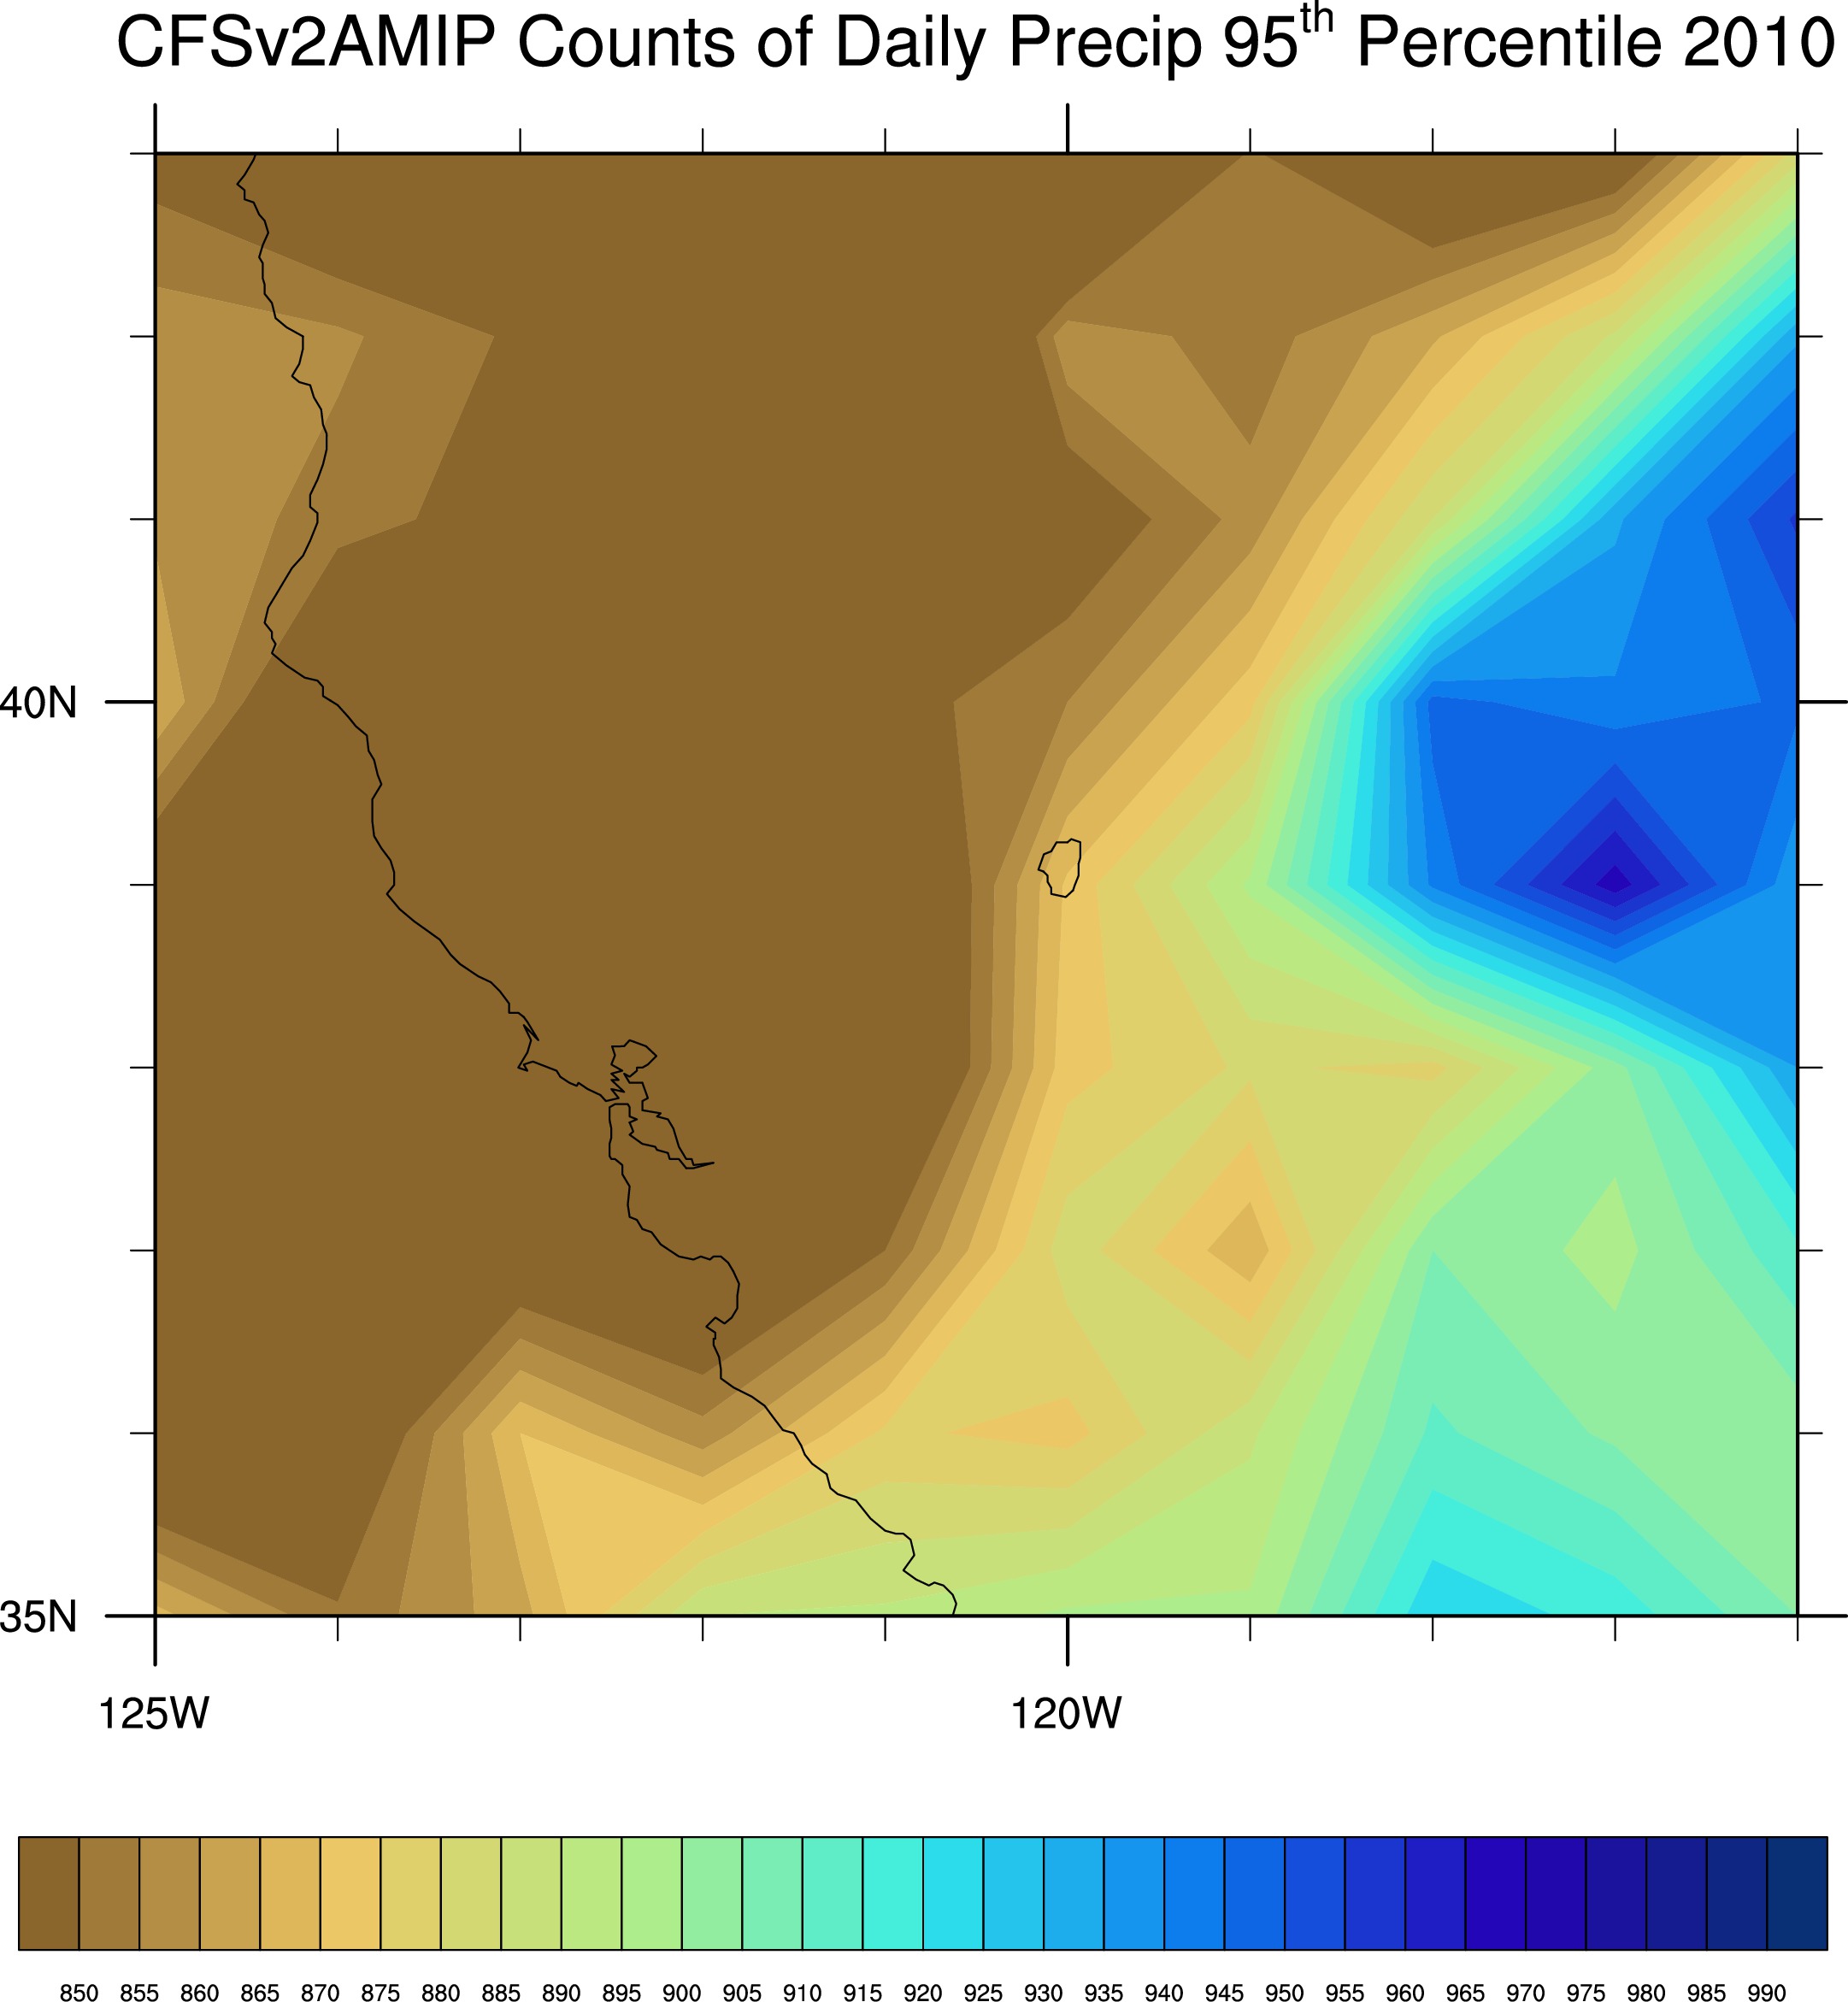
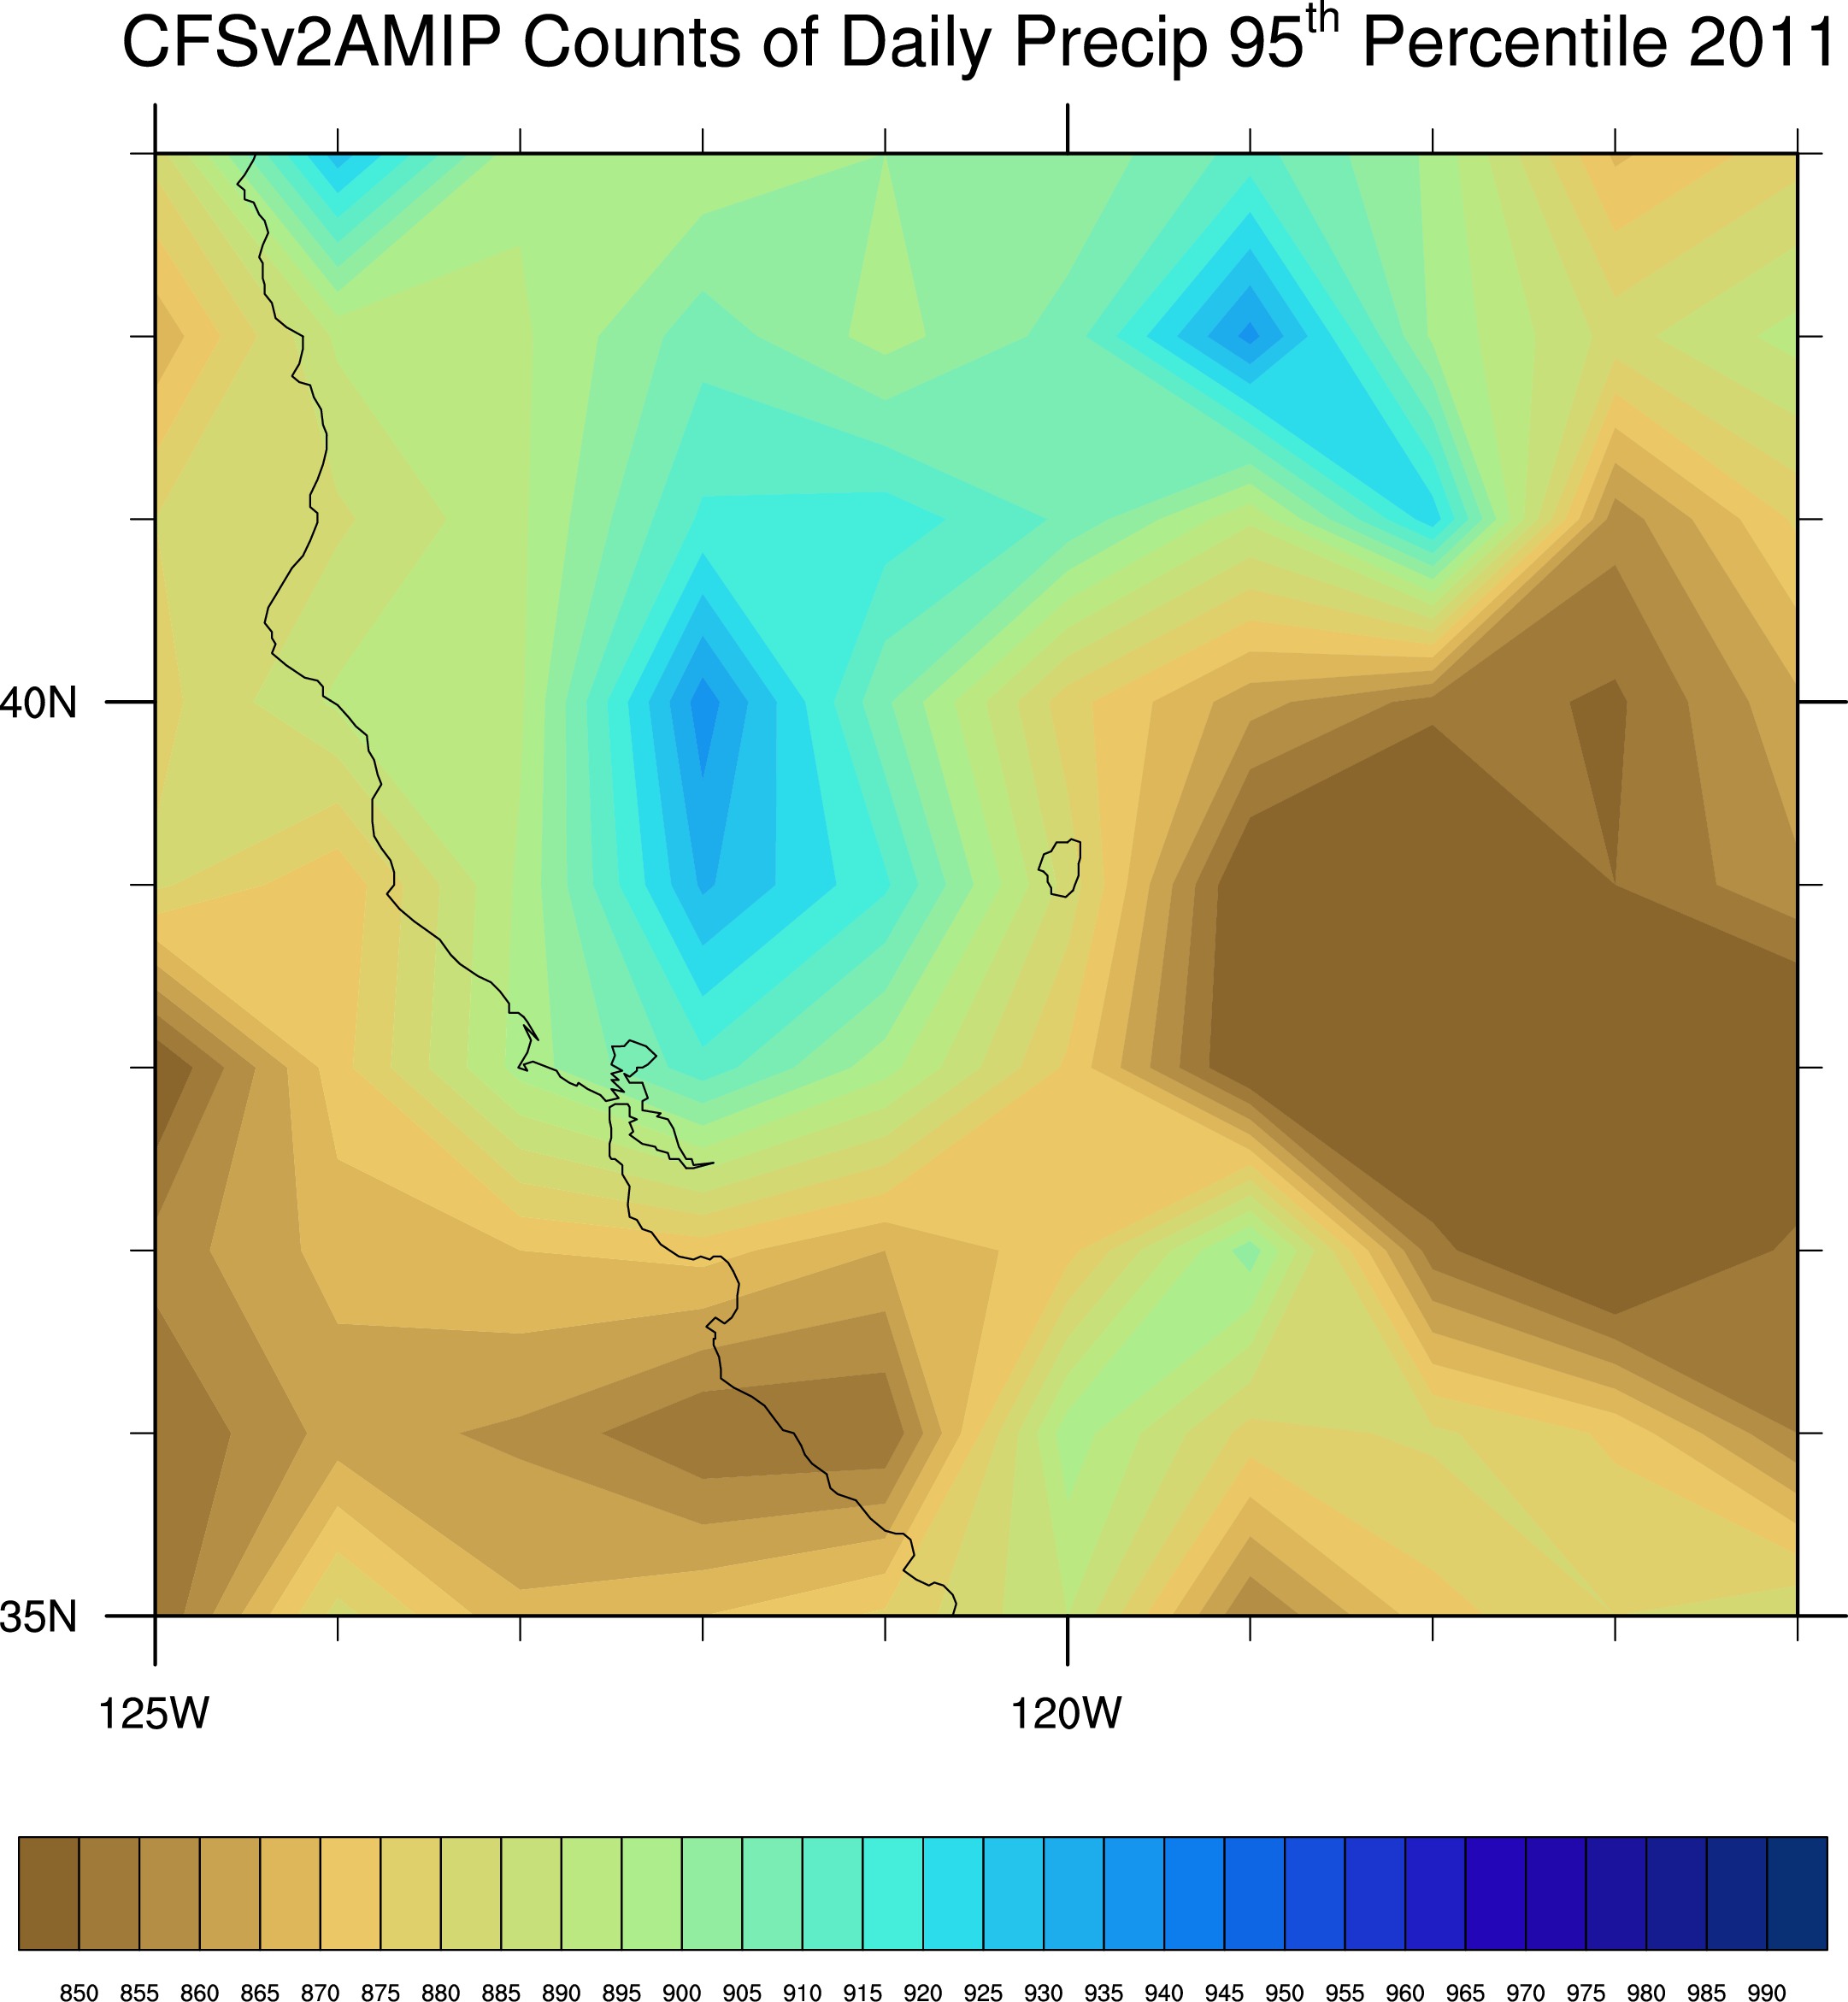
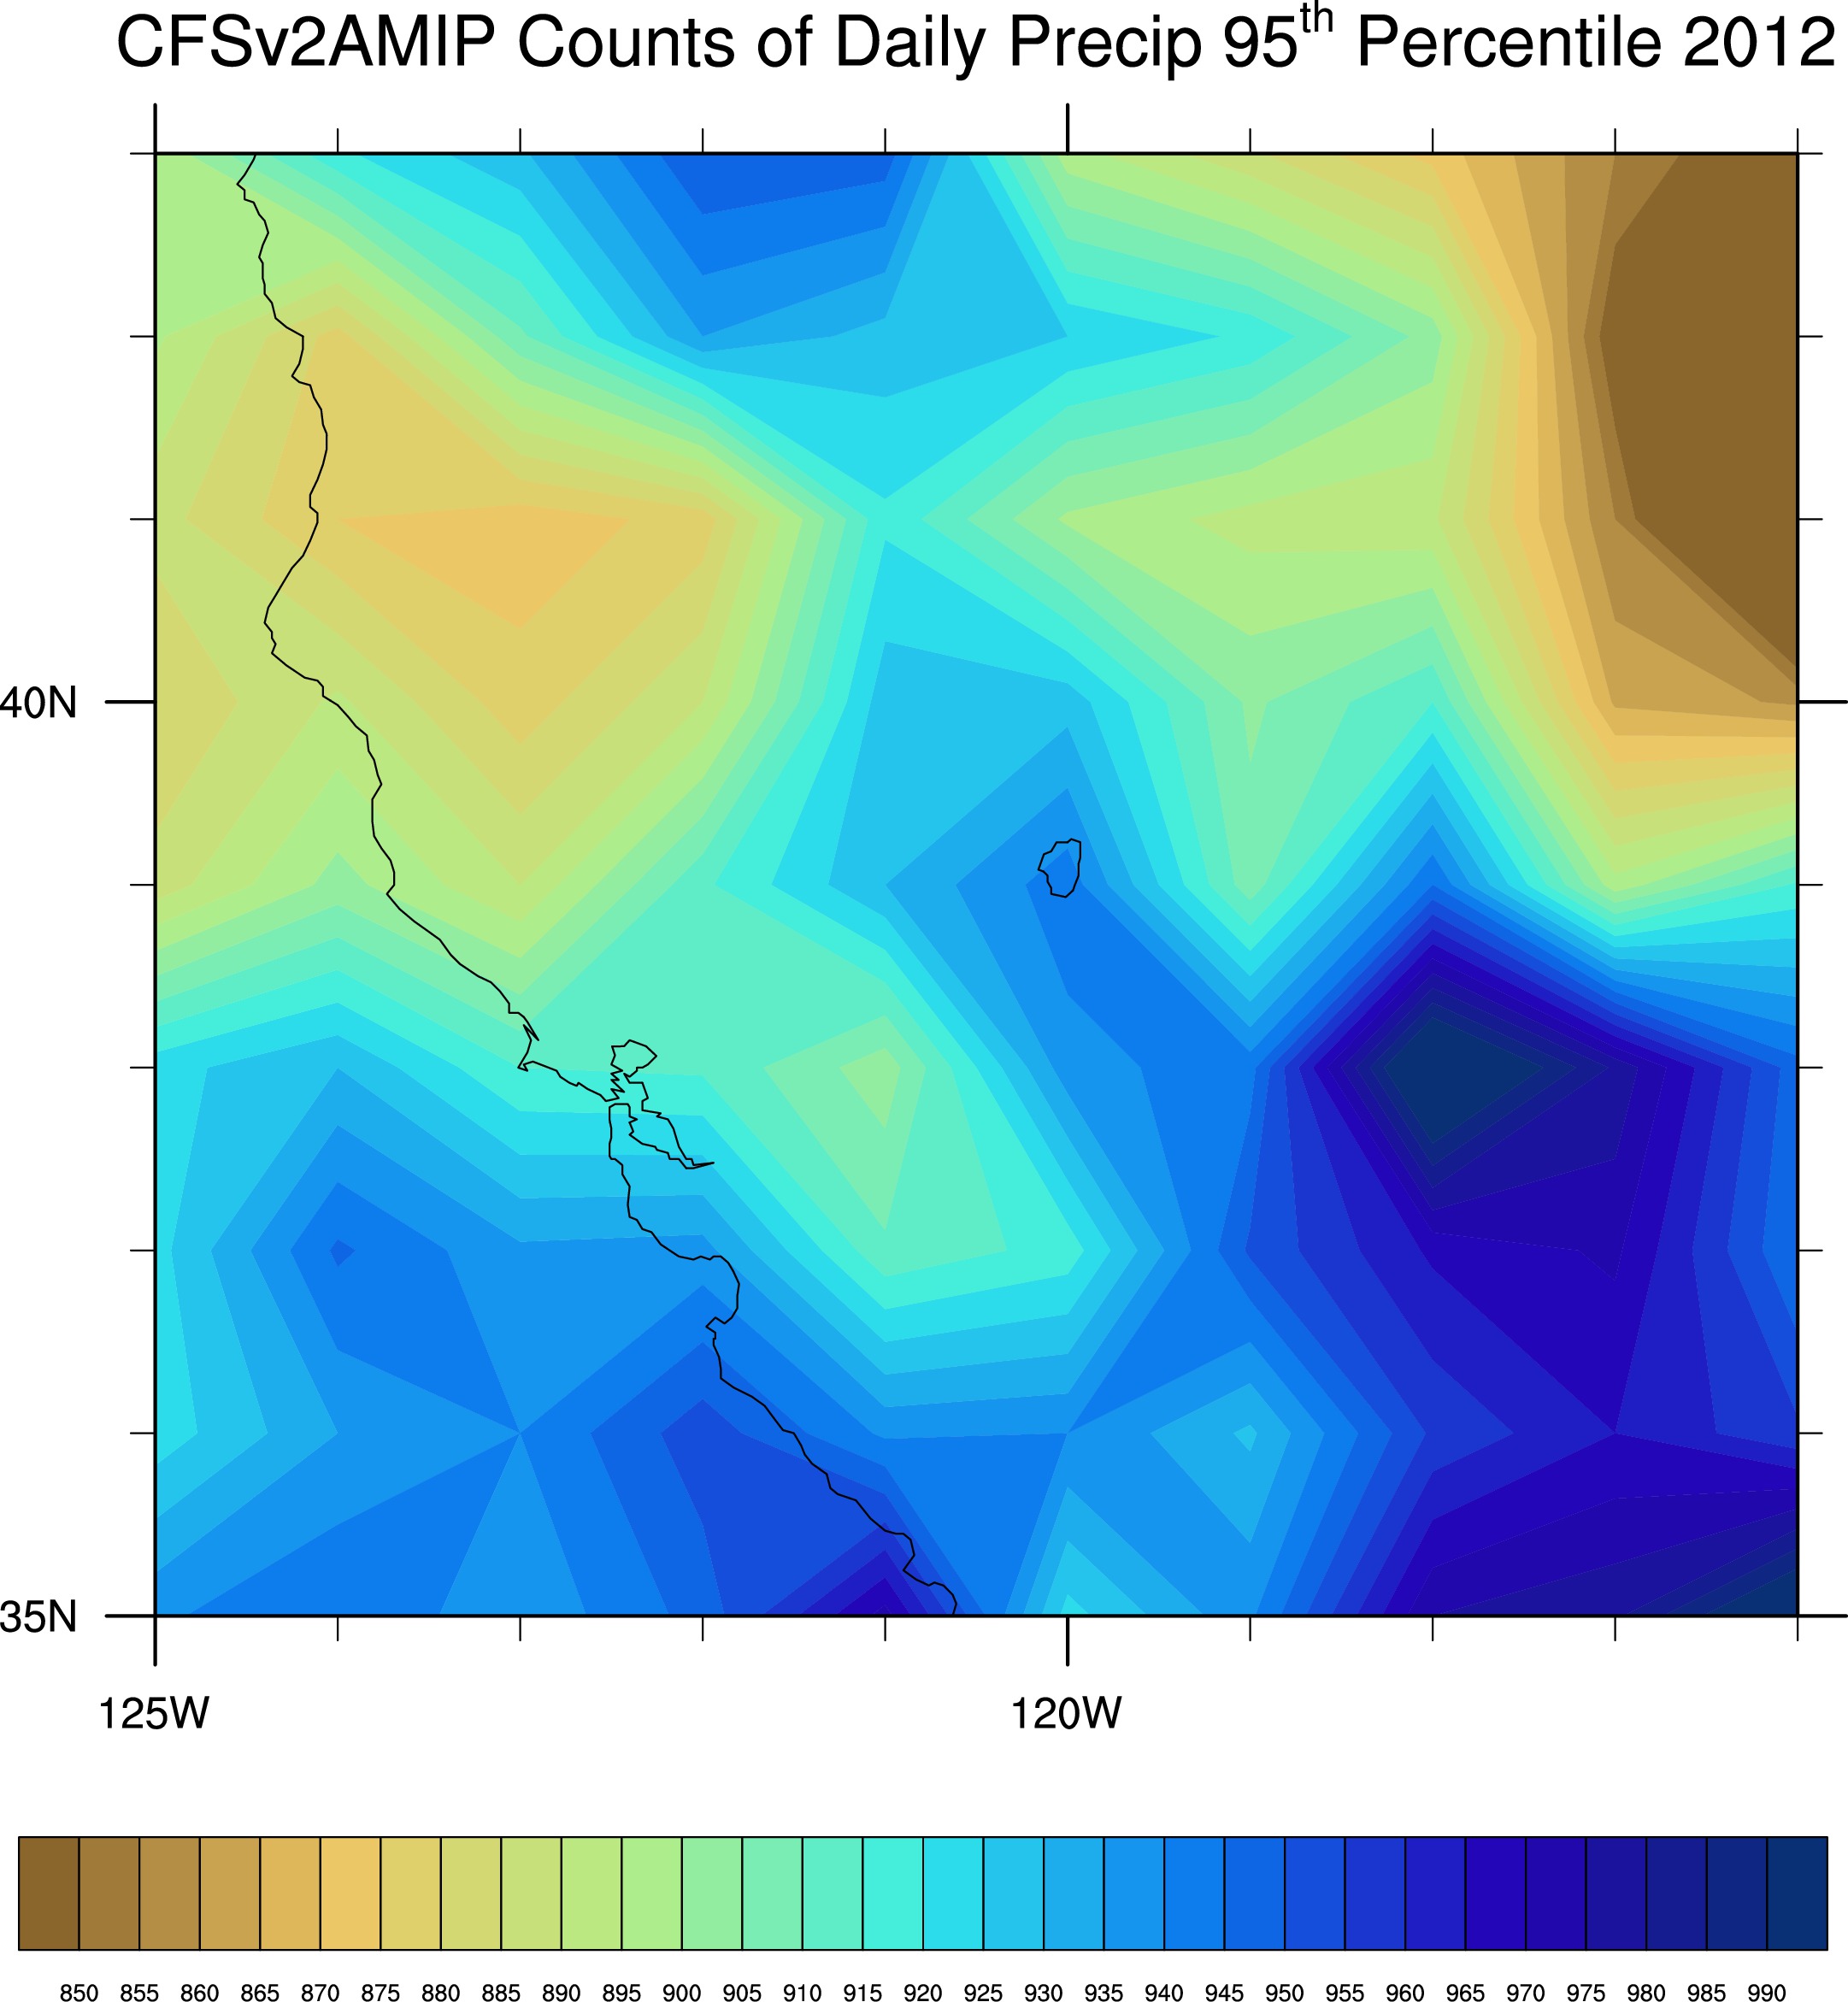
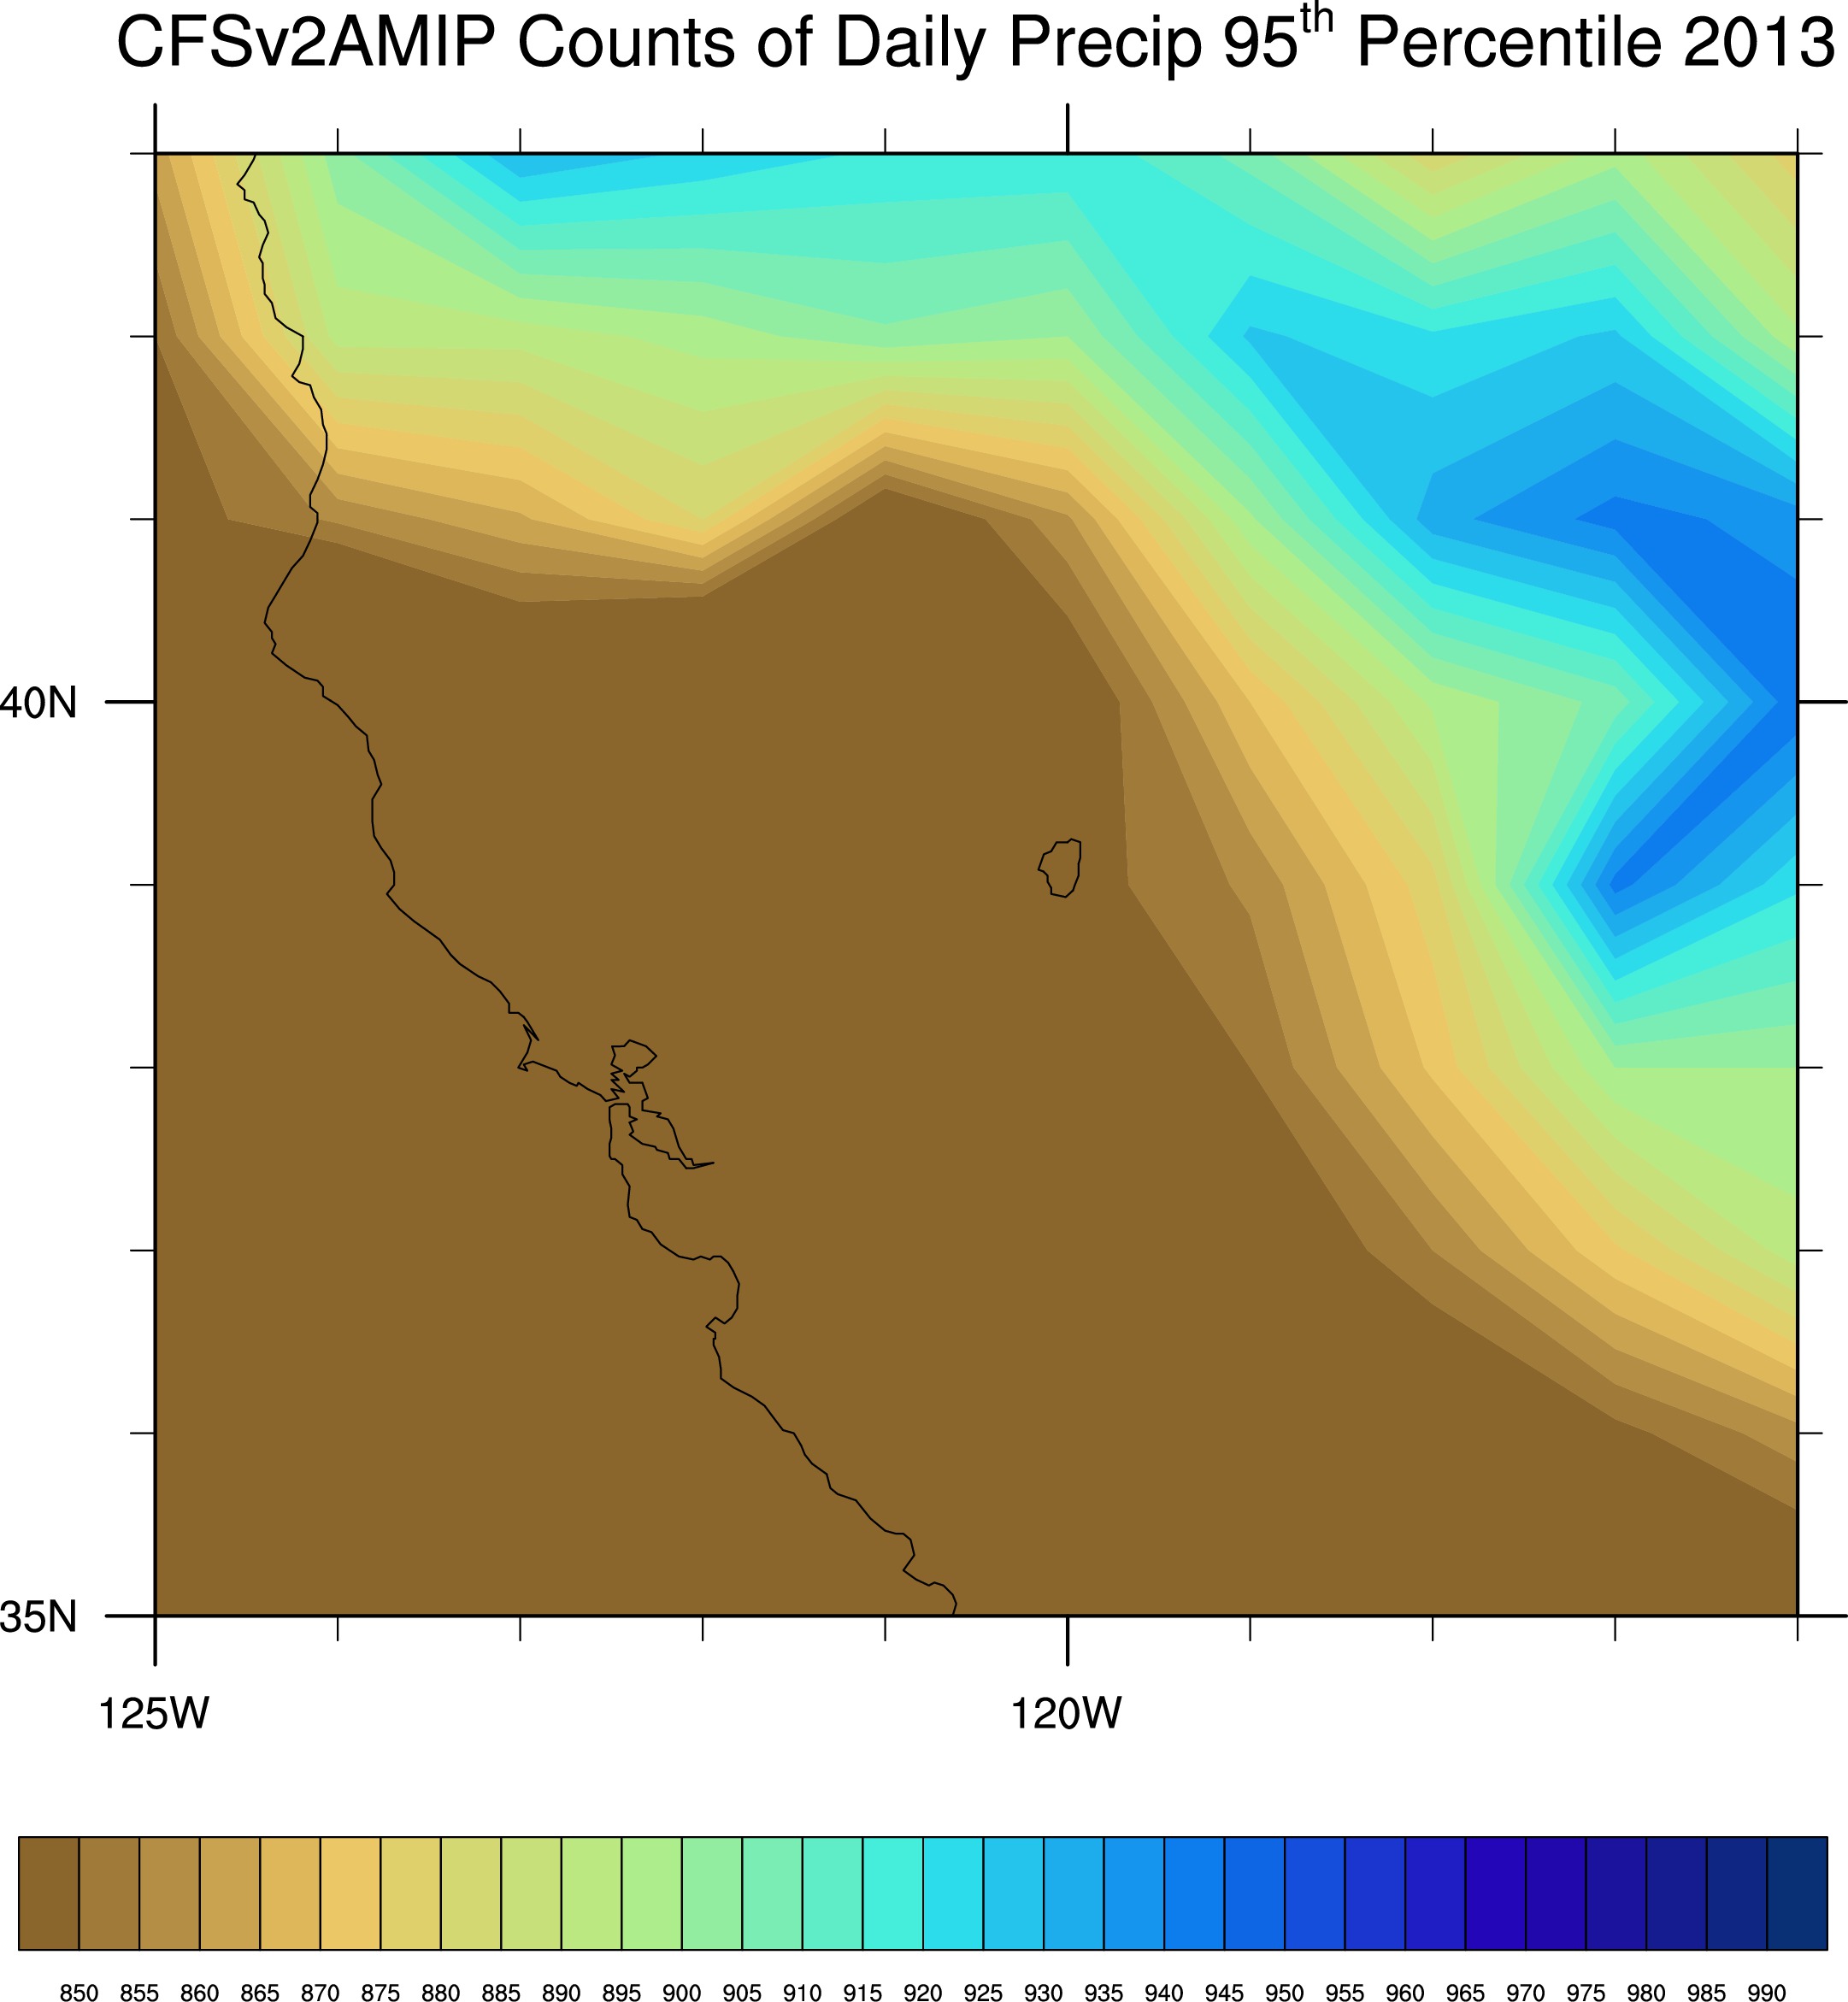
Climate Forecast System v2 AMIP data
Using concatenated 50-member ensemble CFSv2 AMIP runs 1979-2013:
95th Percentile Global Precipitation: daily case:
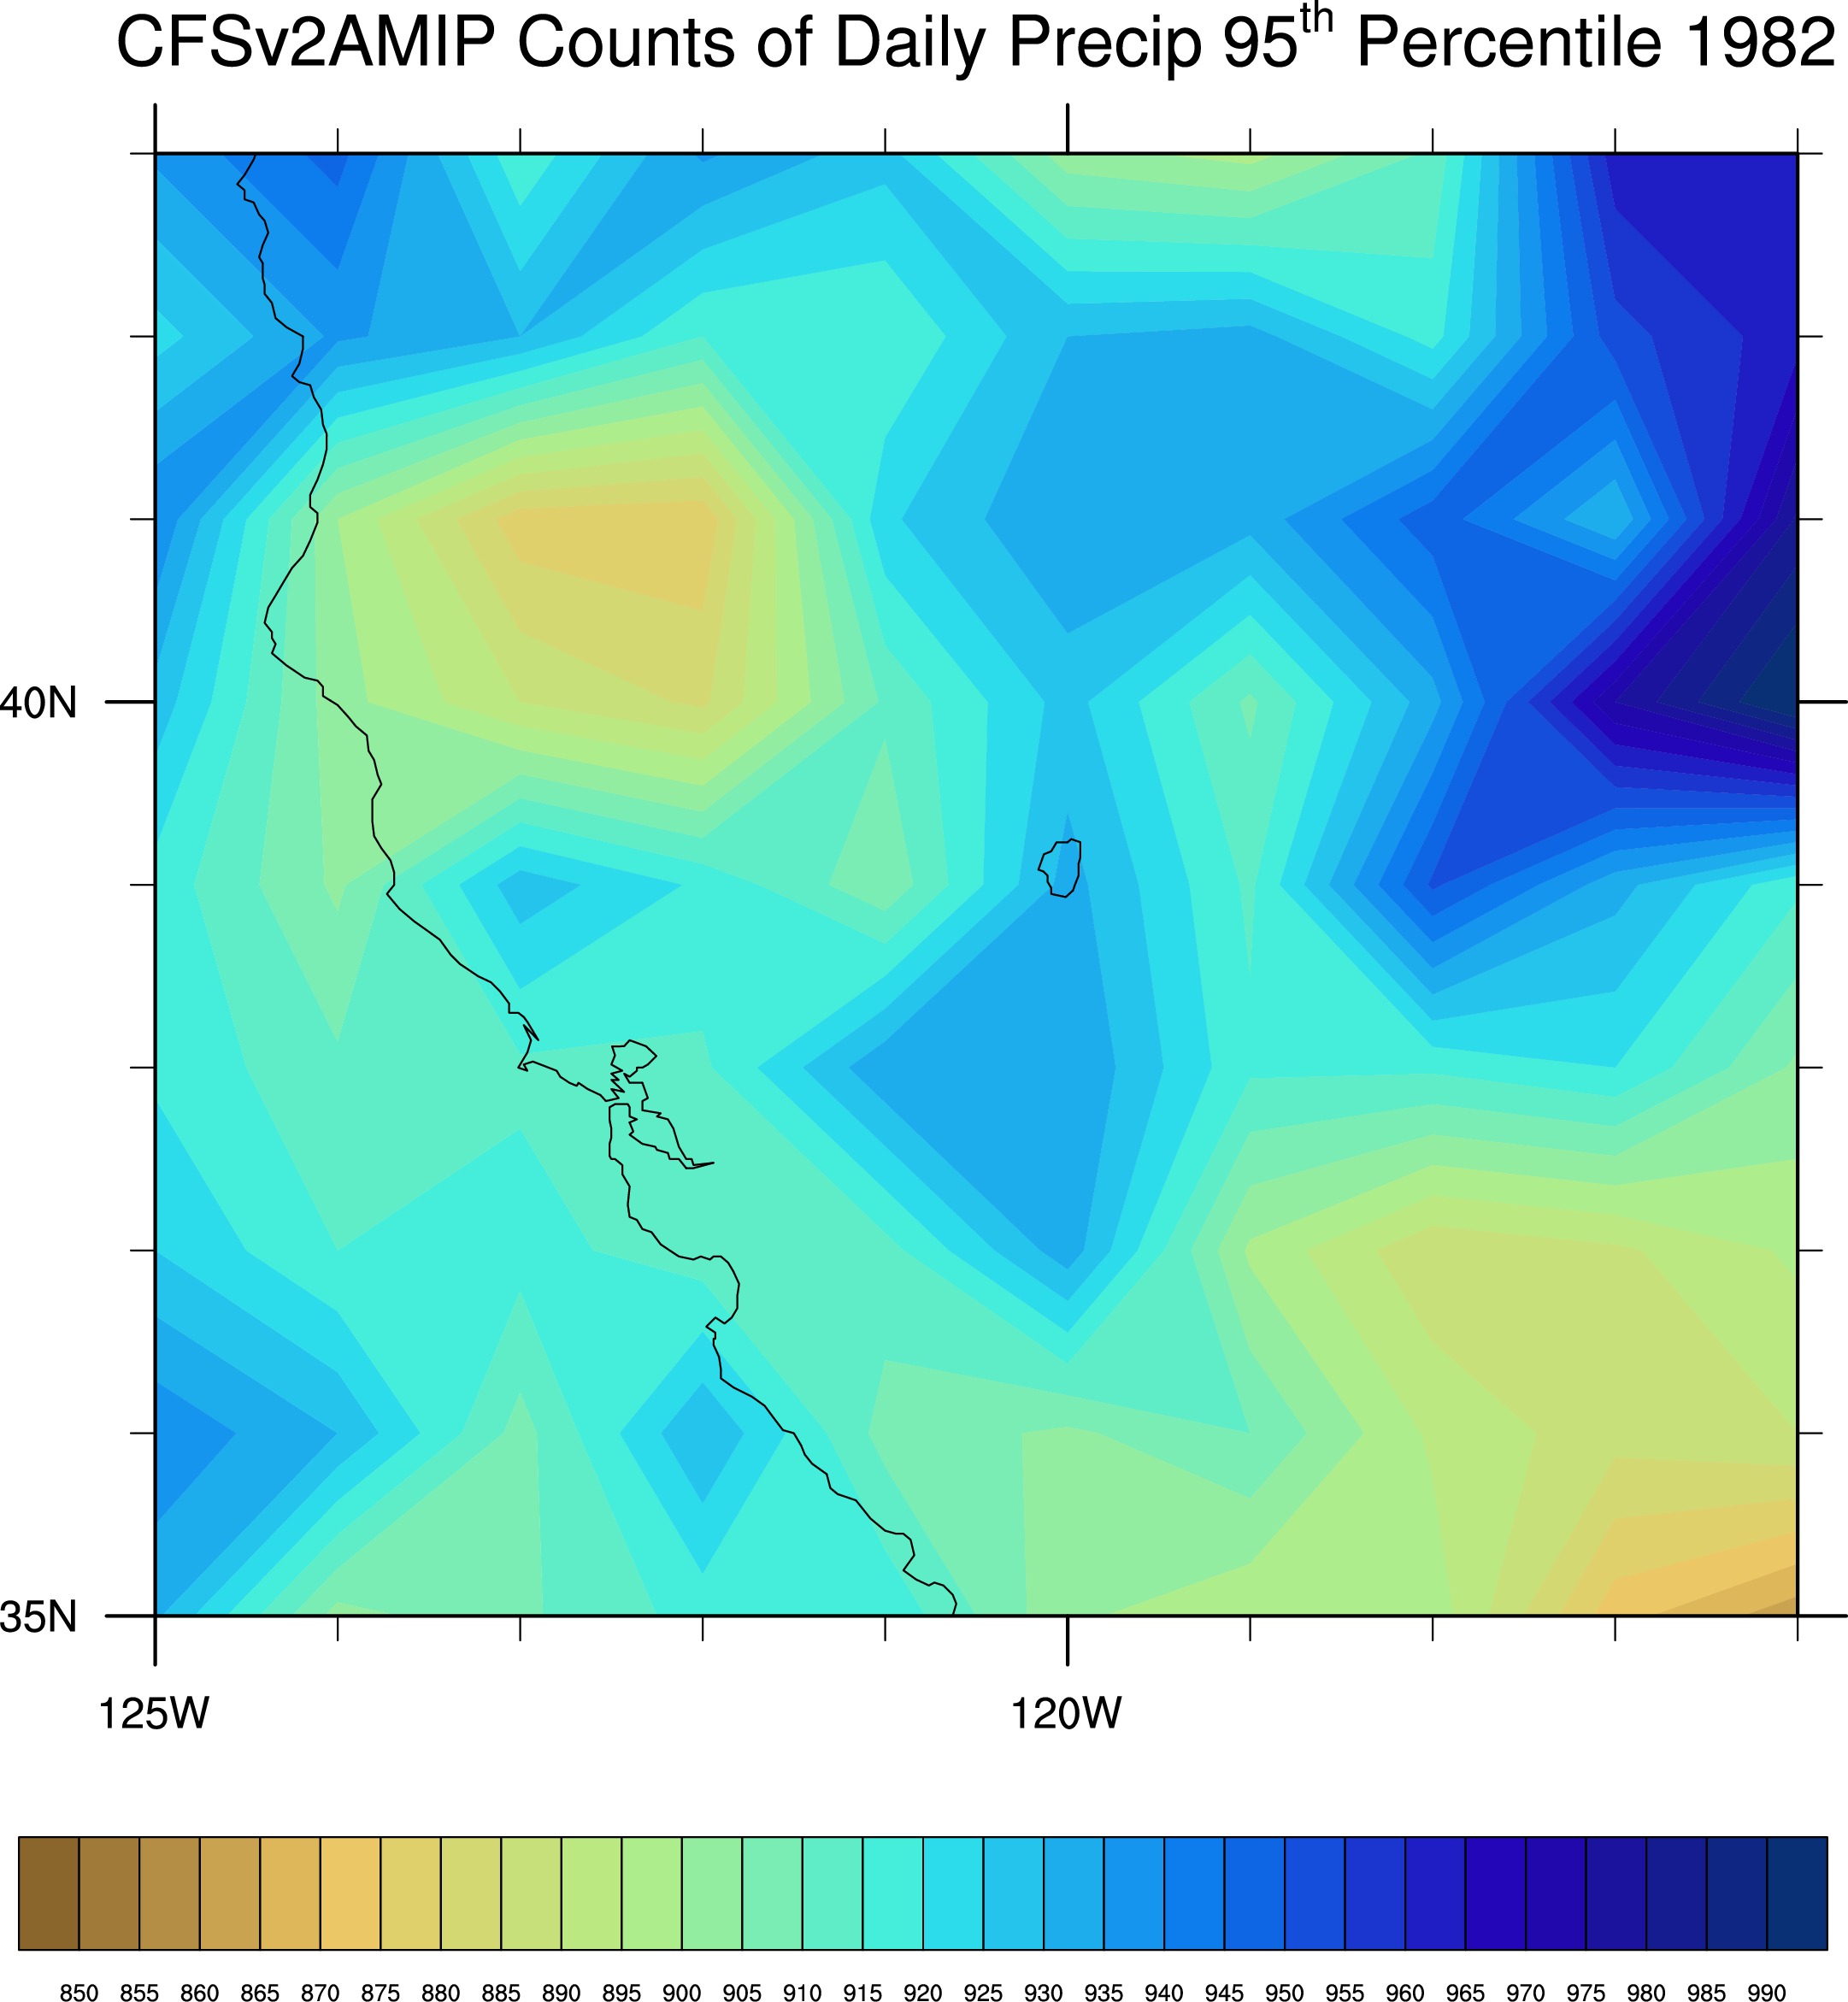
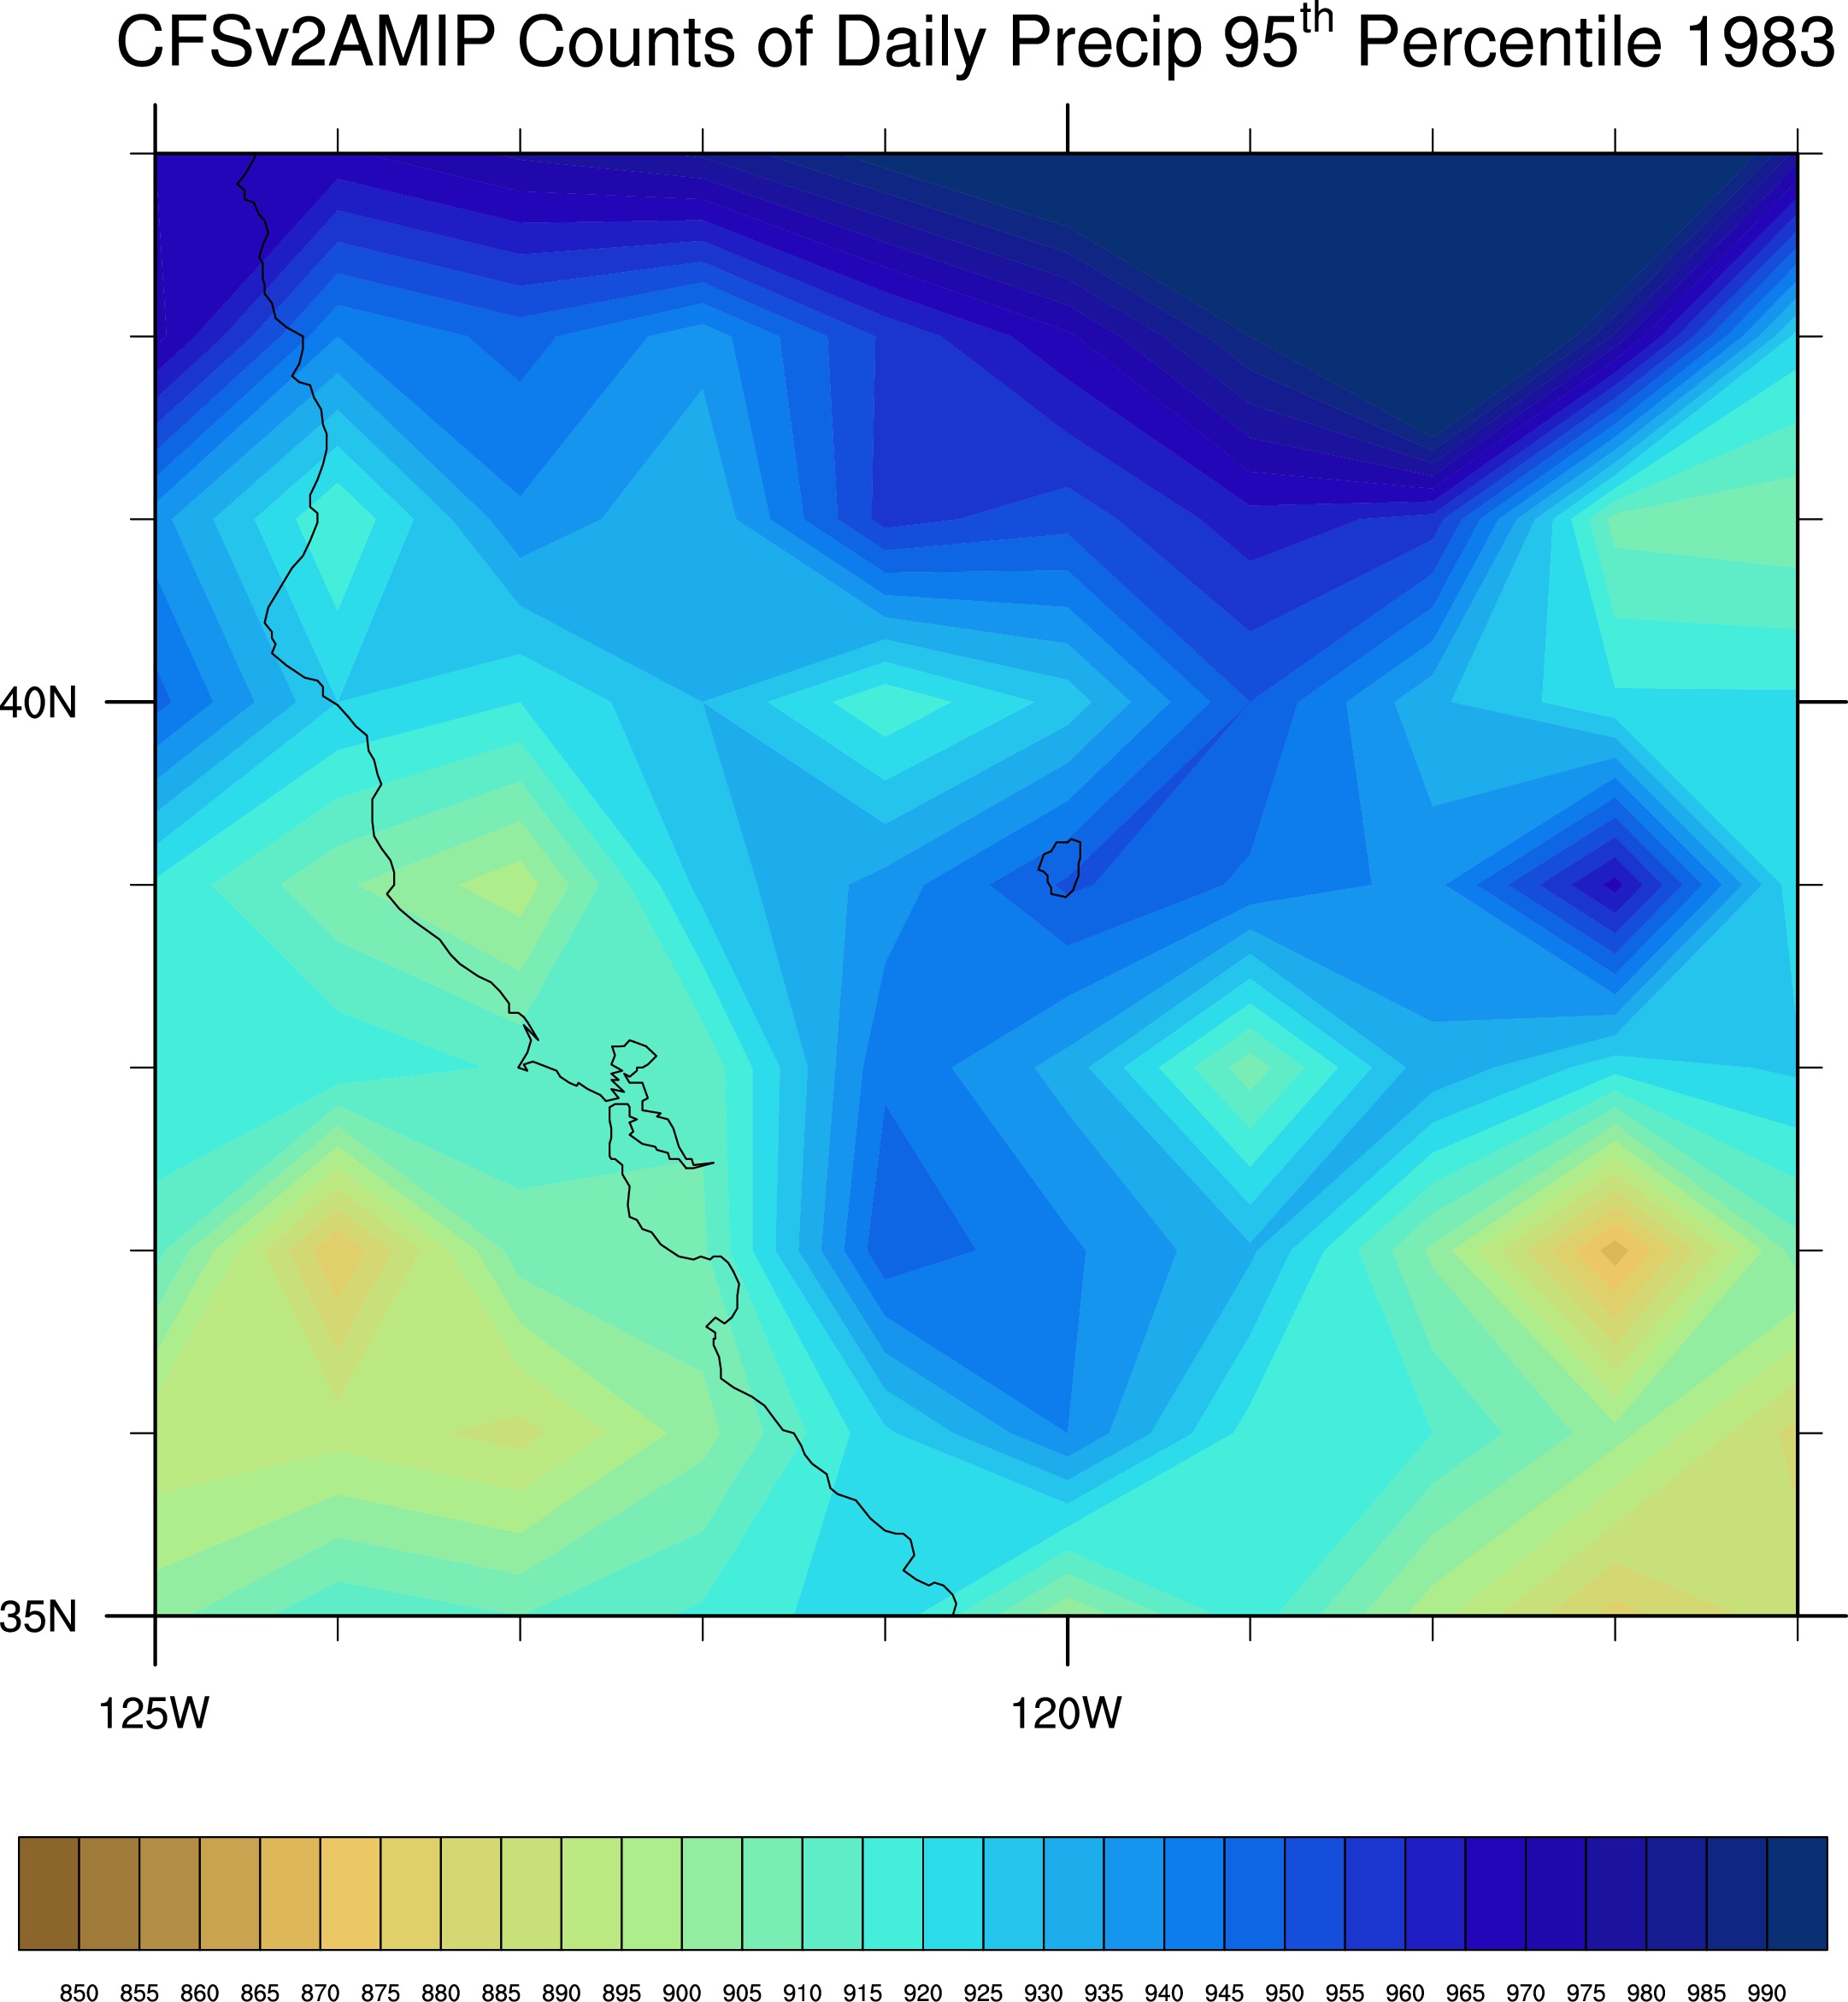
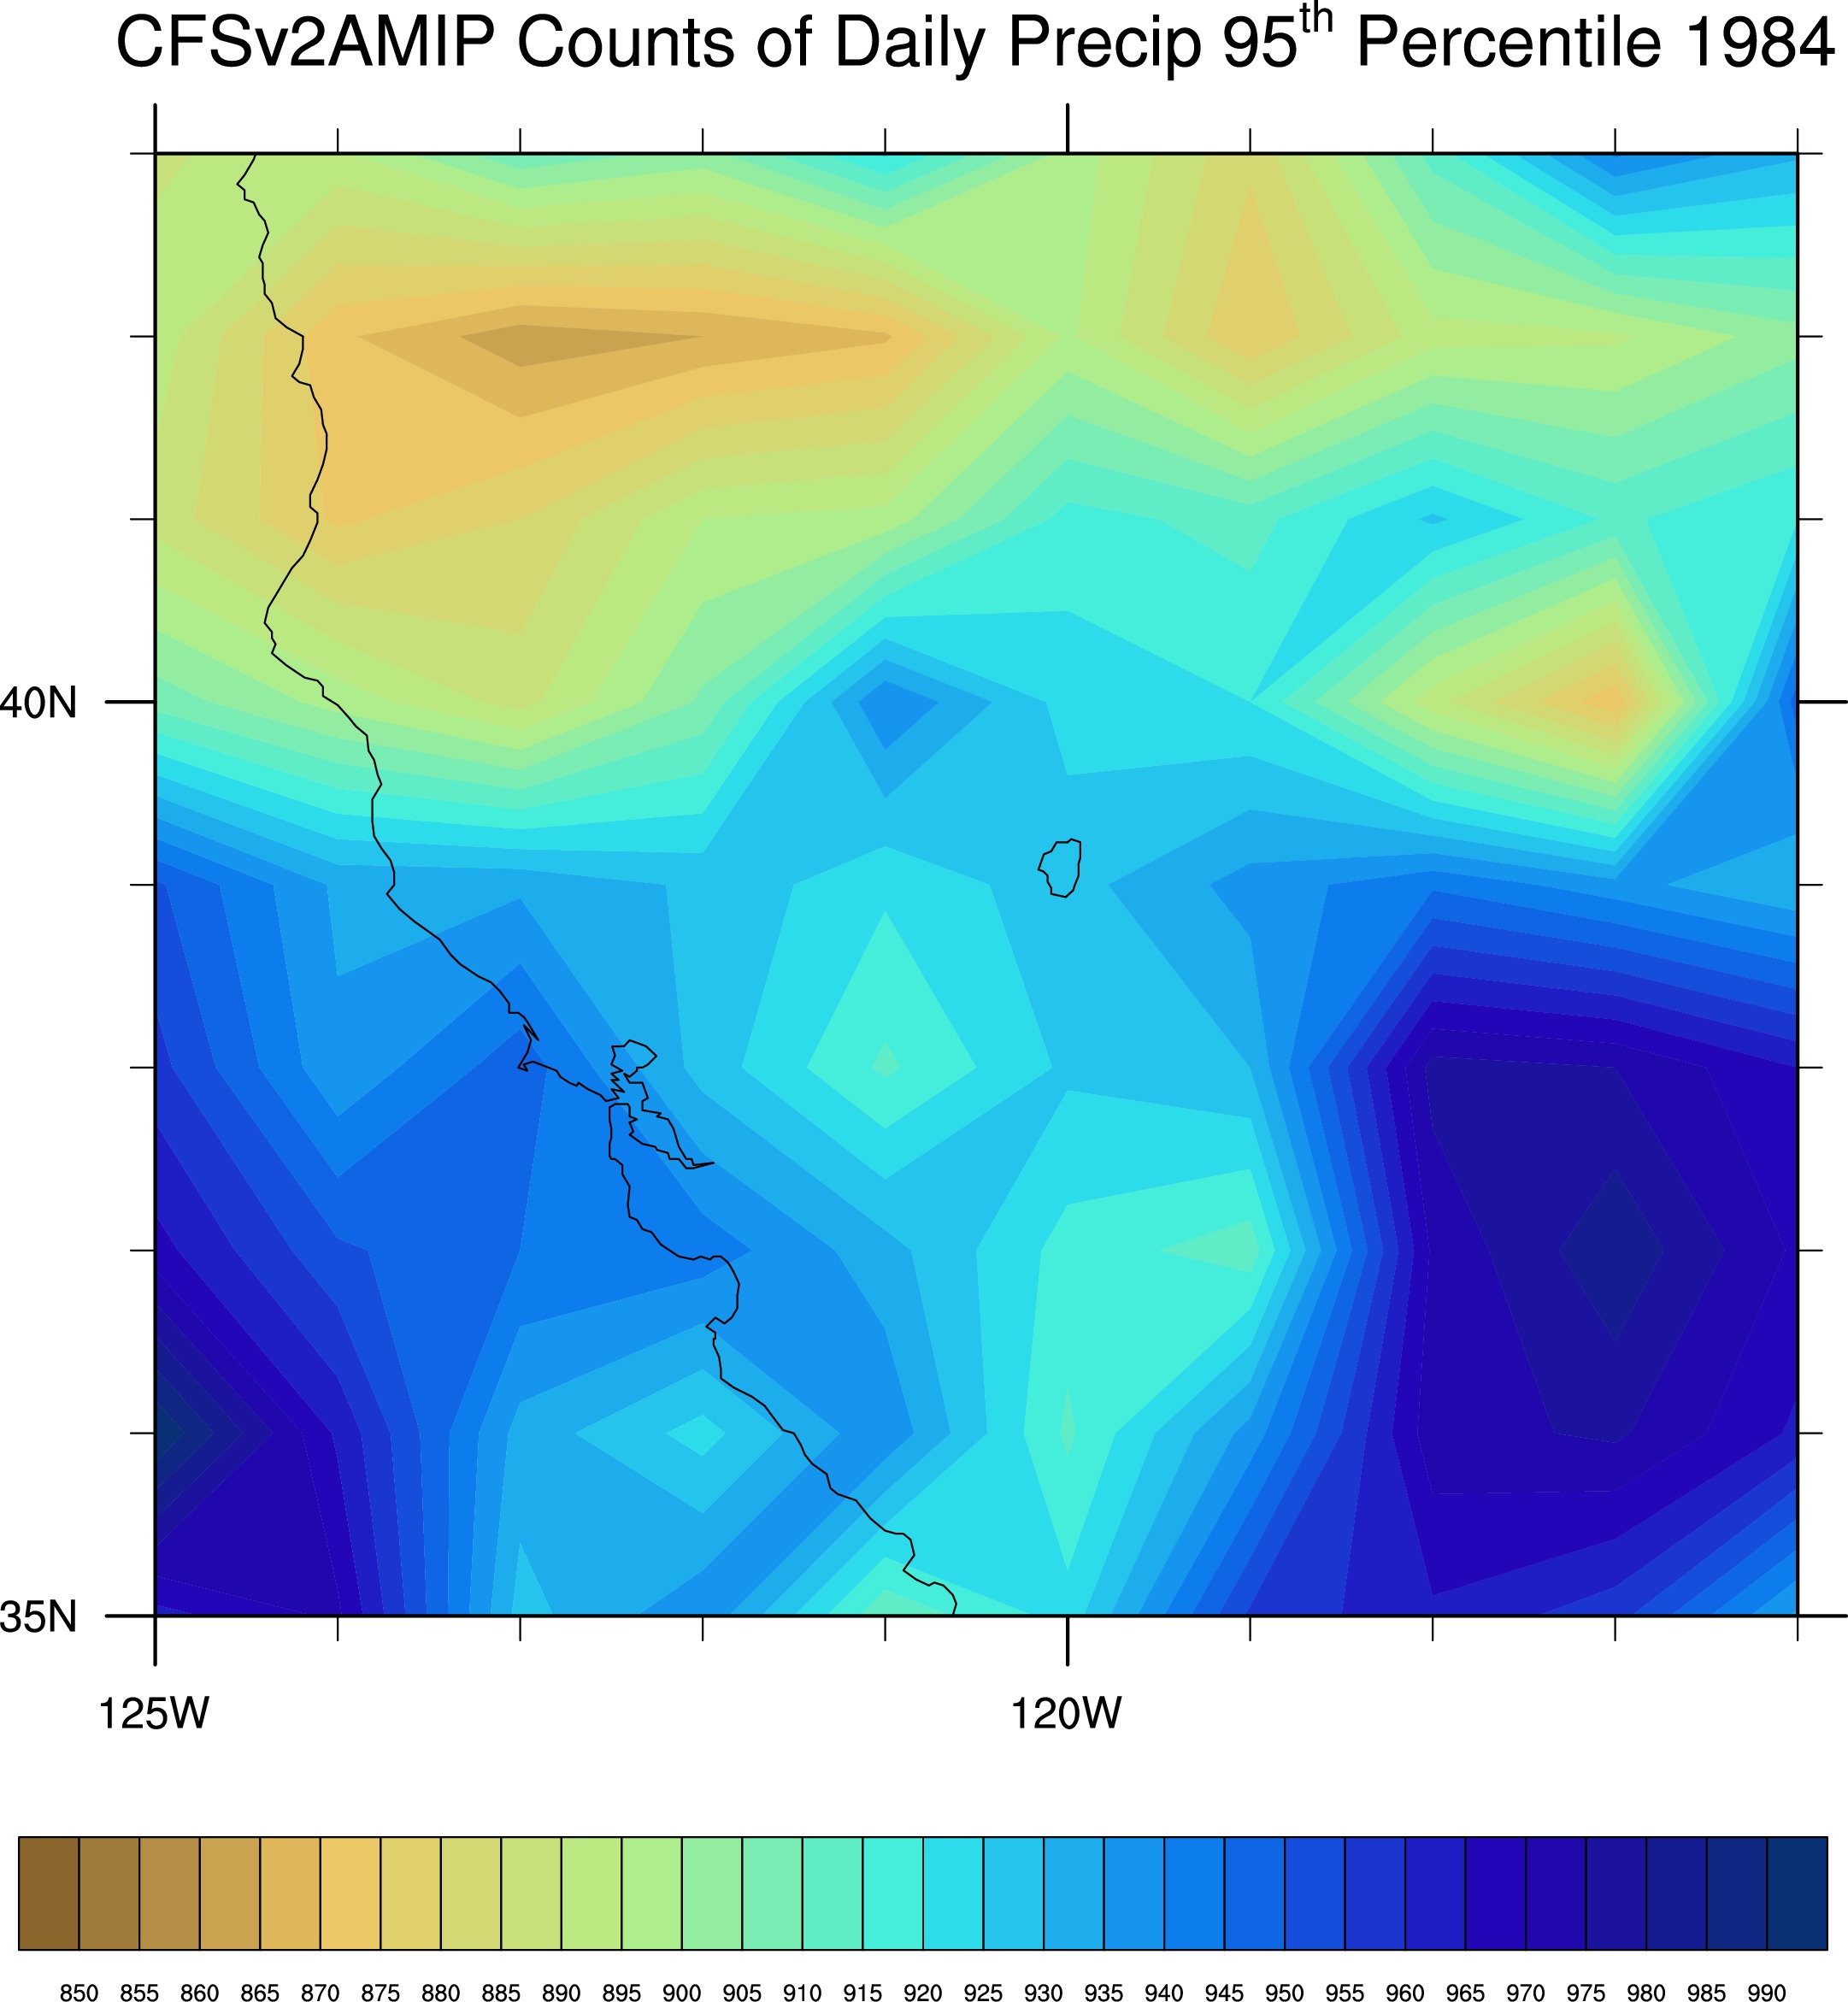
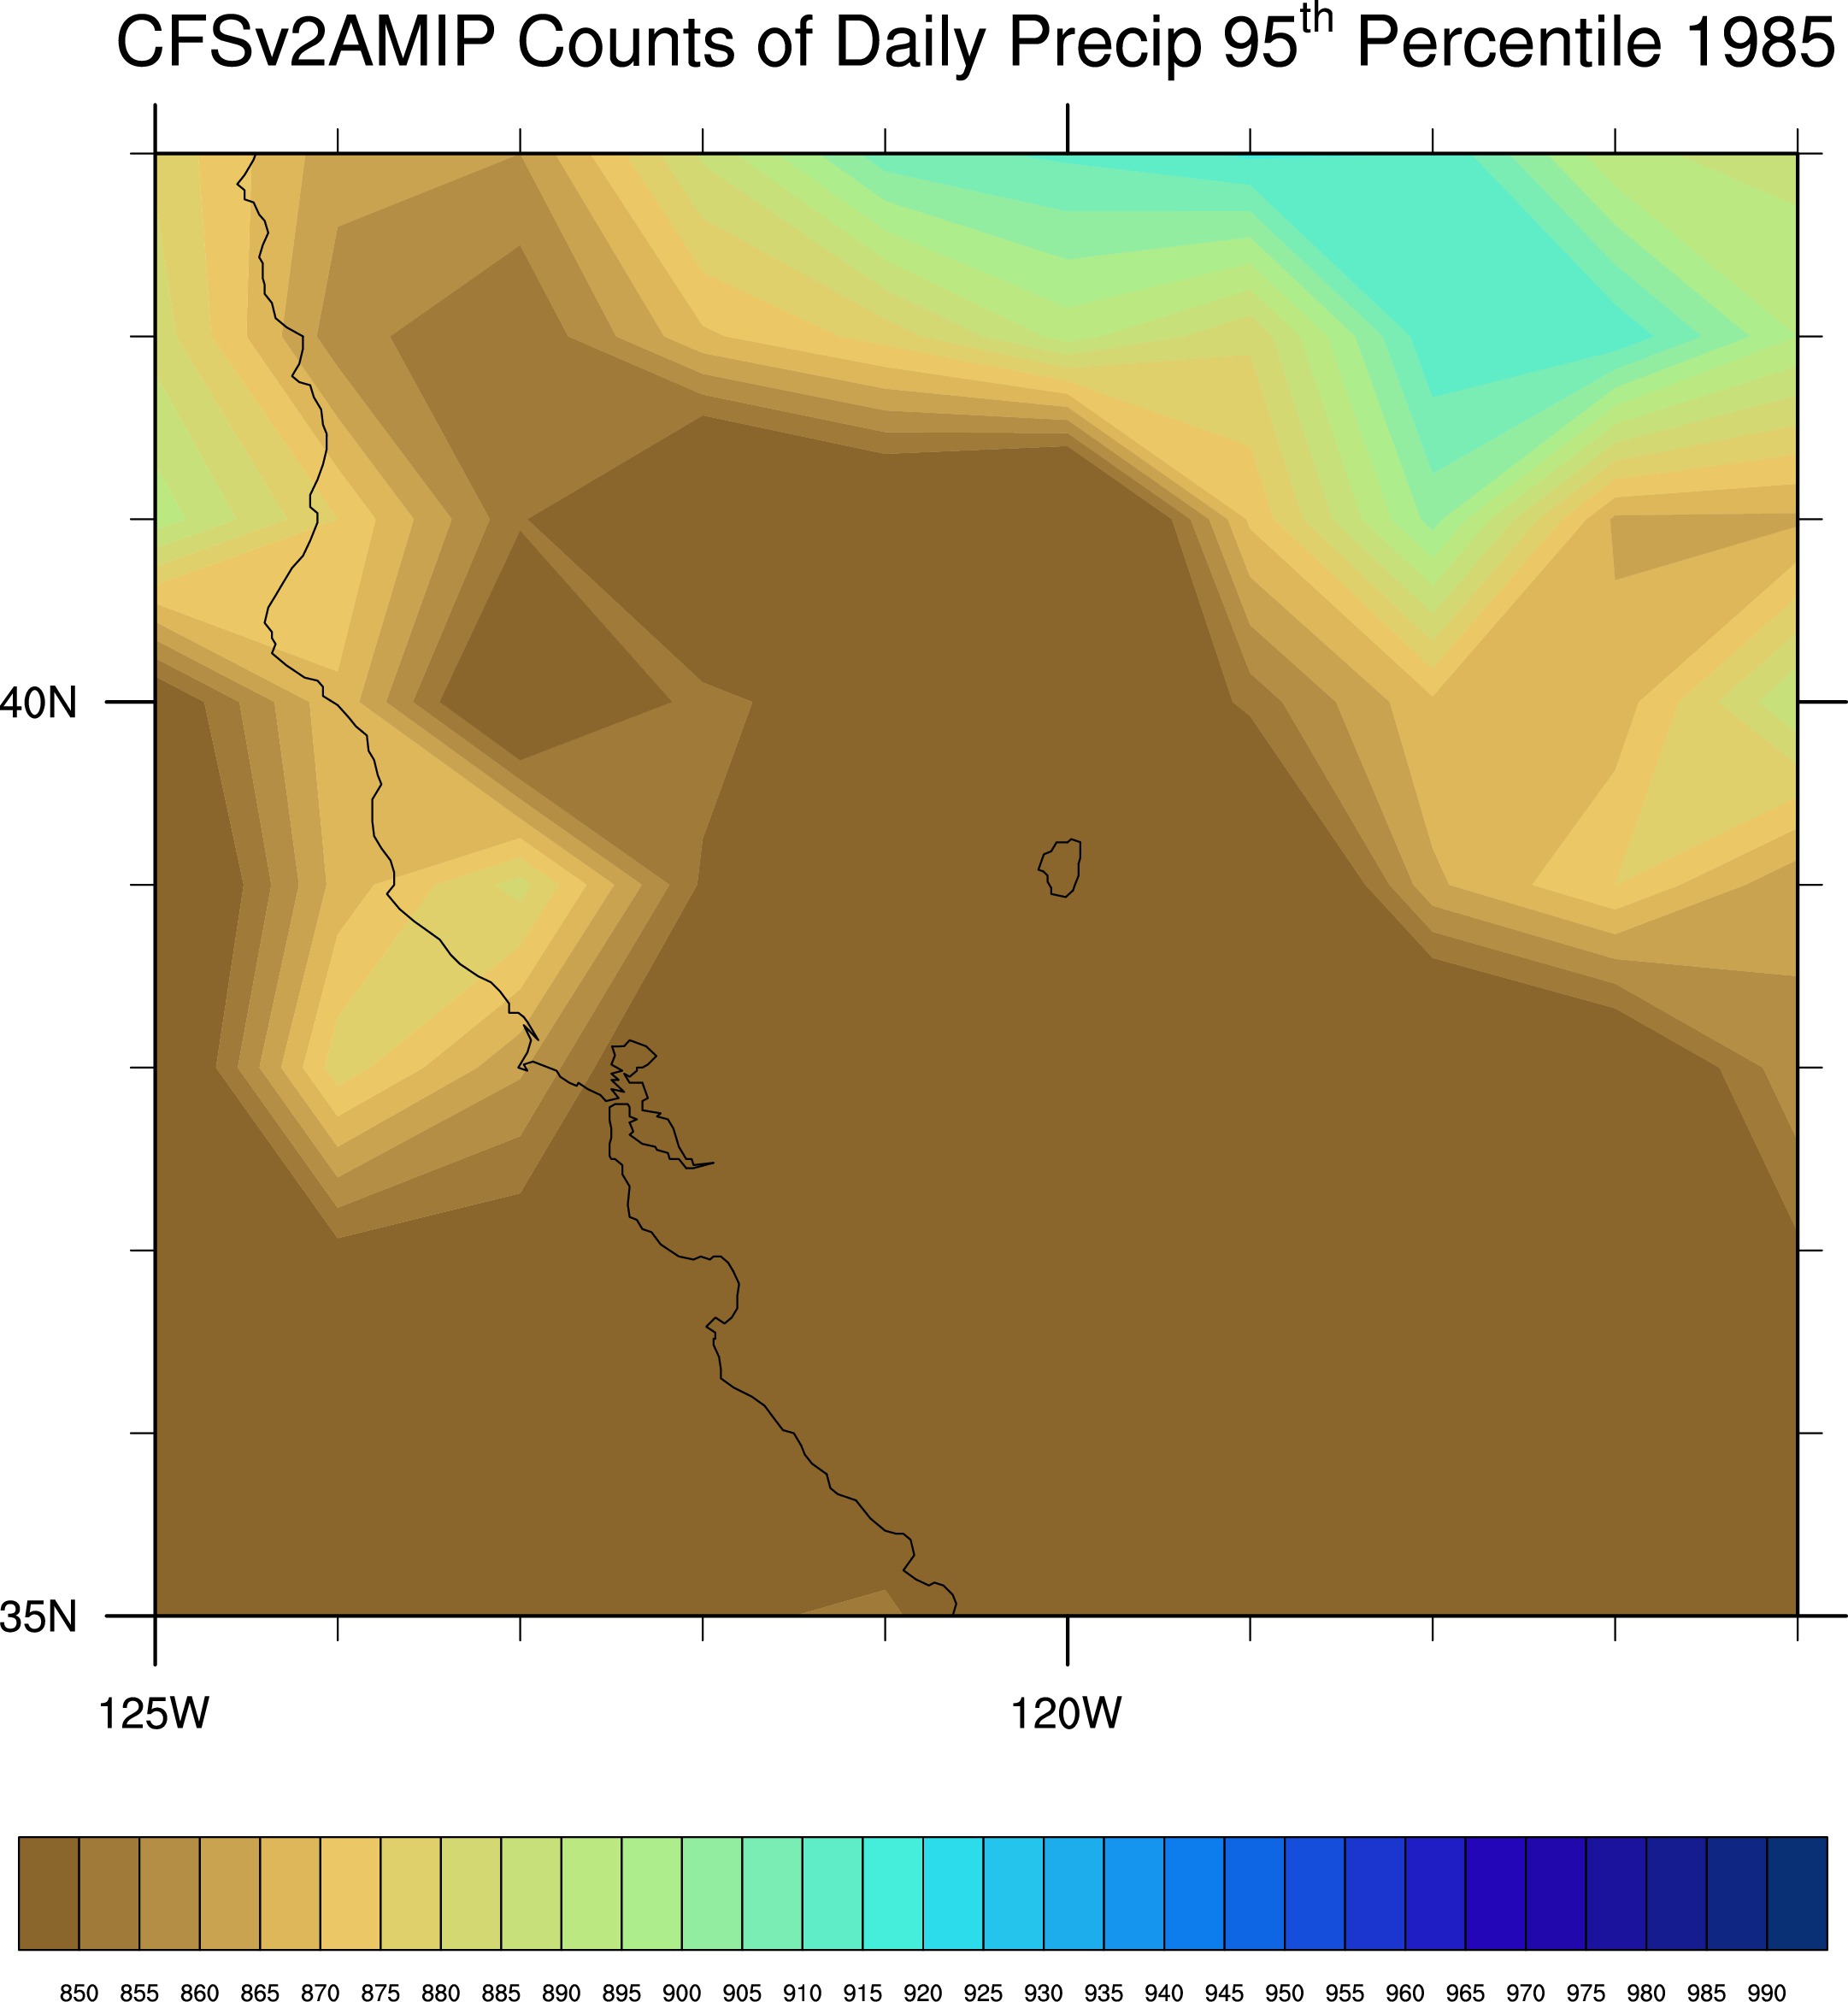
Zooming in on Northern California:
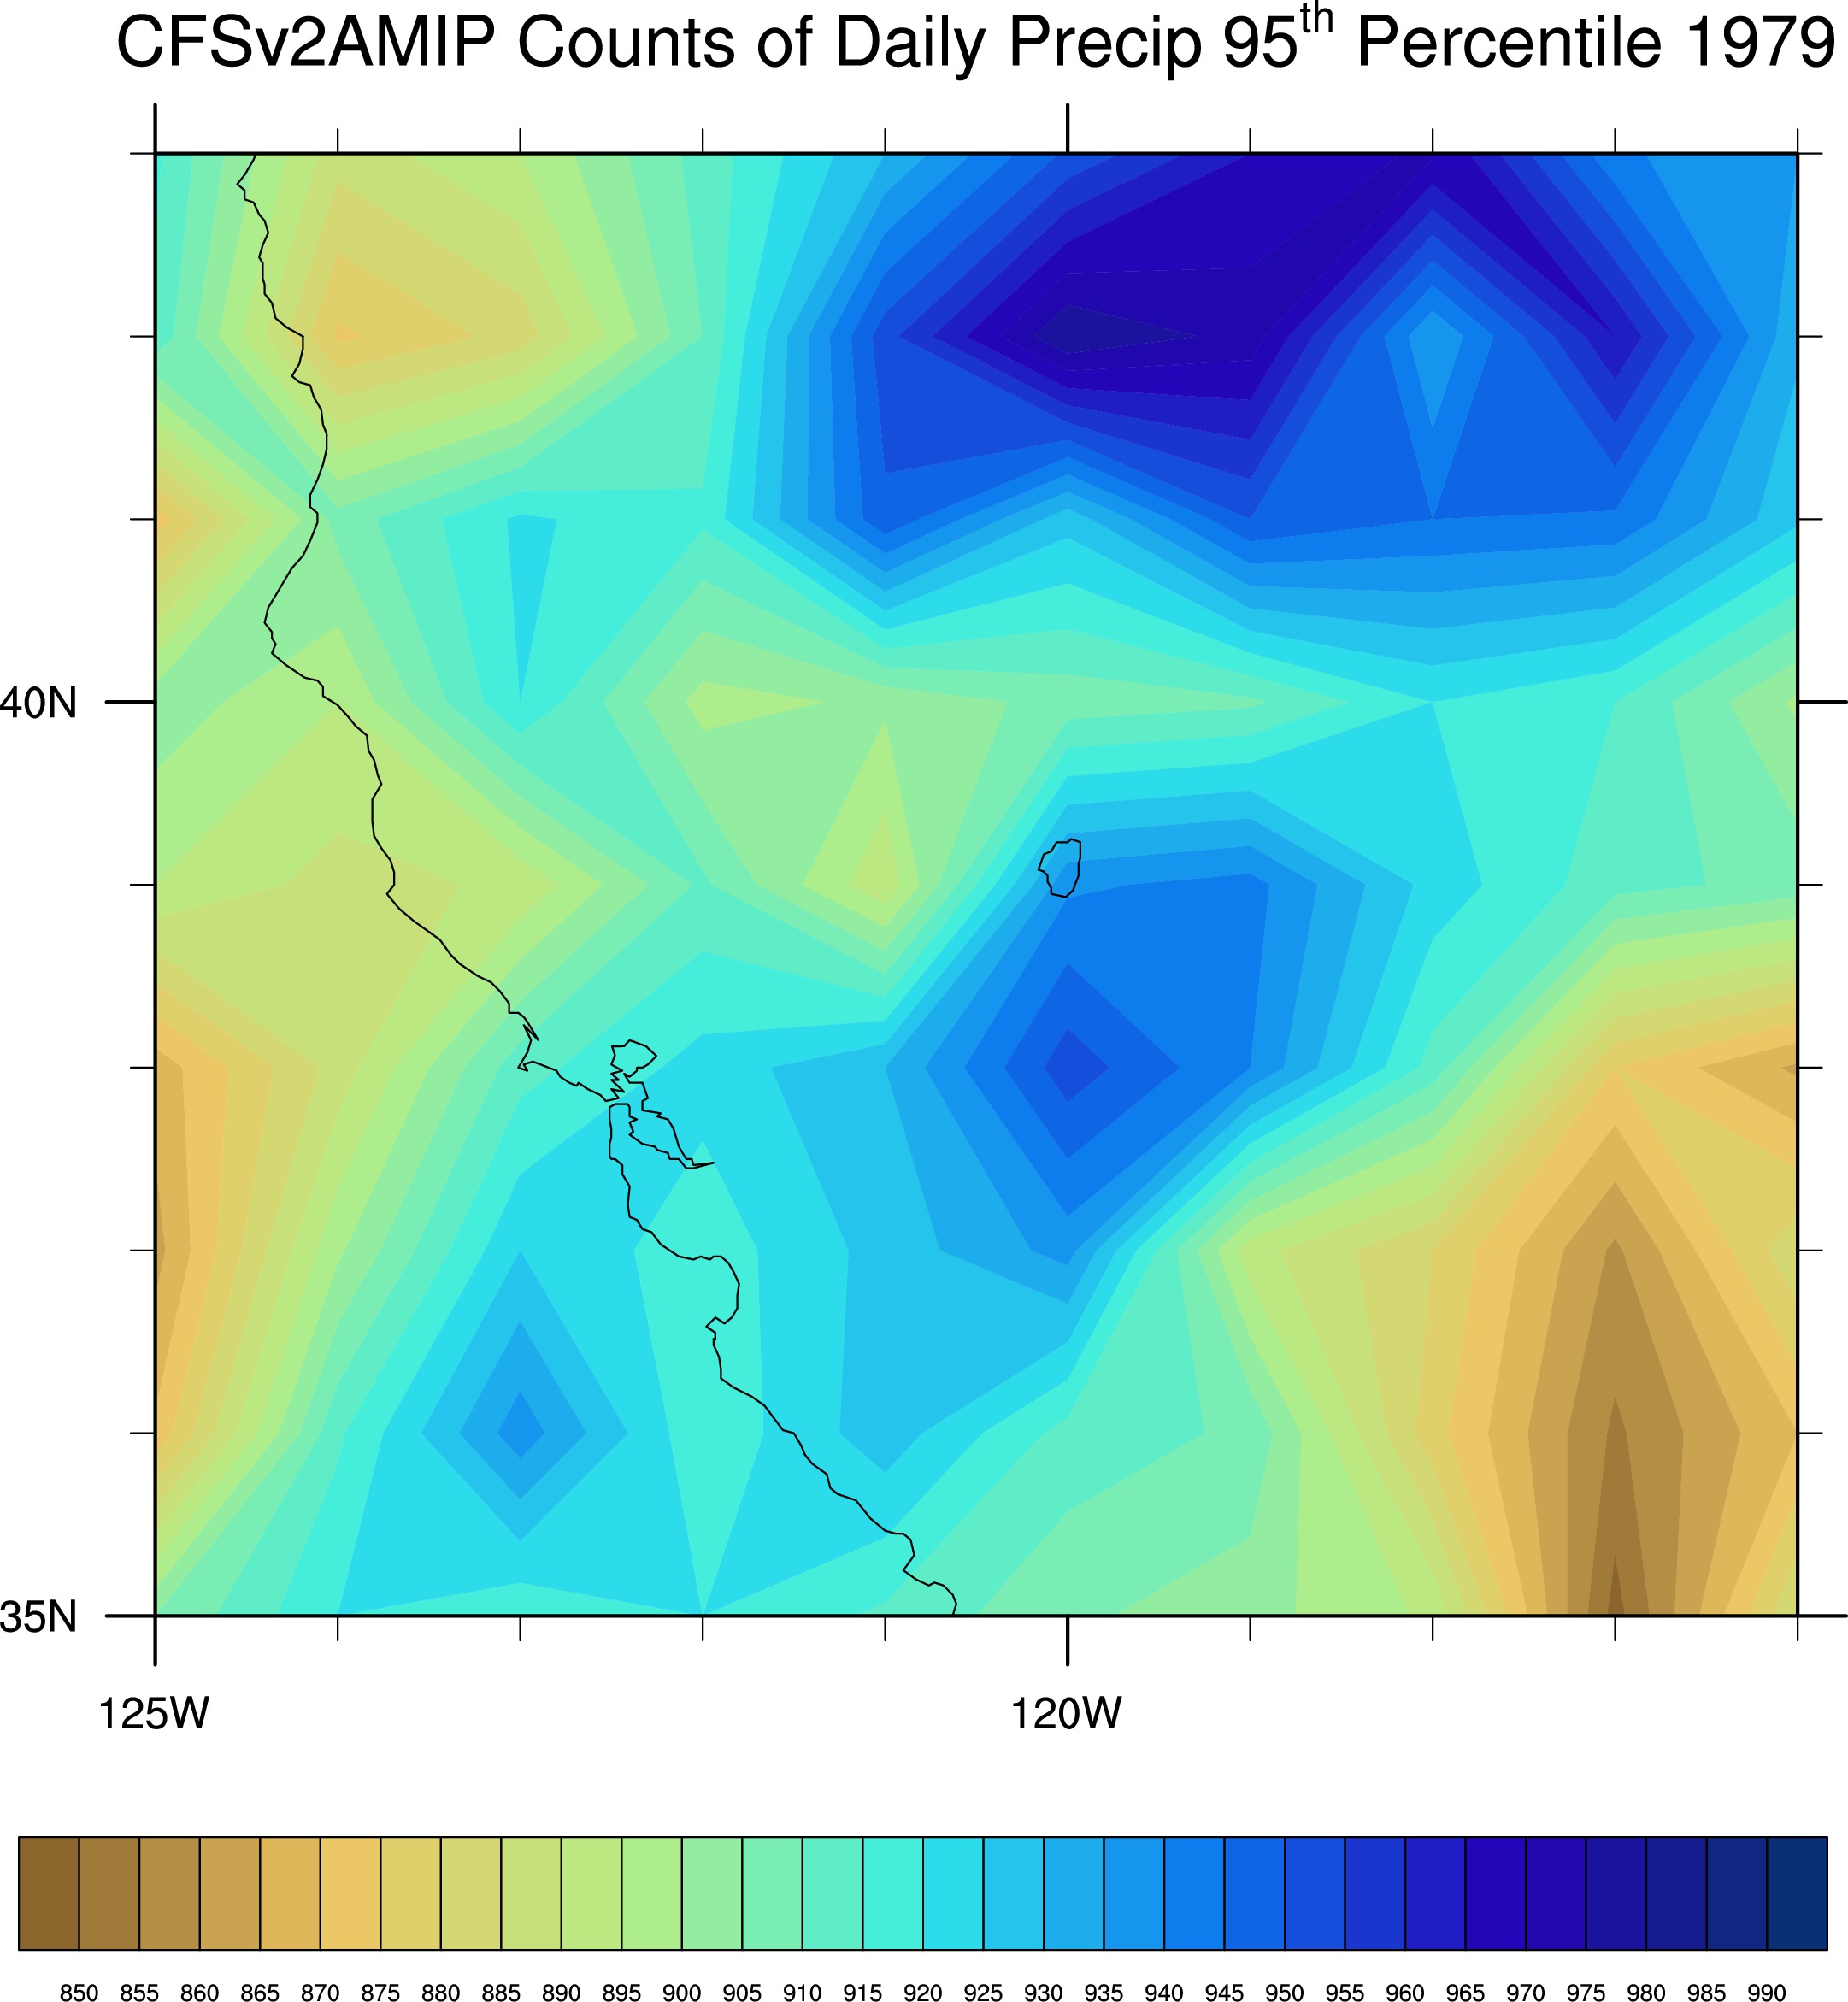
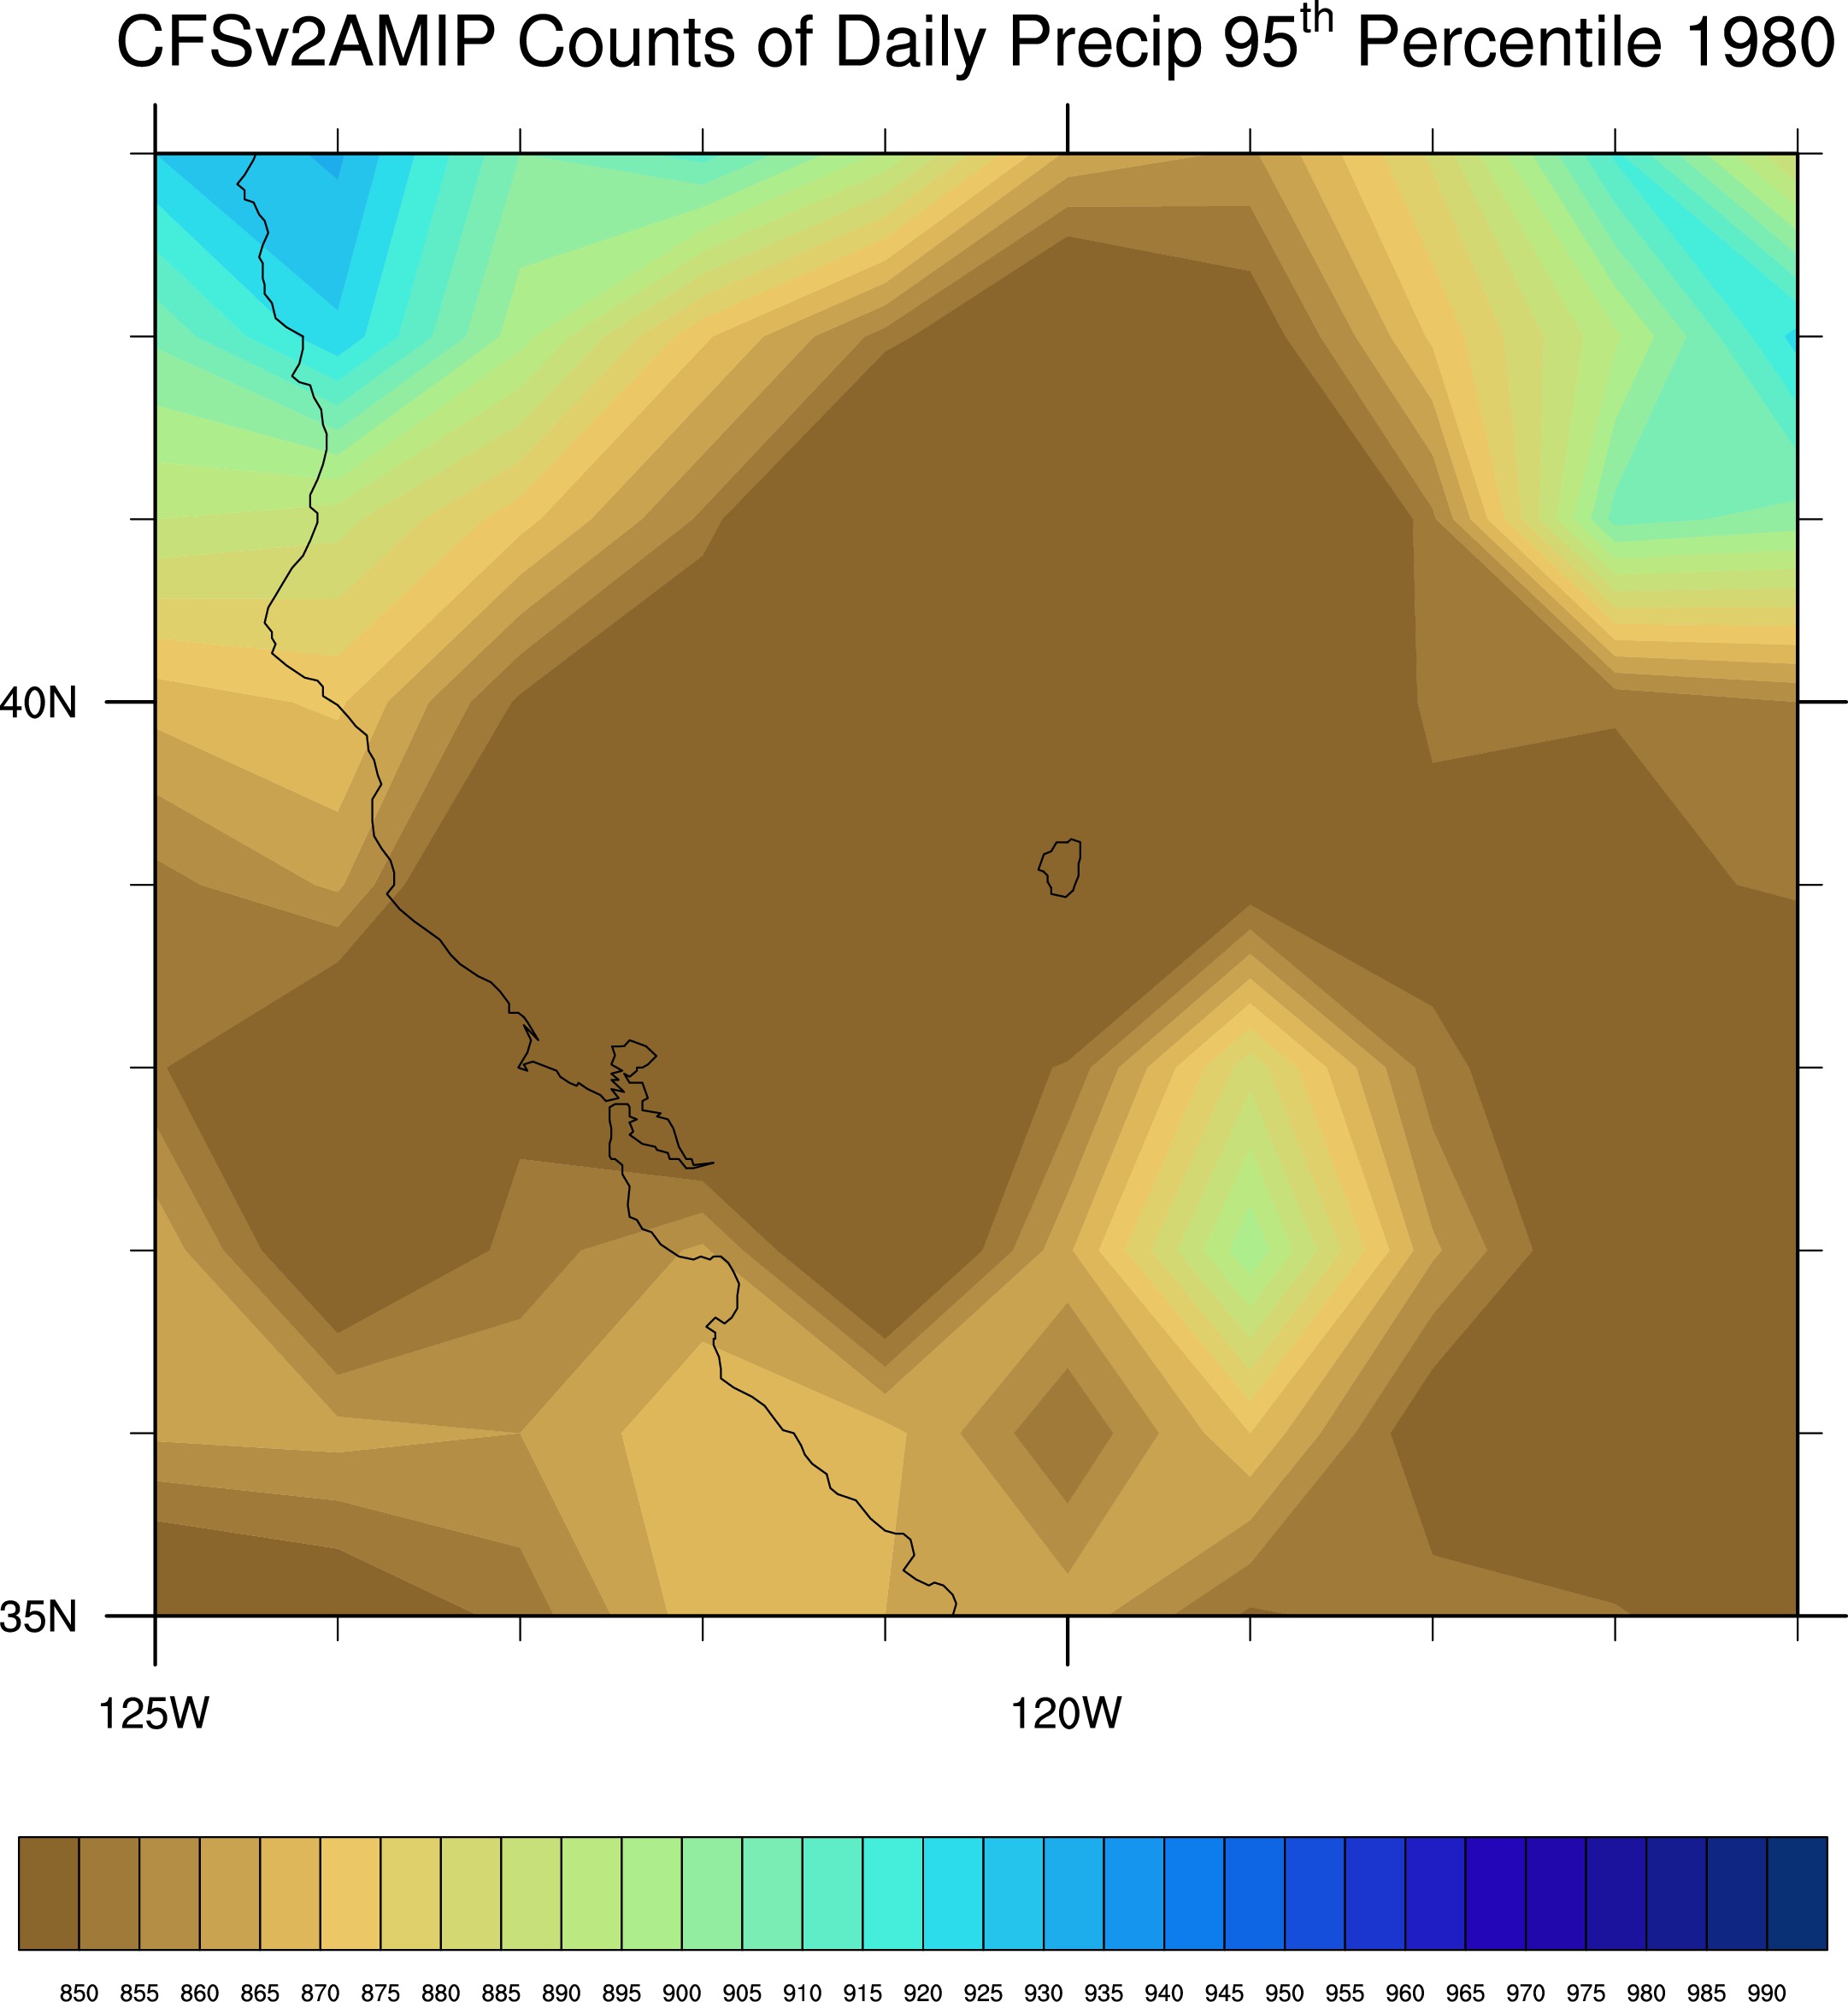
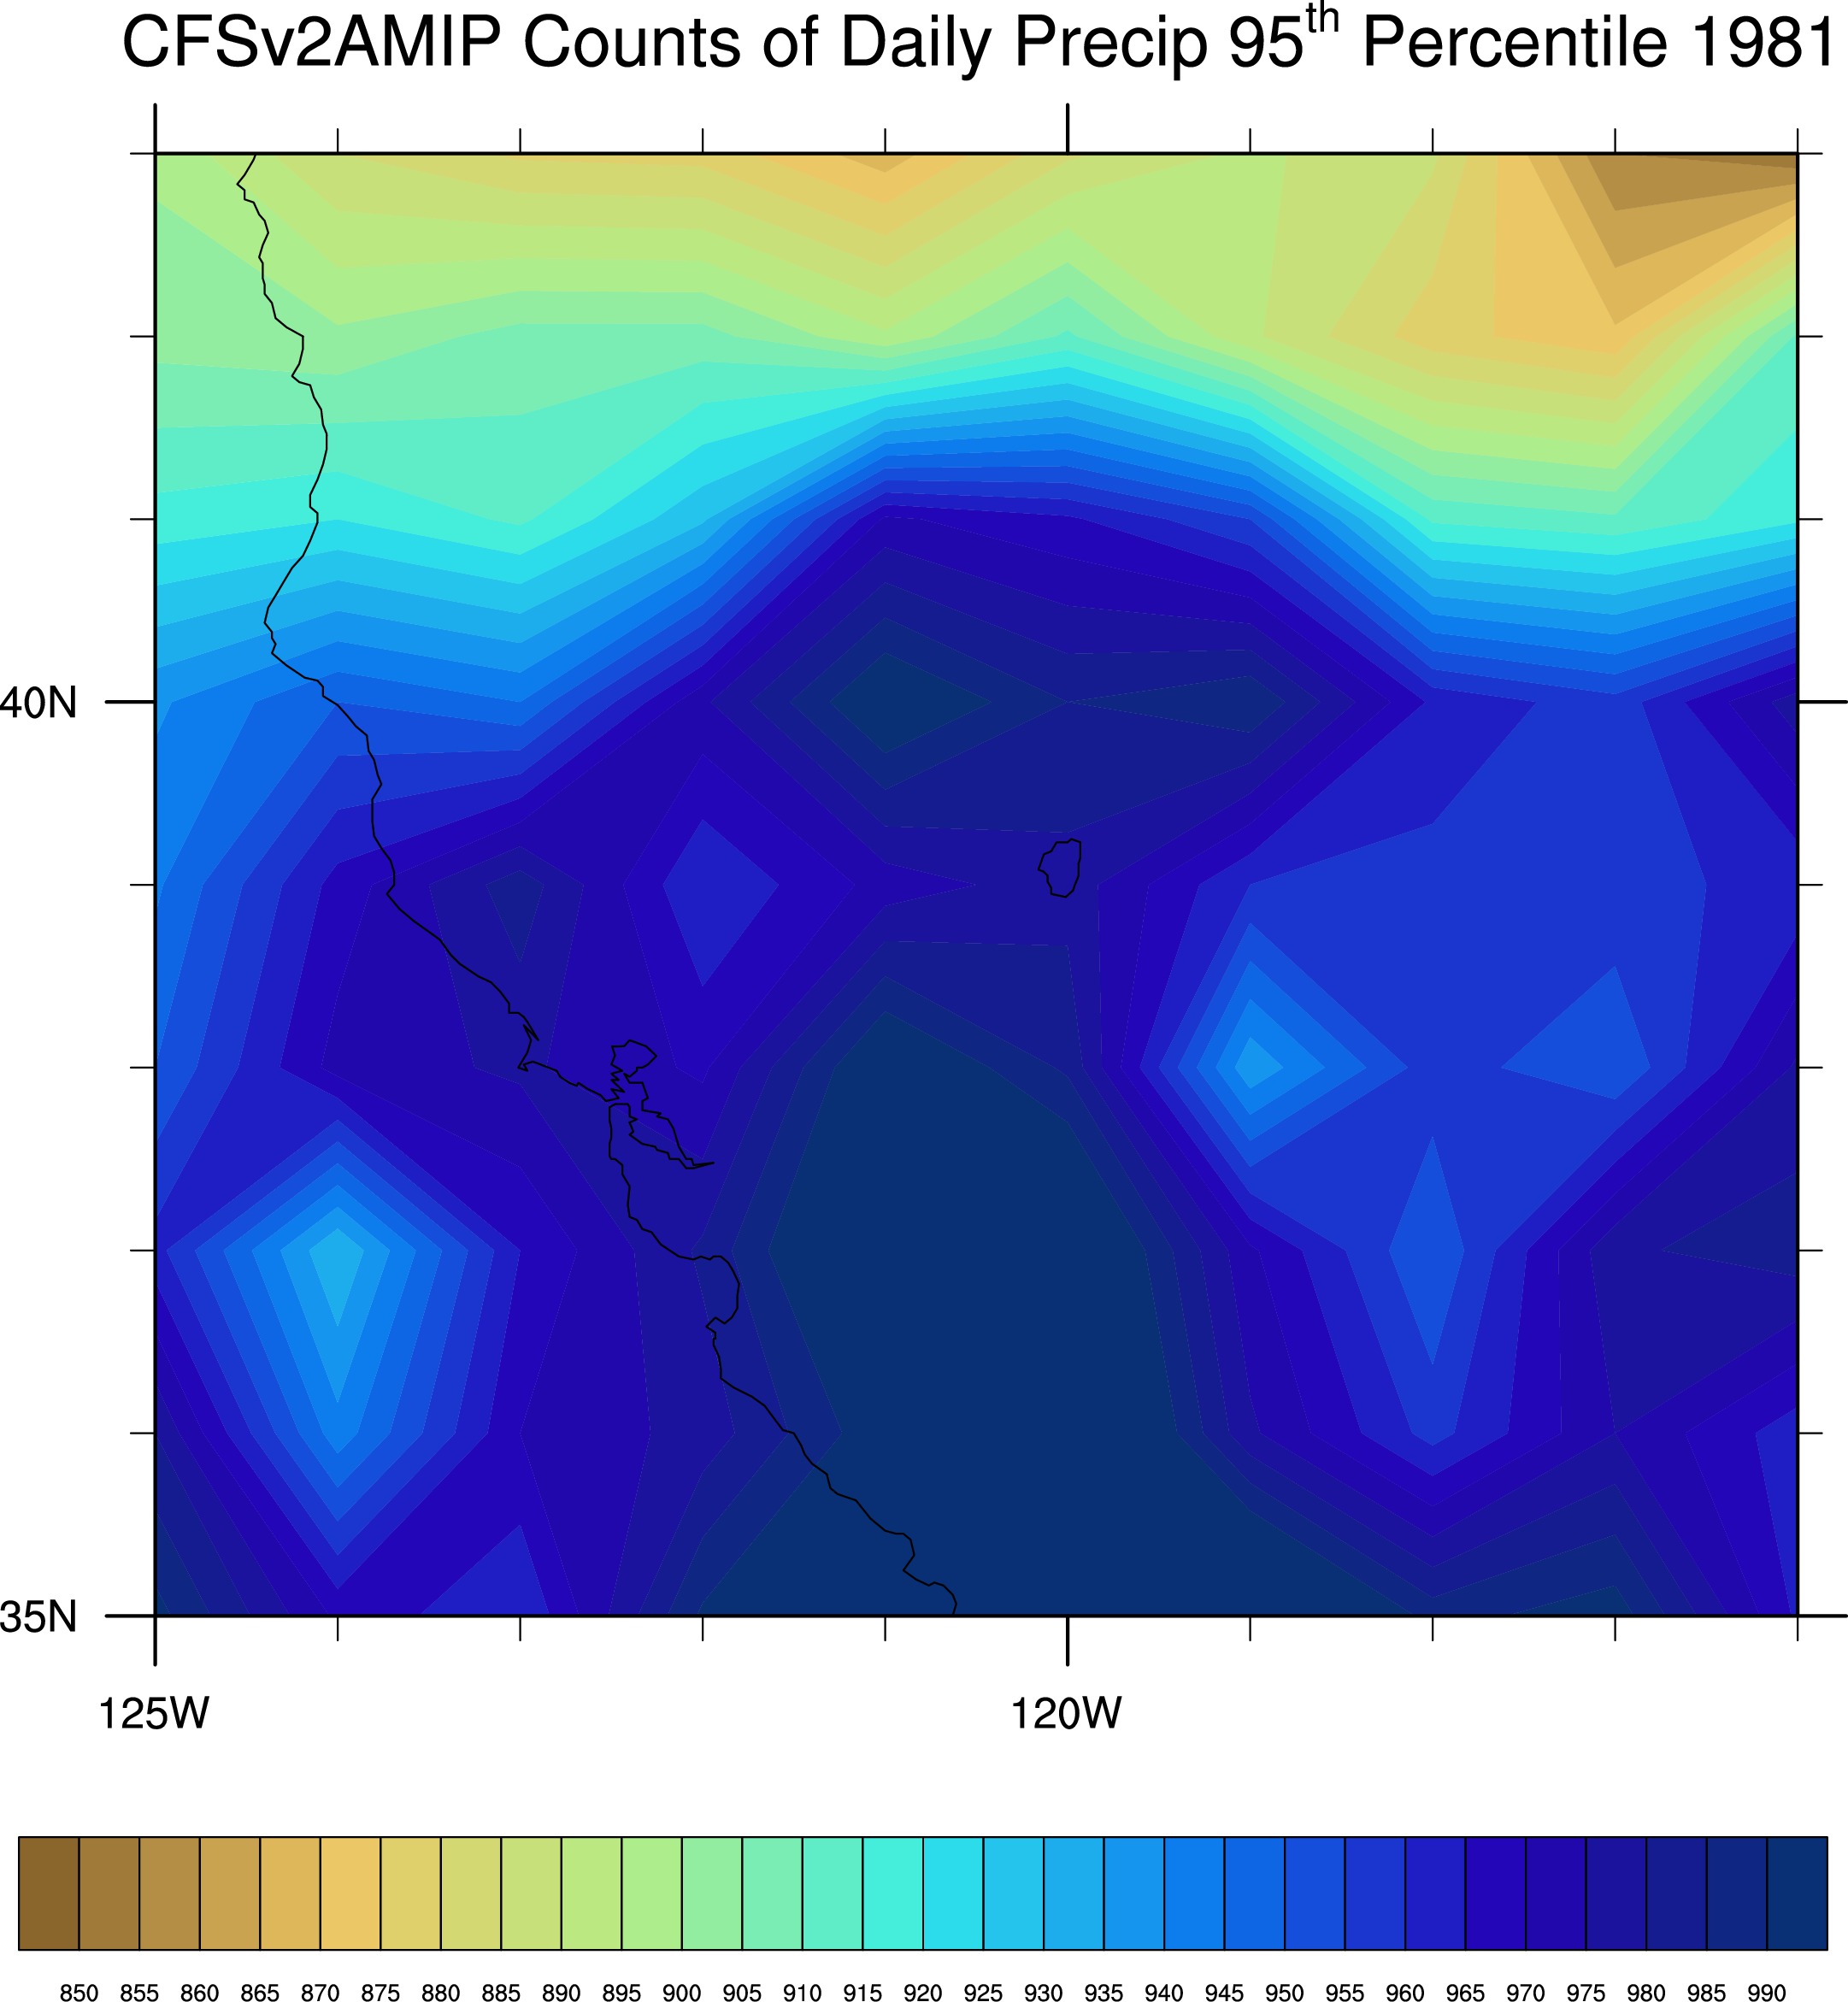
How wet is each year?
Number of times the 95th Percentile is exceeded per year per 50 concatenated runs:
--------------------------------------------------------------------------------------------------------------------------
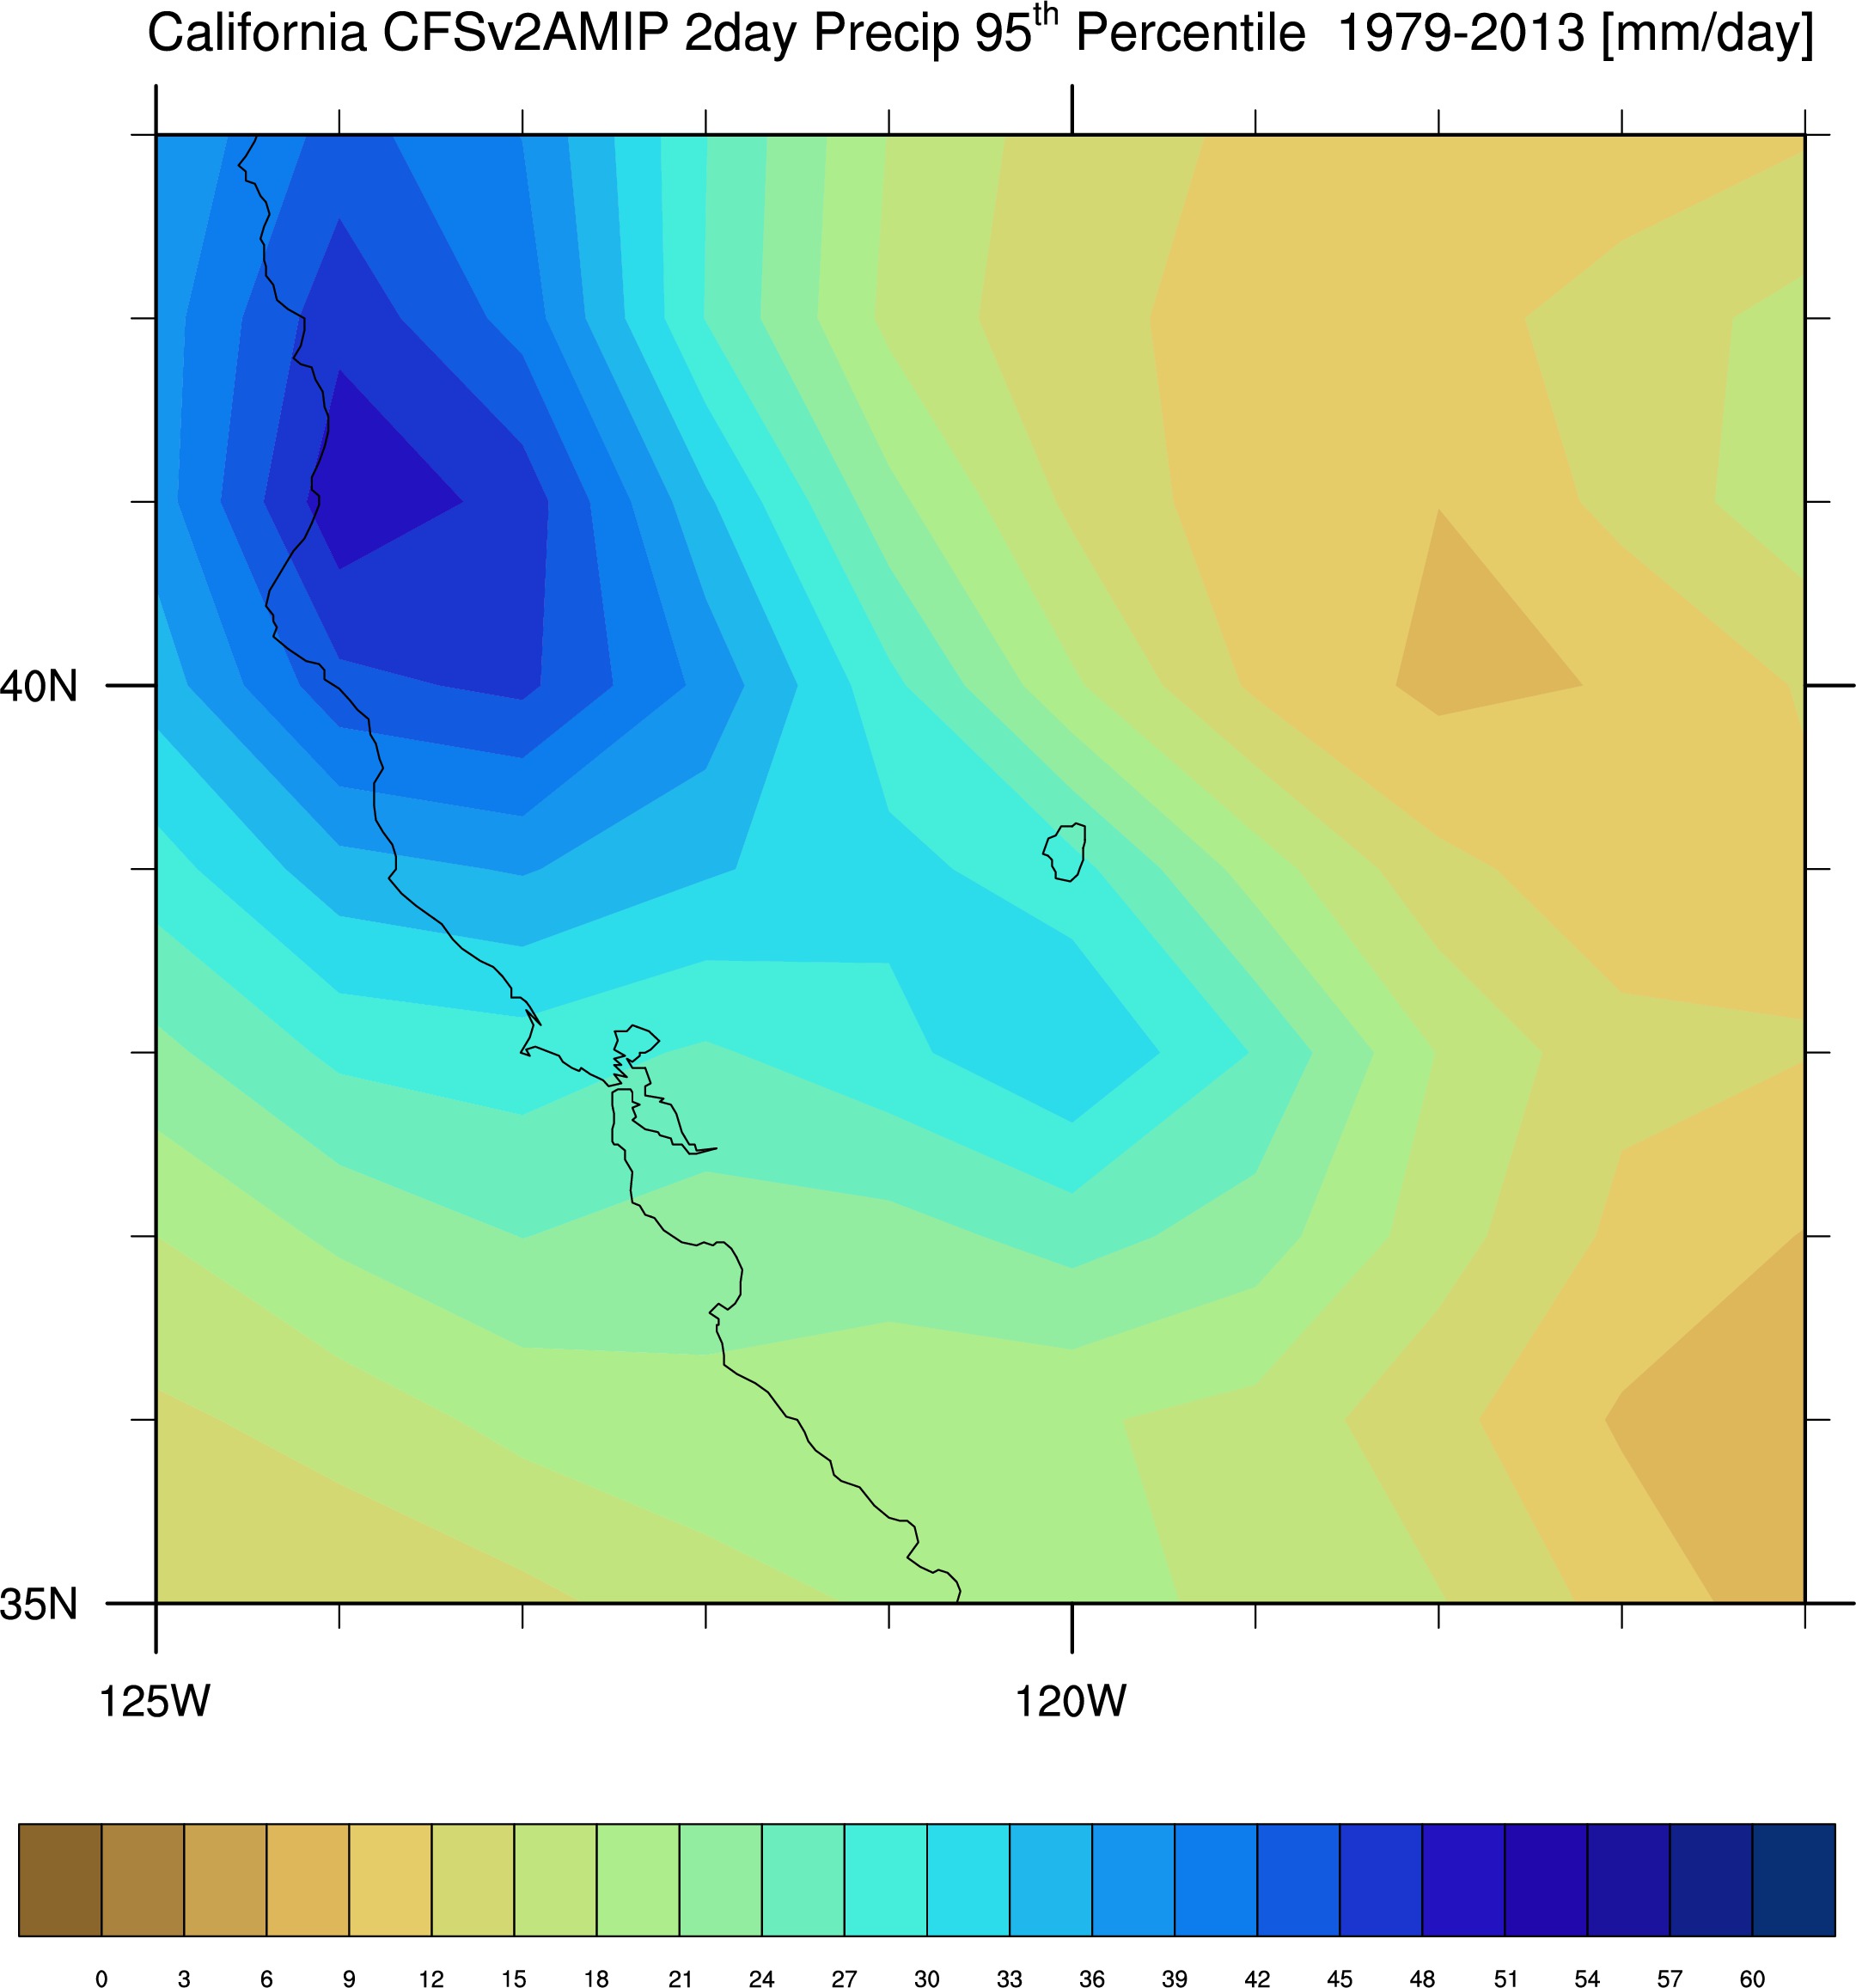
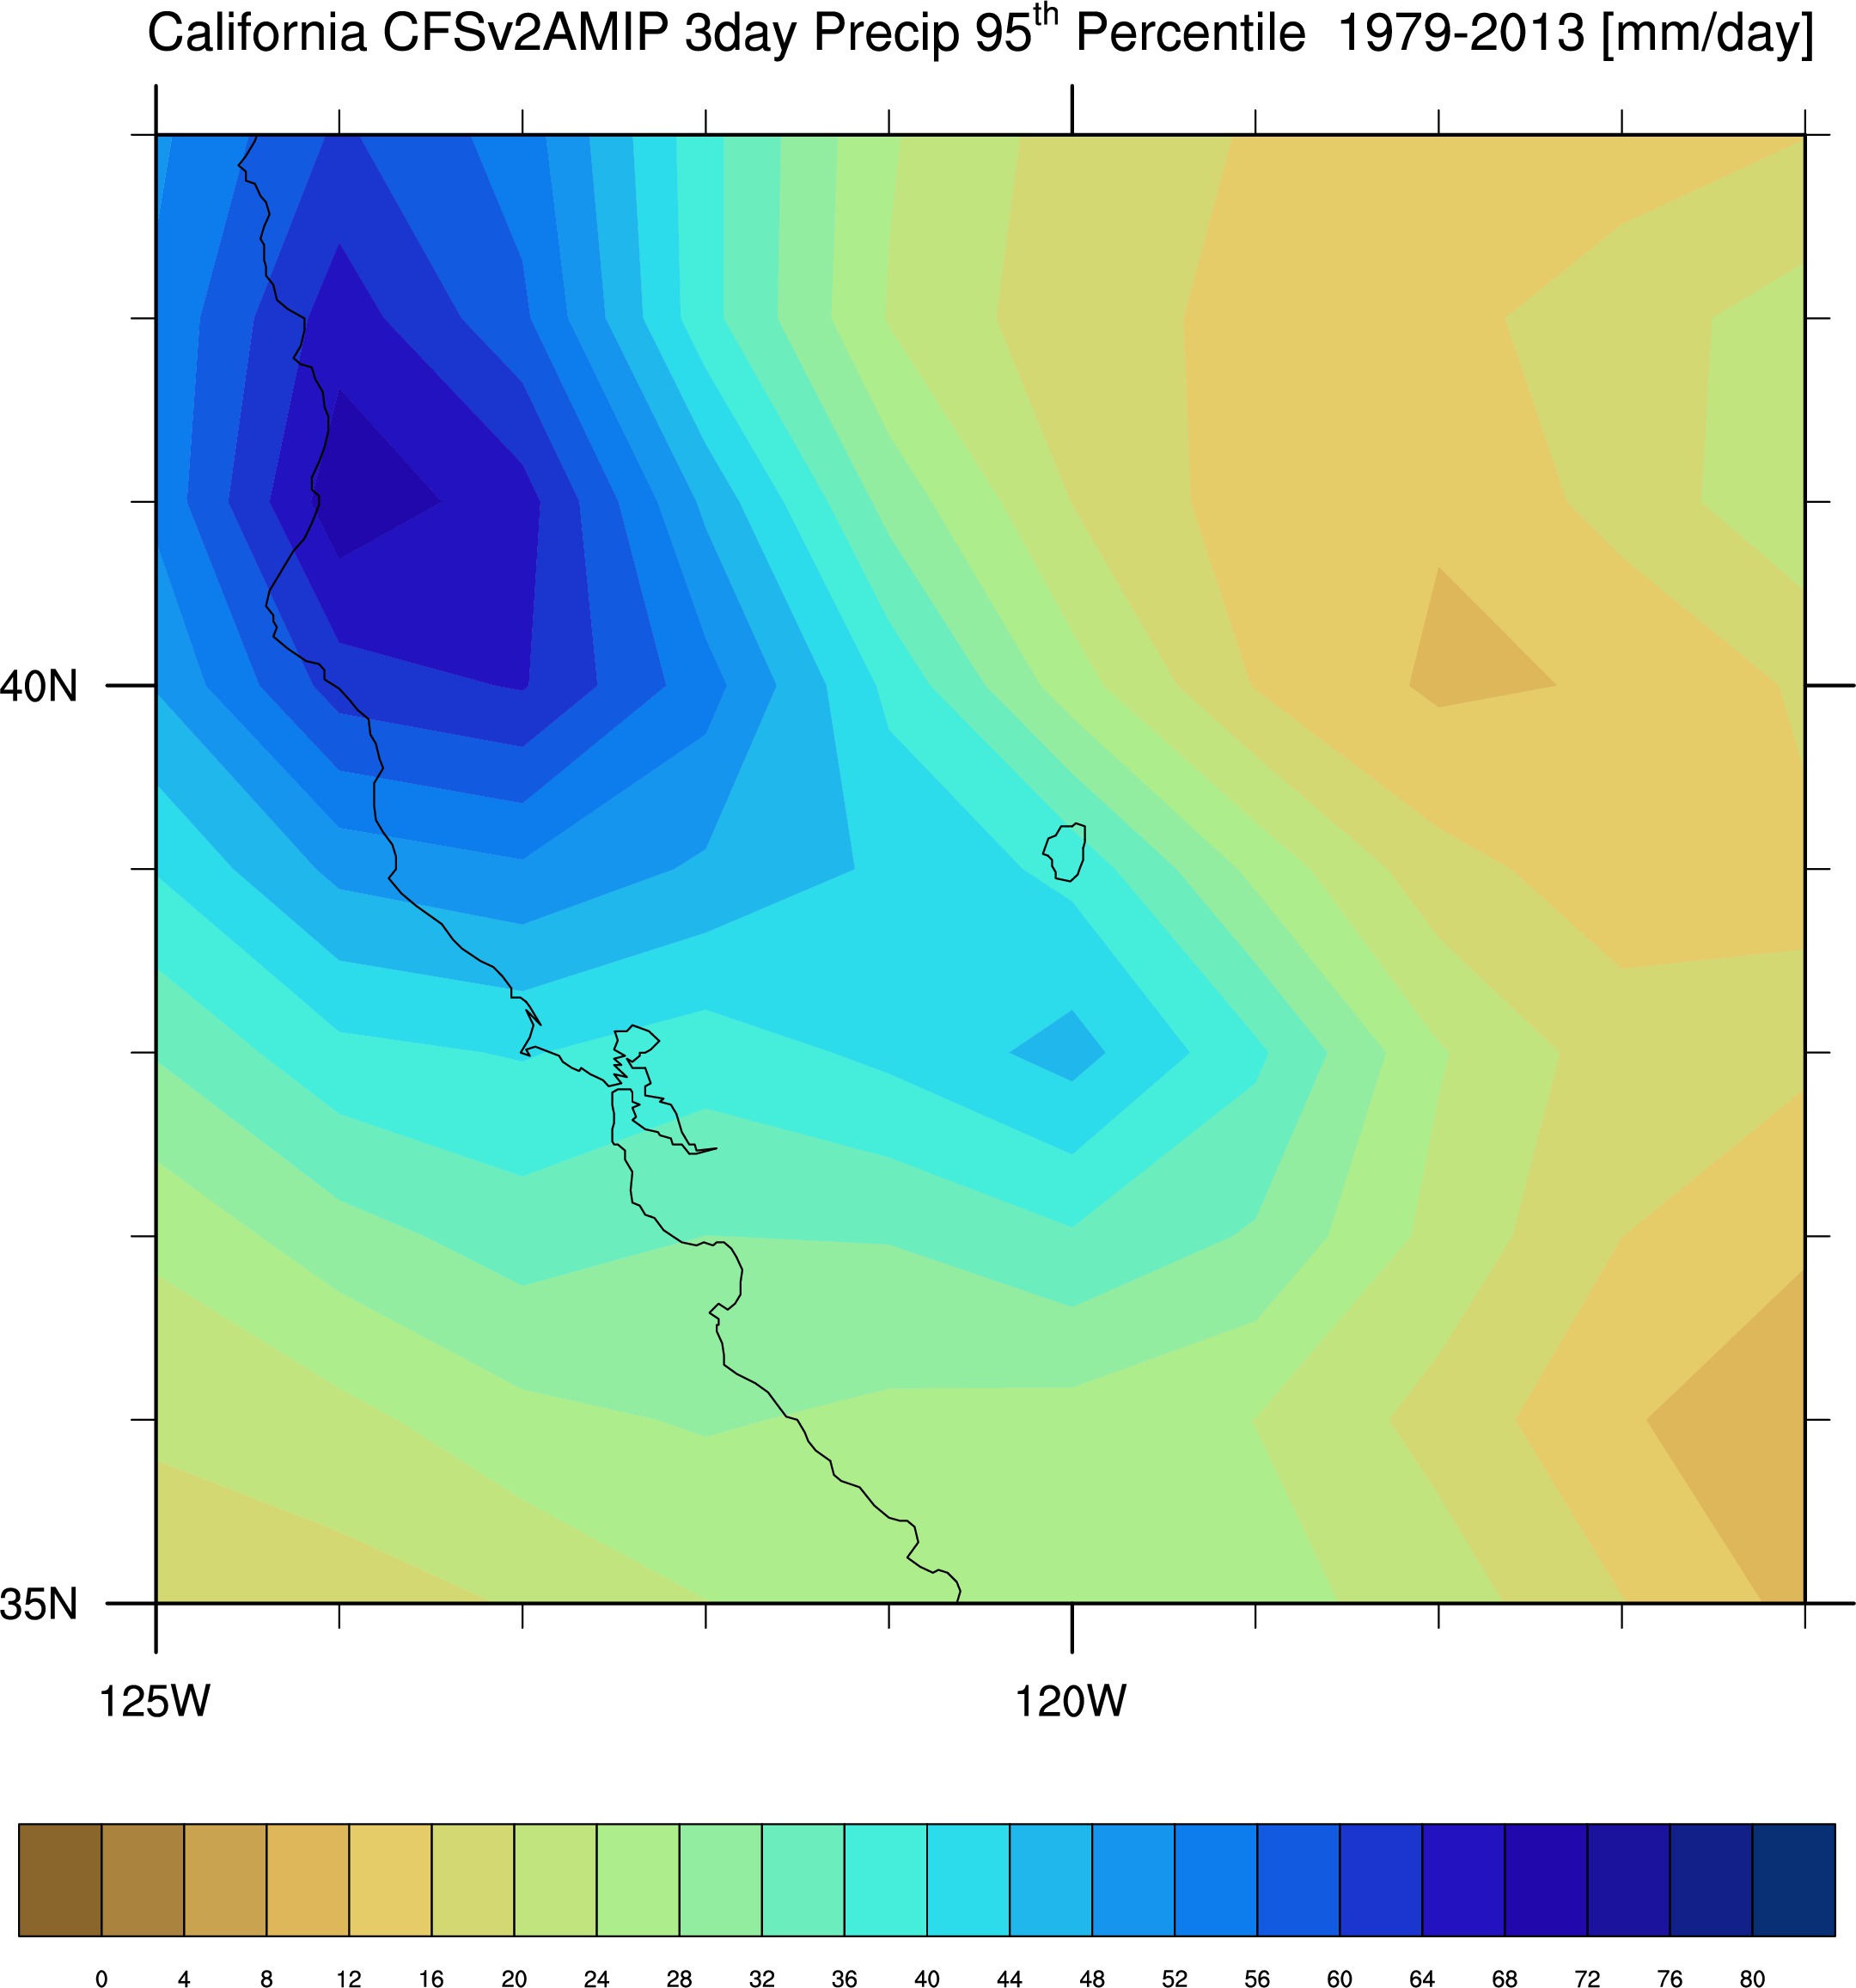
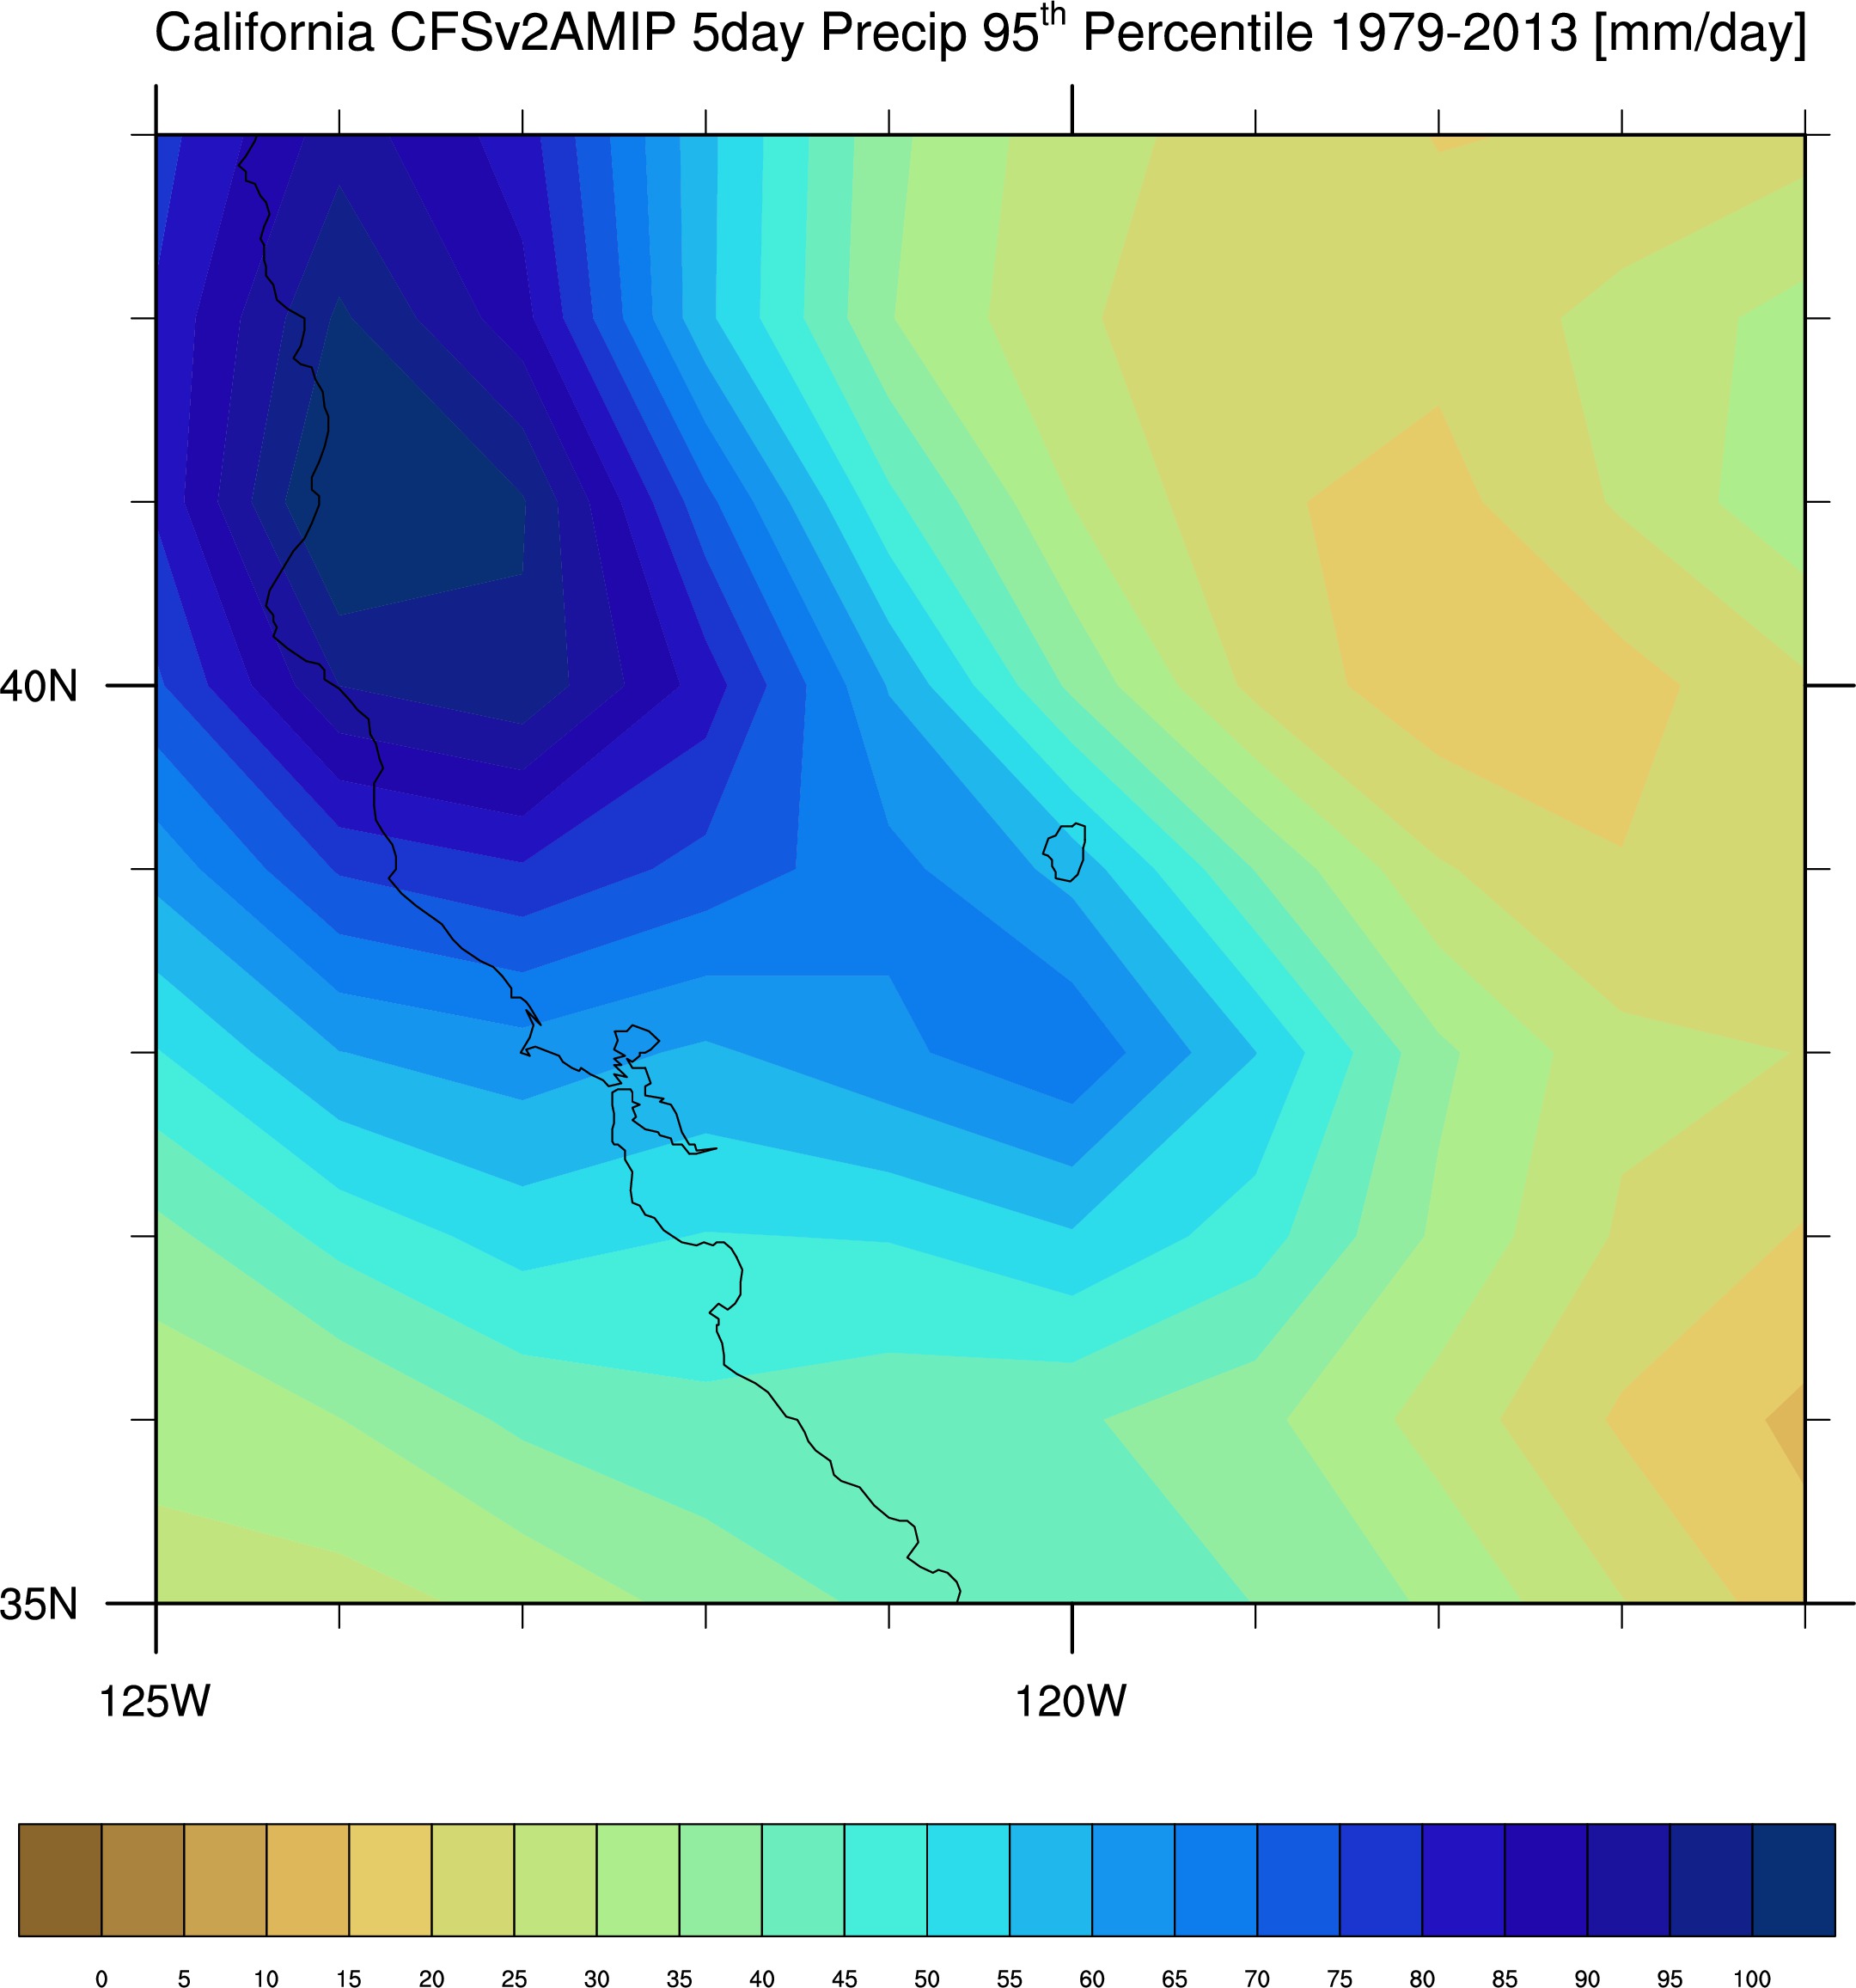
95th Percentile California Precipitation multi-day cases:
Notice the contour levels below vary:
2-day case:
3-day case:
5-day case:
----------------------------------------------------------------------------------------------------------------------------------------------------------------------------------------------------------------------------------------------
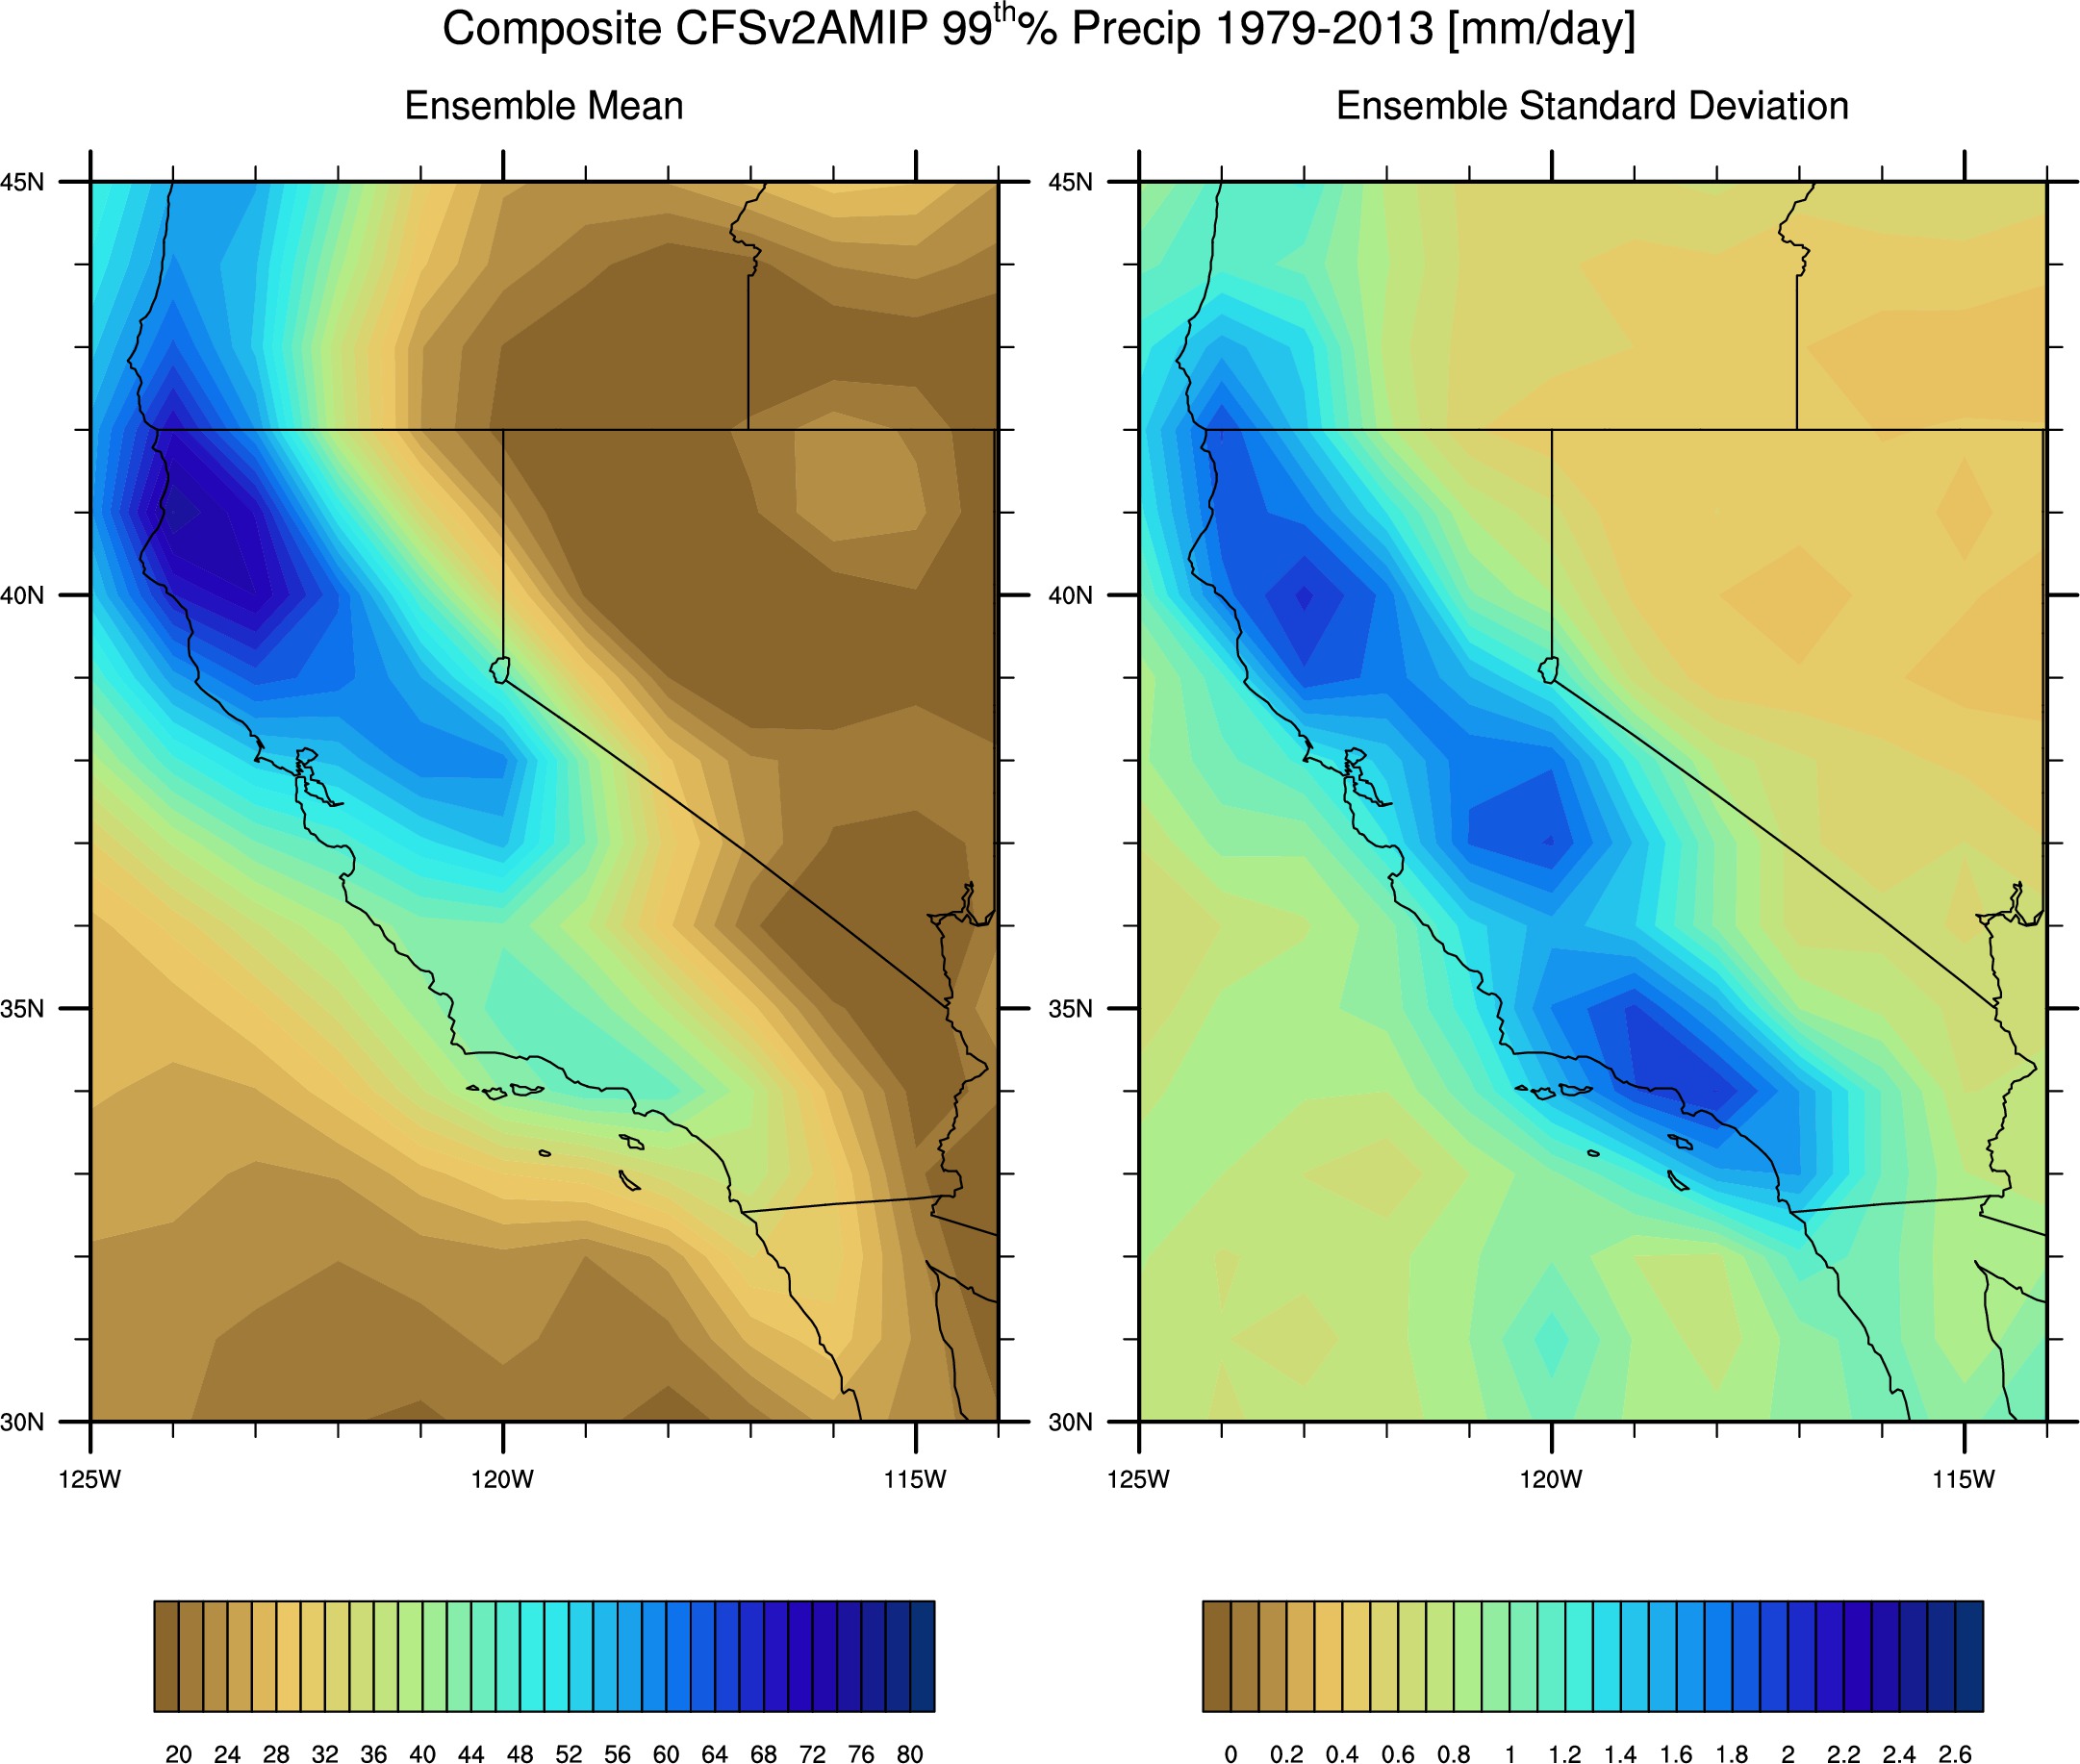
Using the concatenated 50-member ensemble we also computed the 99th Percentile Precip. Then, for each run, we composited the cases that were equal to or exceeded this 99th percentile. The mean and standard deviations of these 50 composites are below:
As a check of all this, mean daily precipitation:
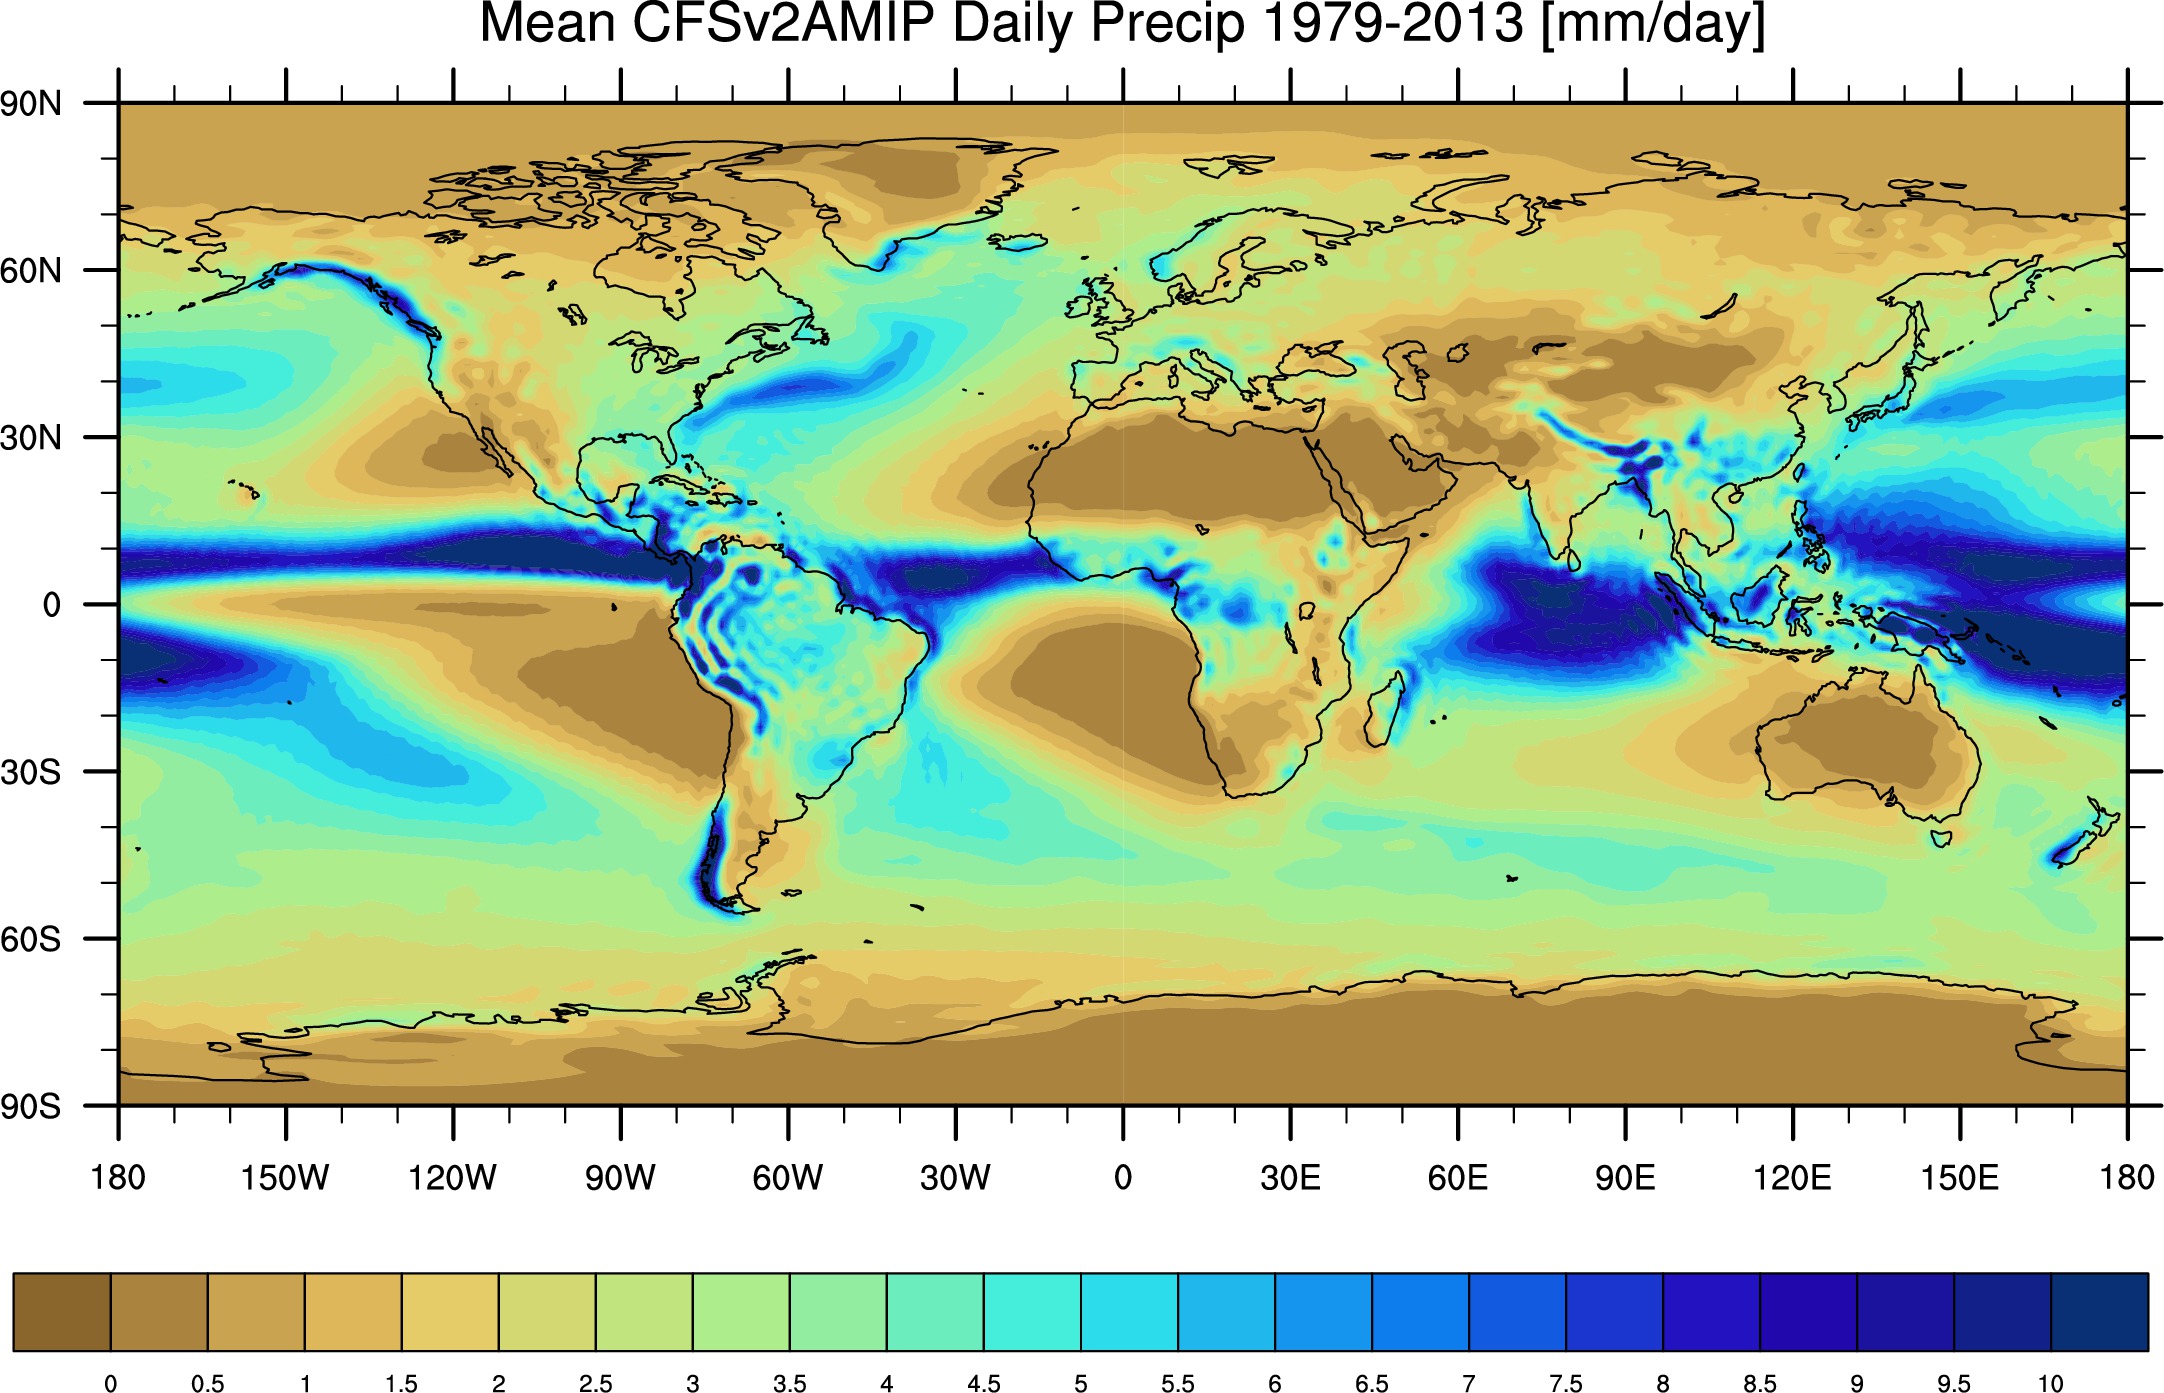
Notice the contour levels are 4 times smaller here than above.