– El Nino
All plots here preliminary. Right click to see bigger images.
Back to main Smith page
ENSO's effect on U.S. weather
CESM1 Large Ensemble experiment
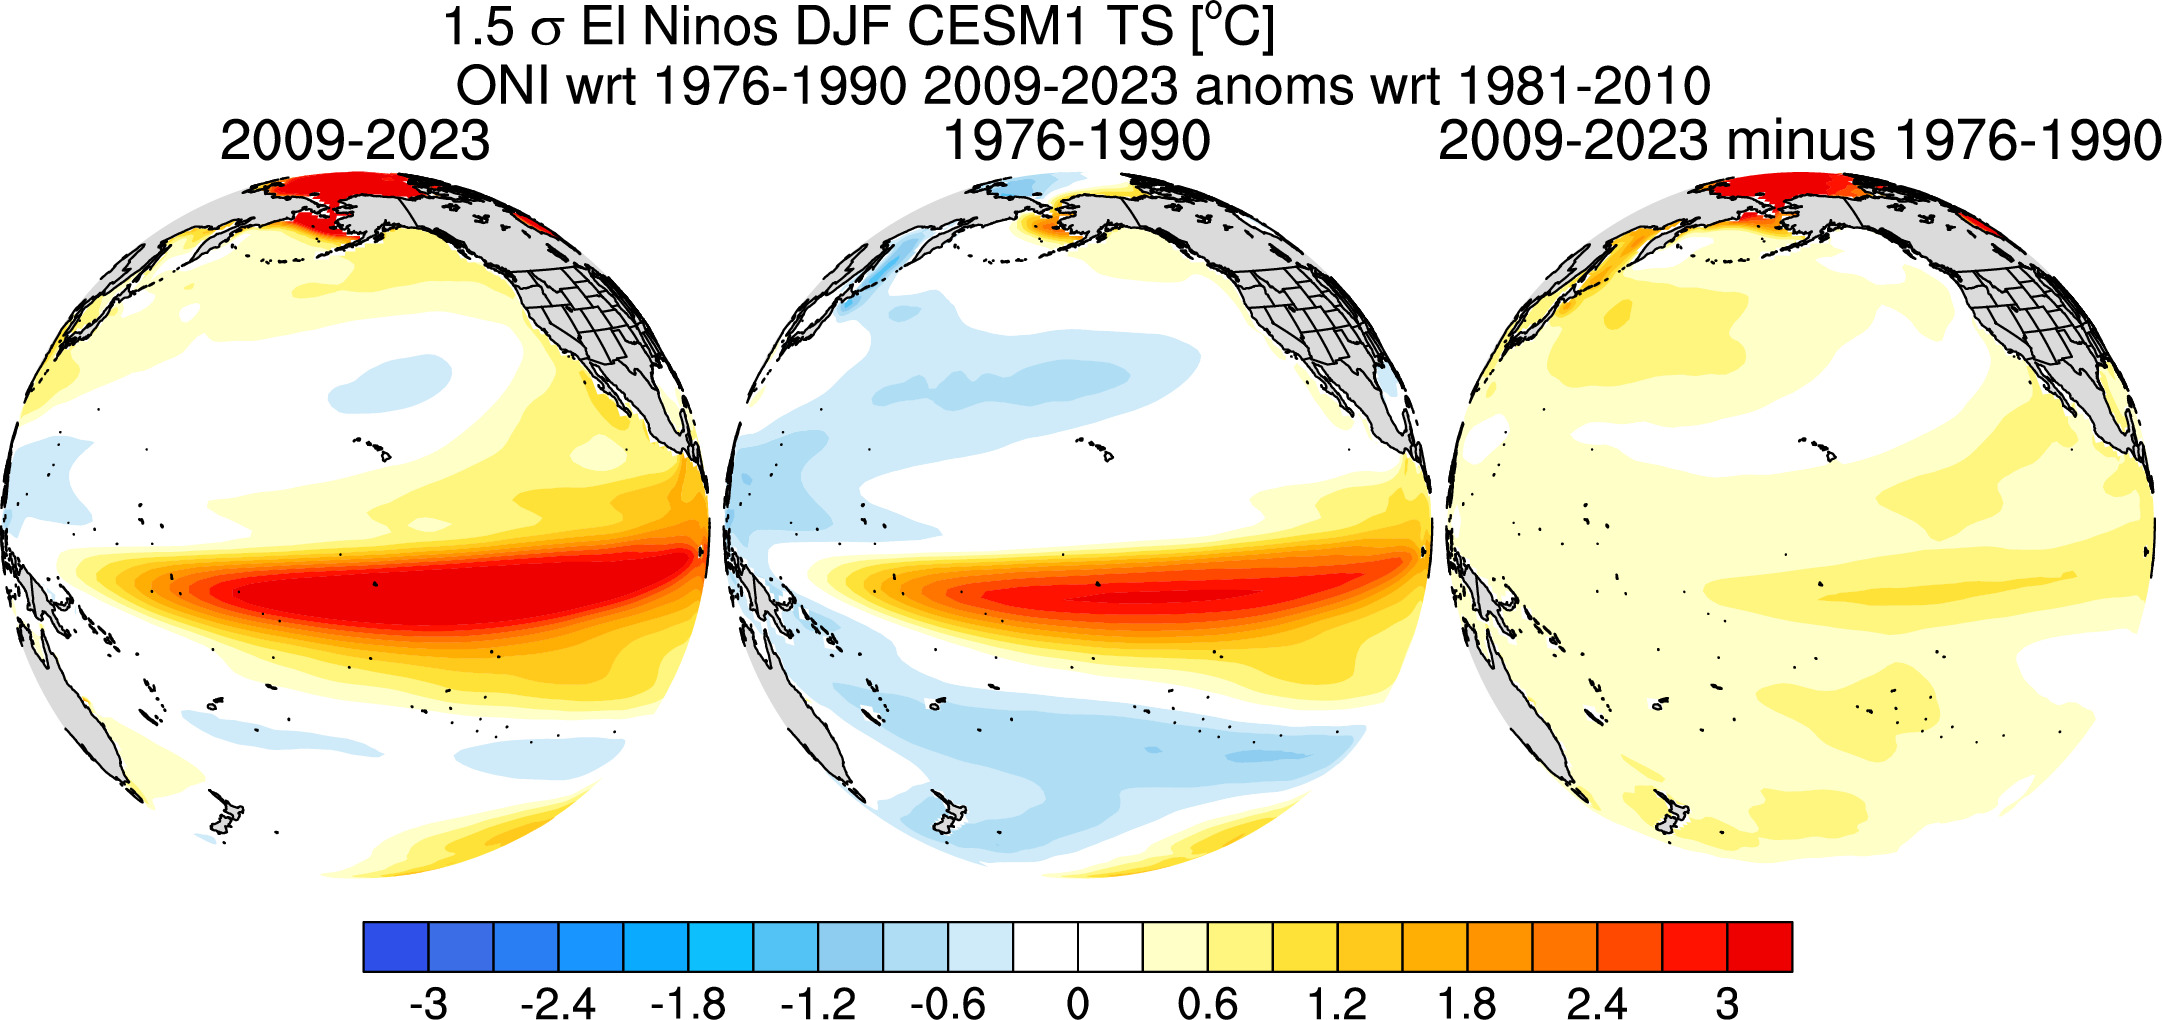
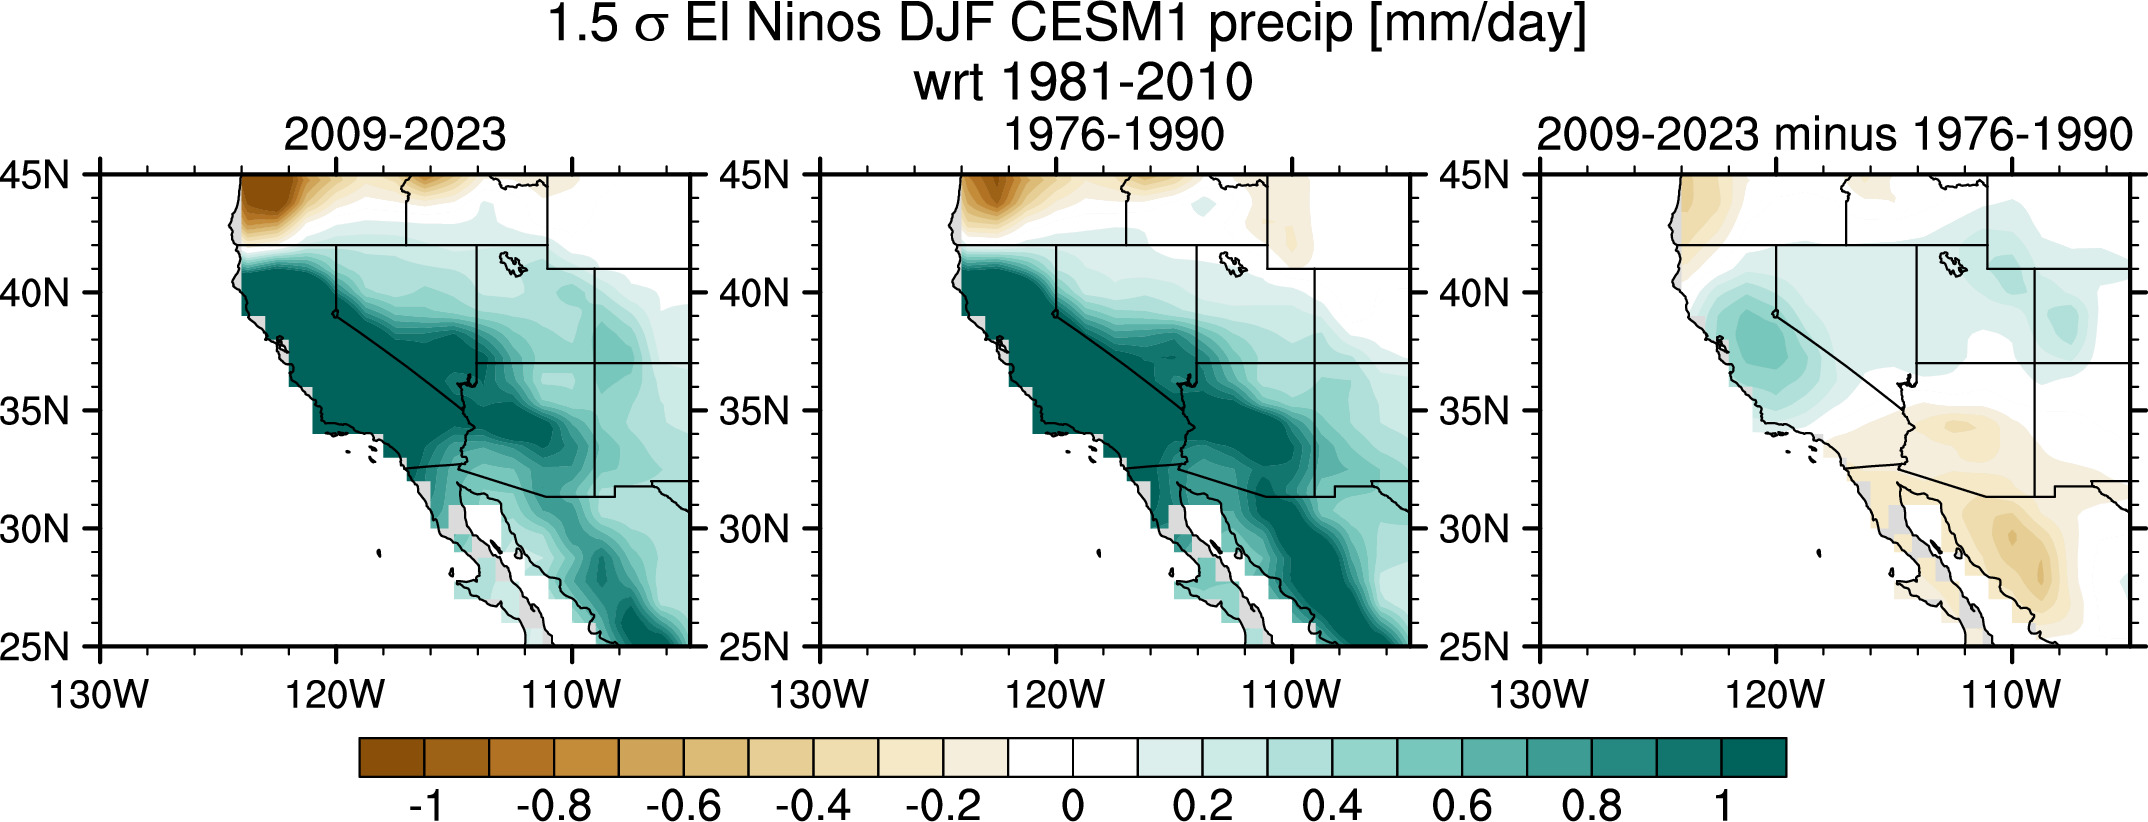
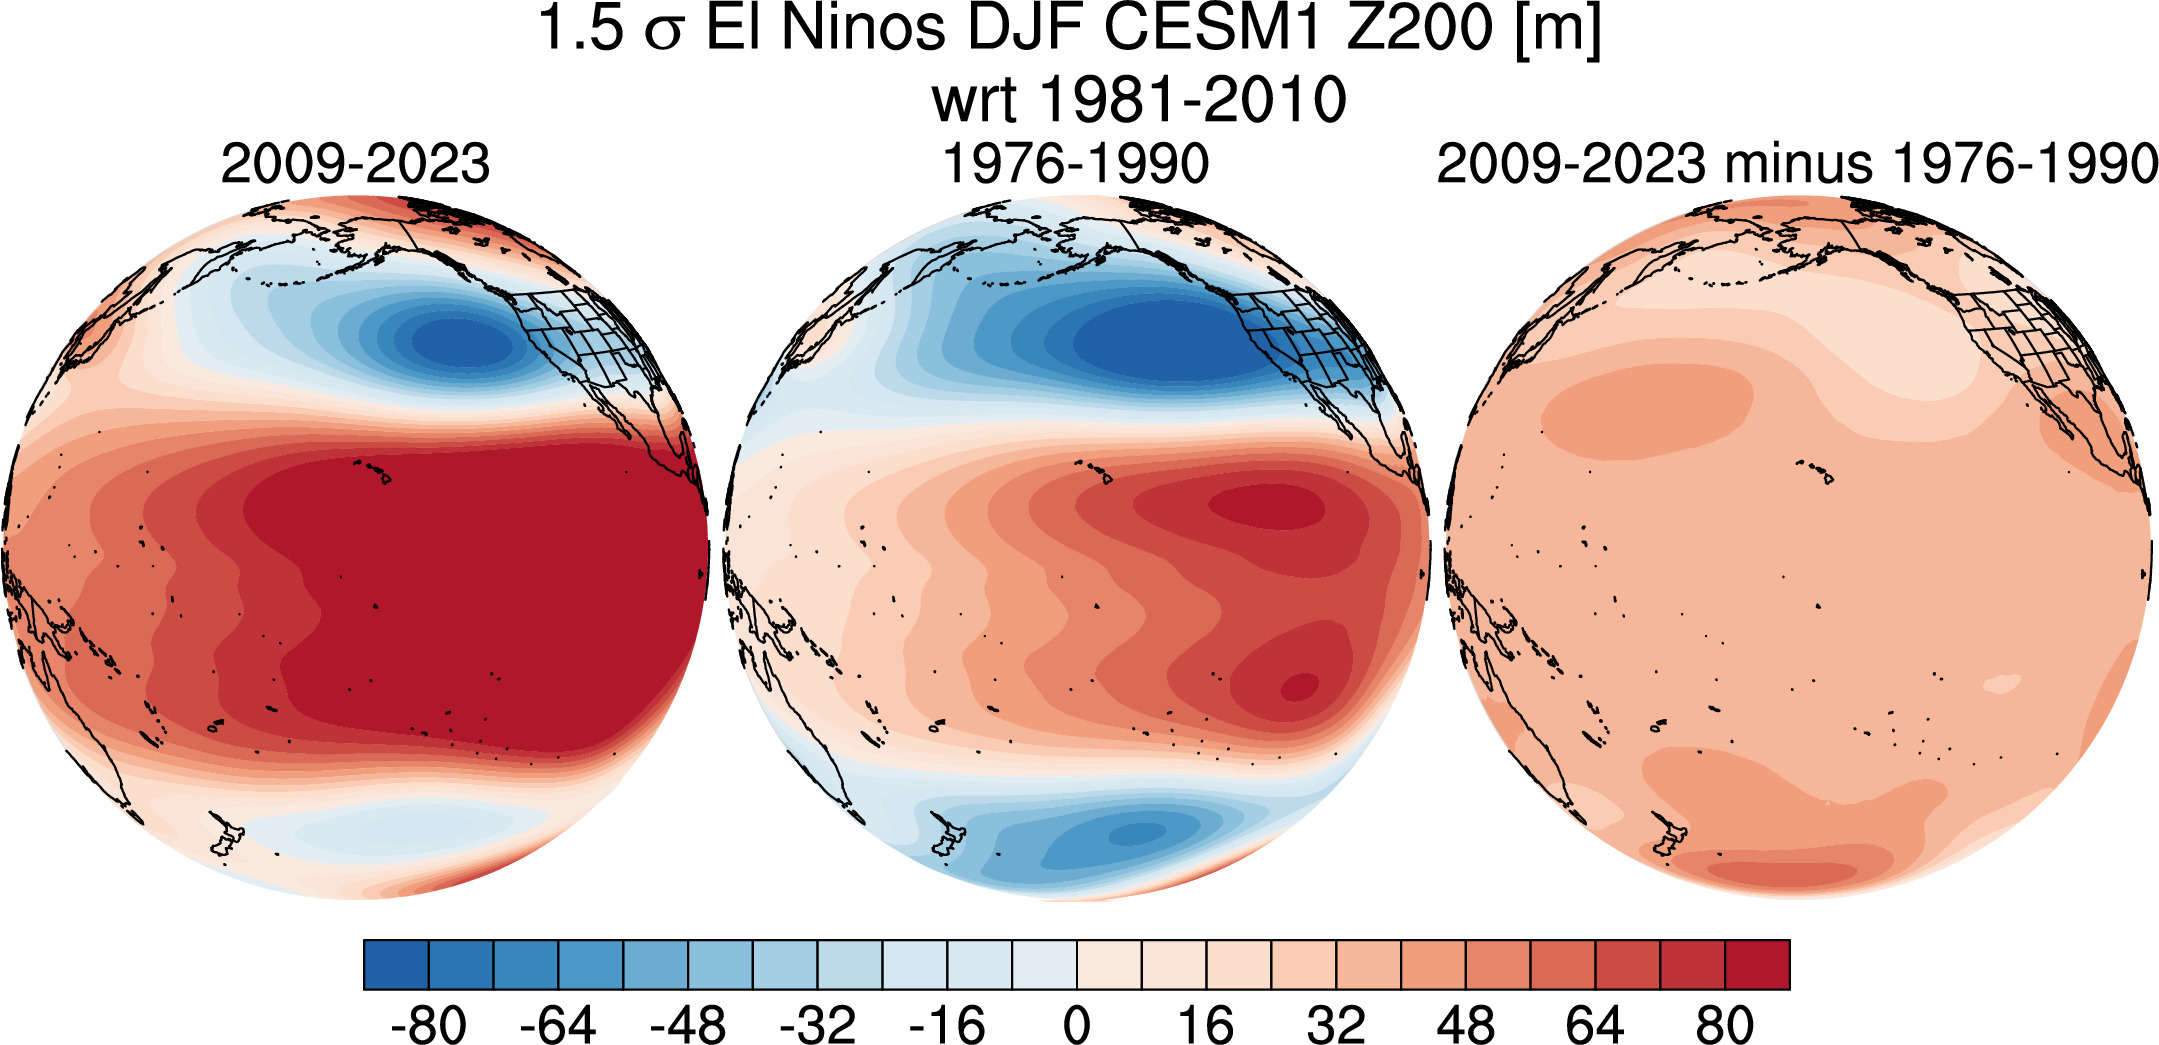
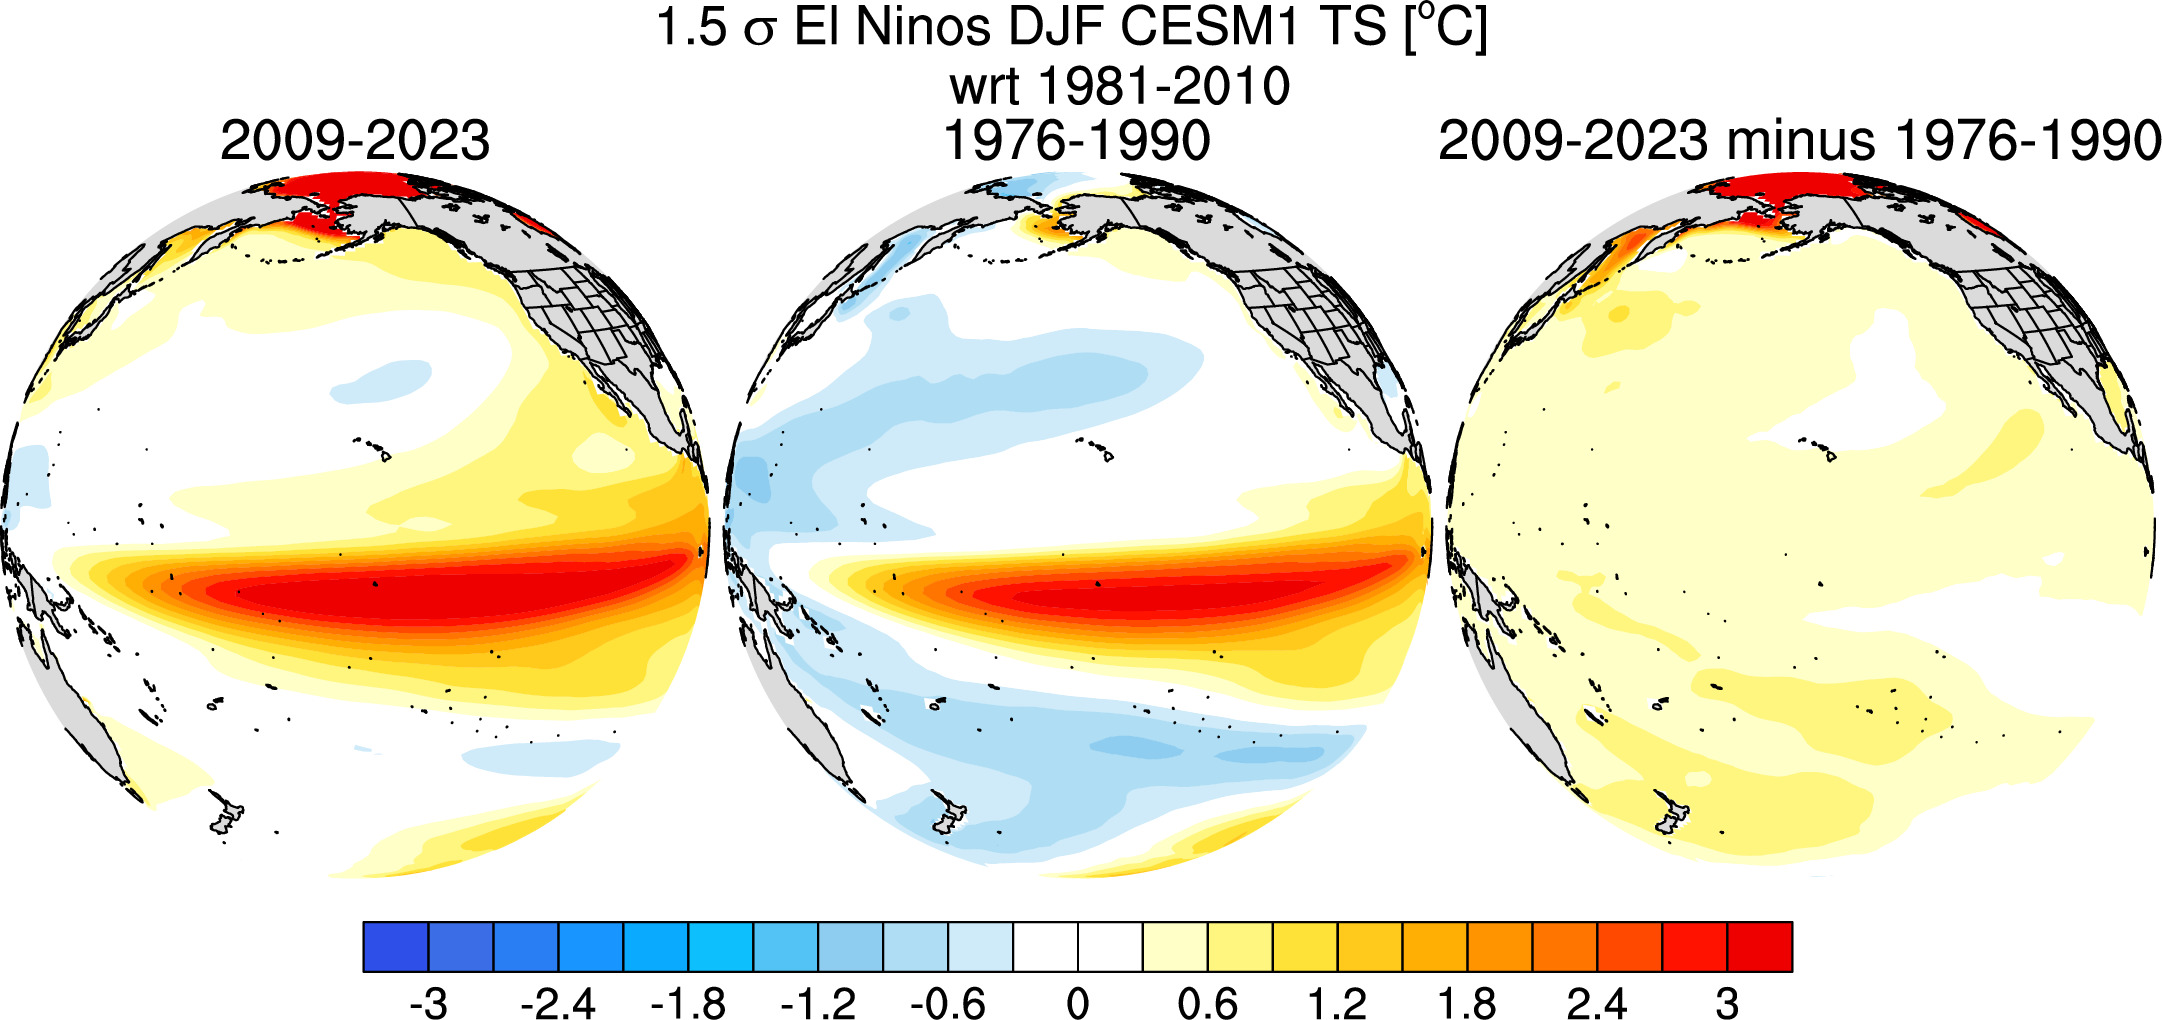
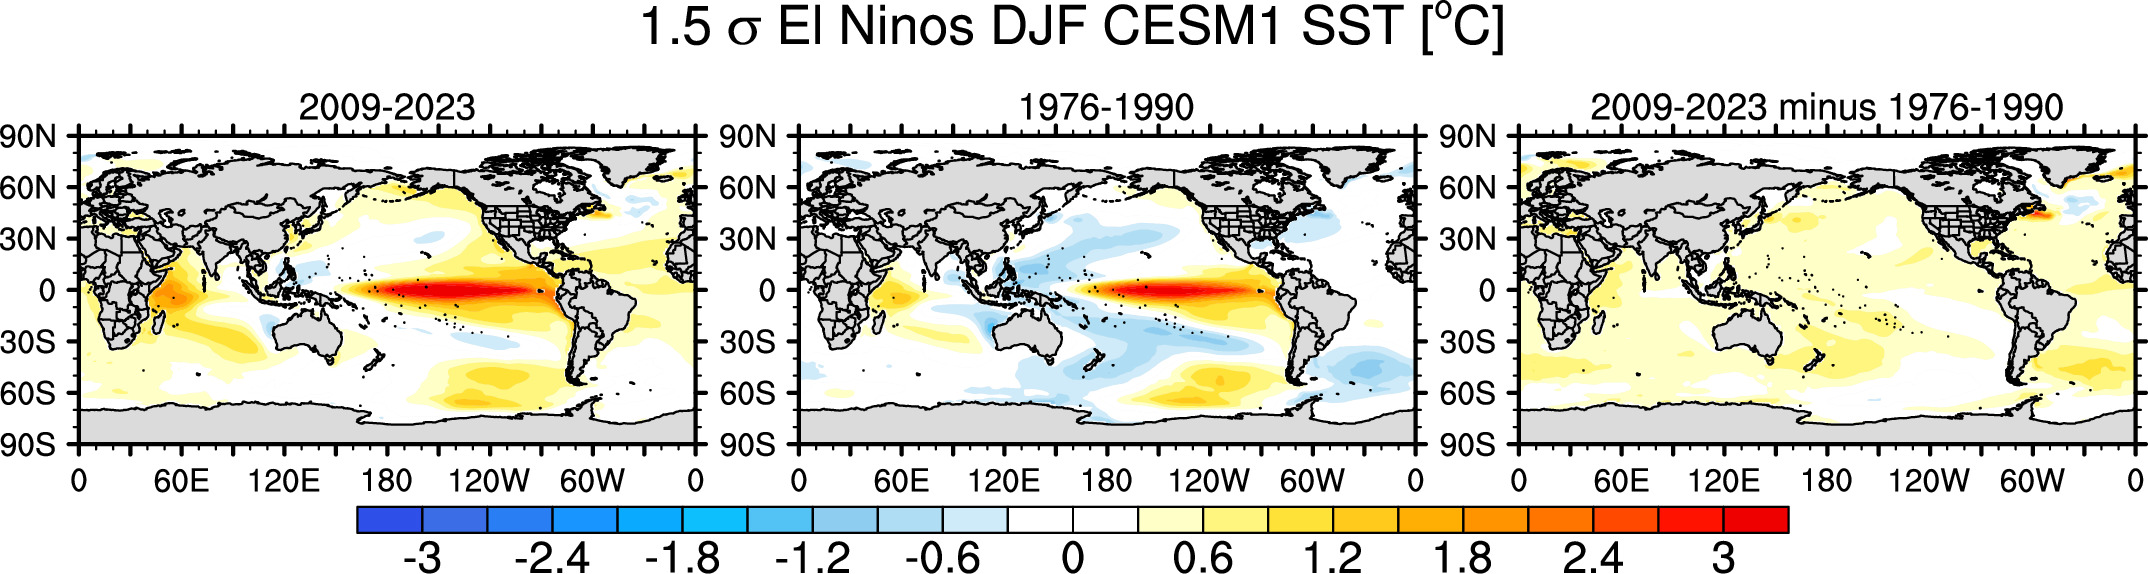
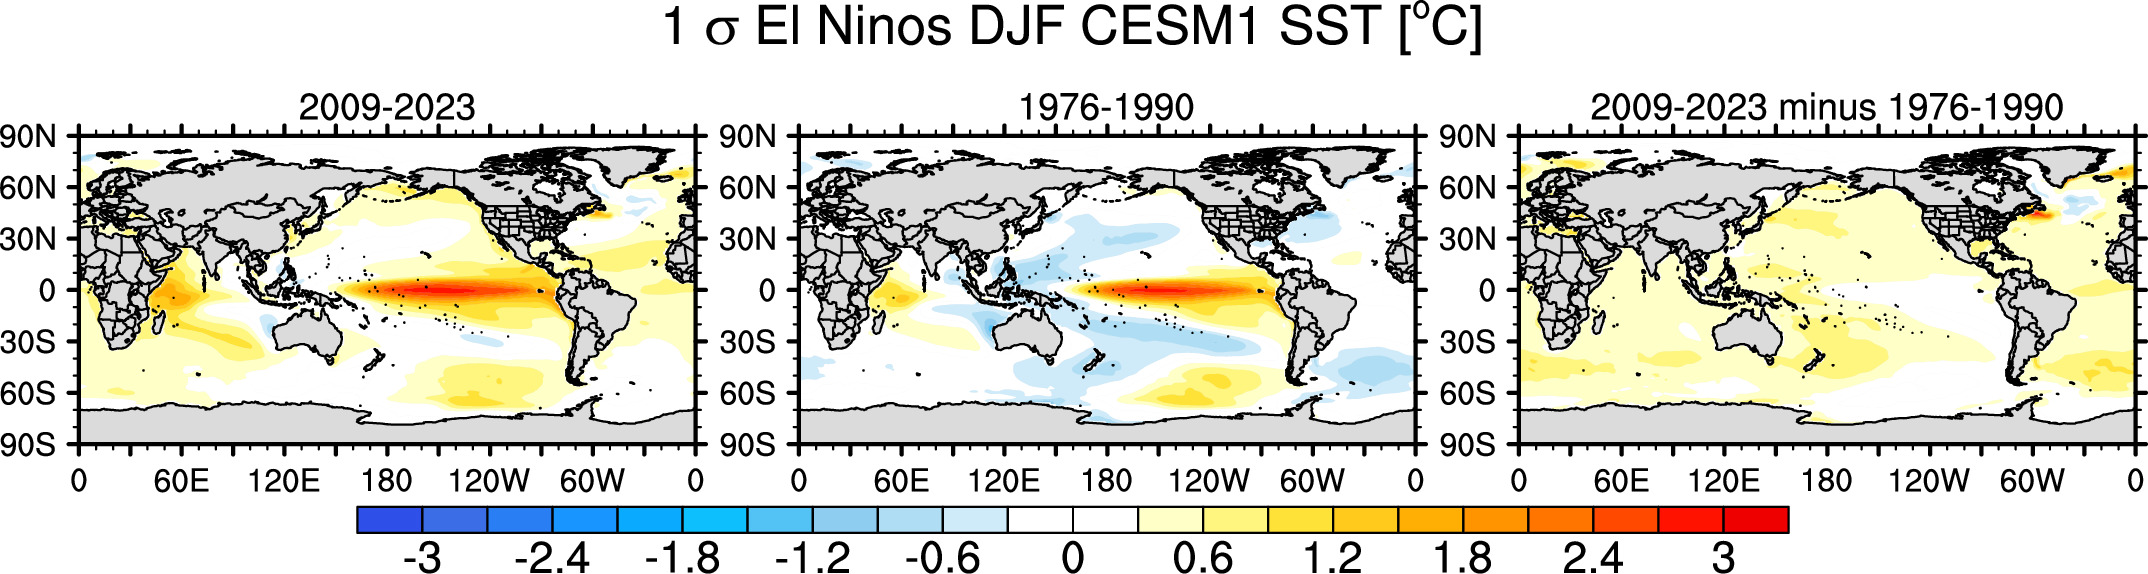
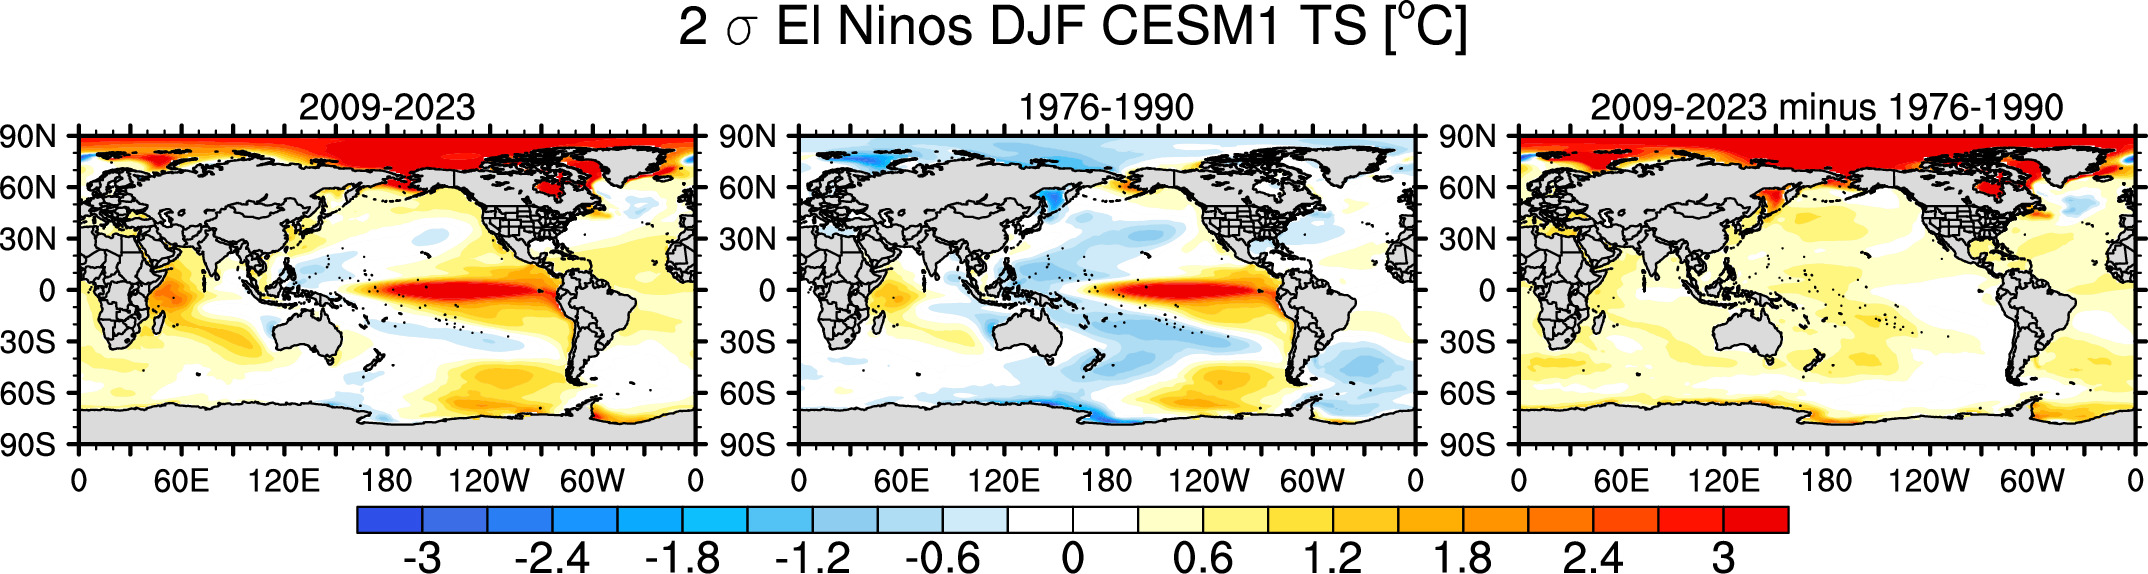
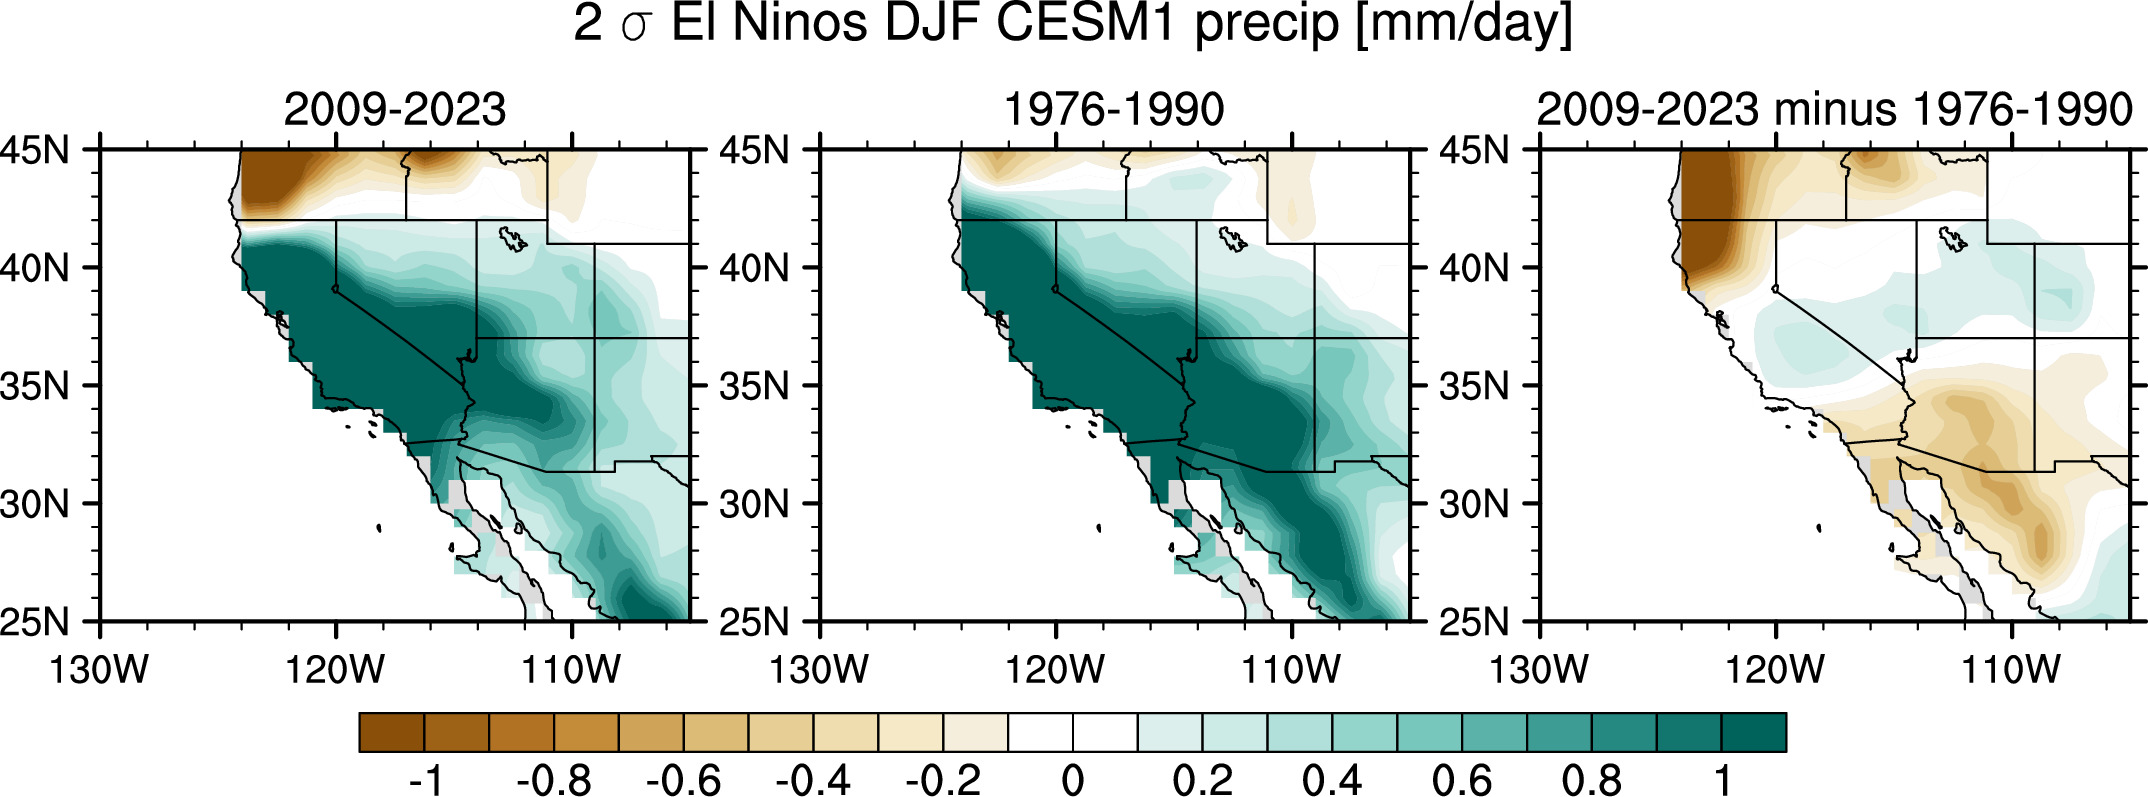
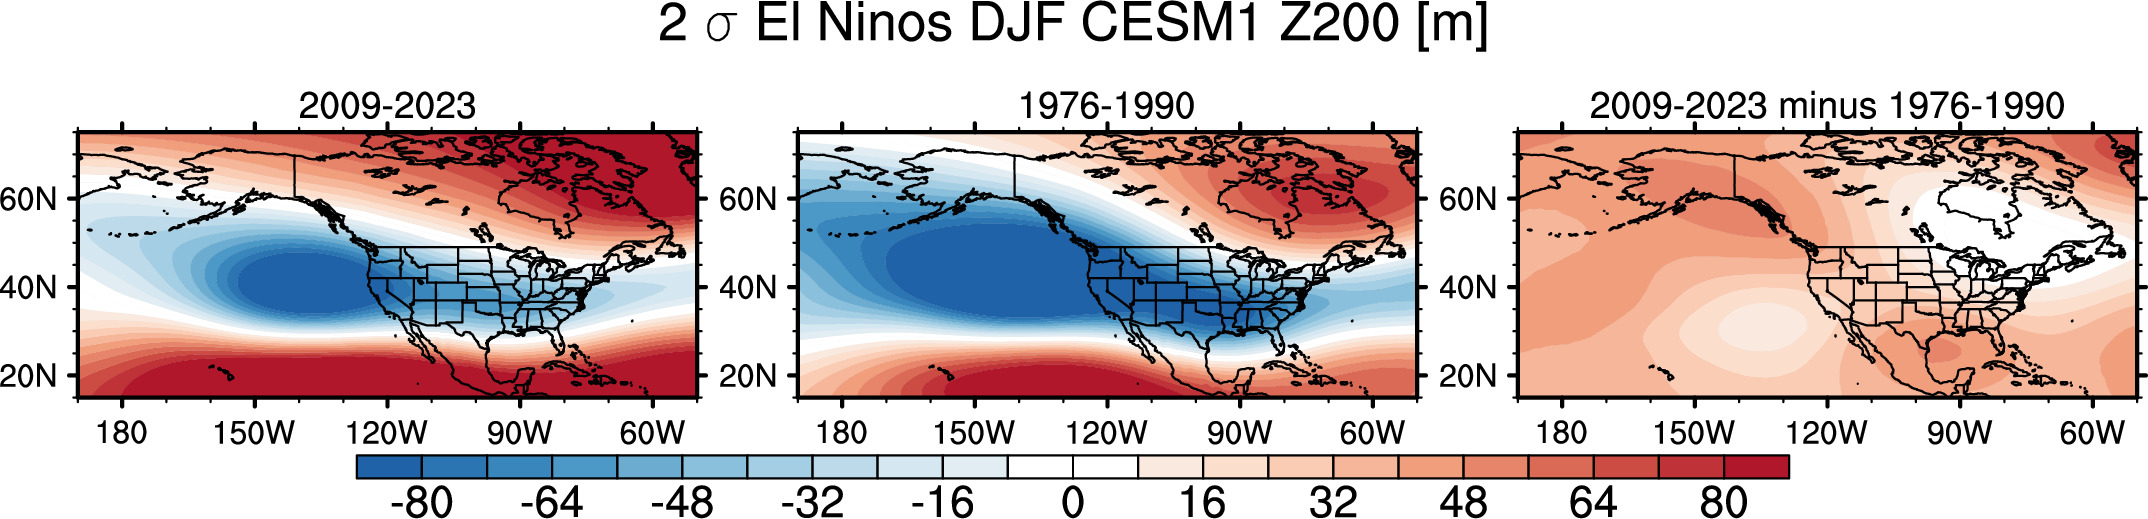
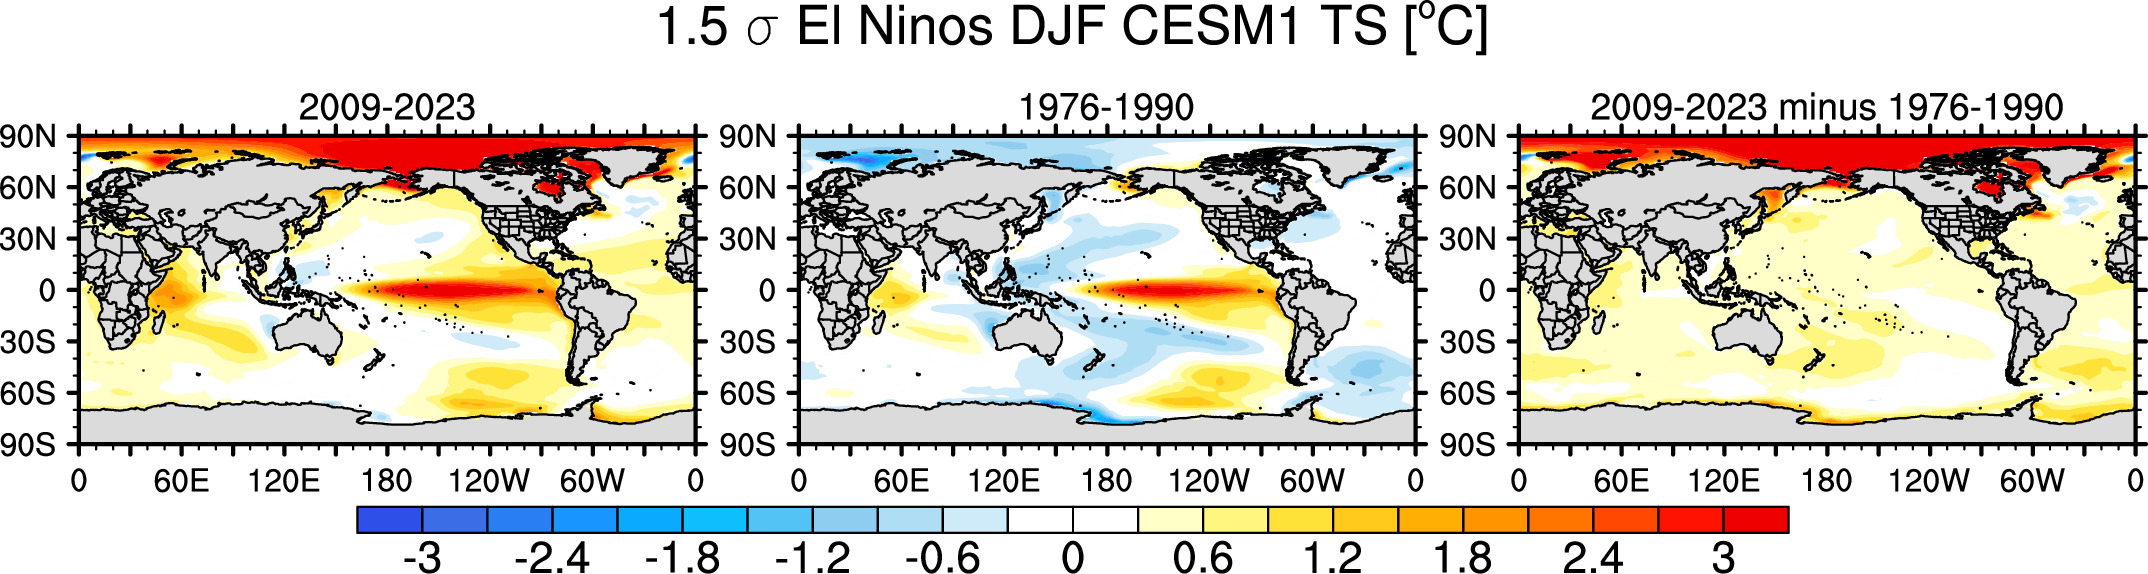
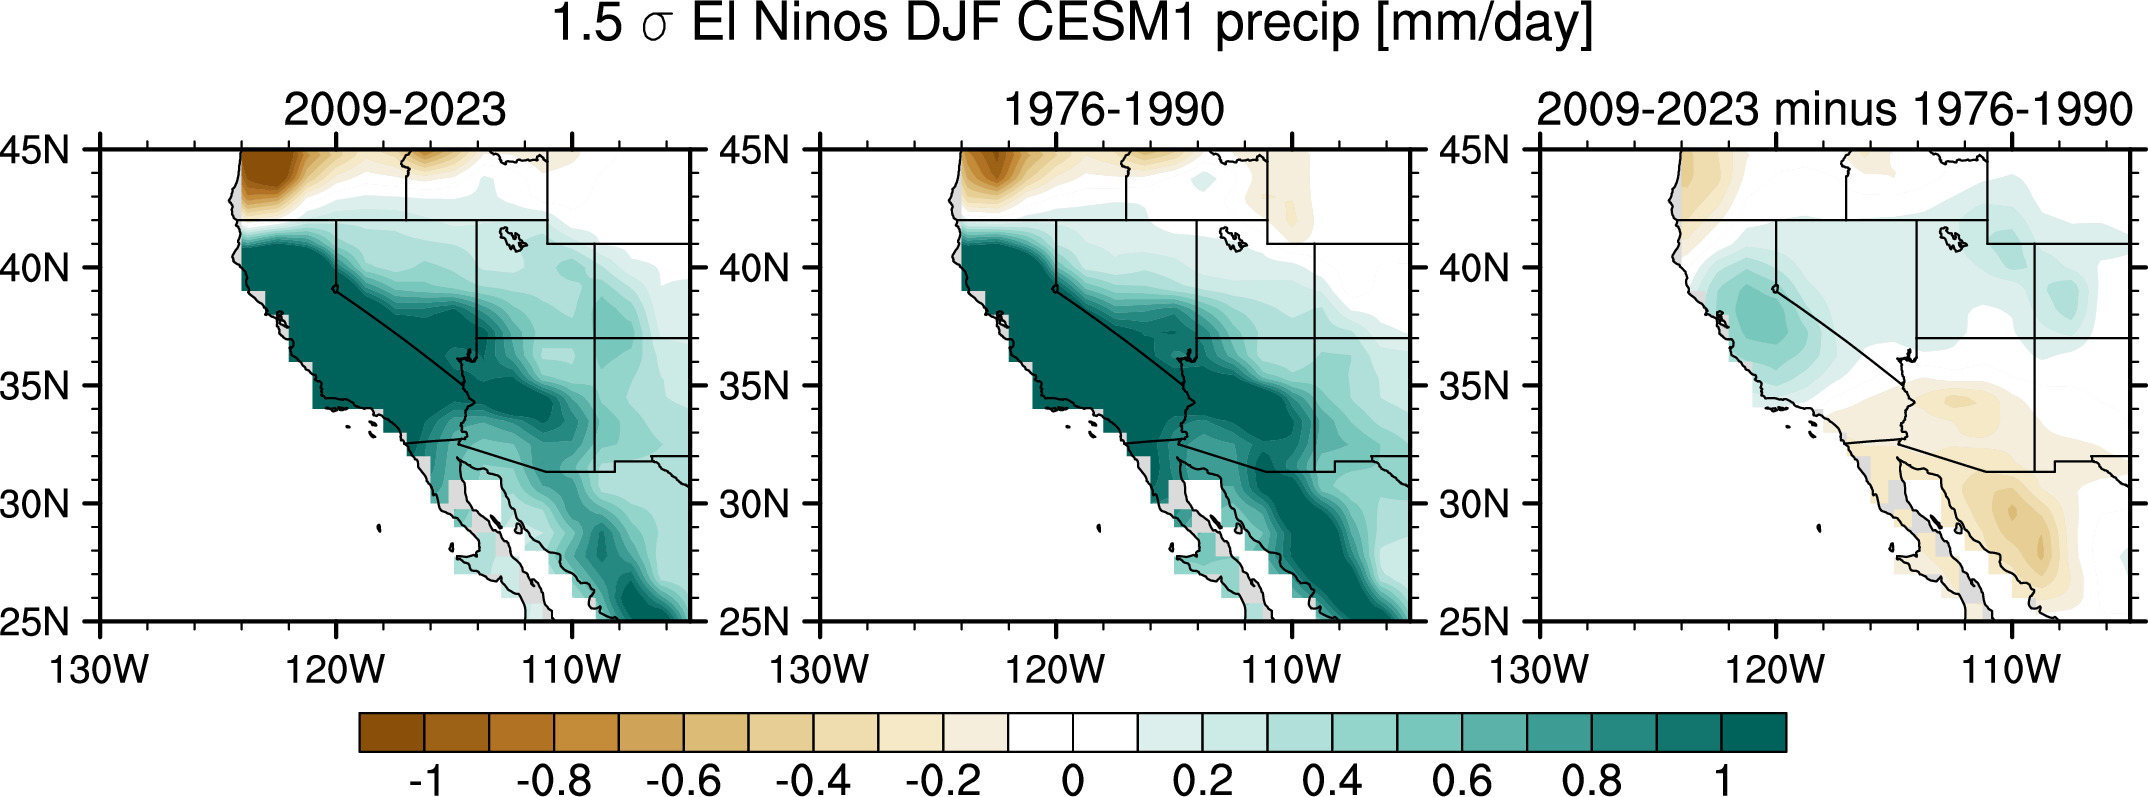
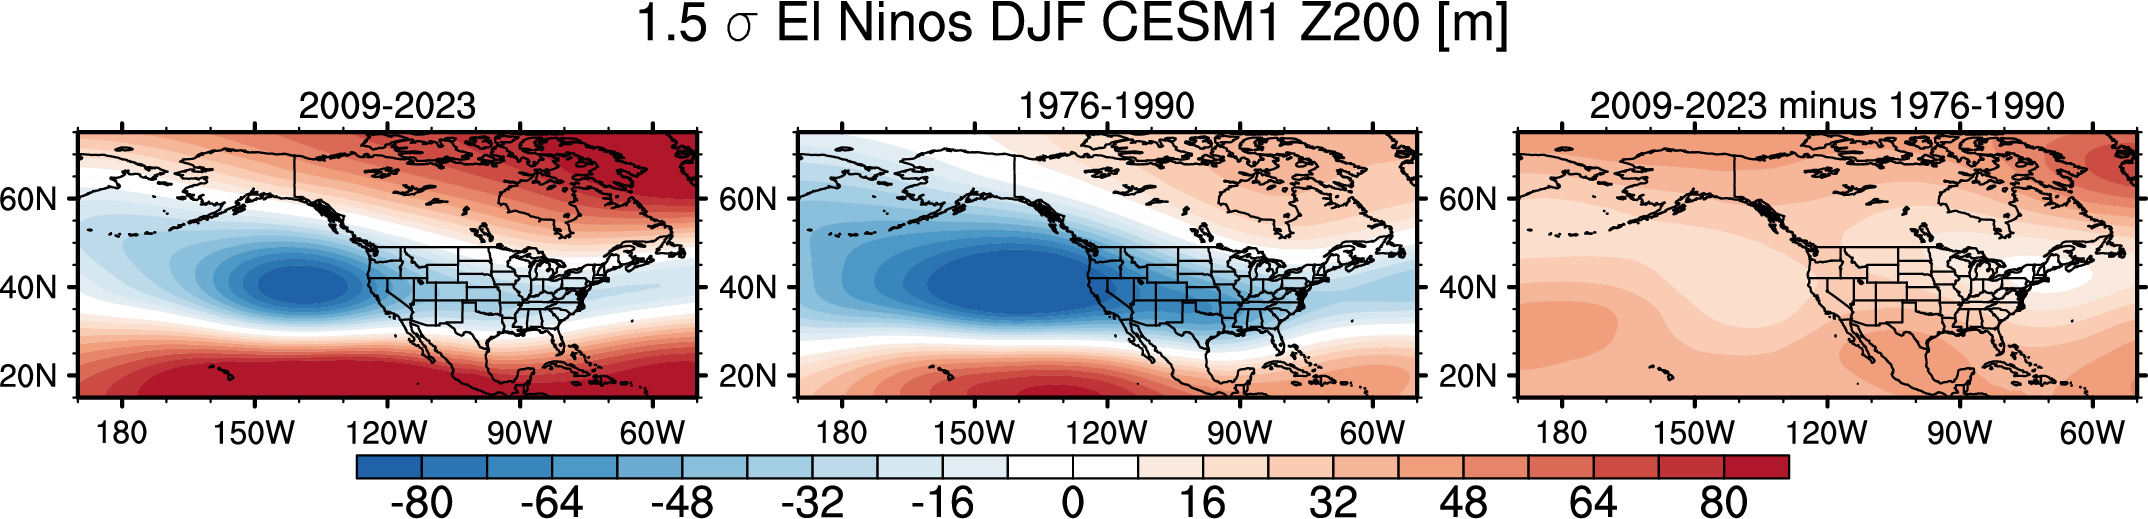
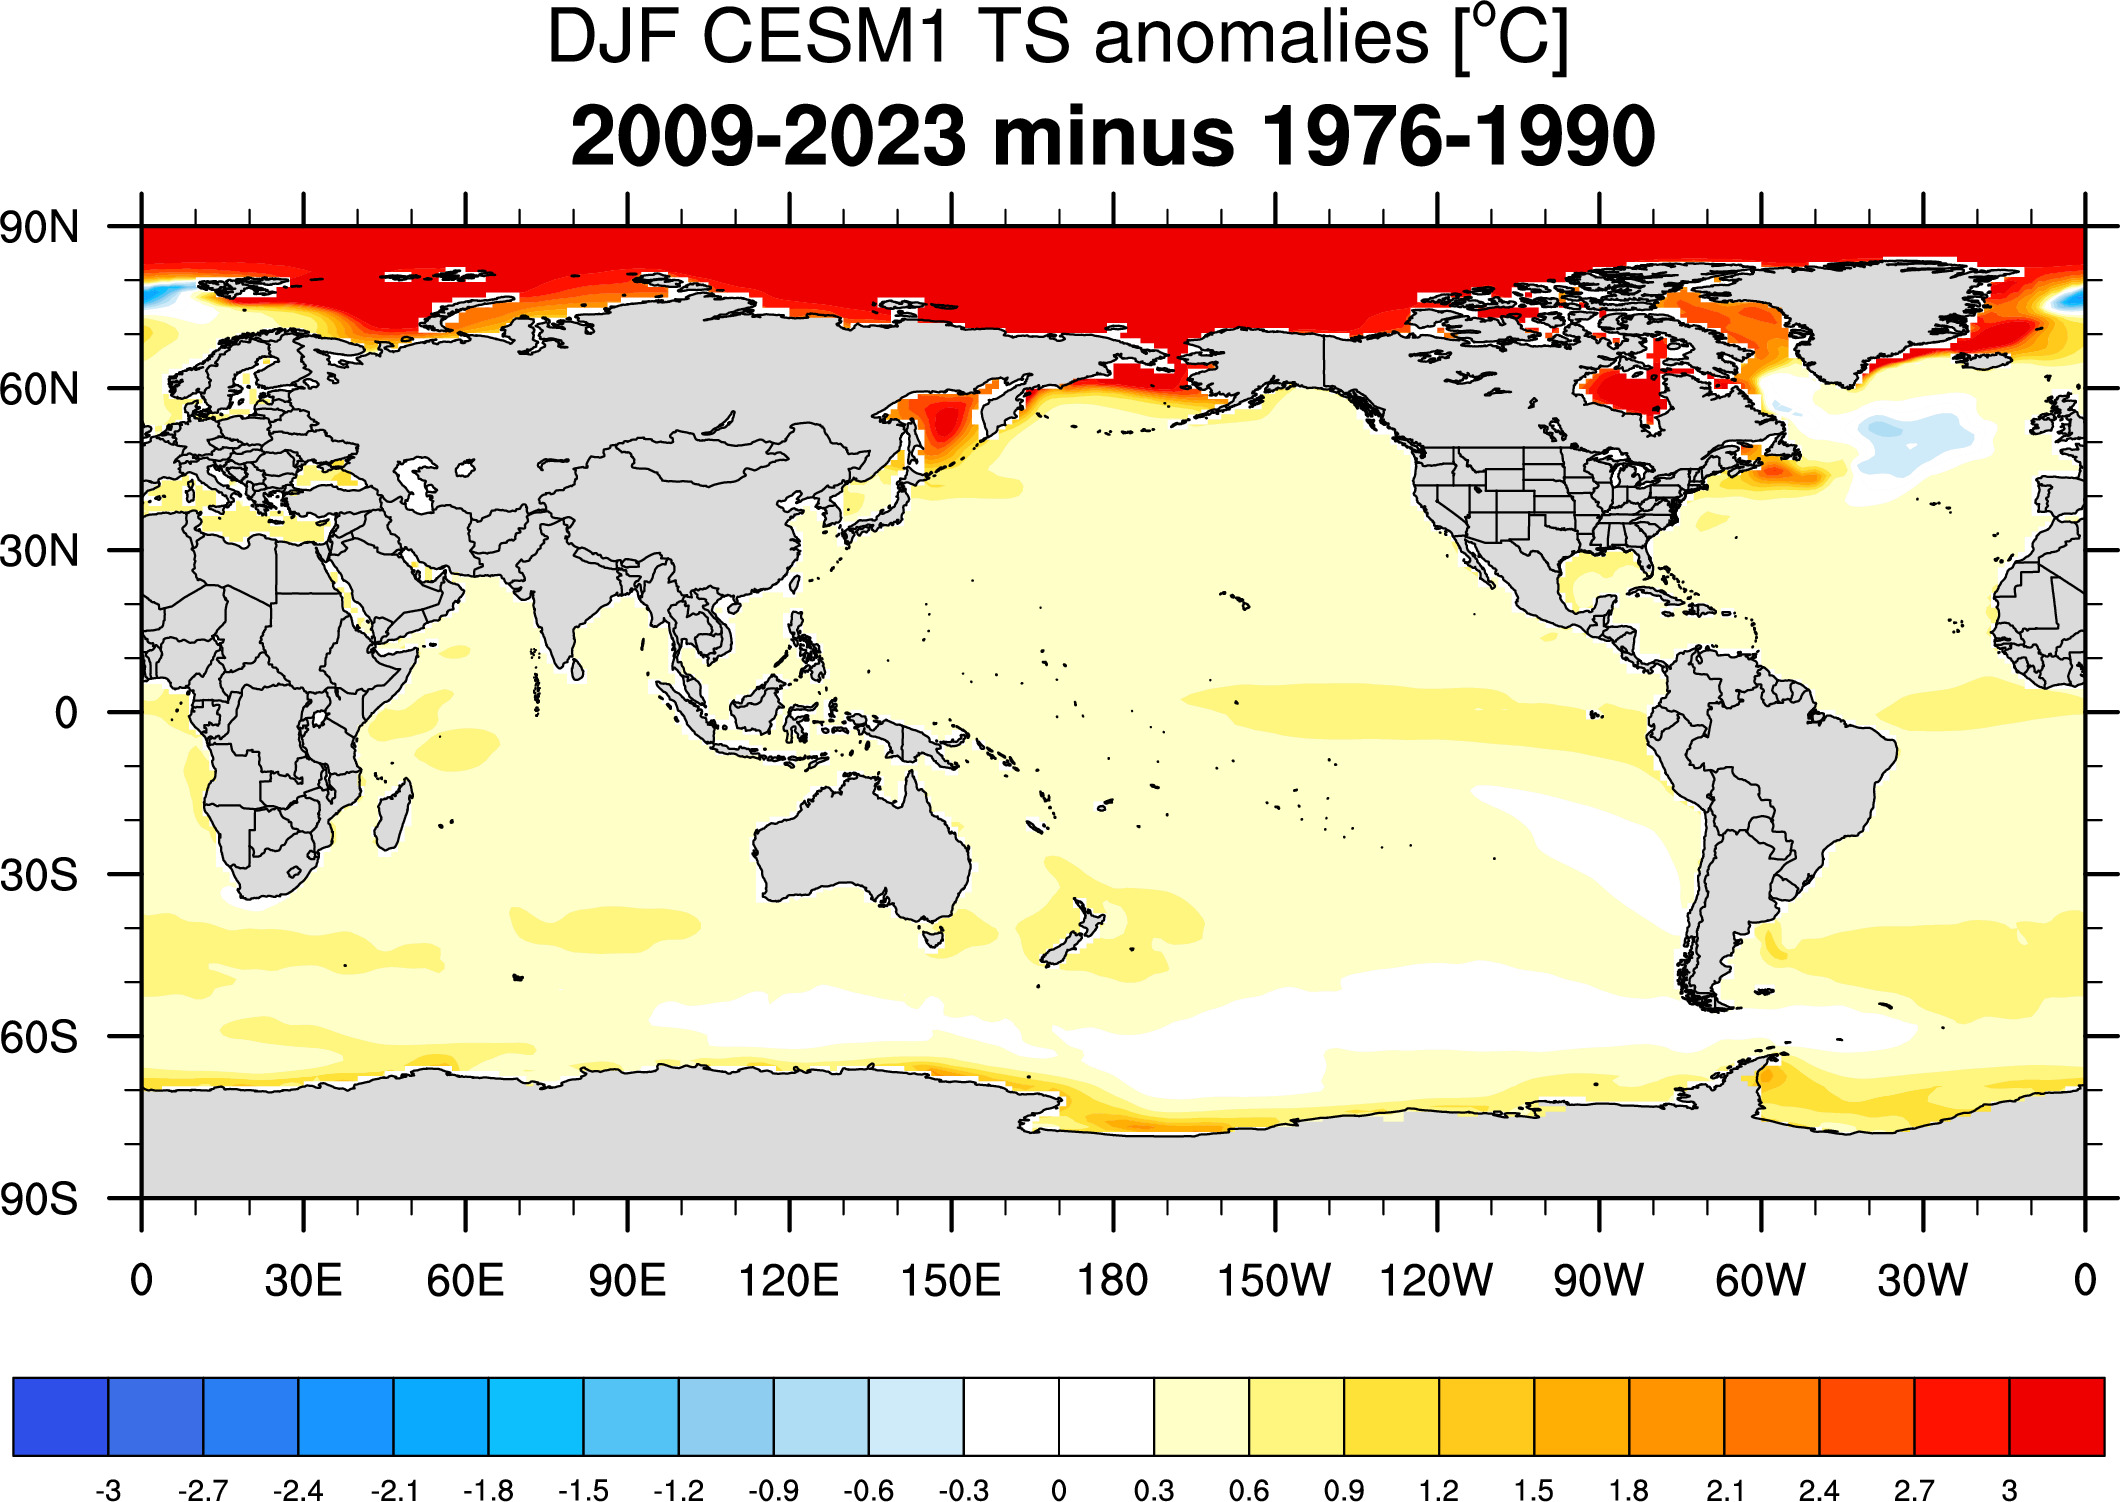
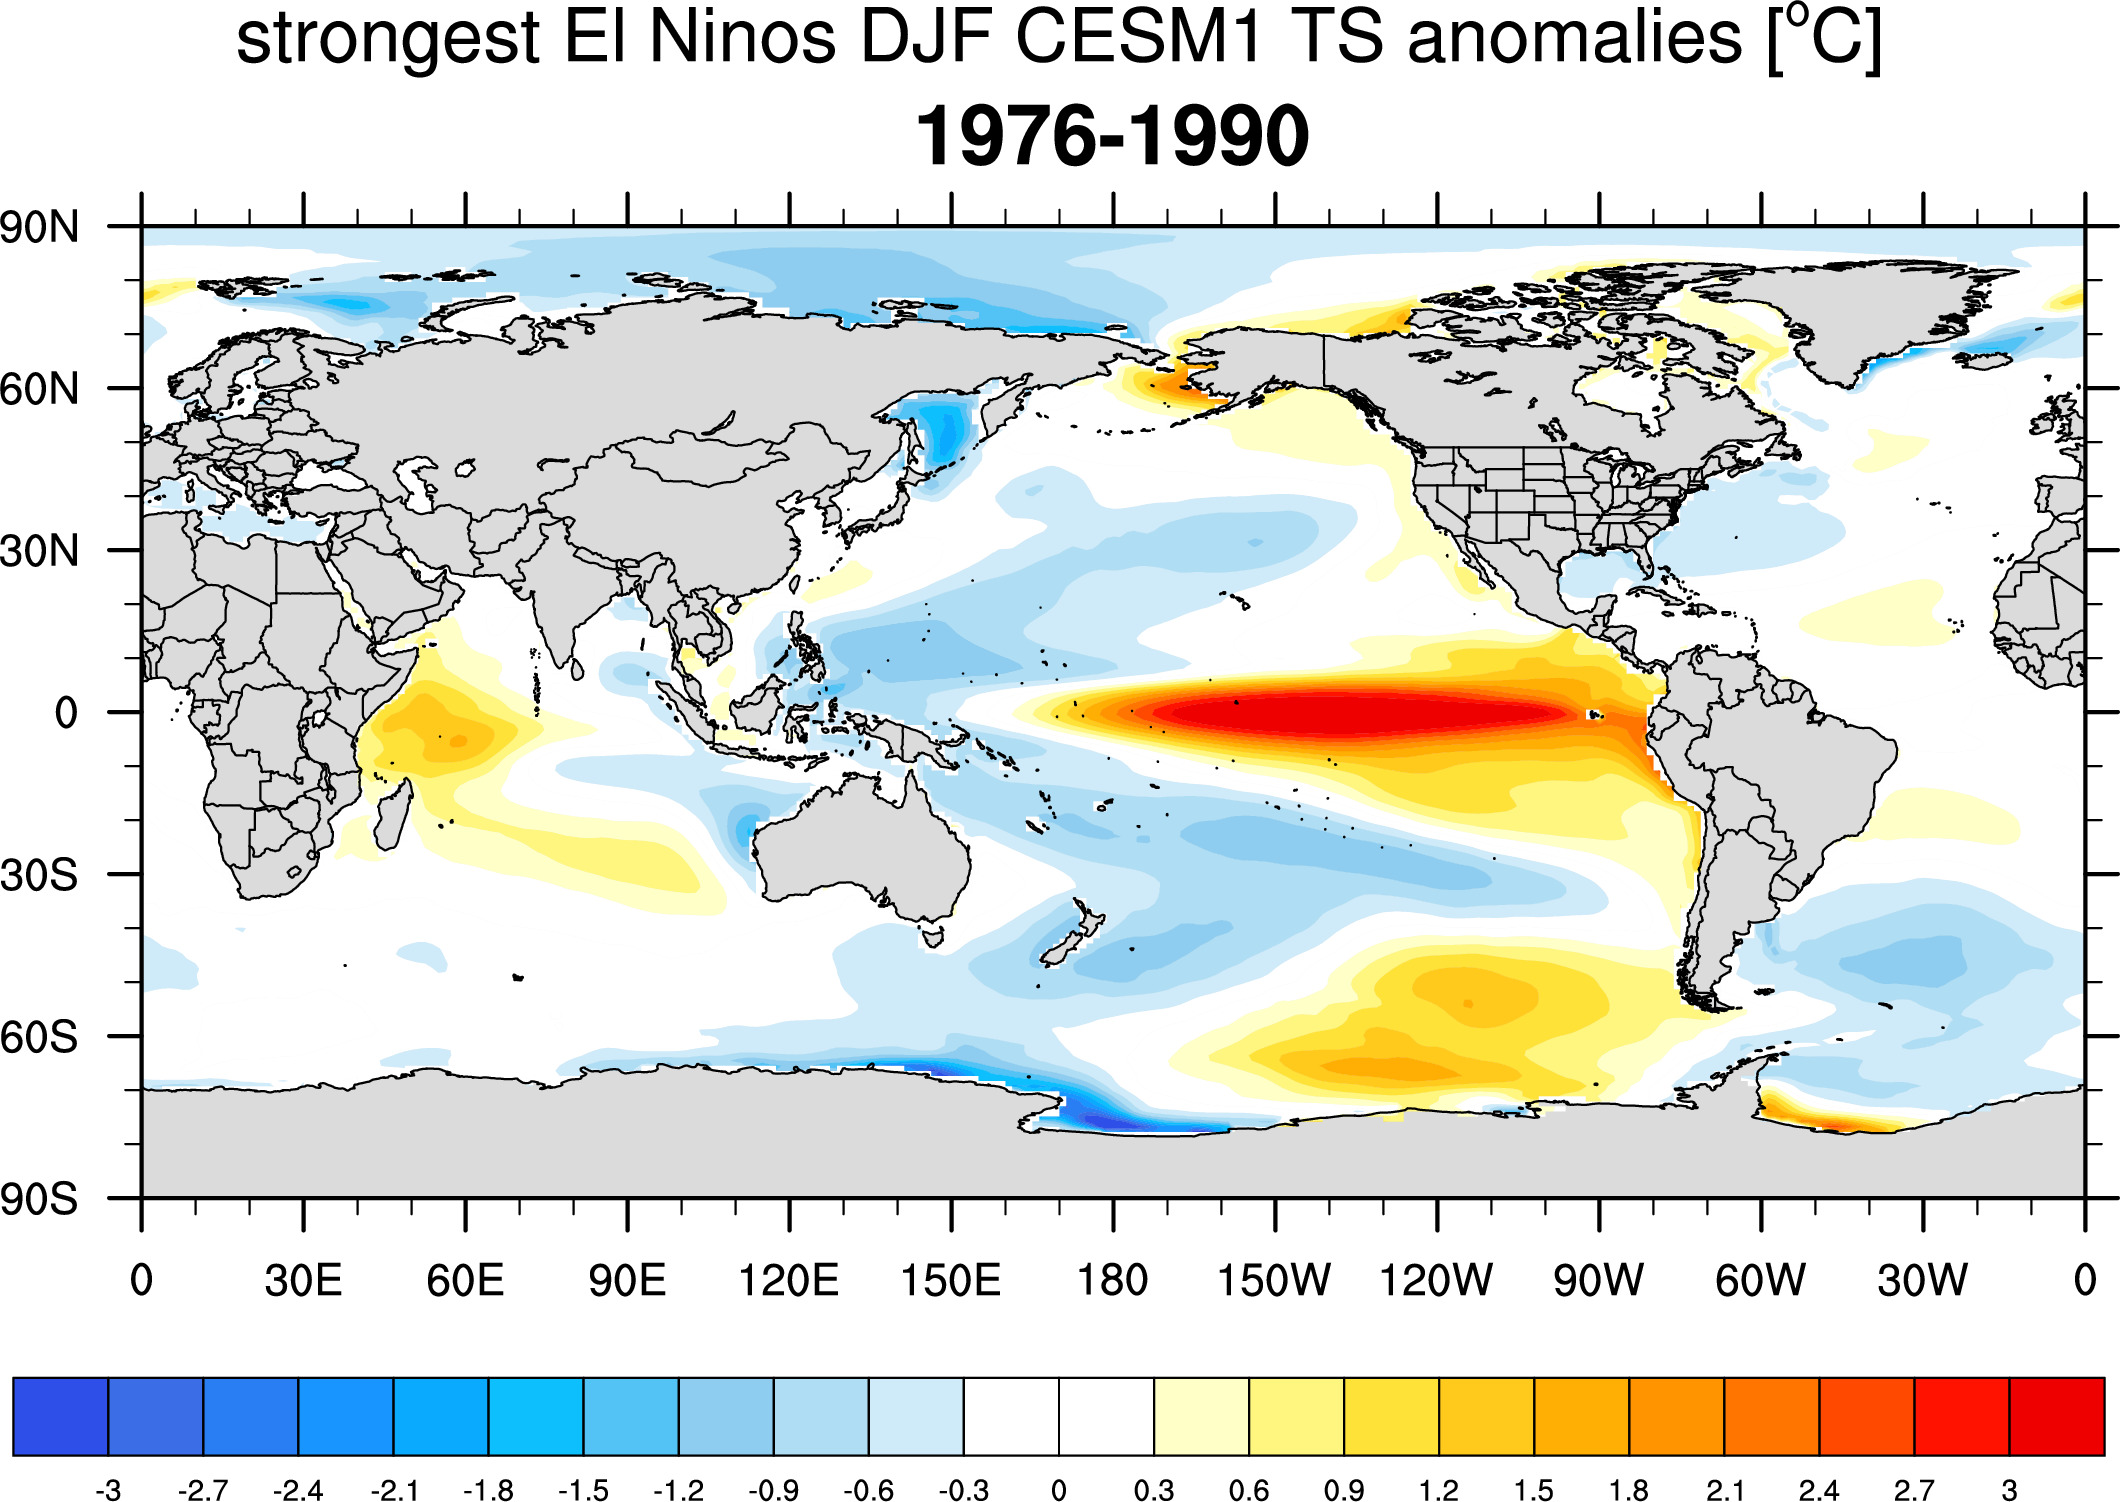
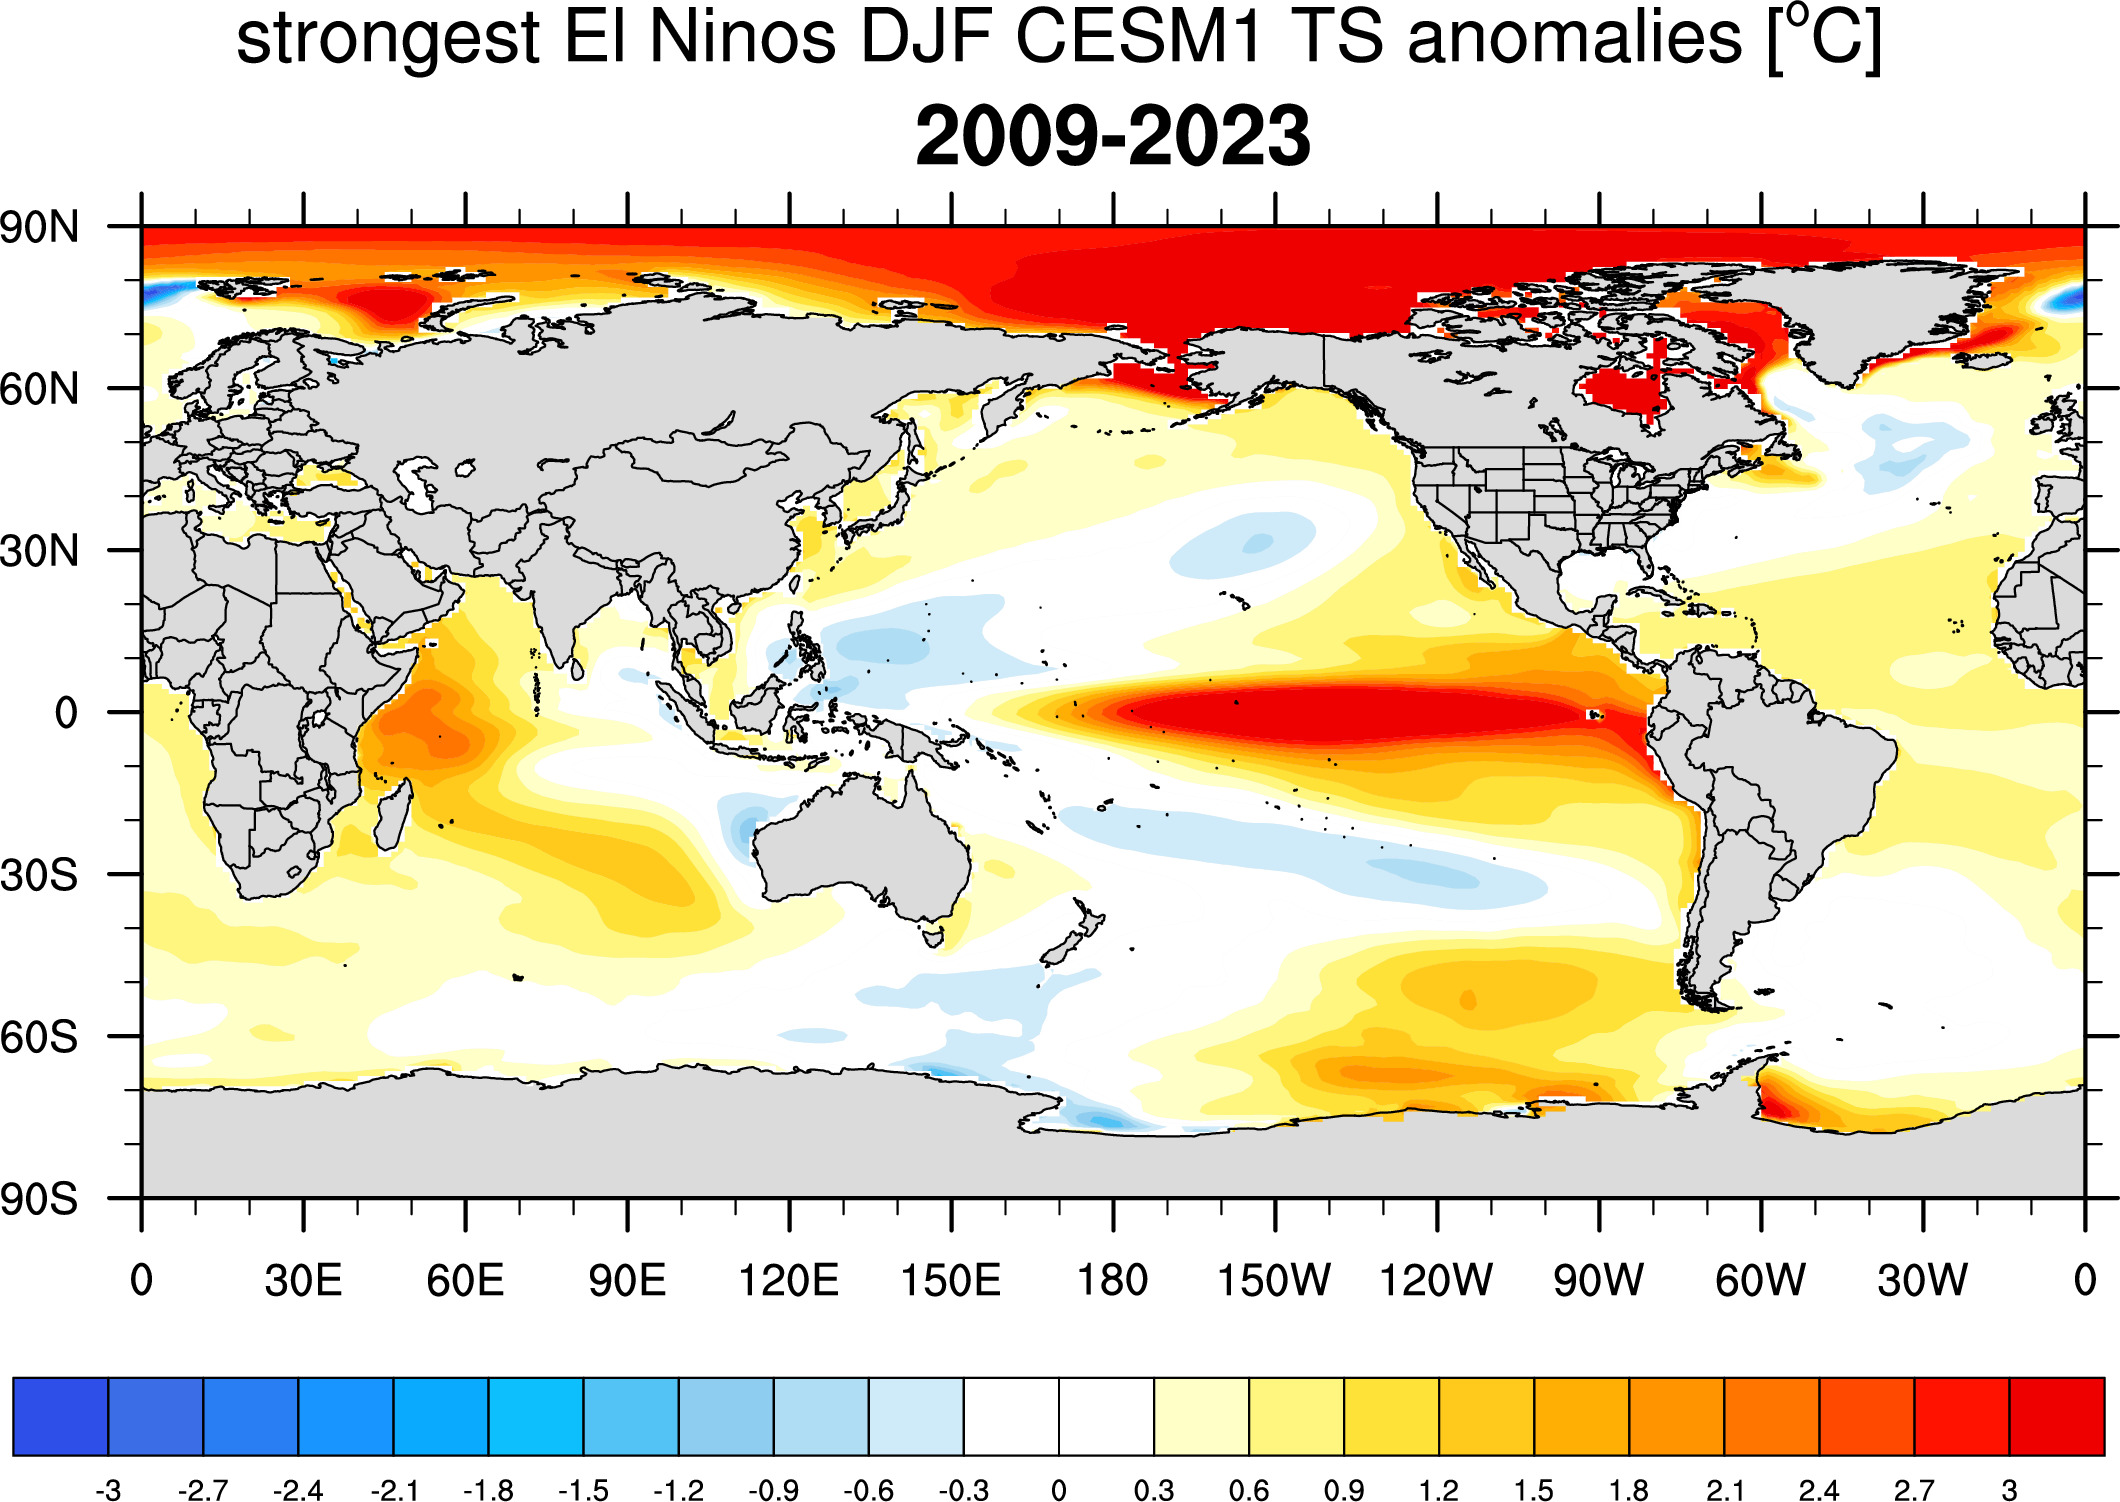
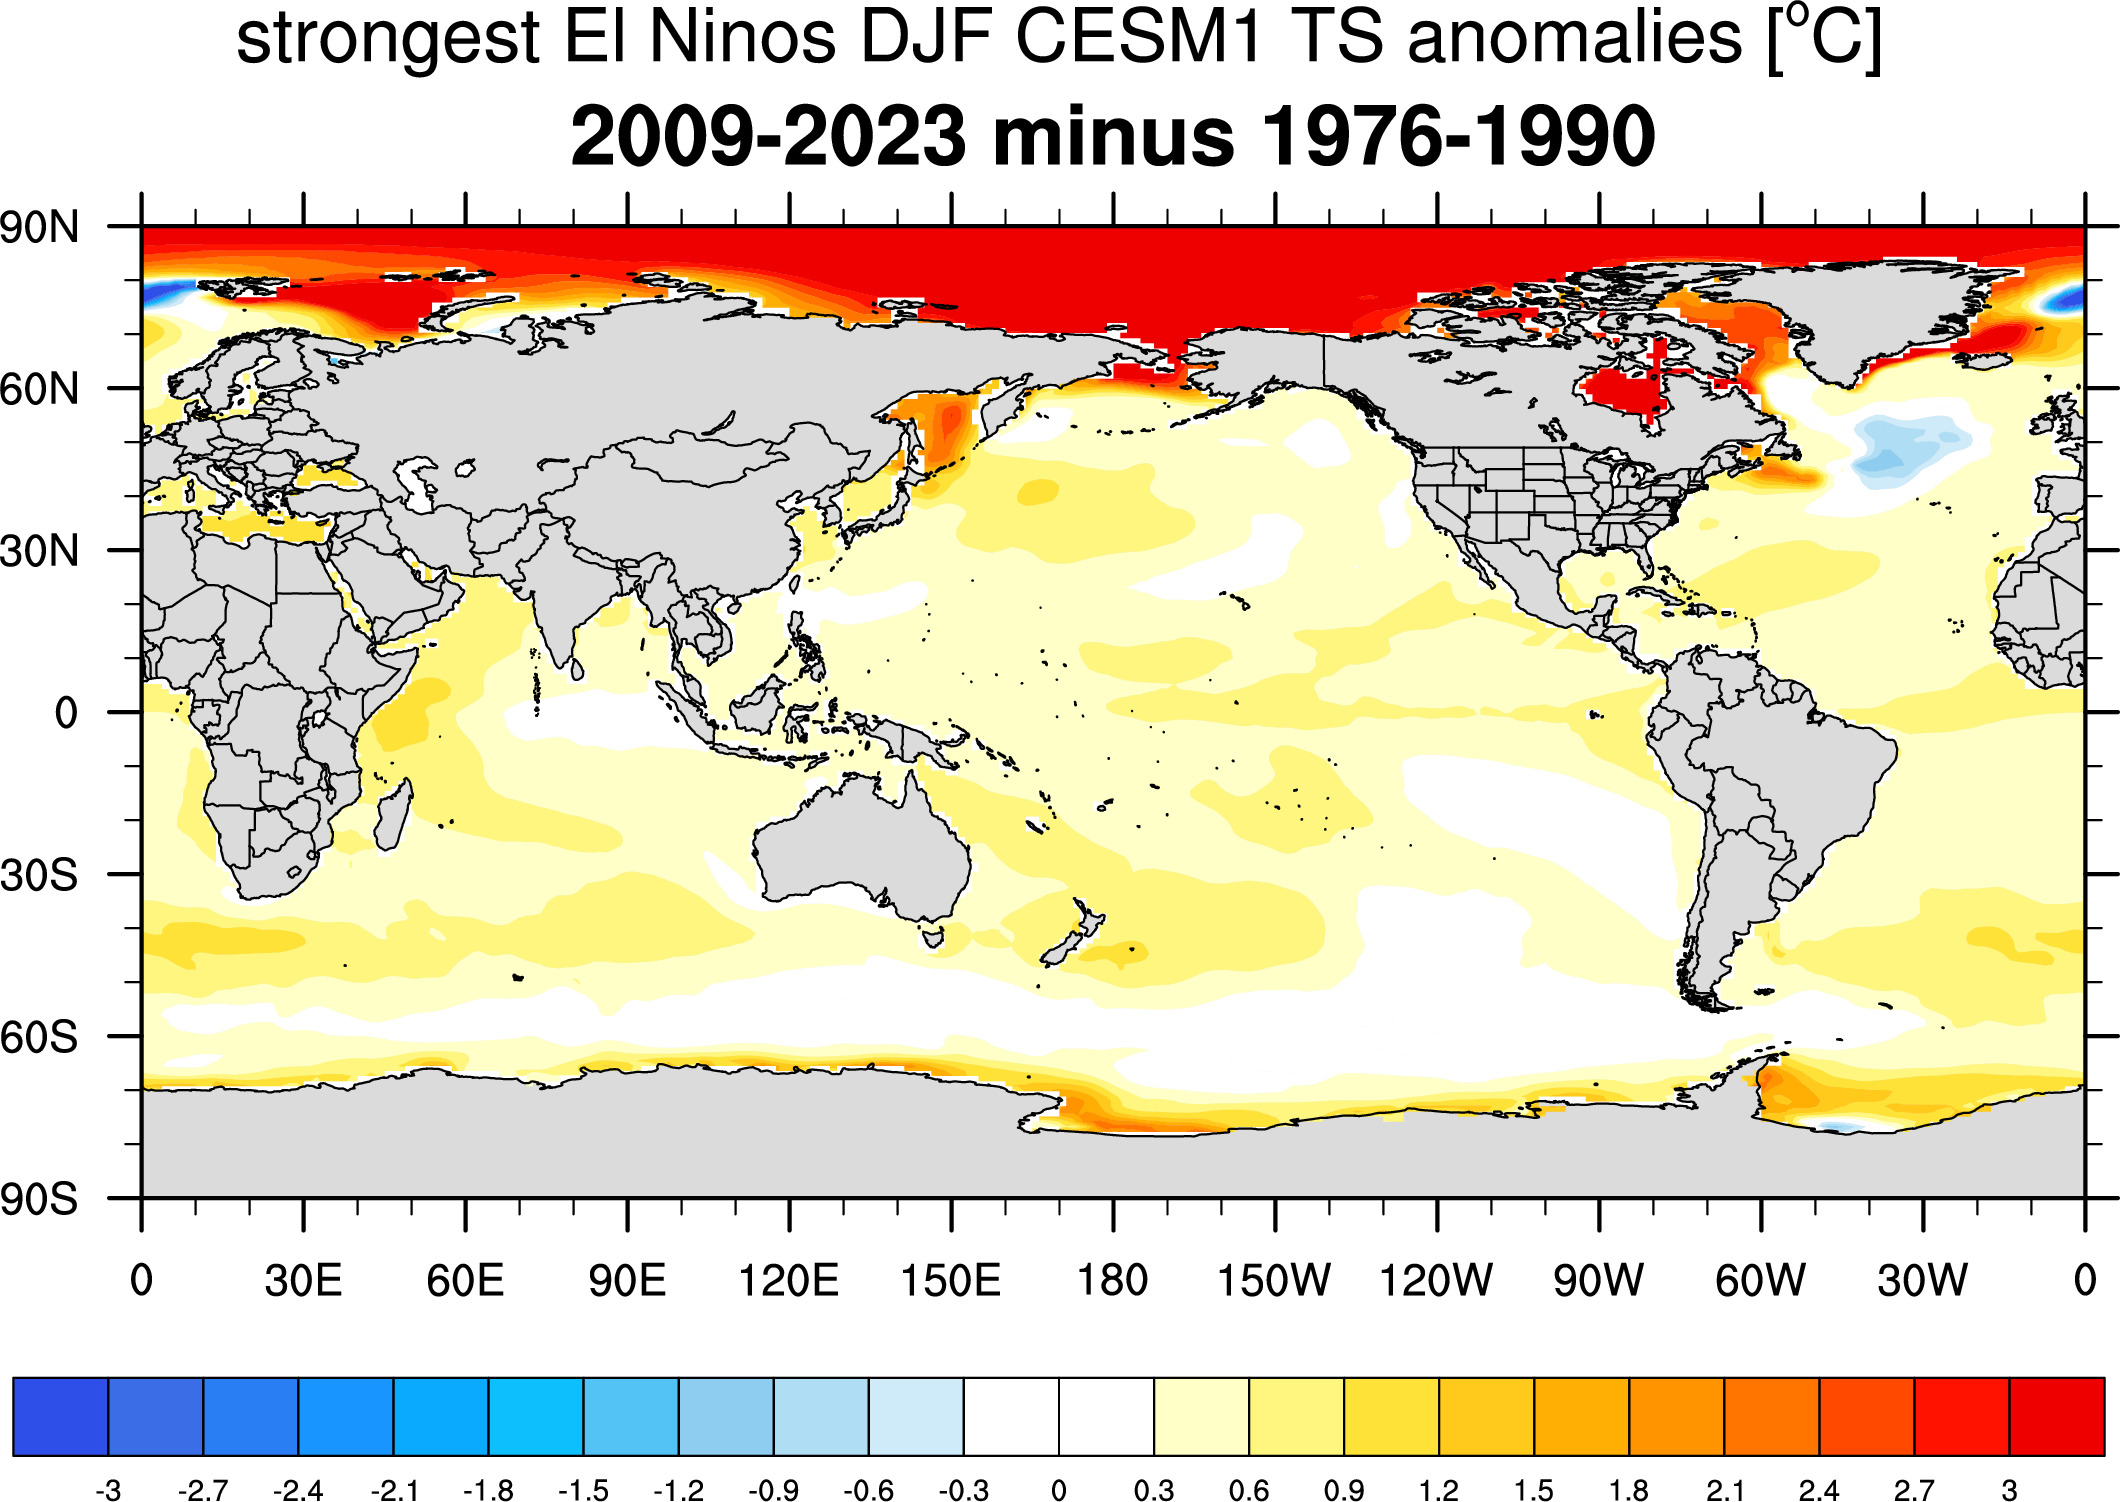
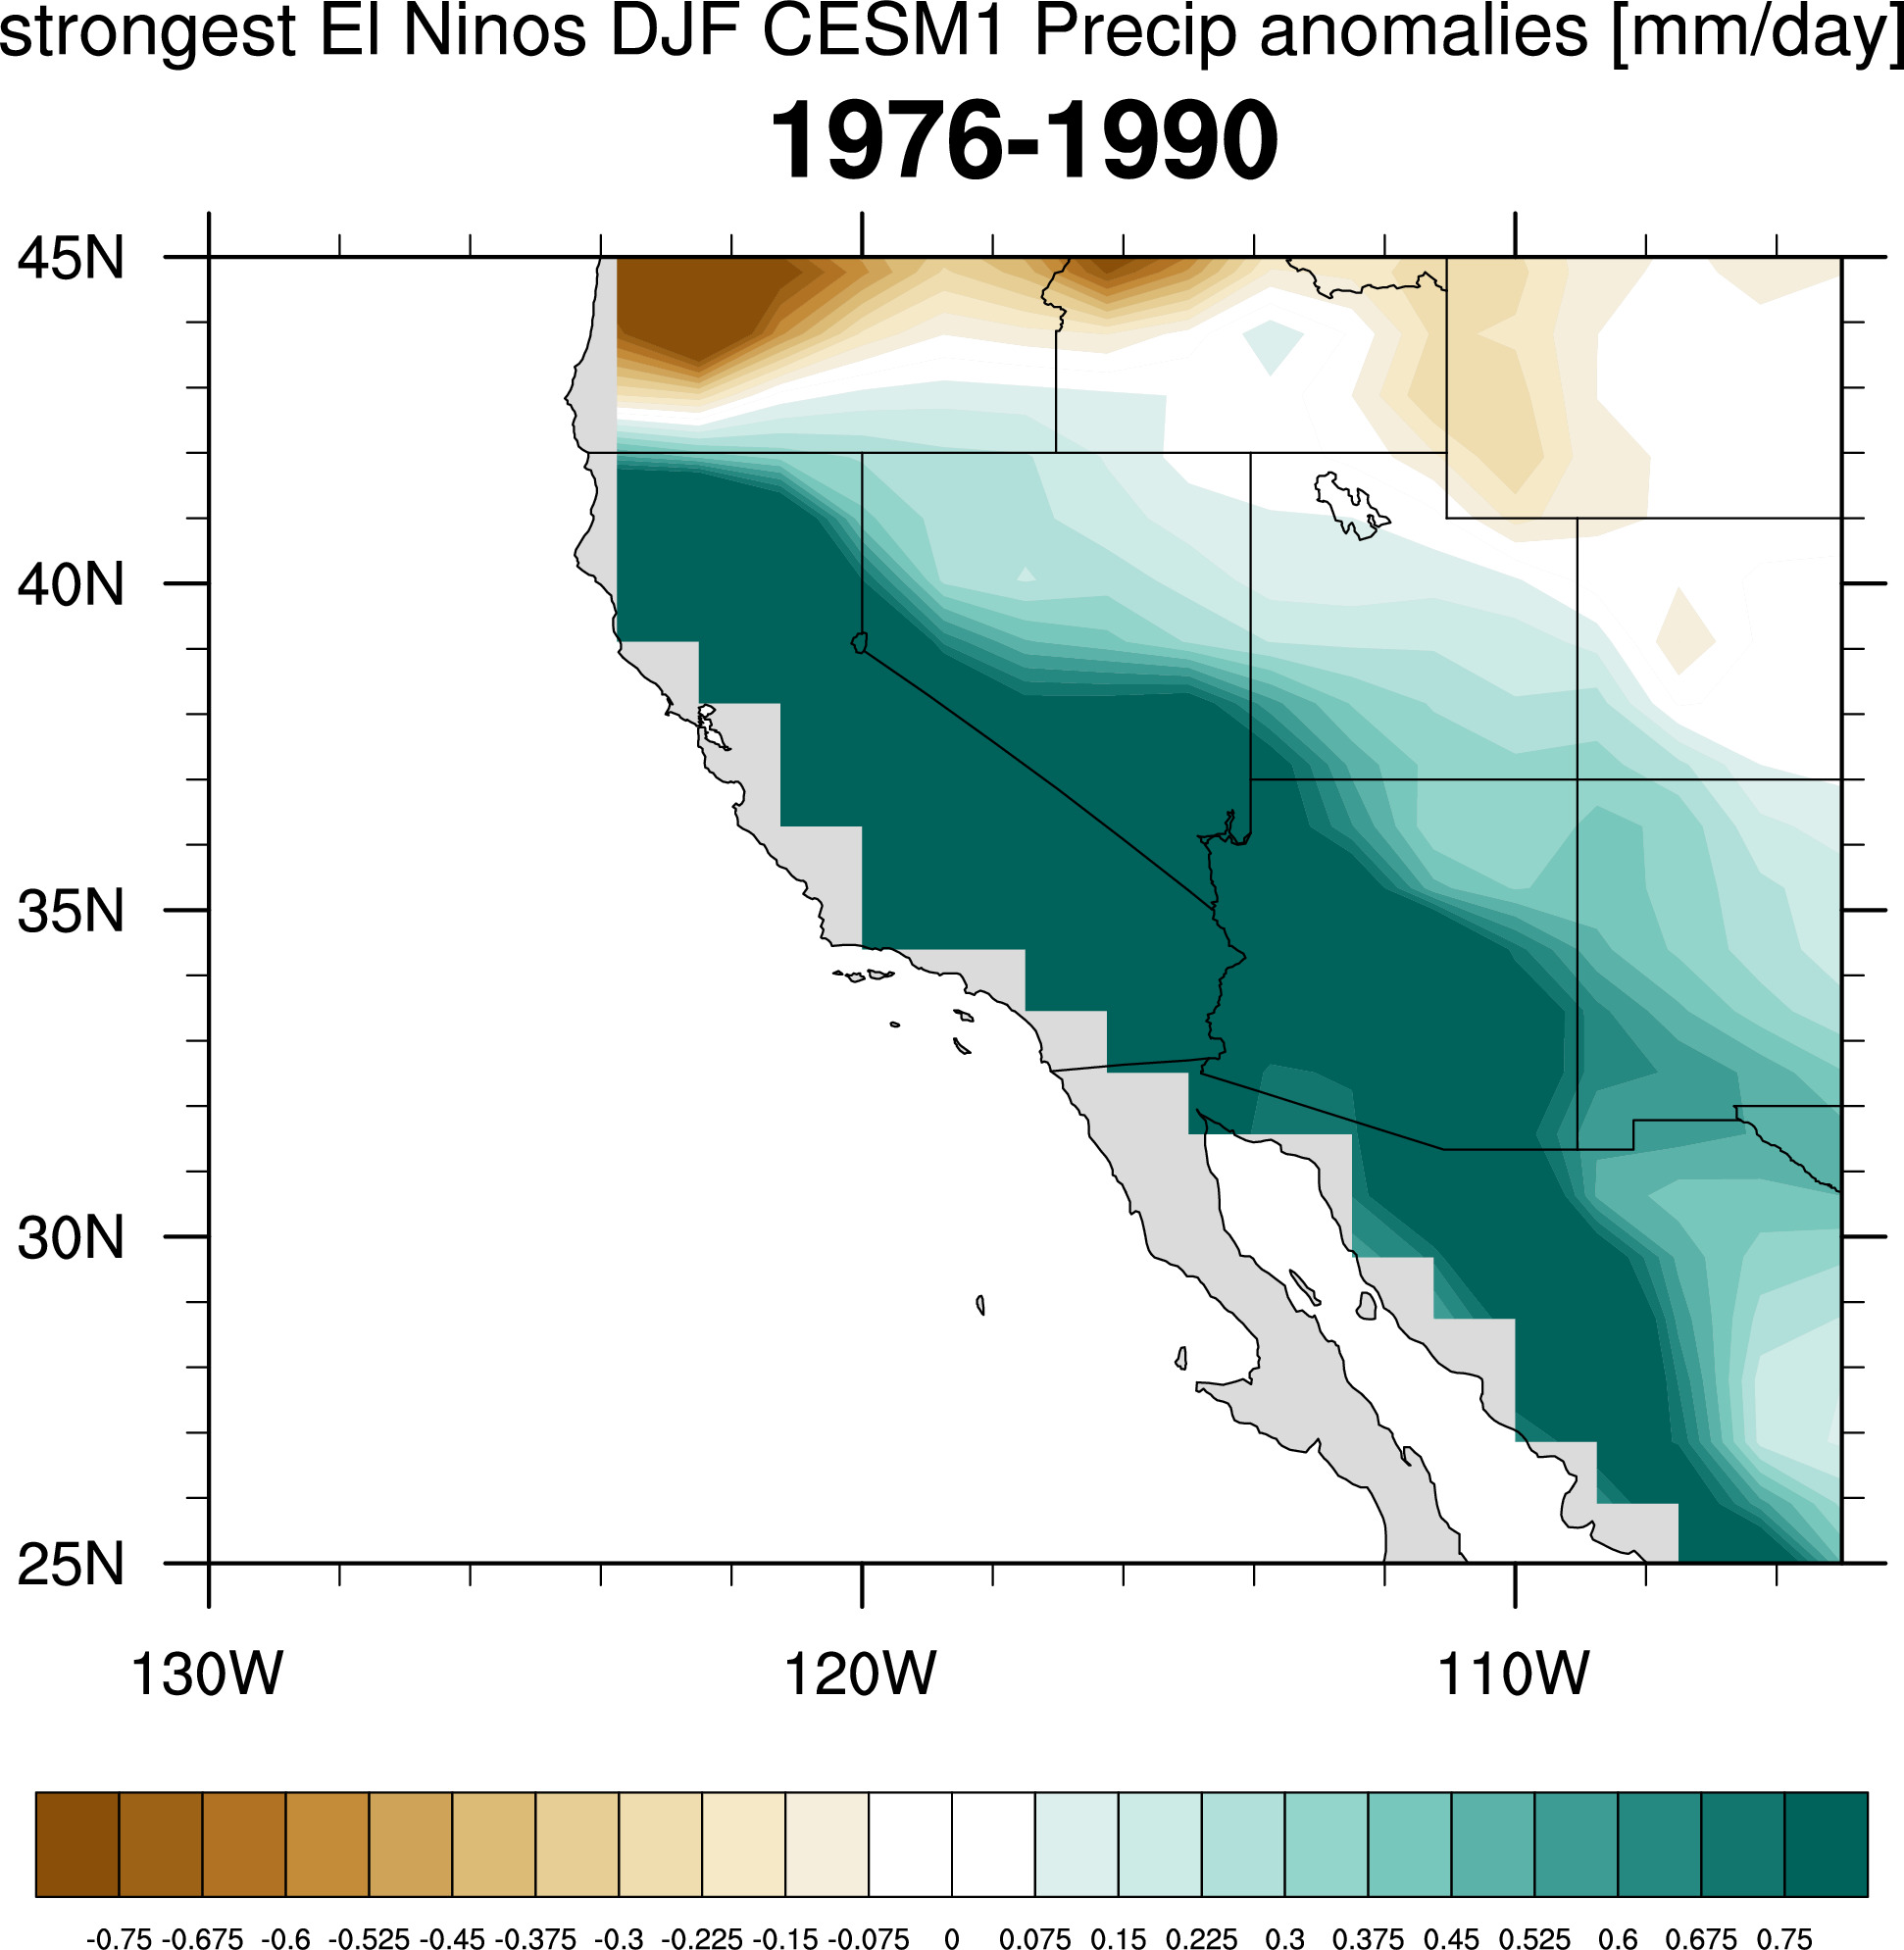
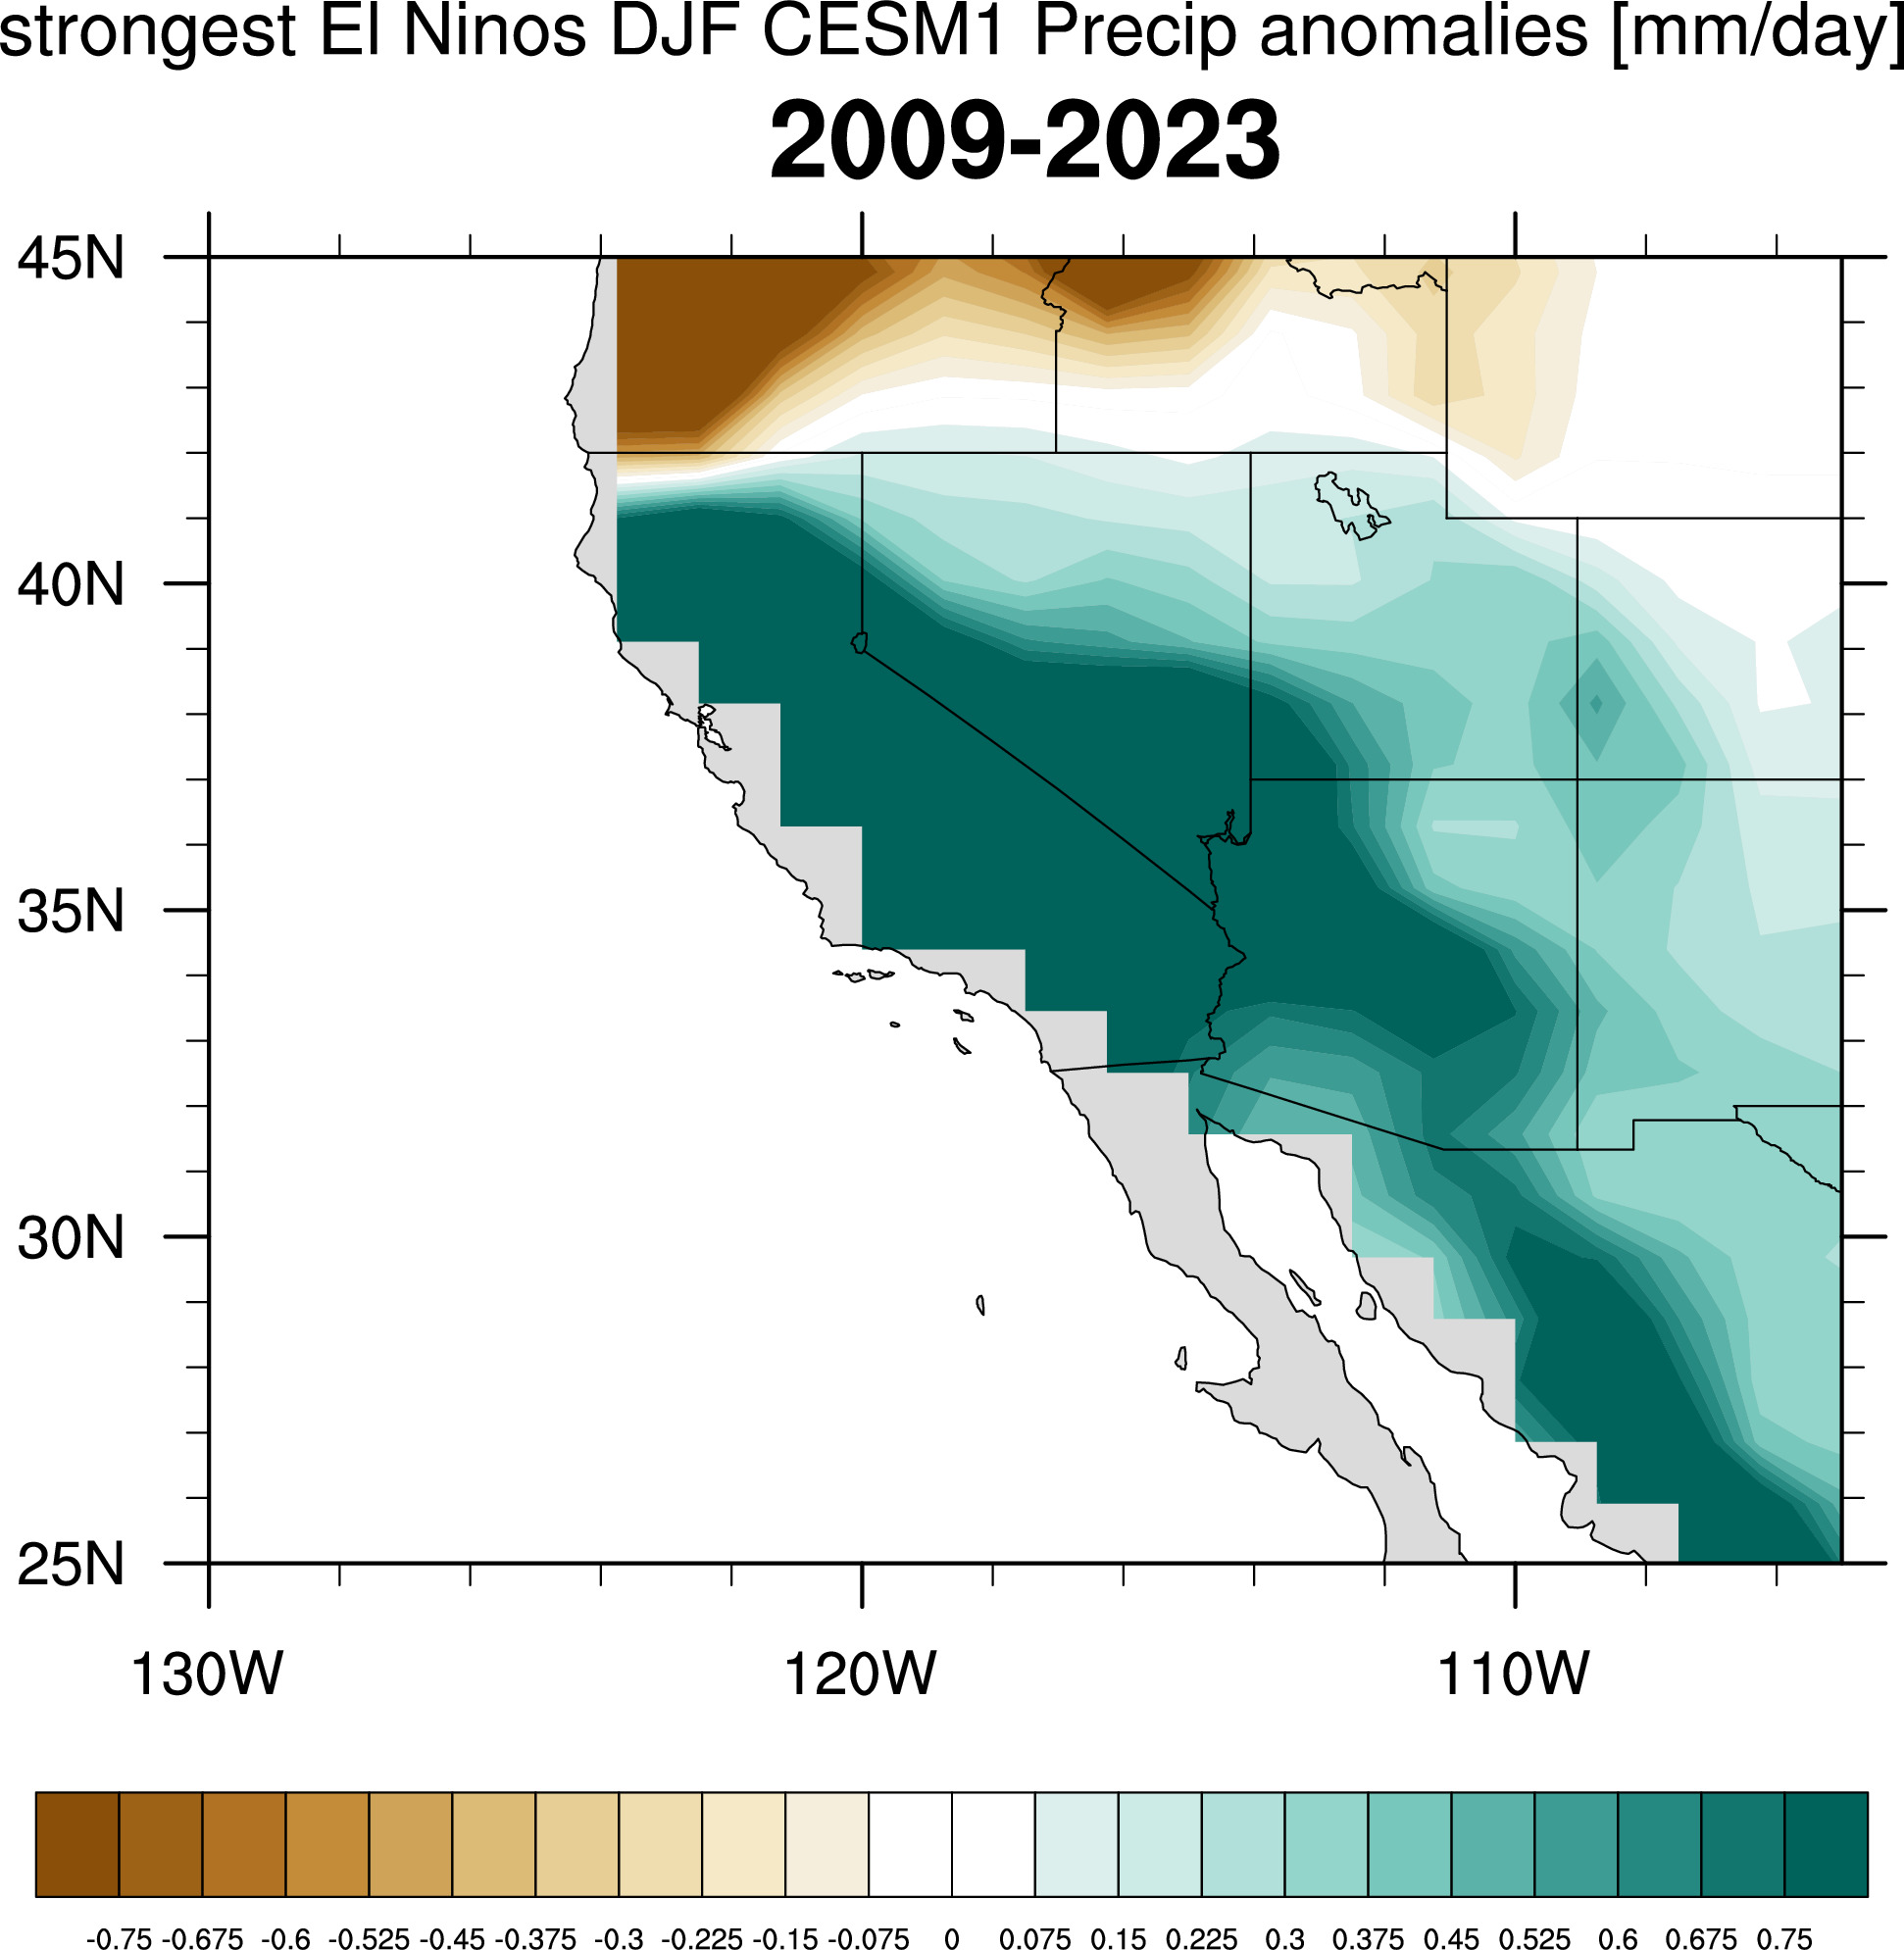
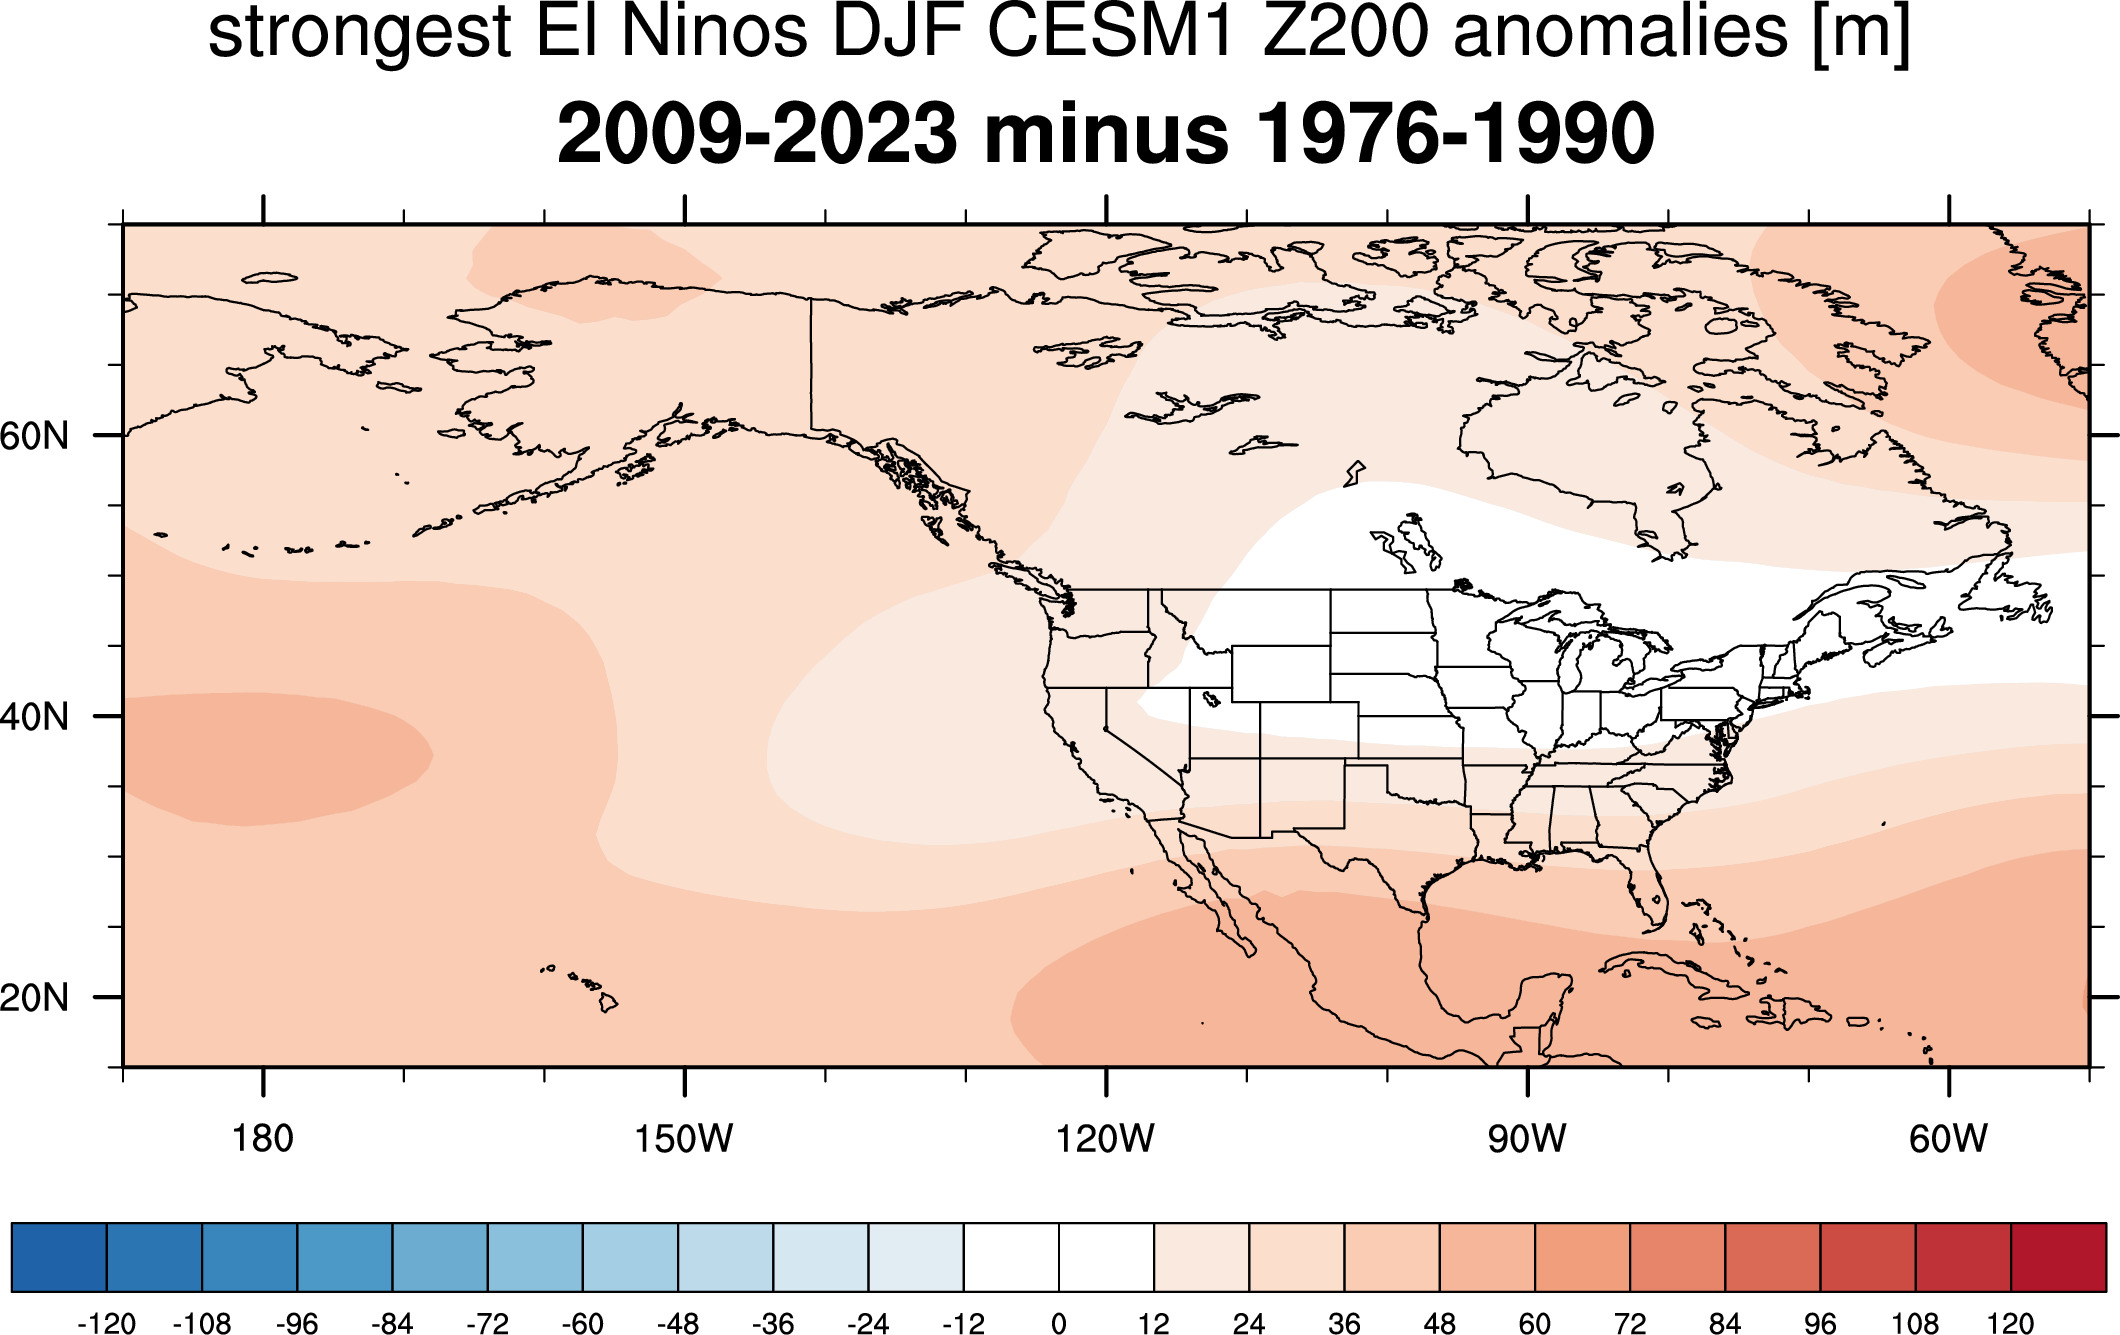
Are El Nino teleconnections changing?
Older plots on this topic here.
New
Standardized Nino indices
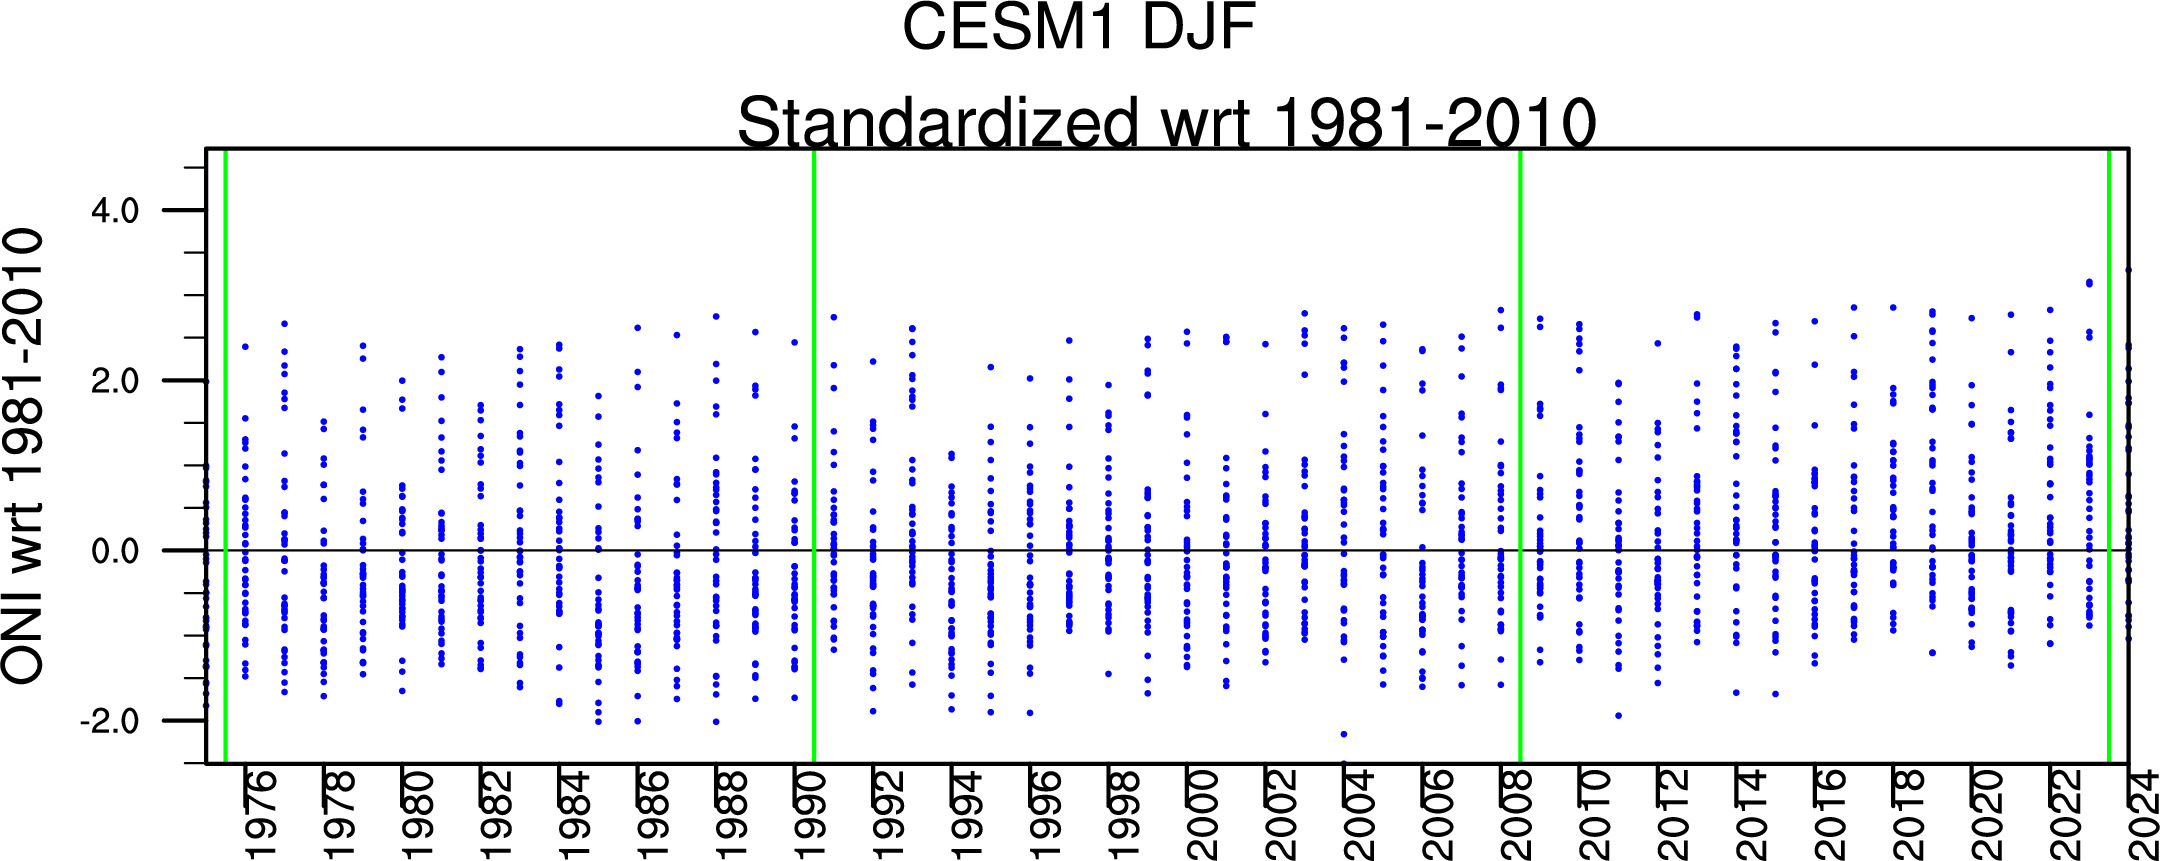
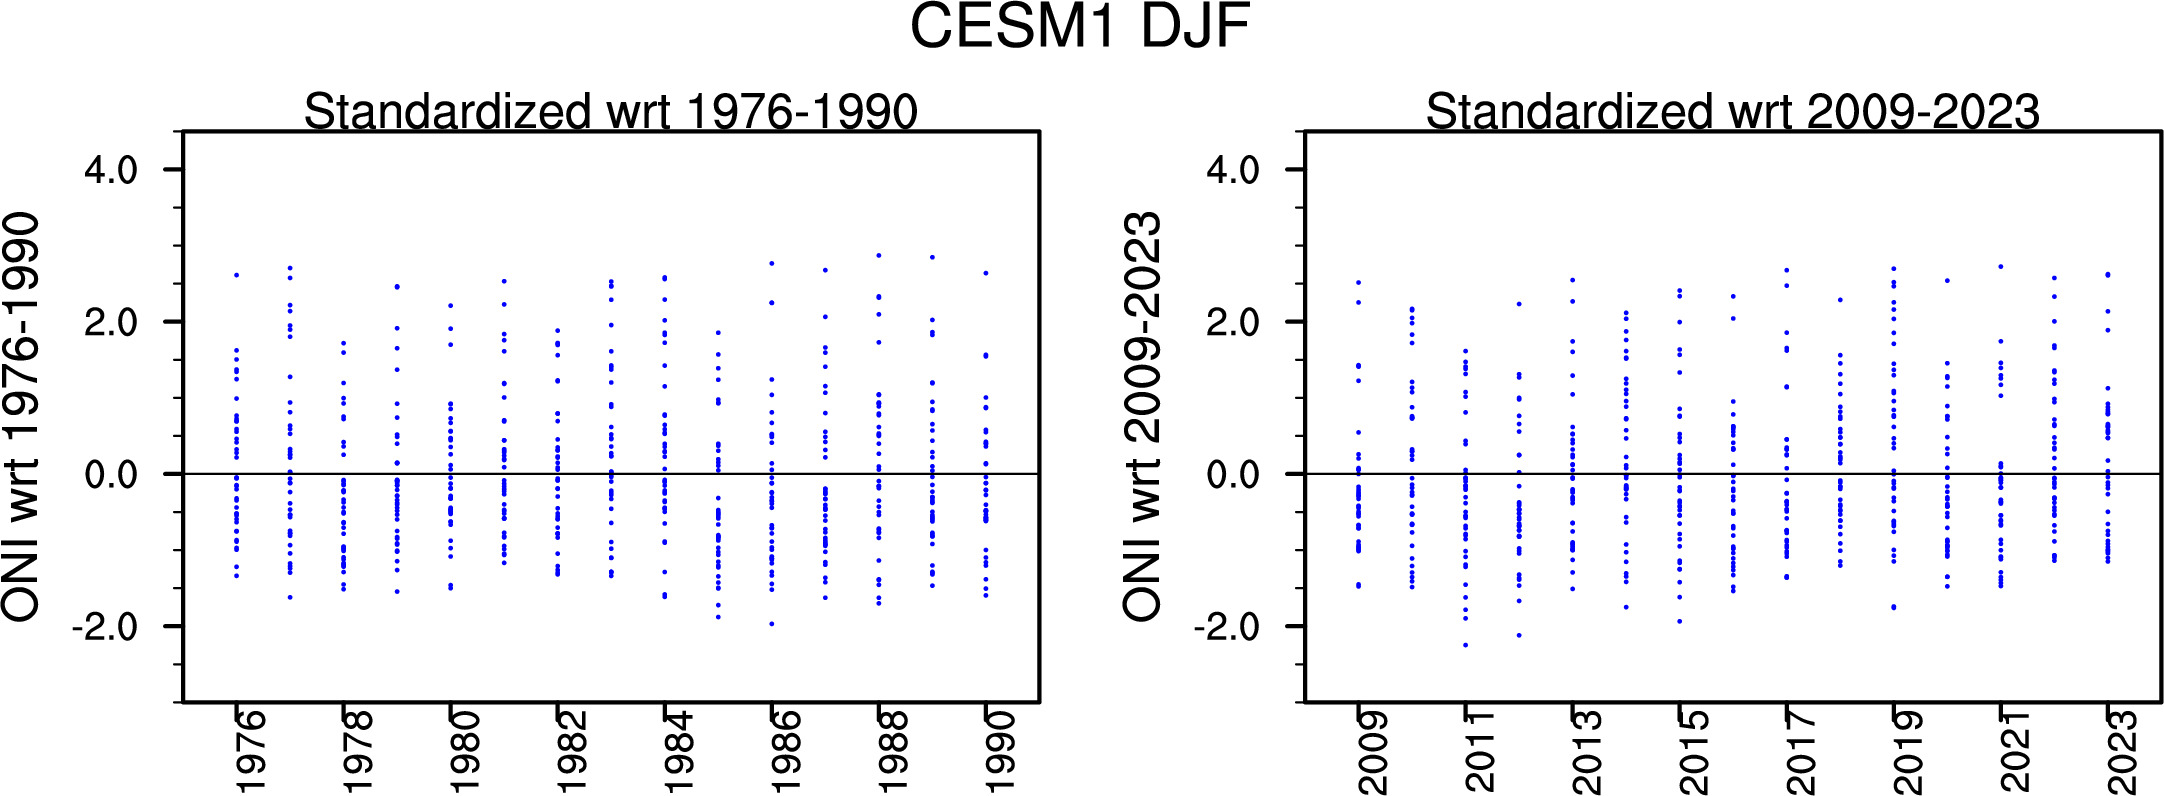
-------------------------------------------------------------
w mixed reference periods
wrt 1981-2010 (53, 81)
wrt 1976-1990, 2009-2023 (63, 55)
-----------------------------------------------------------------------------------------------------------------------------------------------------
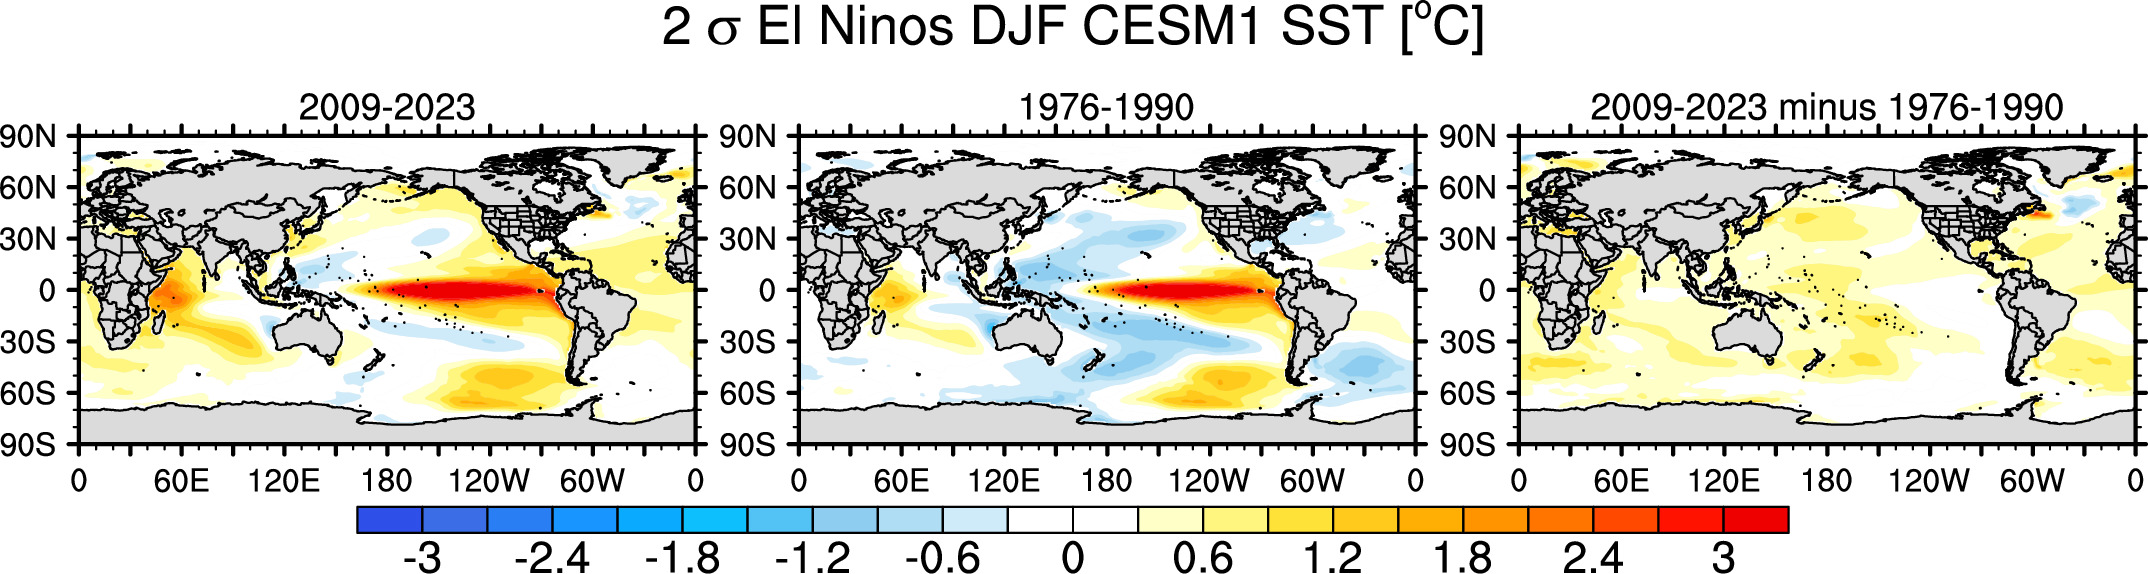
2 σ El Ninos: 23 El Ninos for 1976-1990 range. 44 El Ninos for 2009-2023 range.
where sigma of the TS Nino3.4 region DJF anomalies wrt 1981-2010 is 1.386922 deg C.
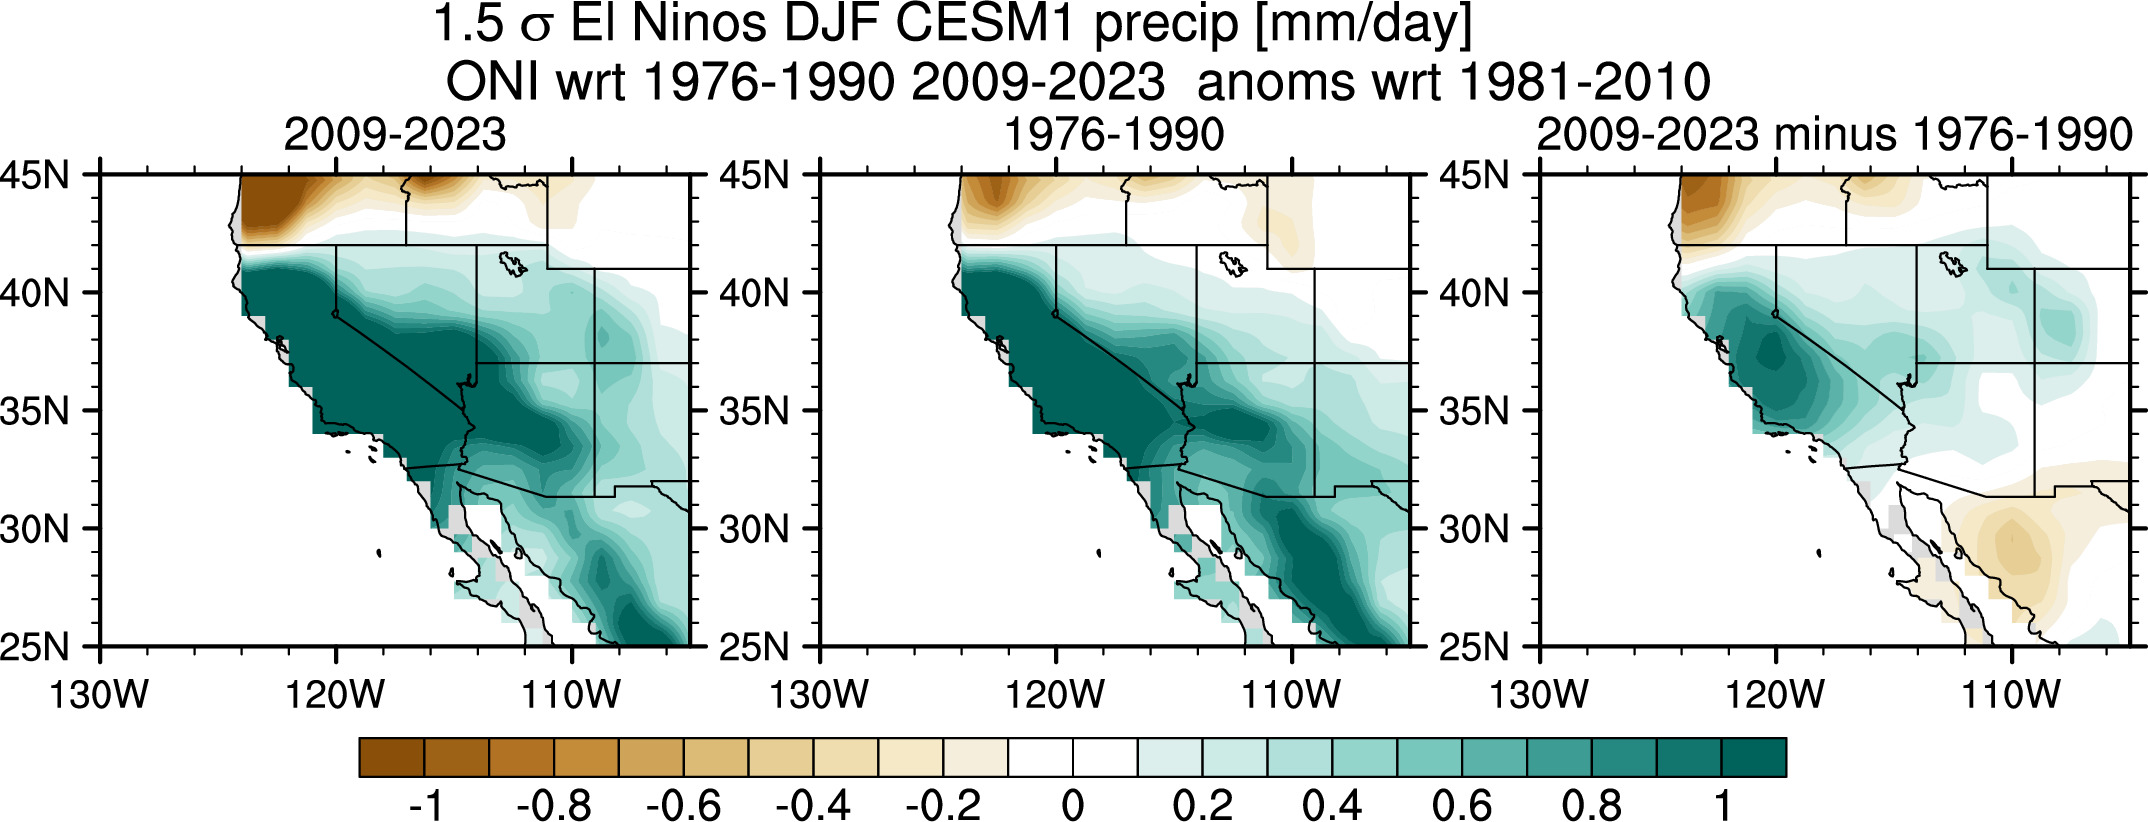
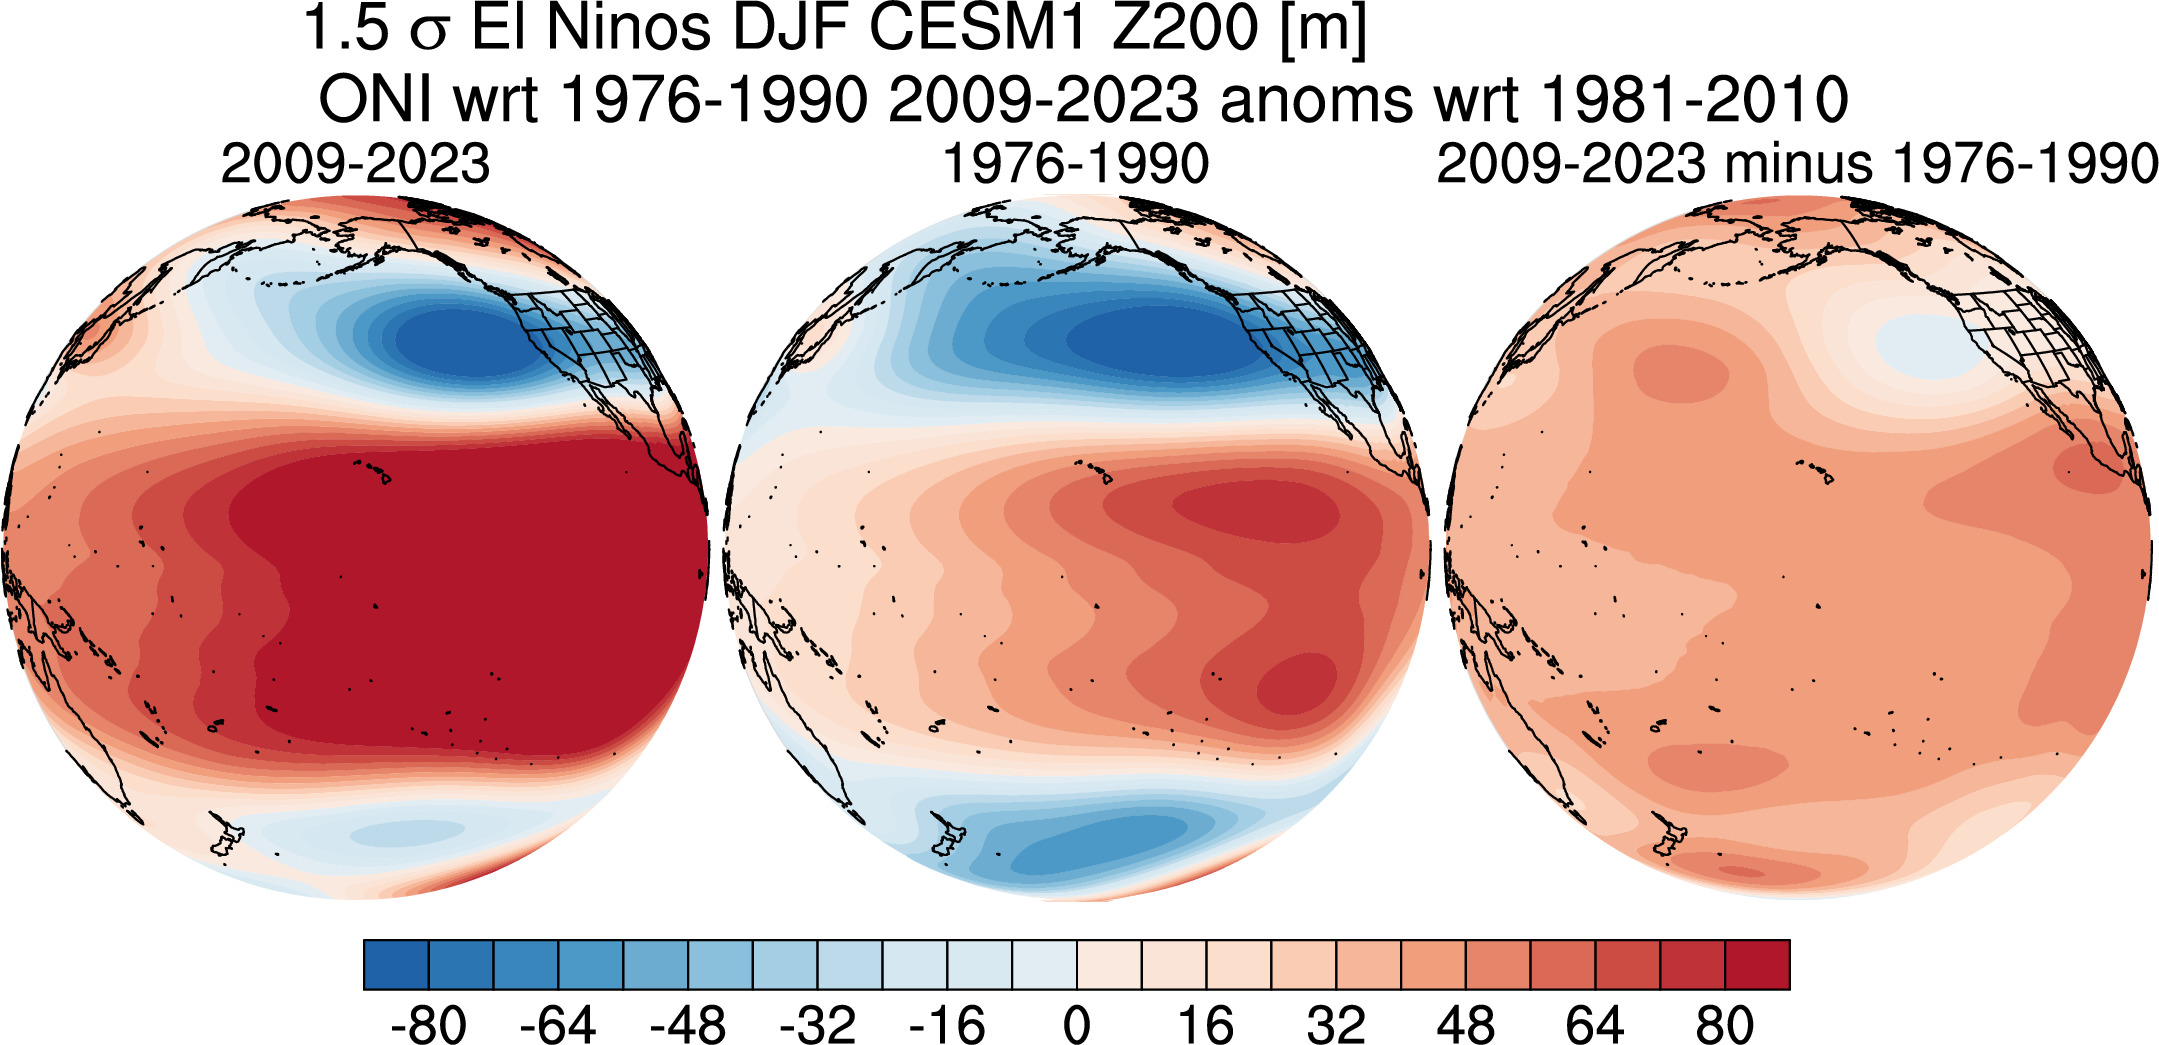
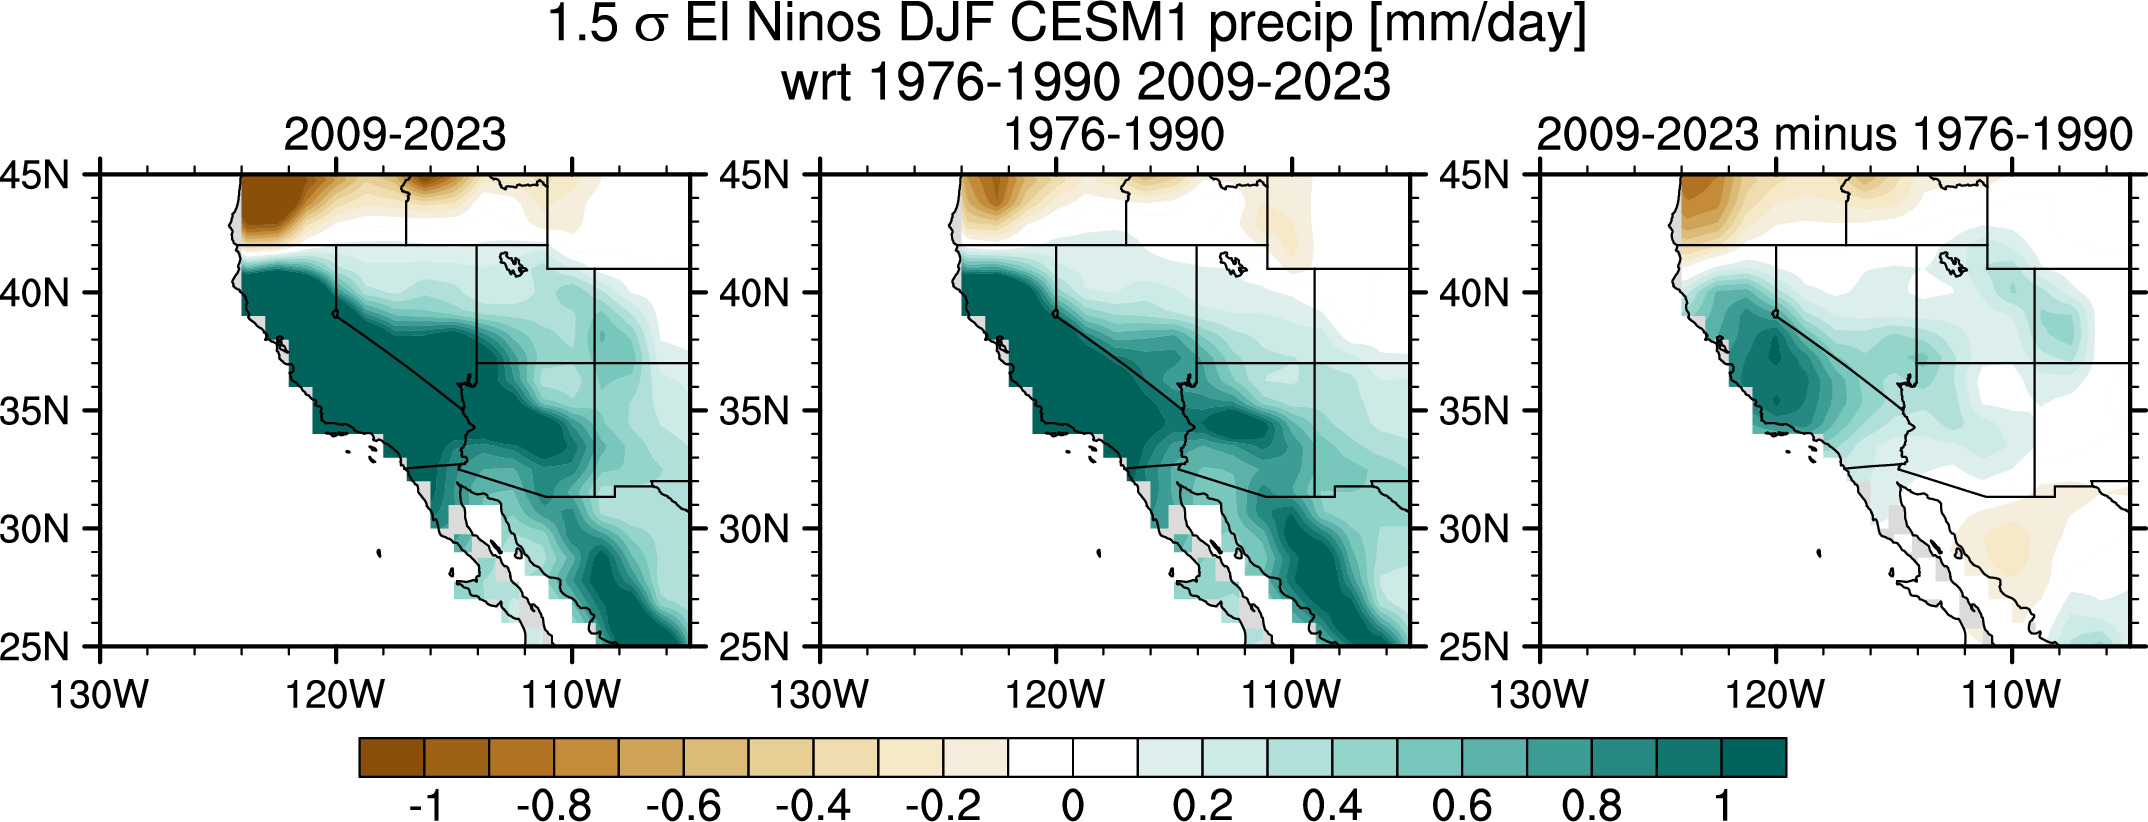
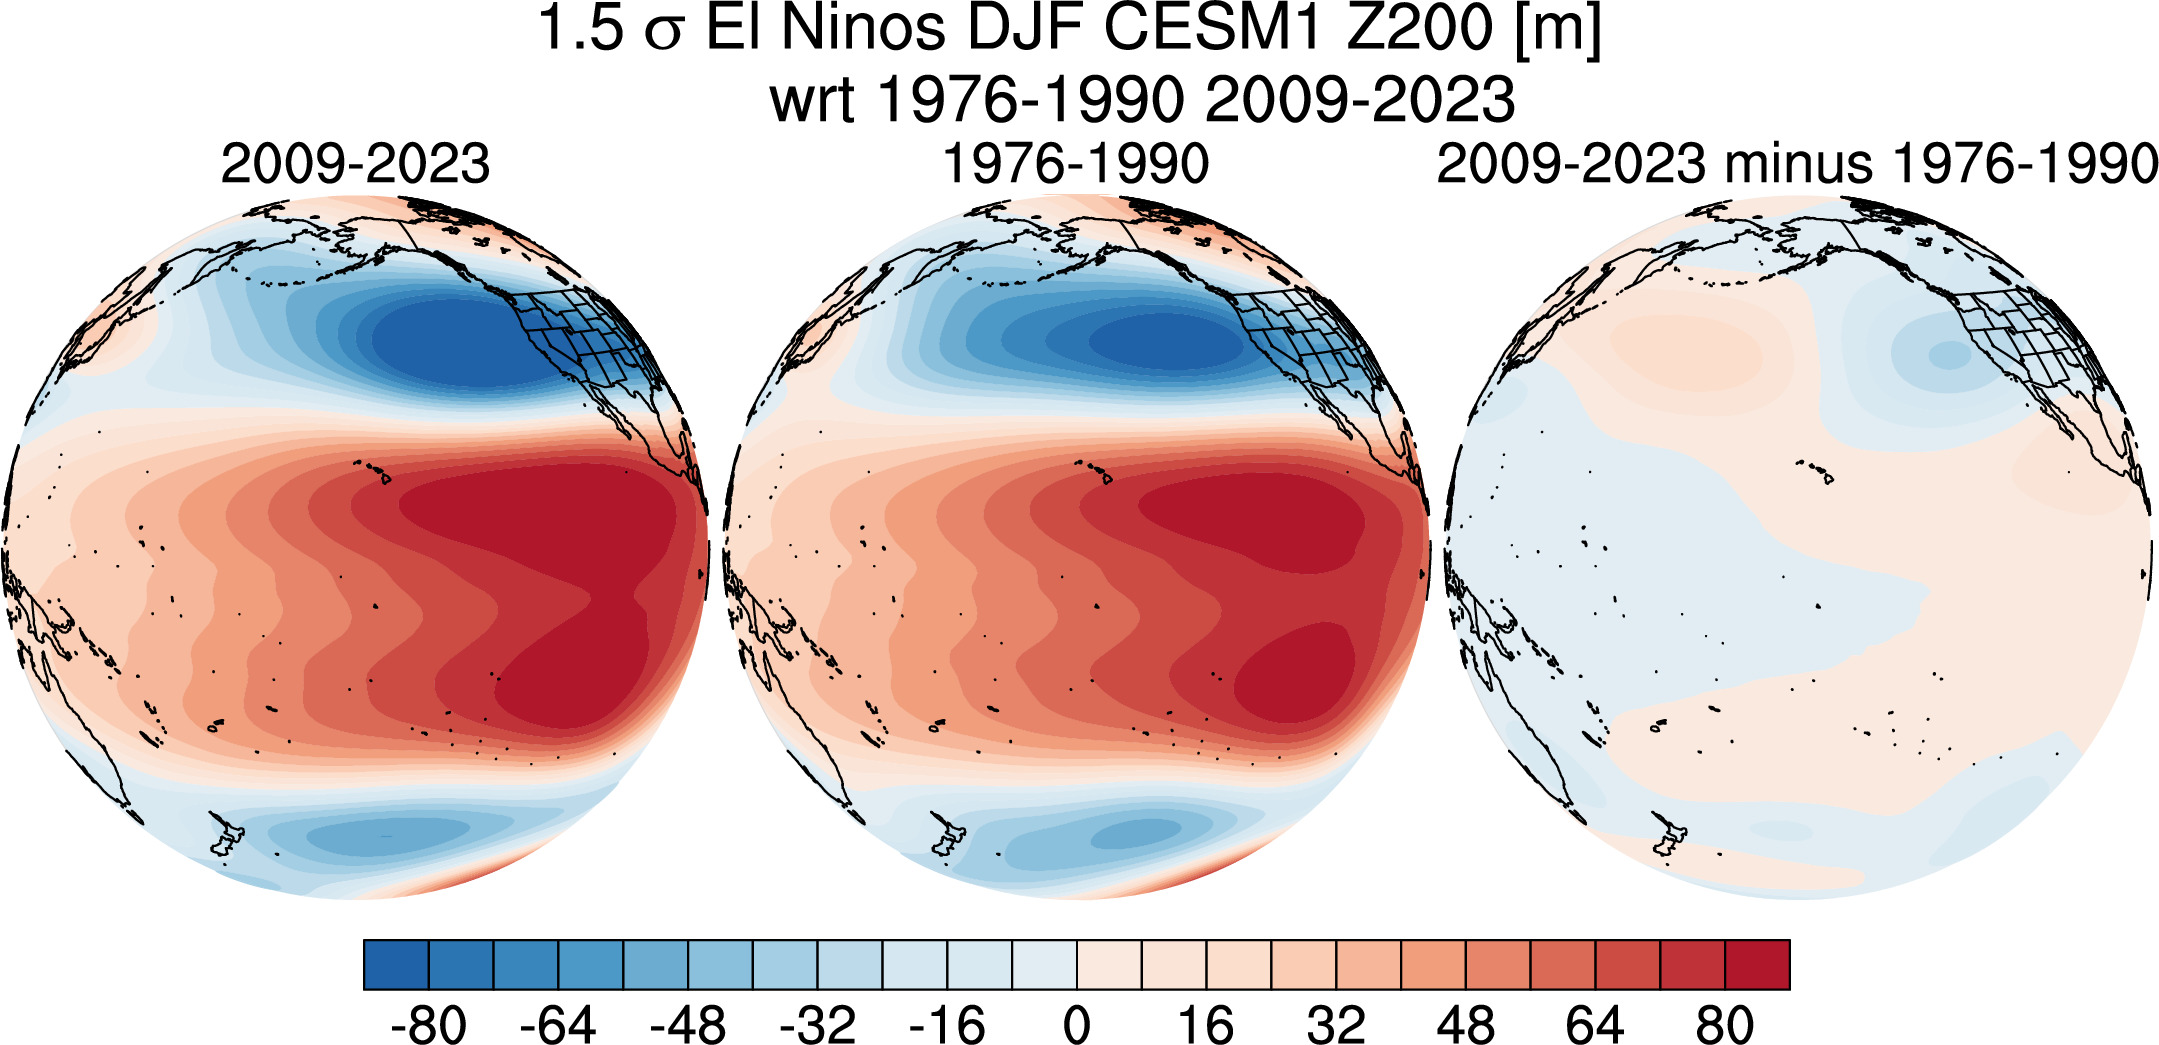
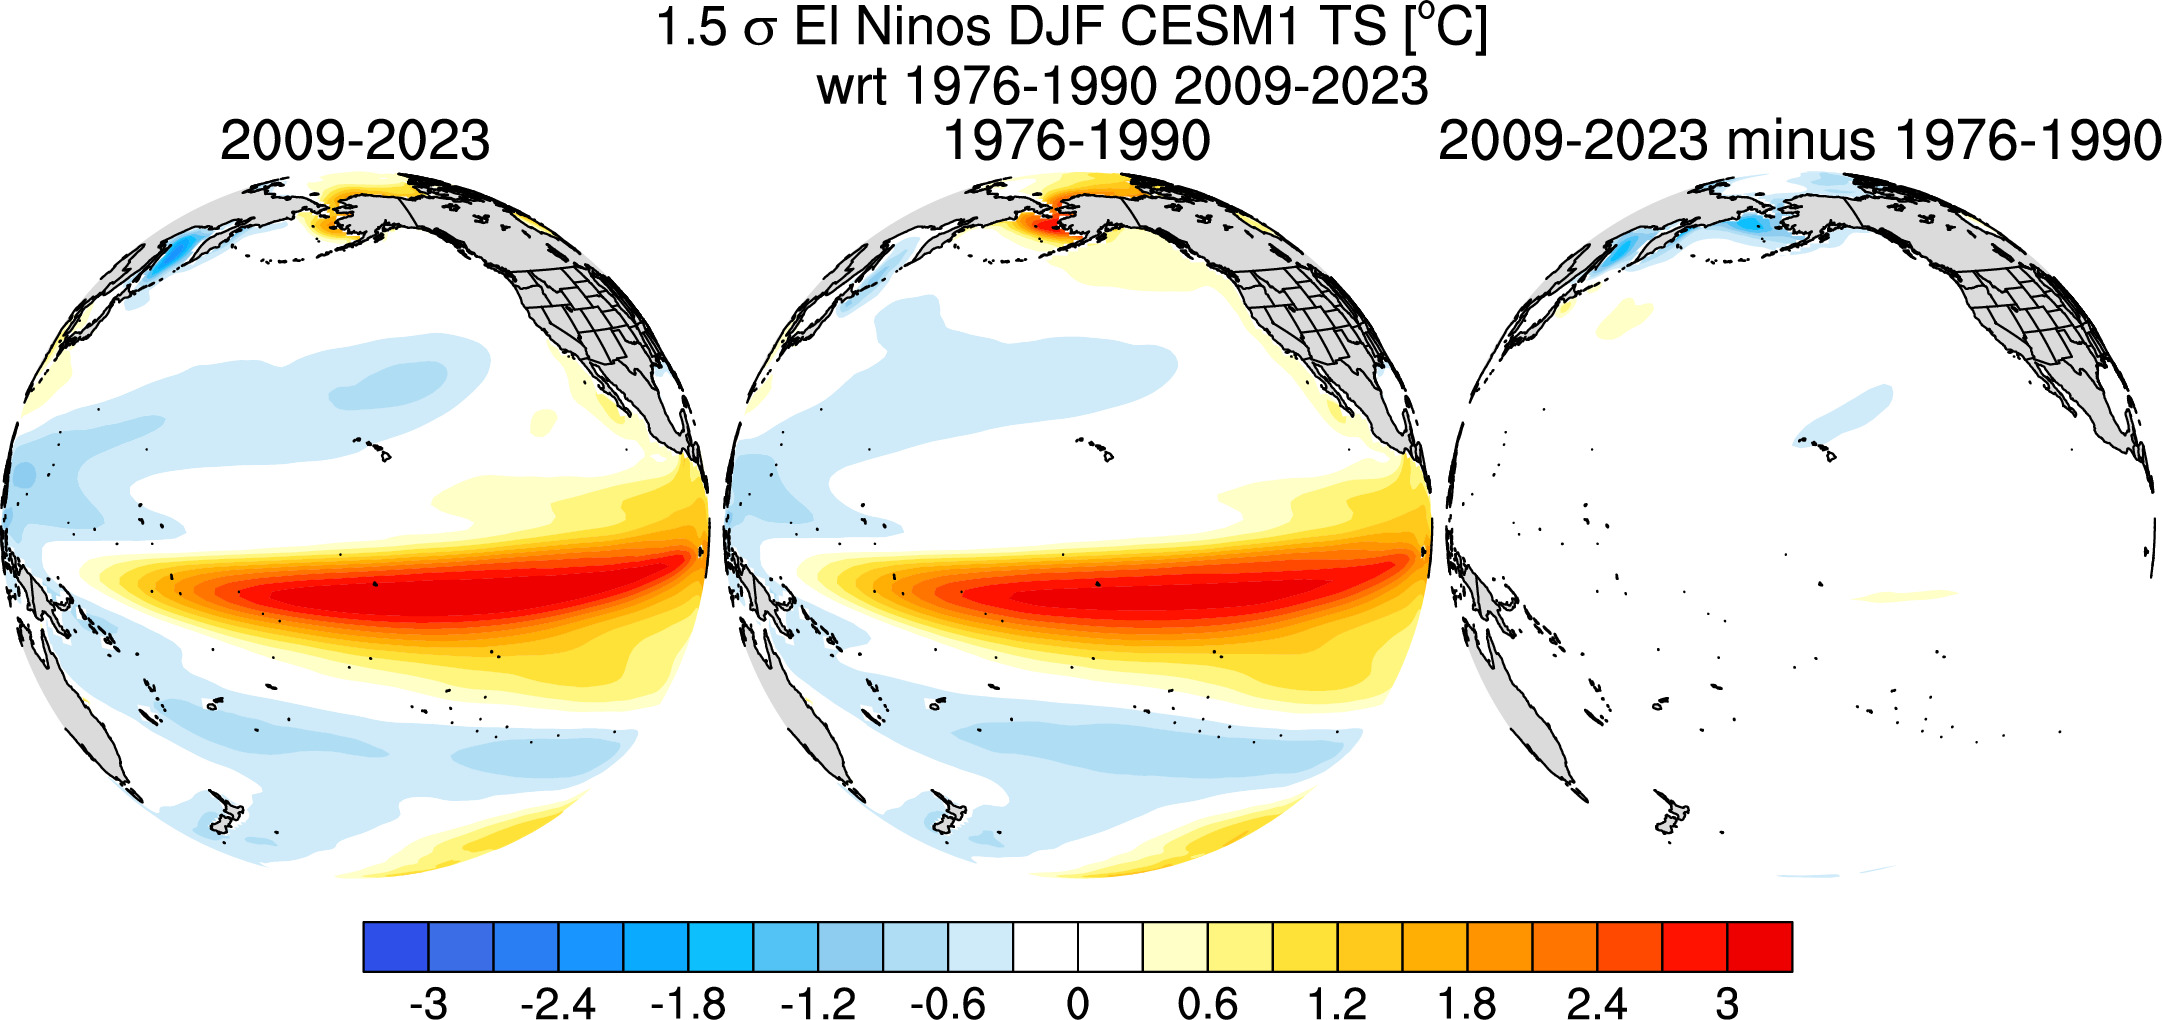
1.5 σ El Ninos: 53 El Ninos for 1976-1990 range. 81 El Ninos for 2009-2023 range.
1 σ El Ninos: 85 El Ninos for 1976-1990 range. 142 El Ninos for 2009-2023 range.
15 year period Anomalies computed wrt 1981-2010. El Ninos computed wrt 1981-2010 period.
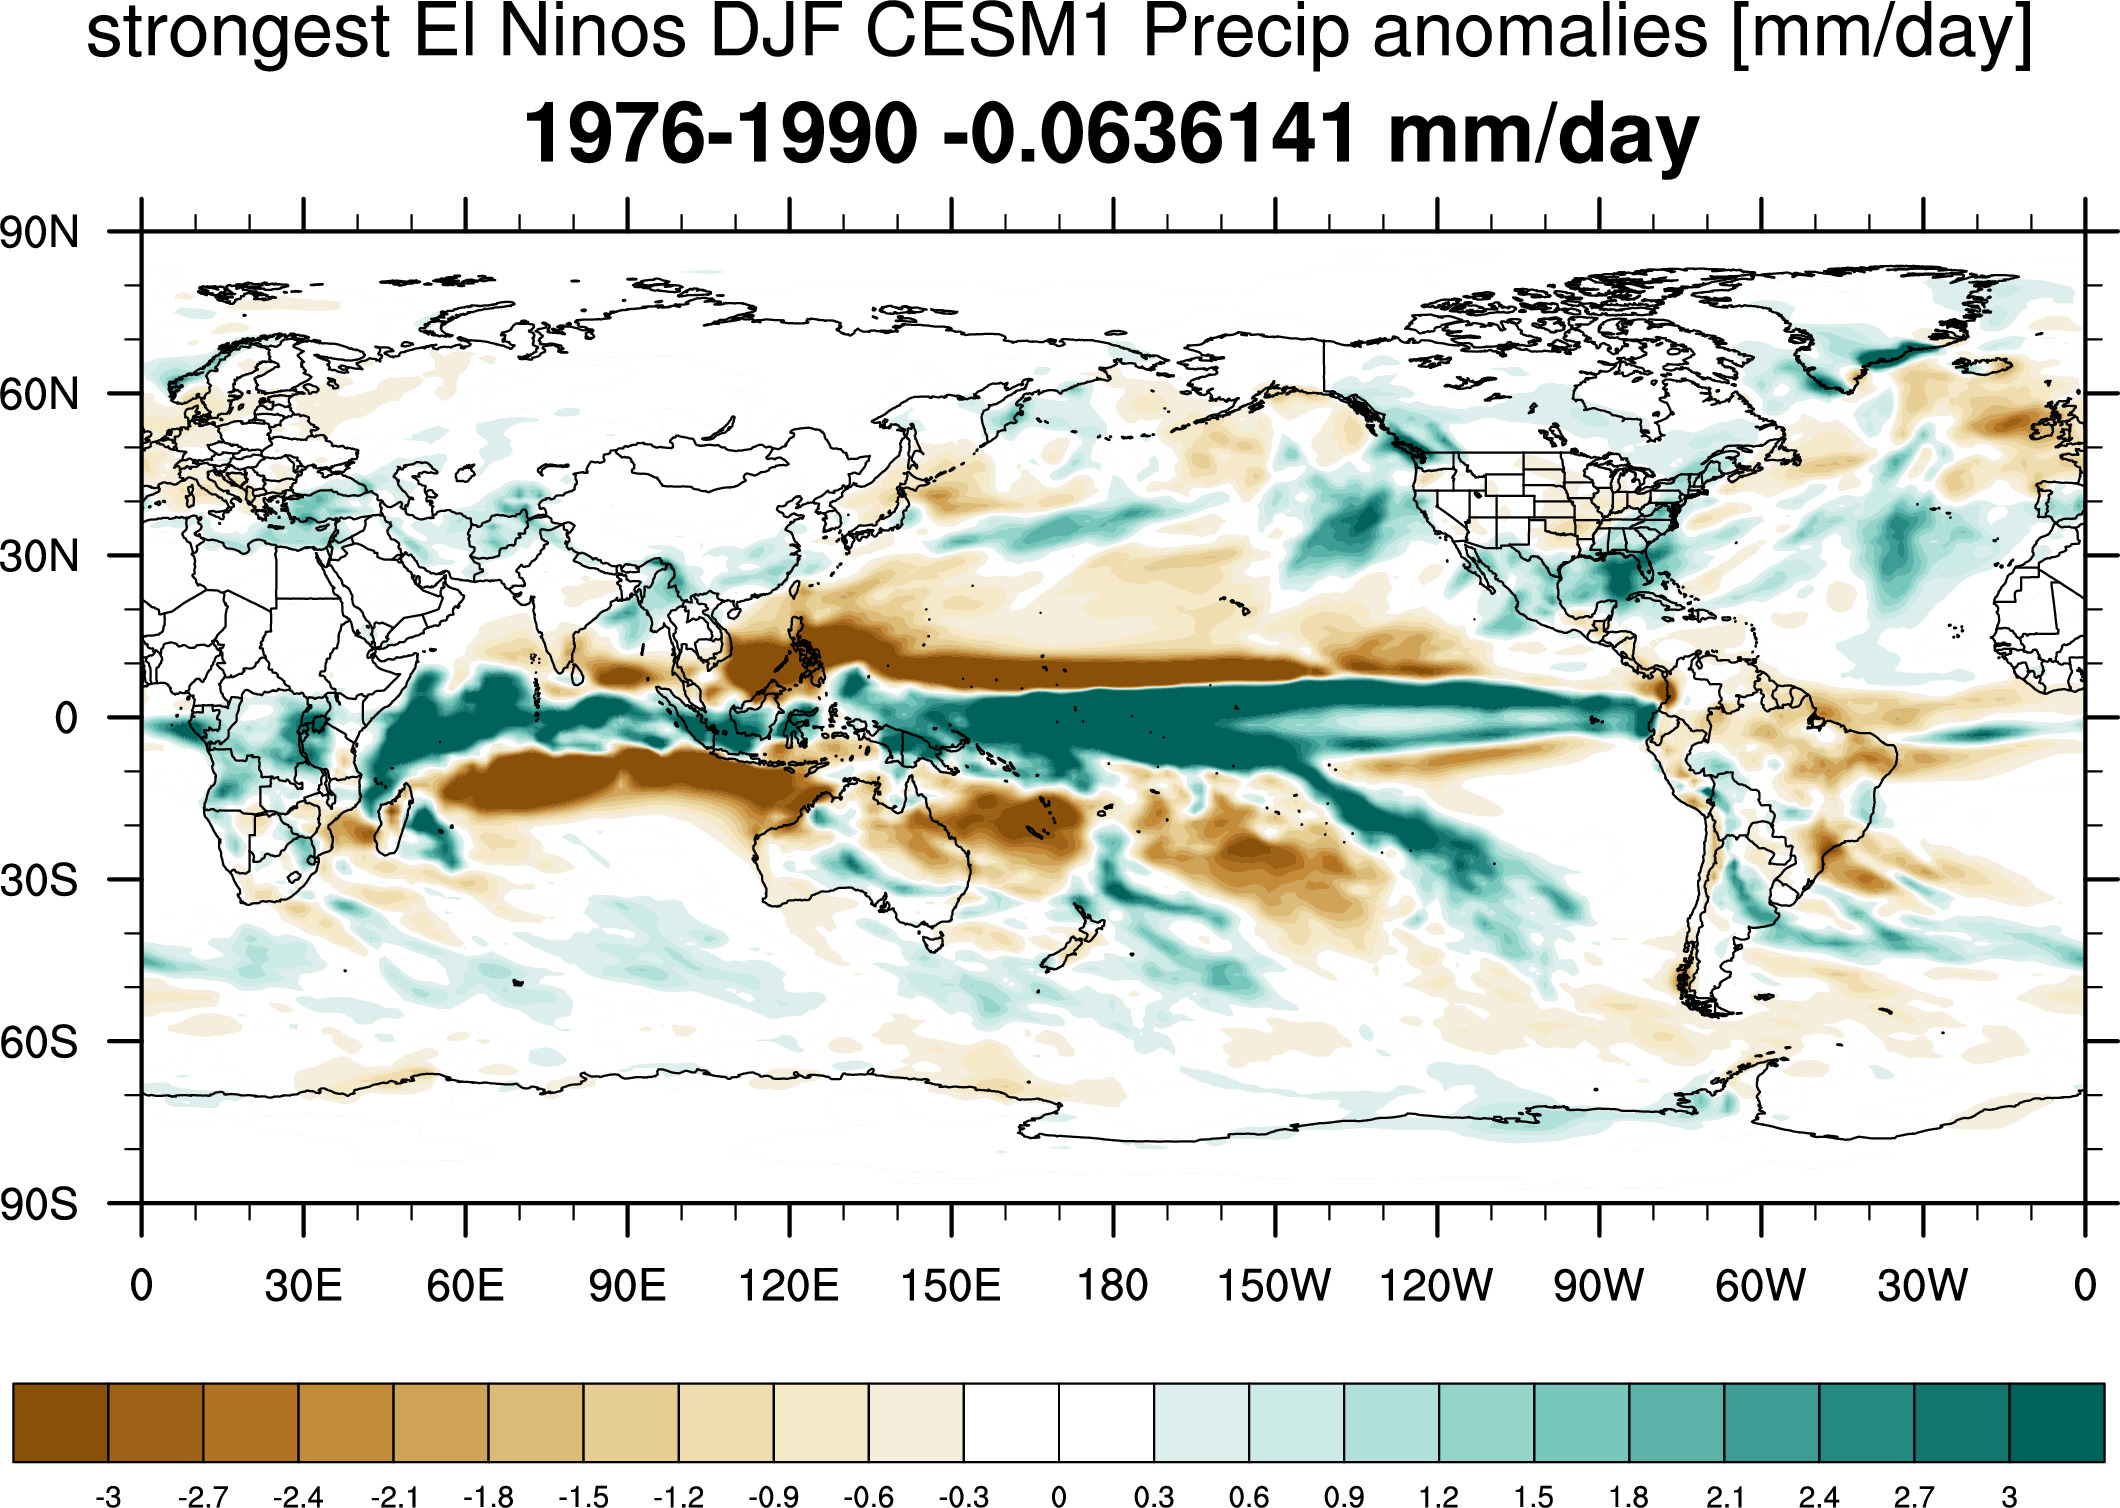
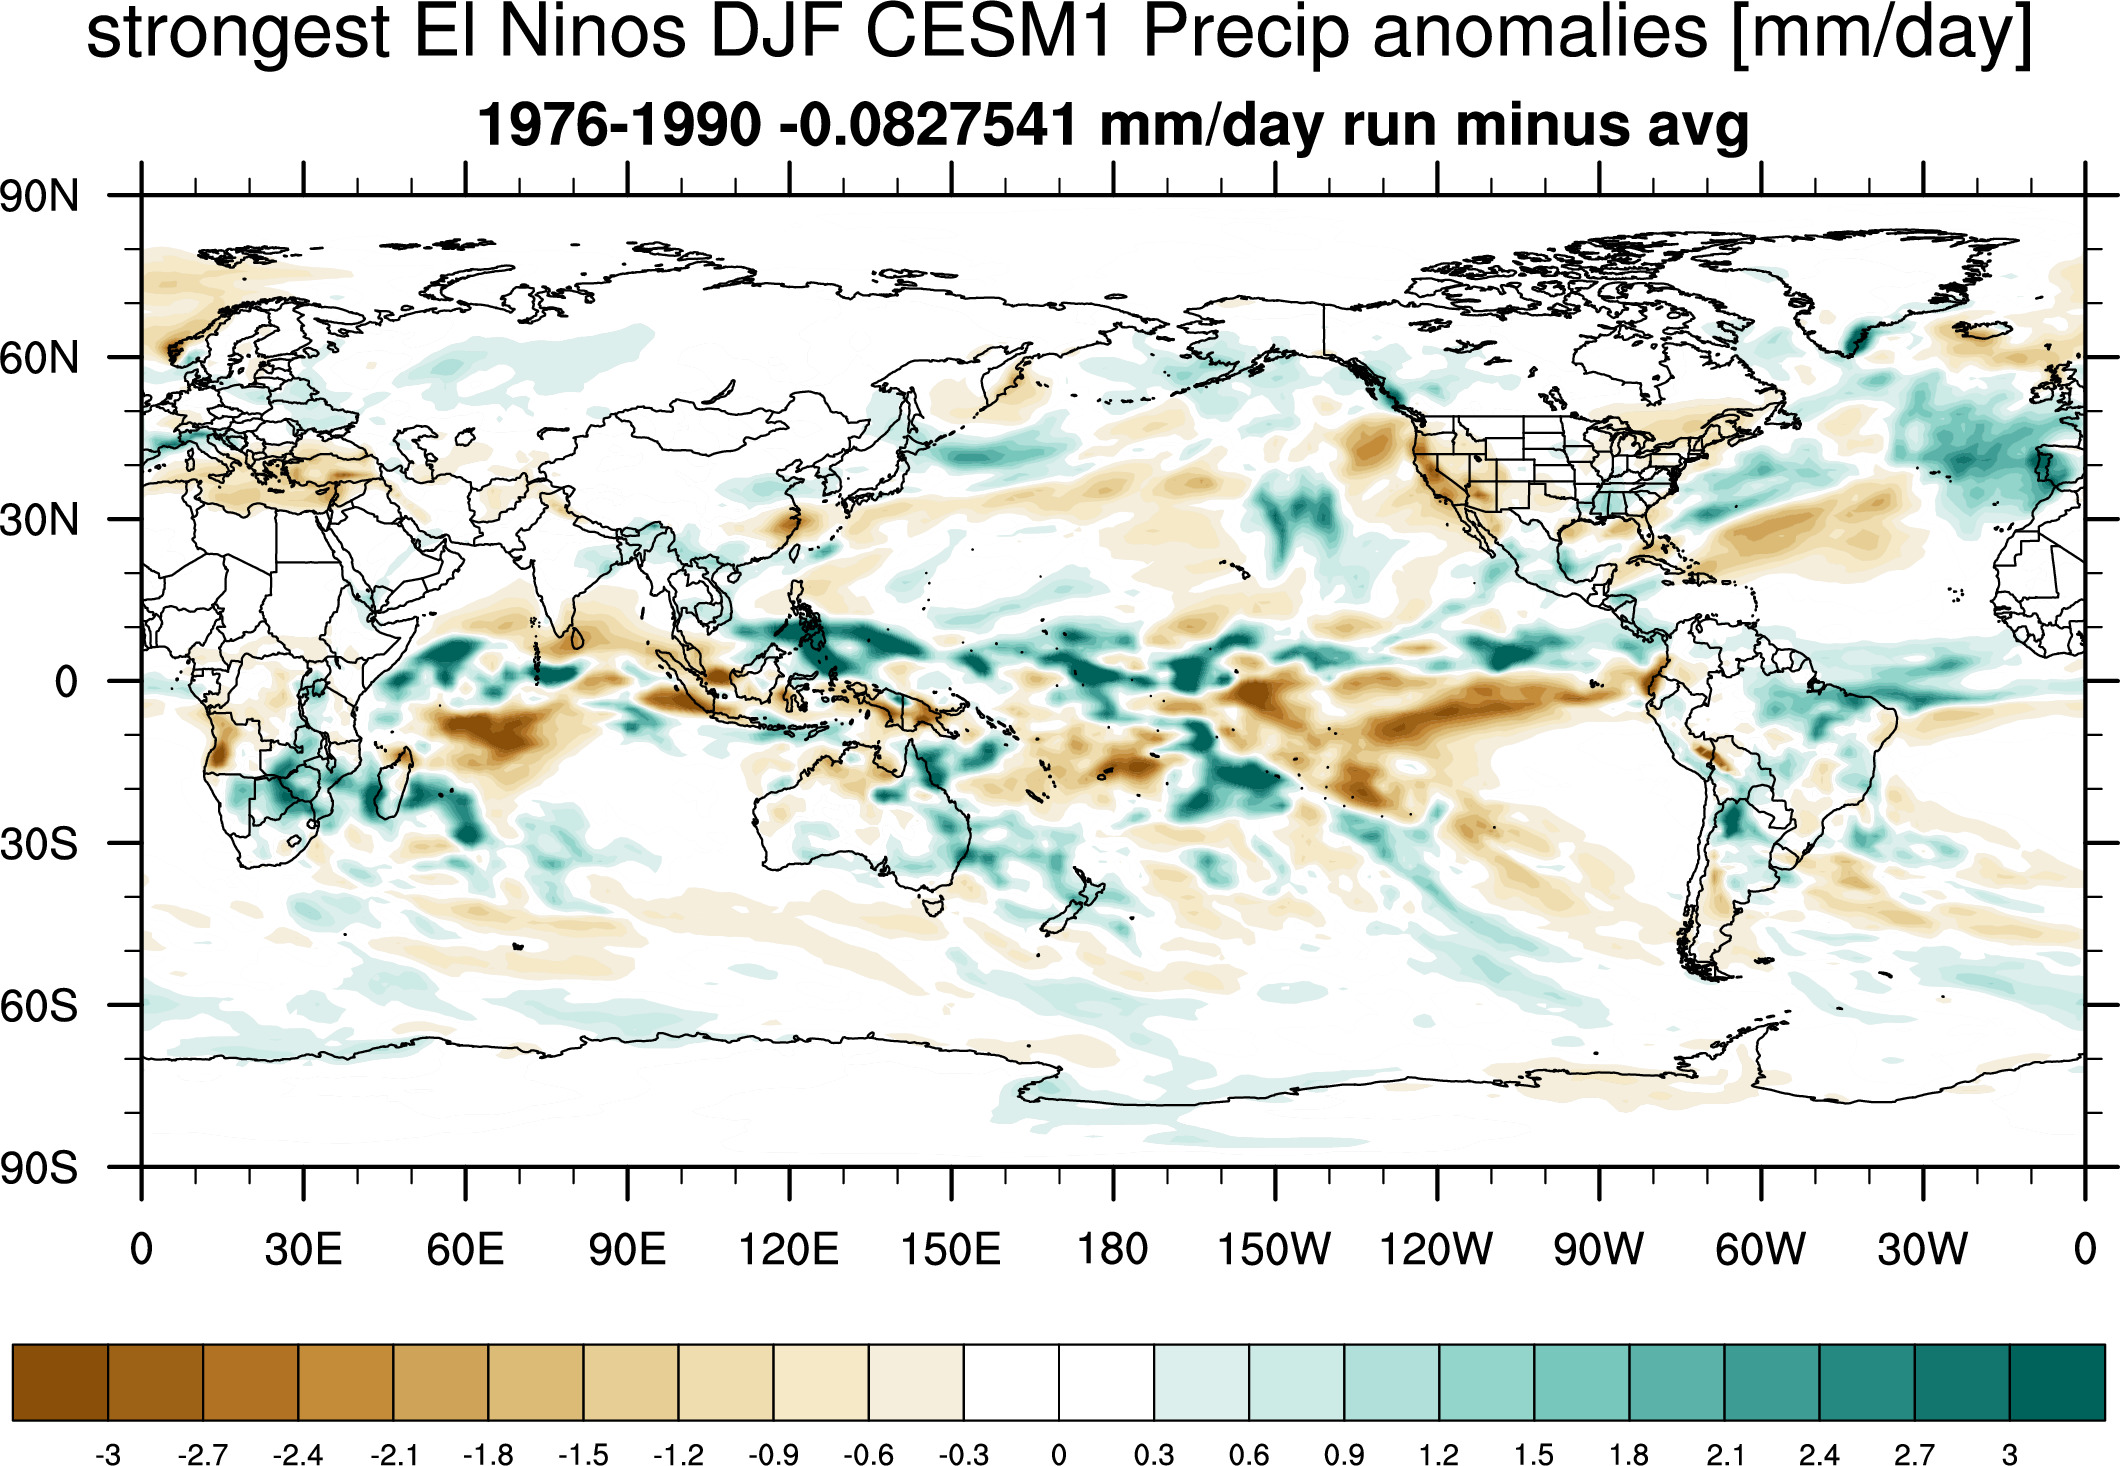
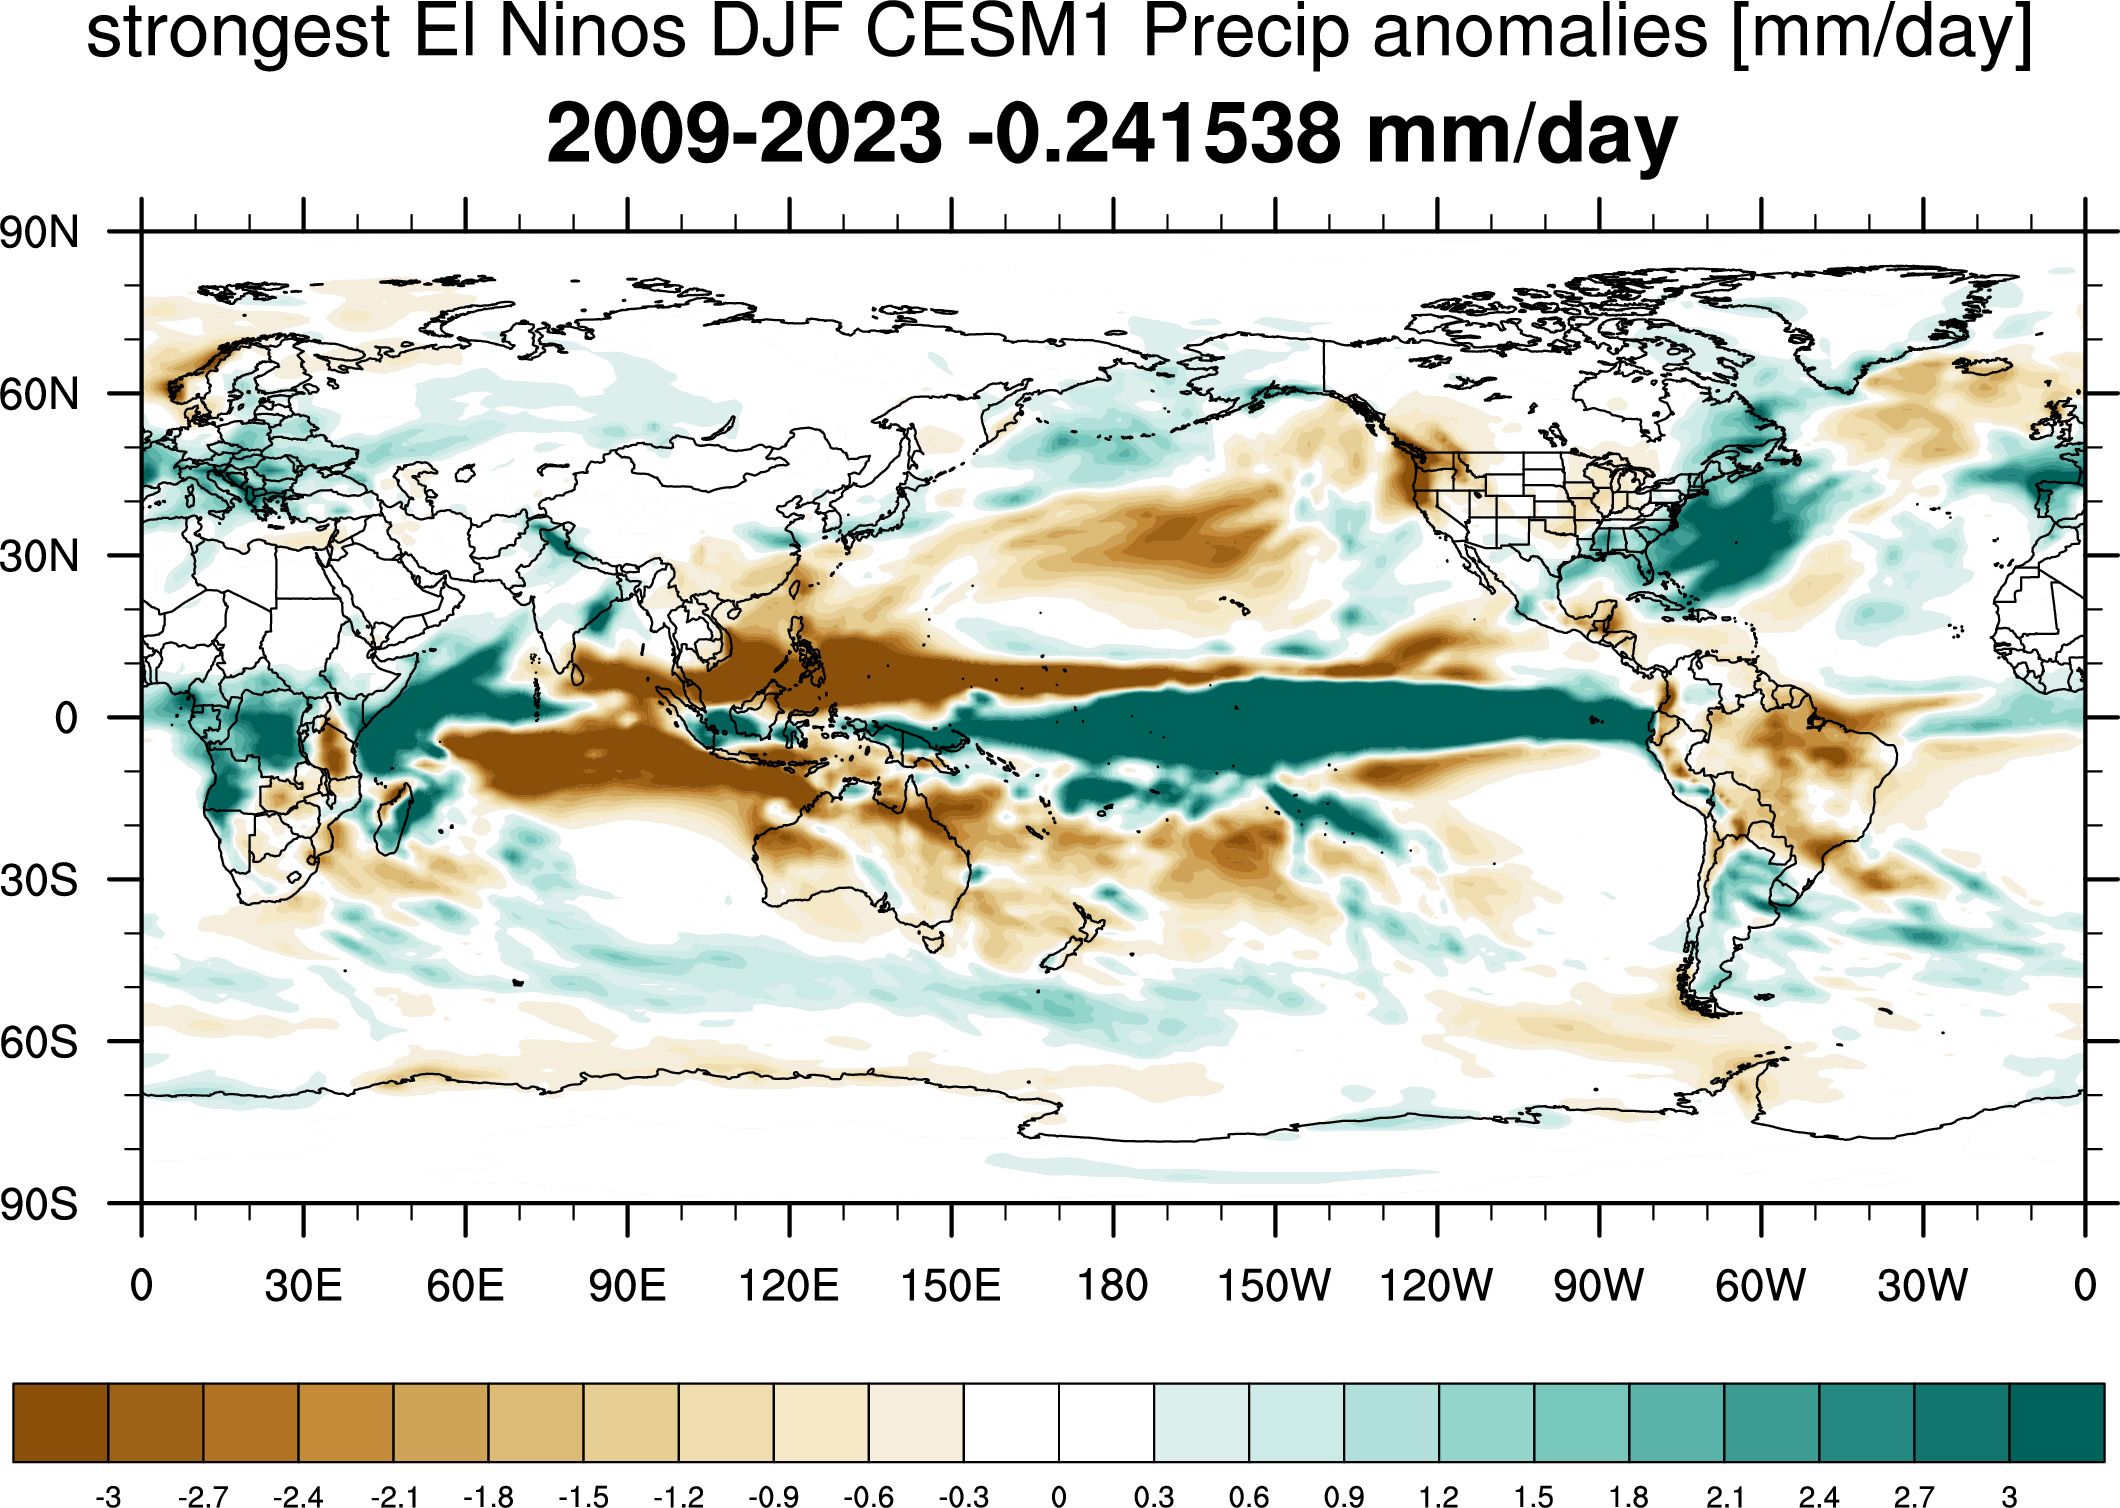
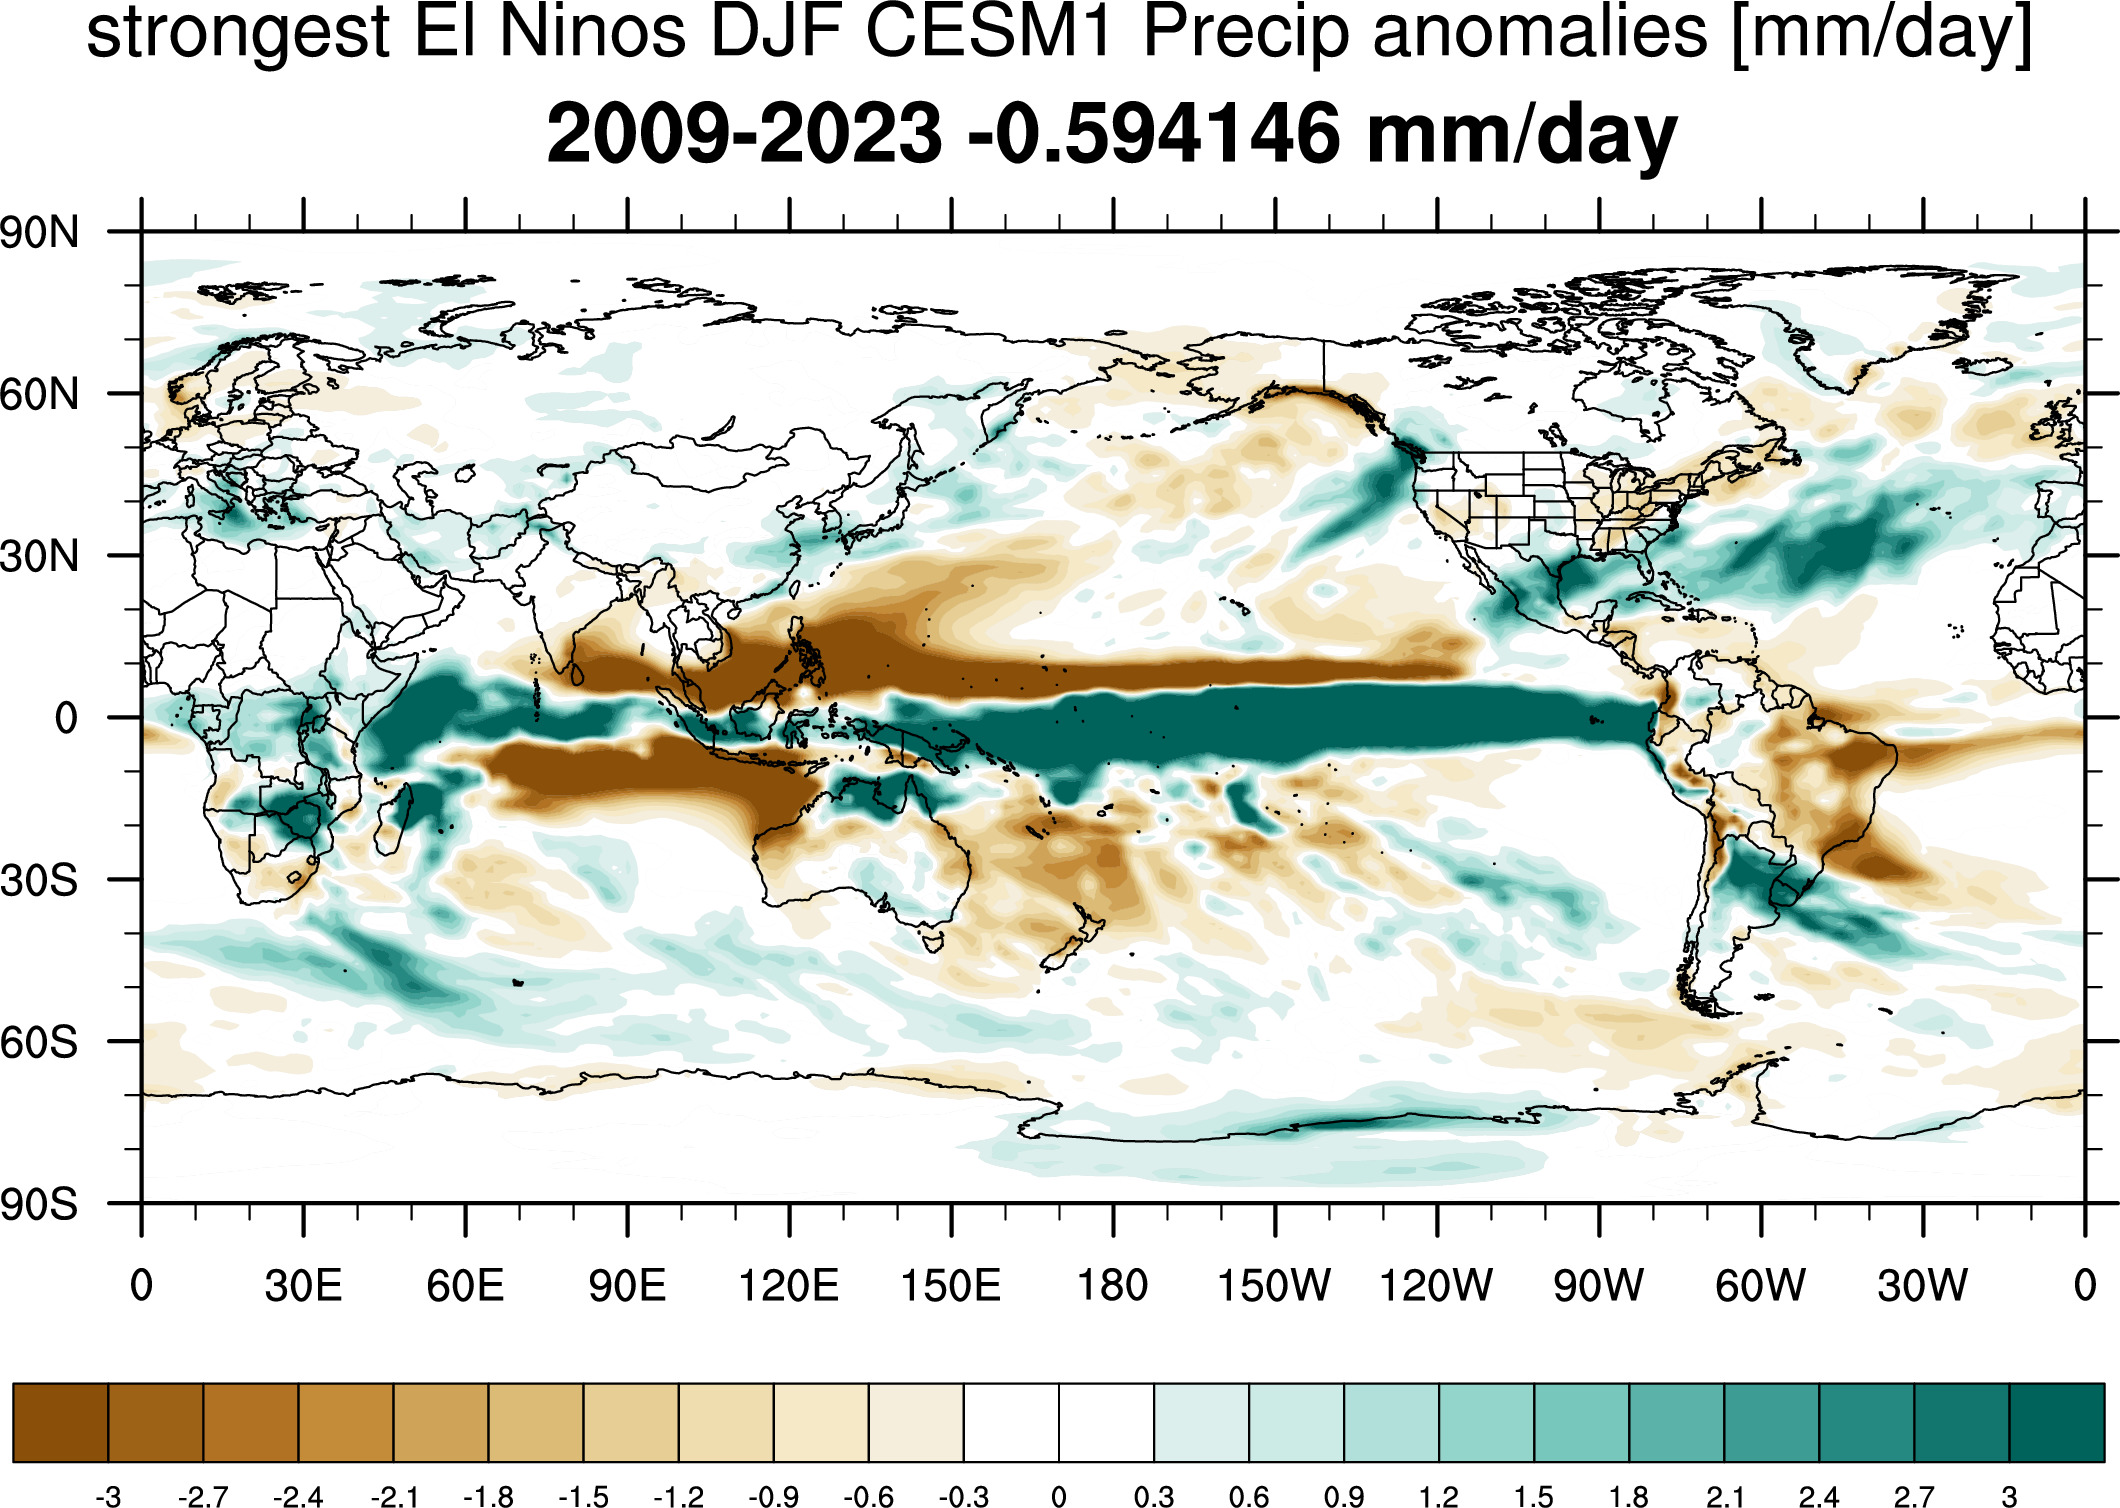
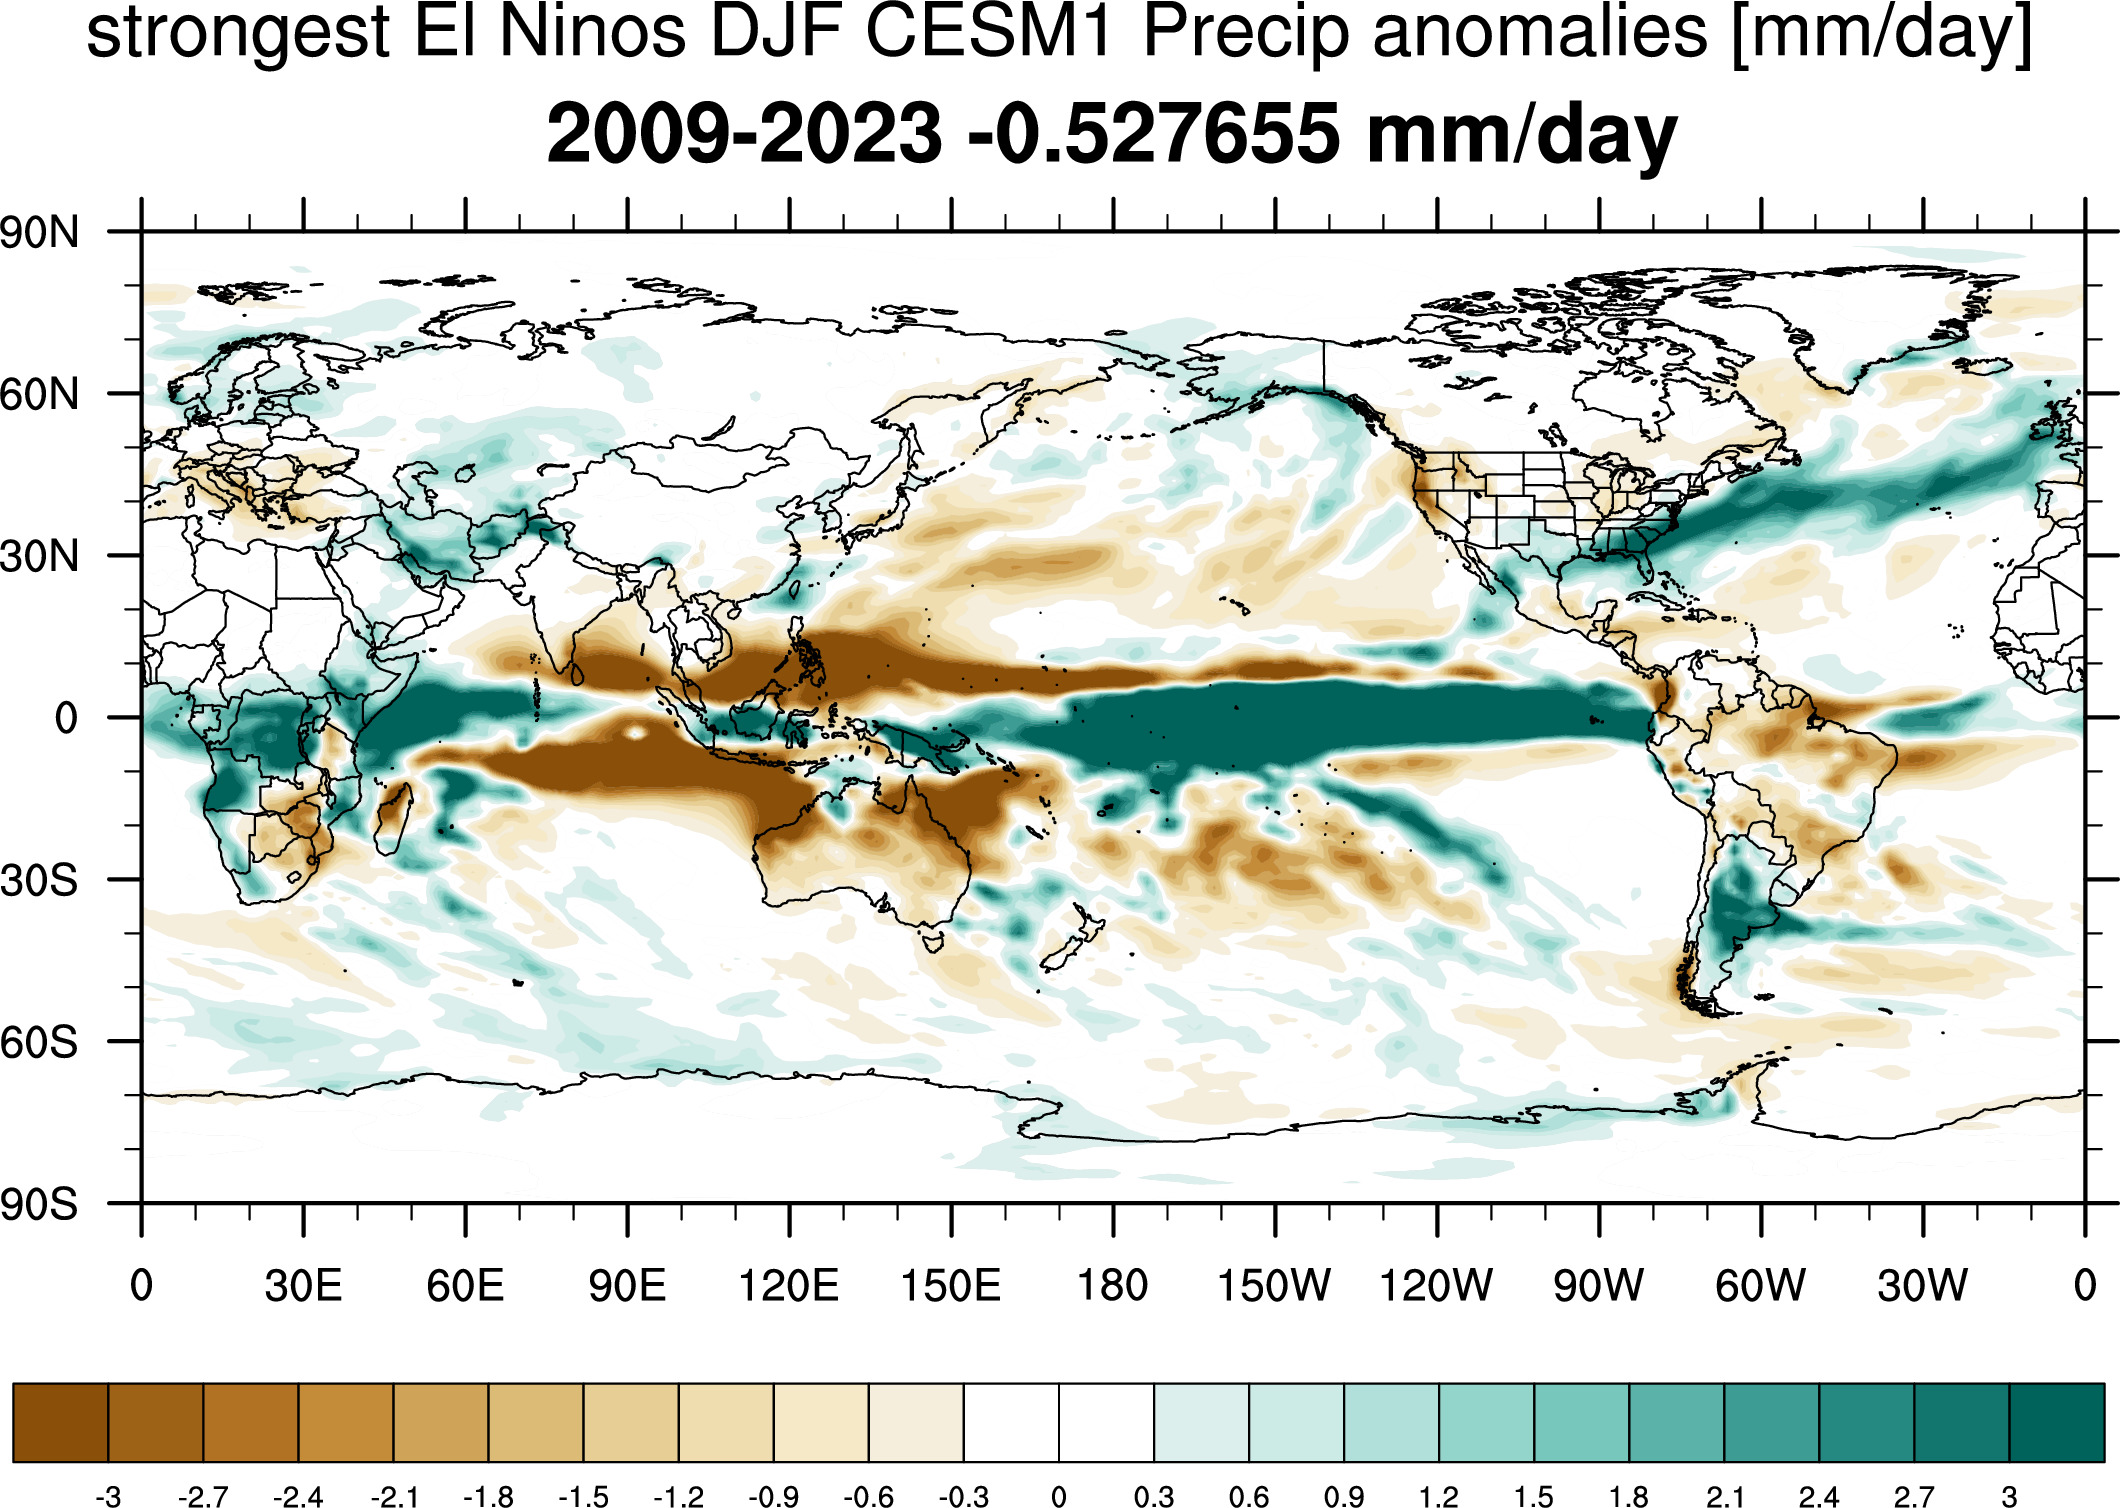
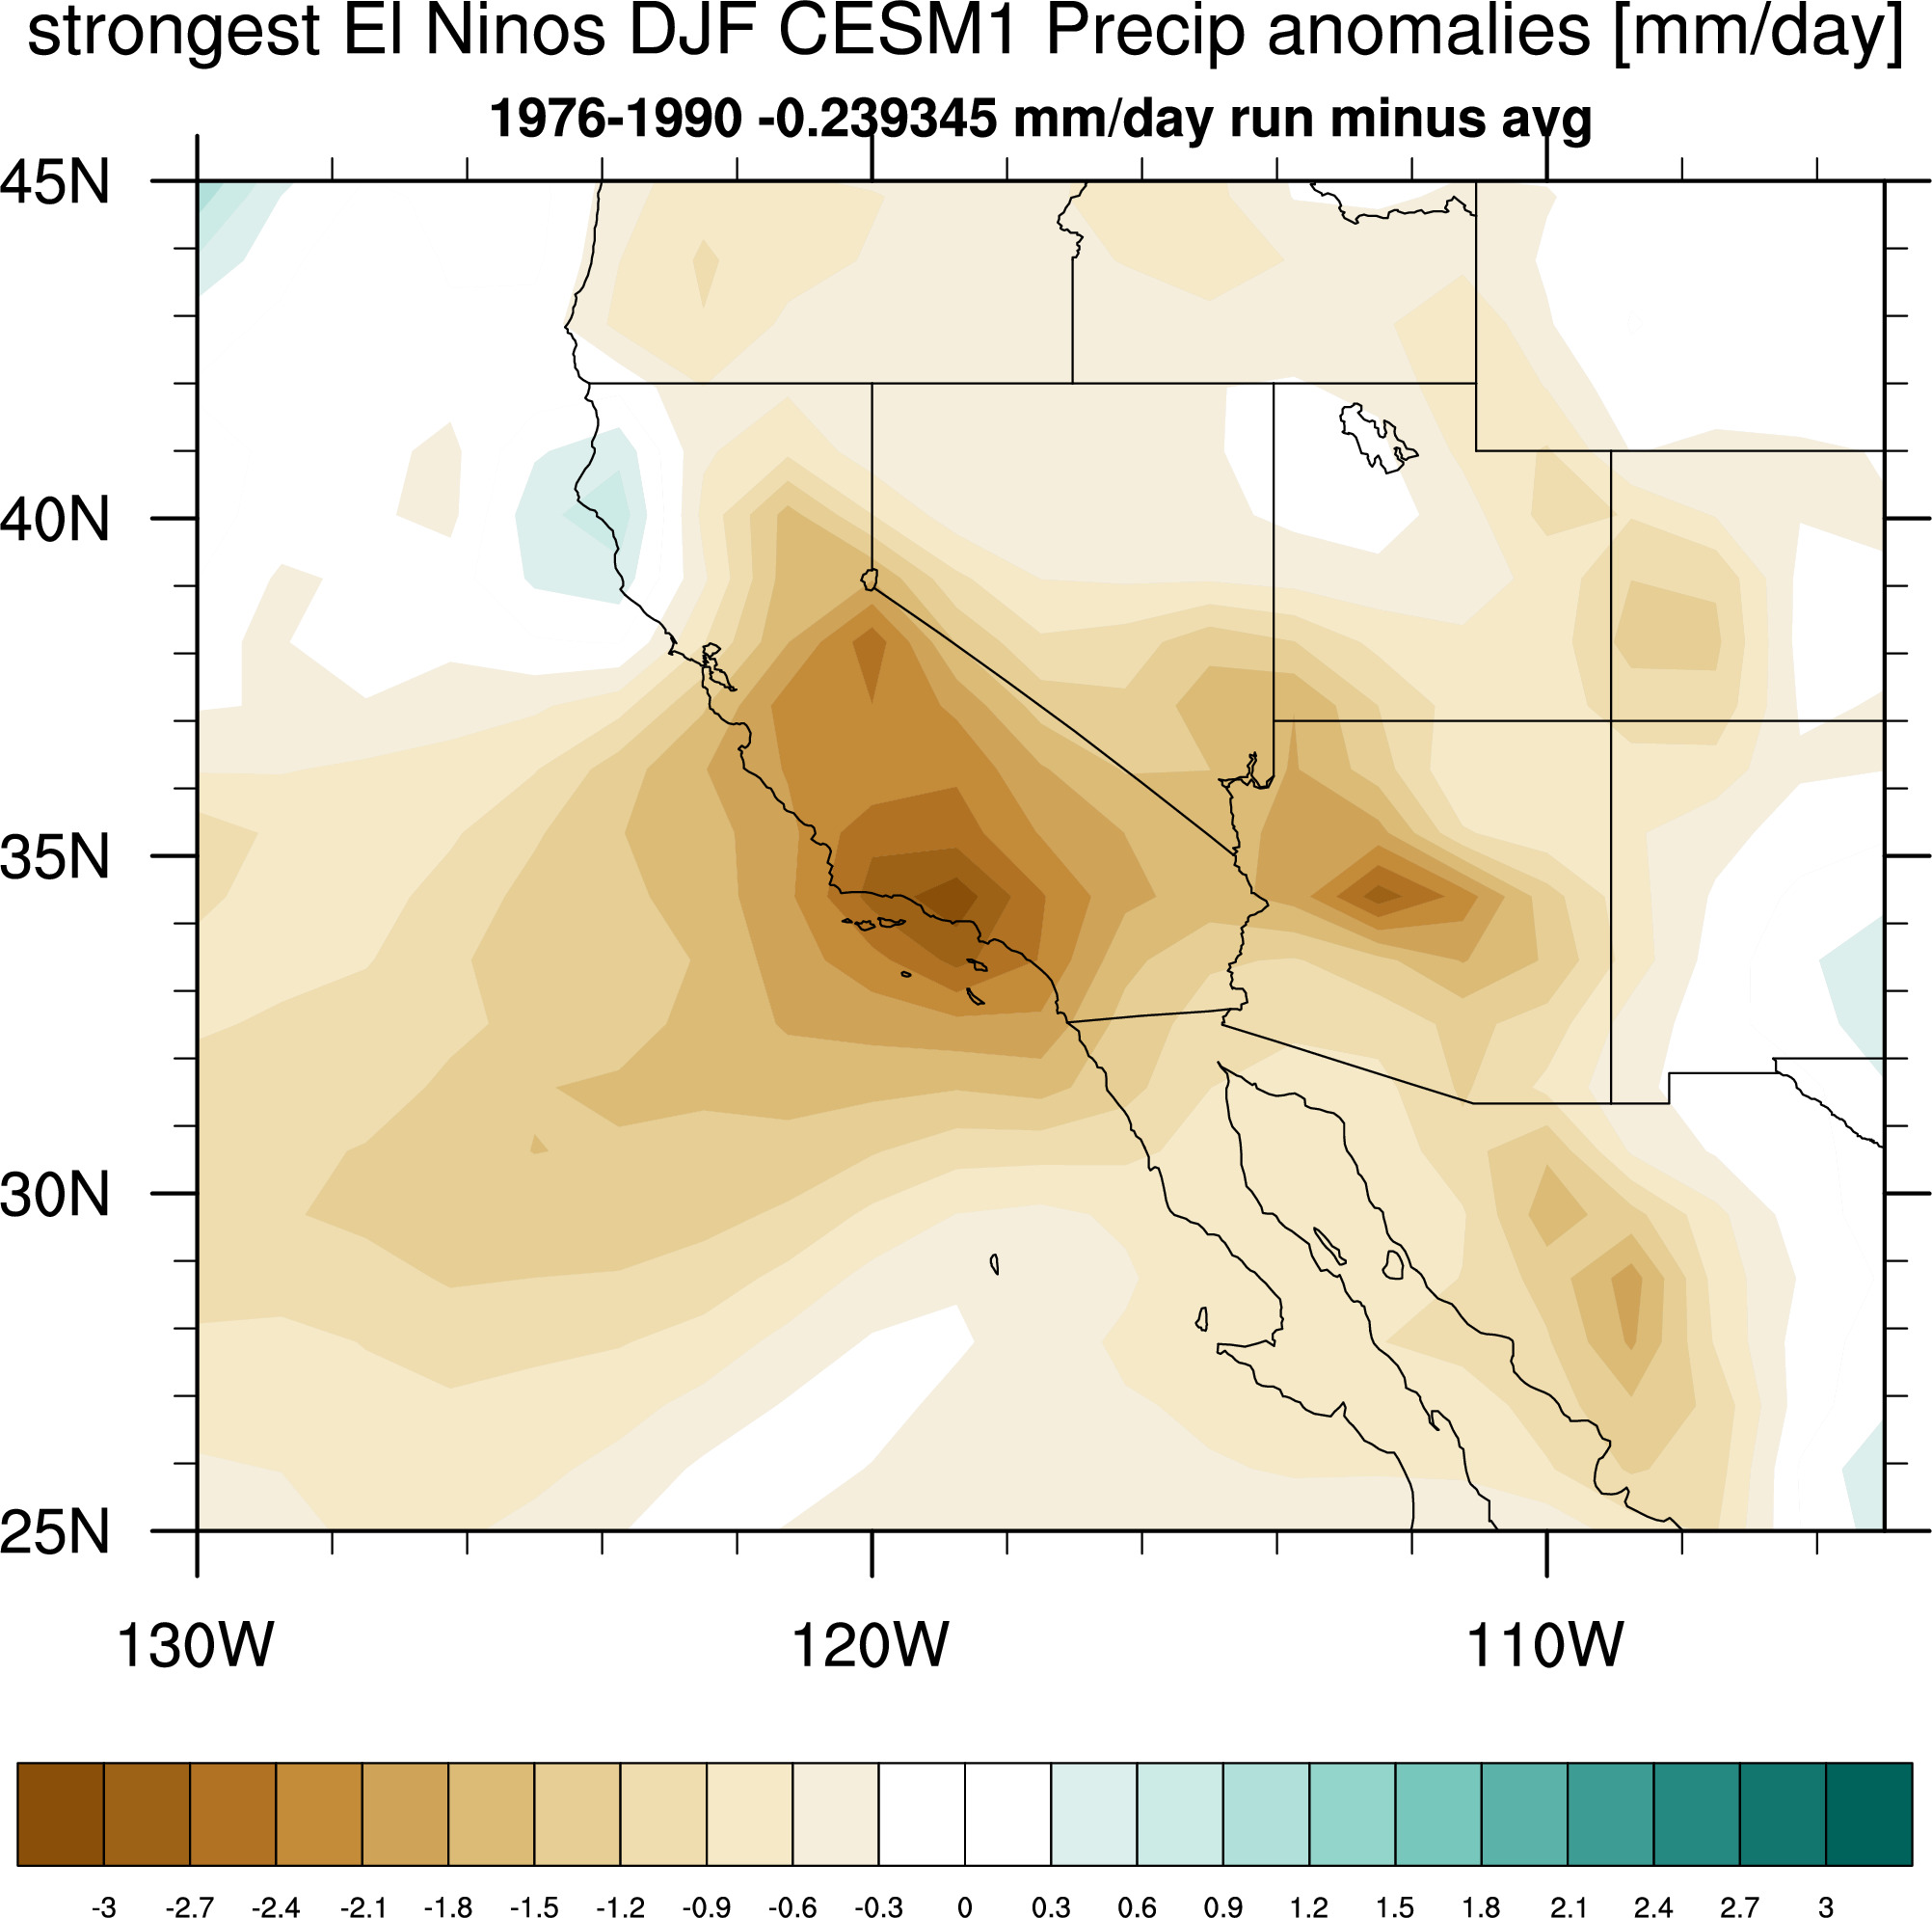
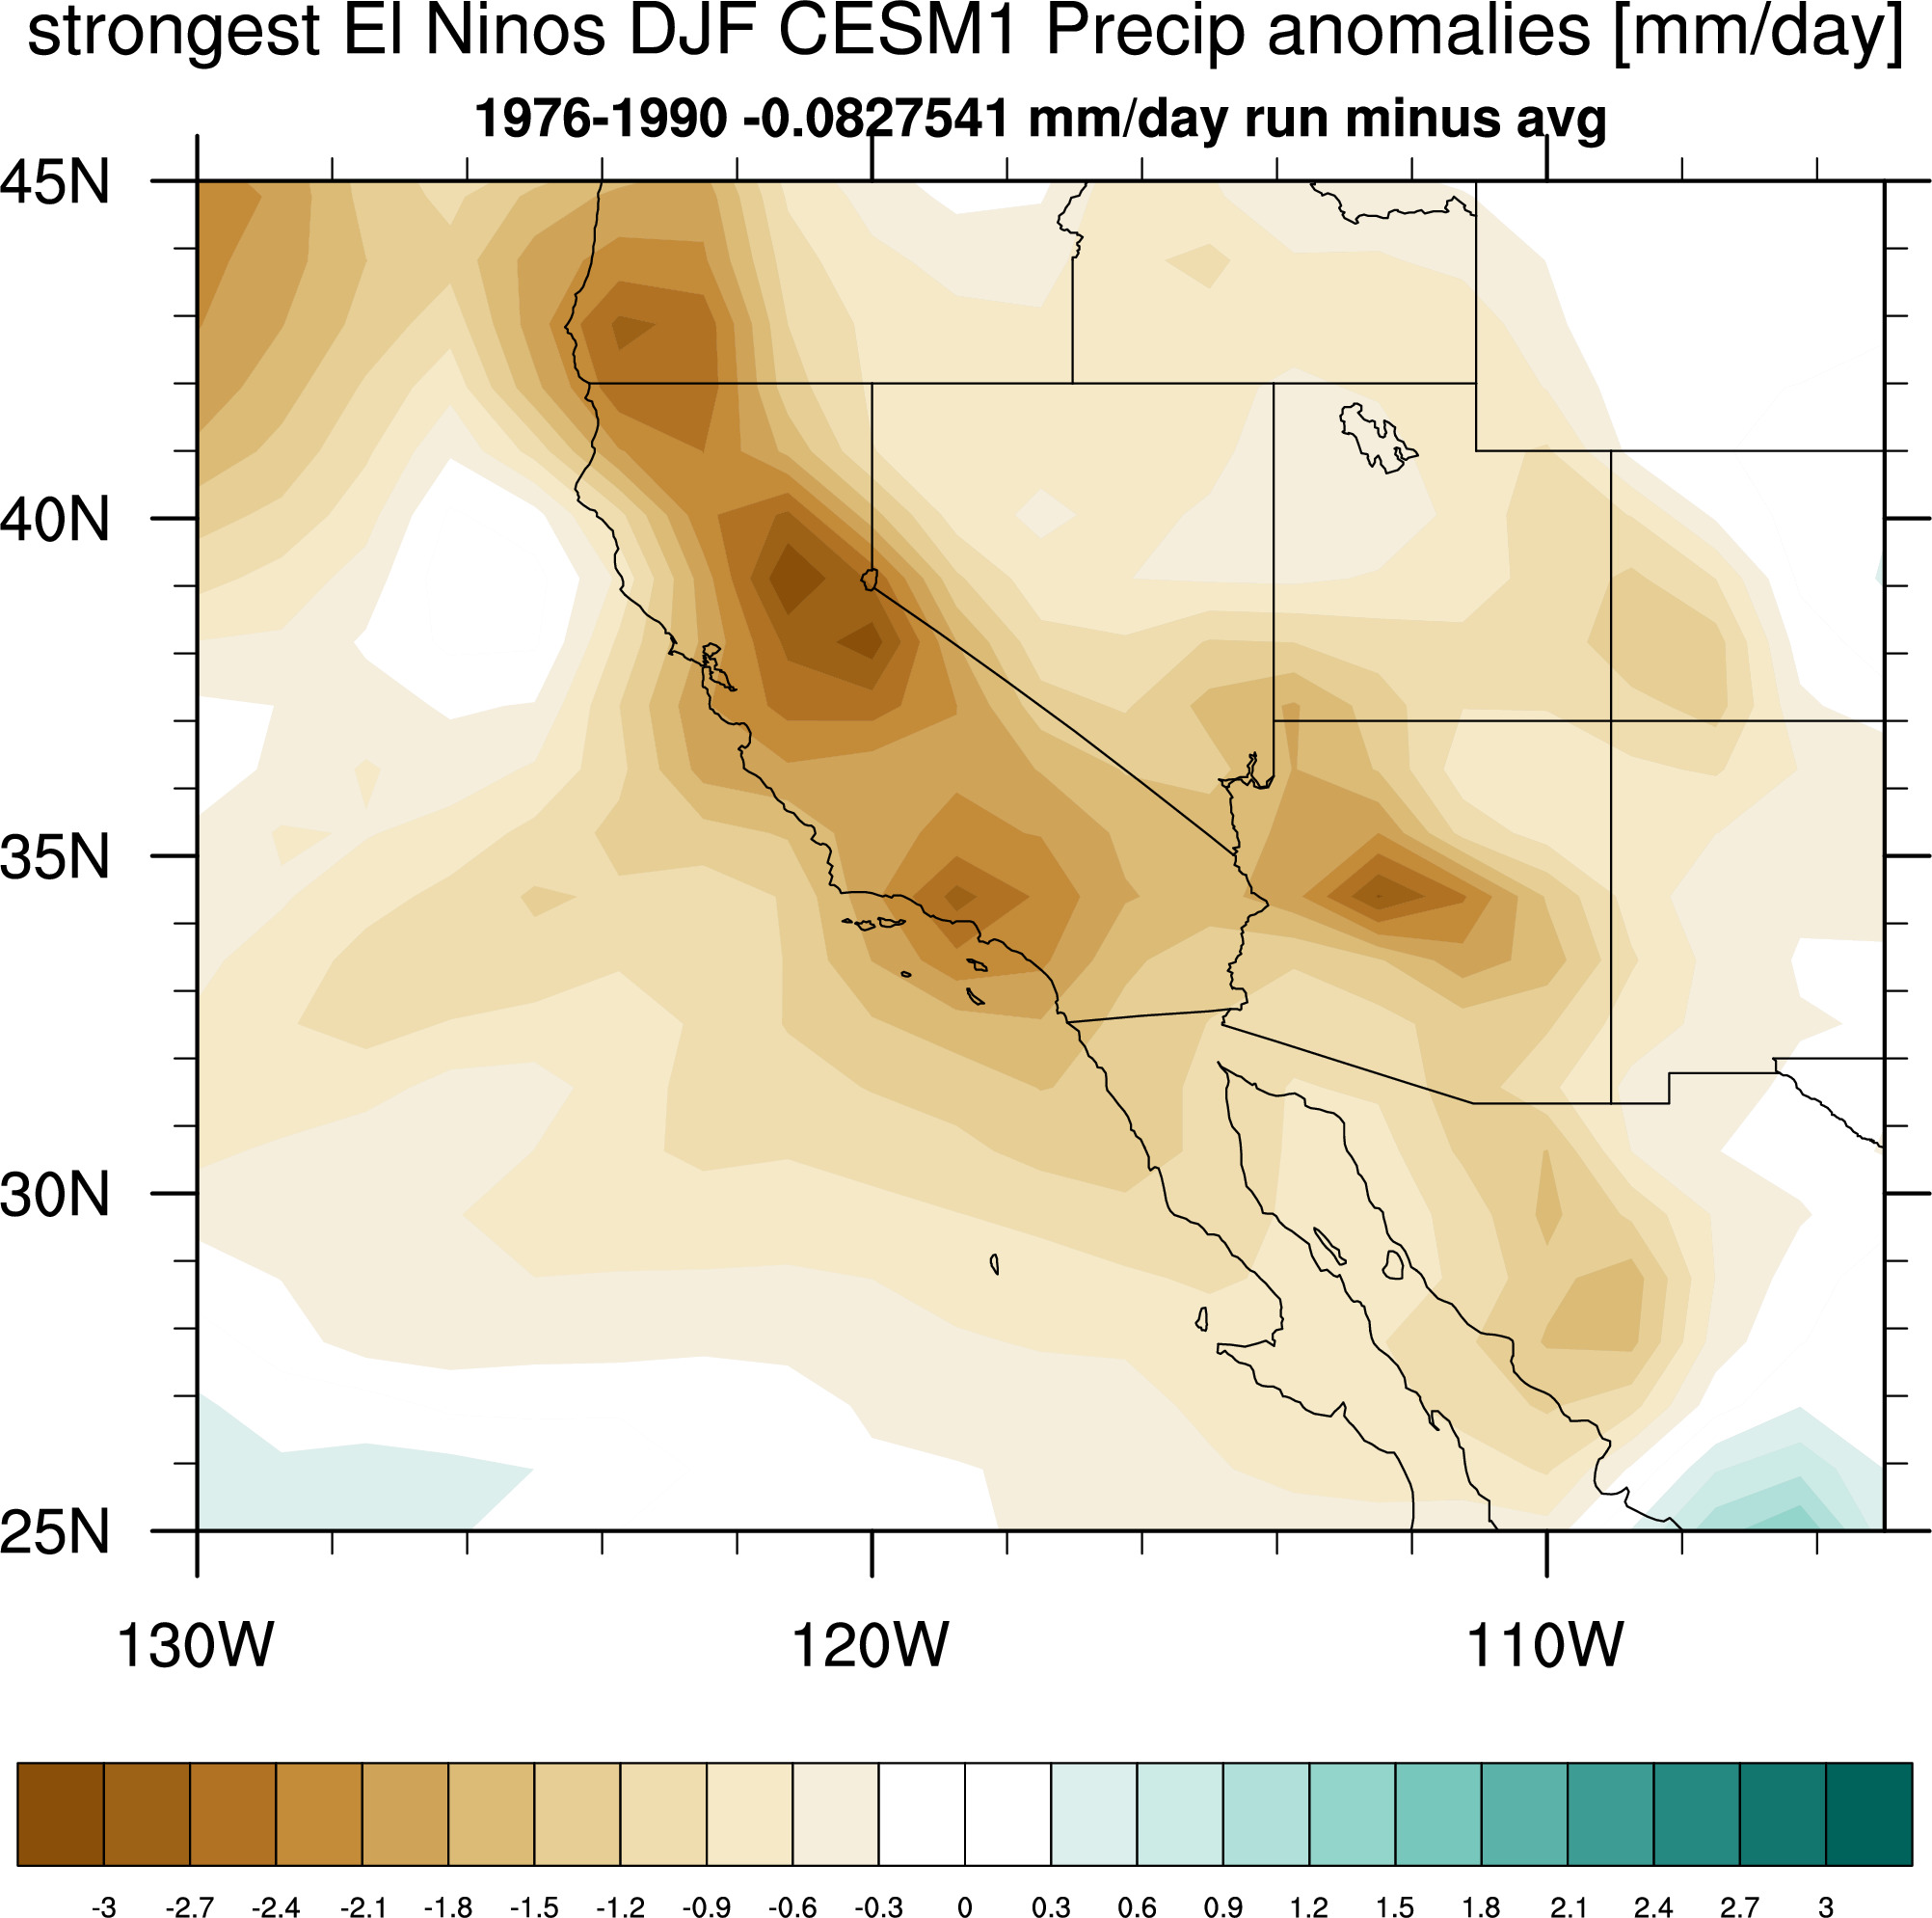
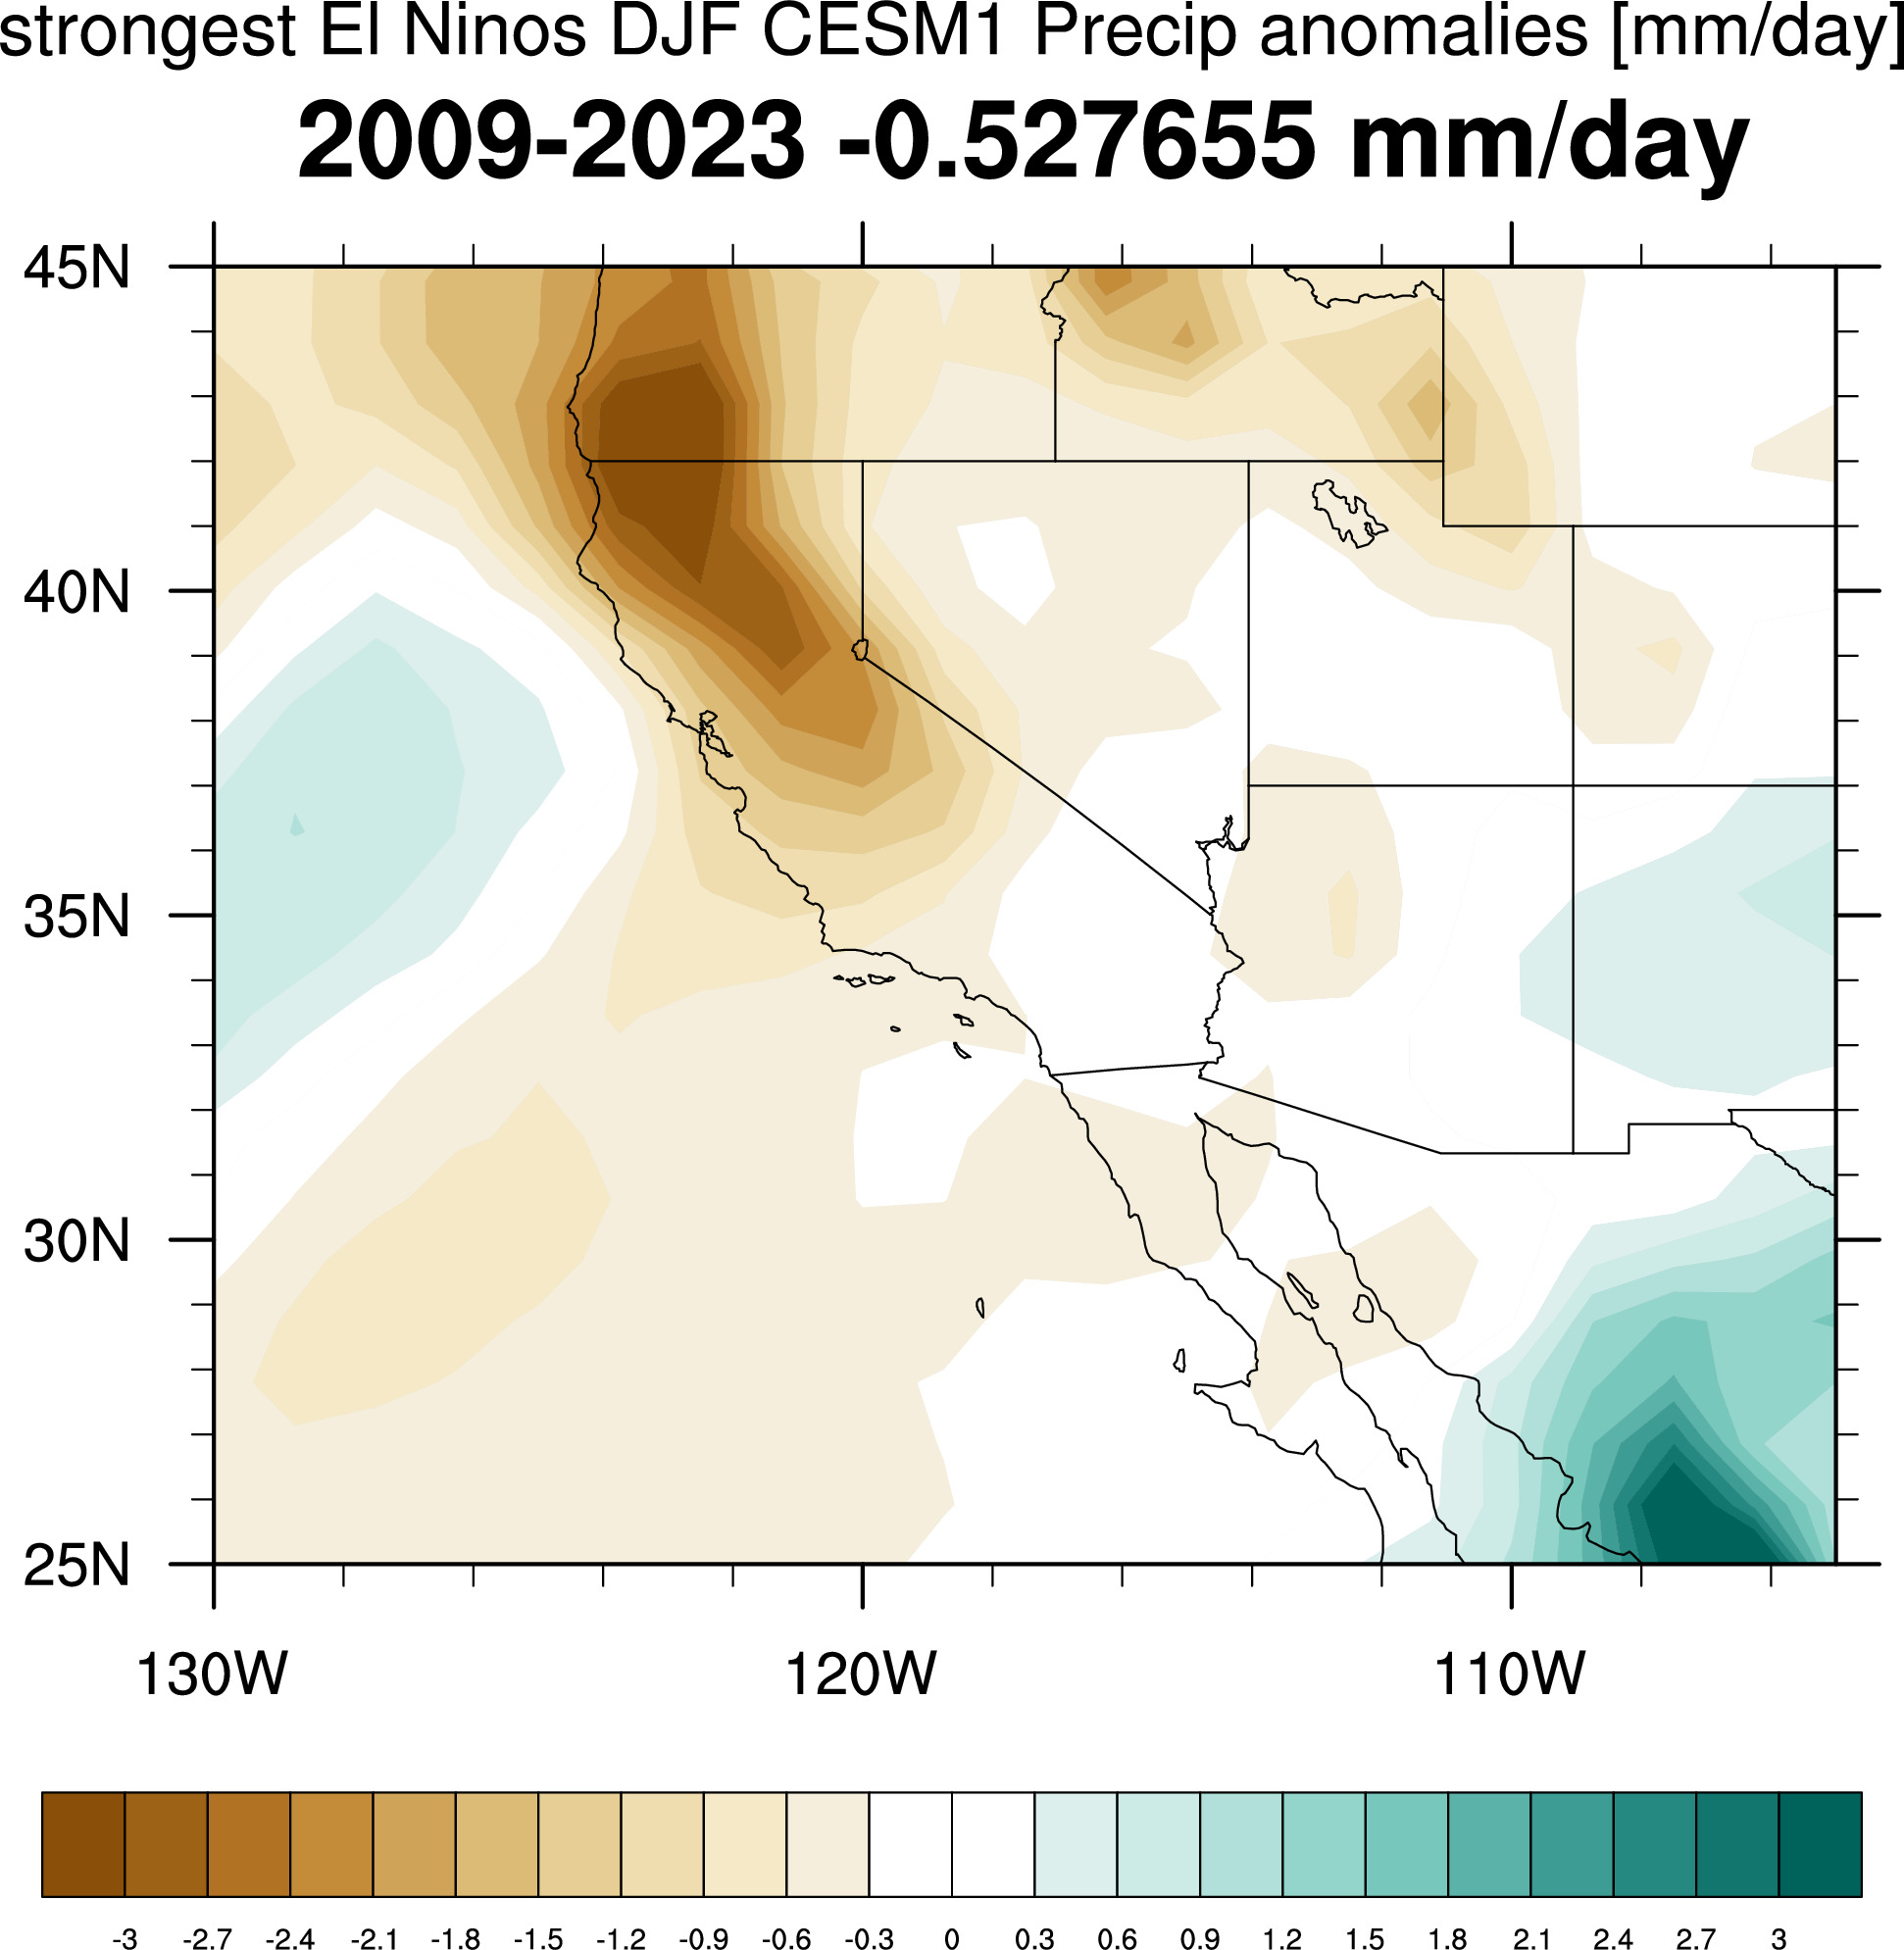
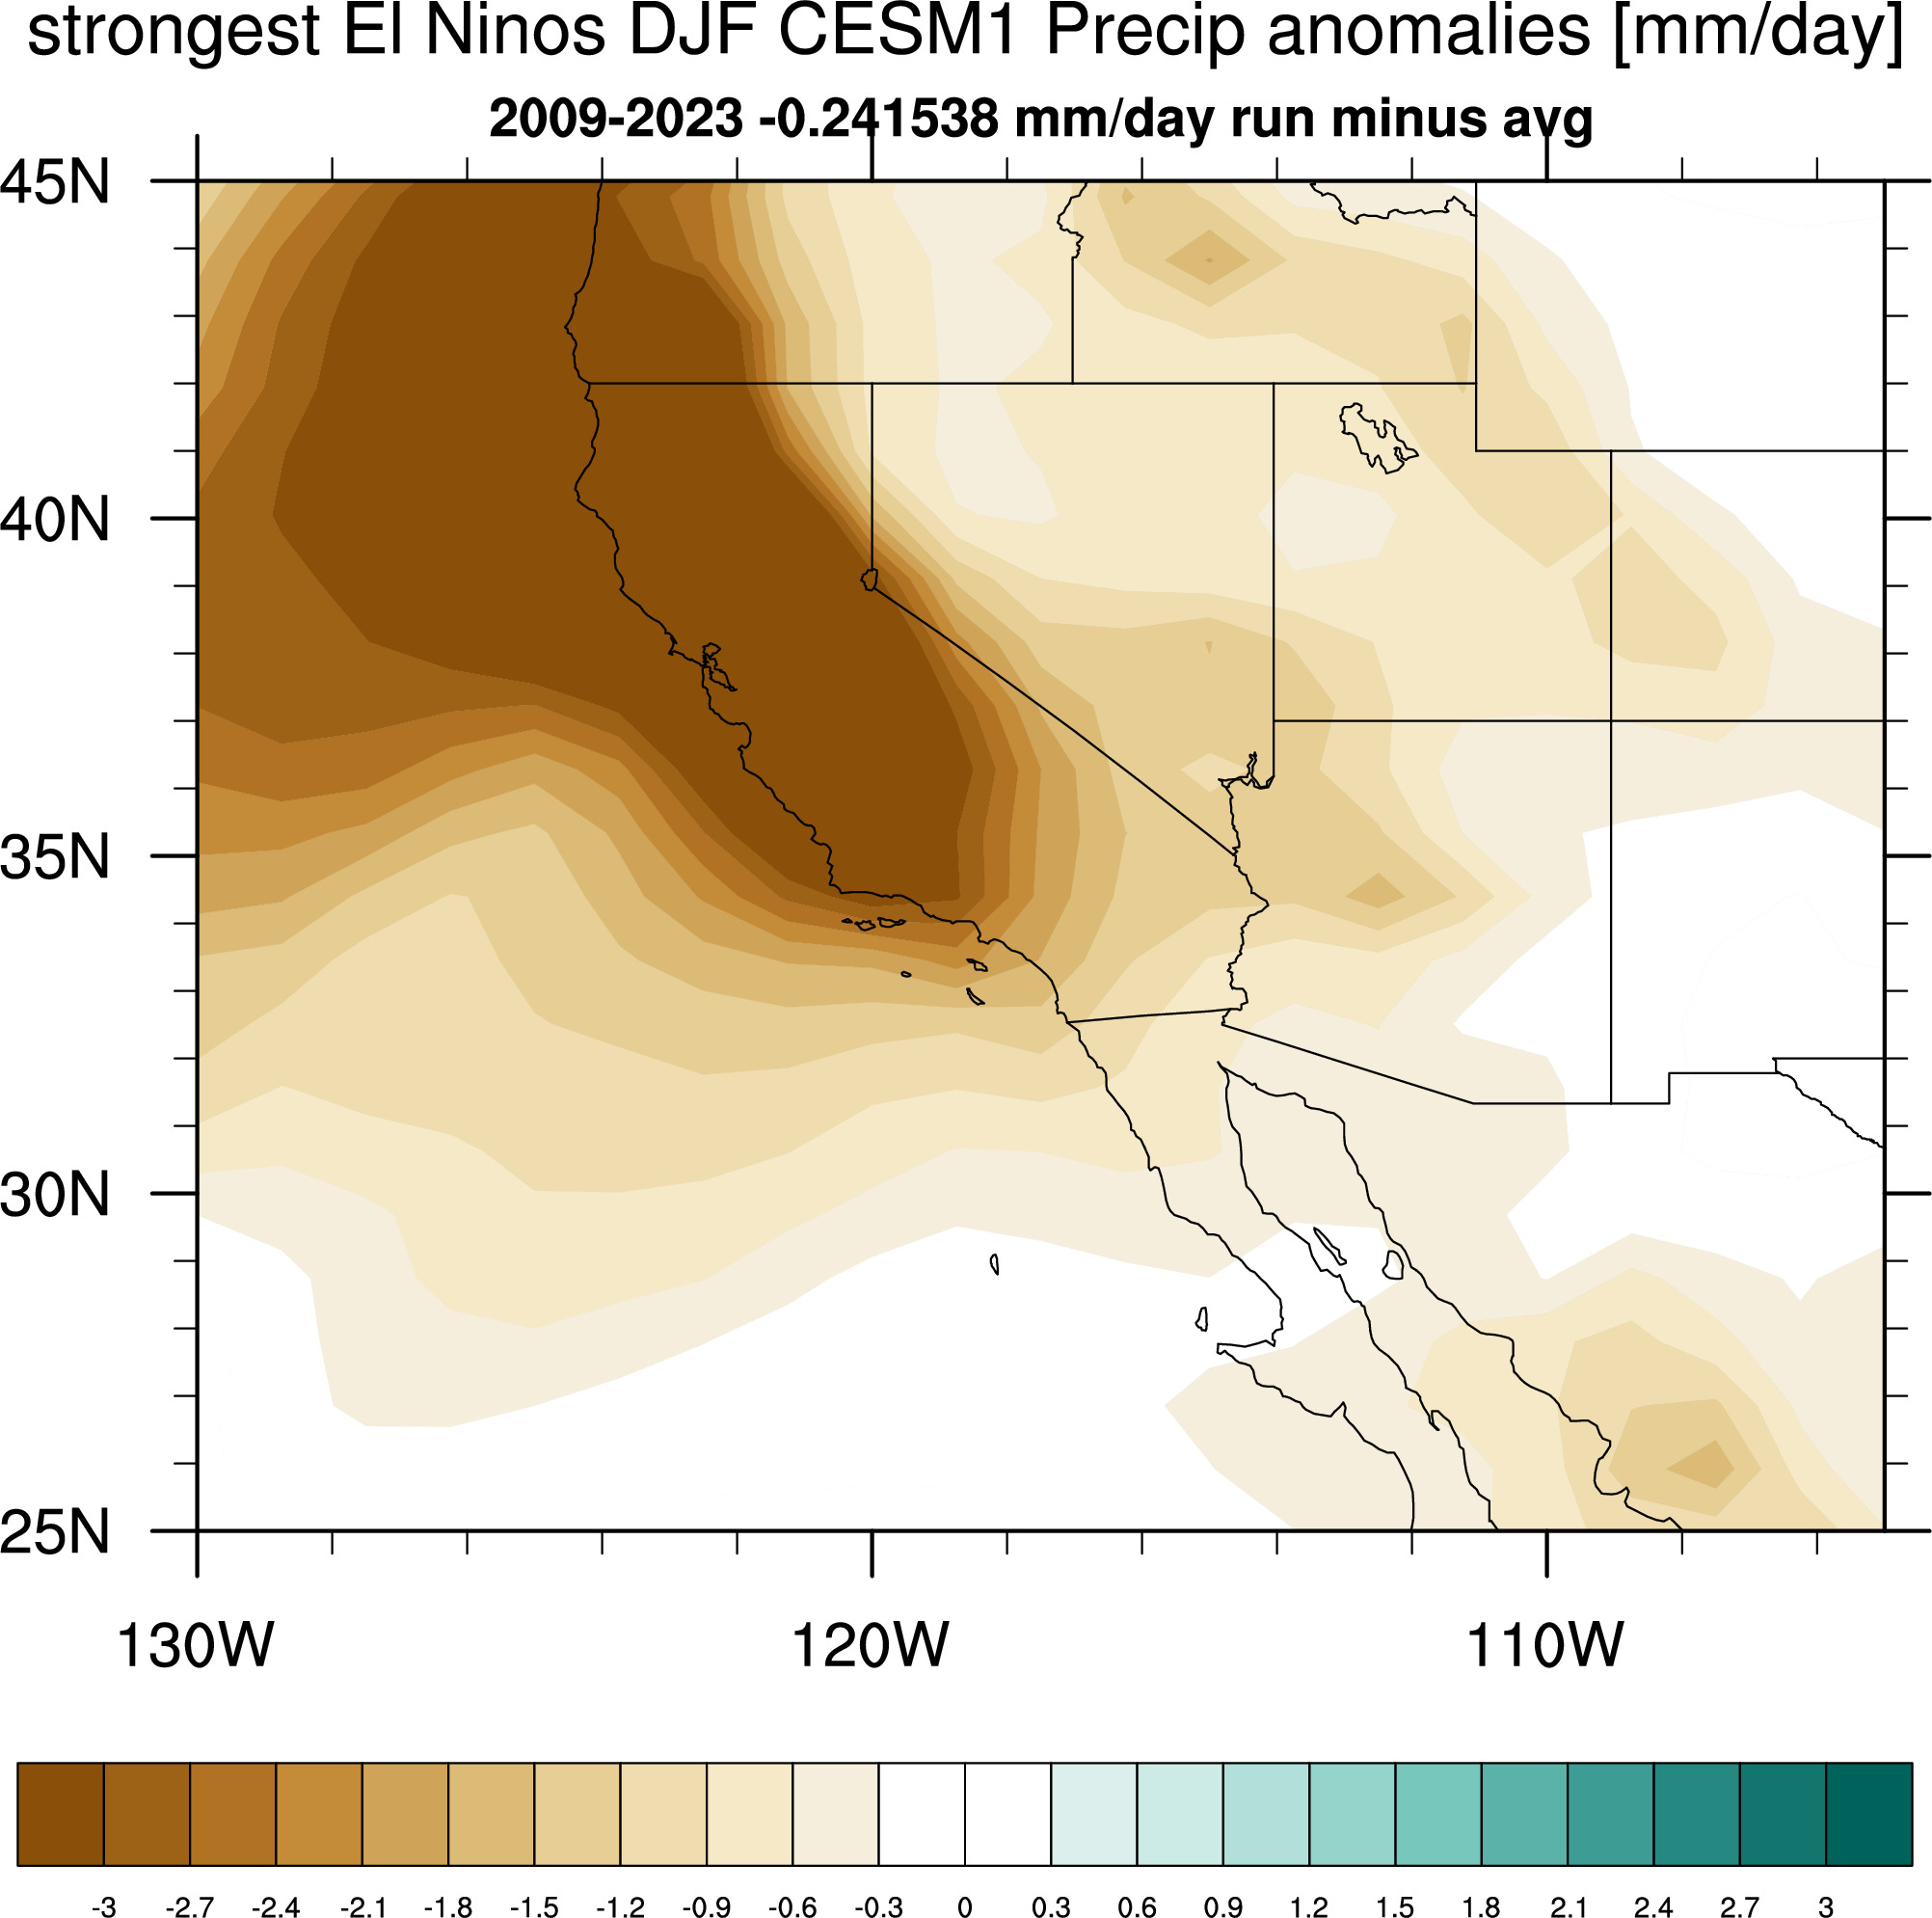
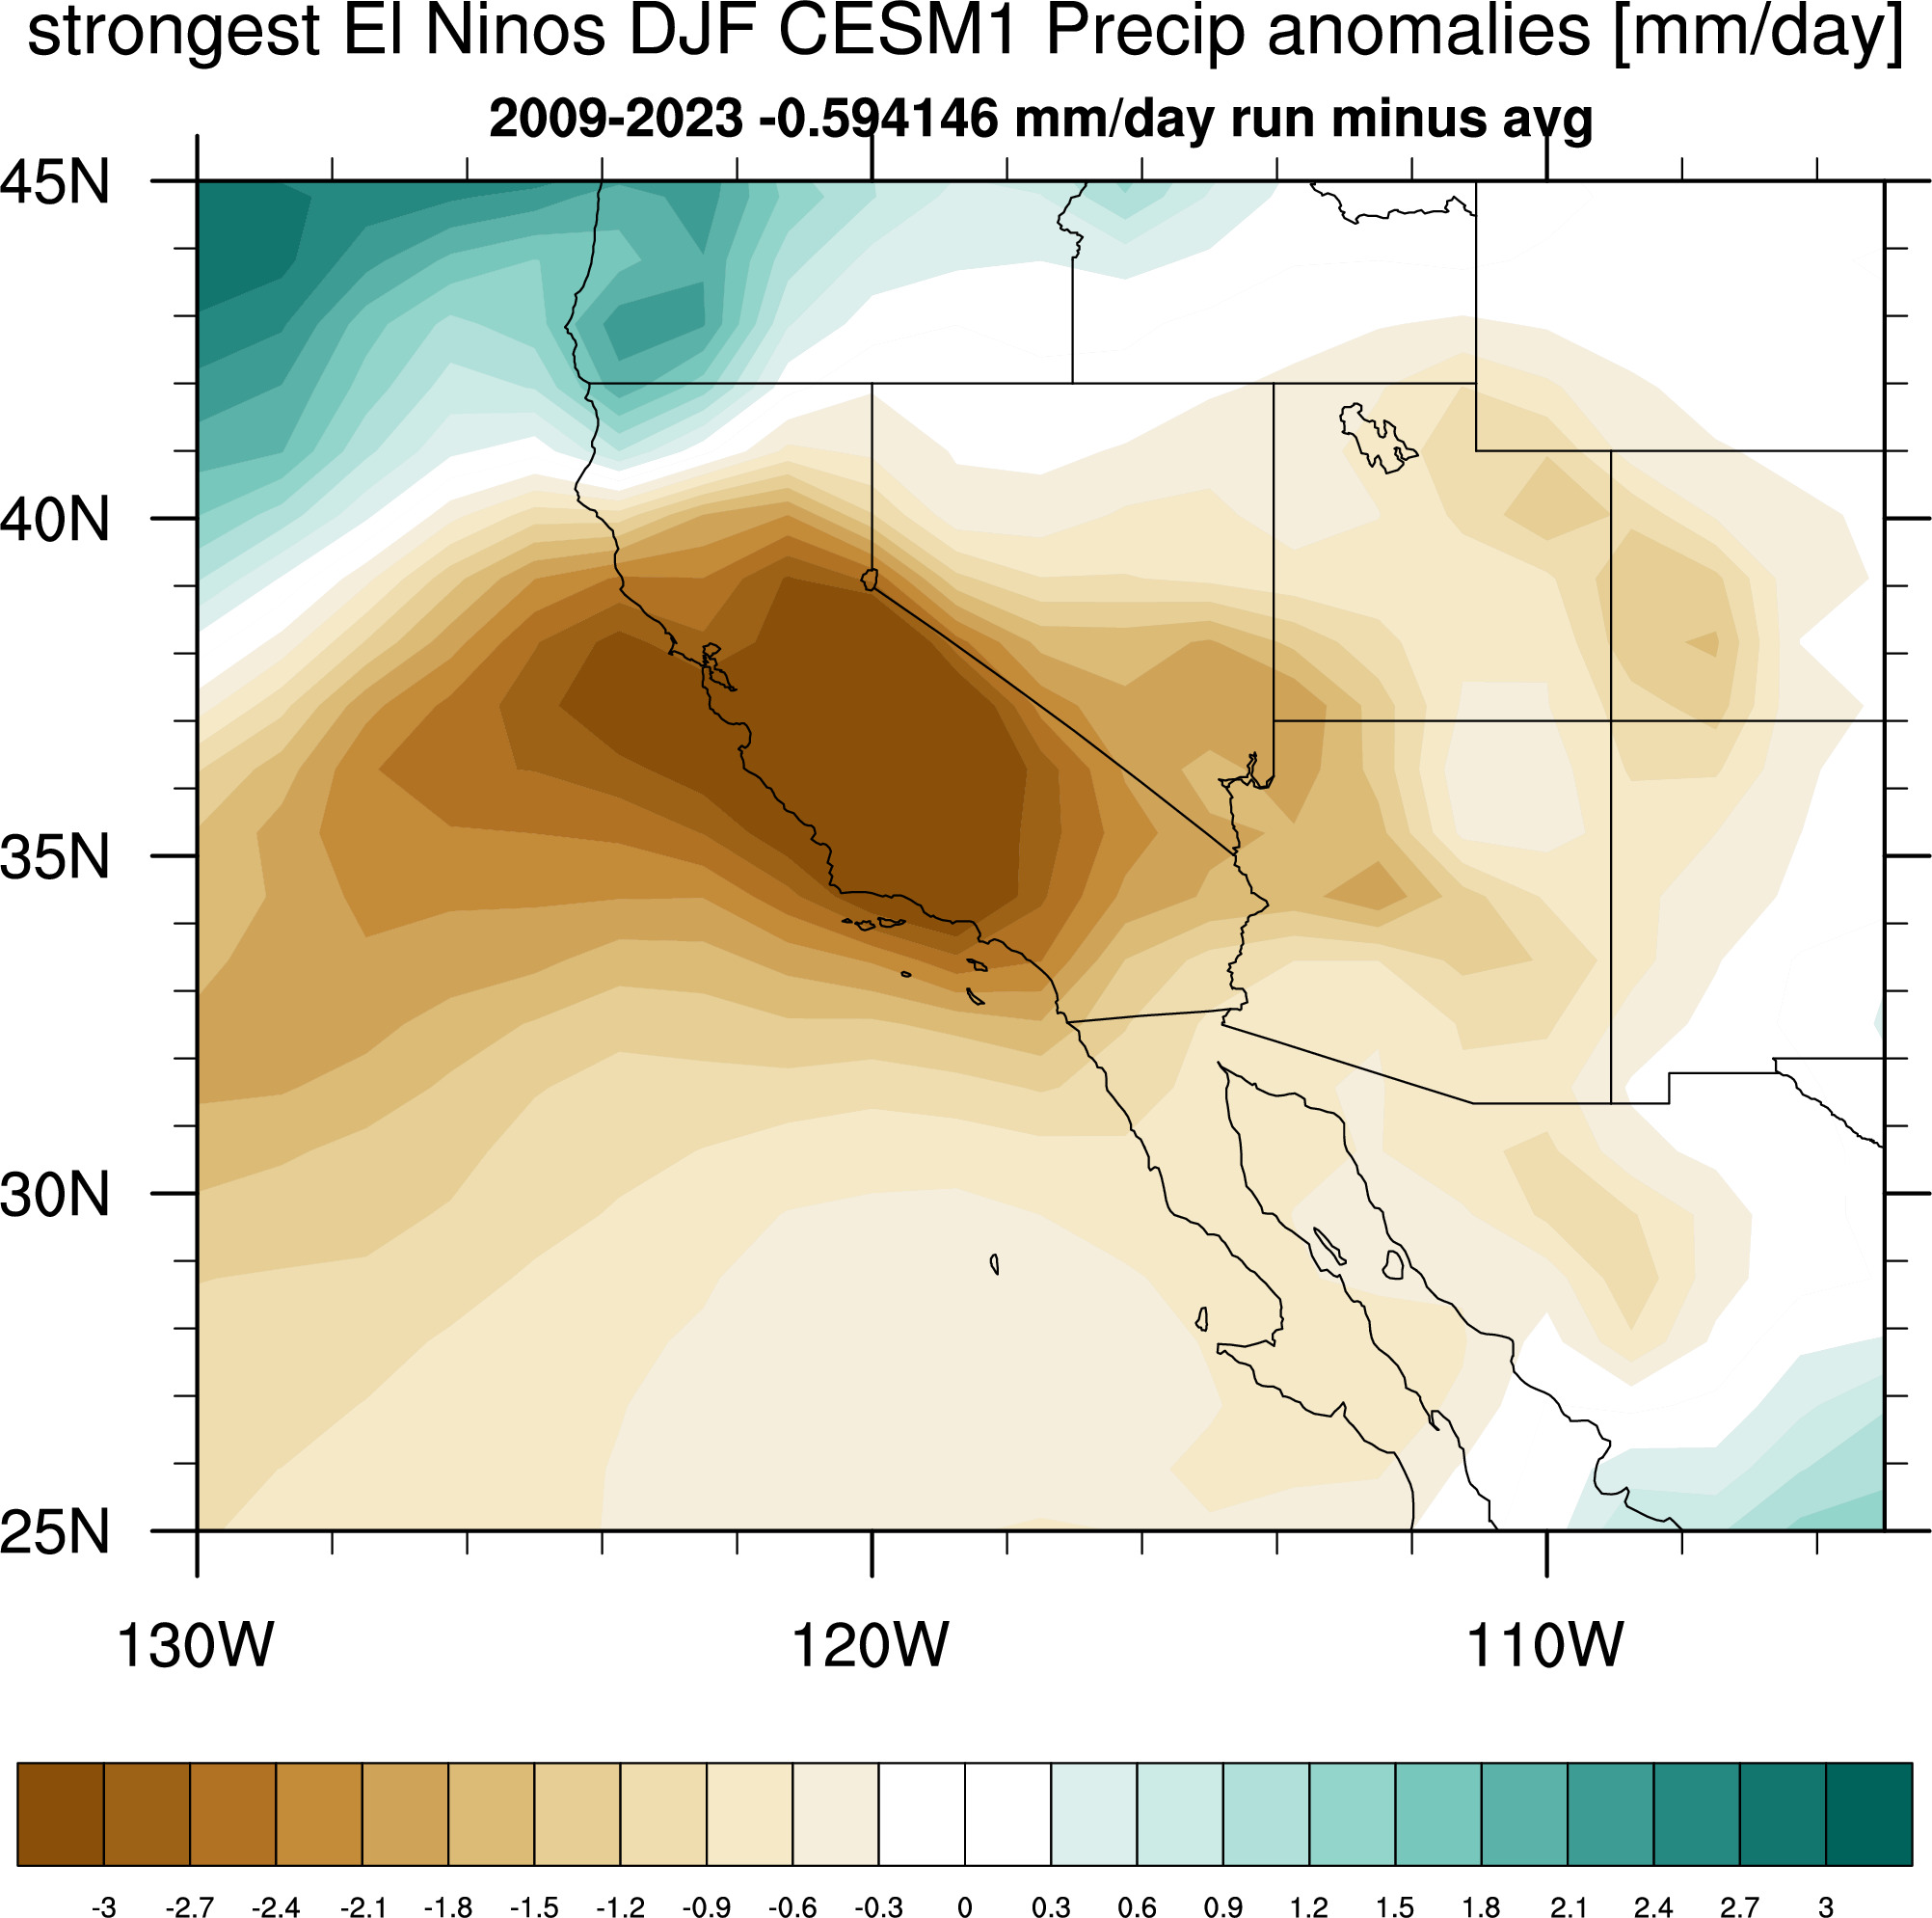
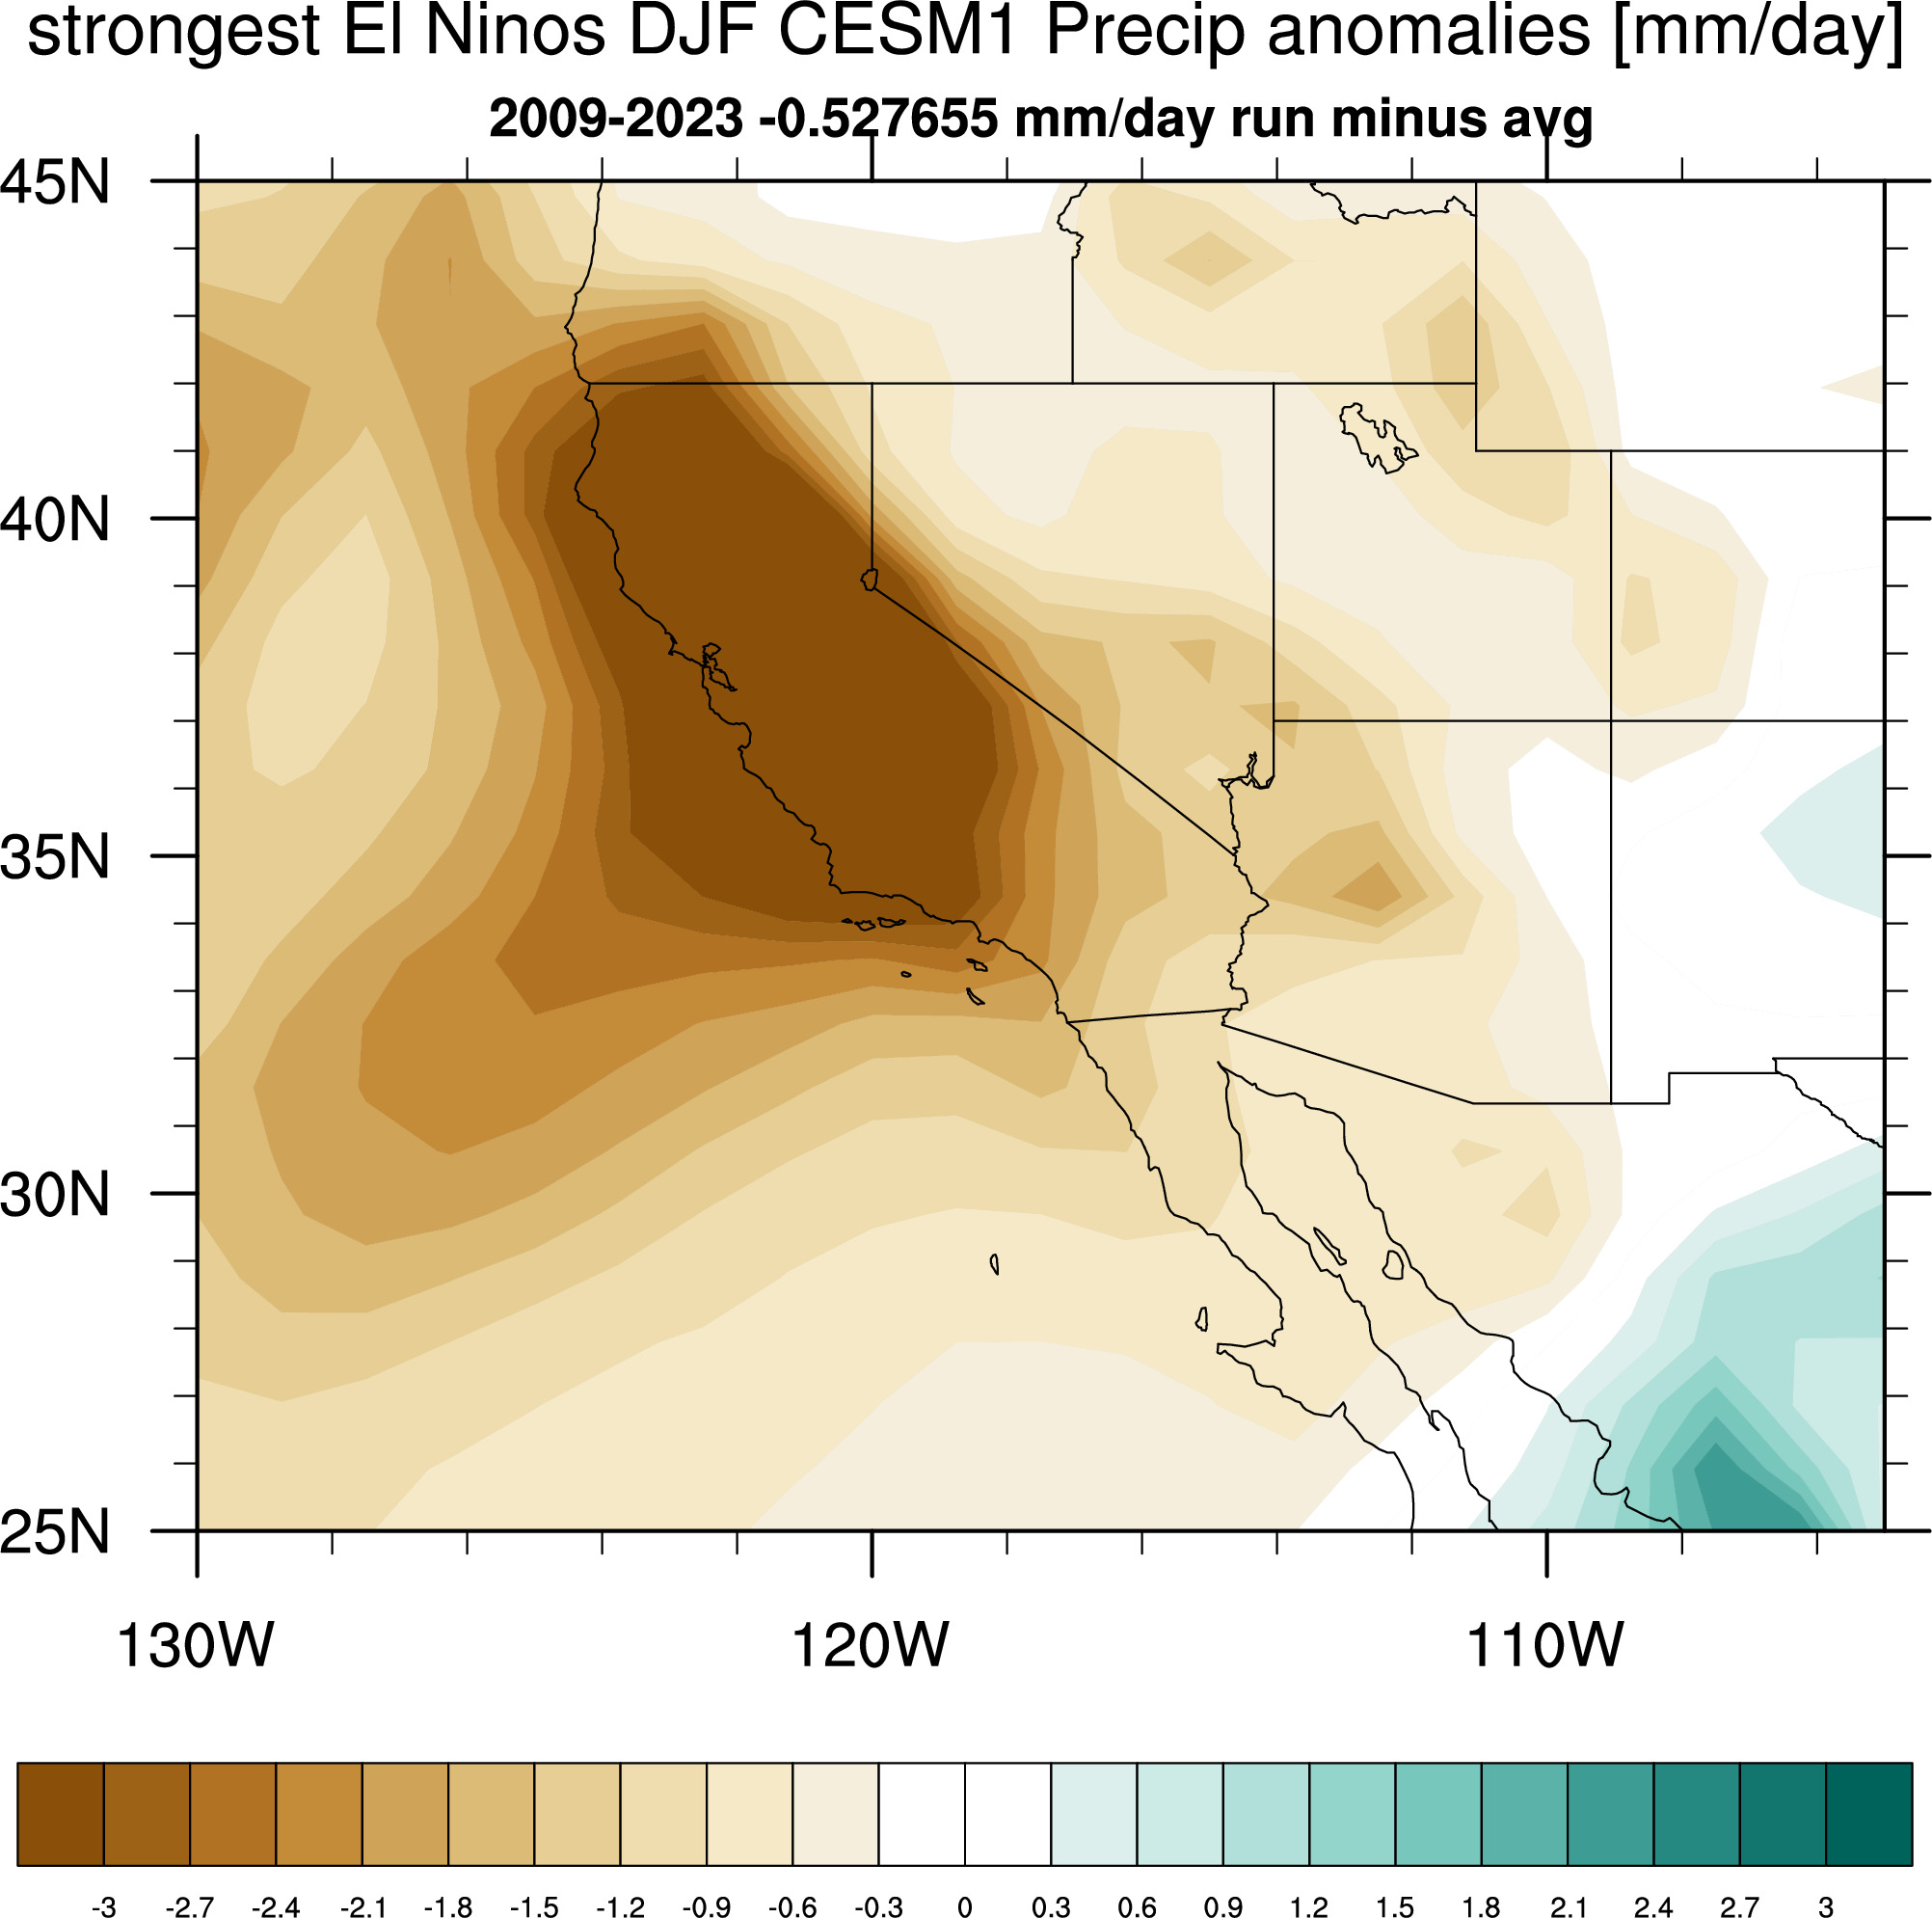
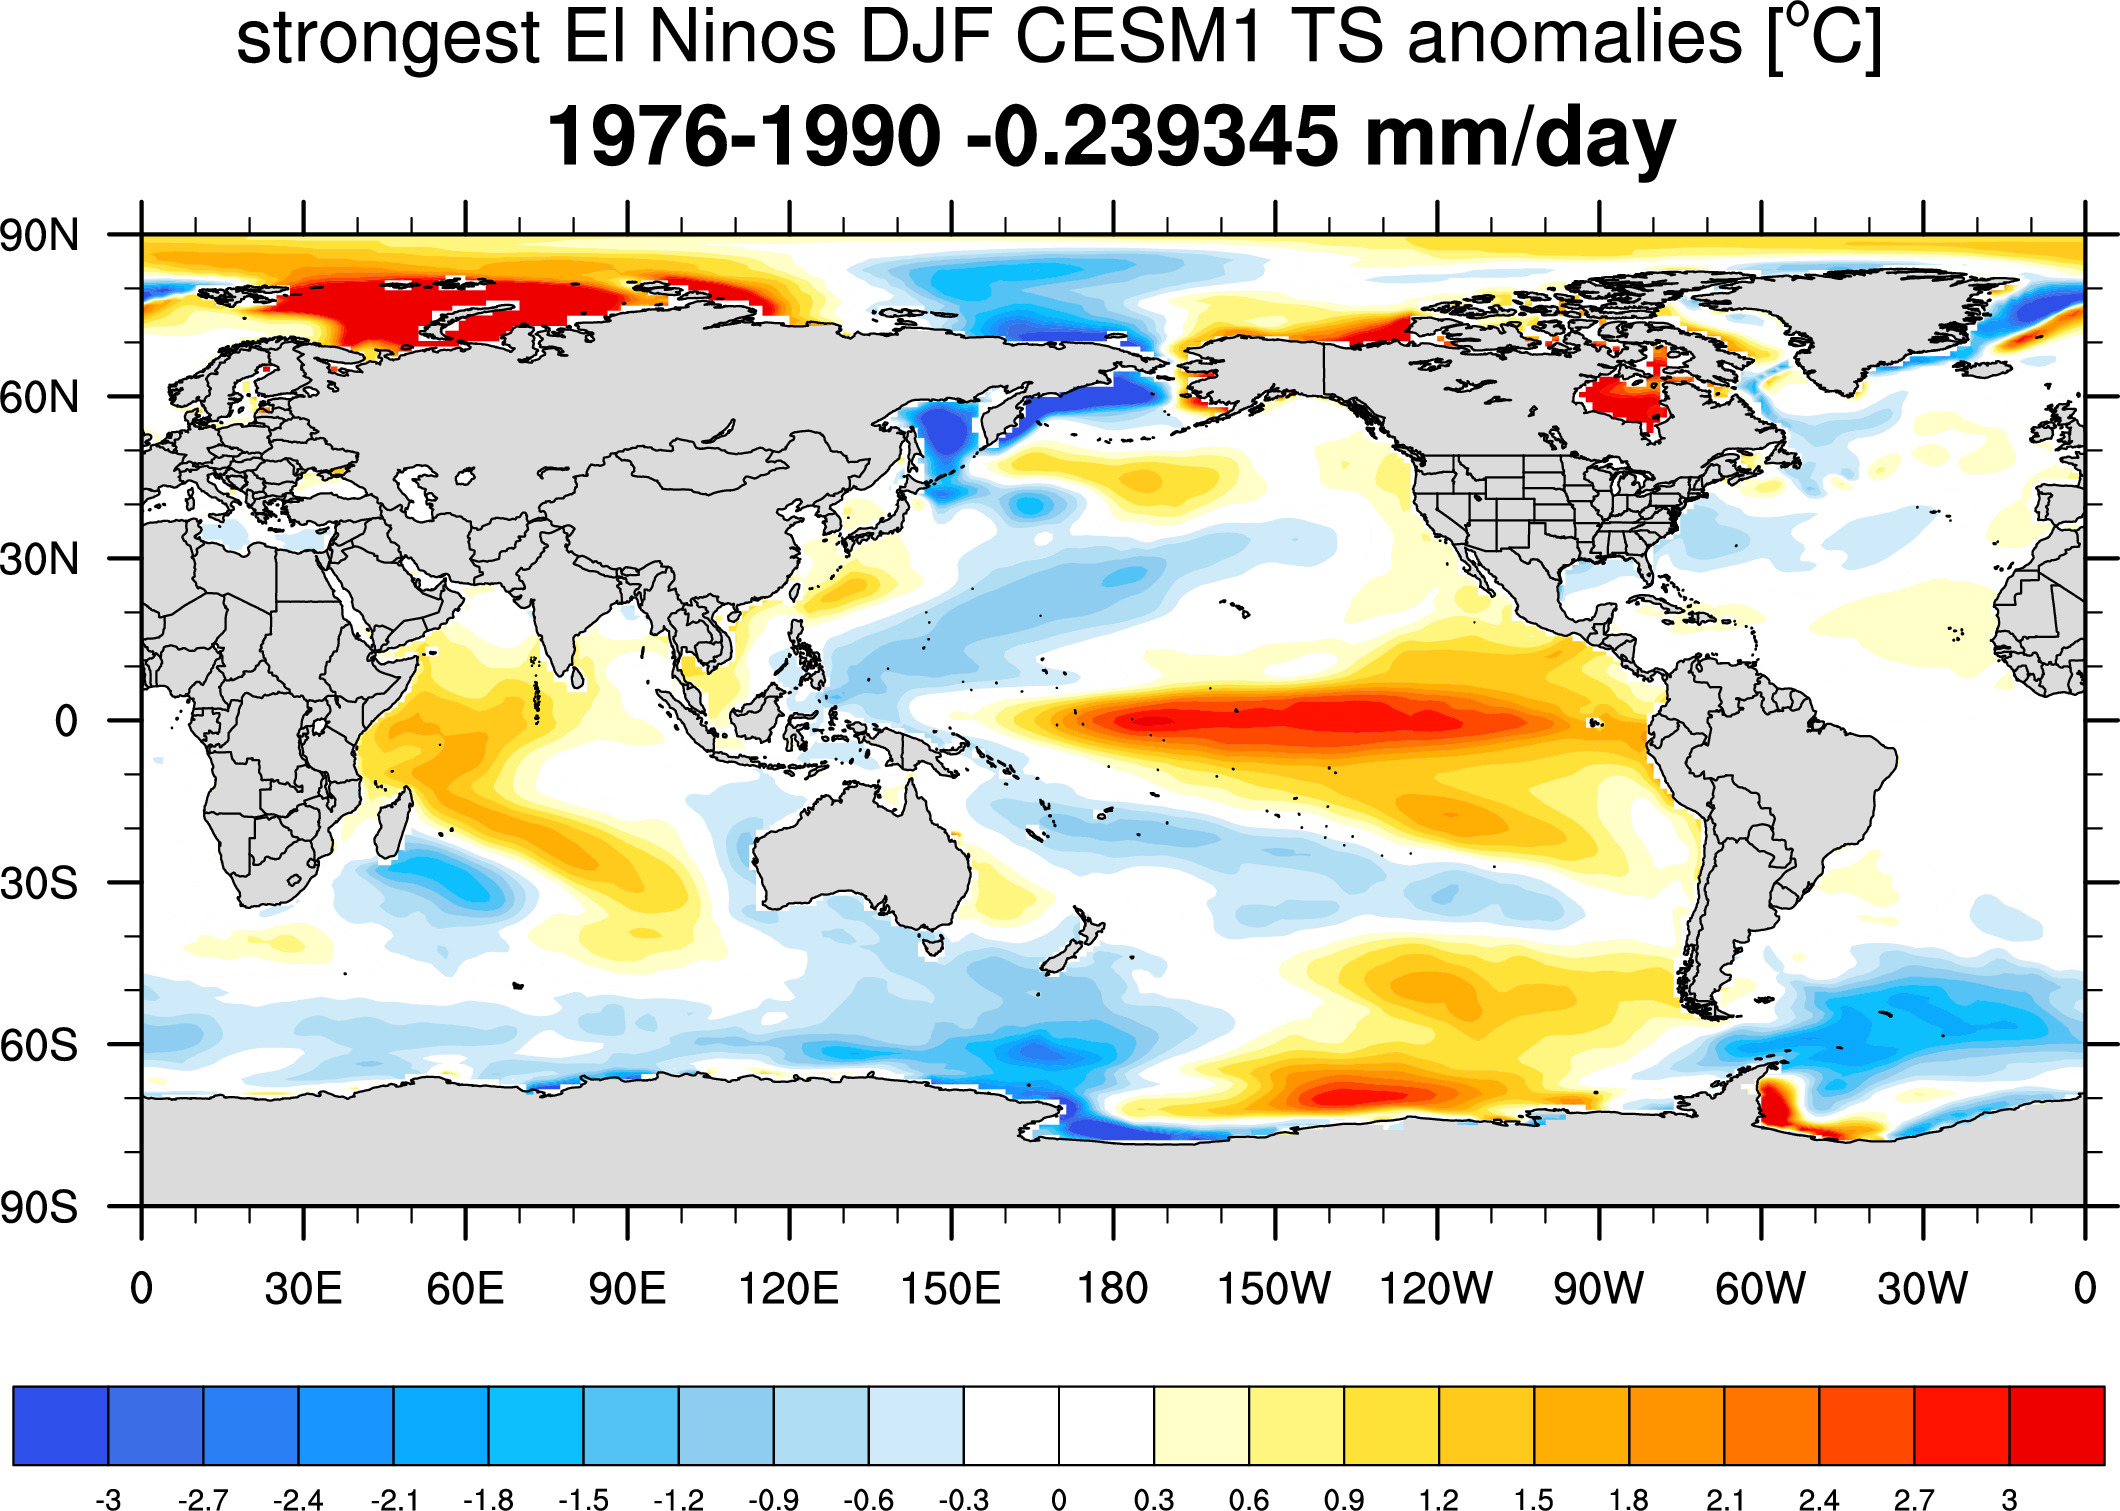
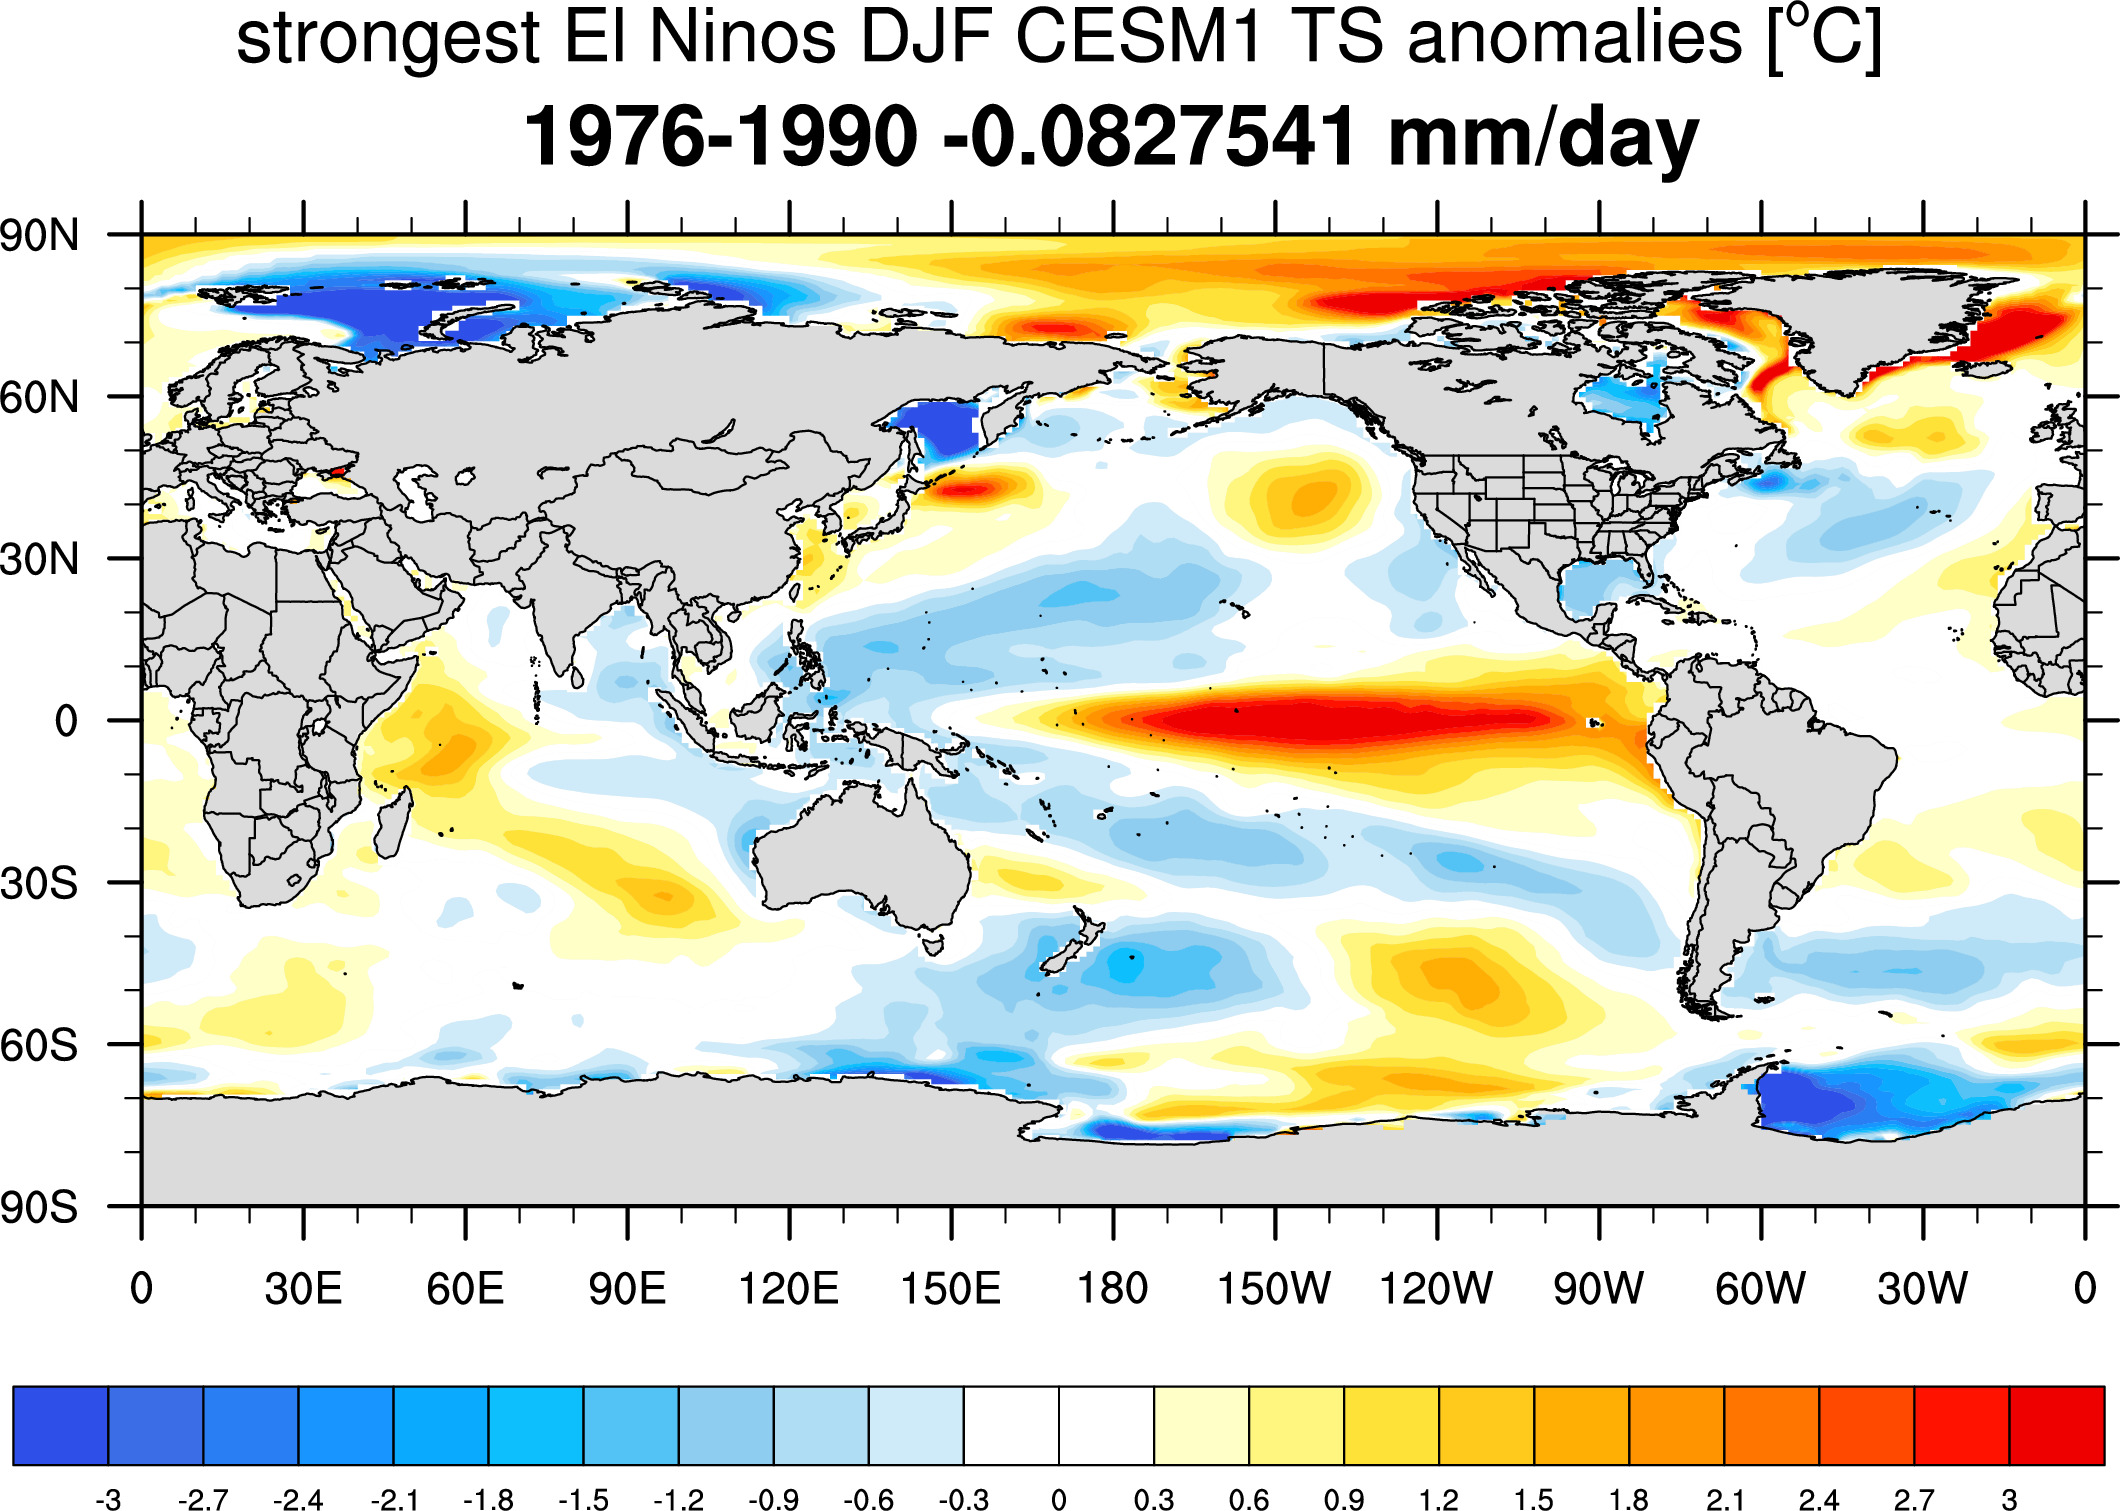
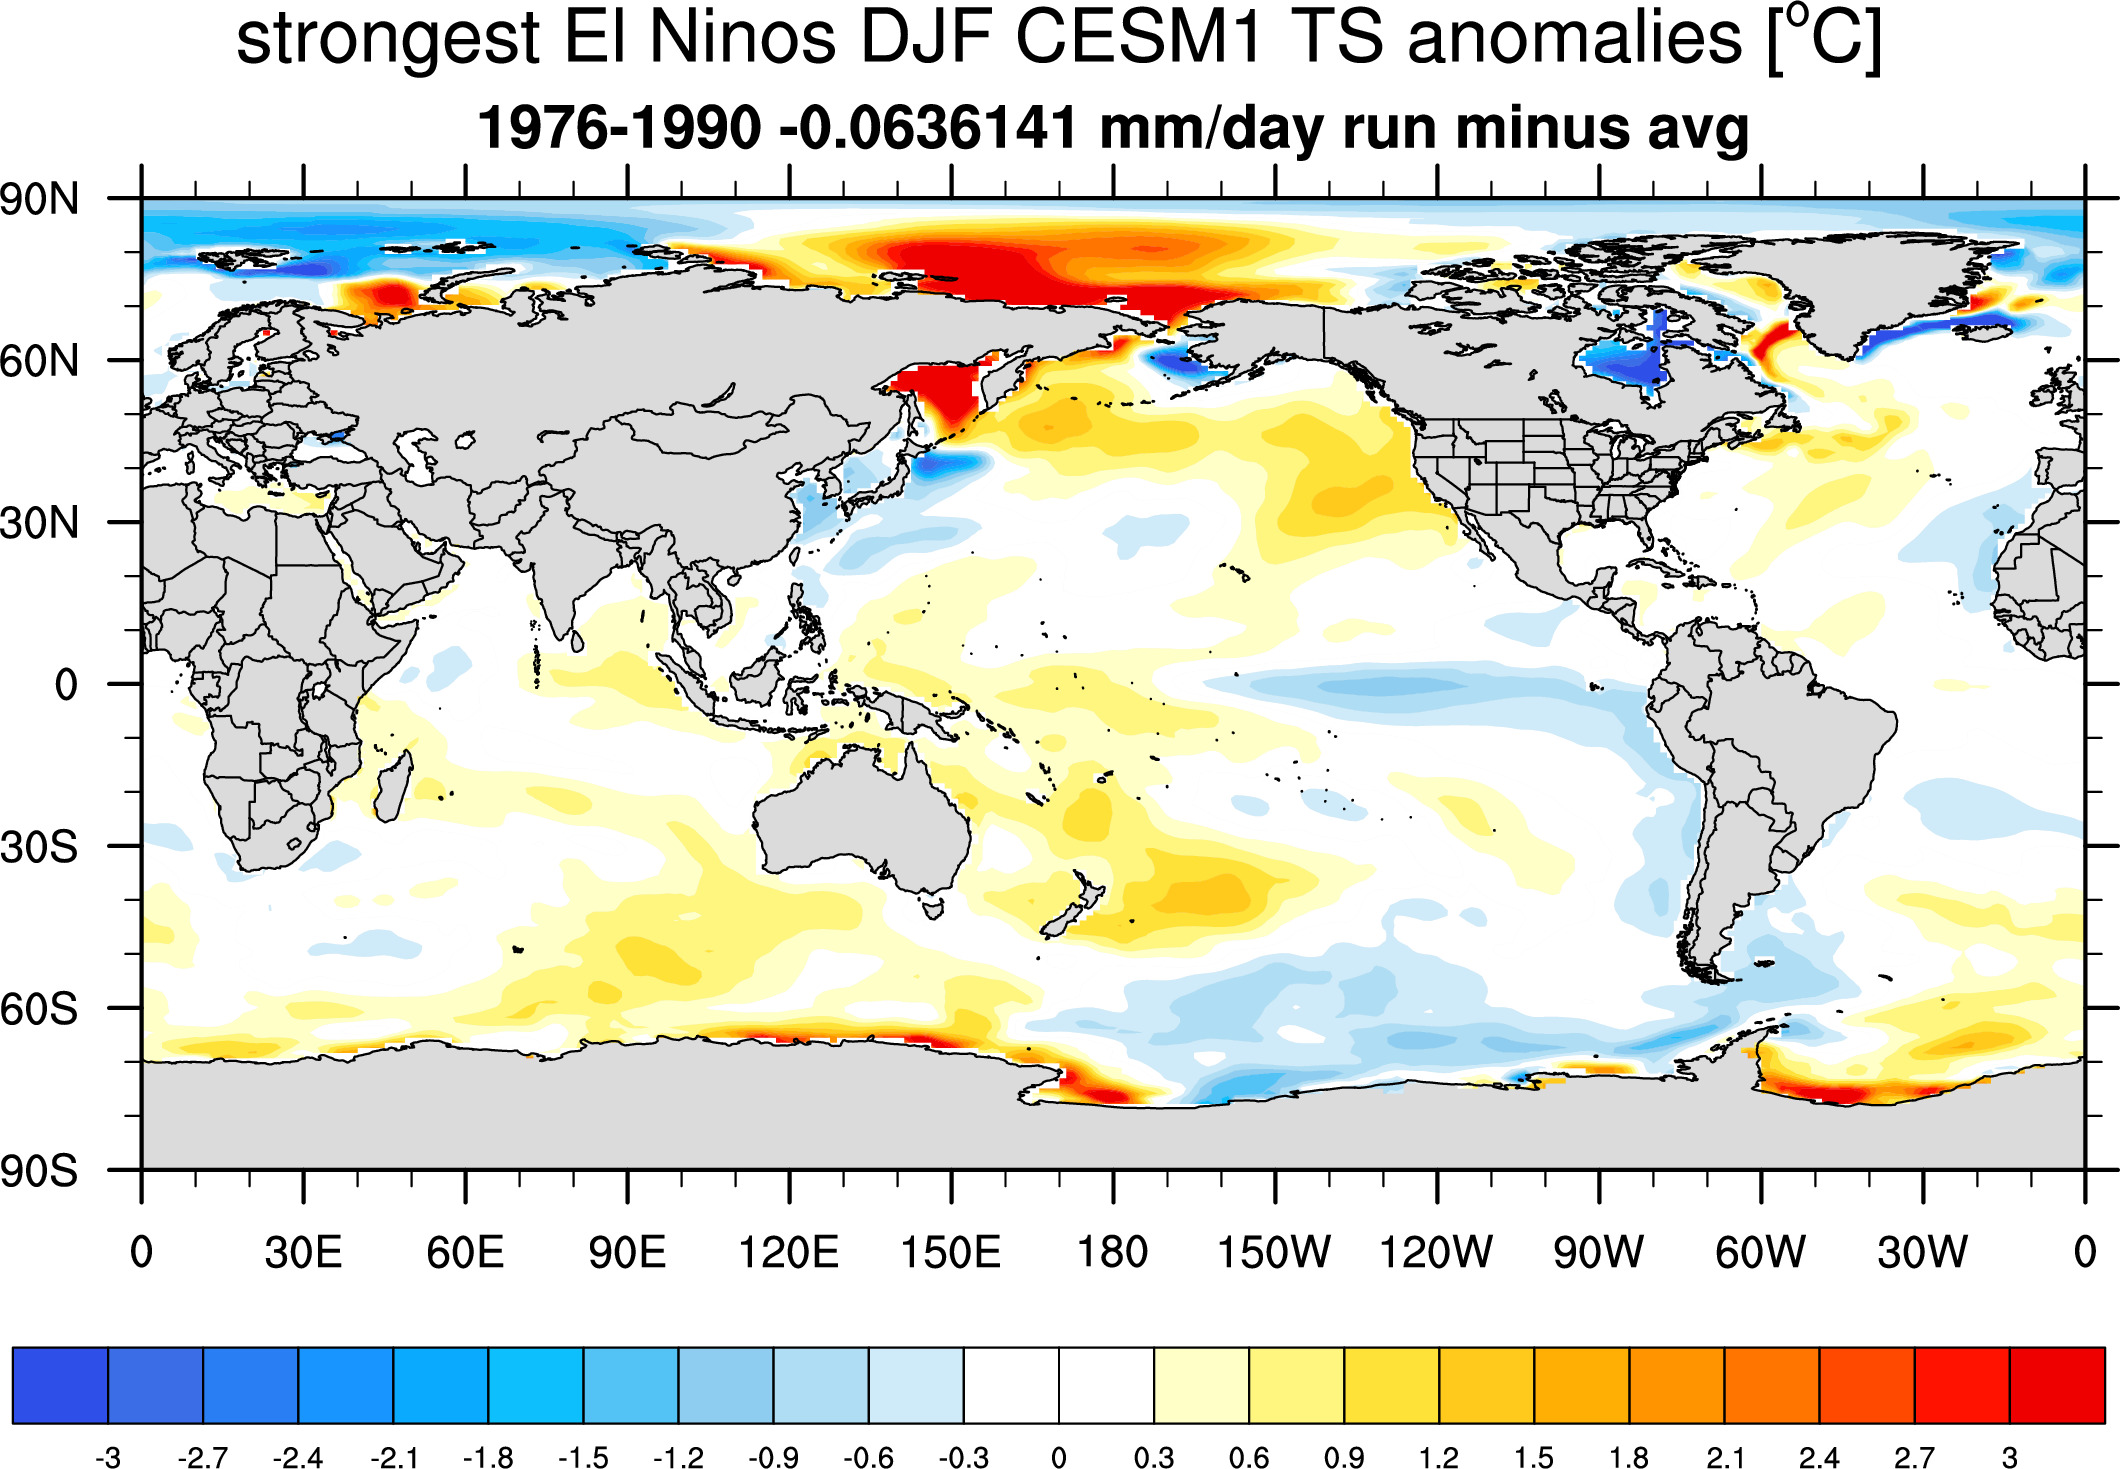
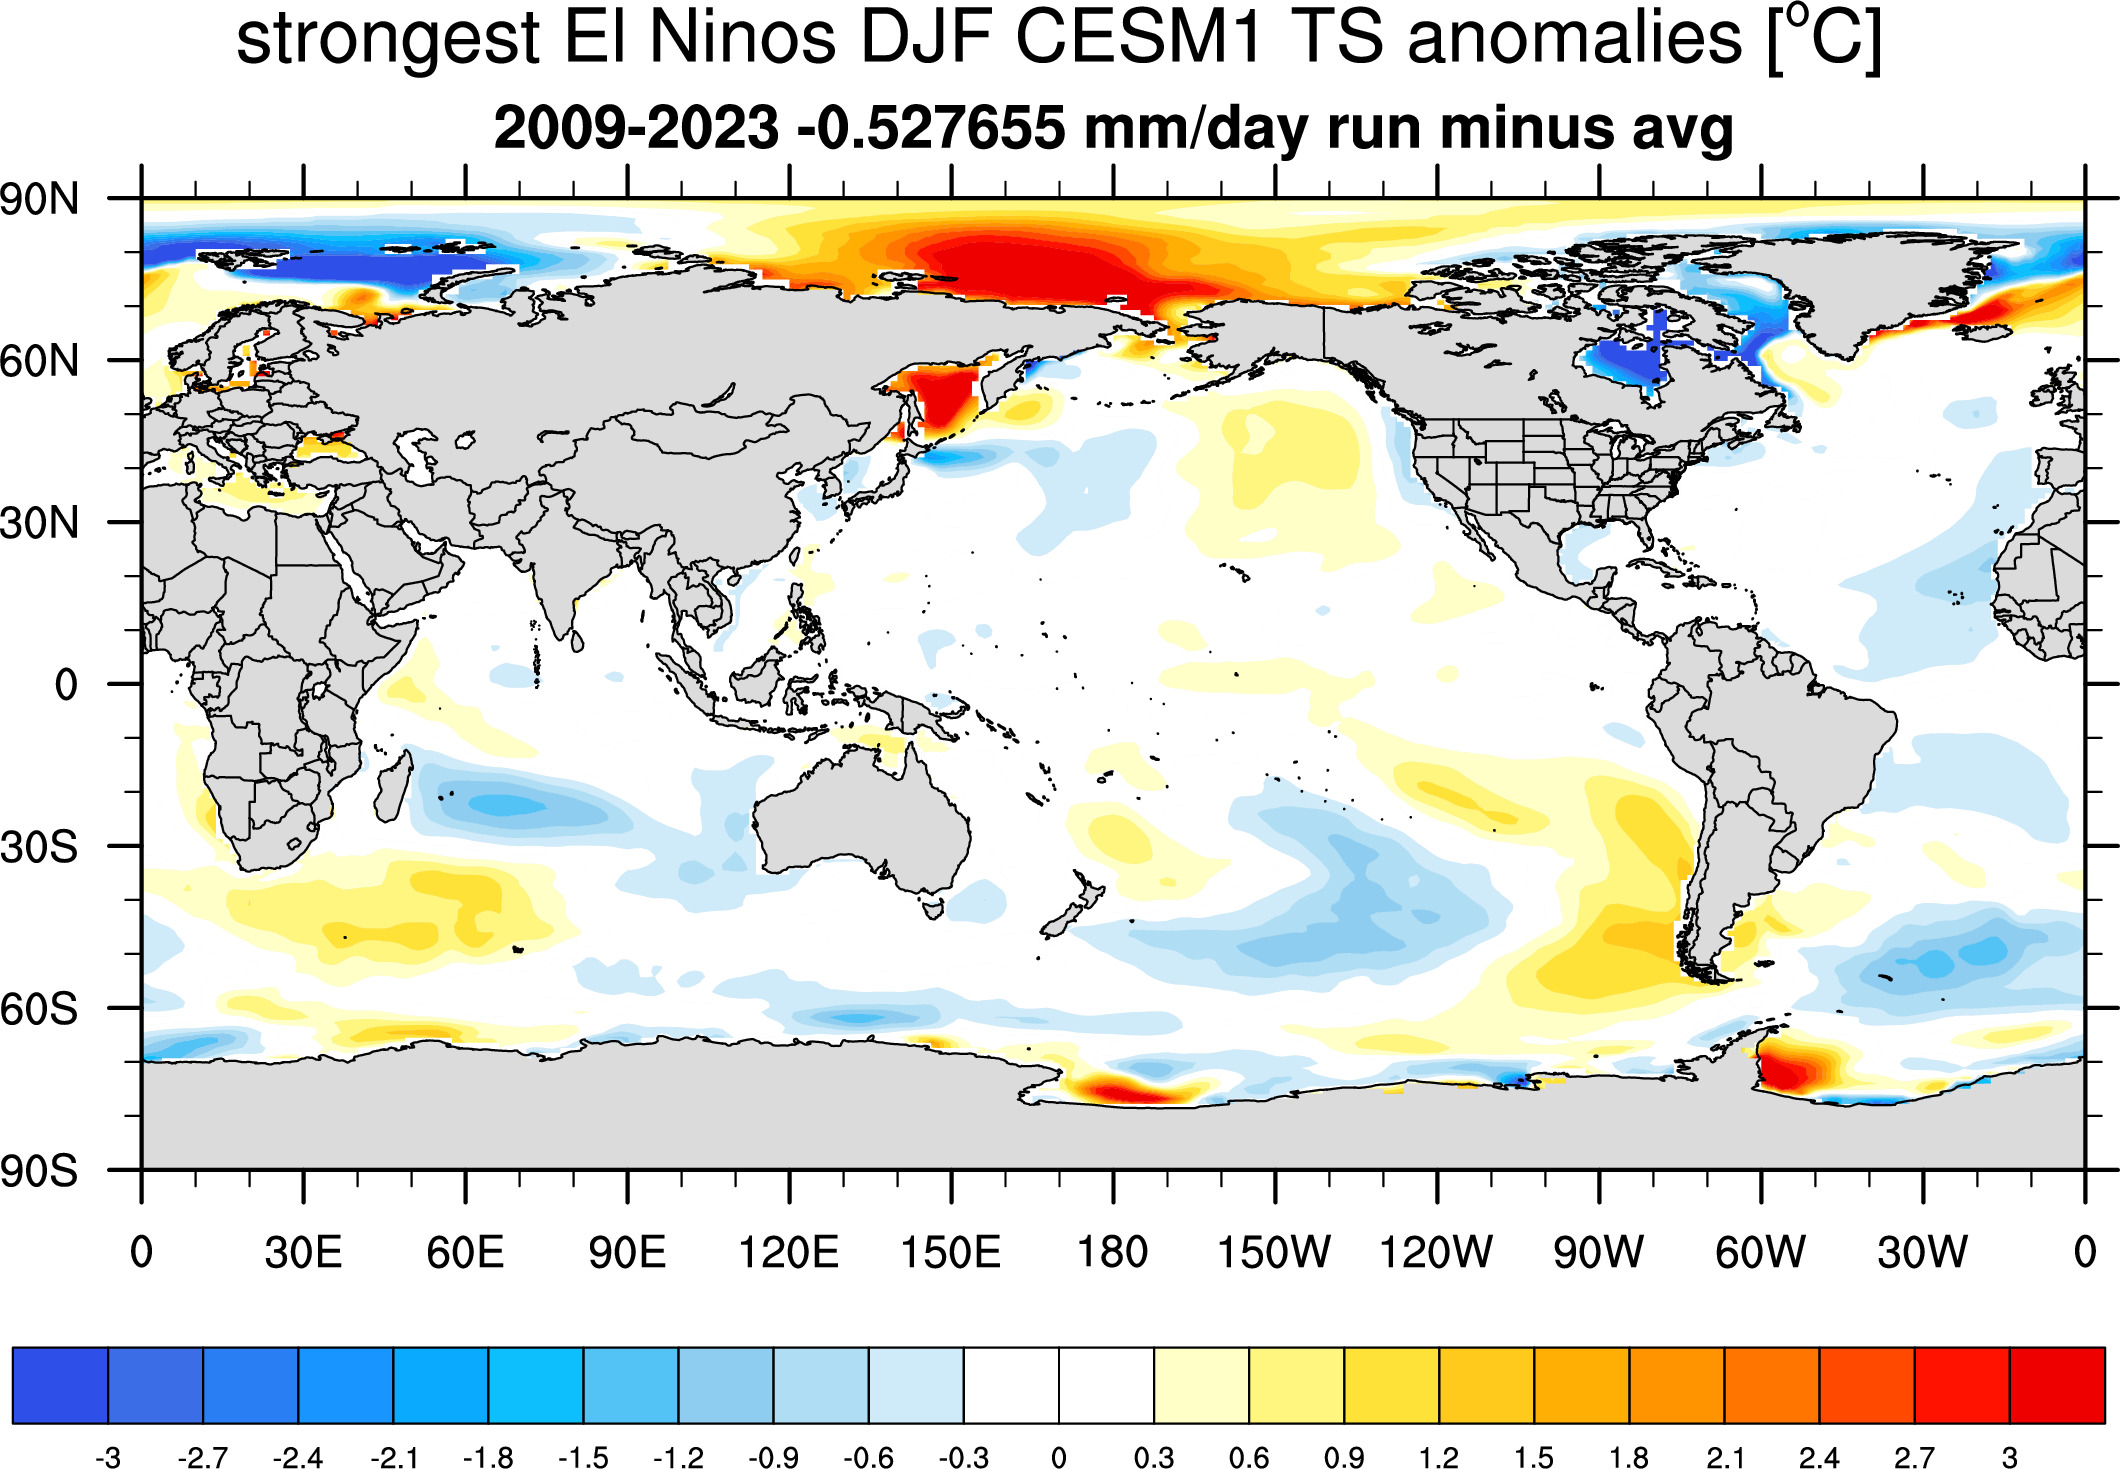
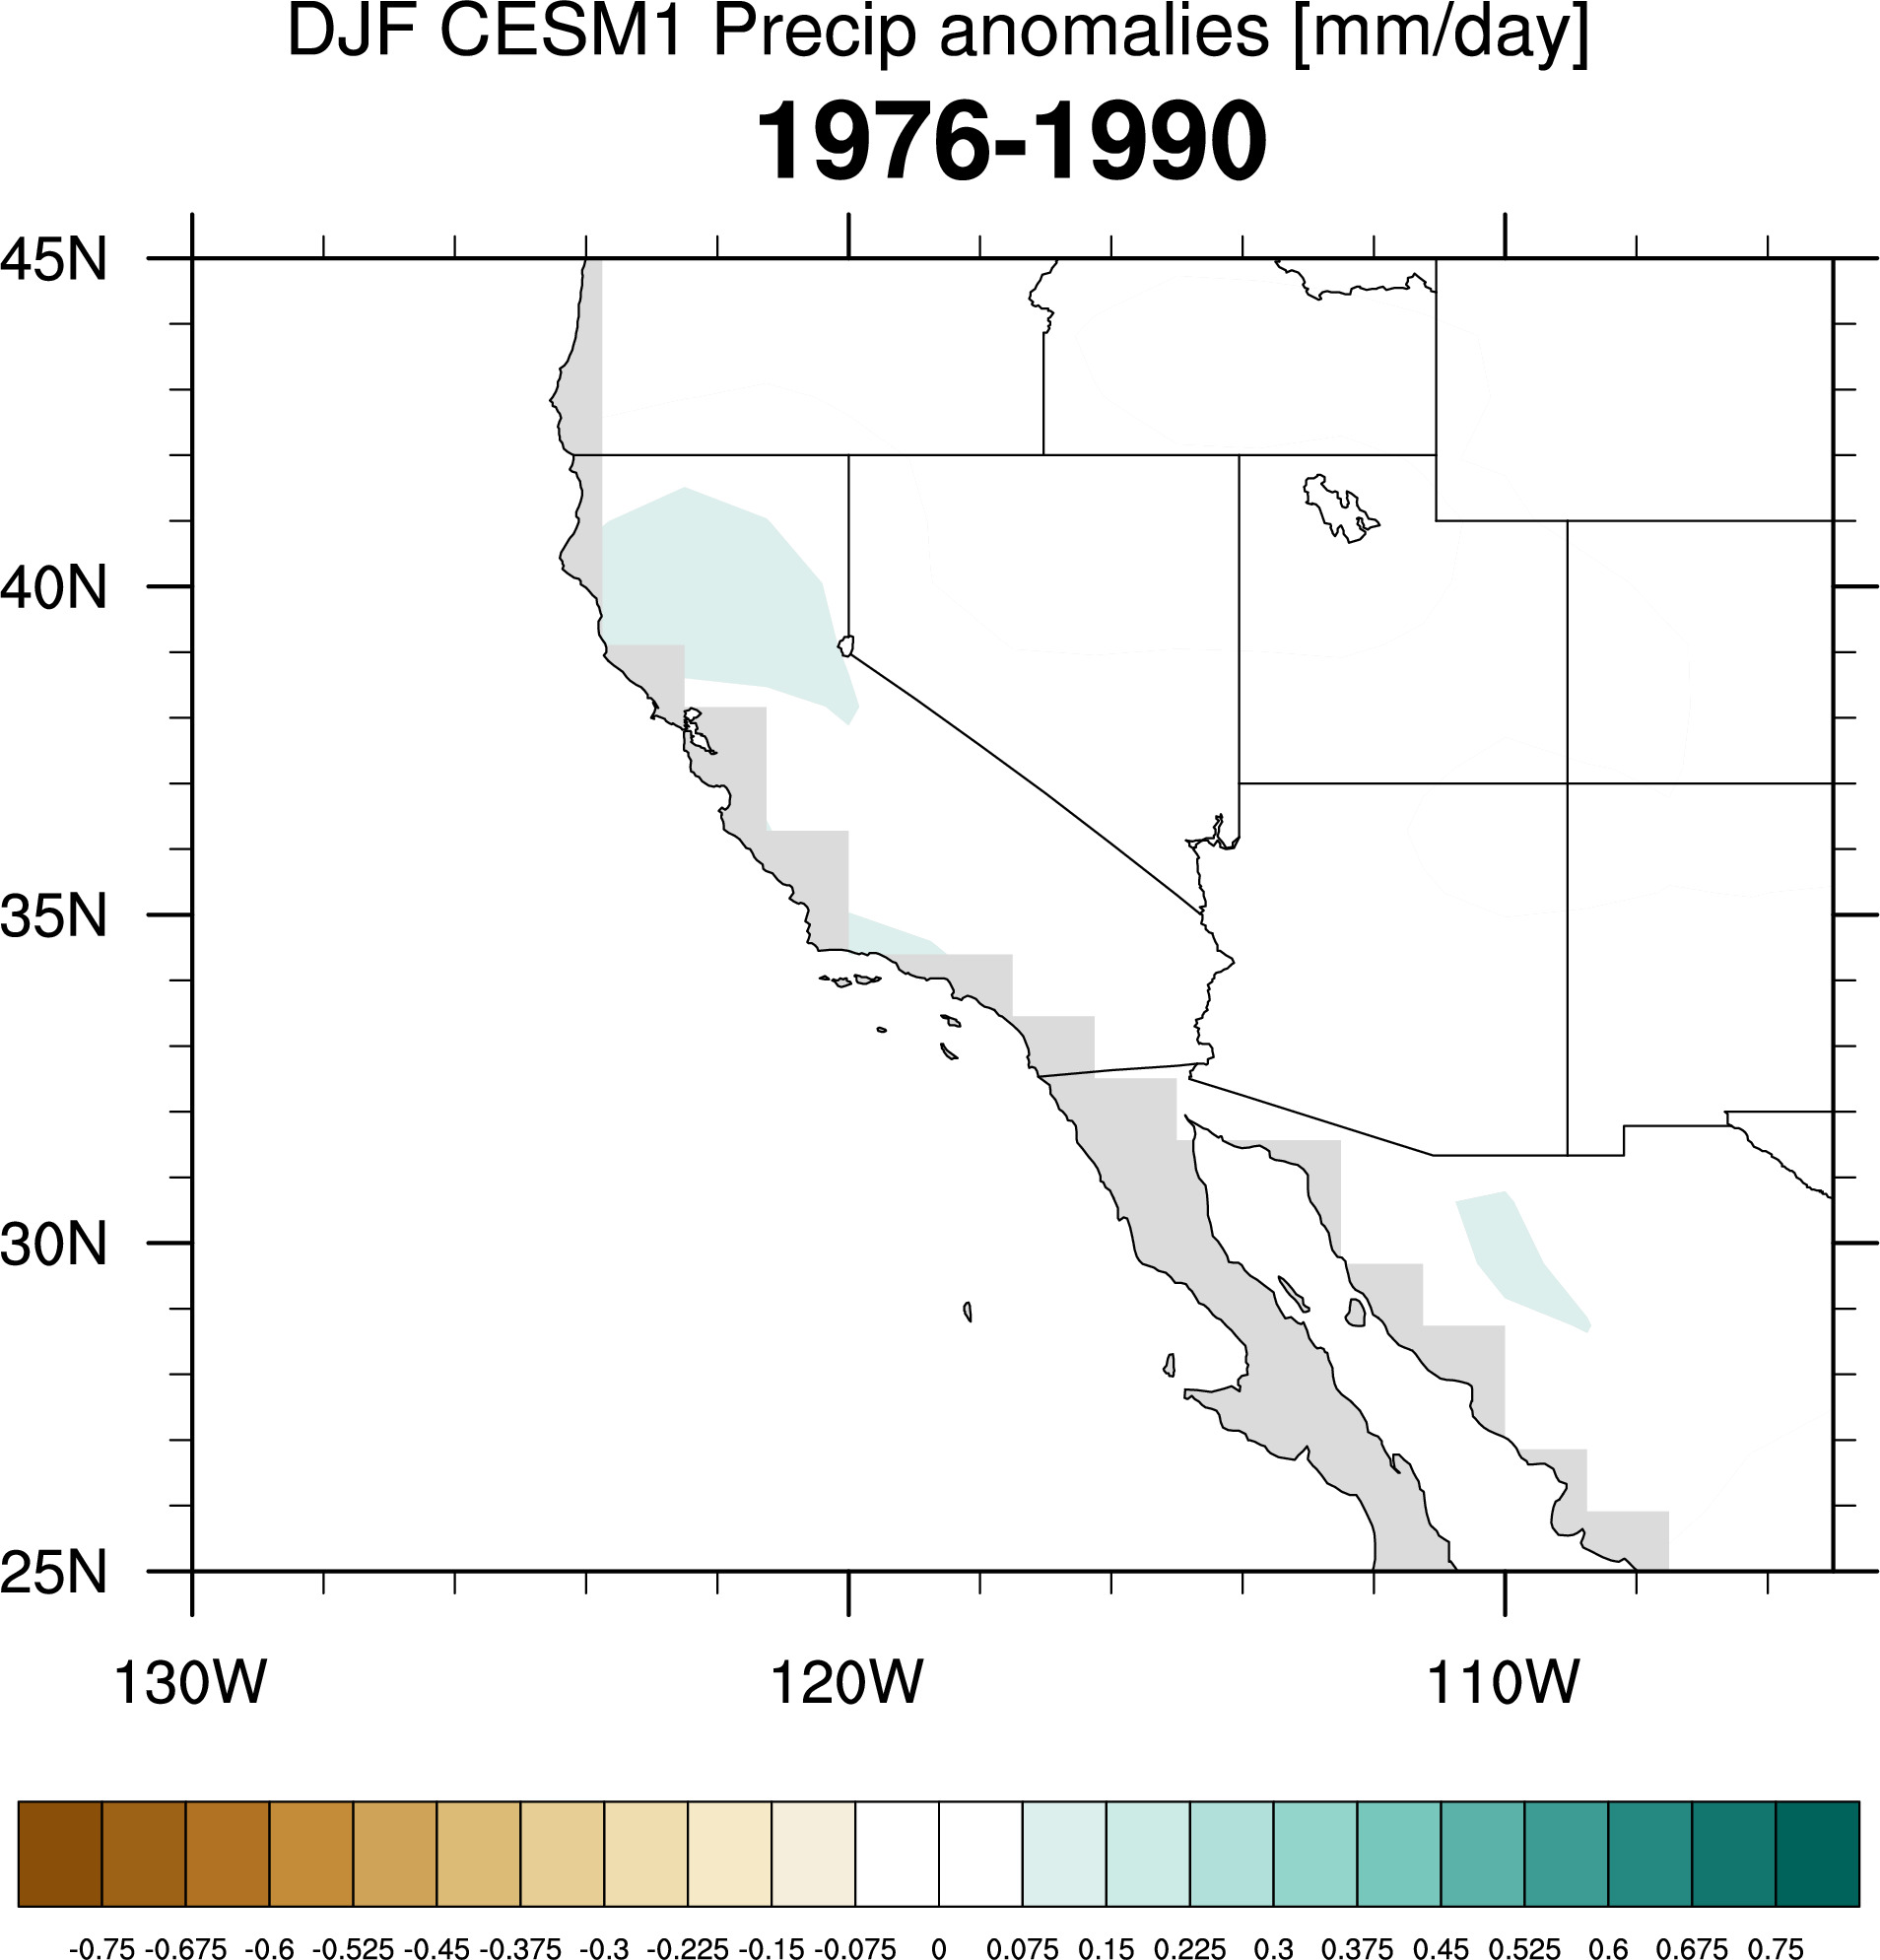
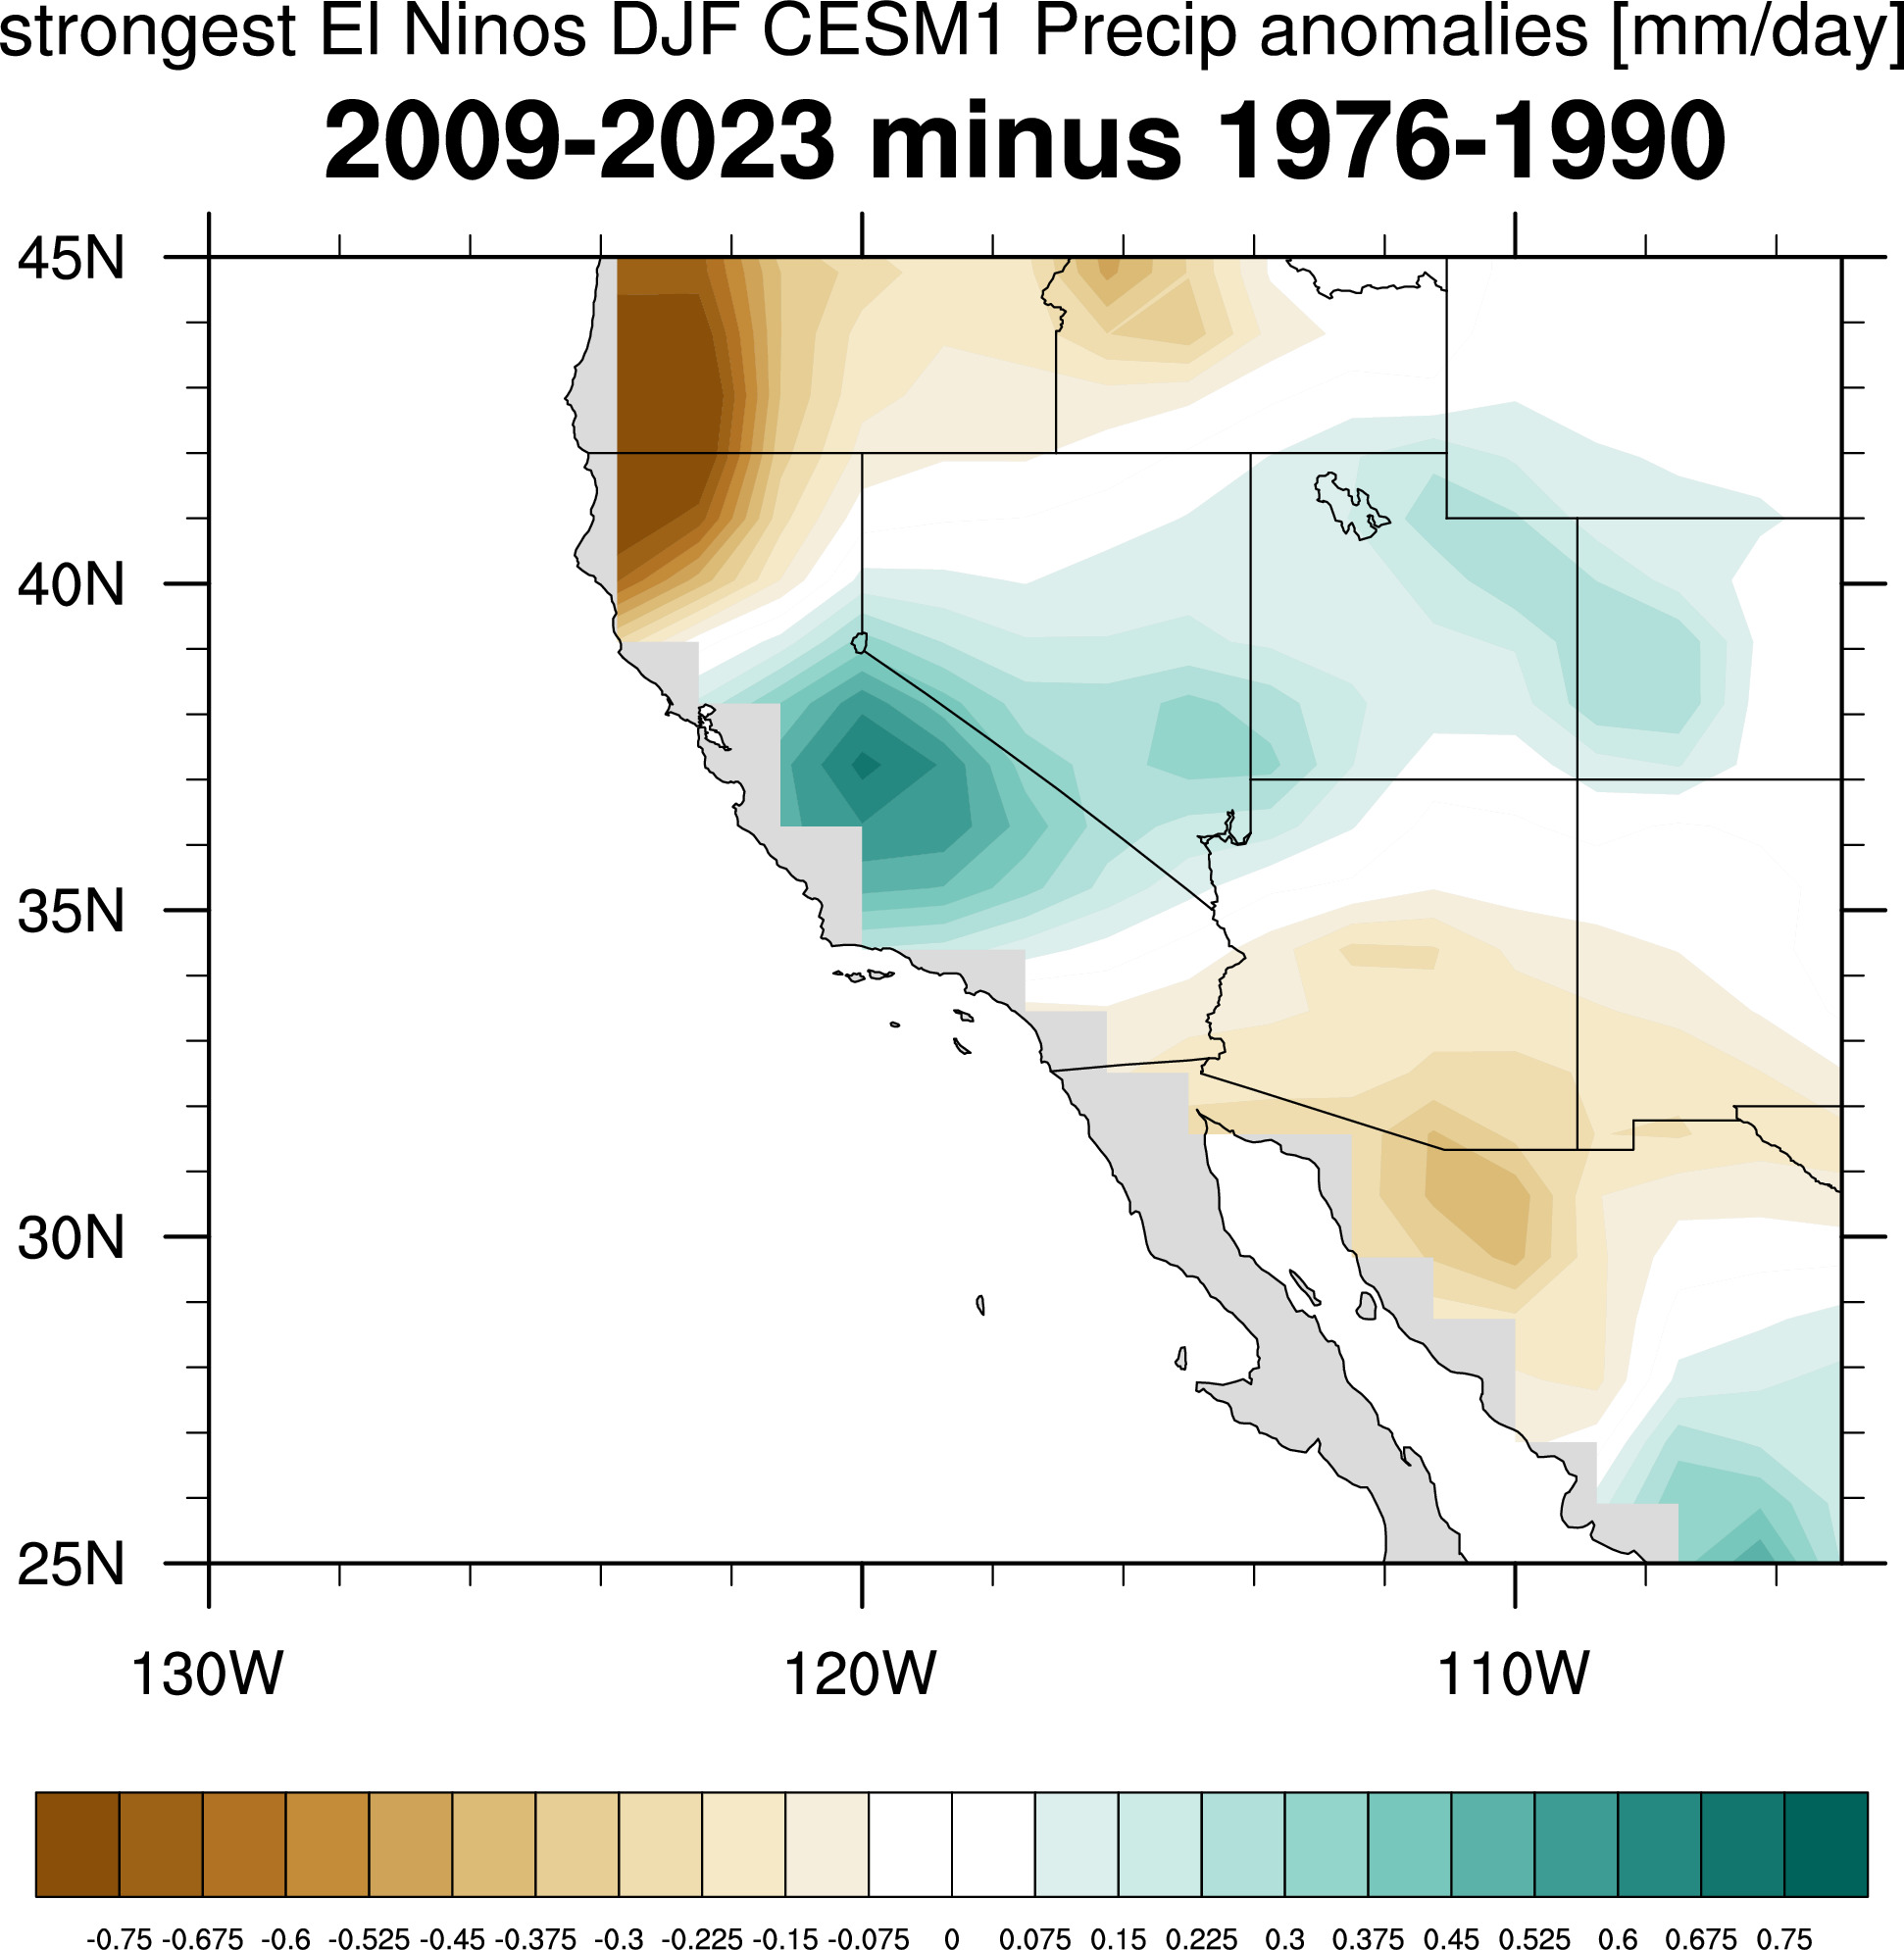
Maps corresponding to lowest precip in strongest El Ninos
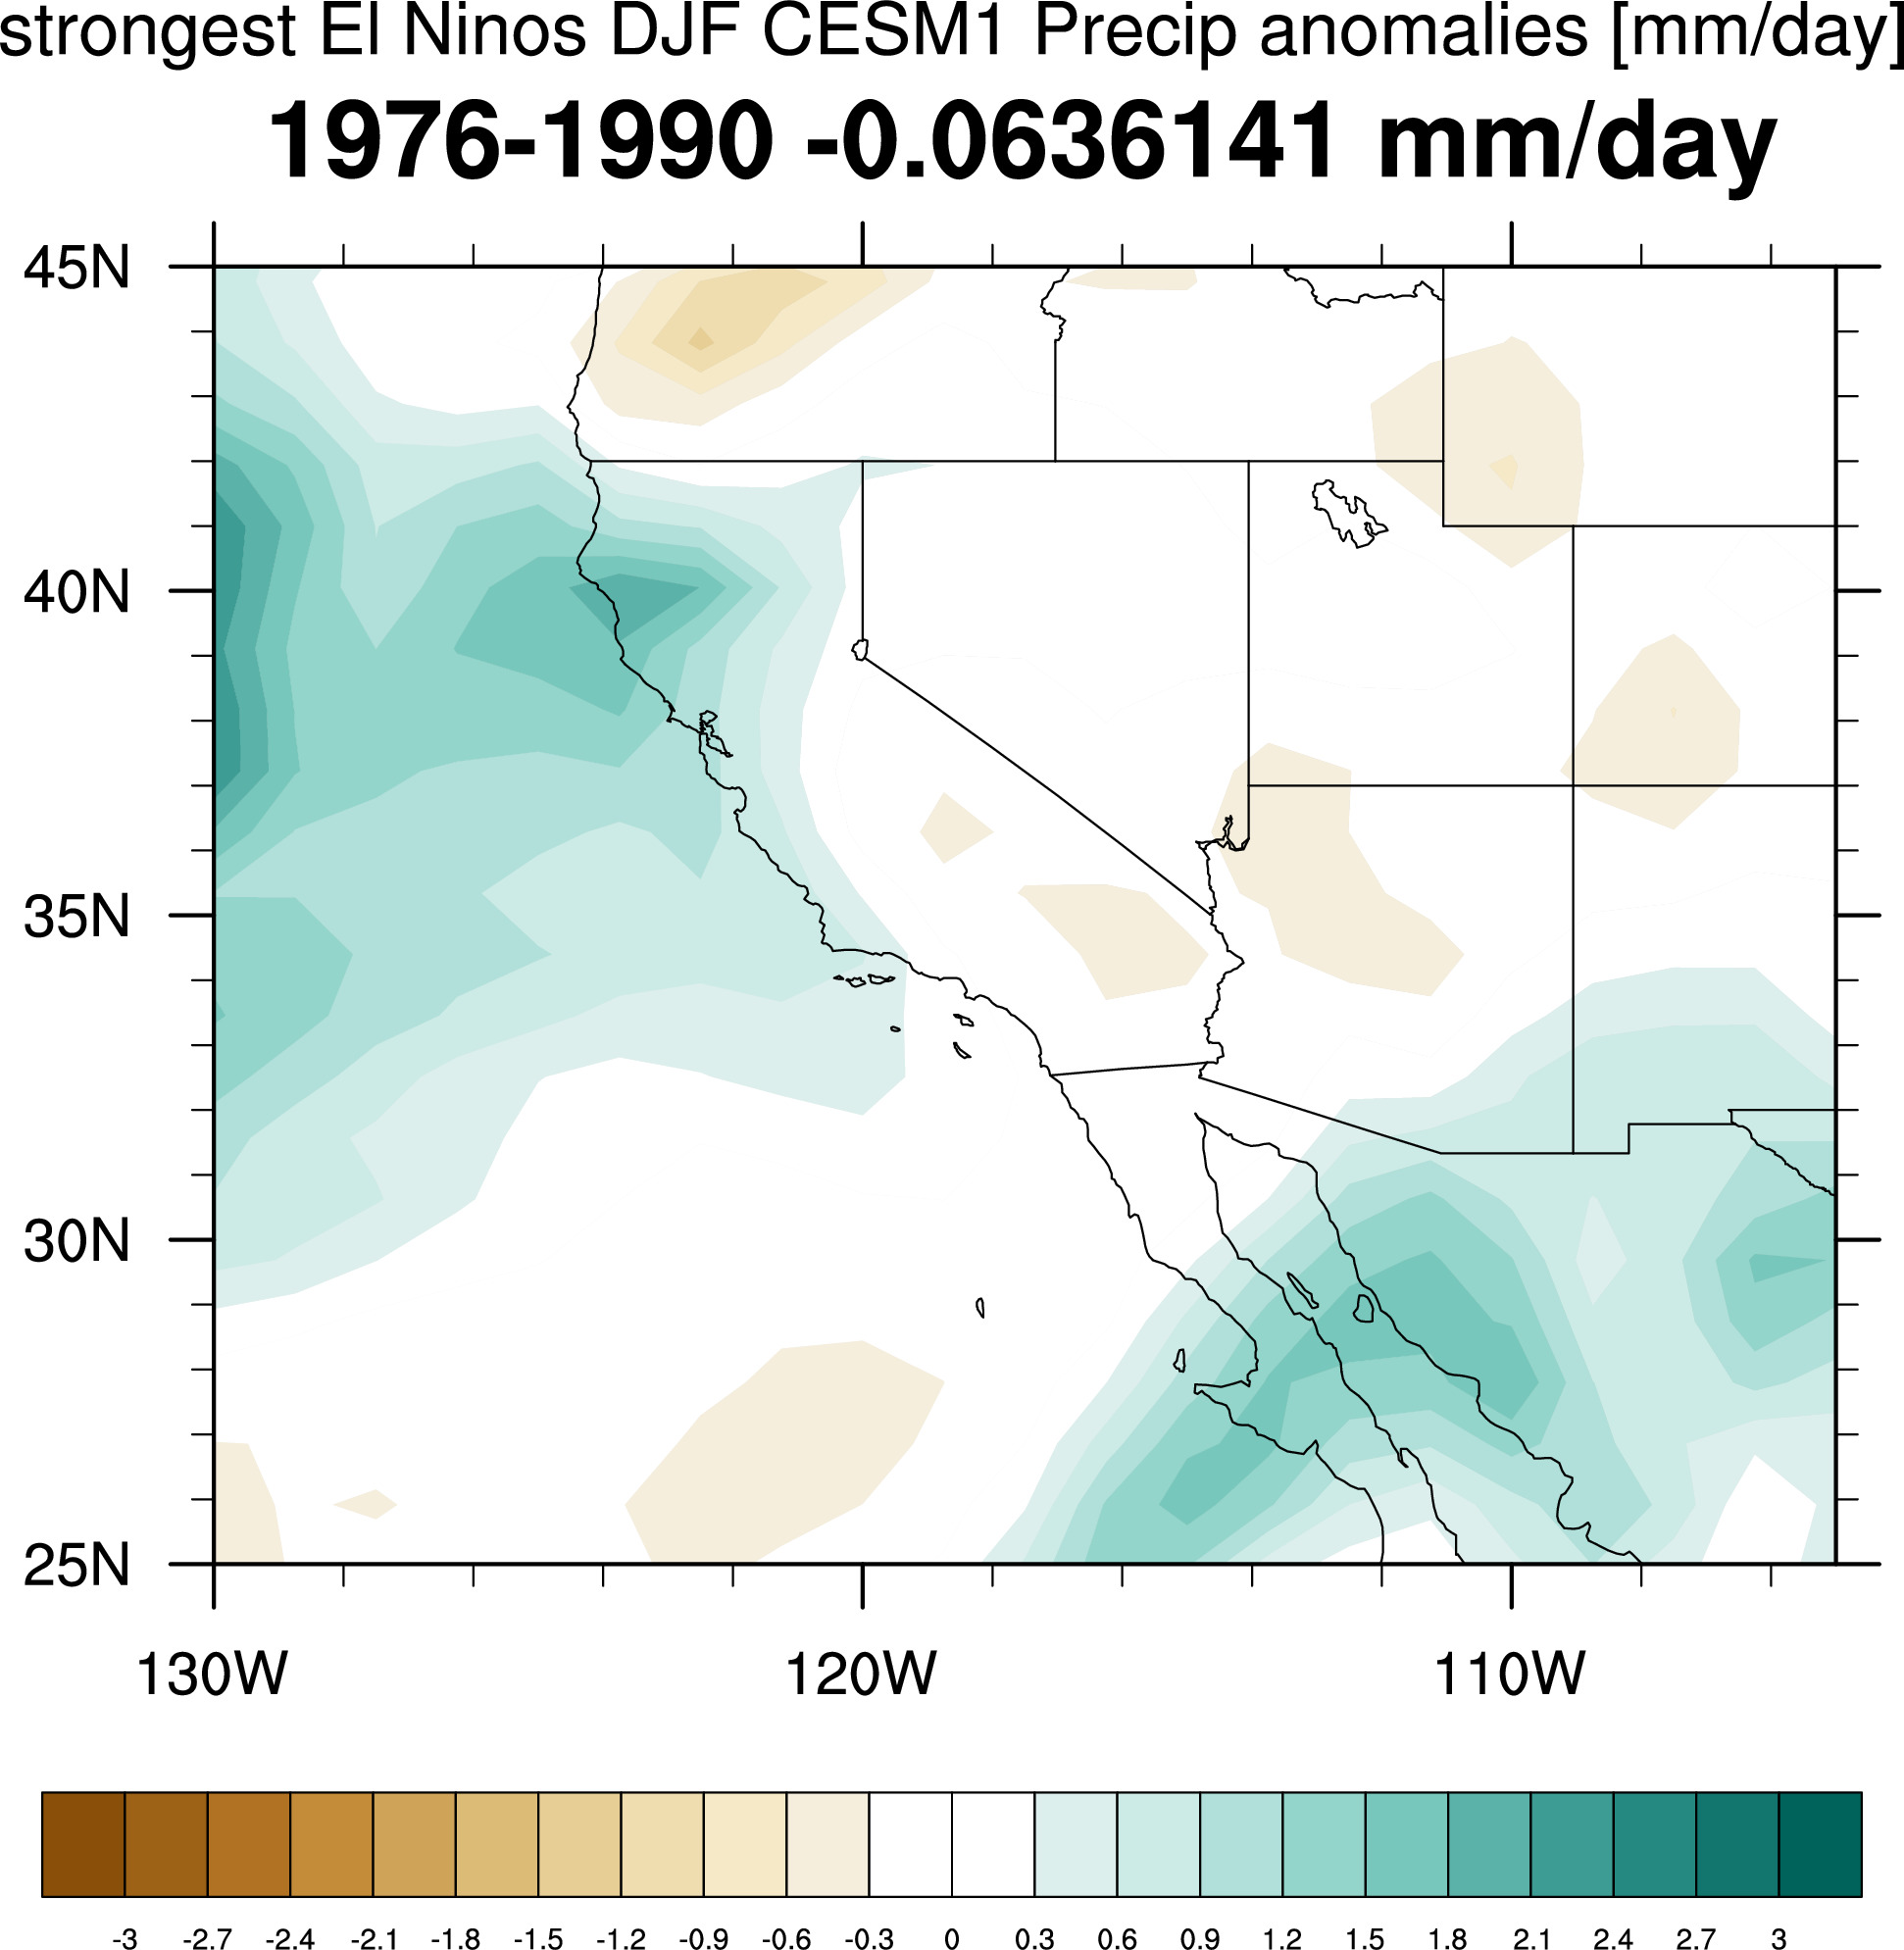
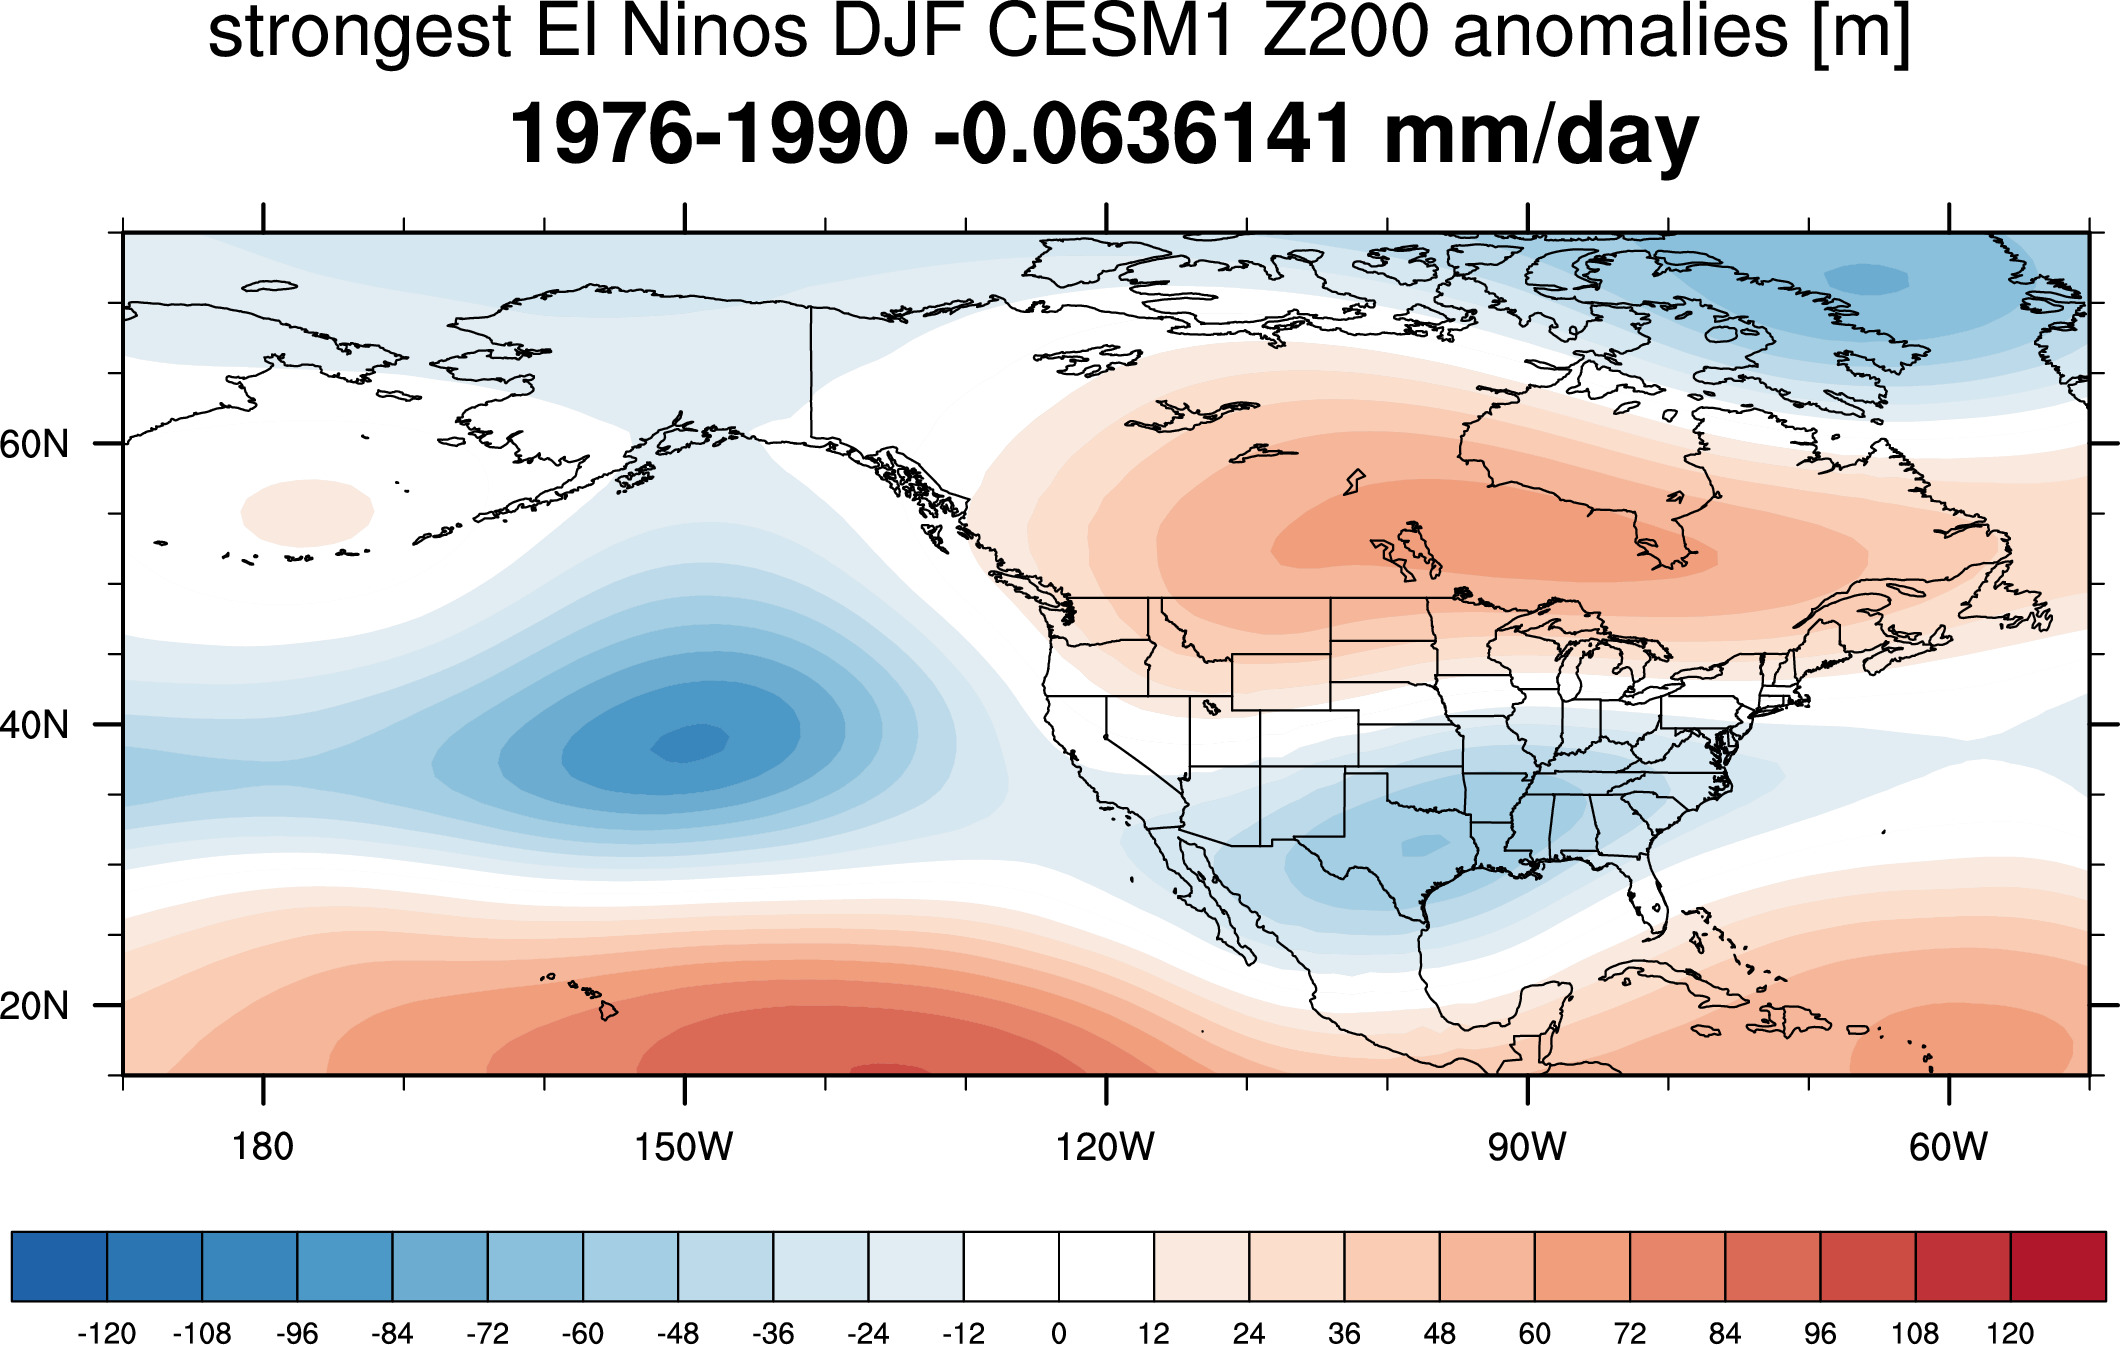
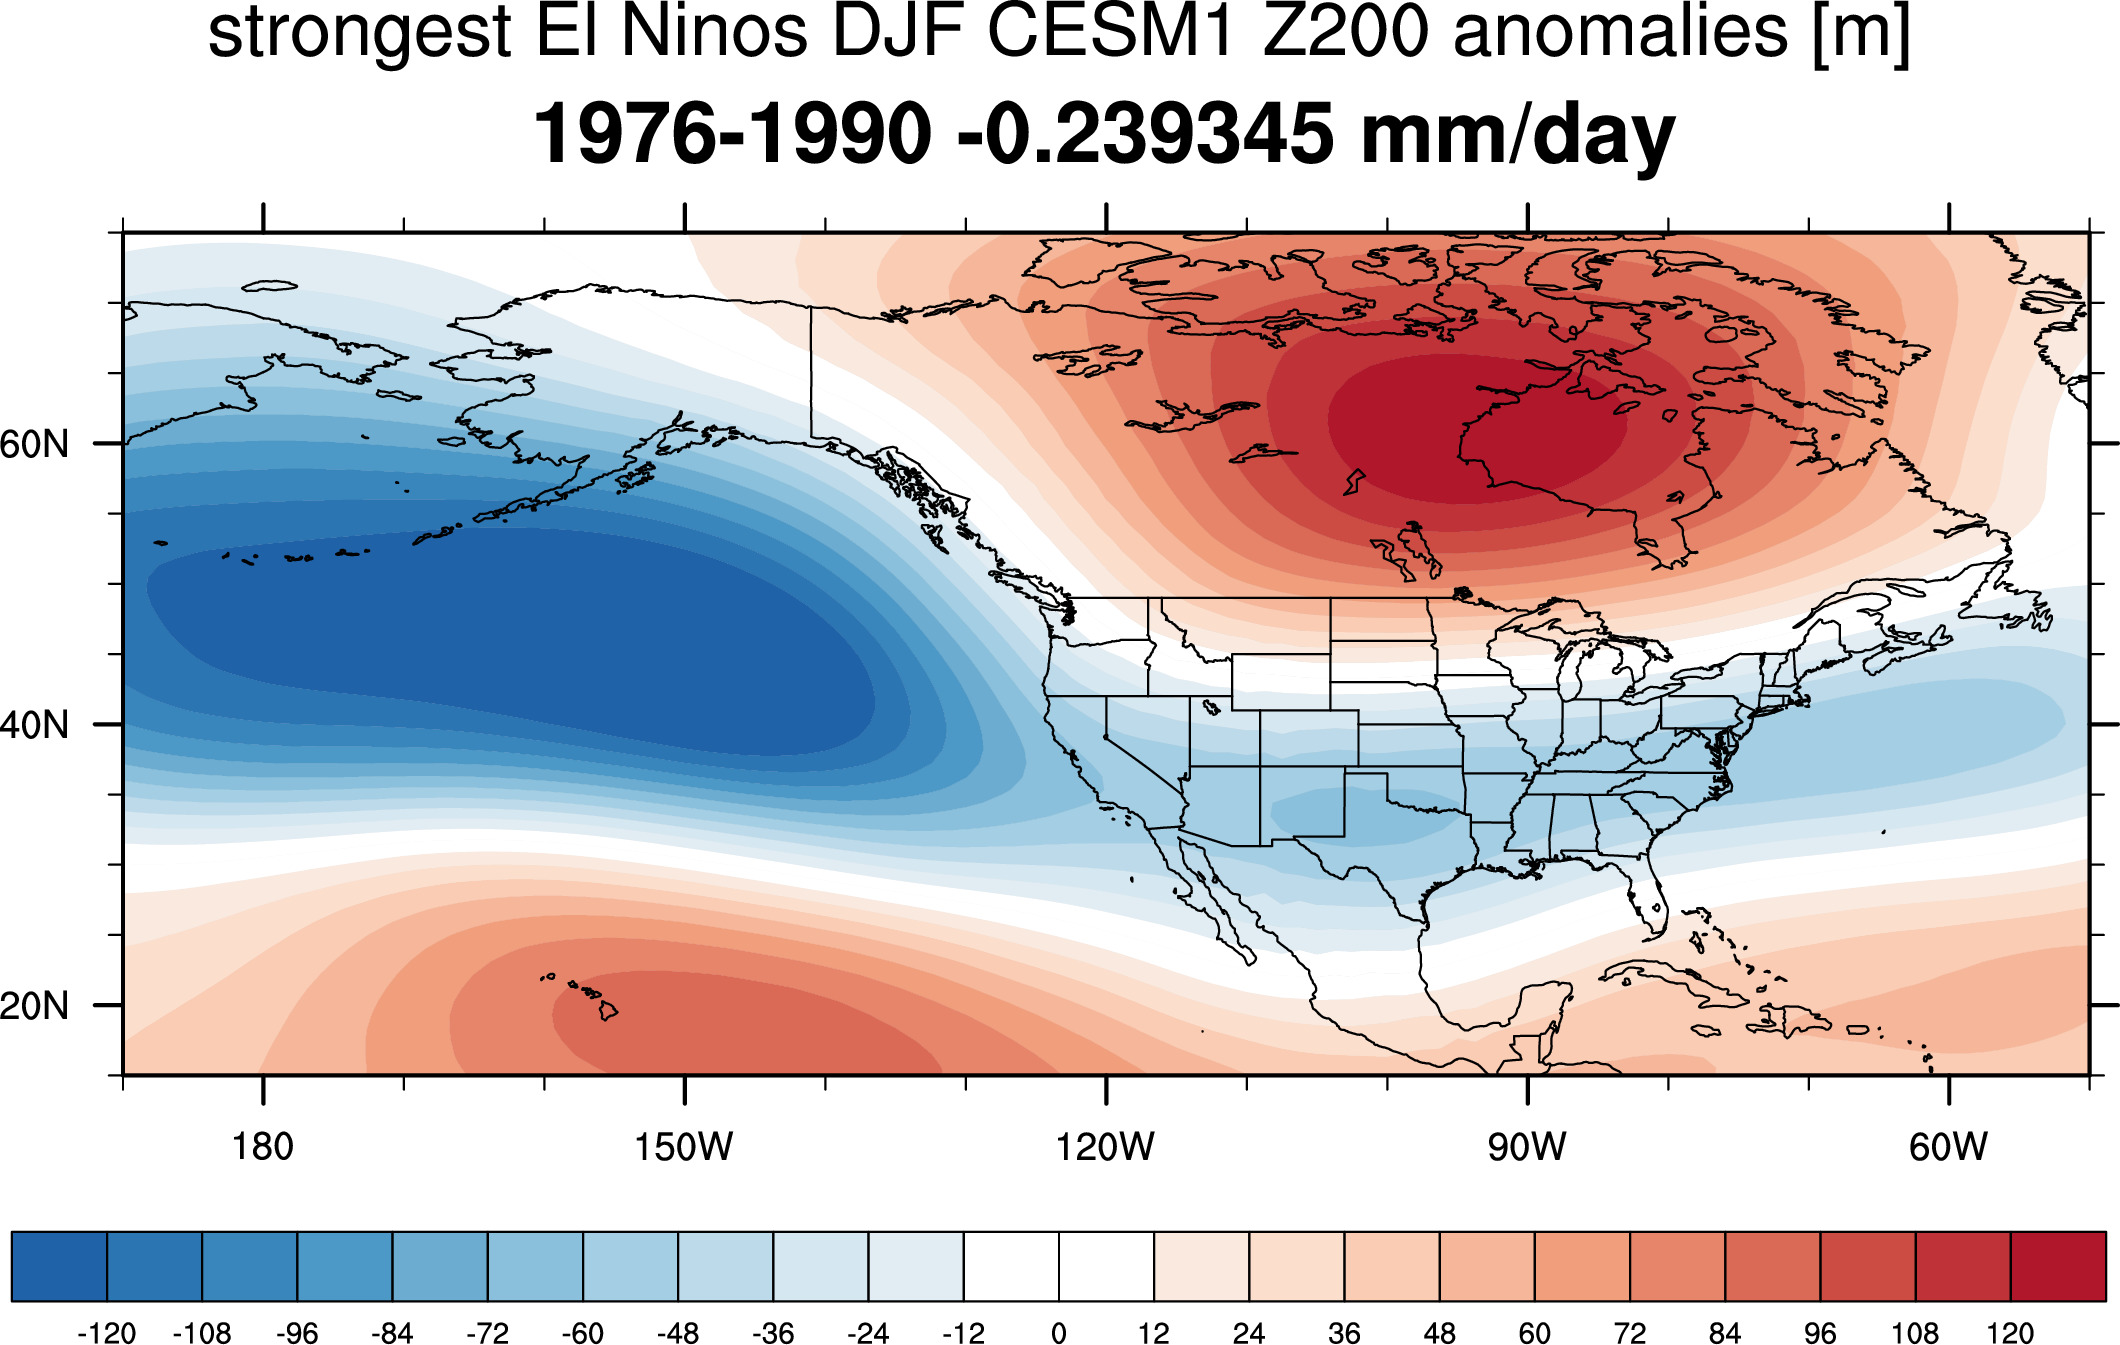
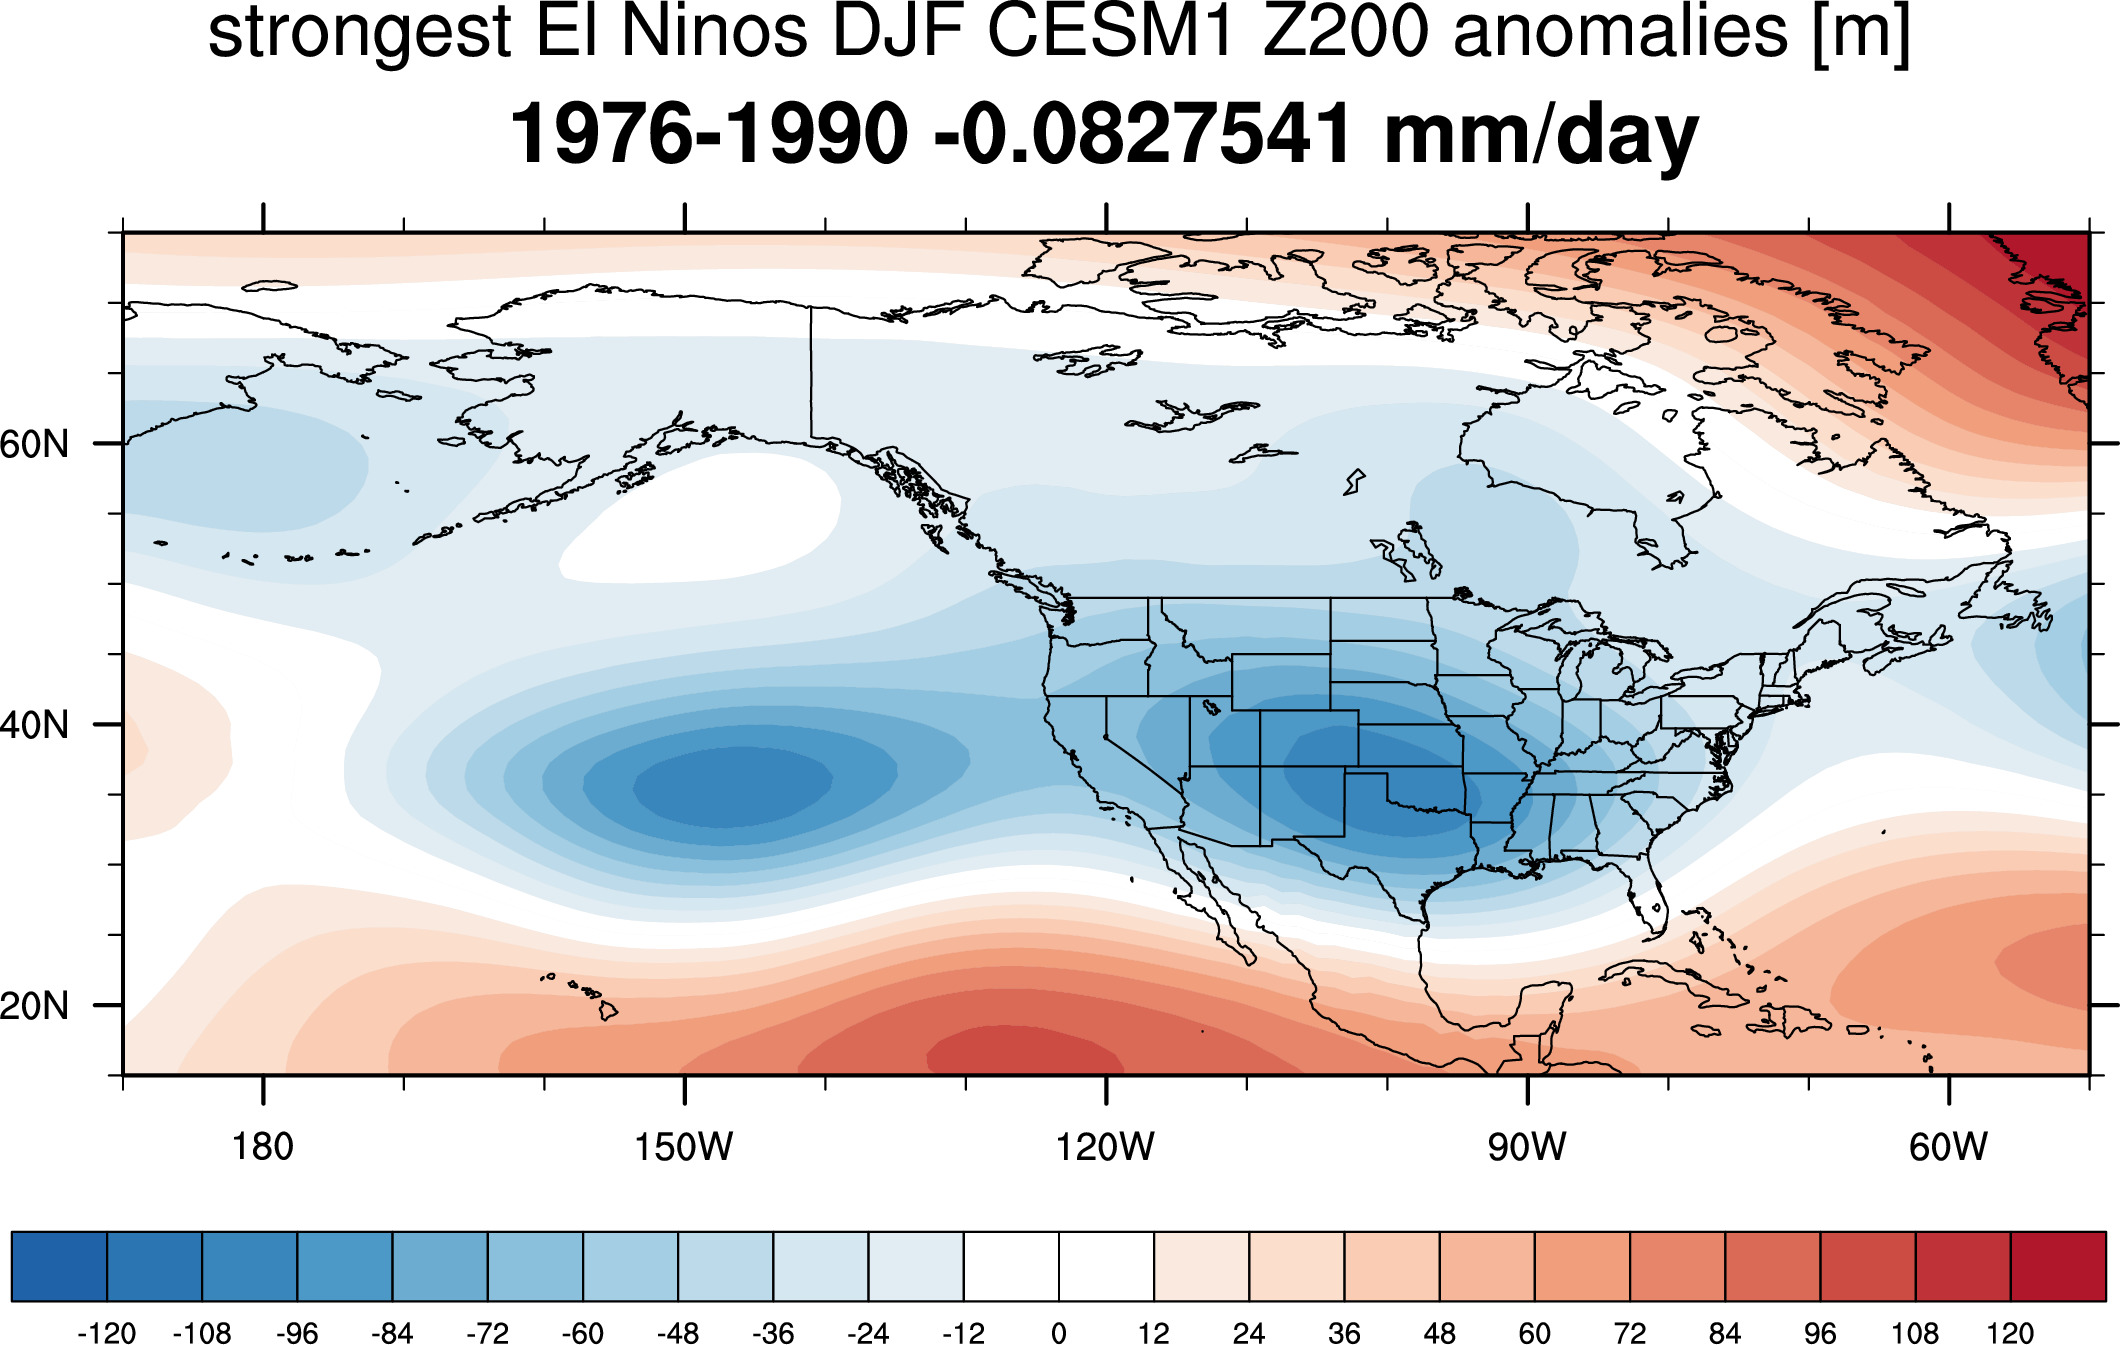
In all cases the numerical precip amounts in titles correspond to land-only CA precip (up to 37°N).
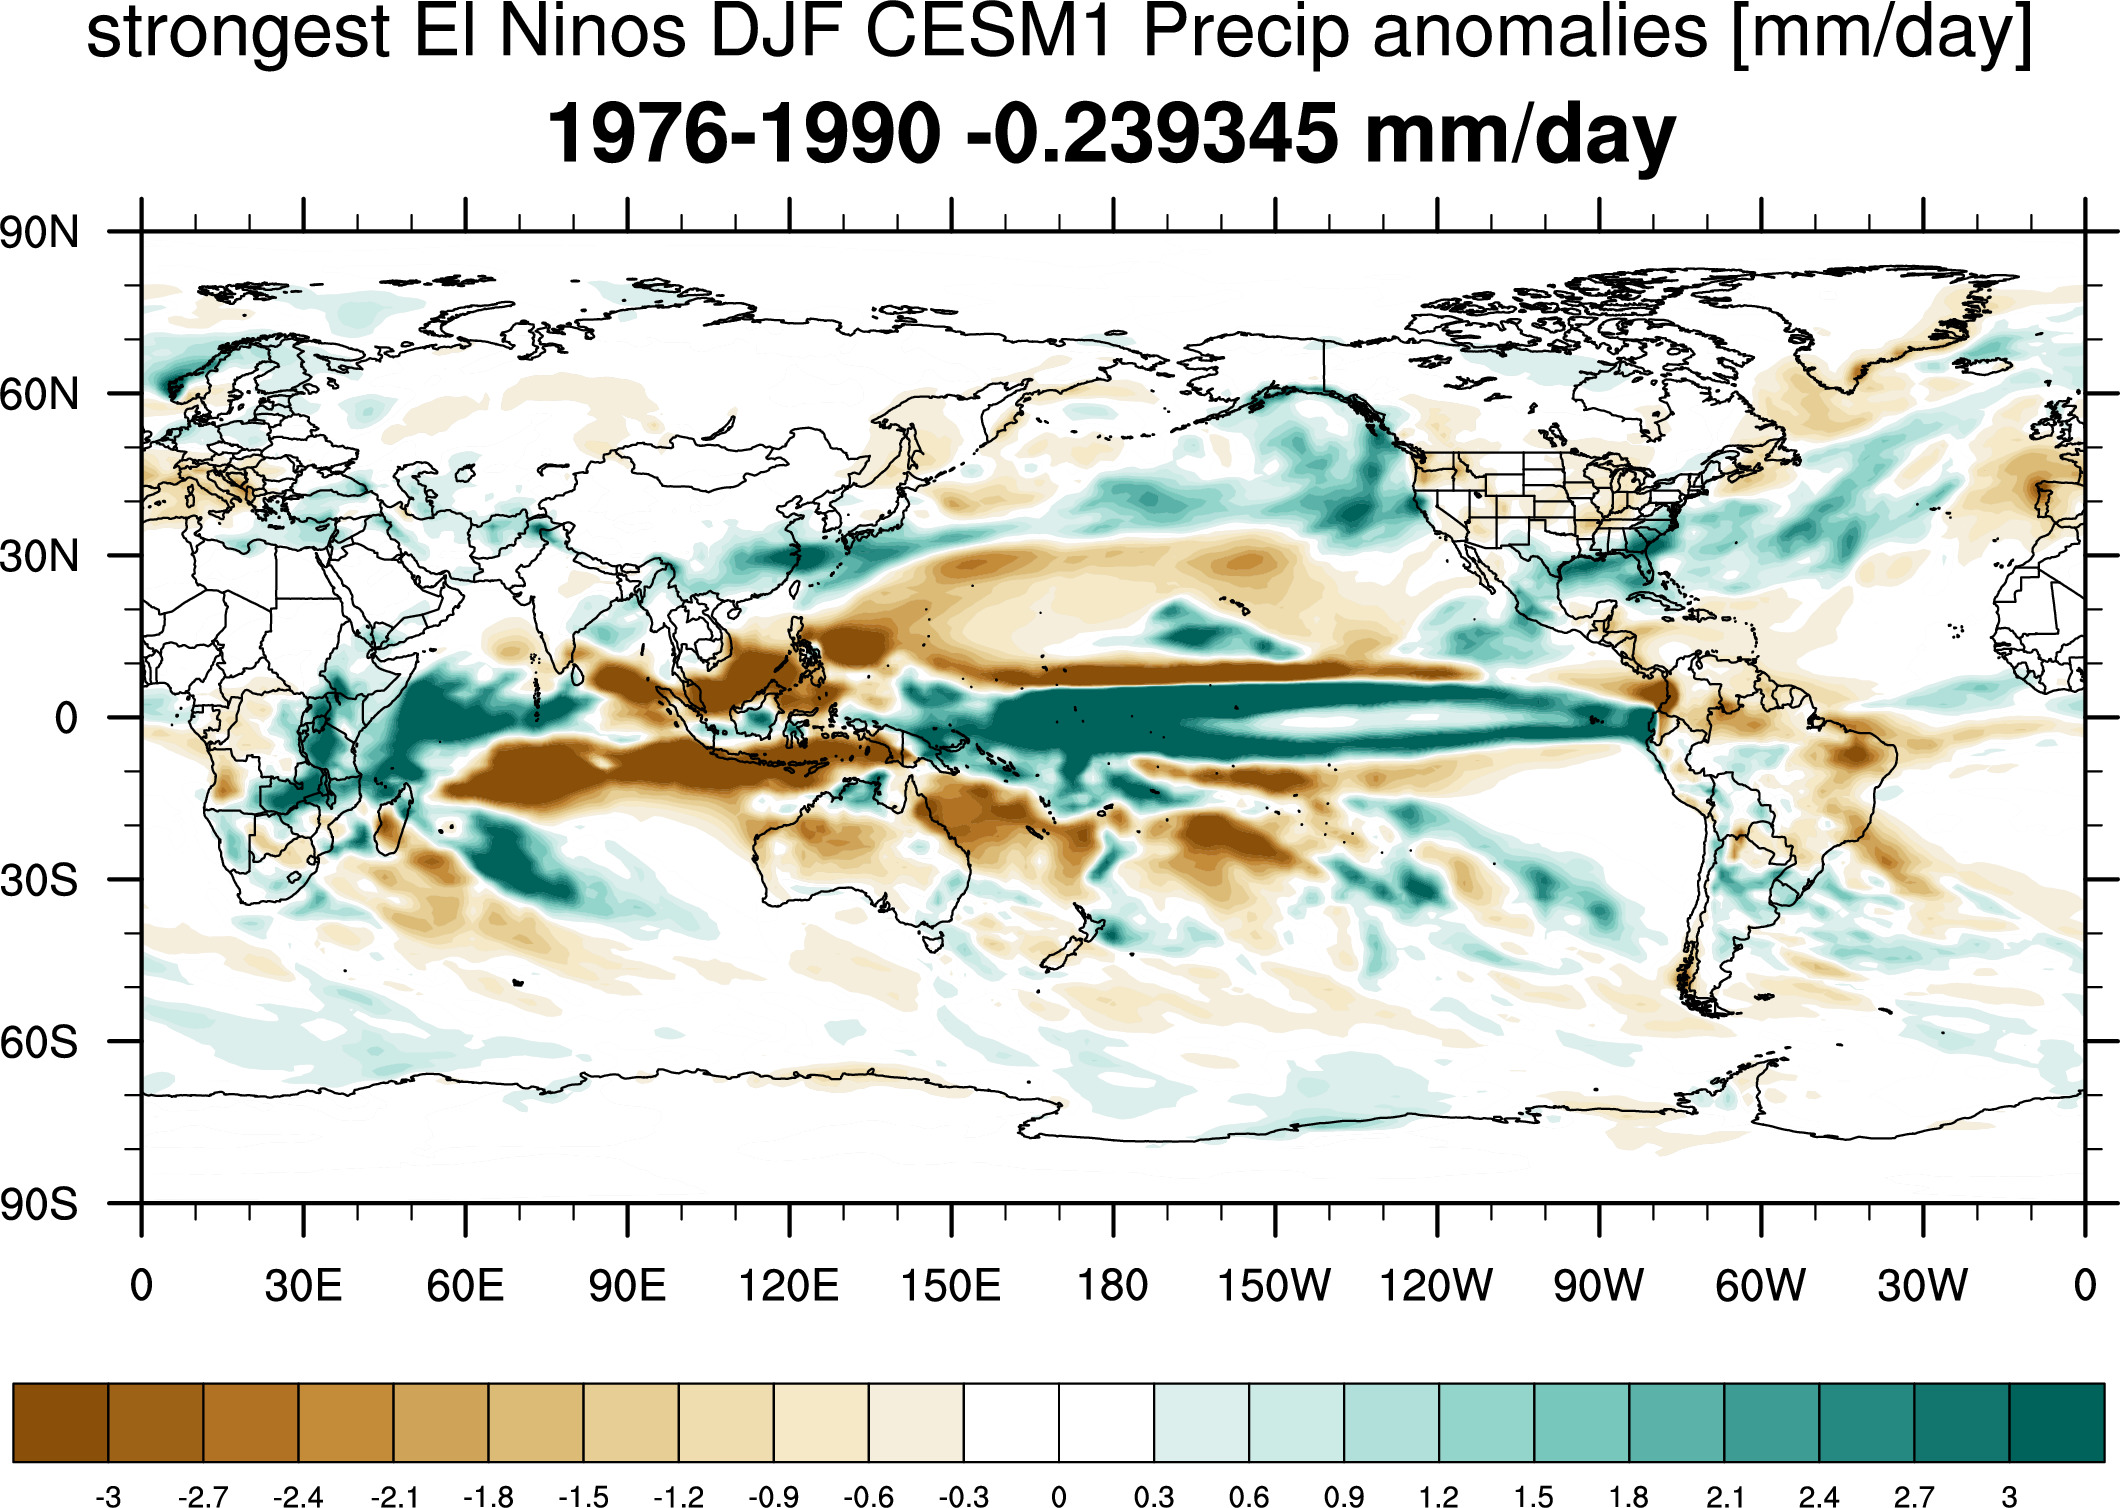
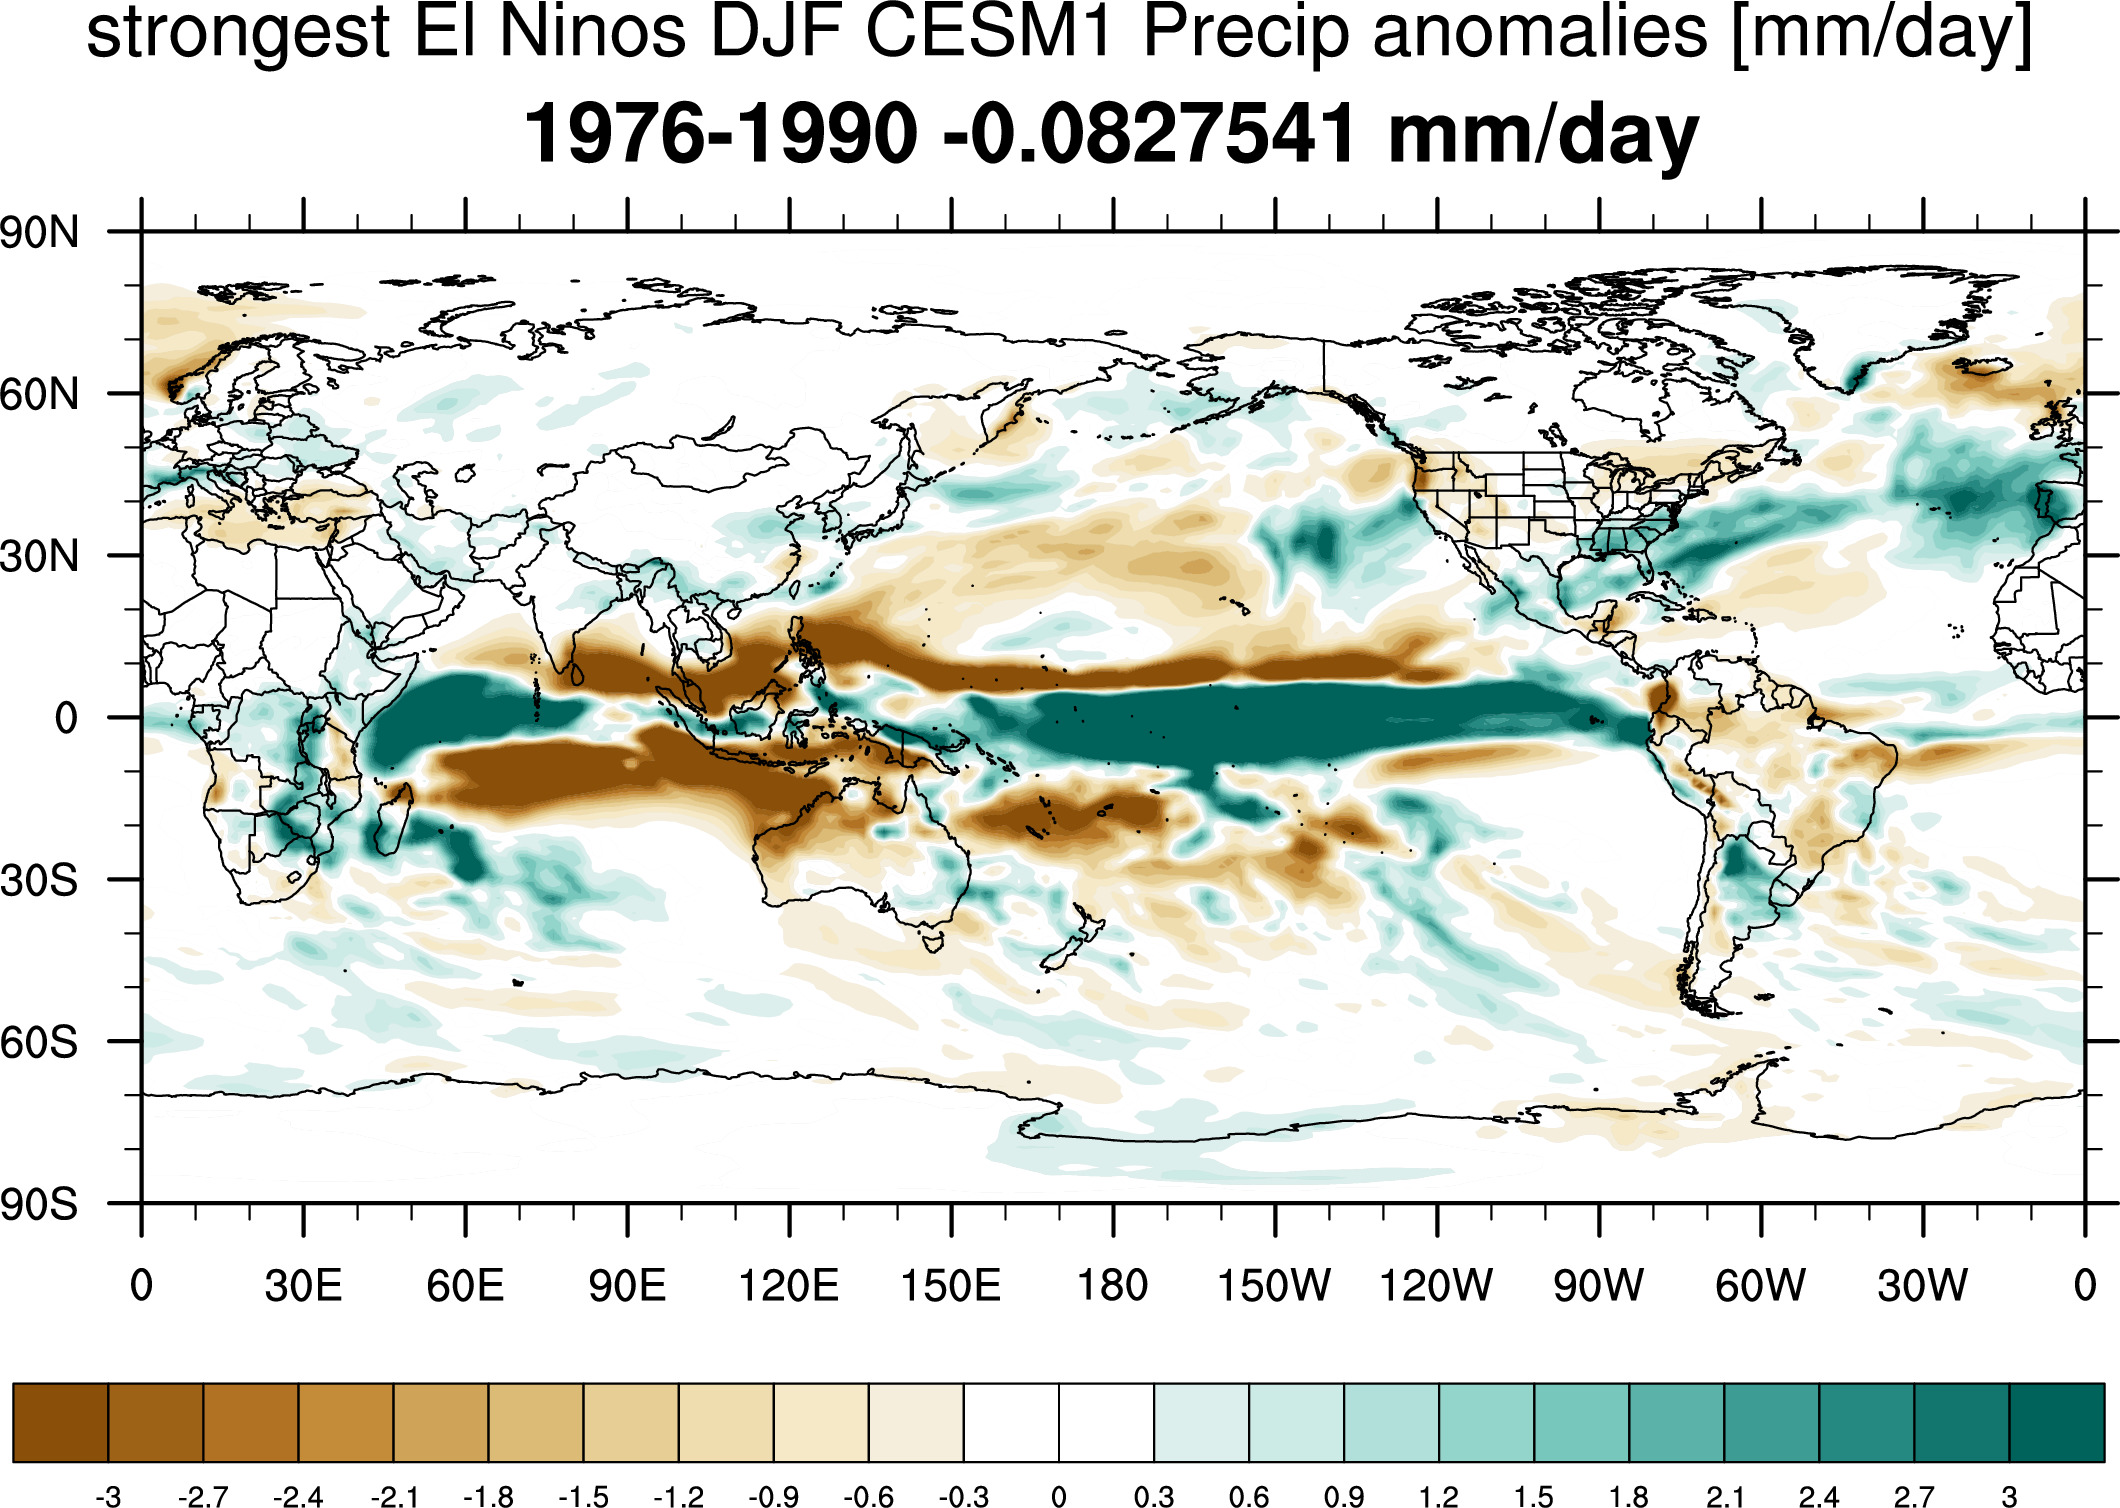
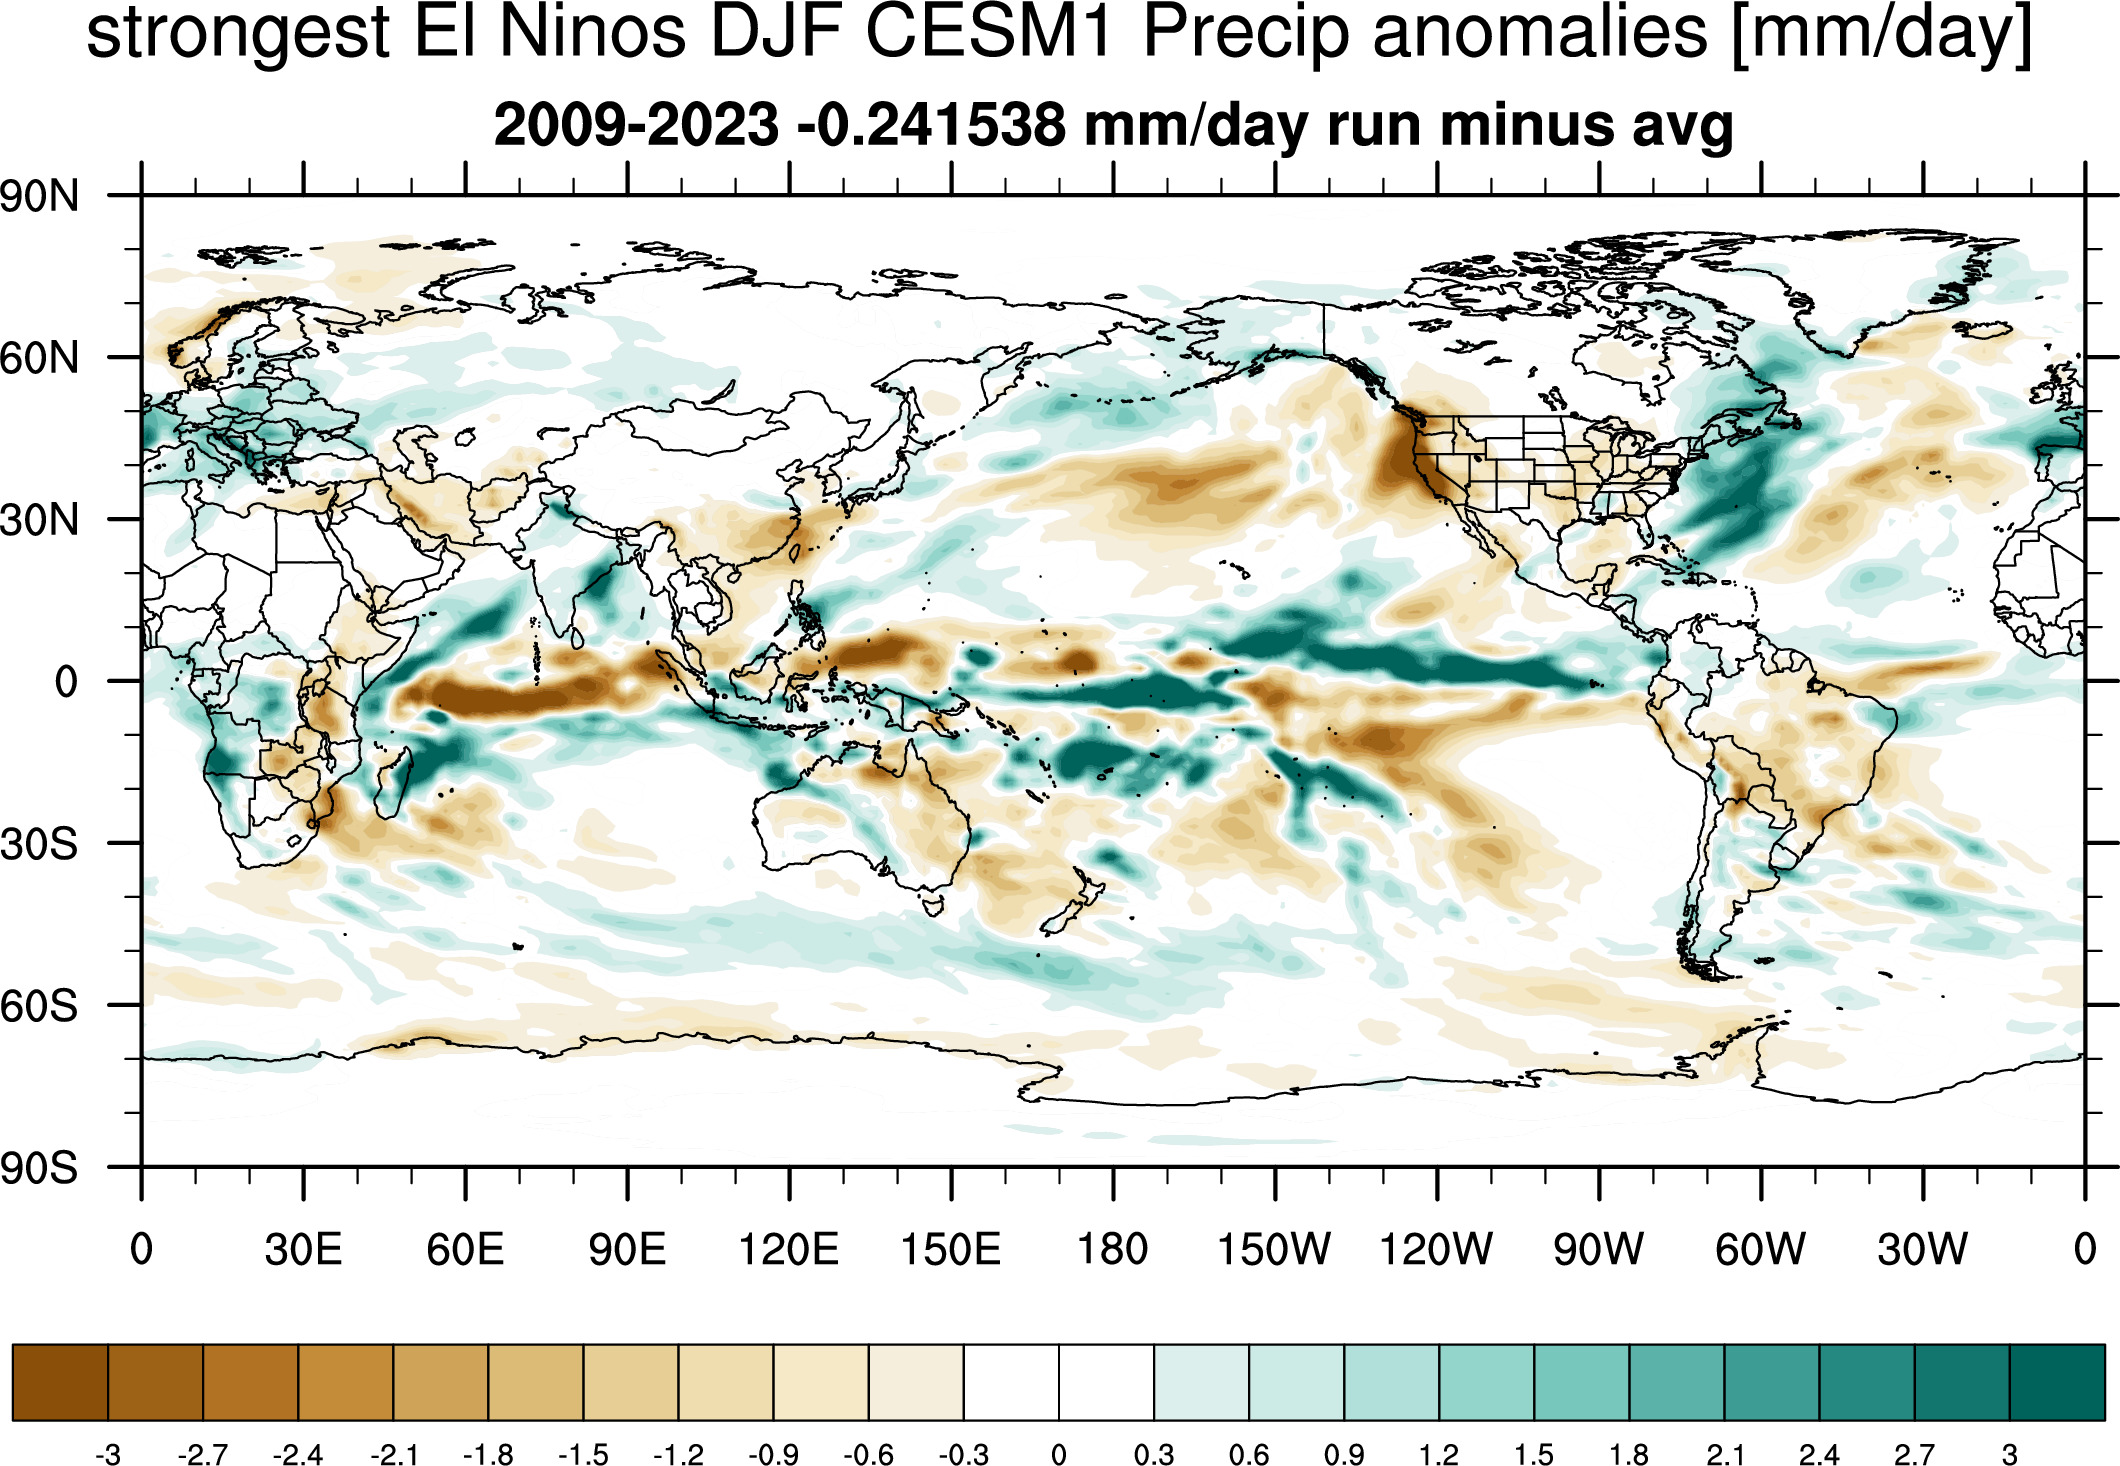
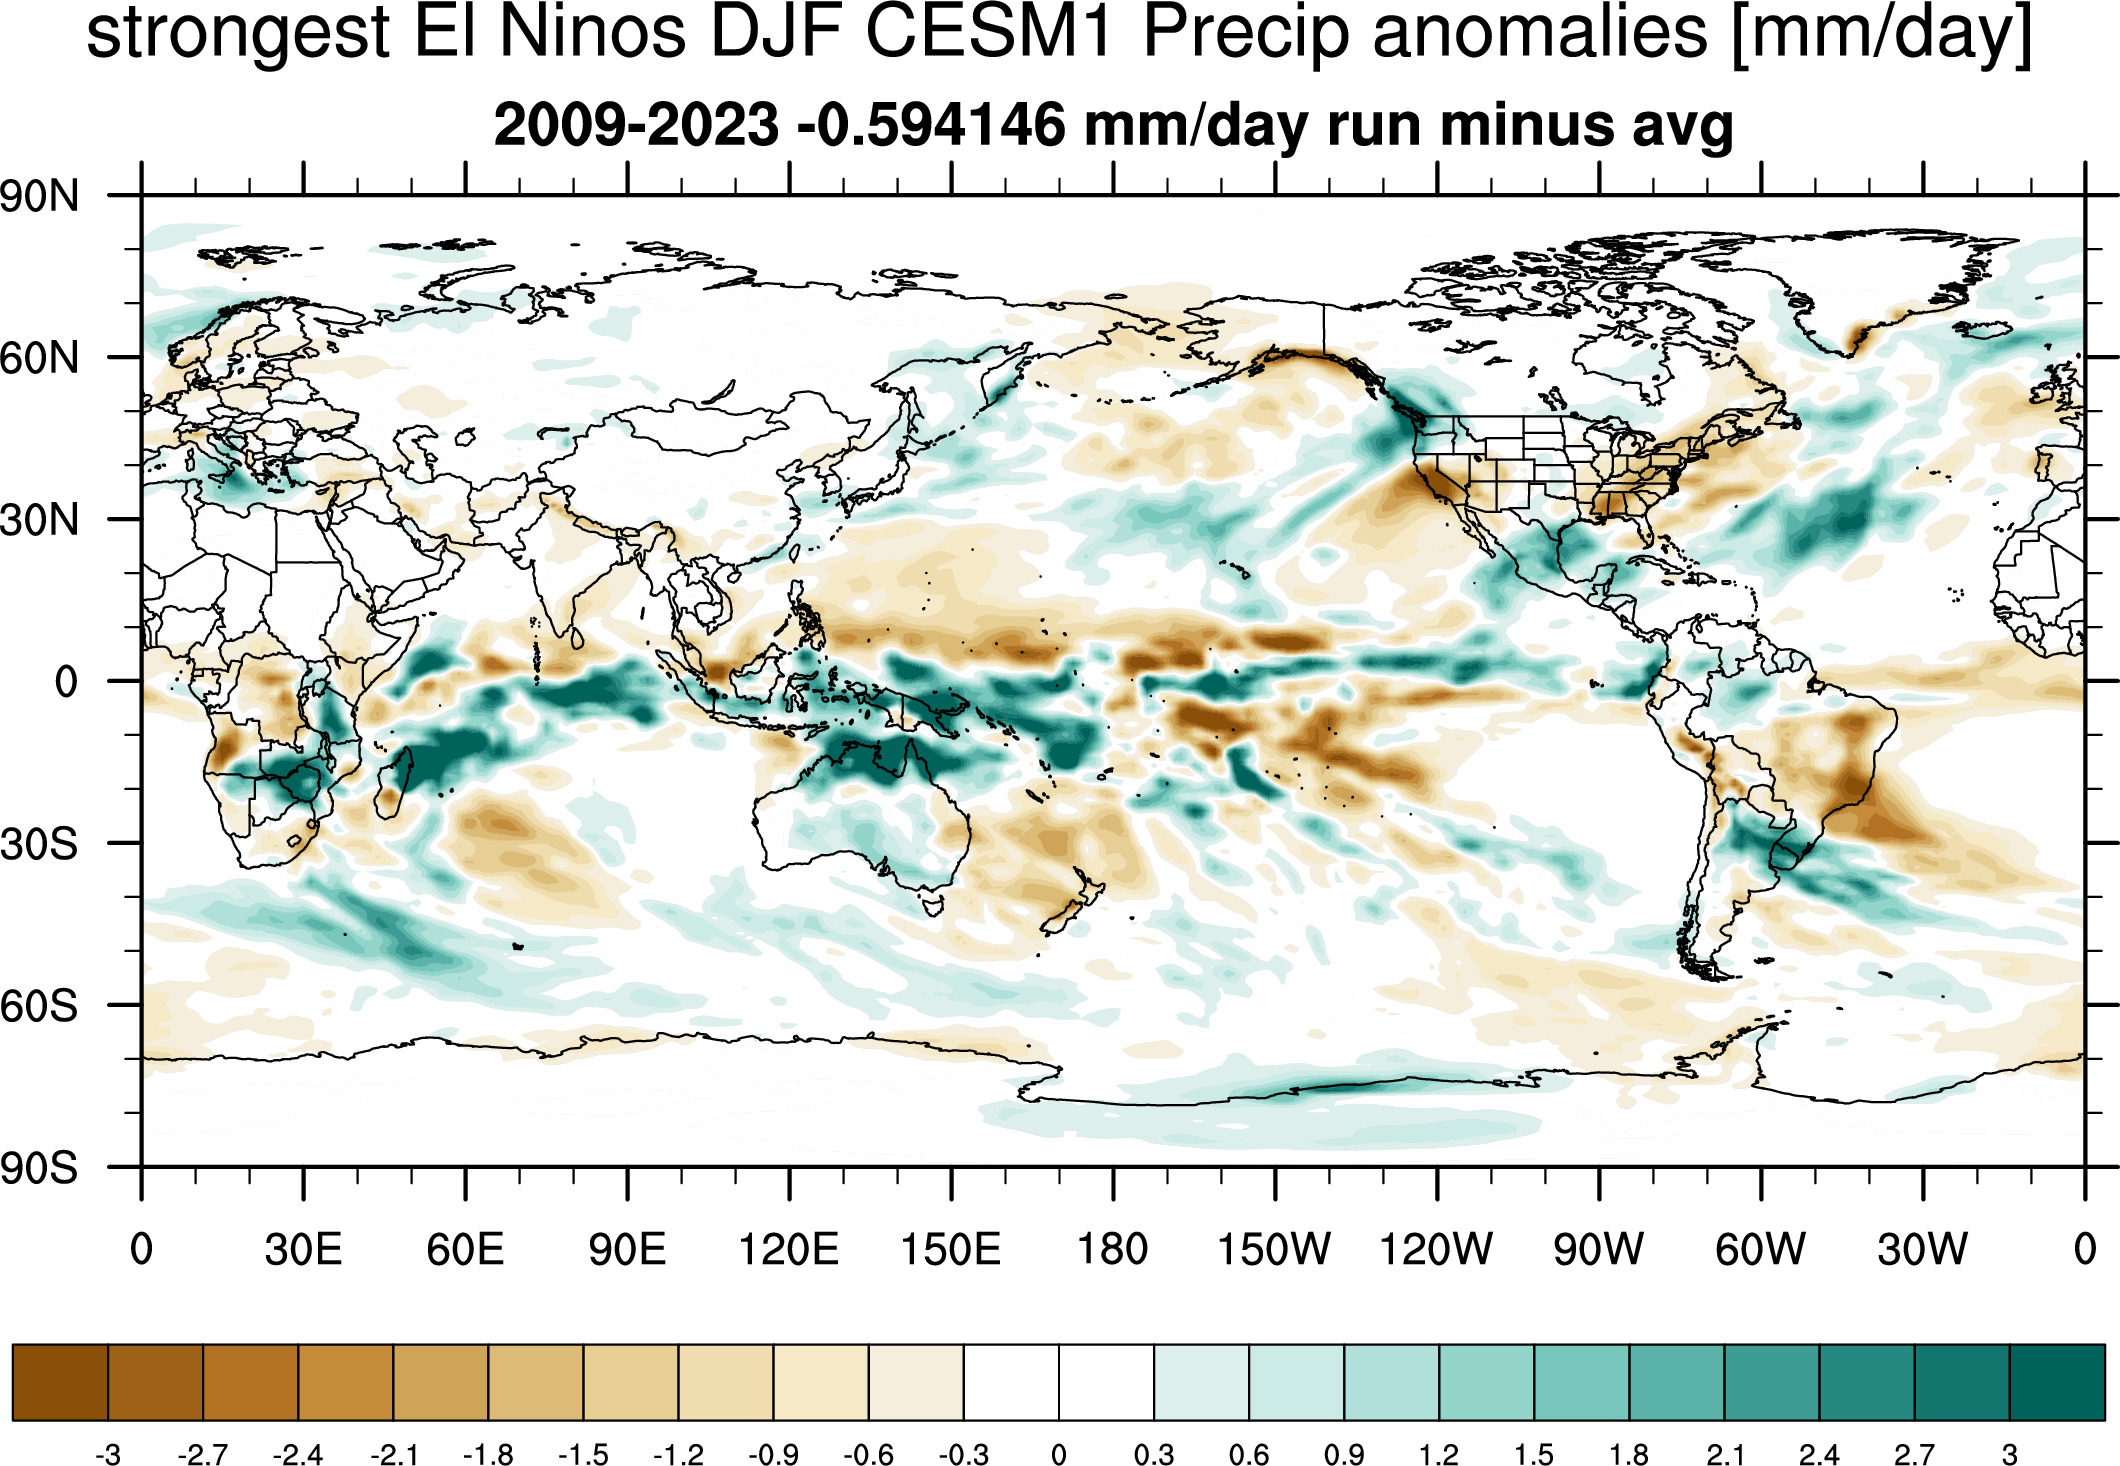
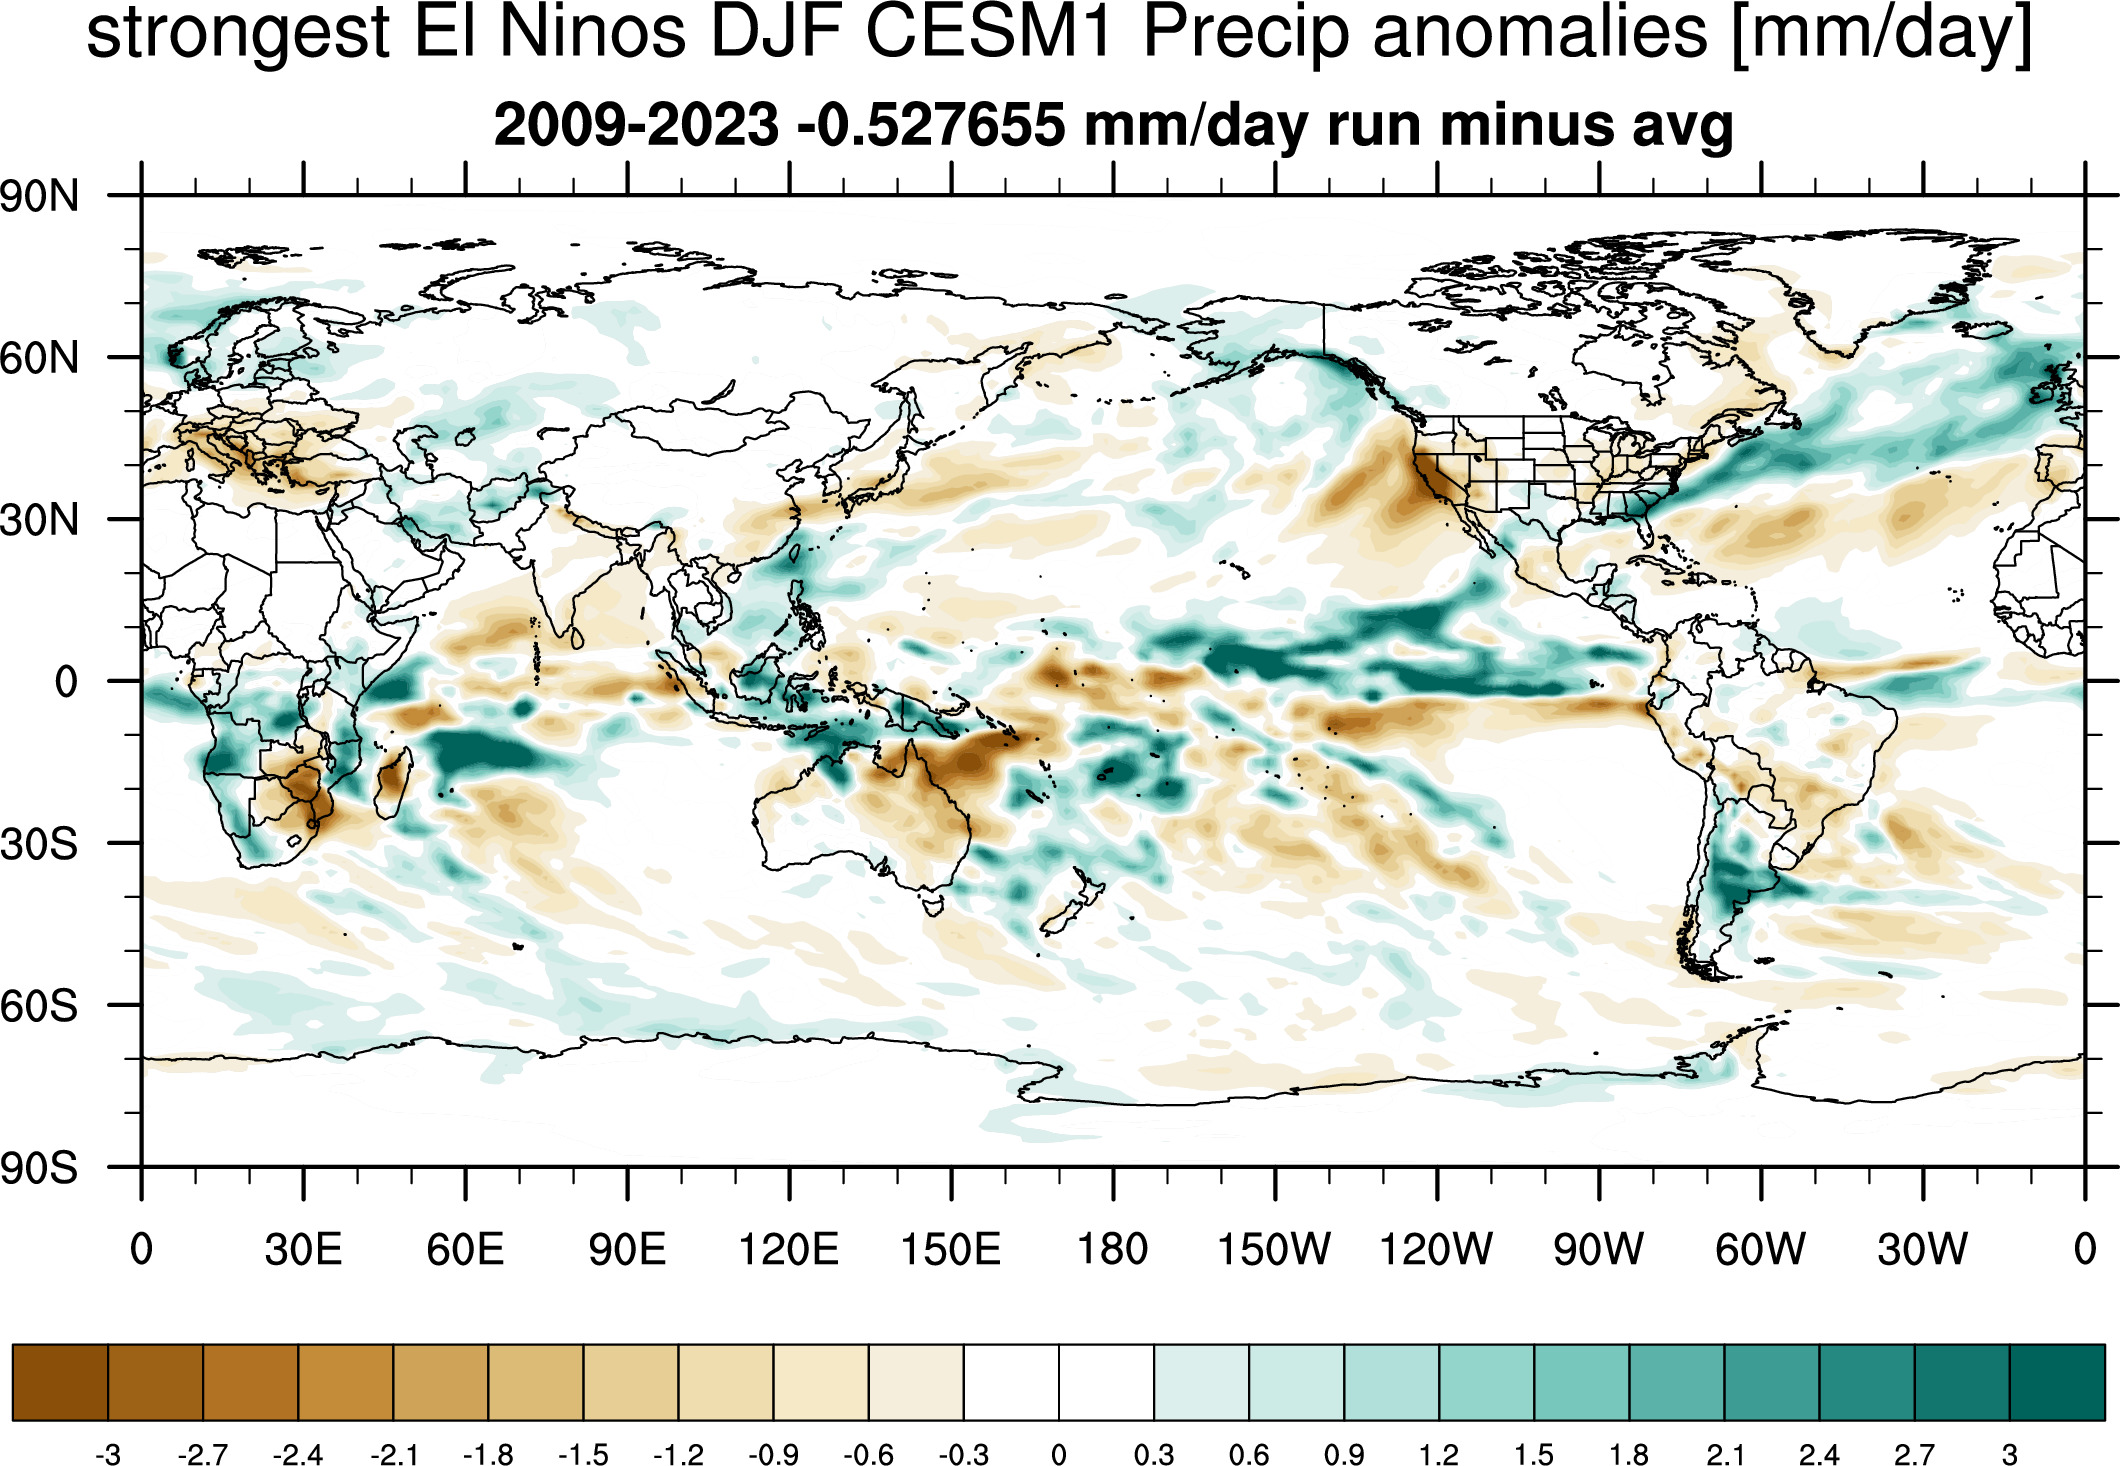
Global Precip Anomaly Maps:
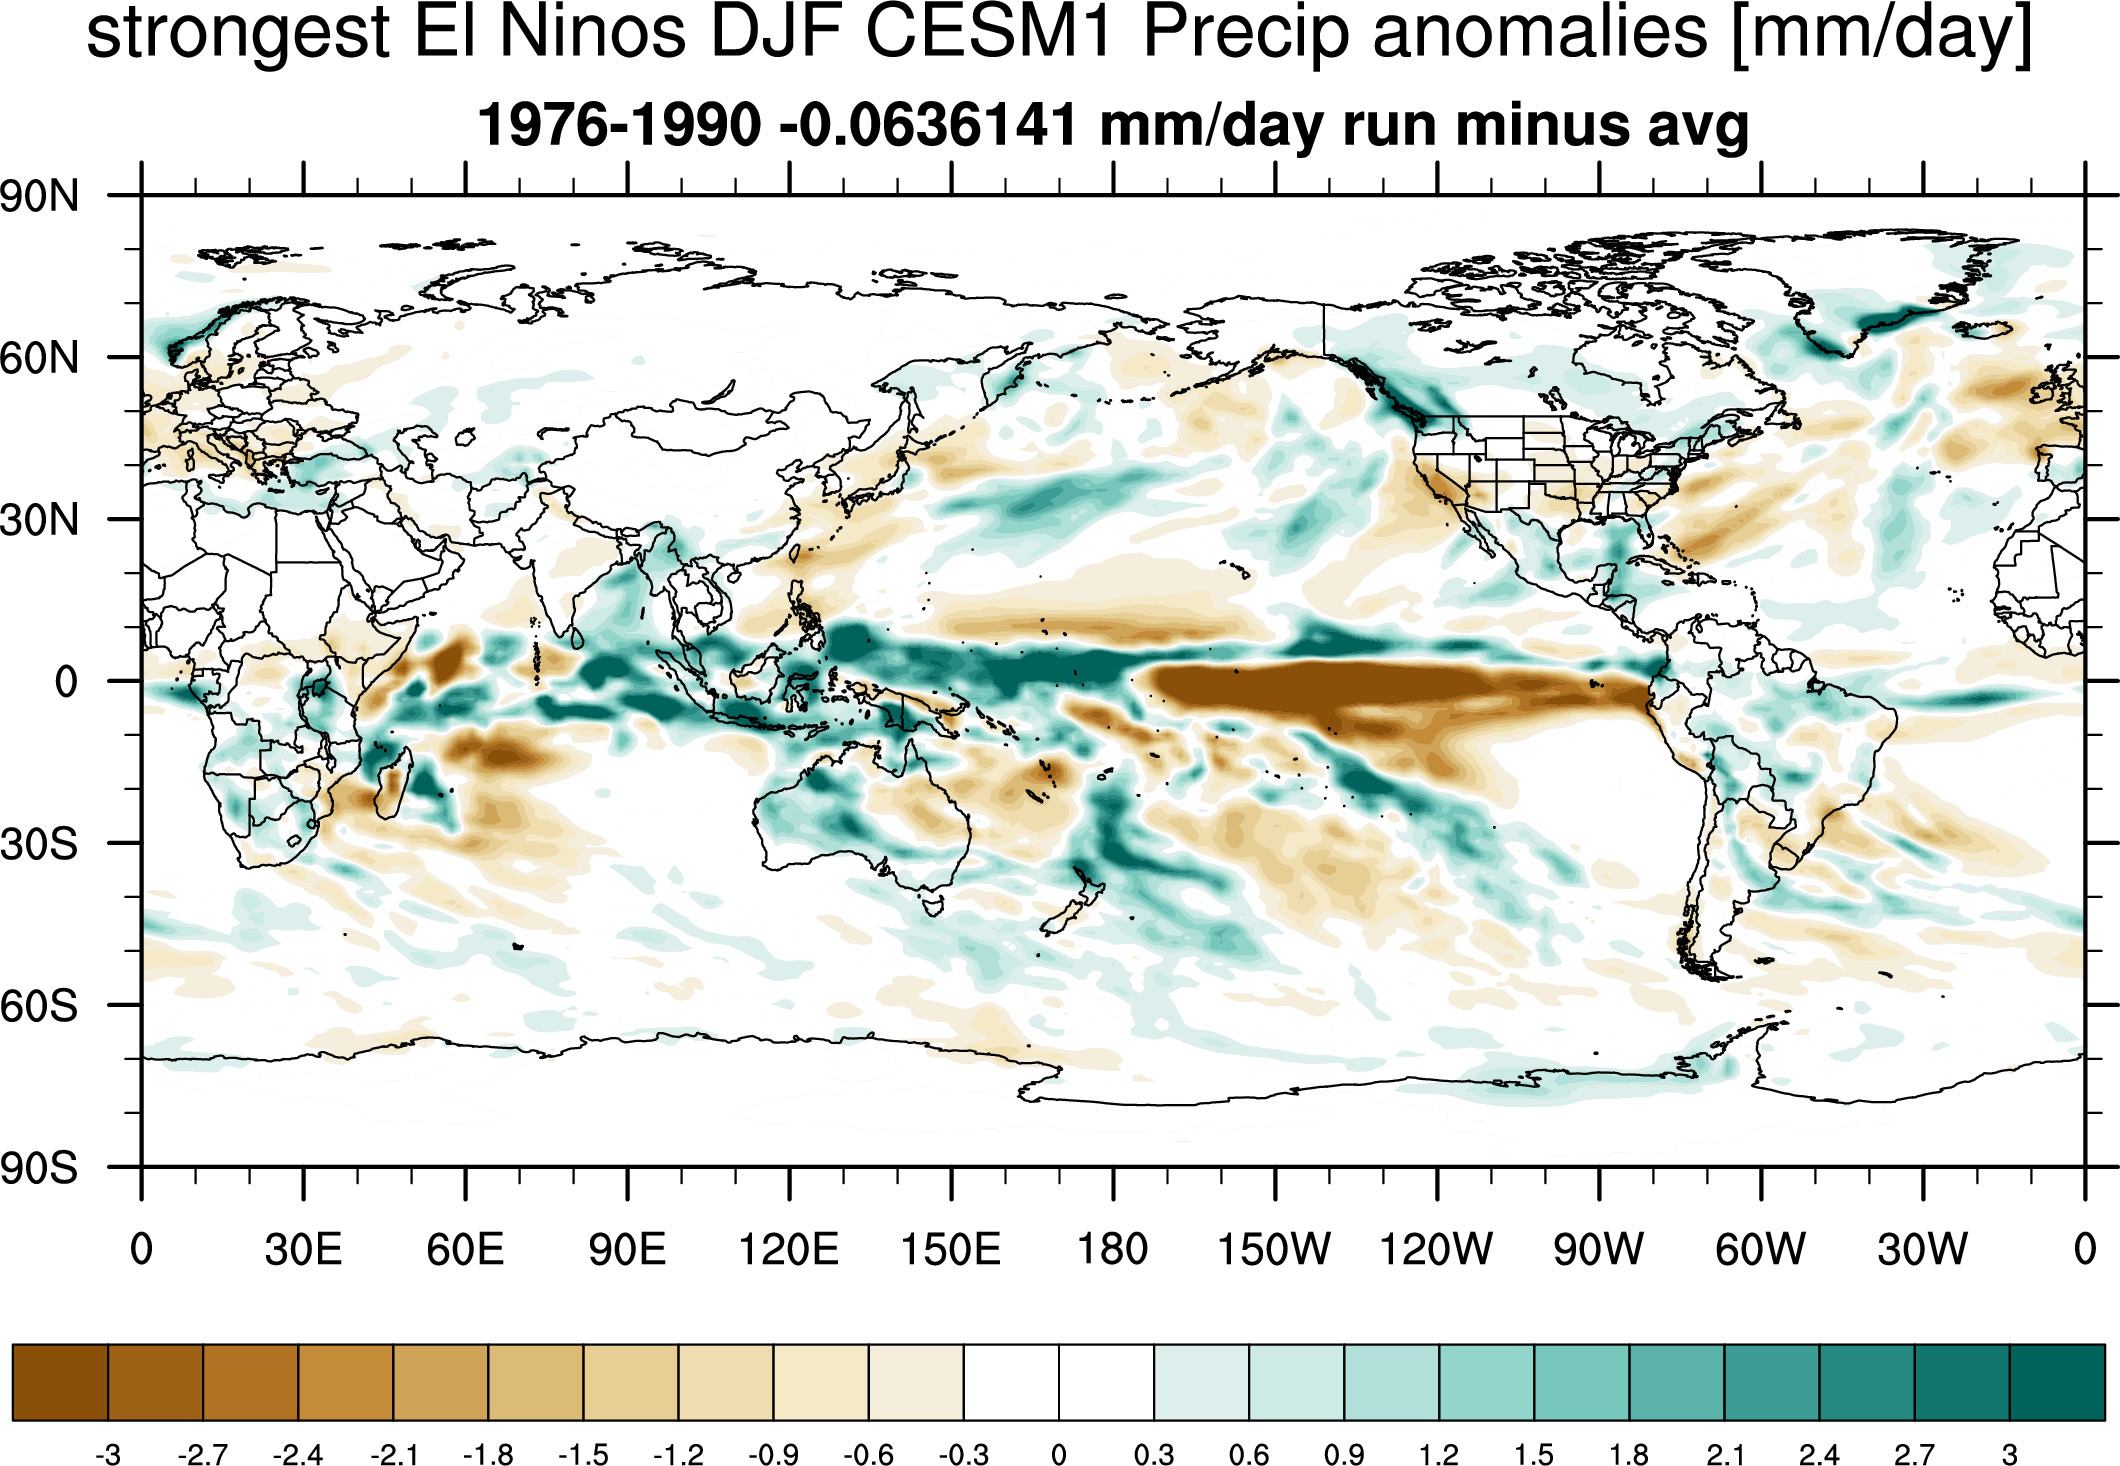
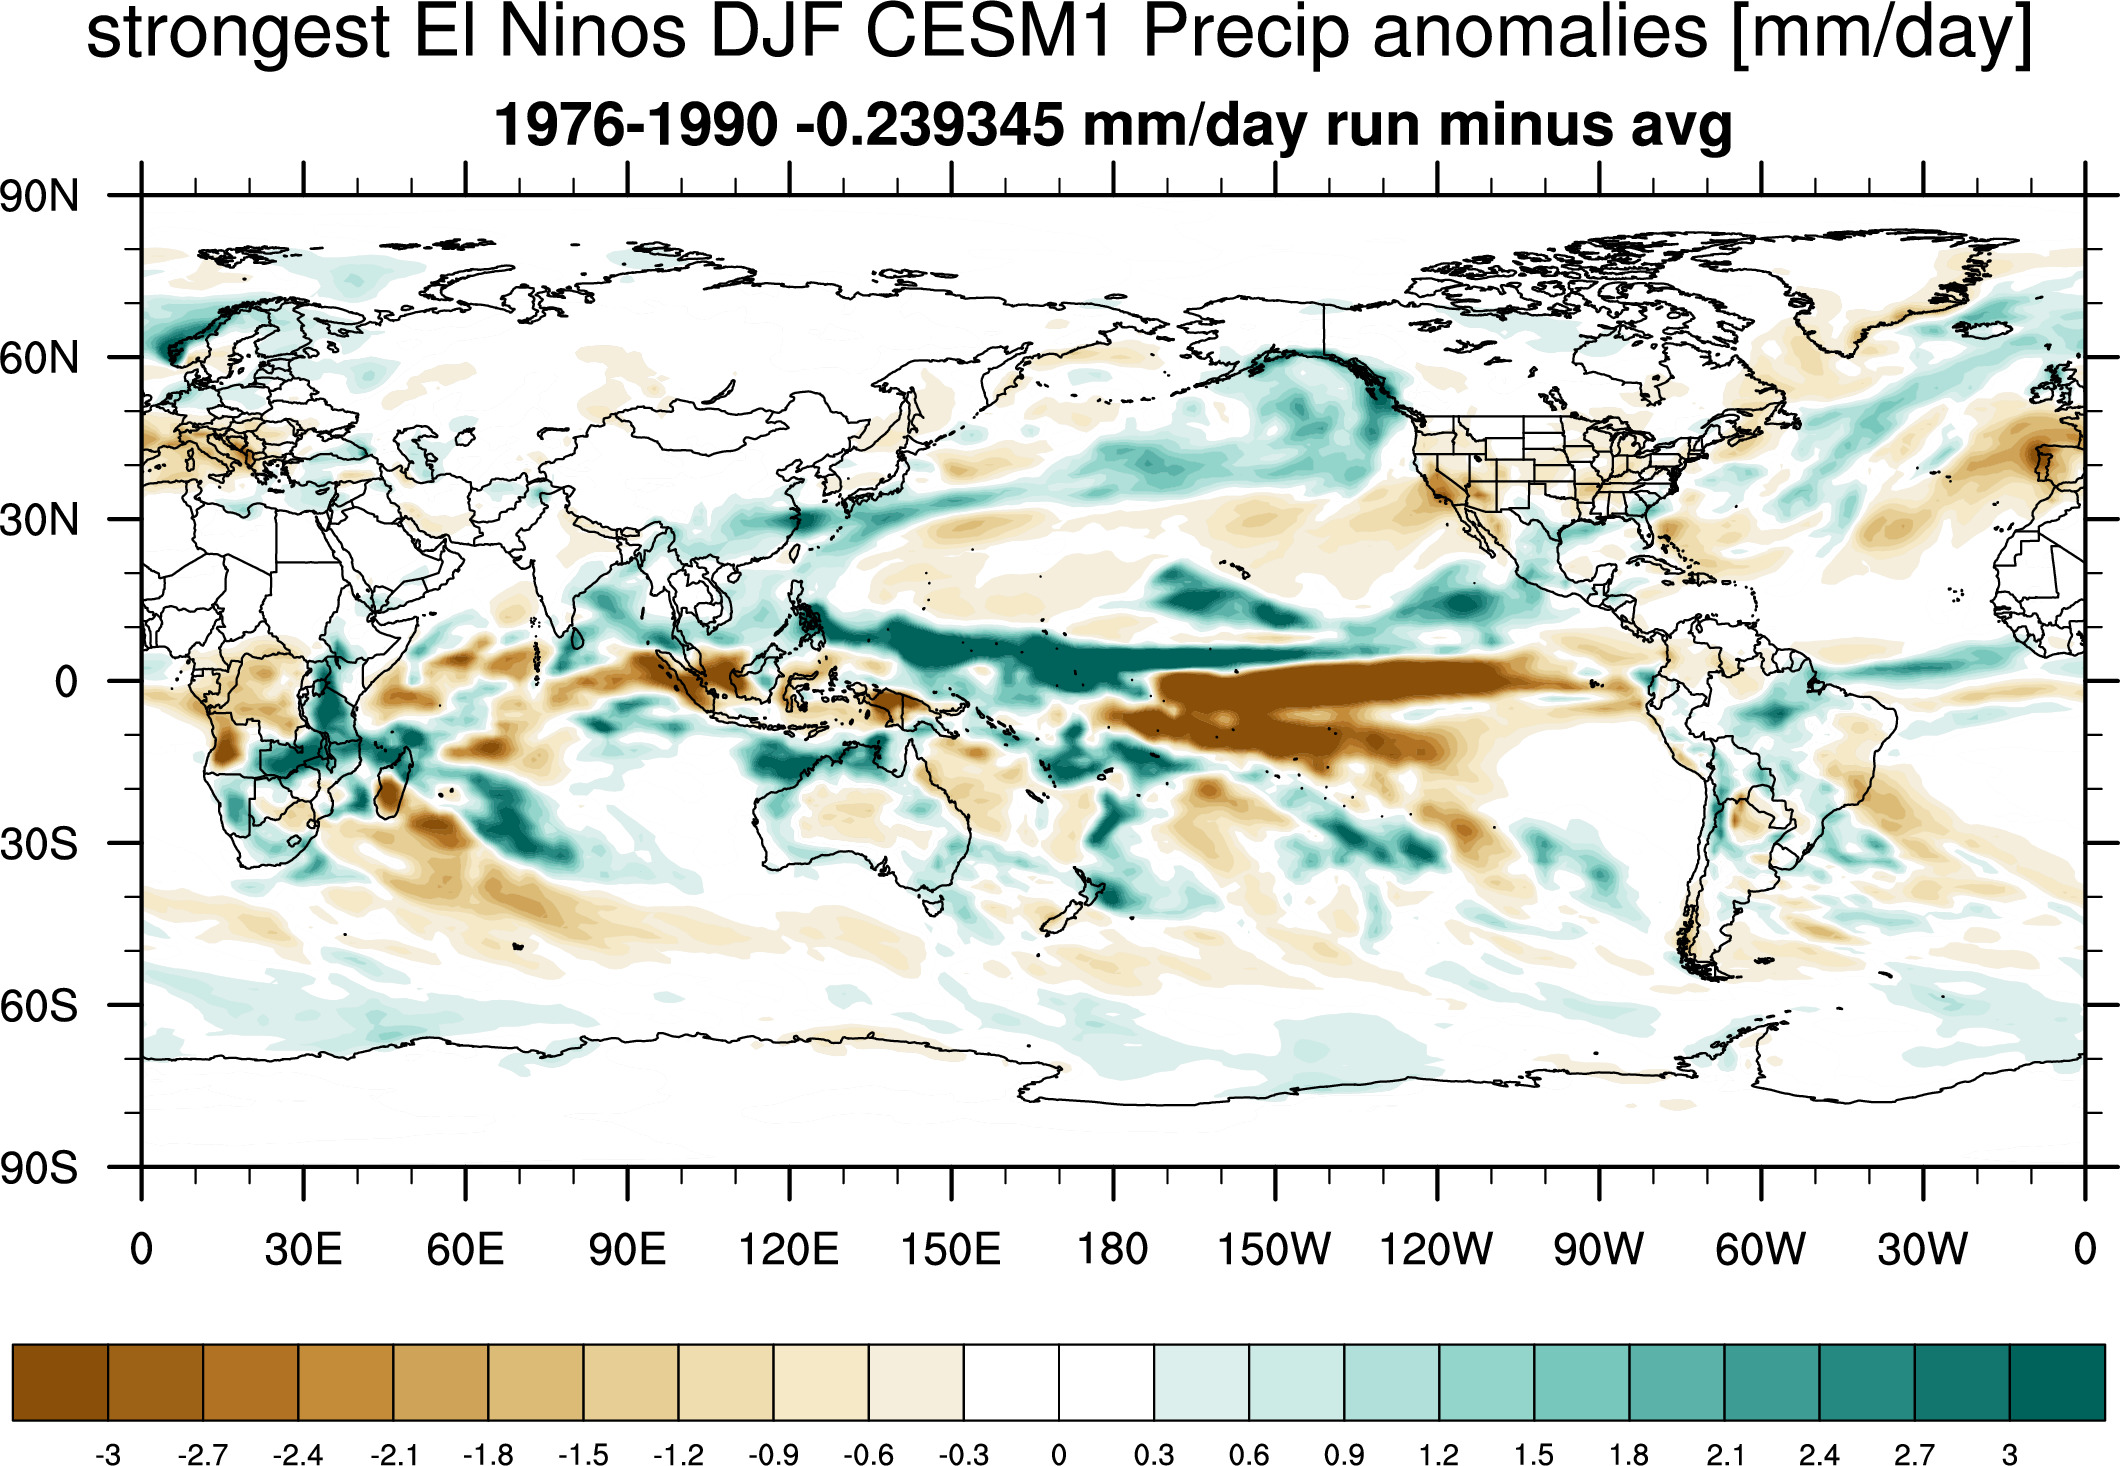
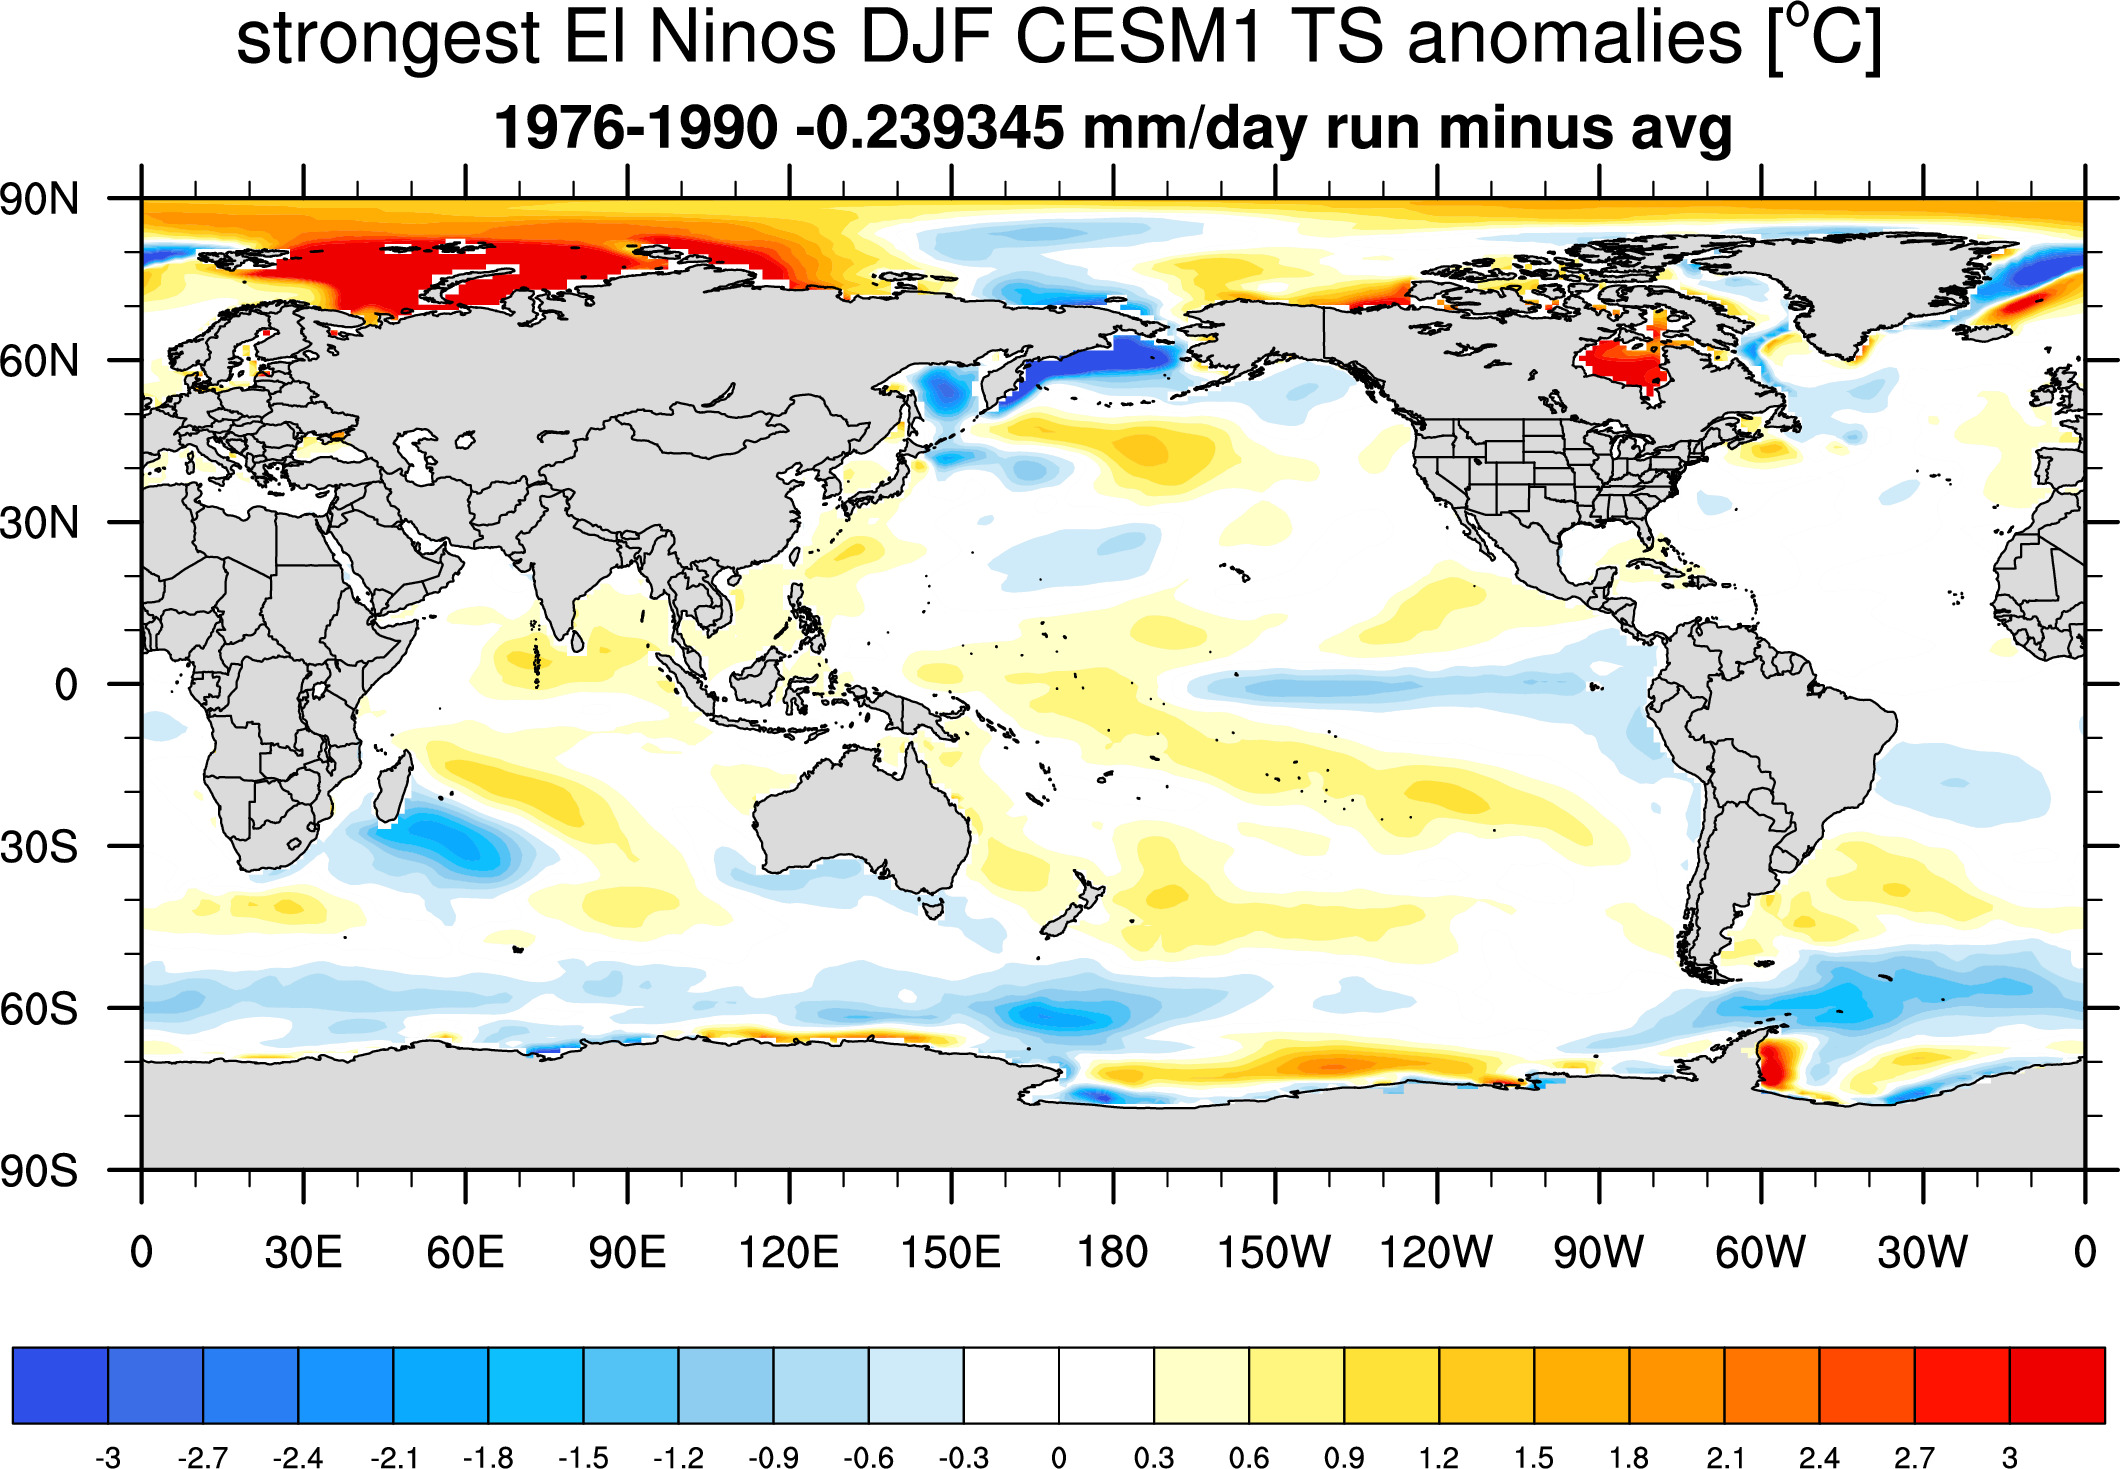
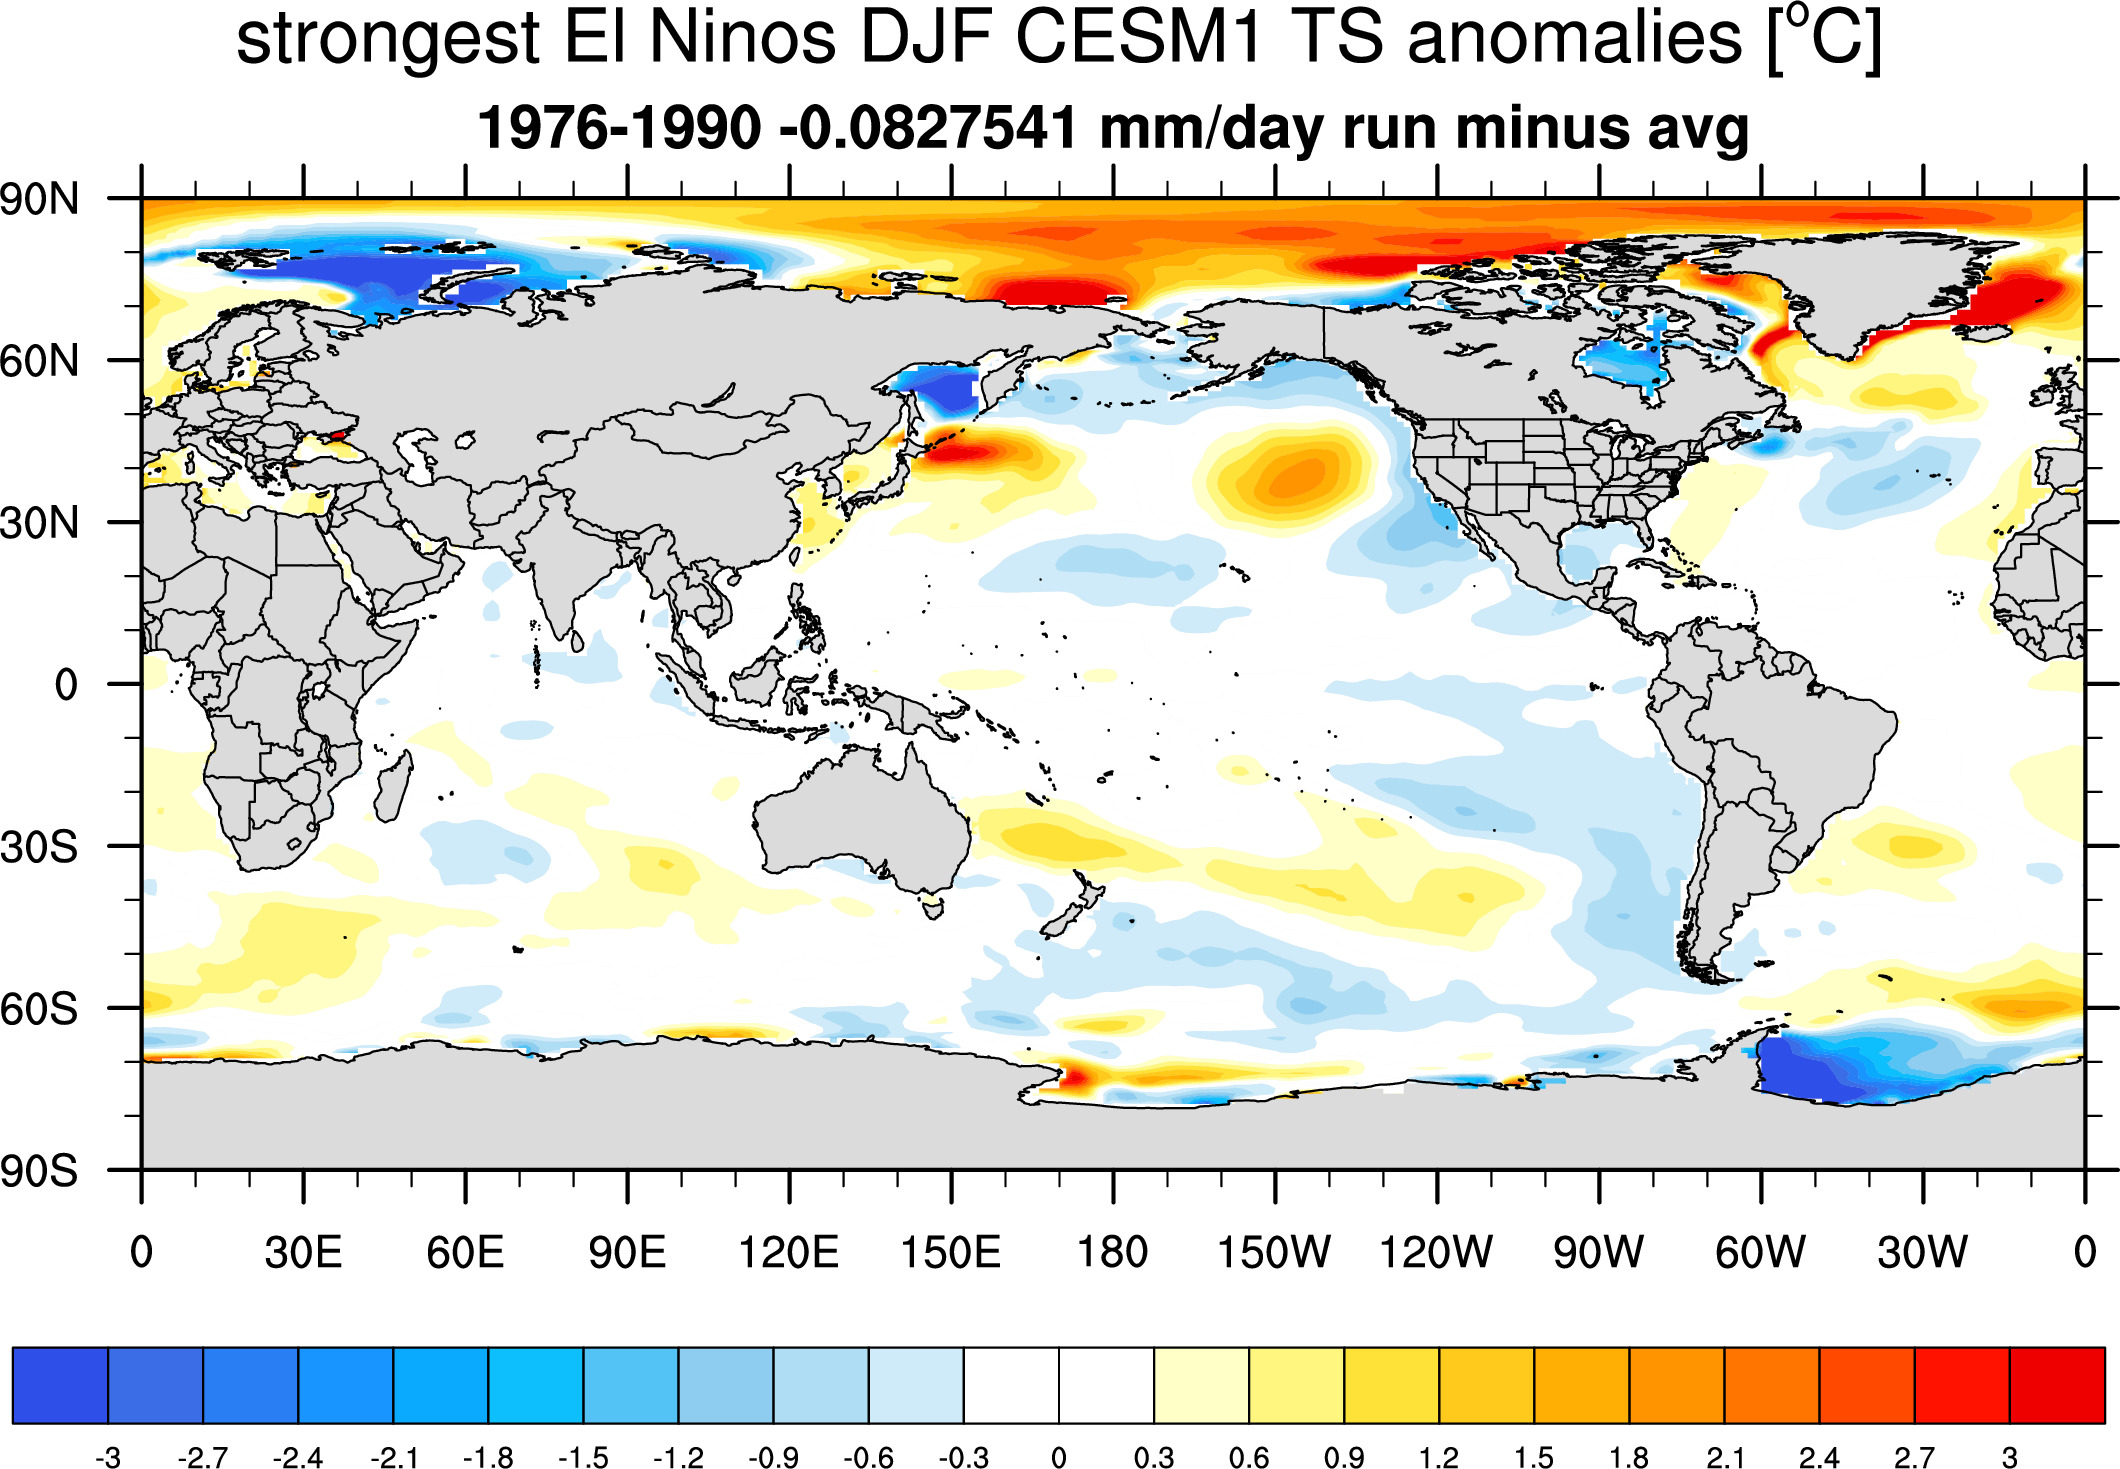
1976-1990: top "strongest" 3 individual runs:
Differences with average
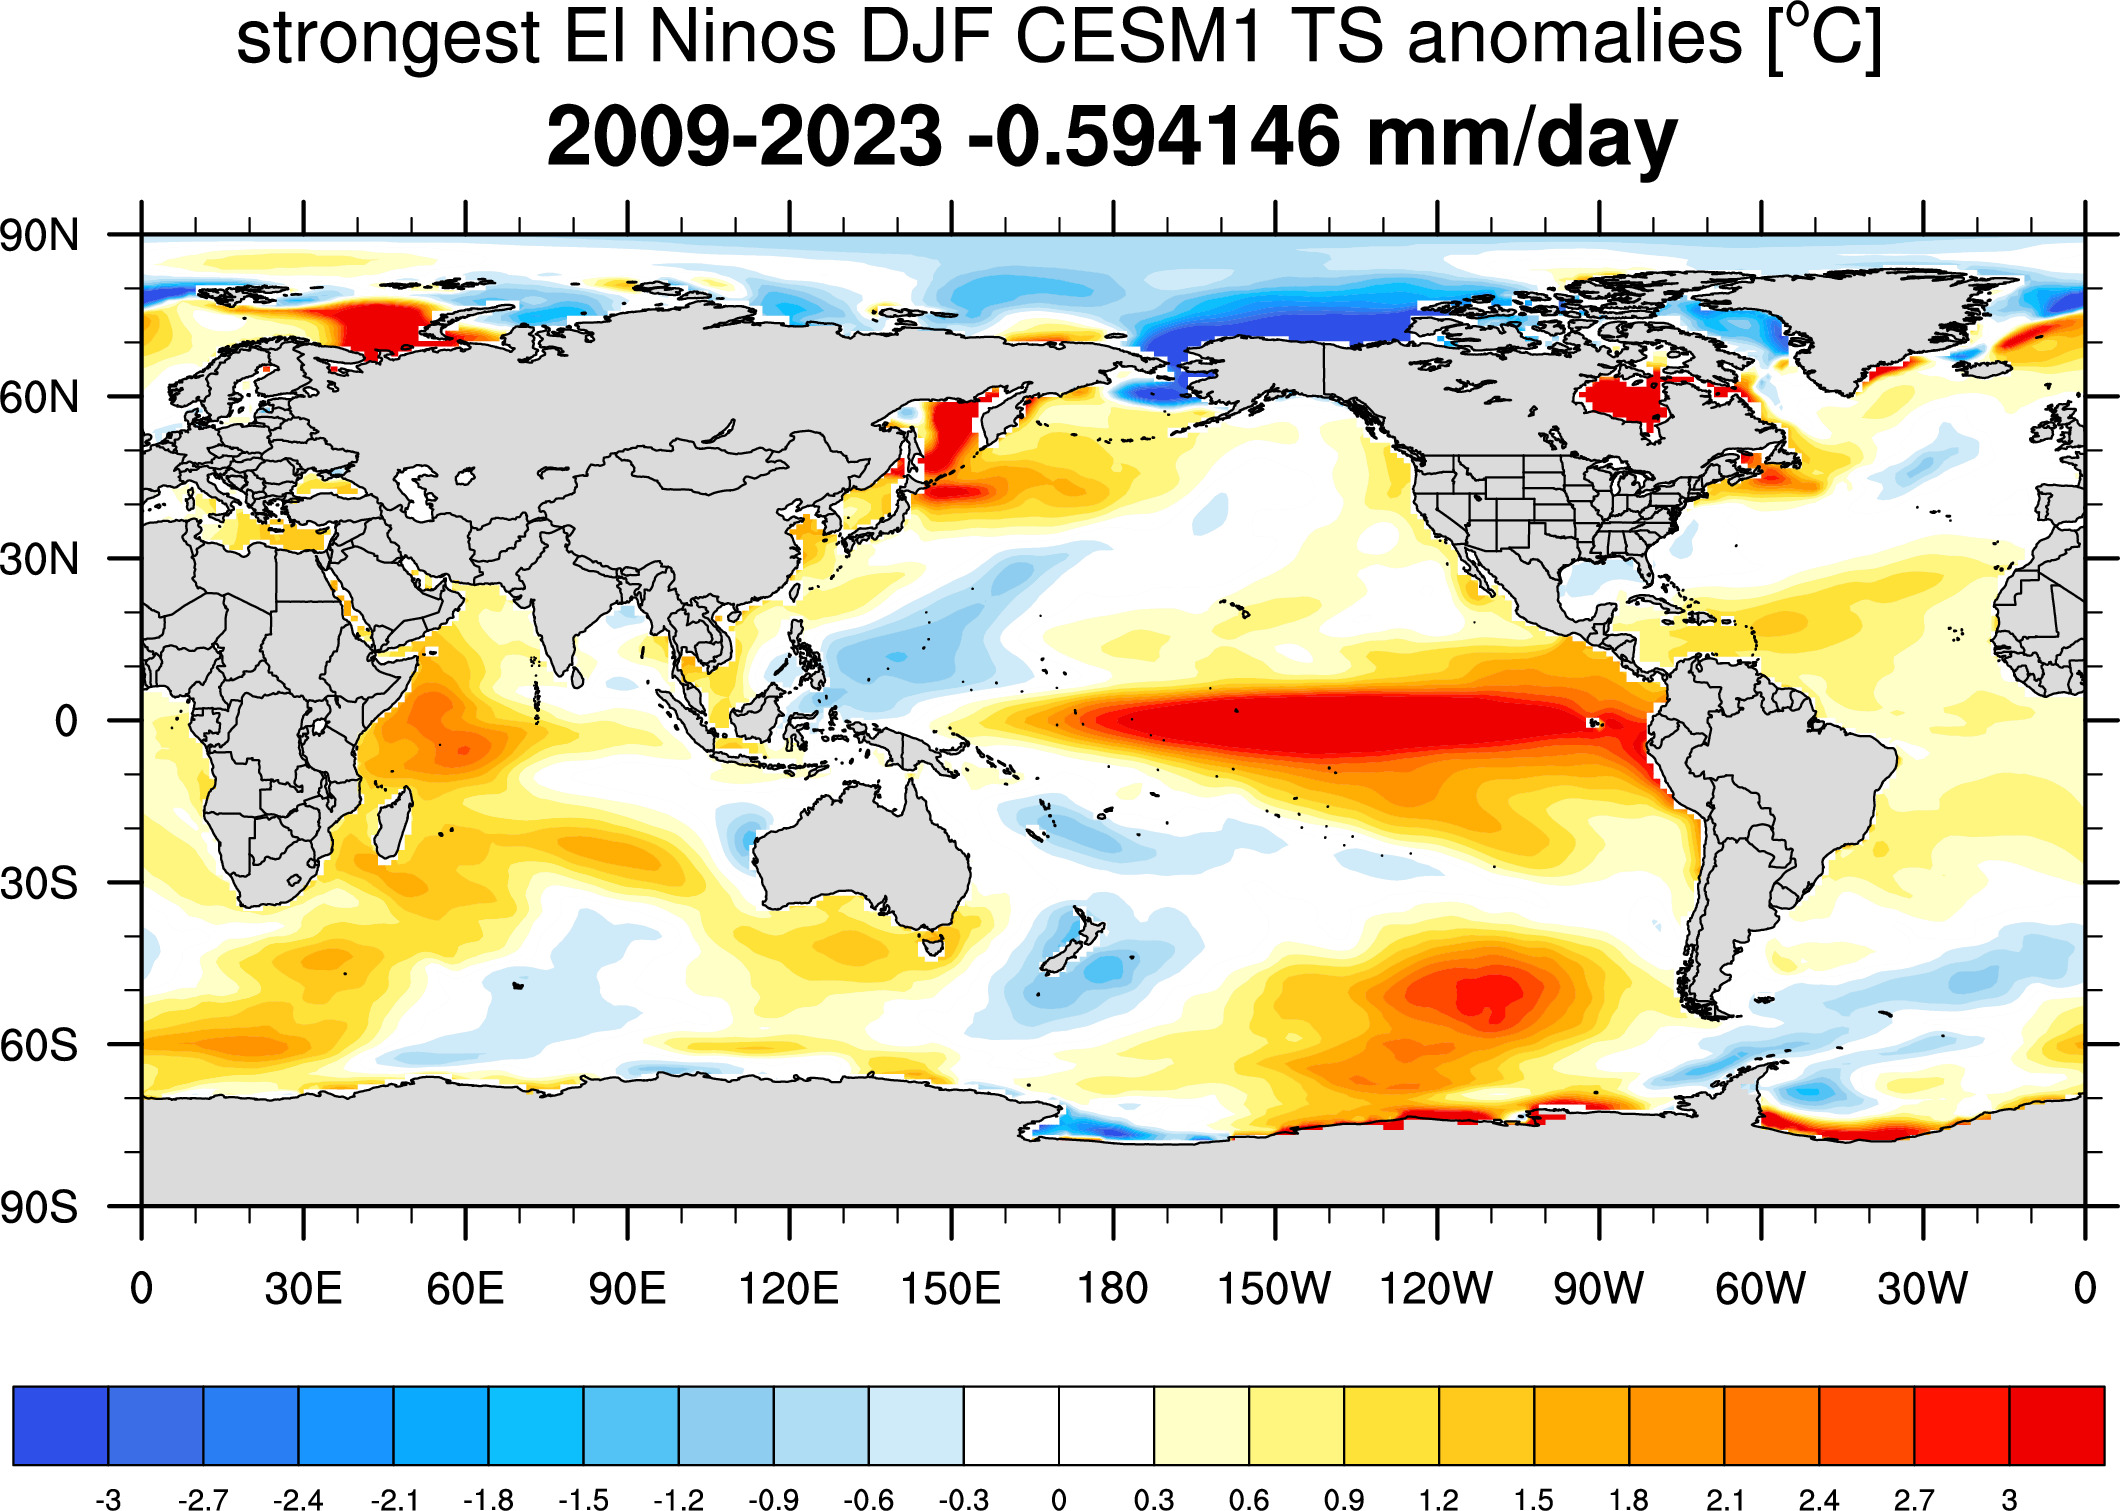
2009-2023: top "strongest" 3 individual runs:
Differences with average
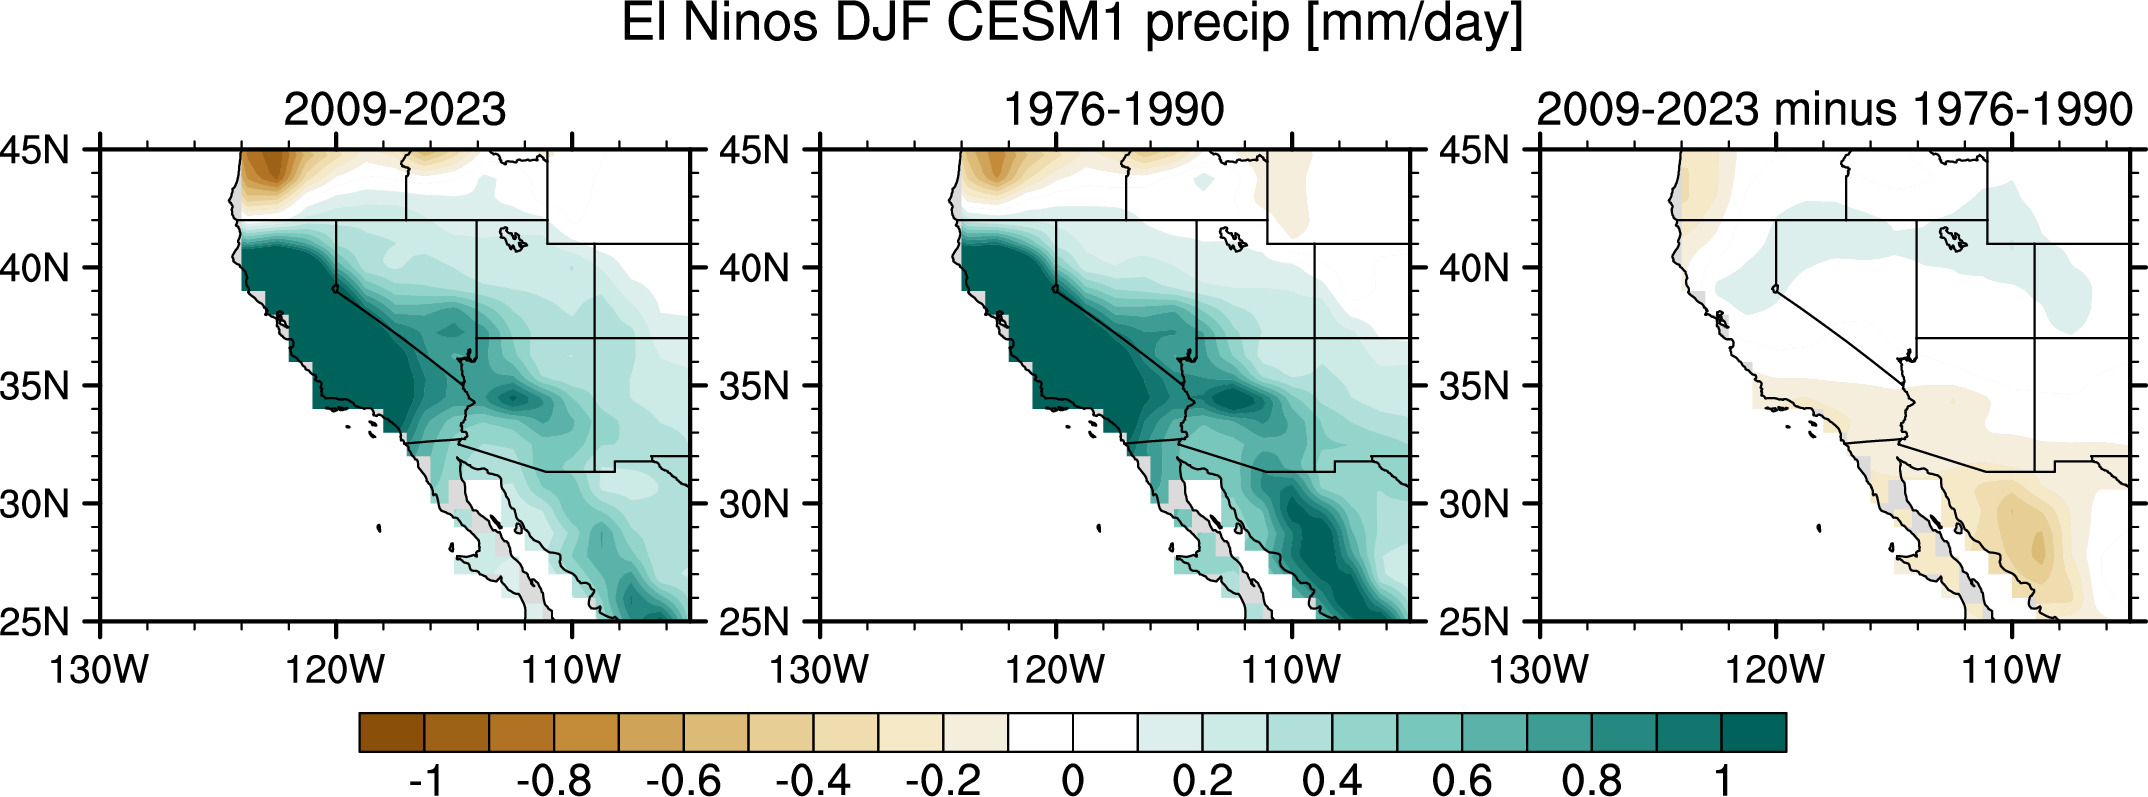
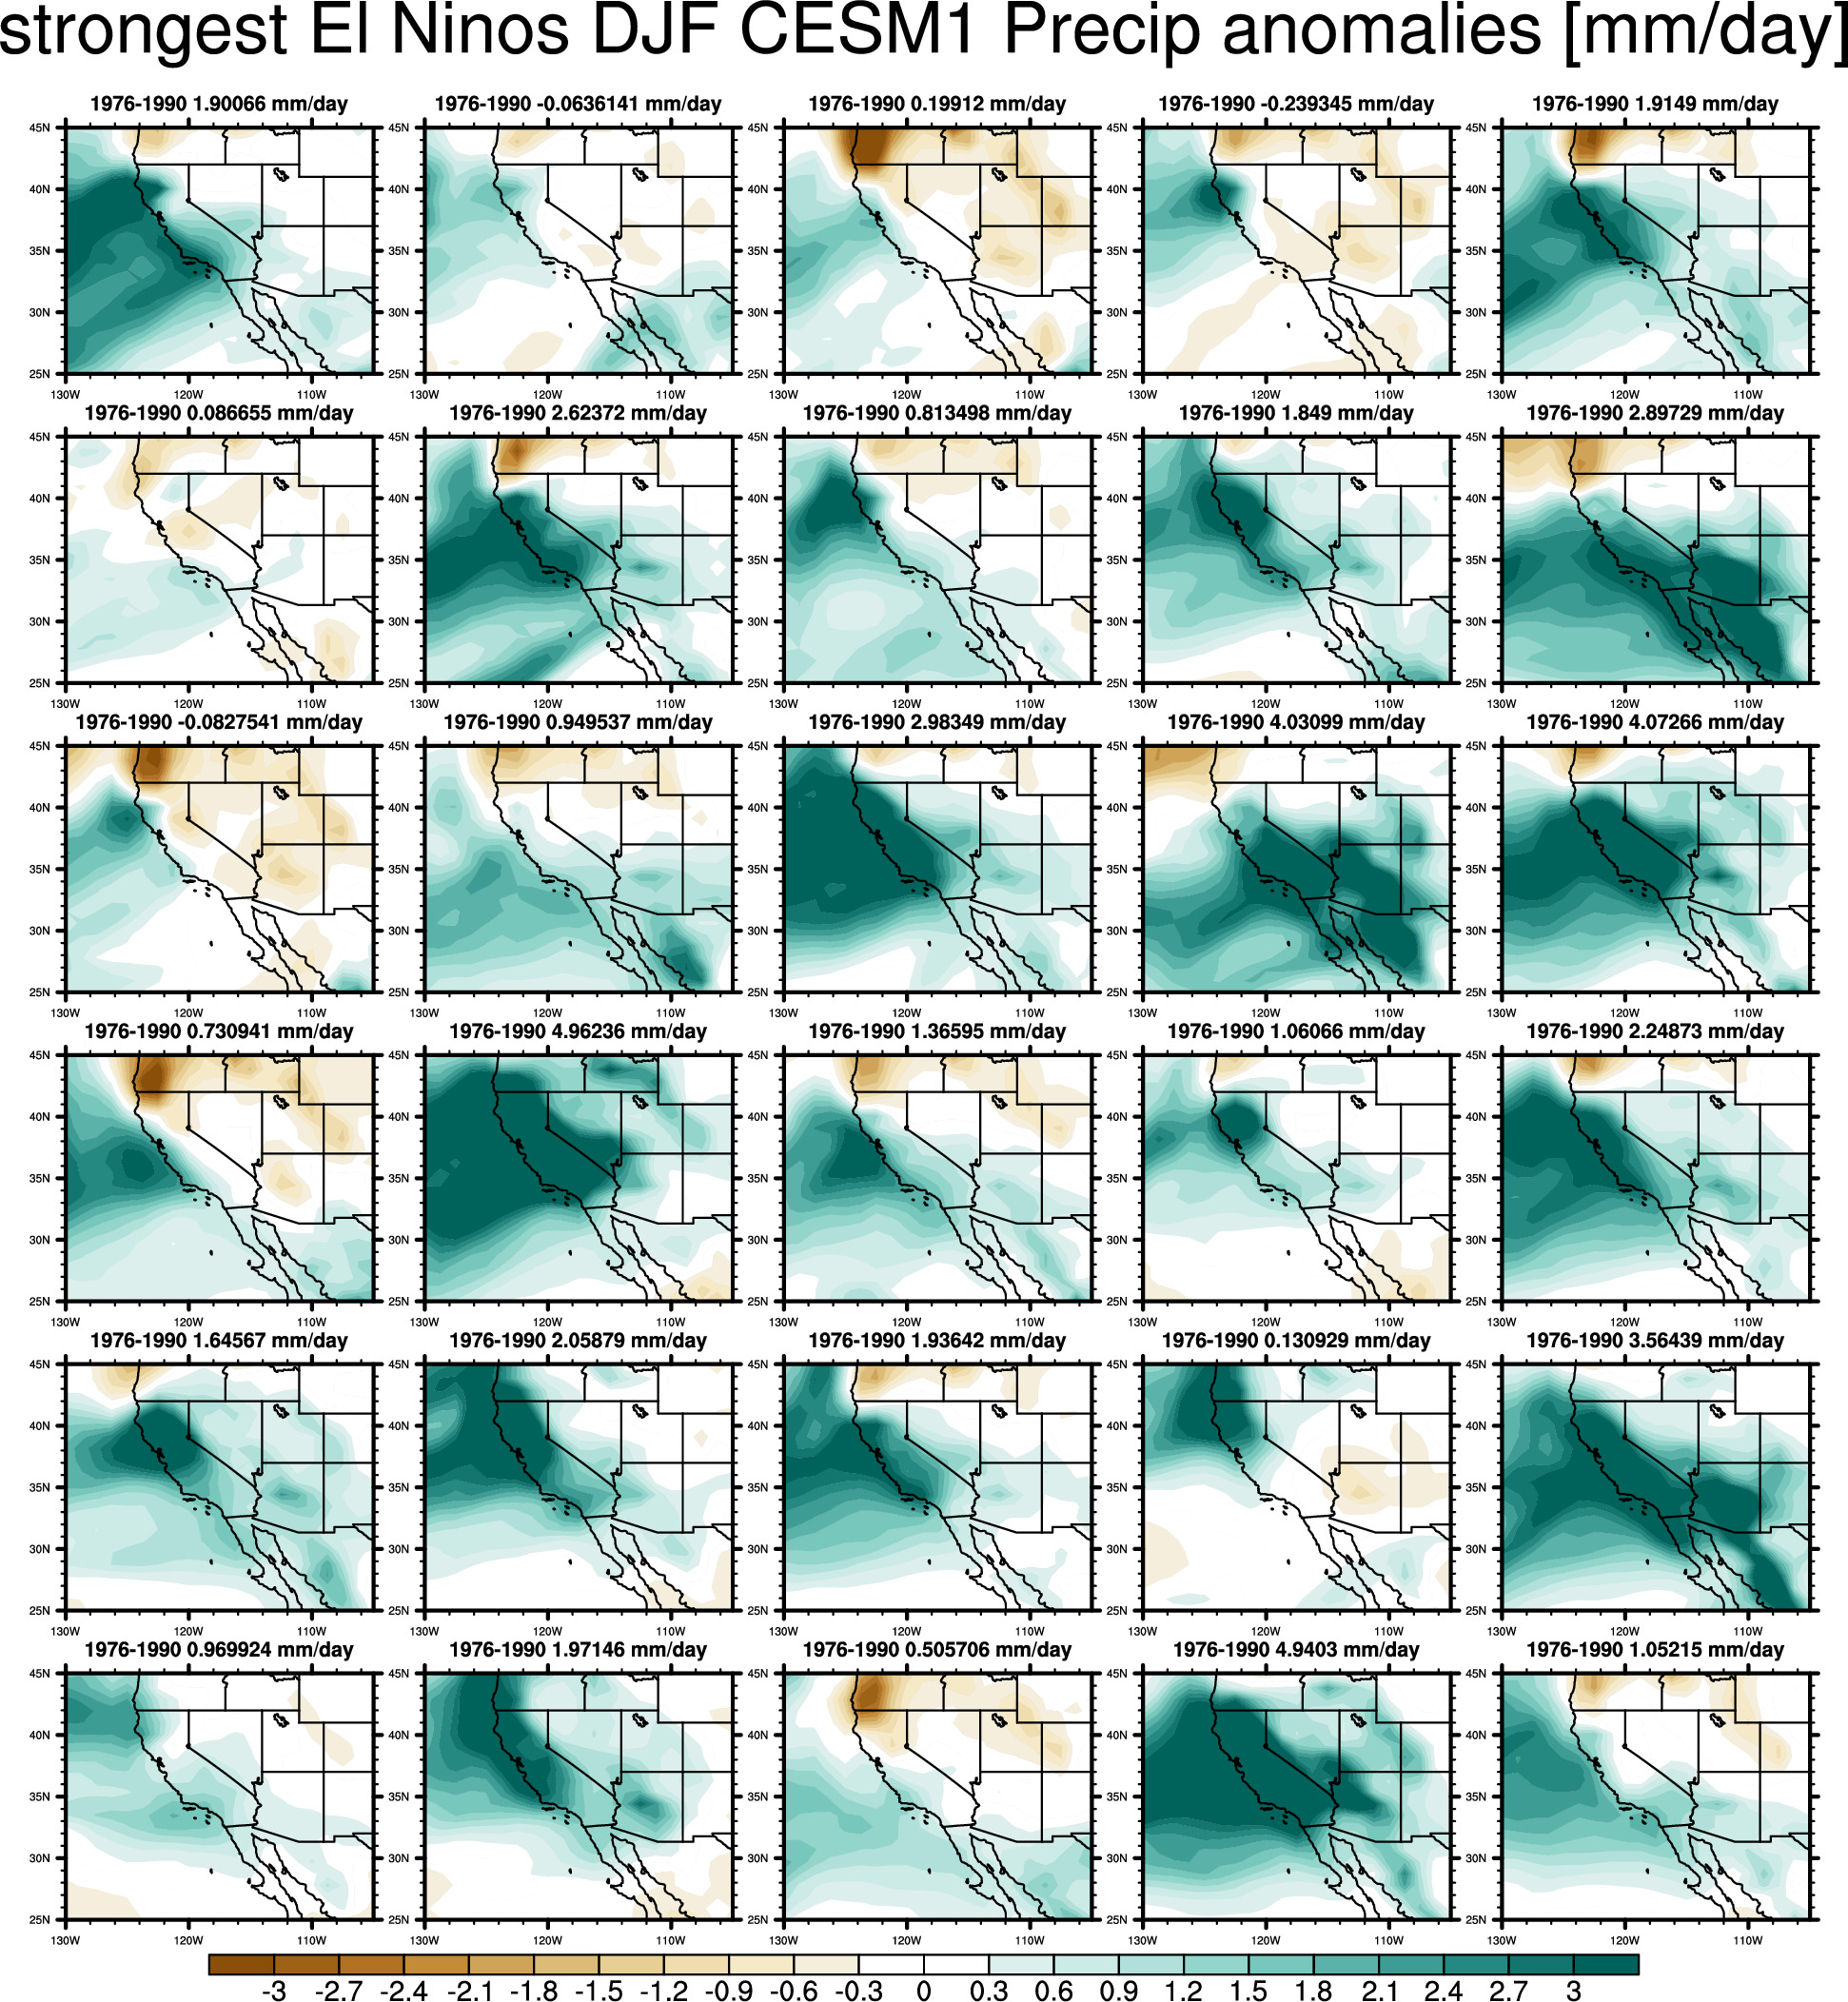
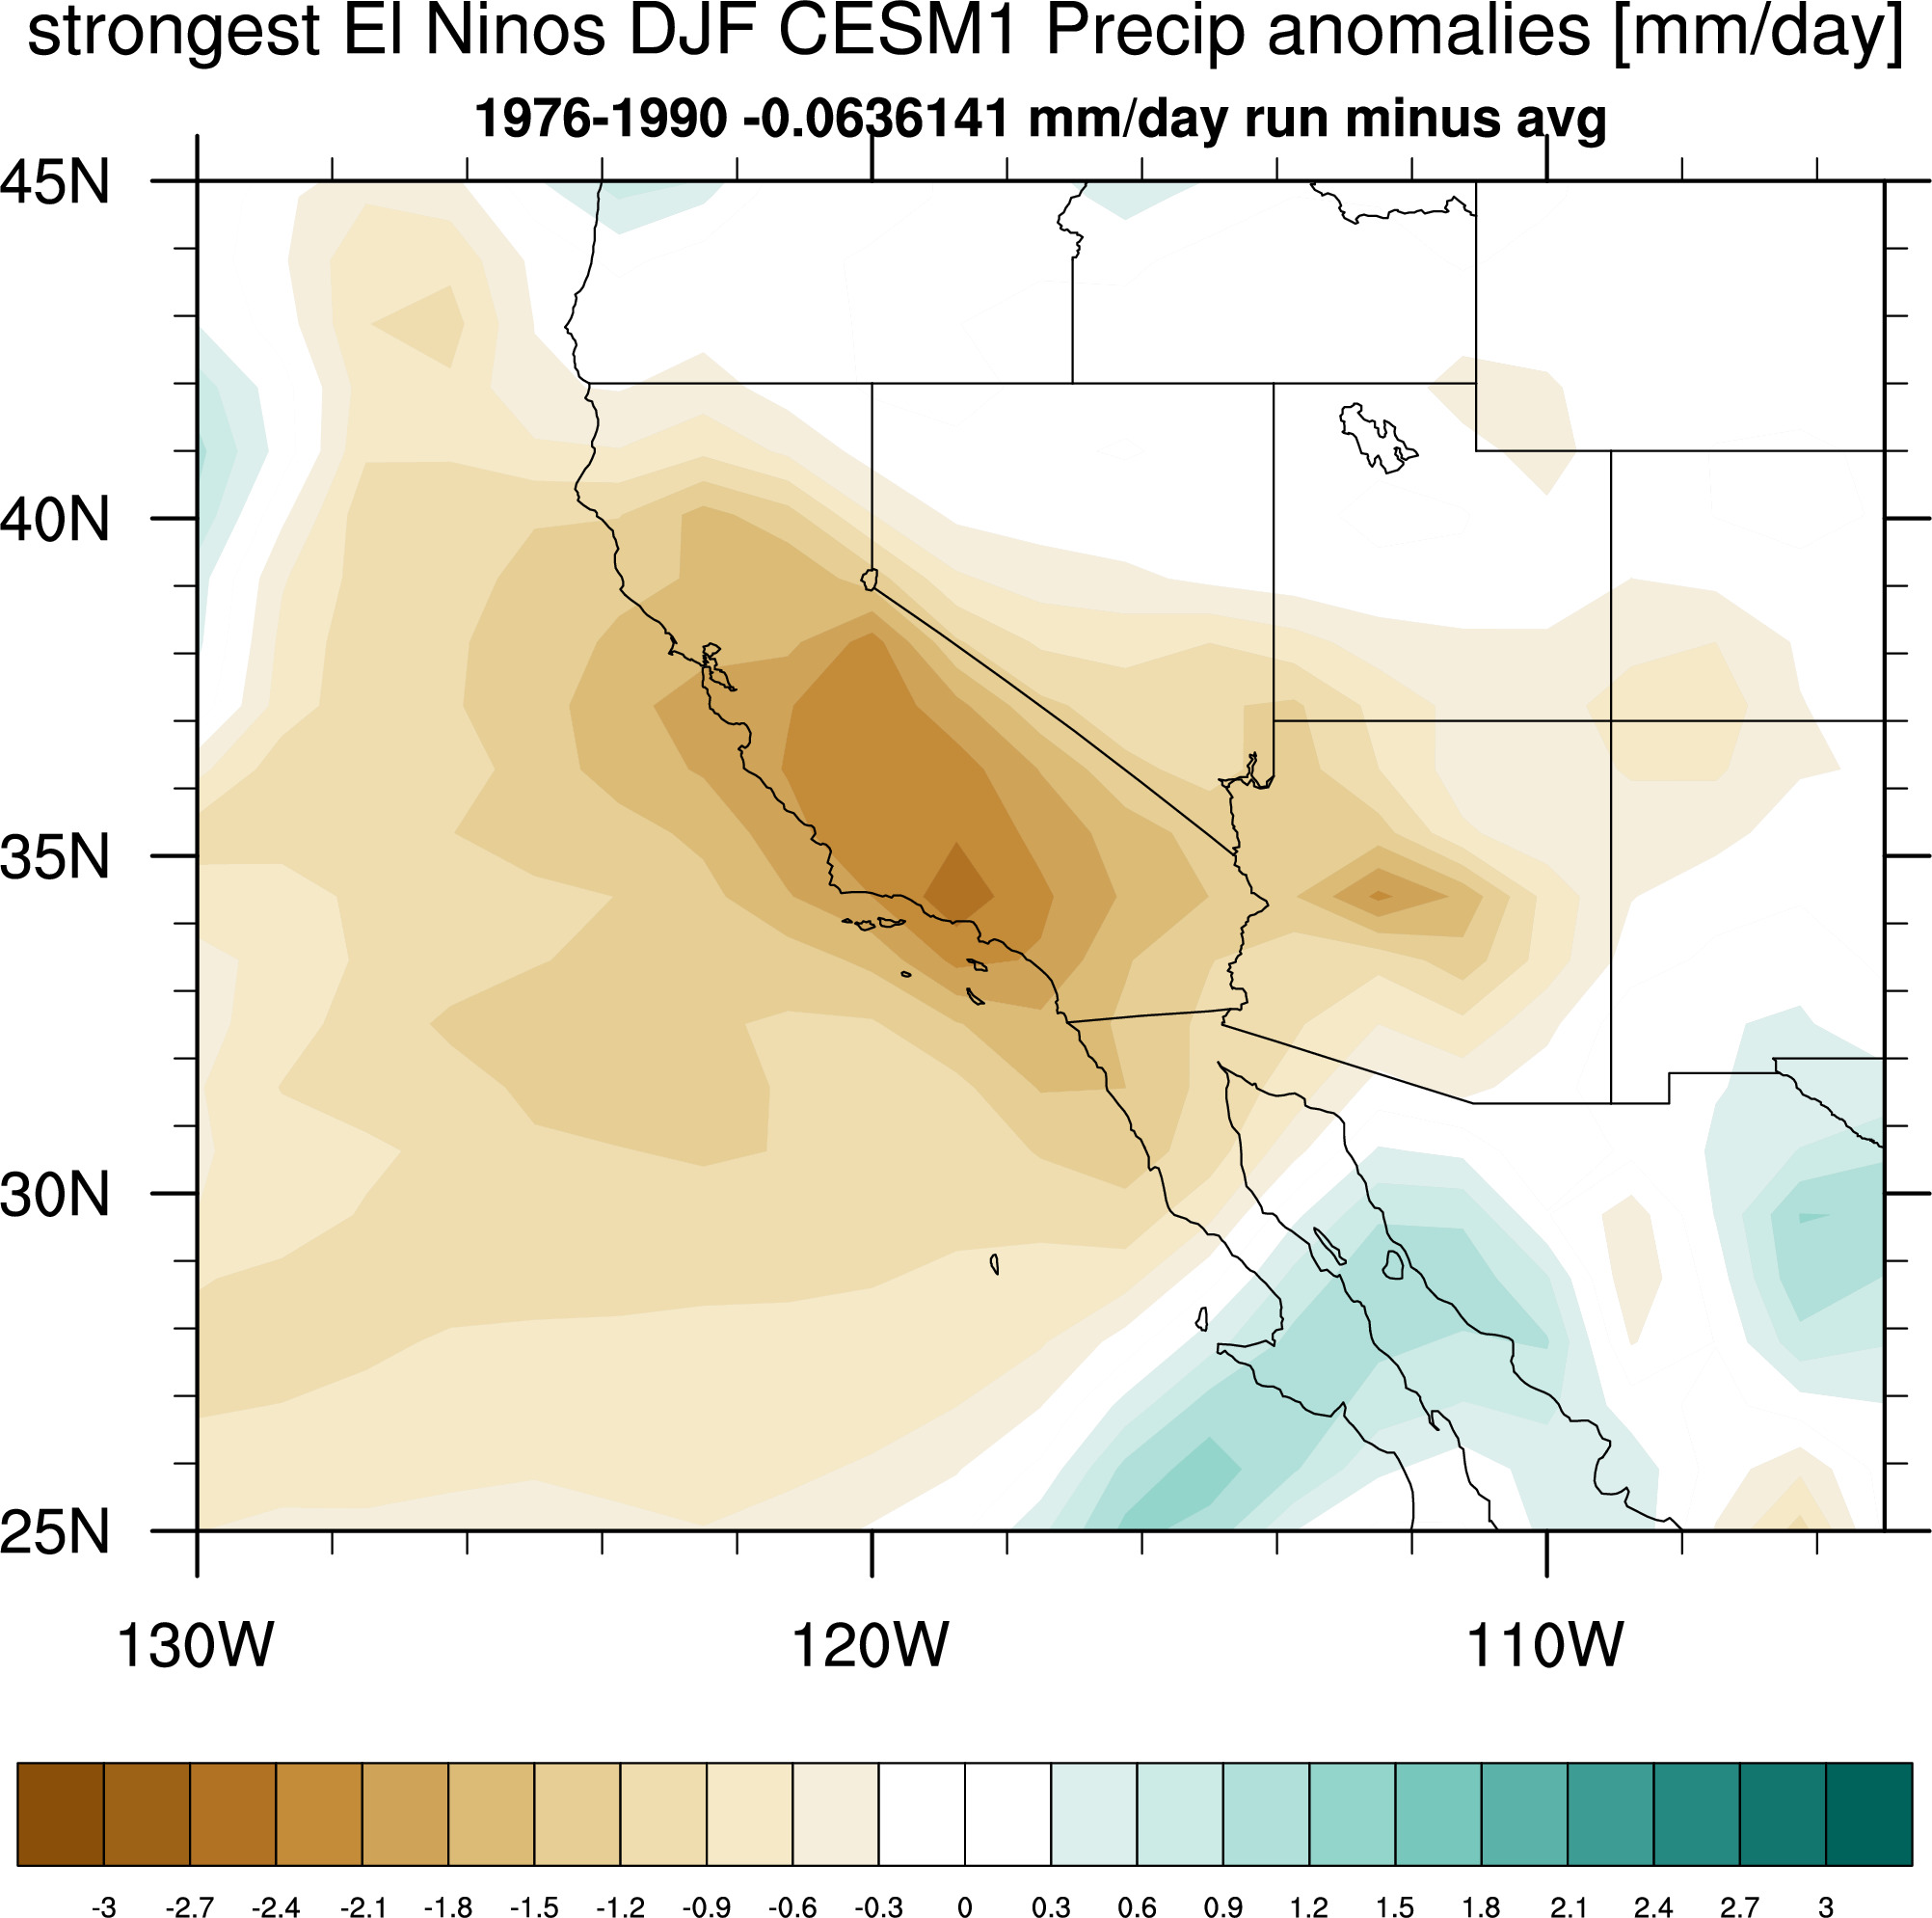
CA-area Precip Anomaly Maps:
1976-1990: top "strongest" 3 individual runs:
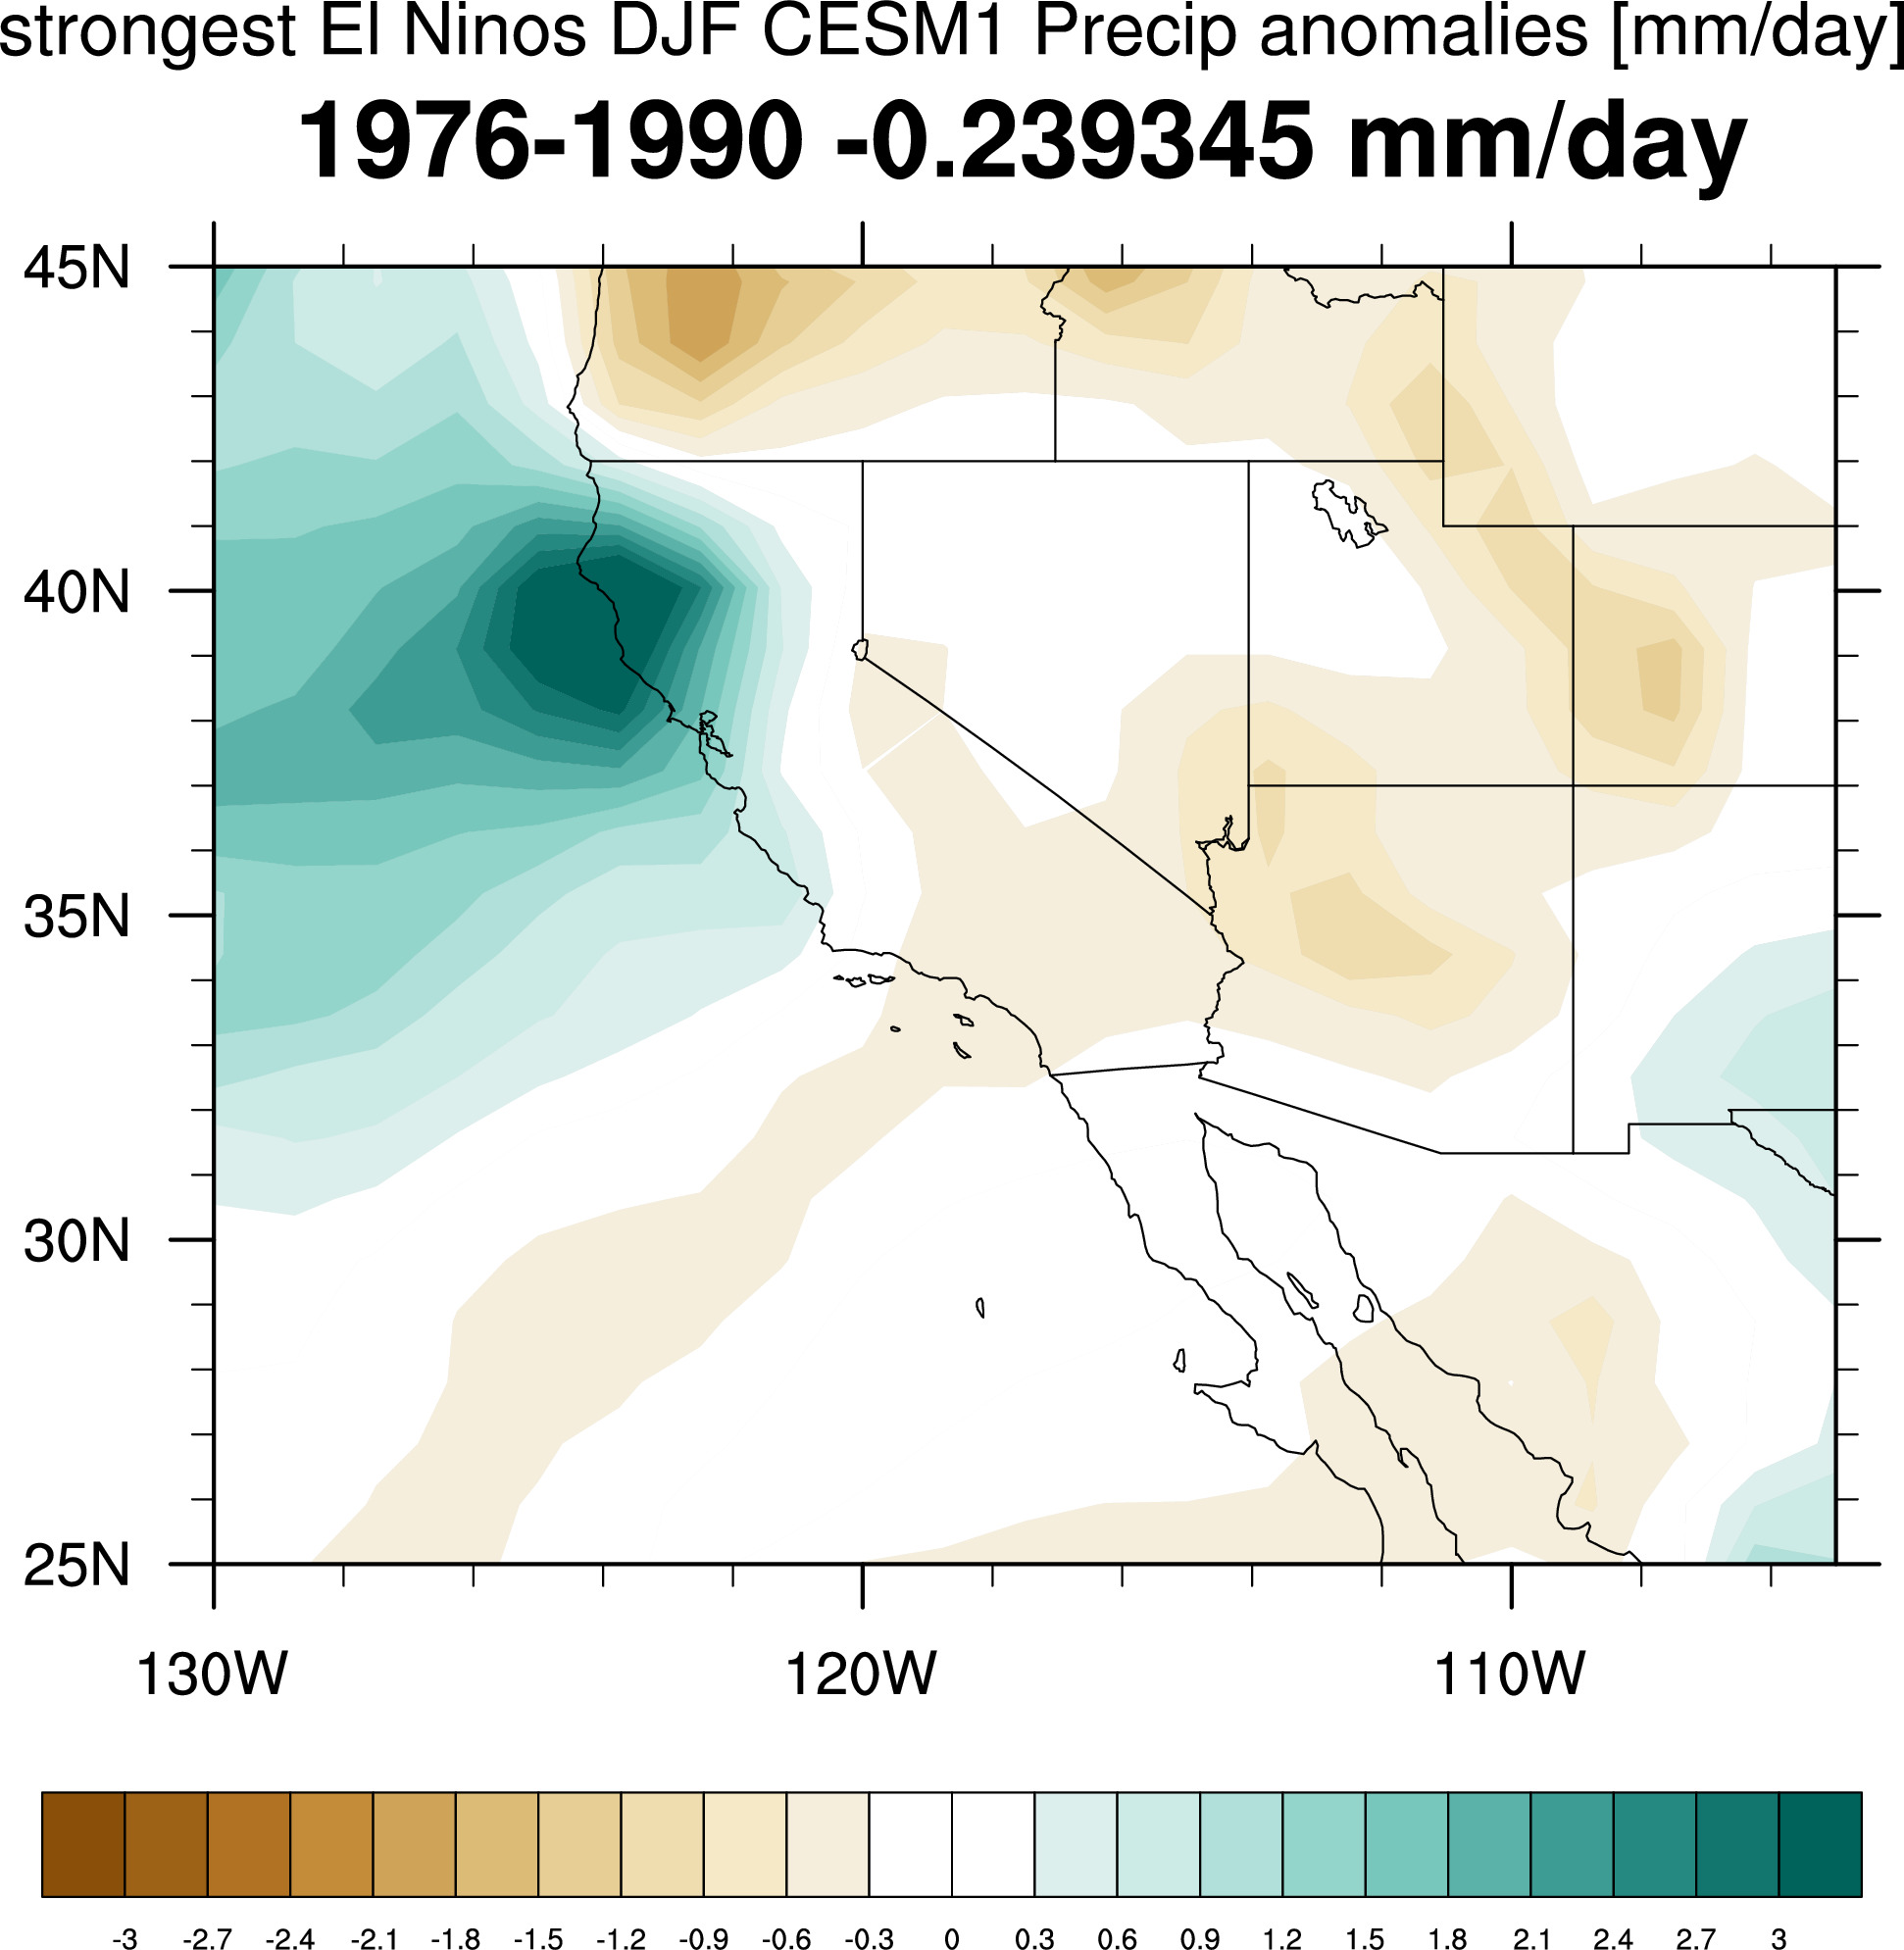
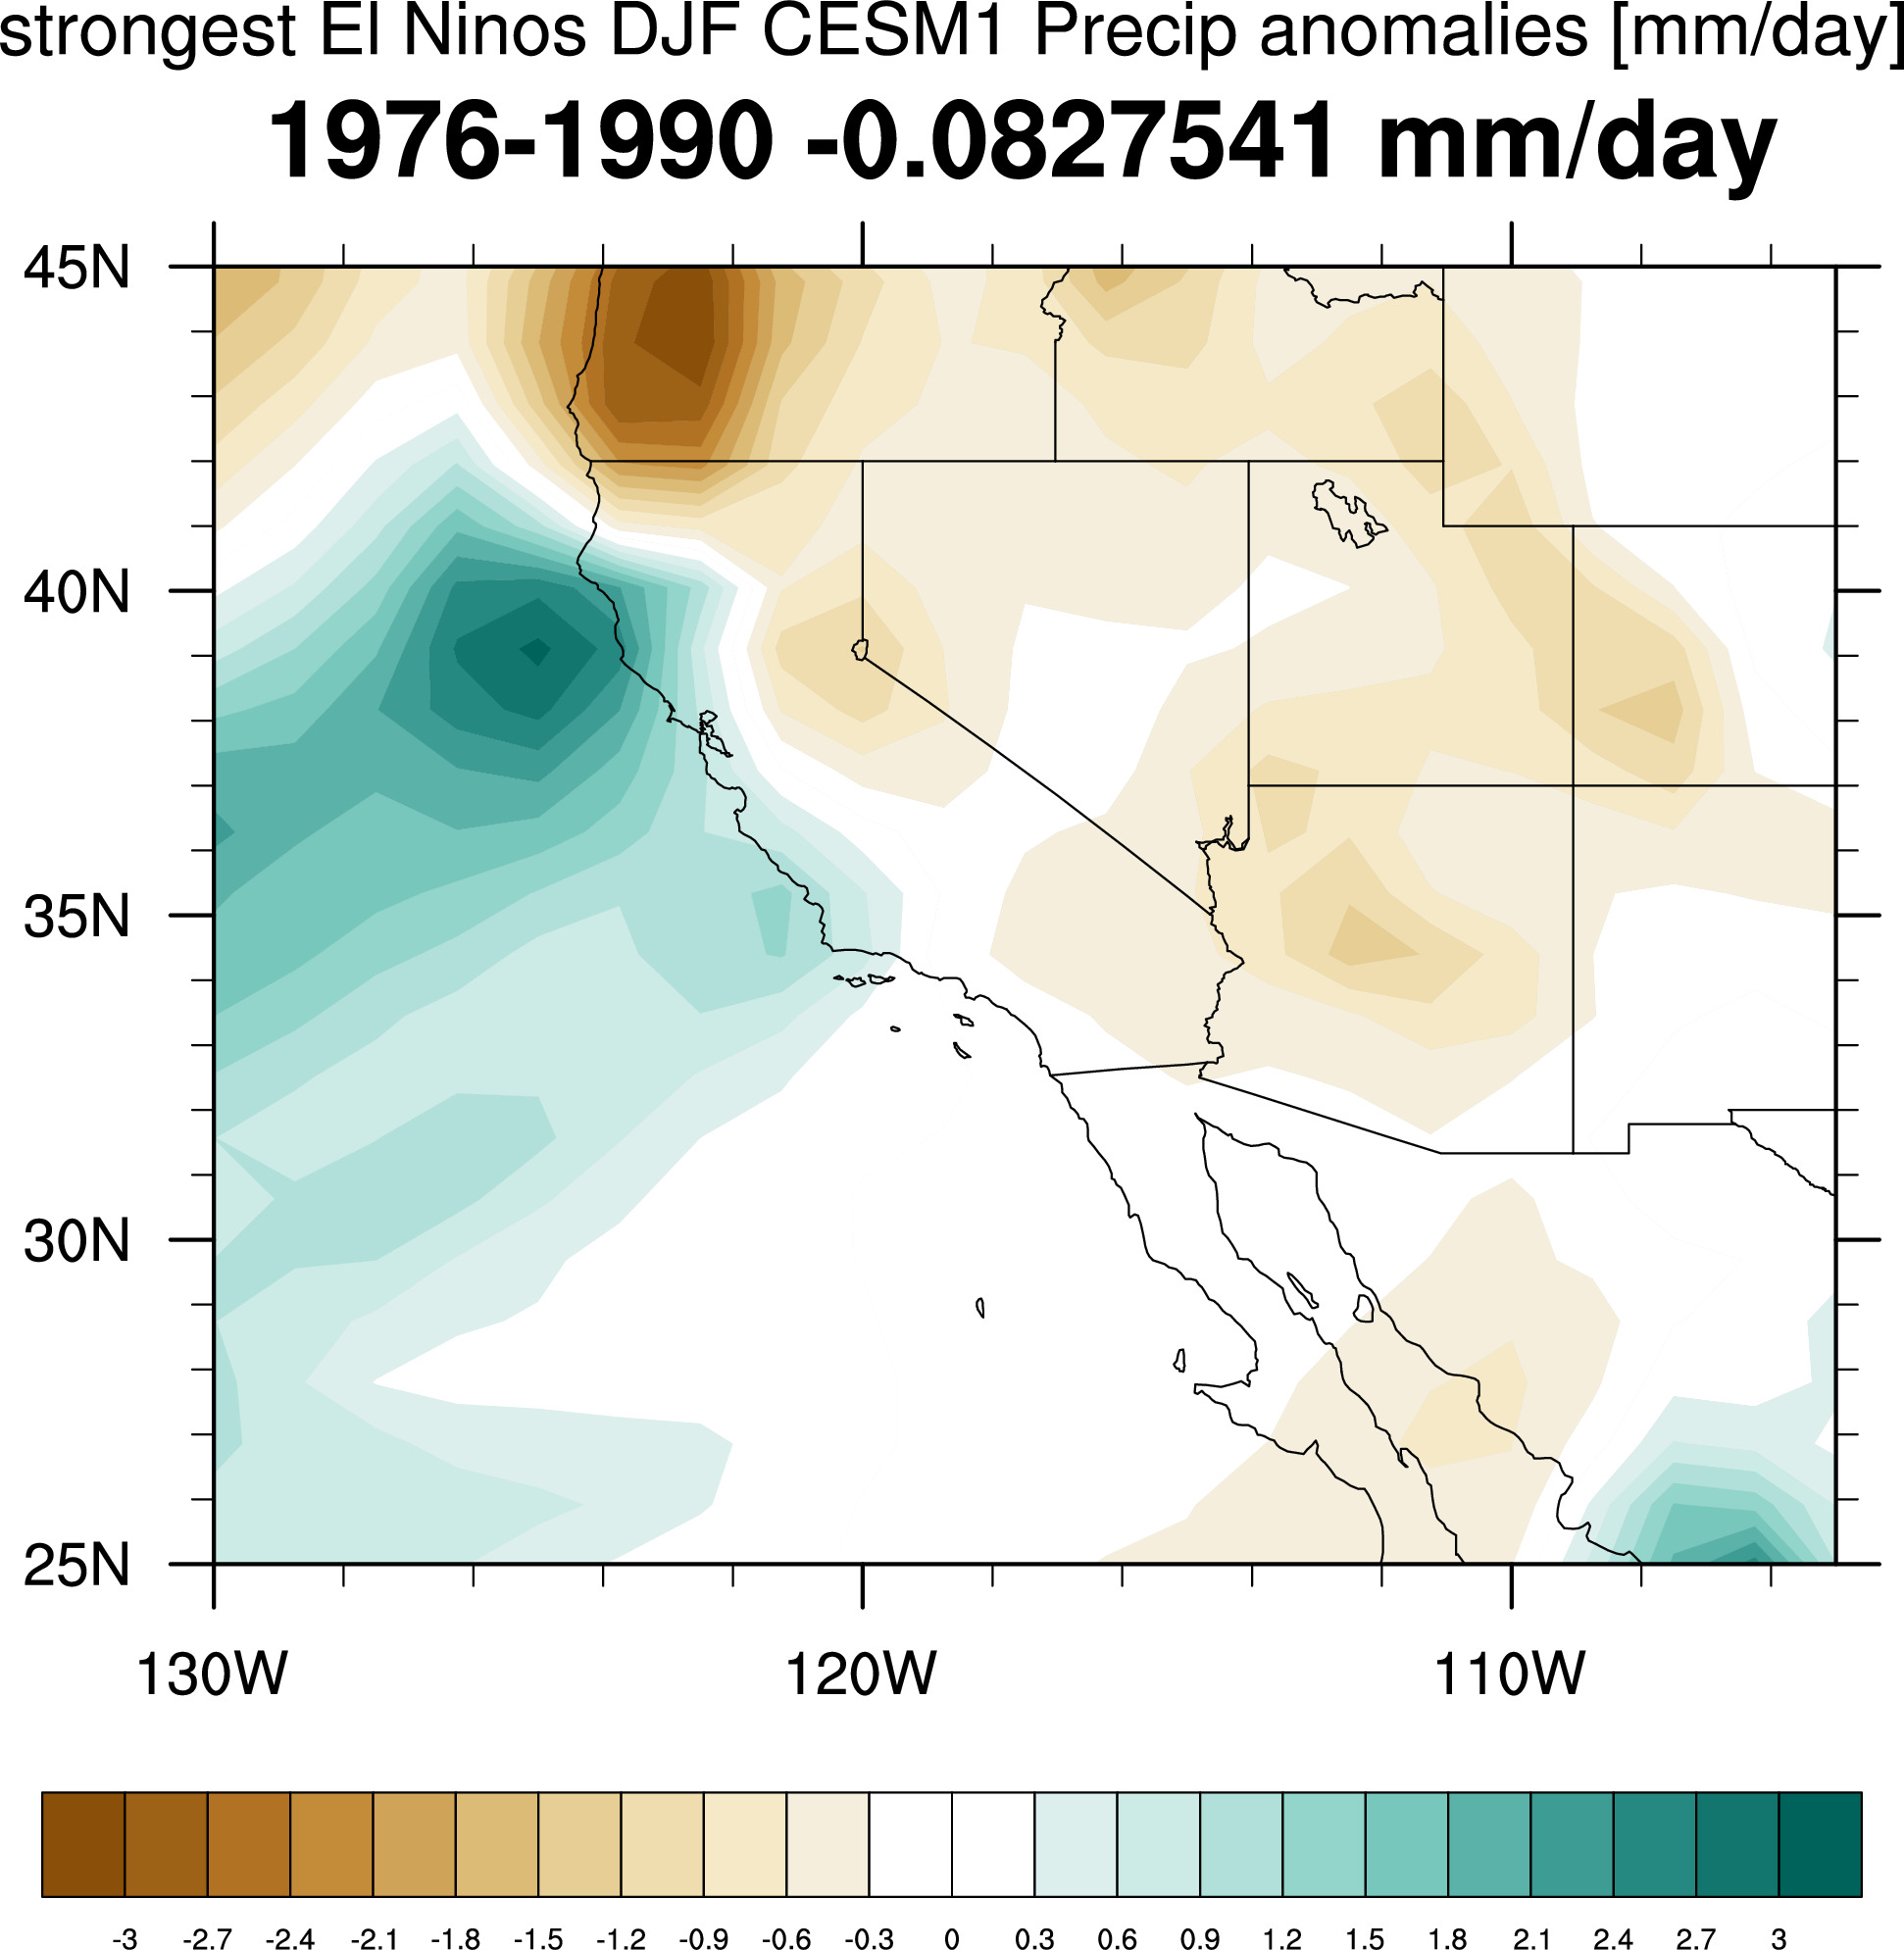 All:
All:
Differences with average
2009-2023: top "strongest" 3 individual runs:
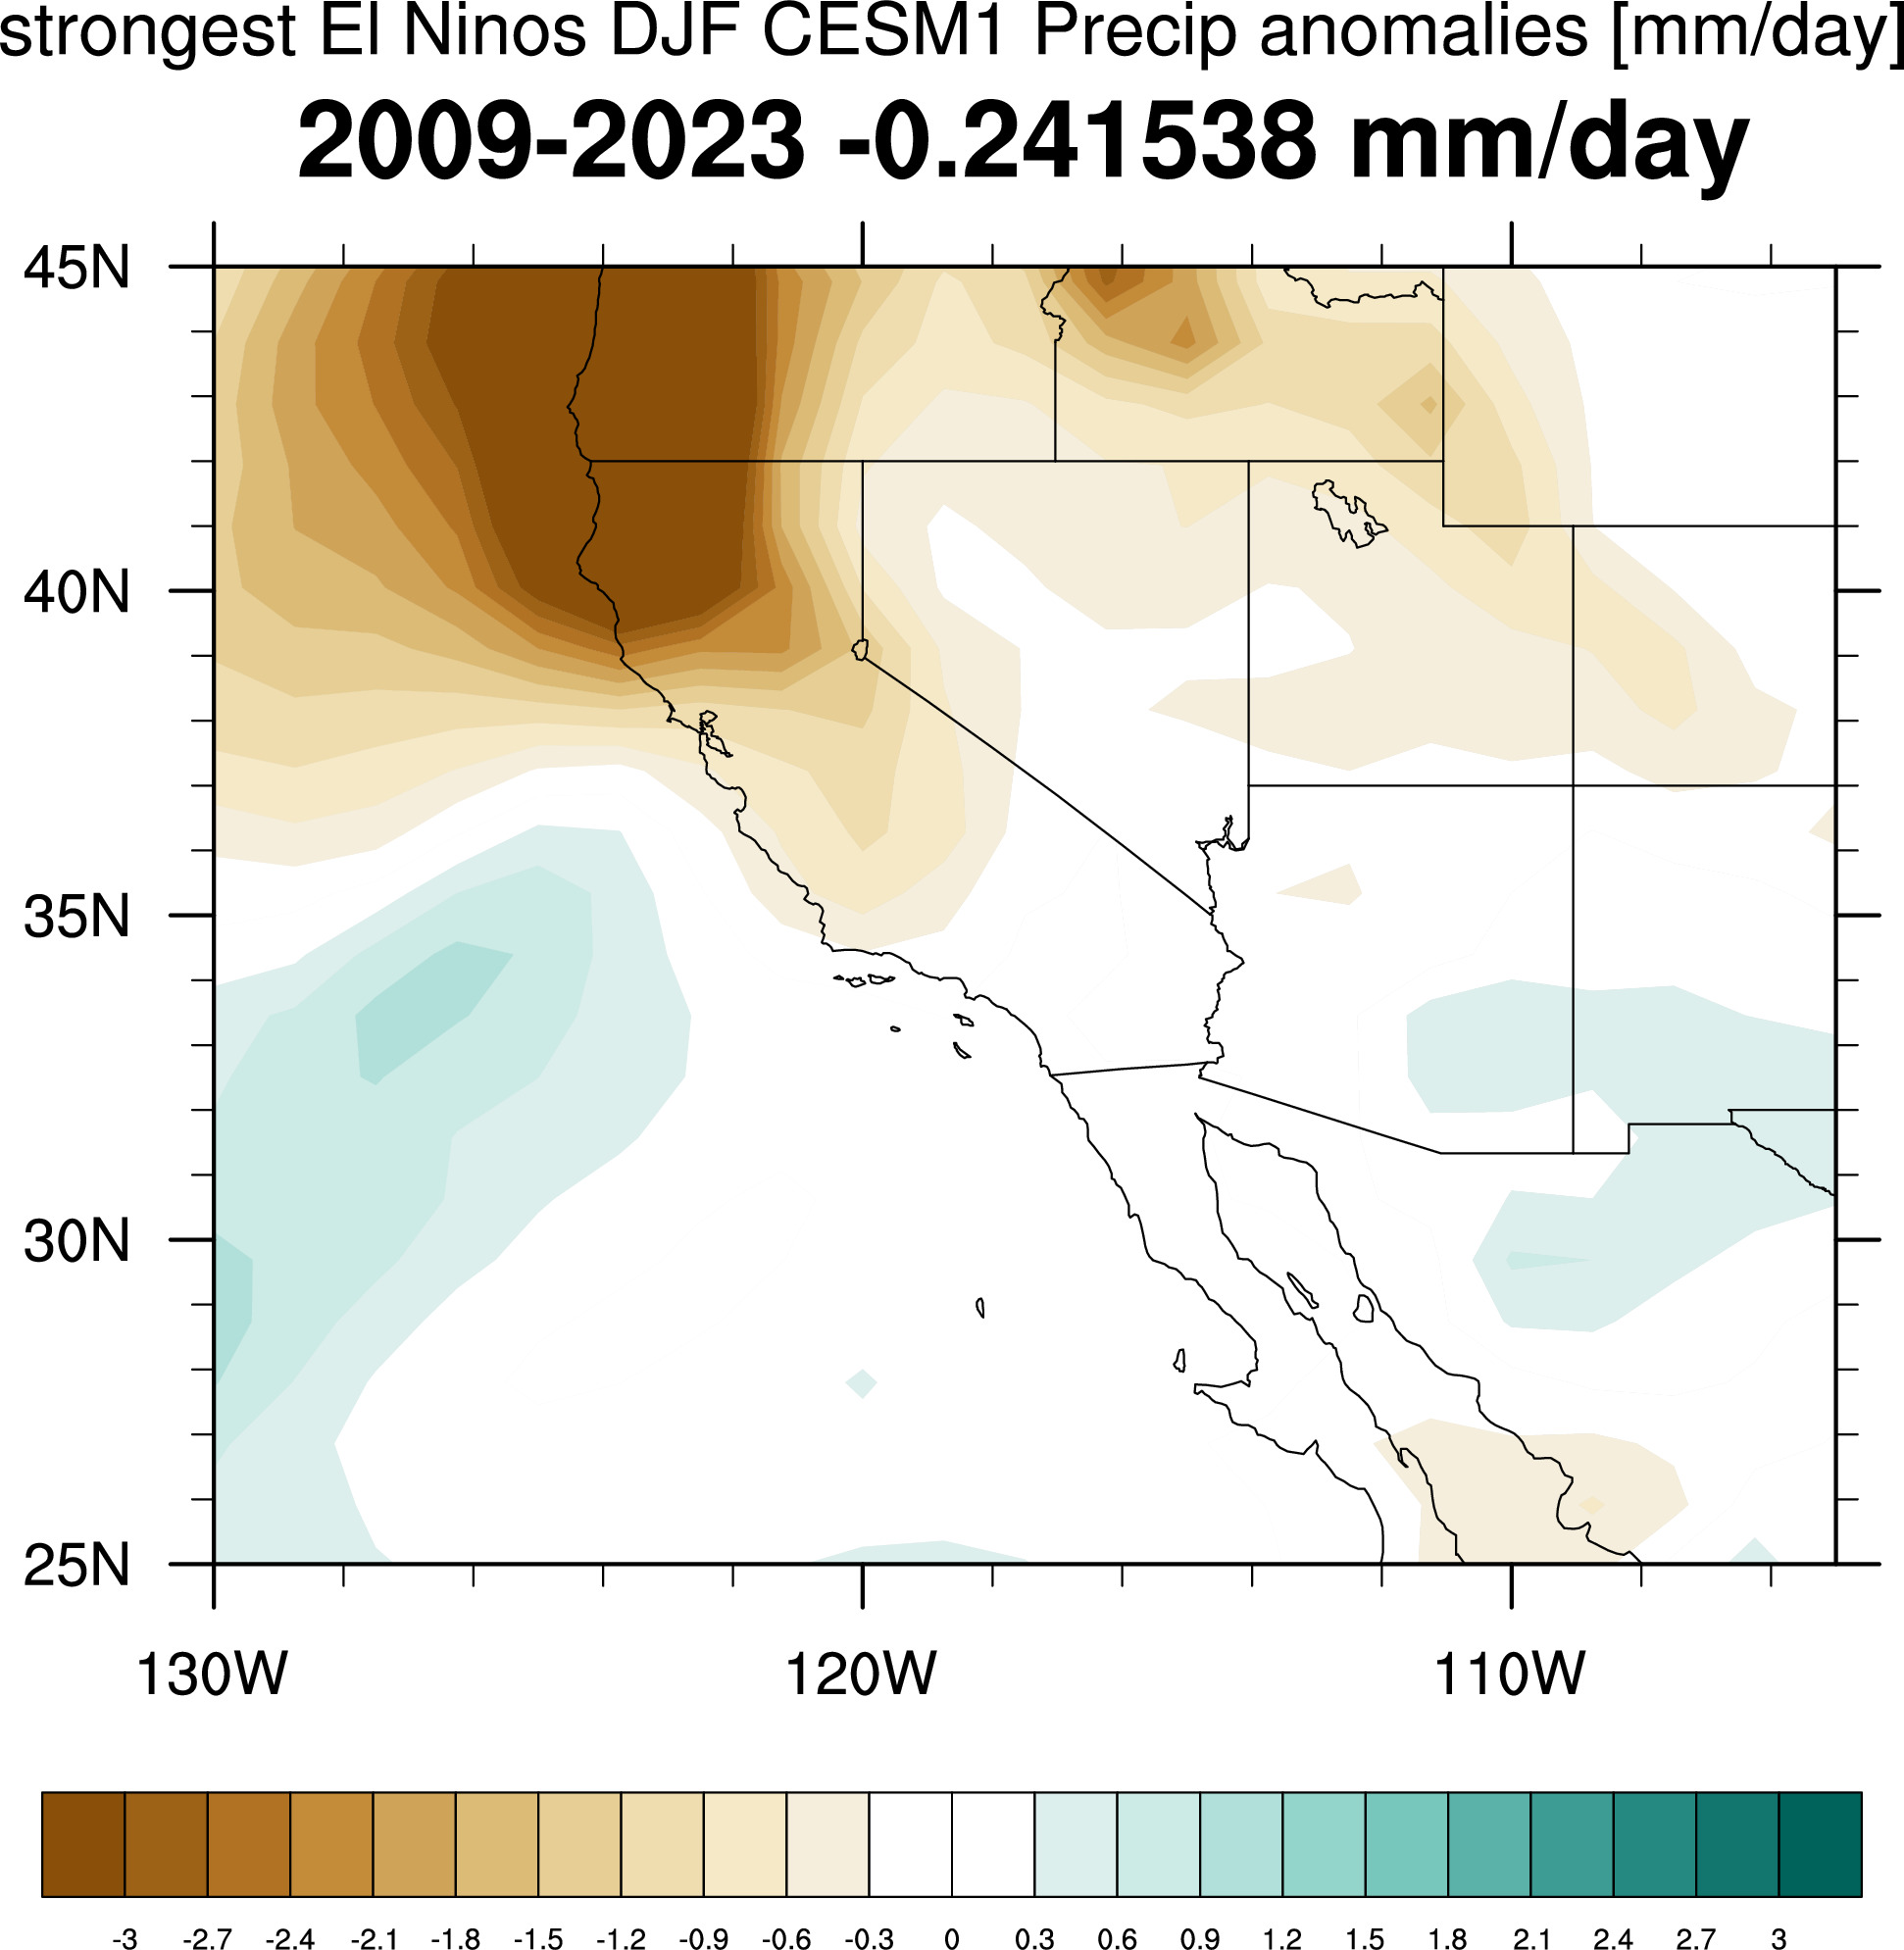
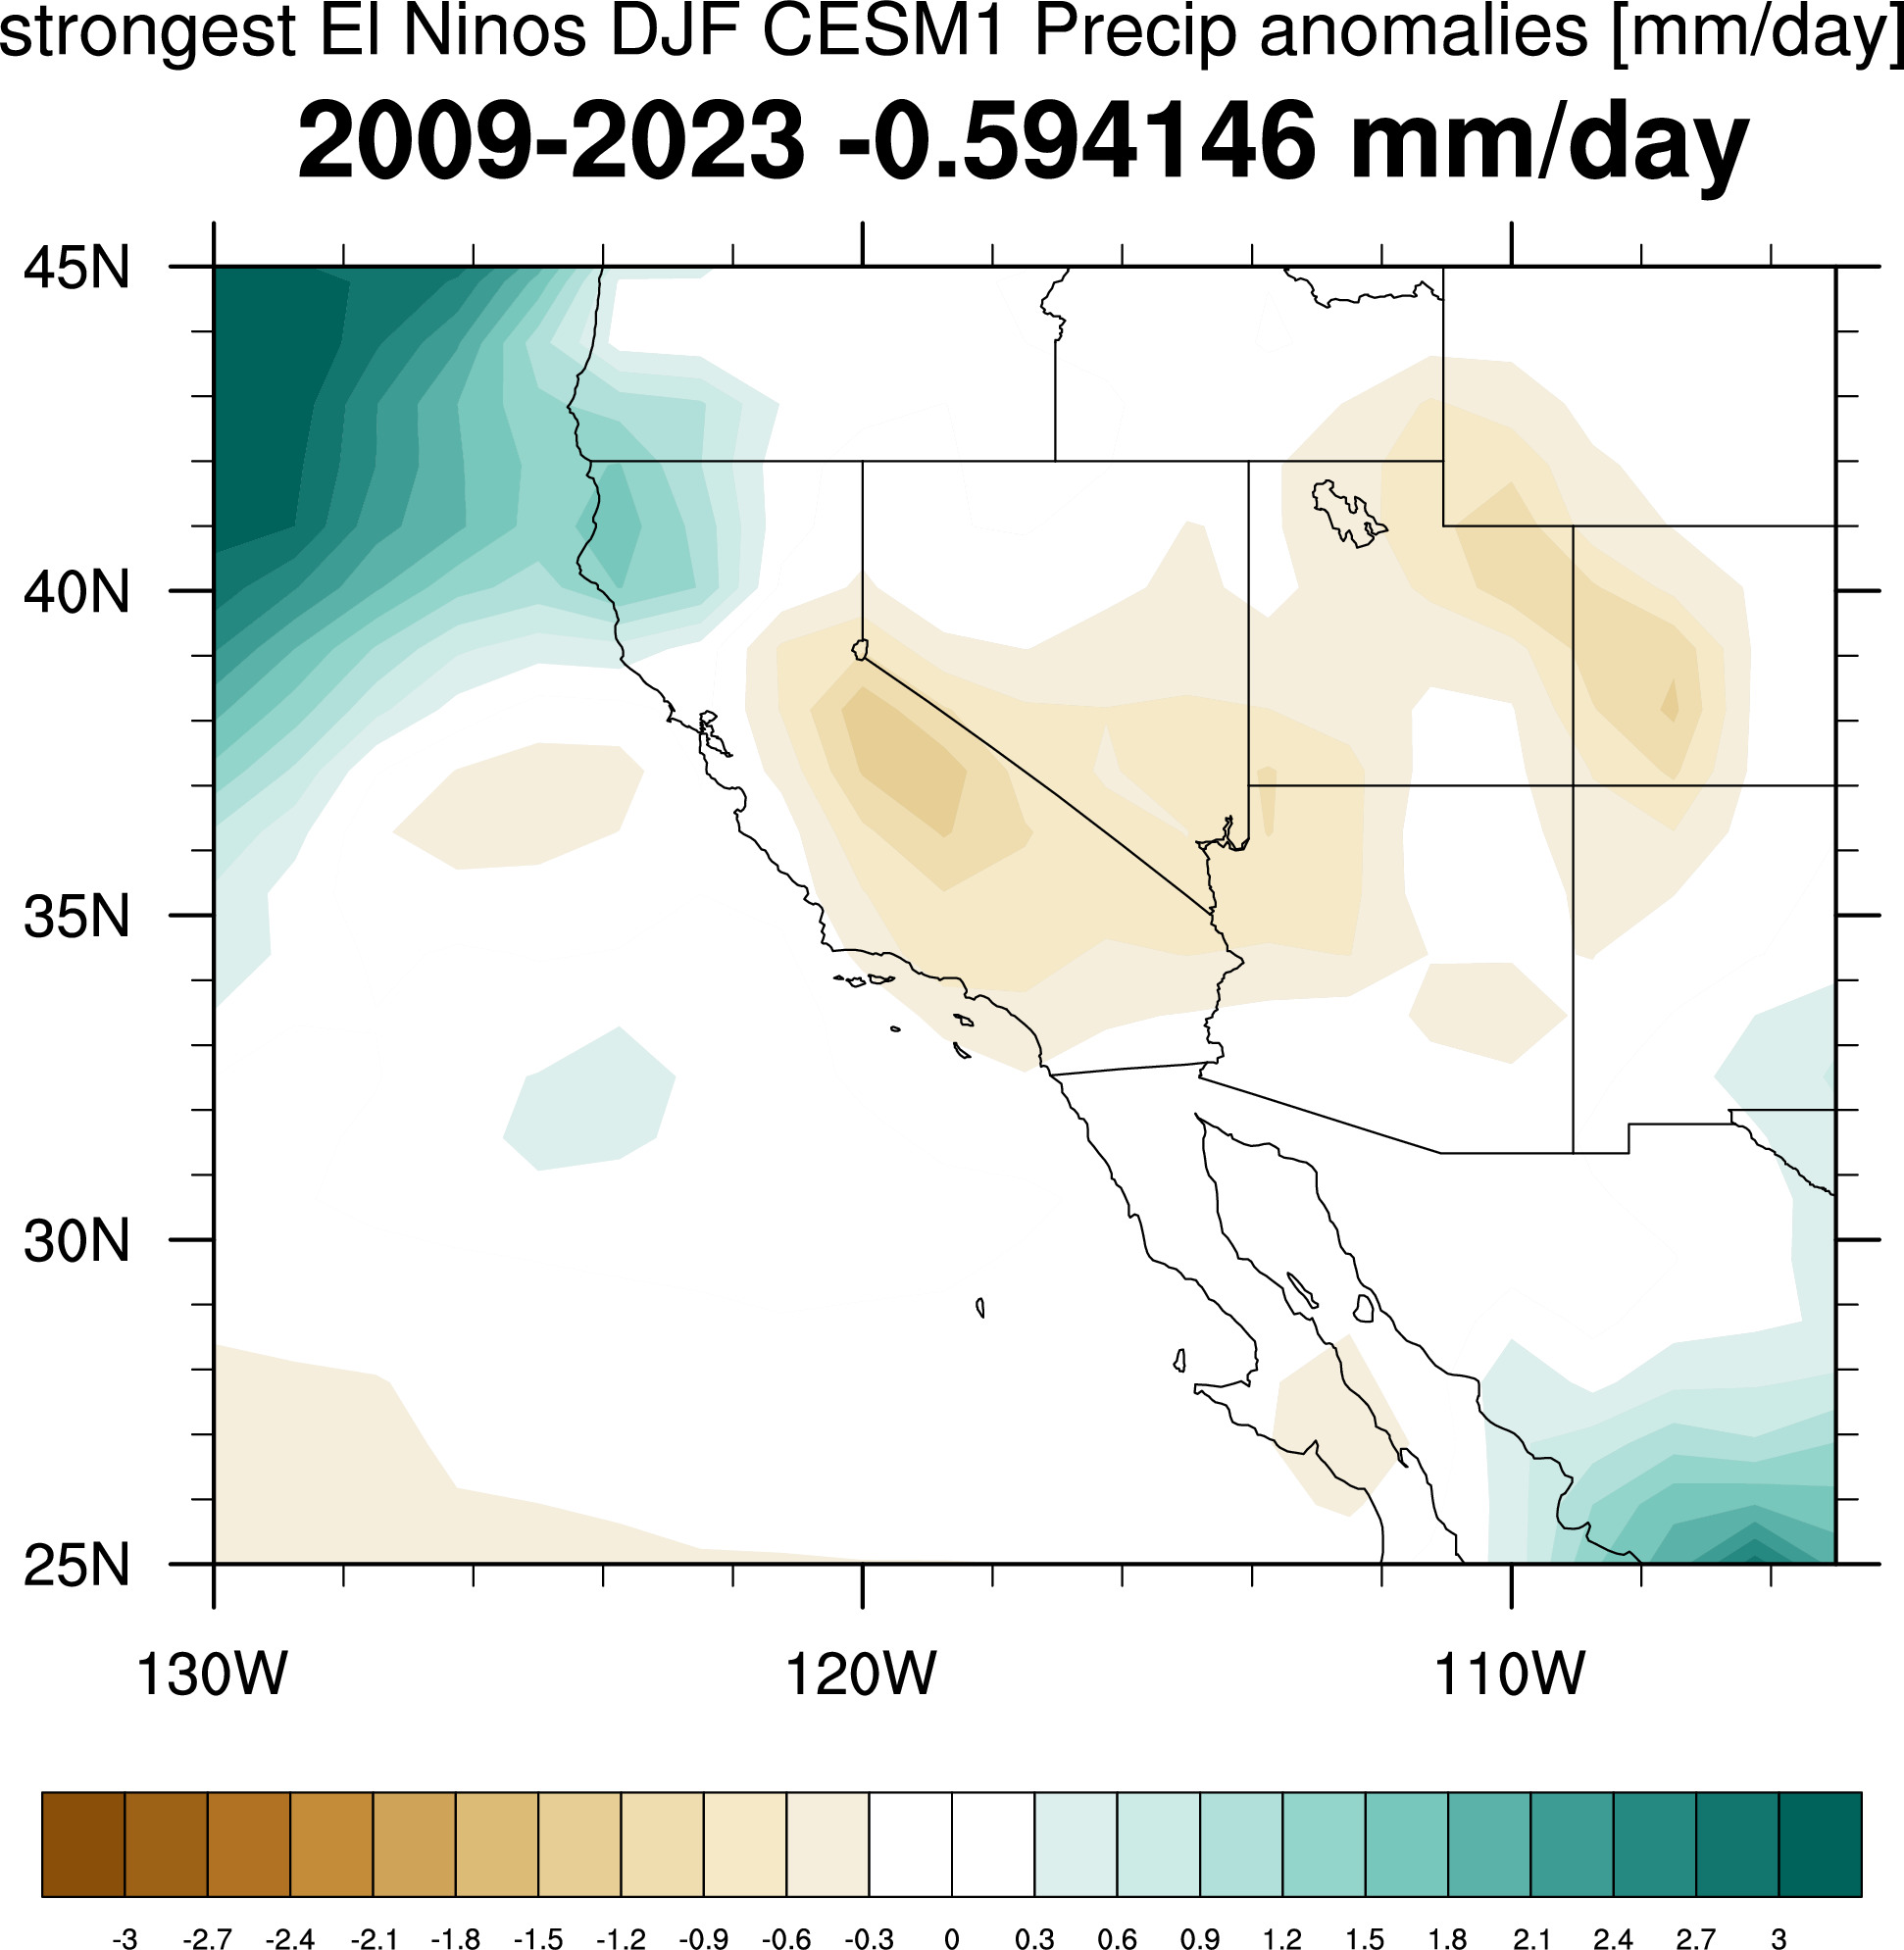
 All:
All: 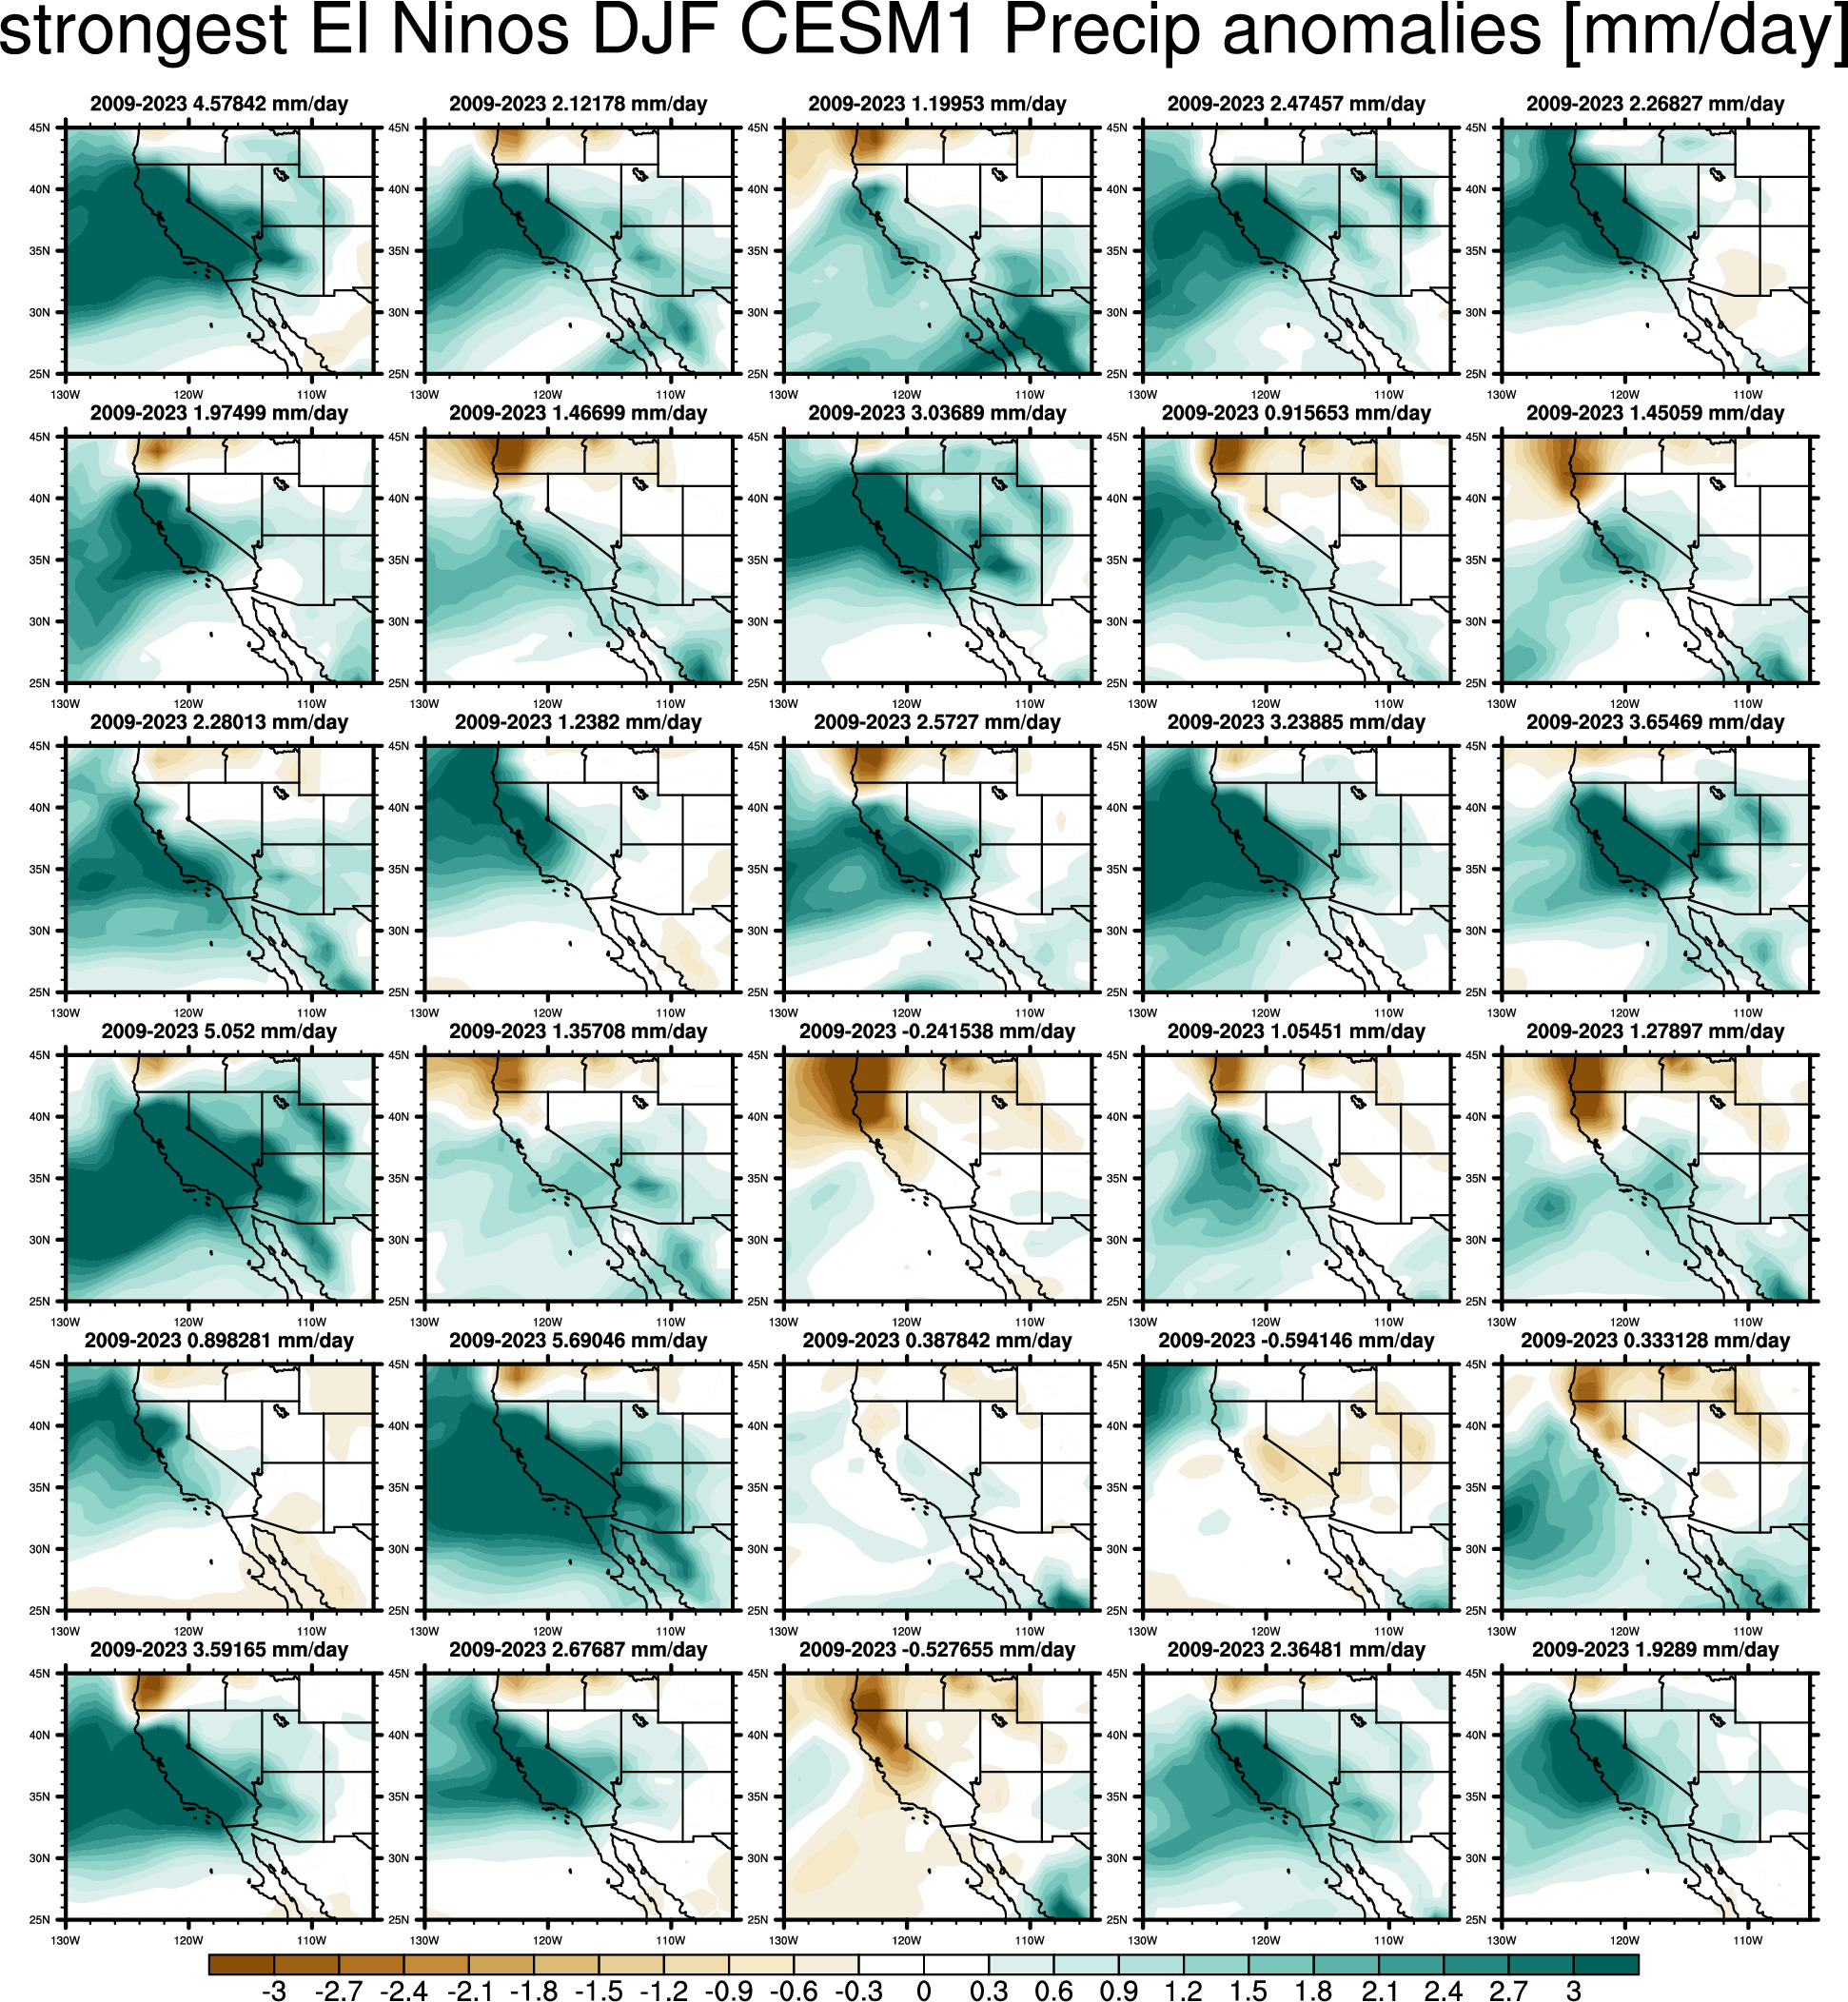
Differences with average
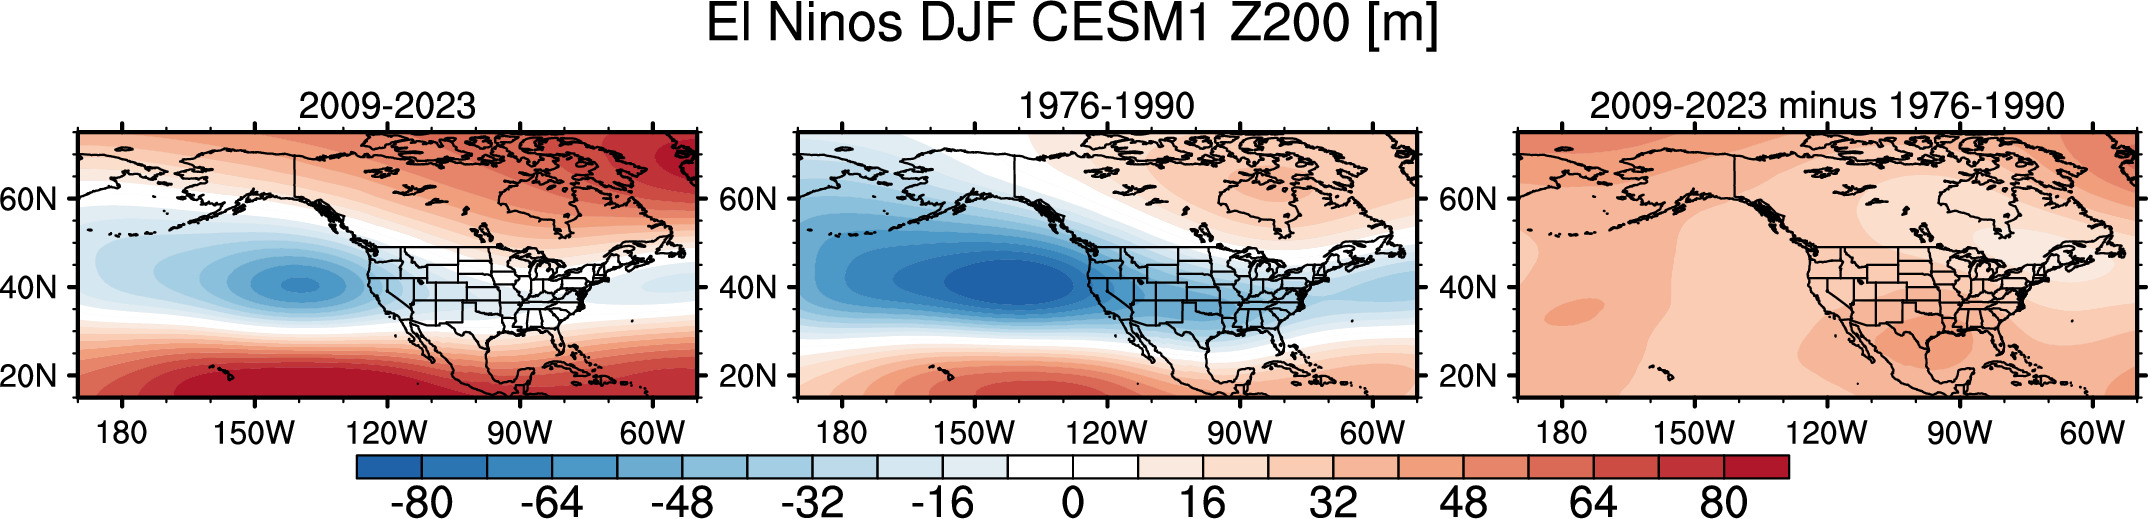
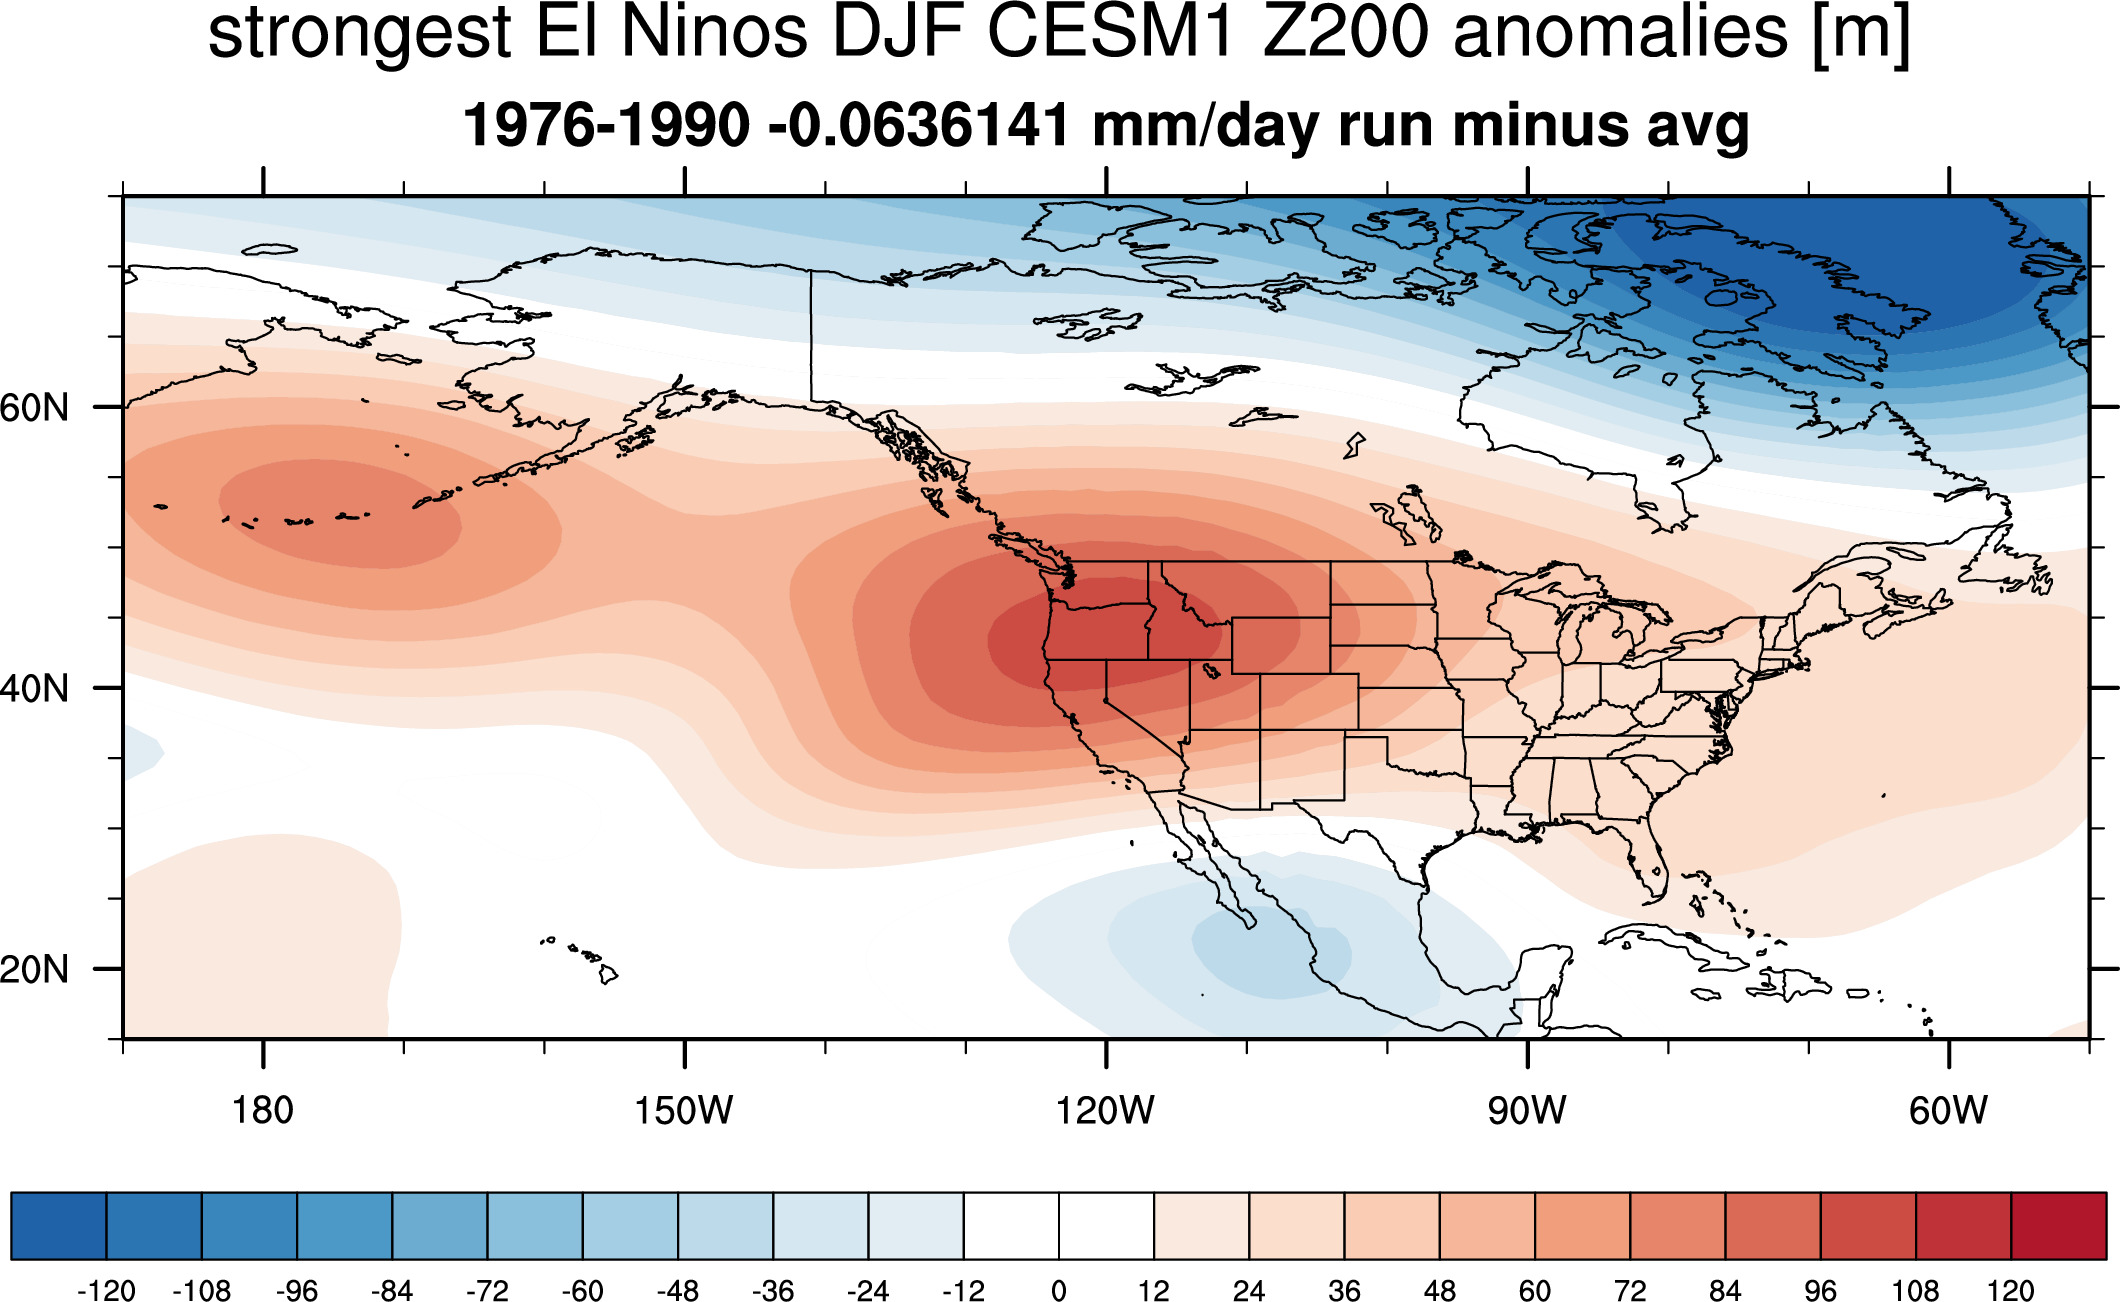
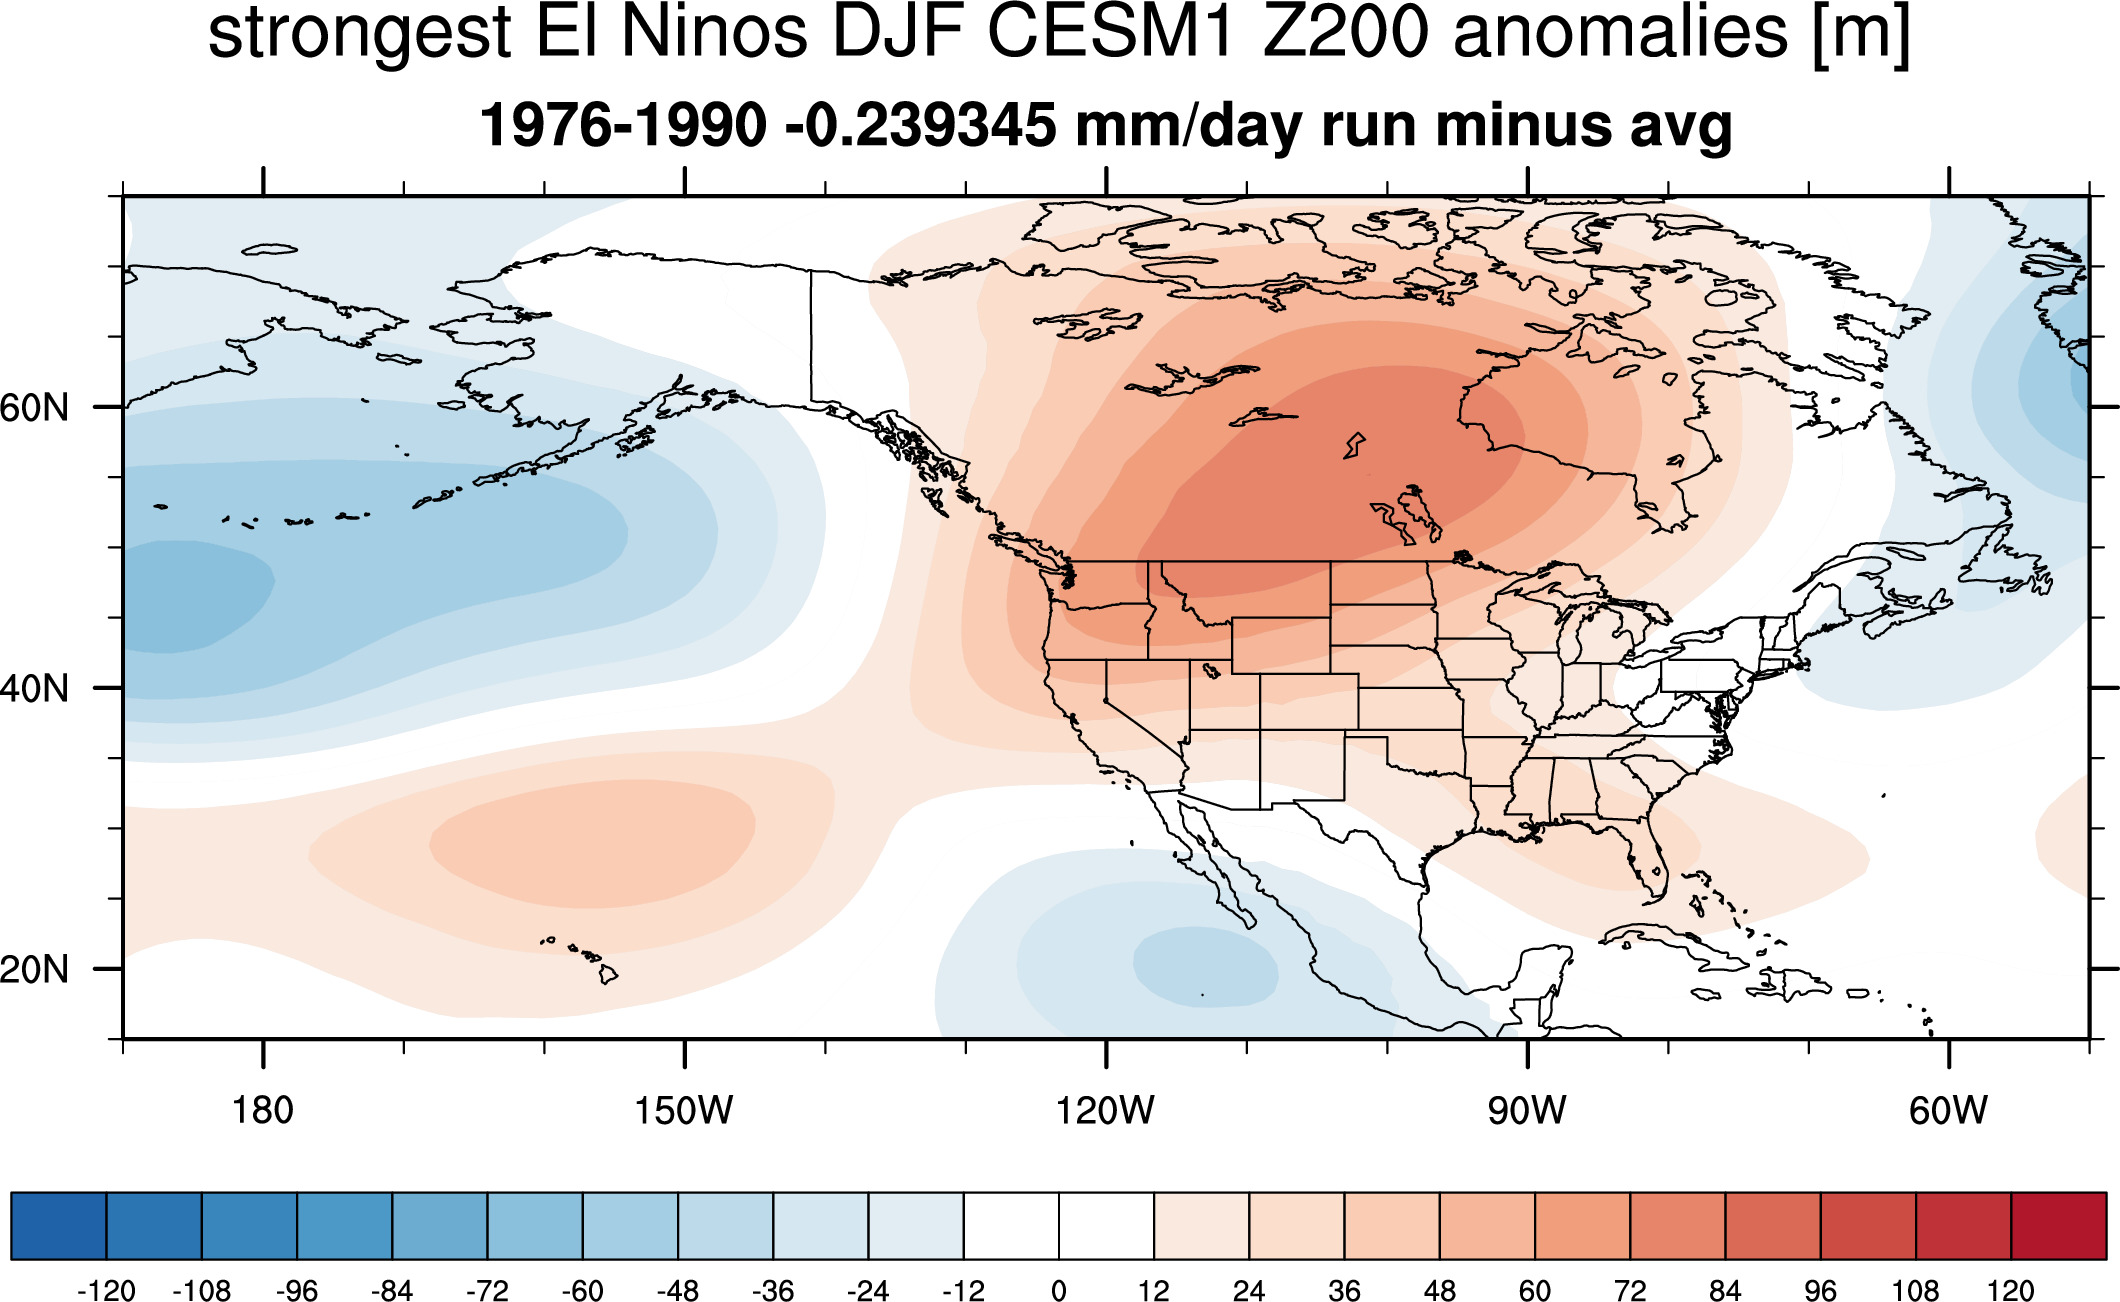
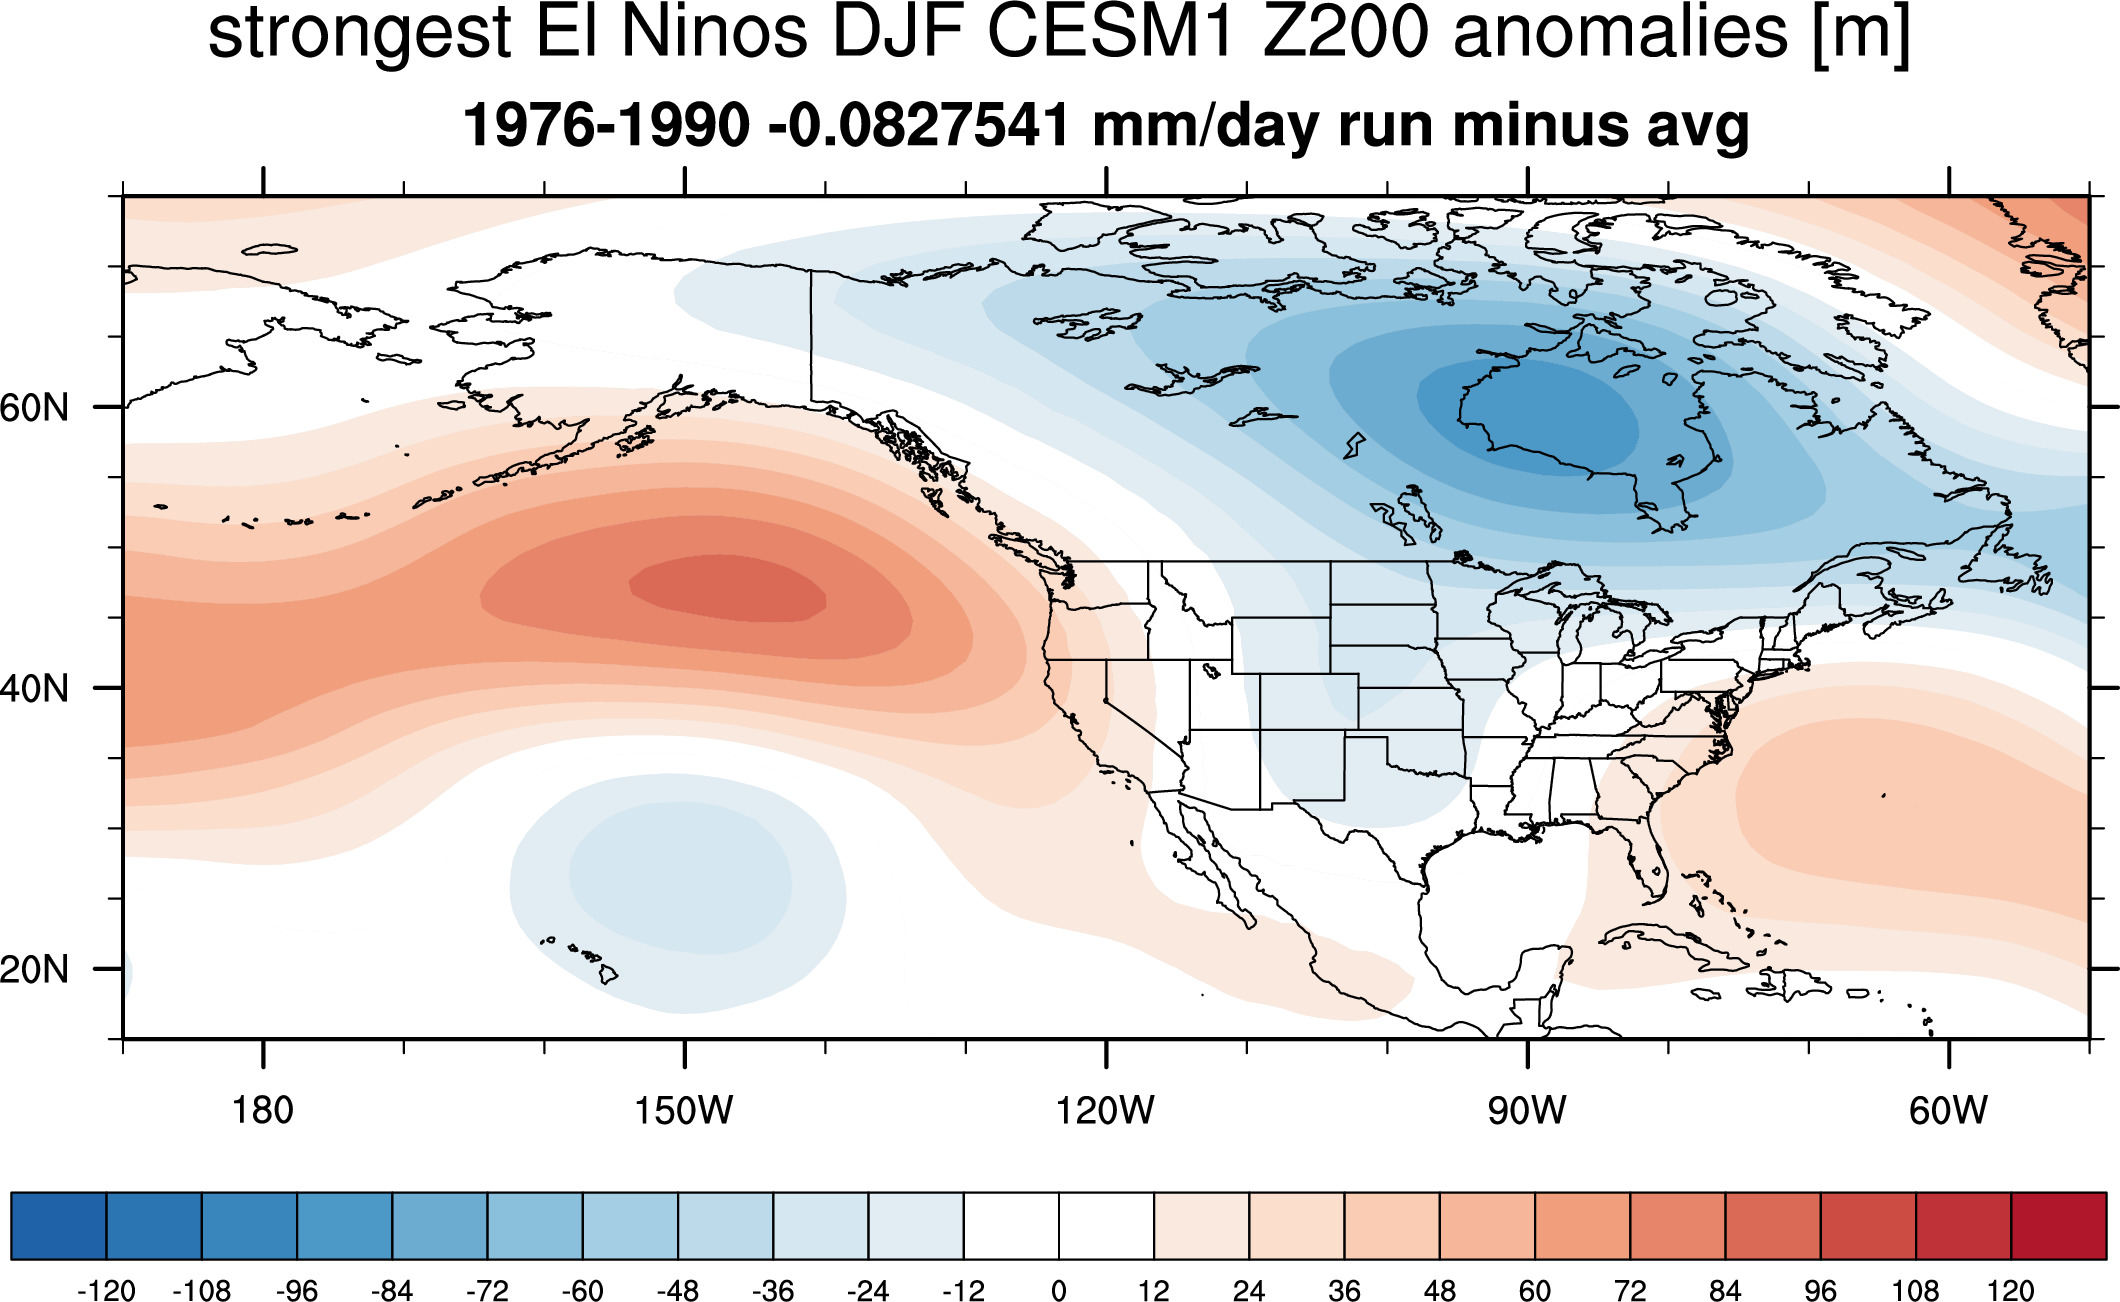
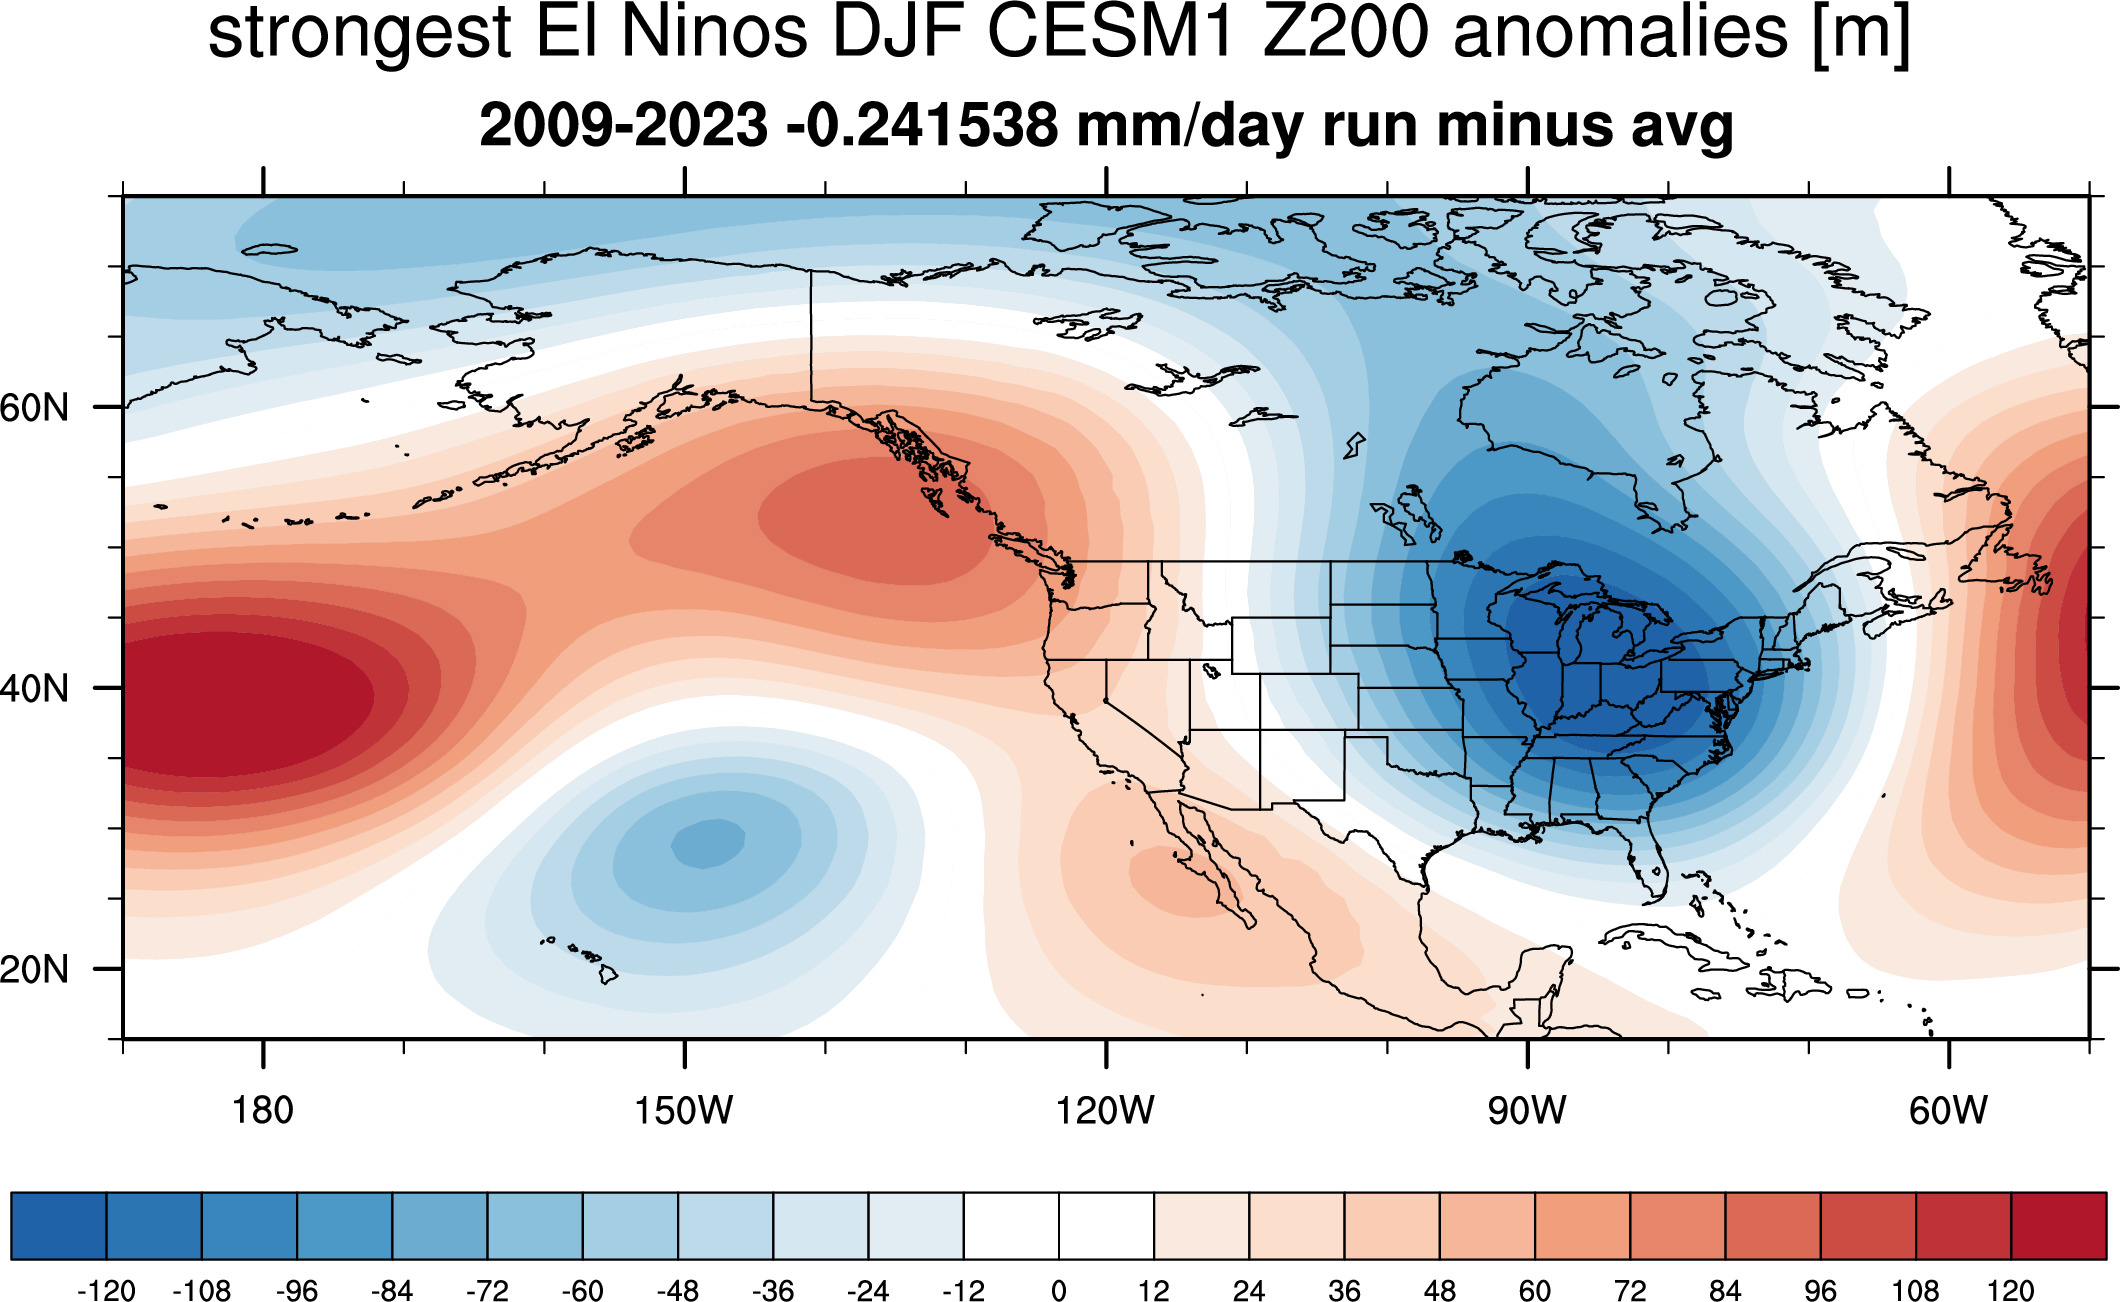
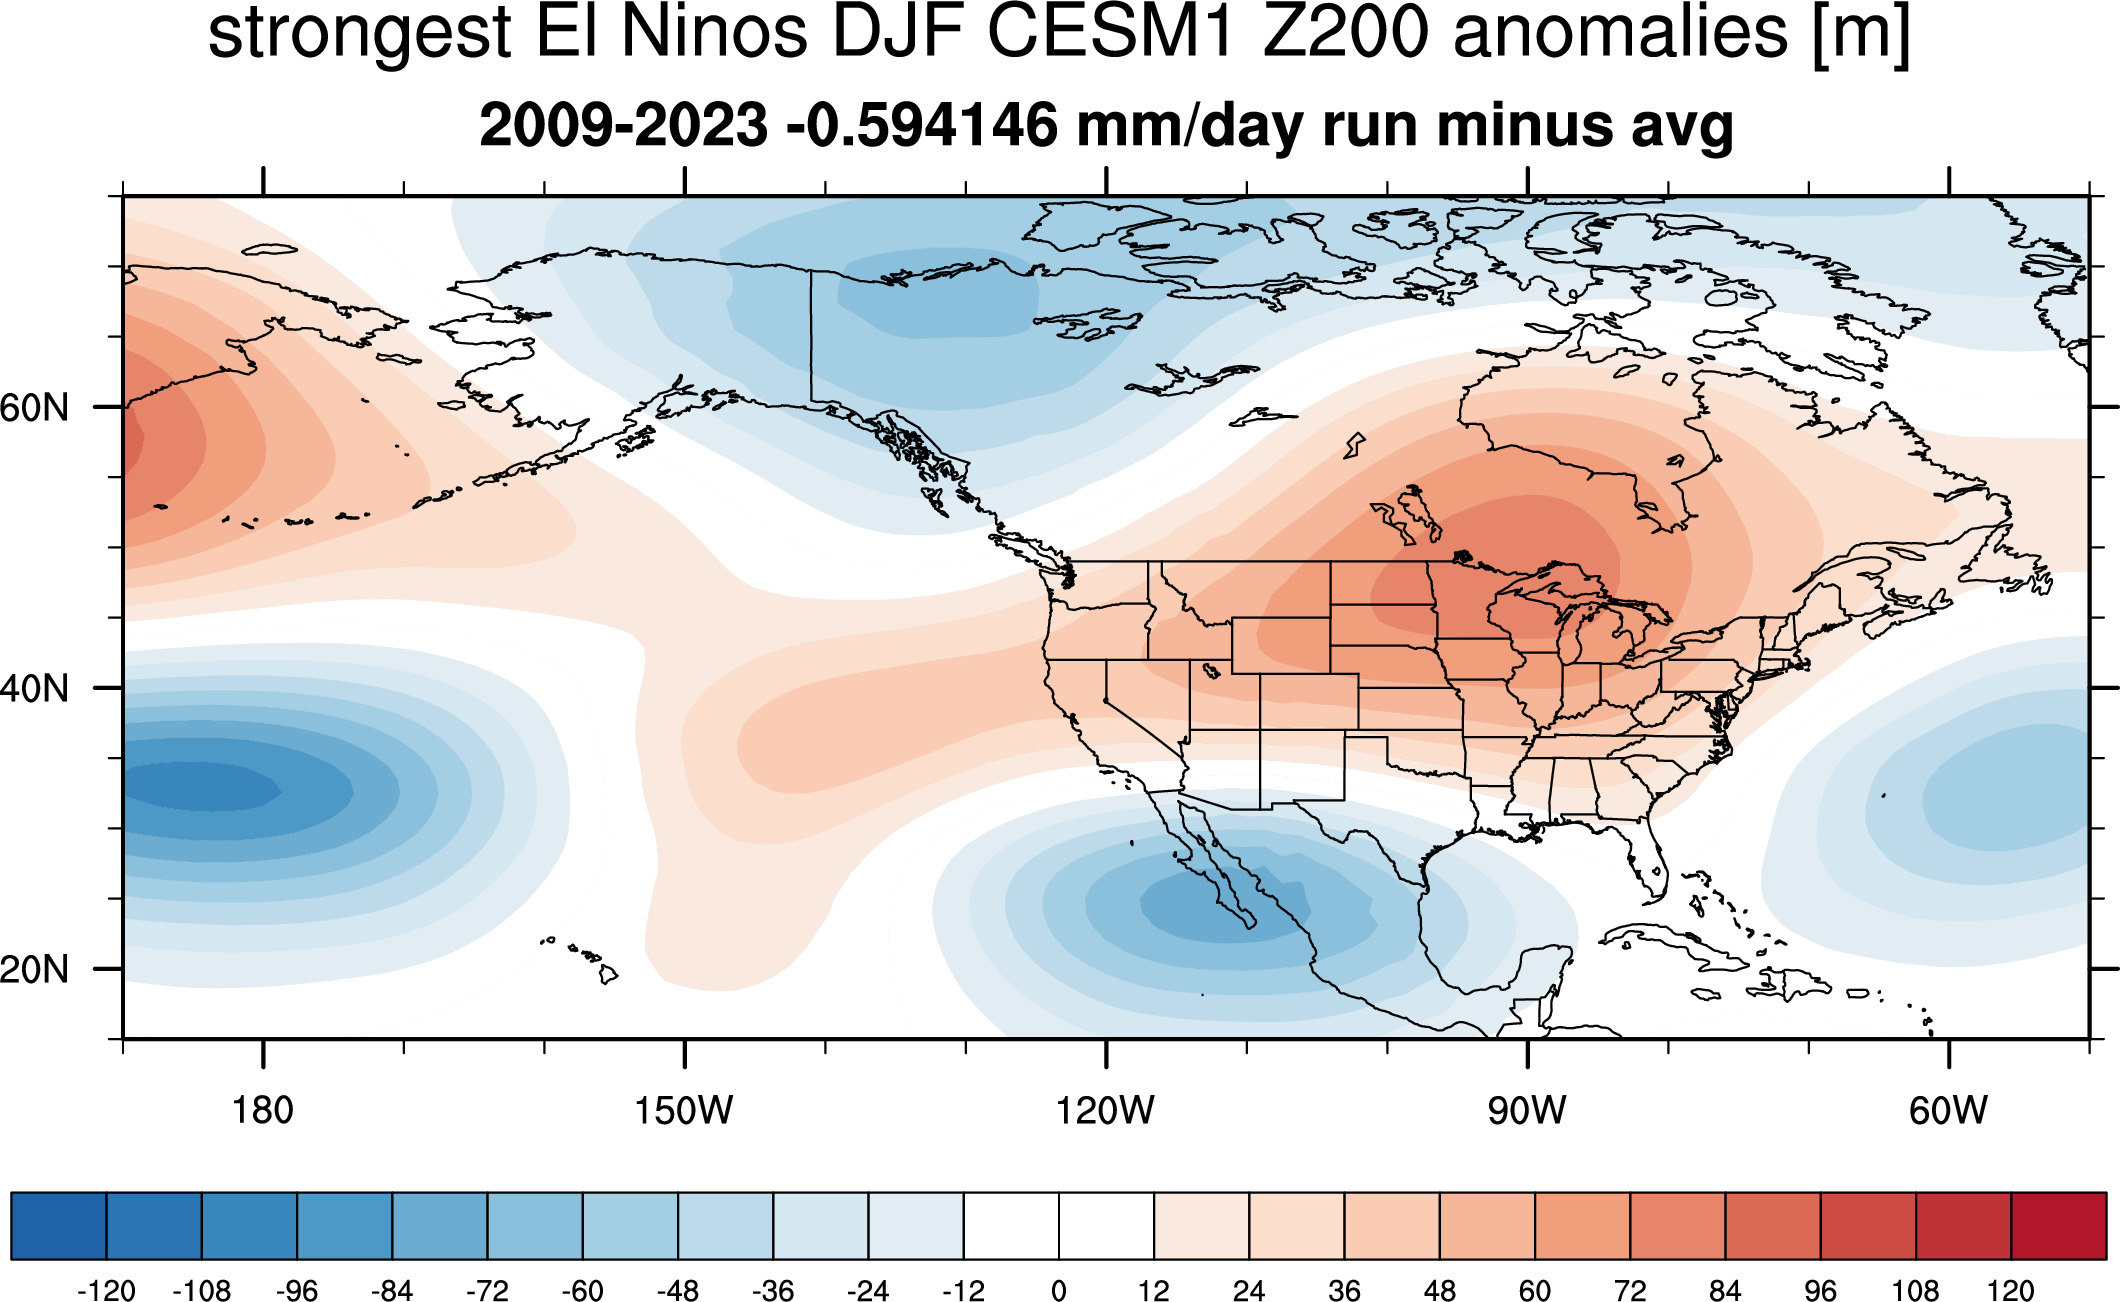
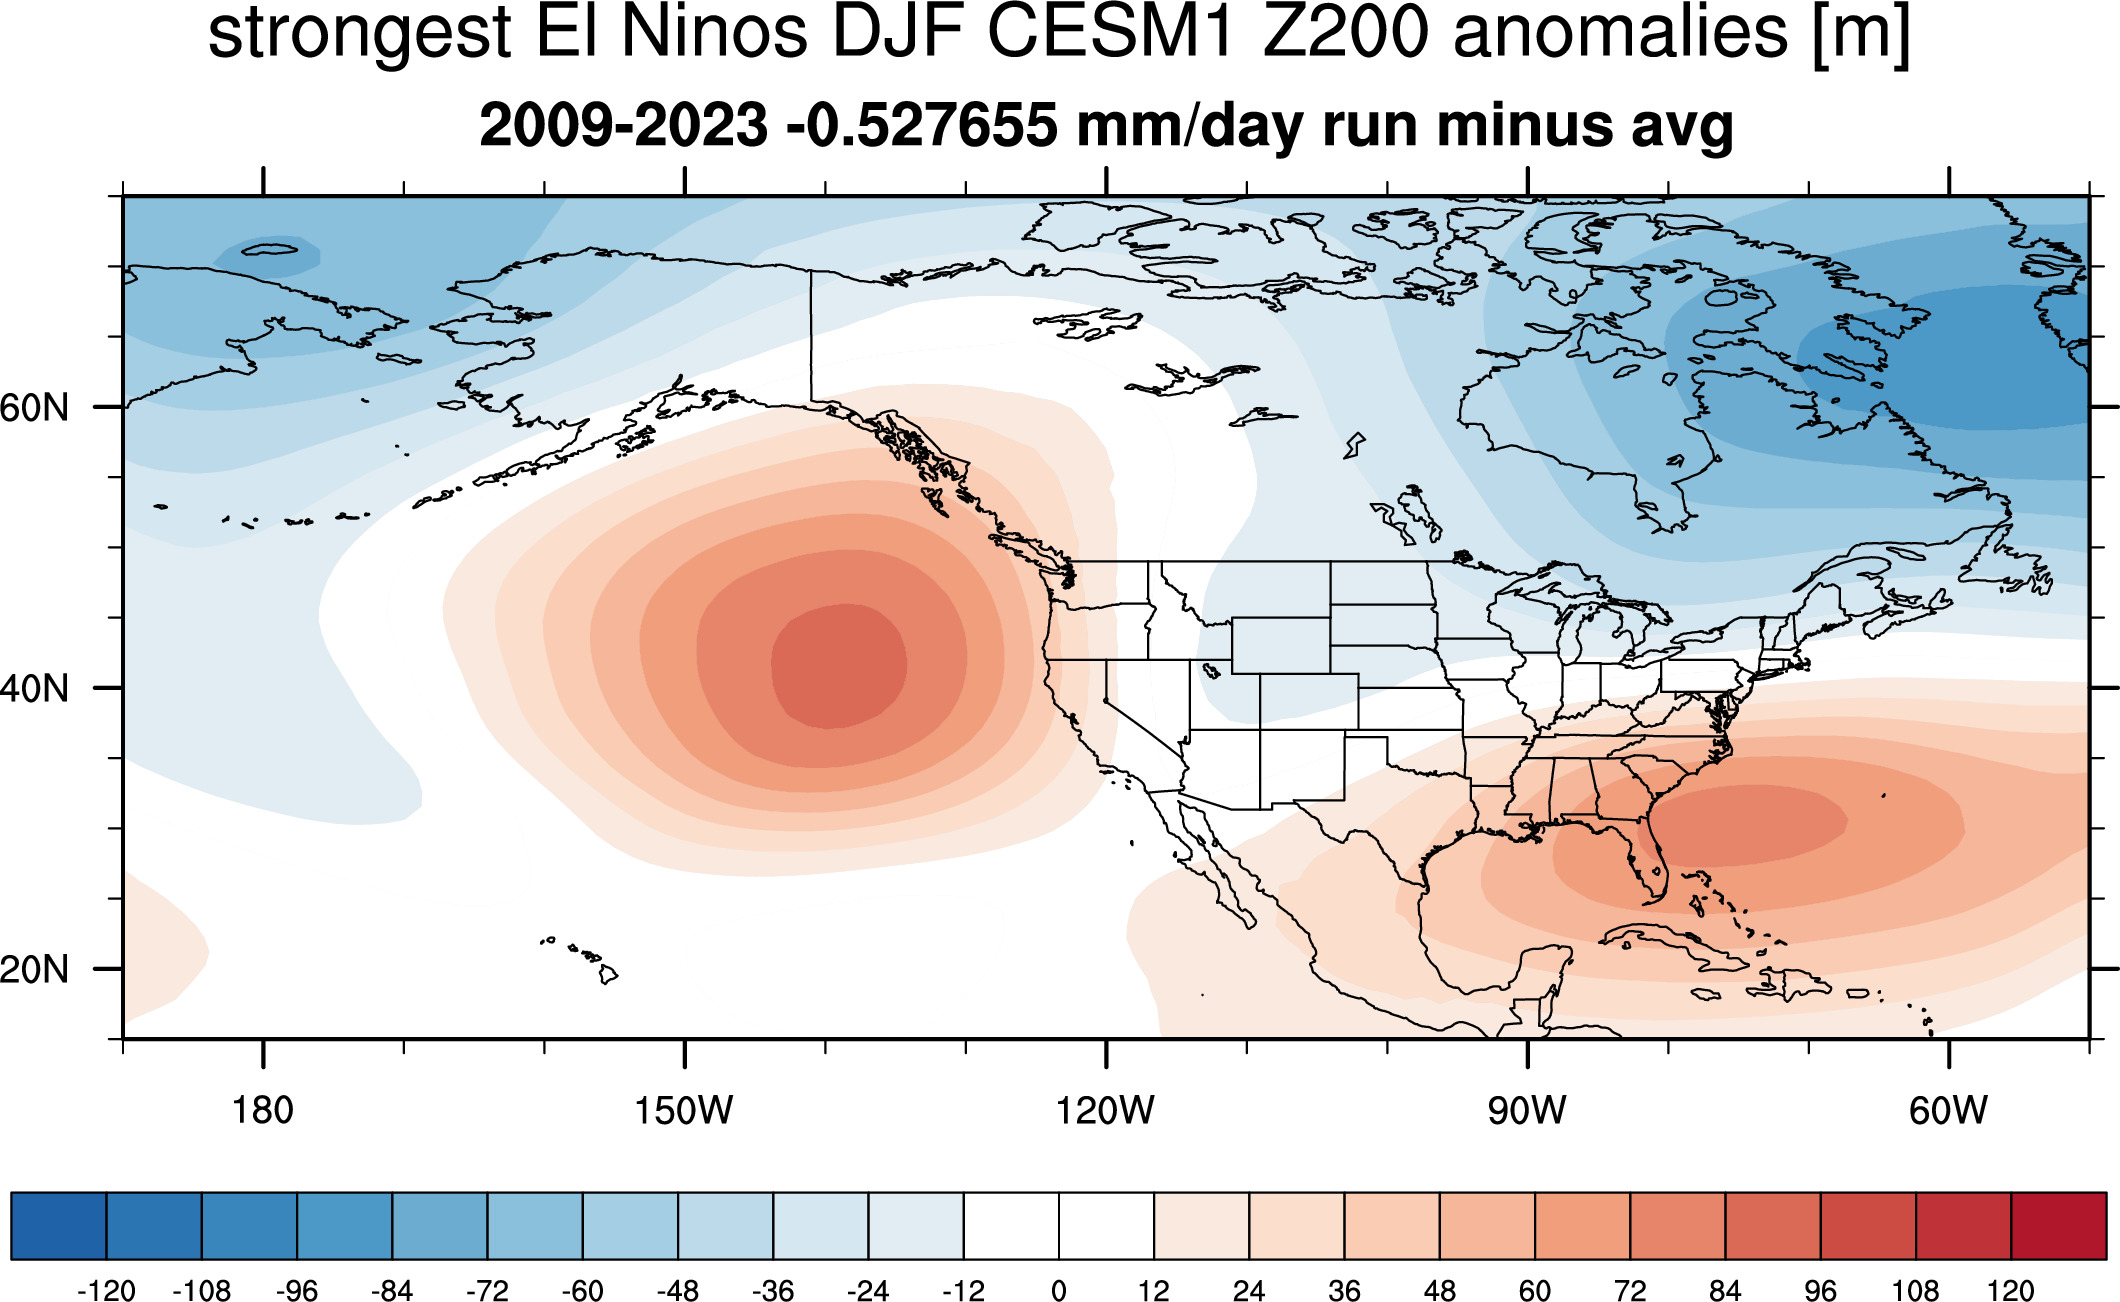
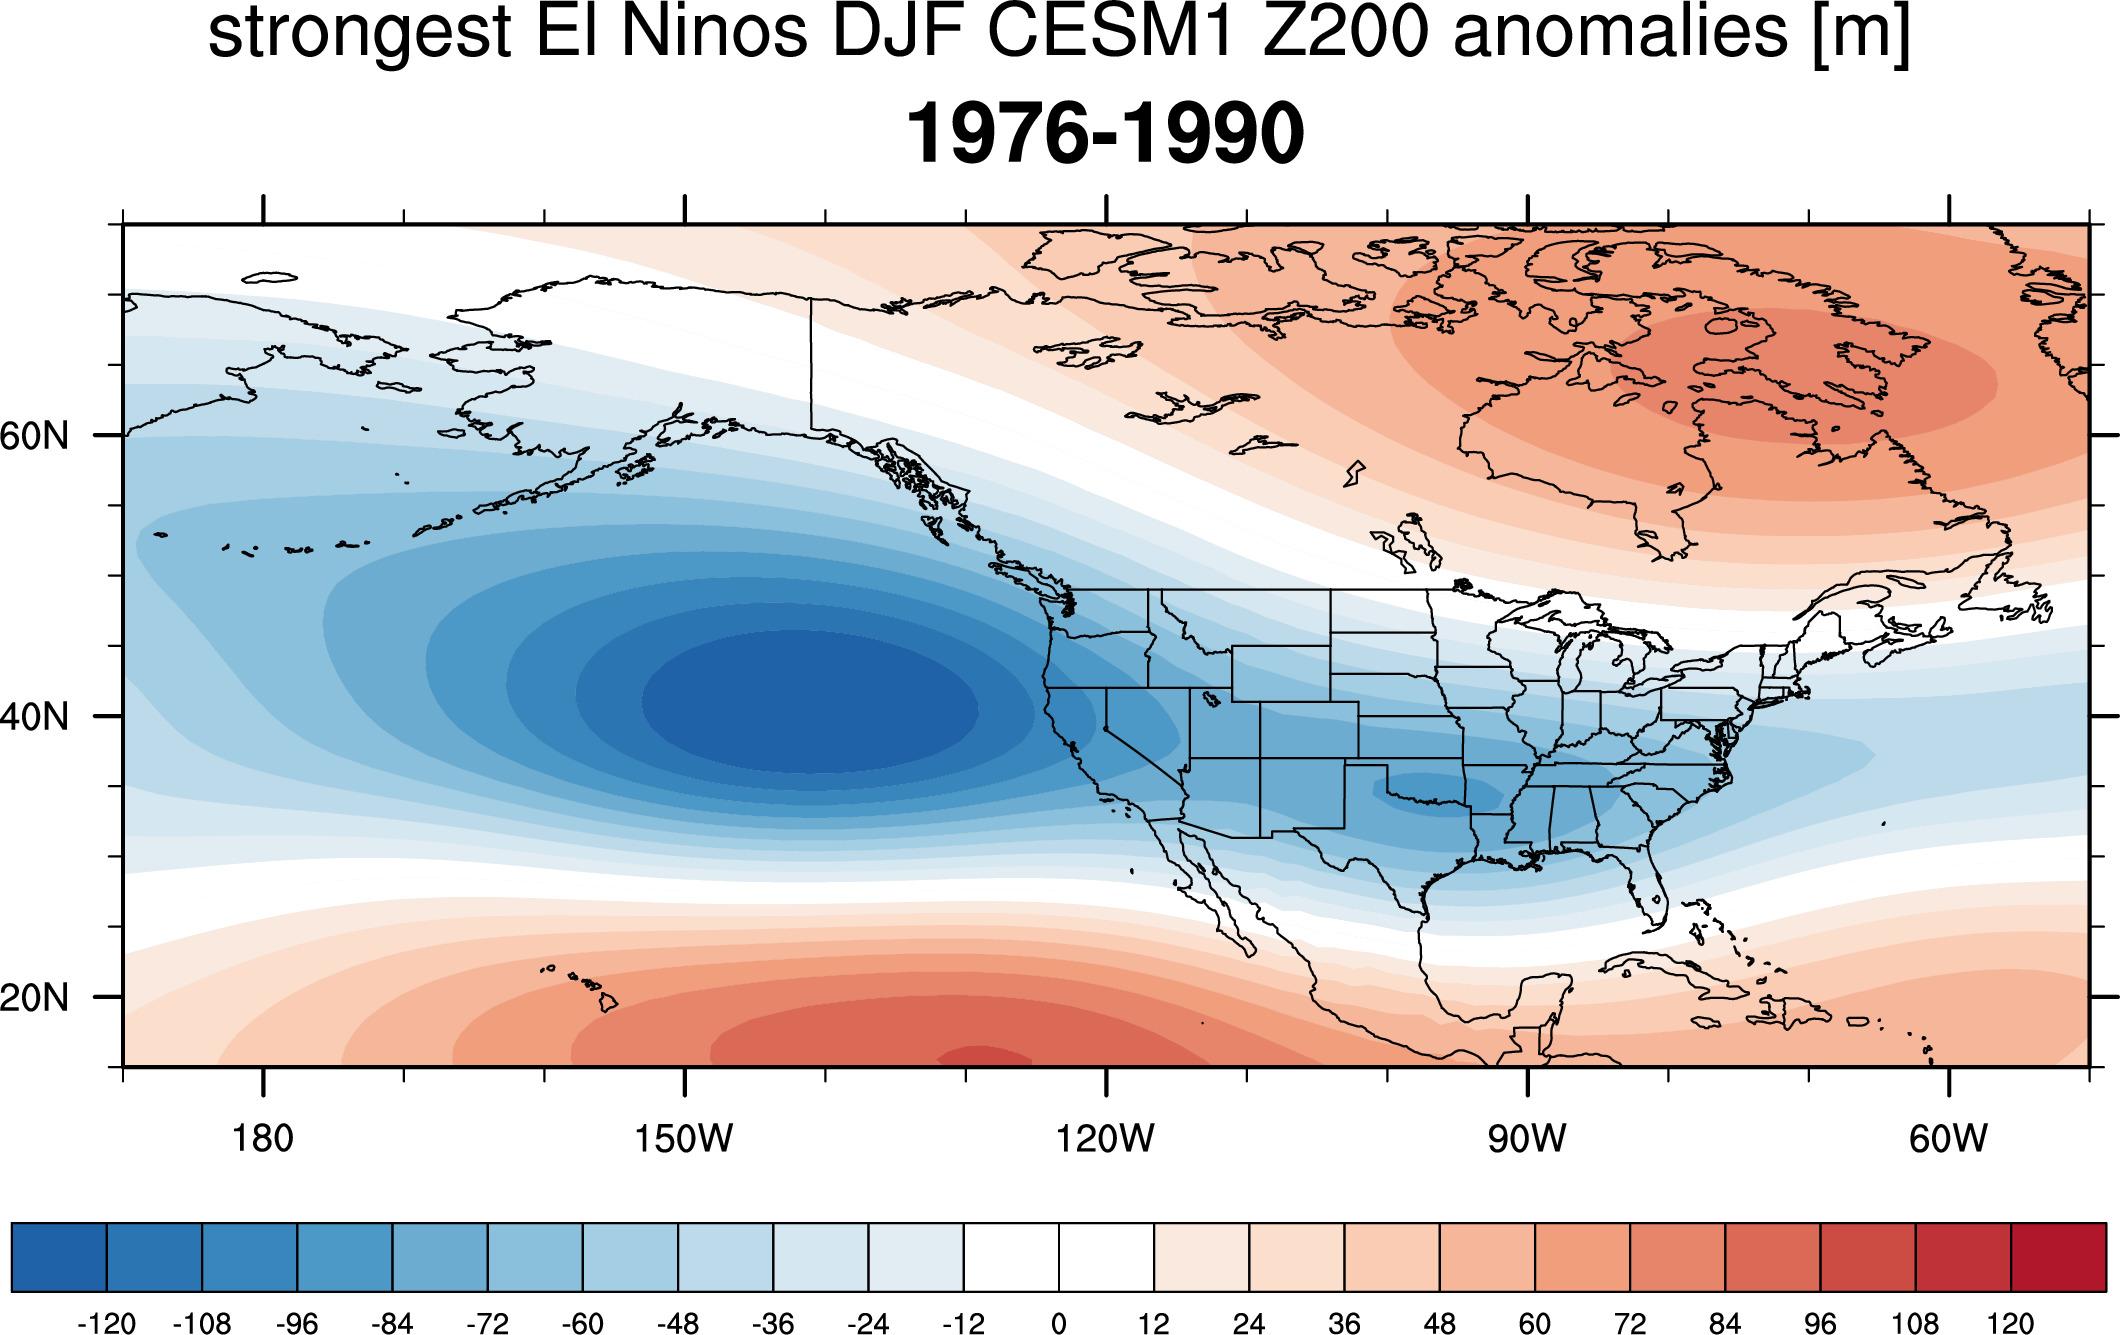
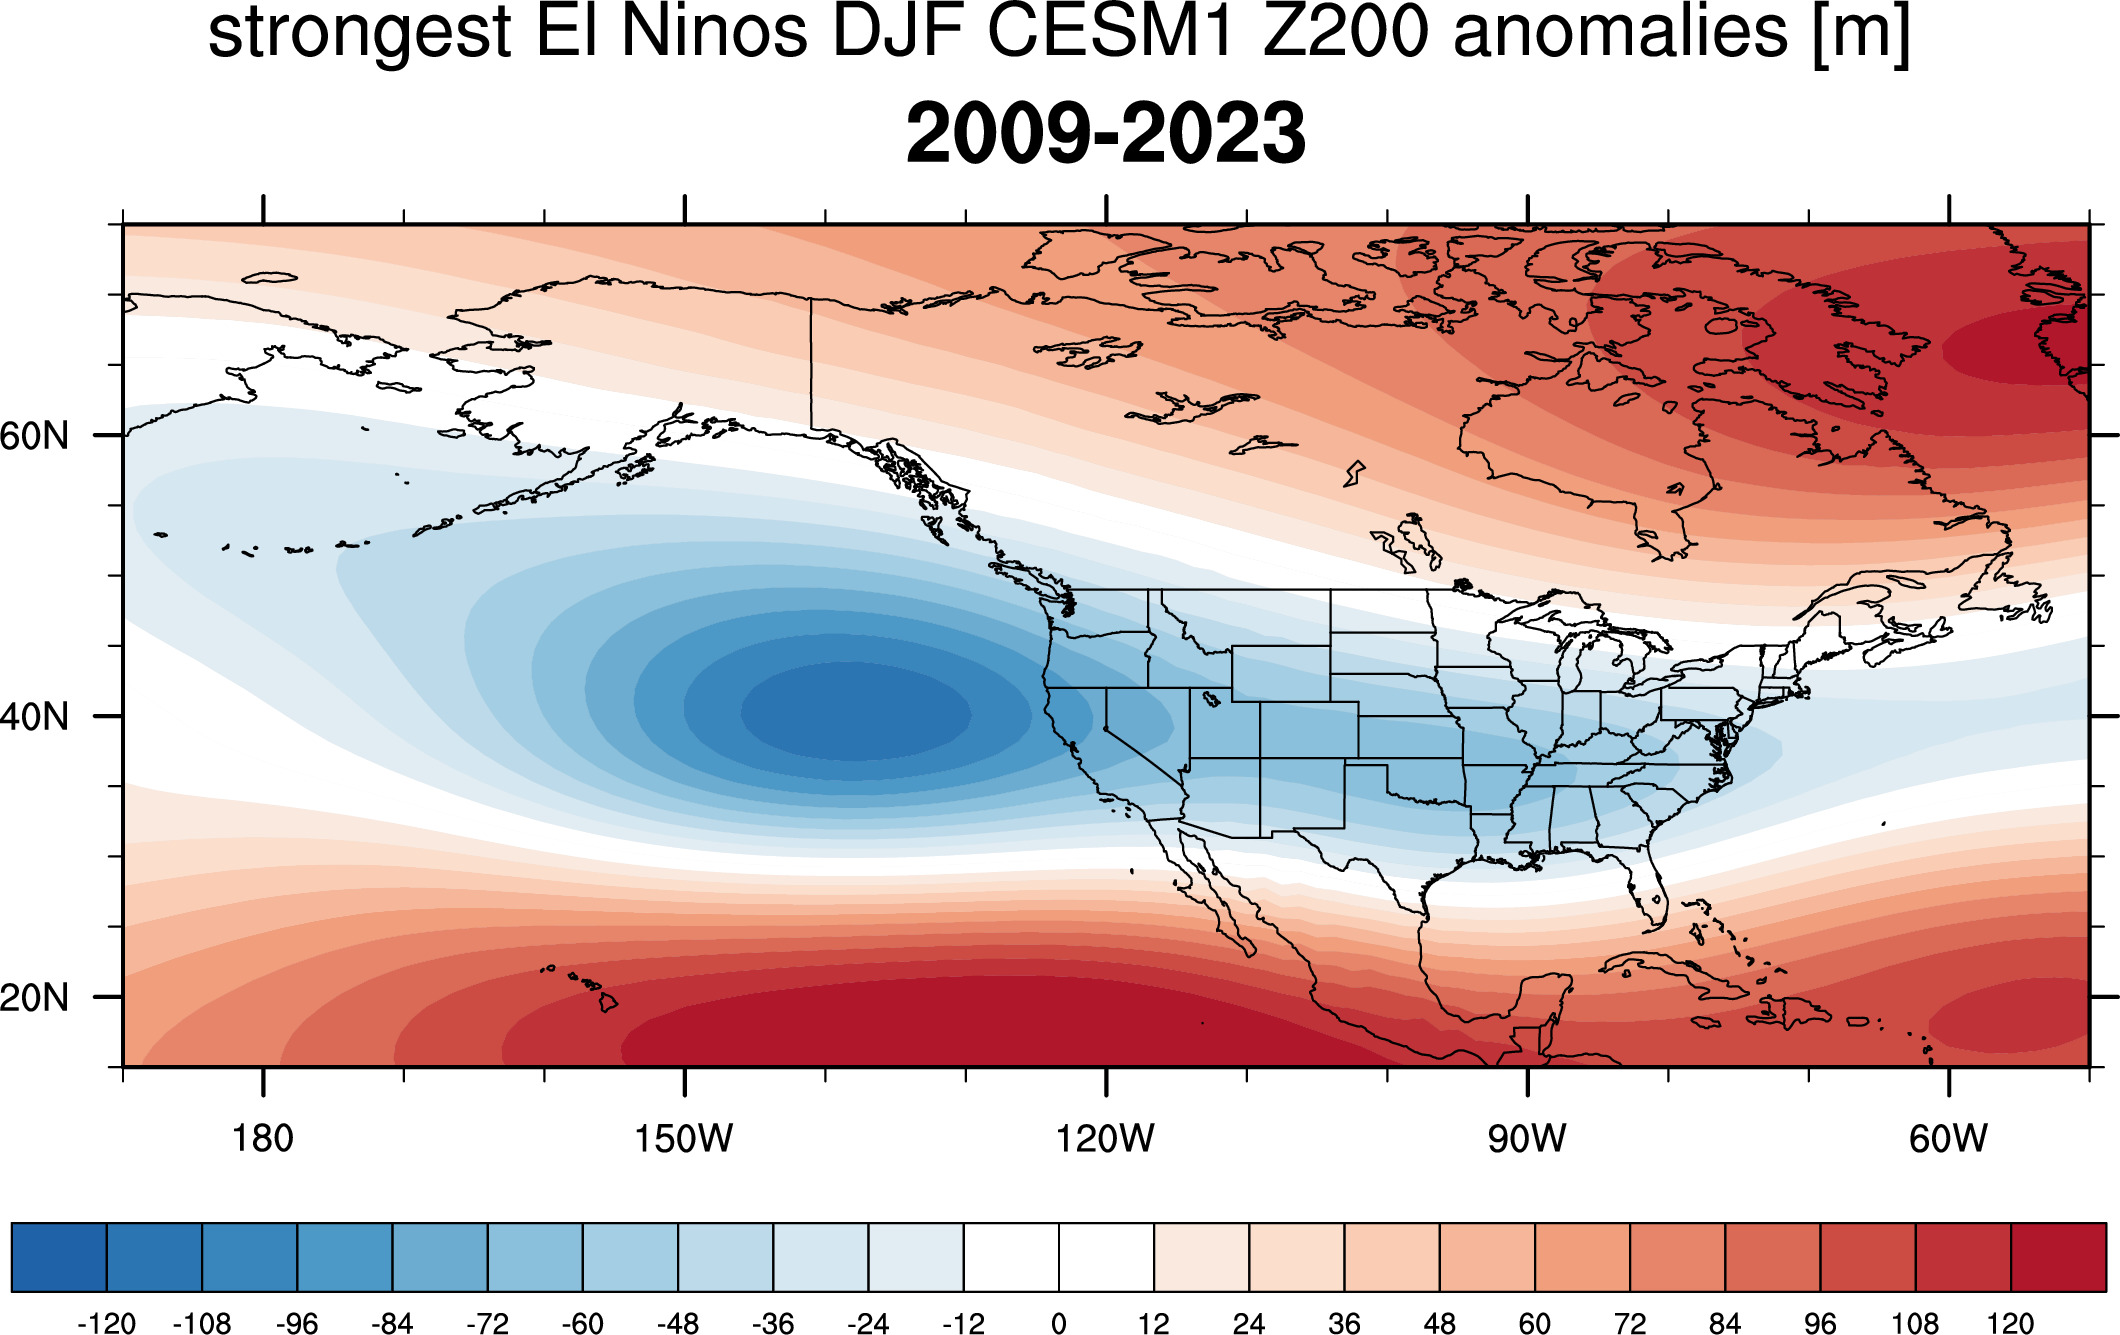
Z200 Anomaly Maps:
1976-1990: top "strongest" 3 individual runs:
 All:
All: 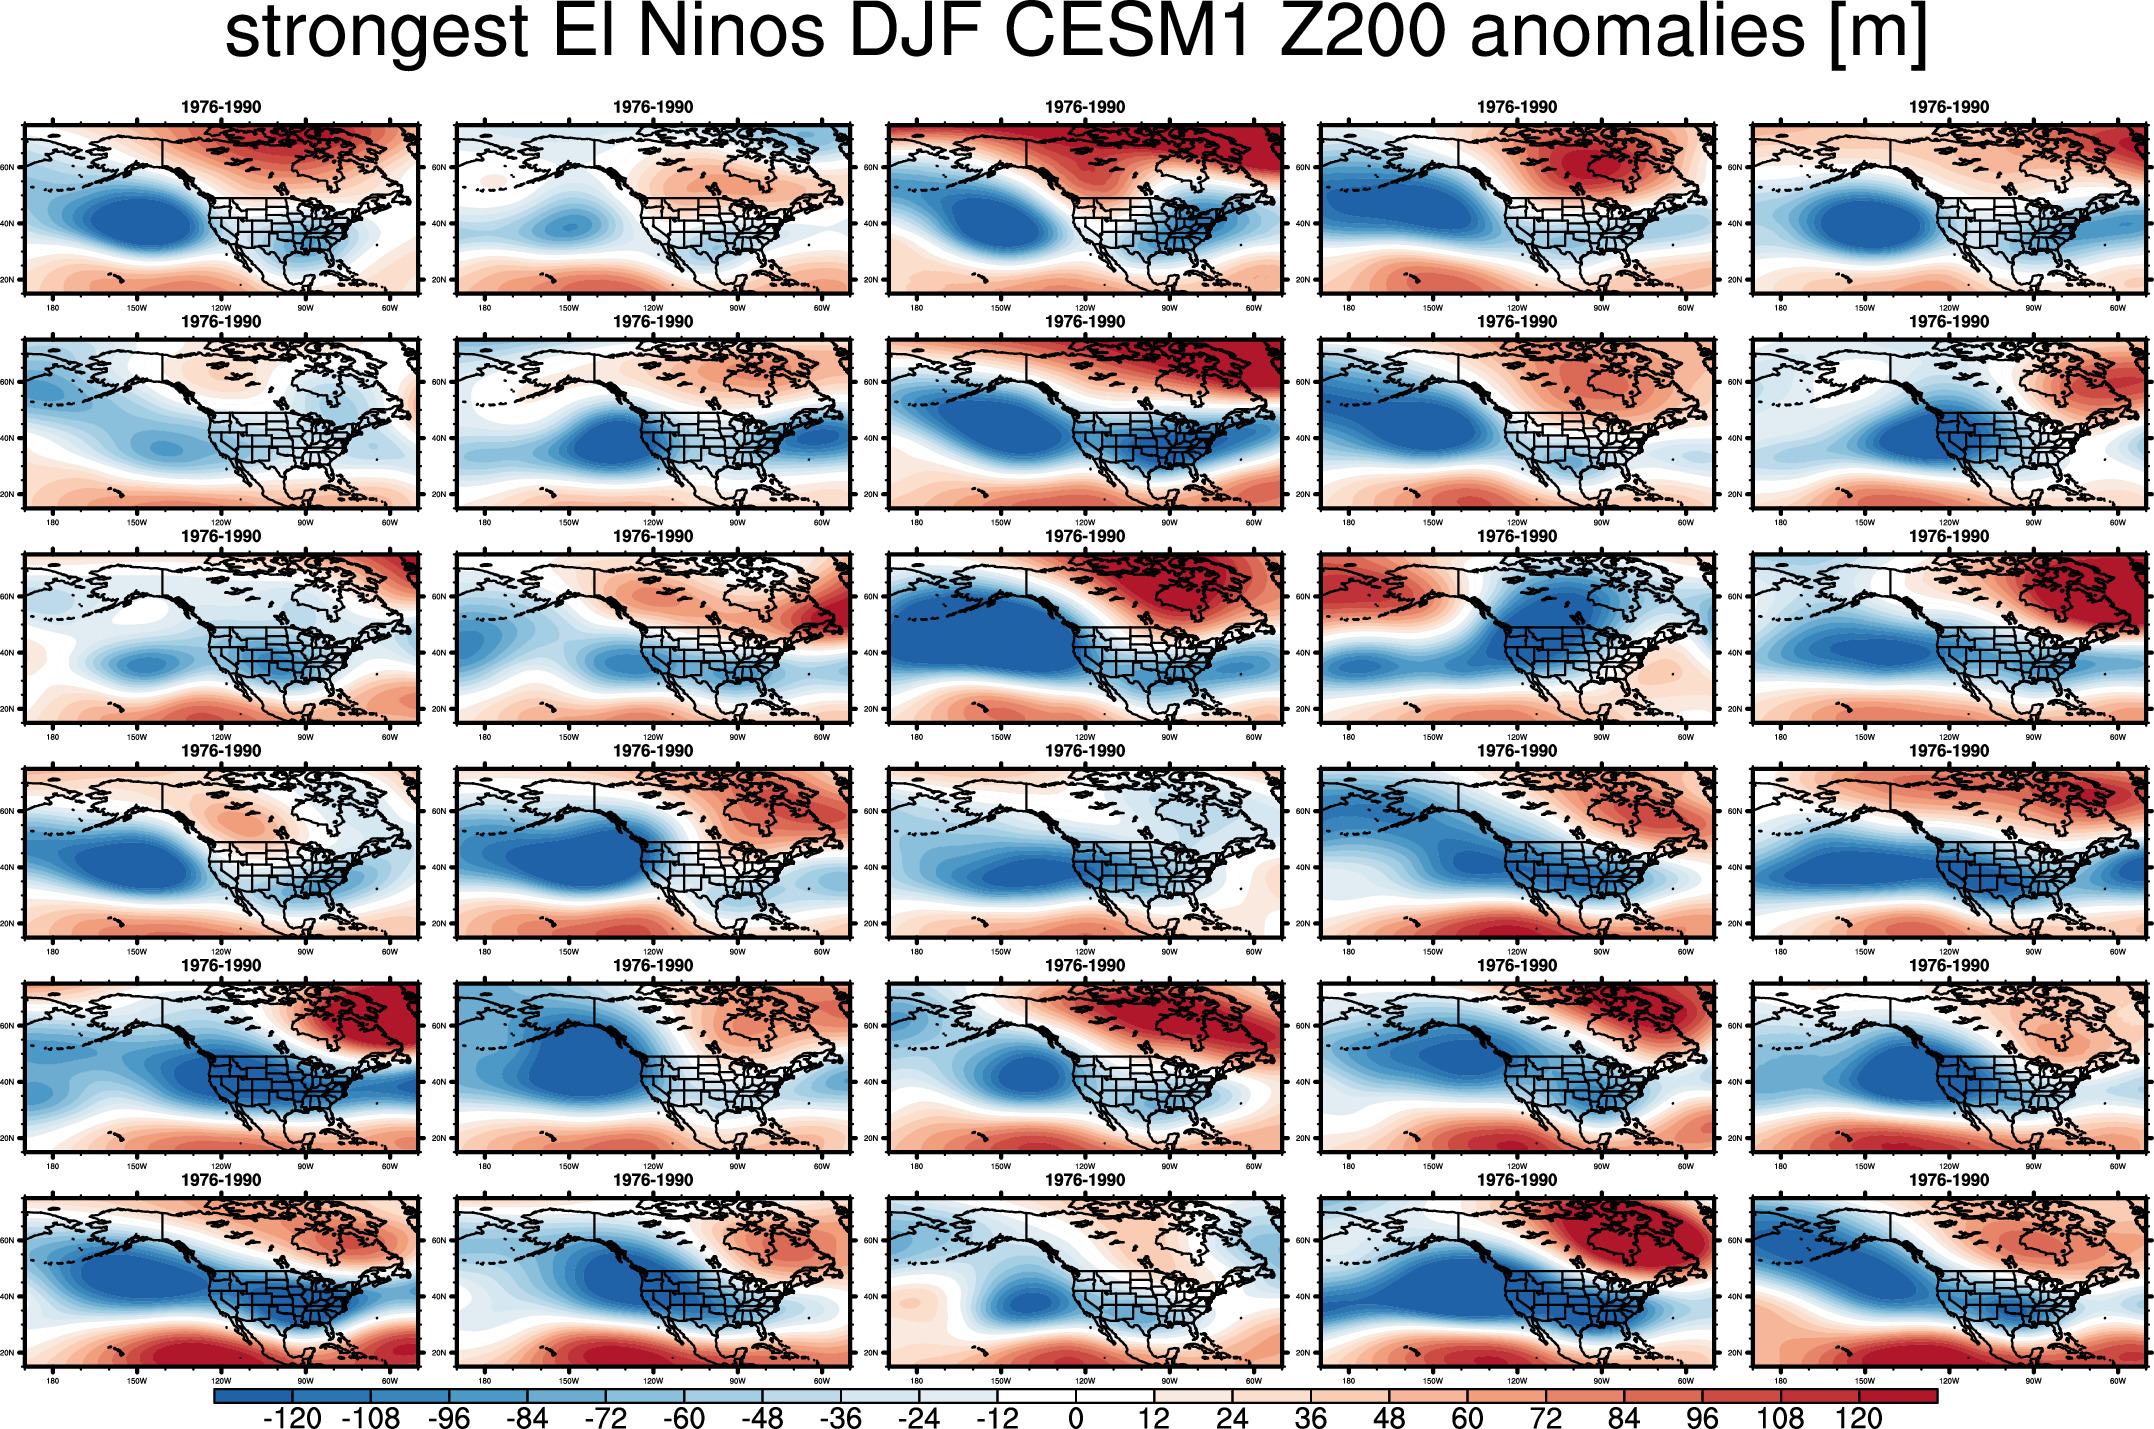
Differences with average
2009-2023: top "strongest" 3 individual runs:
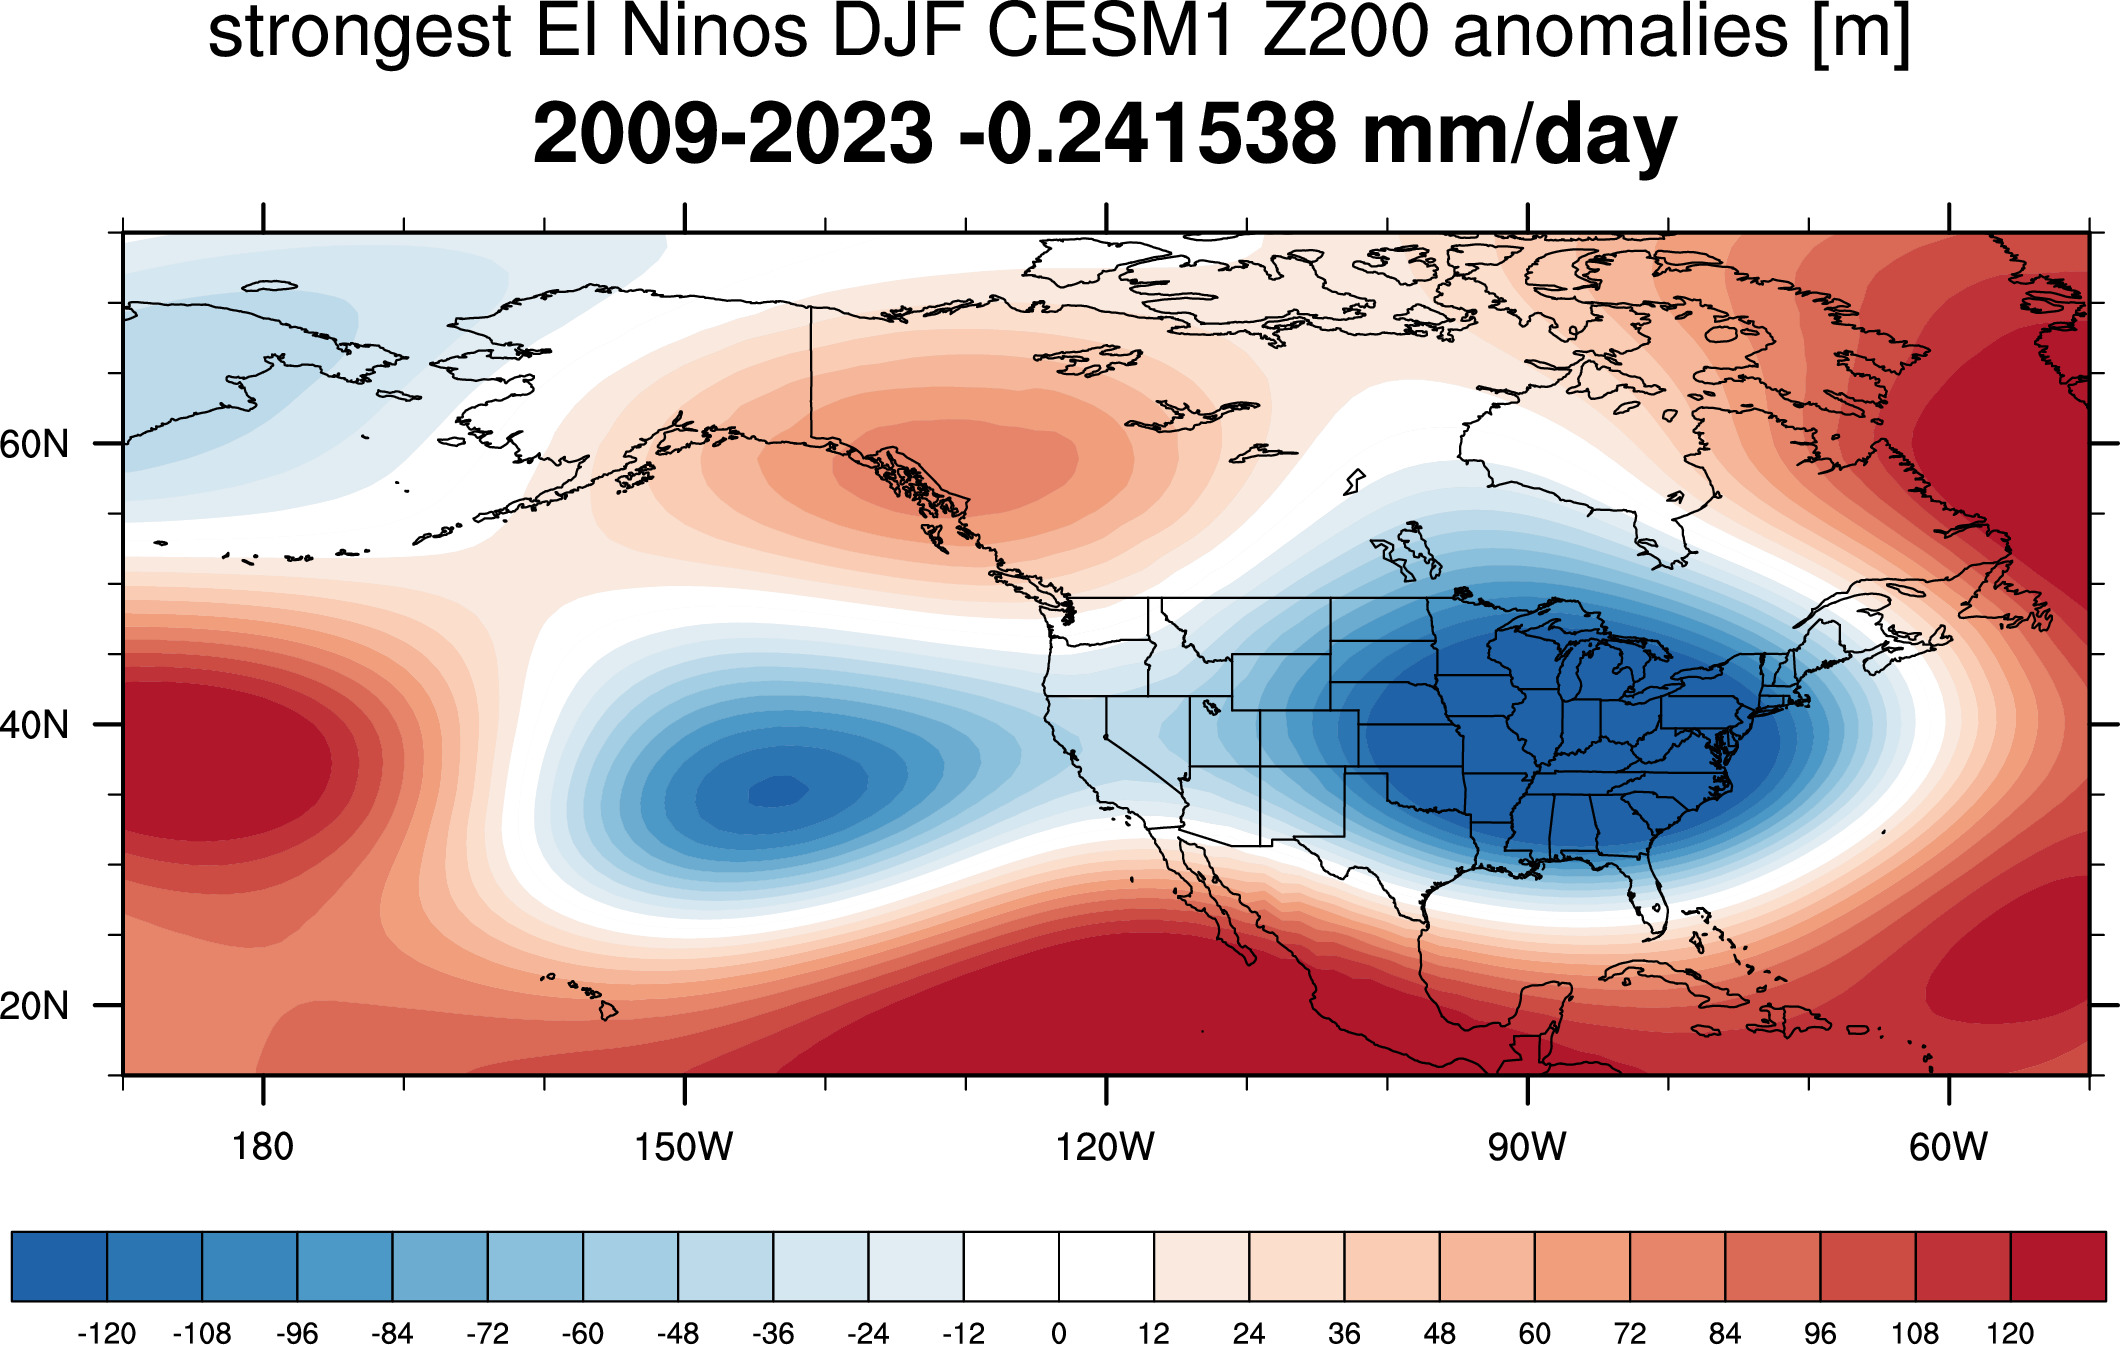
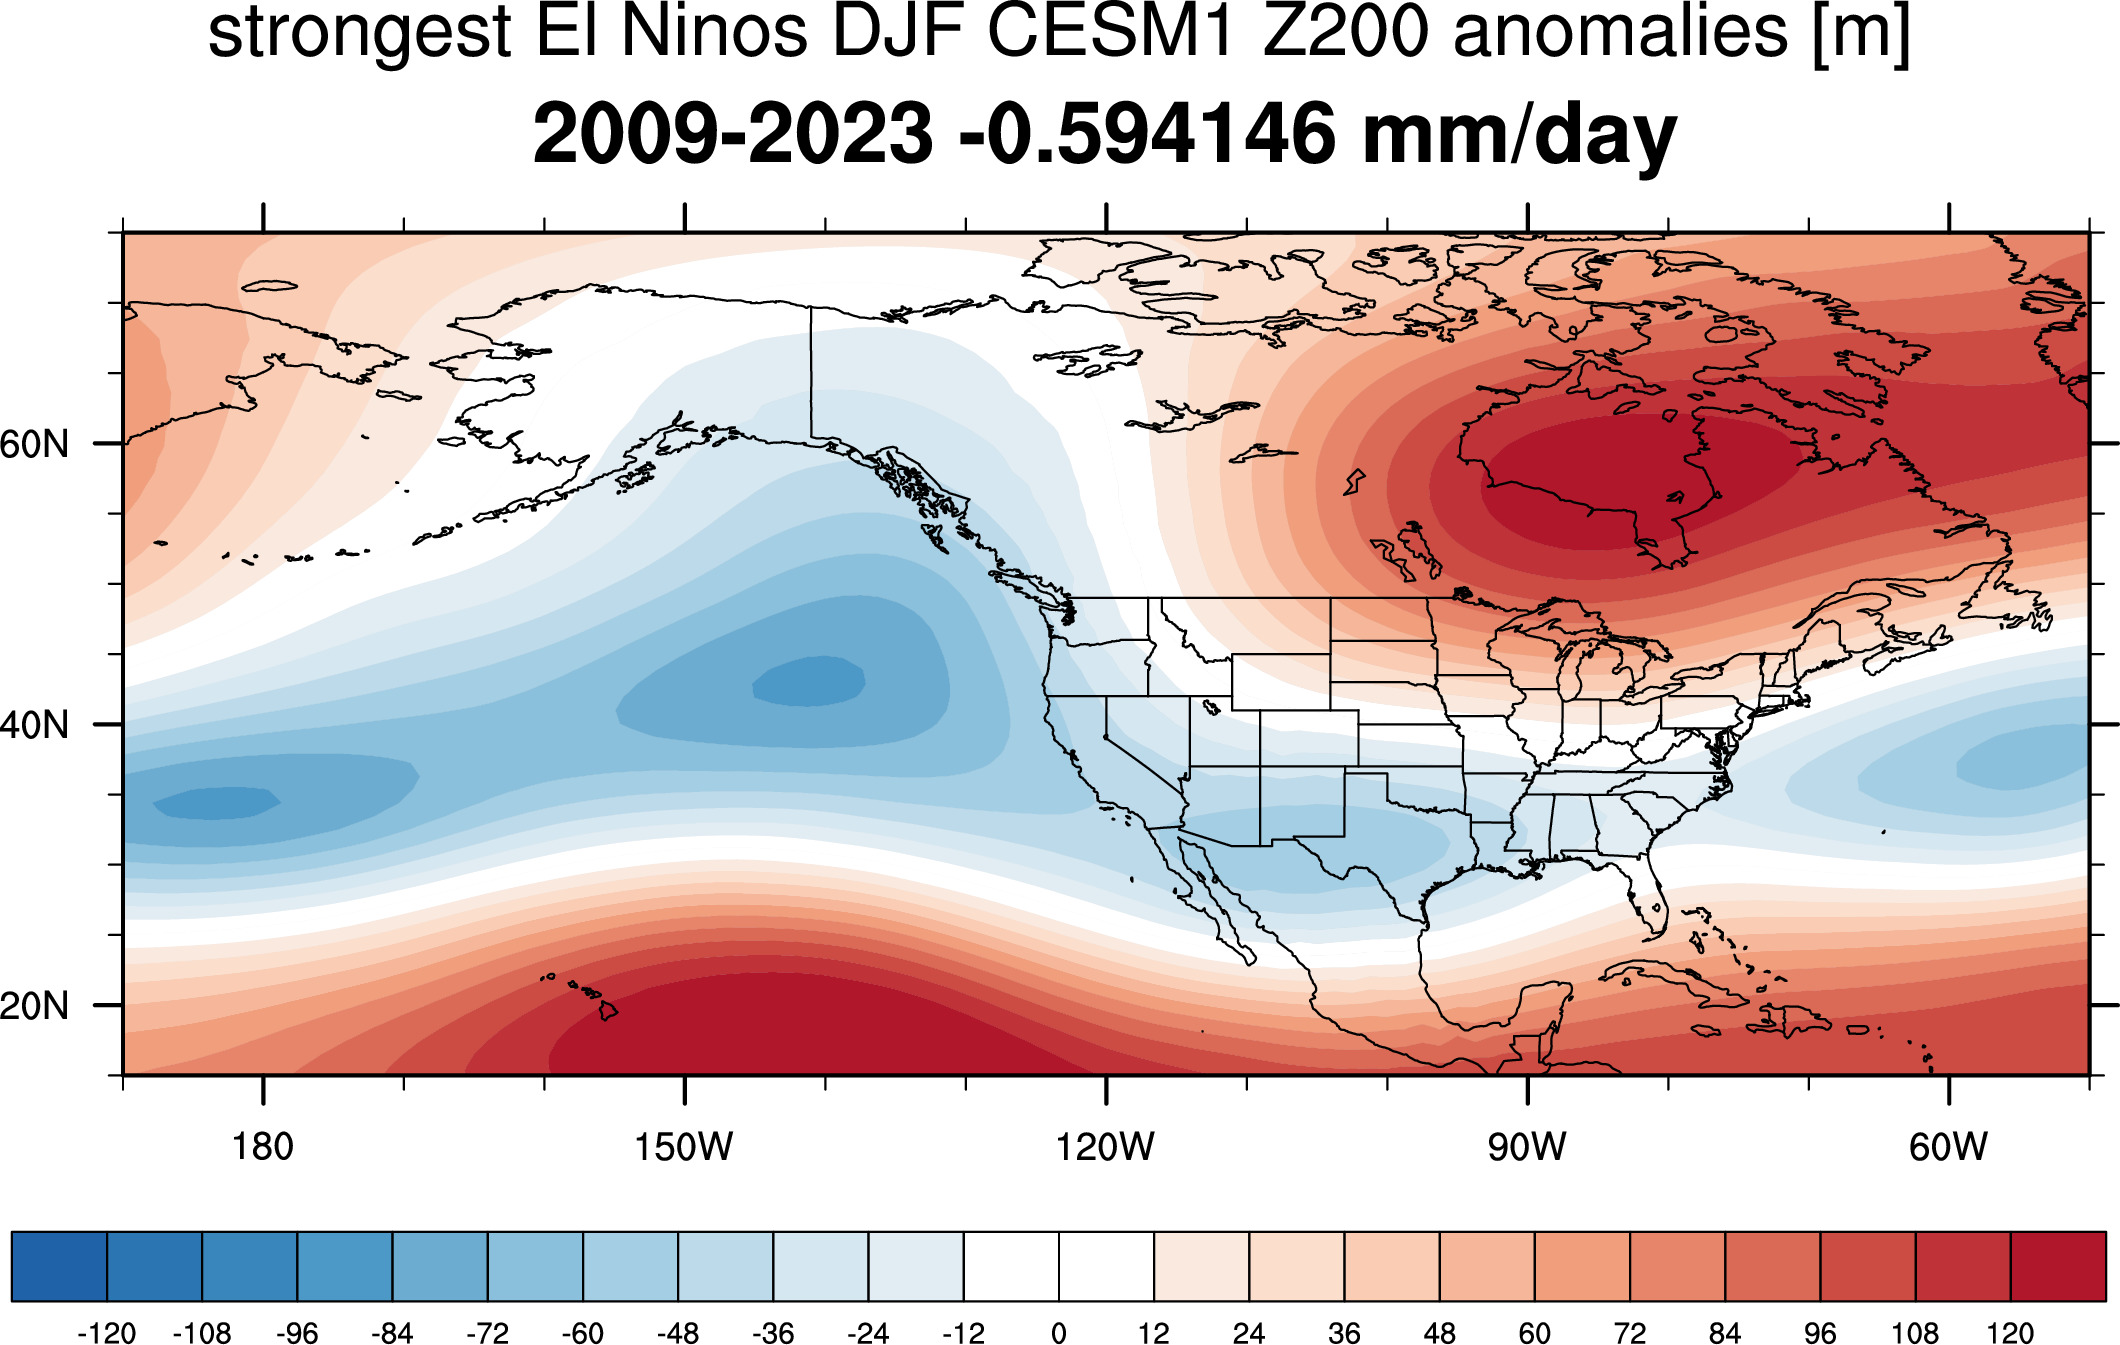
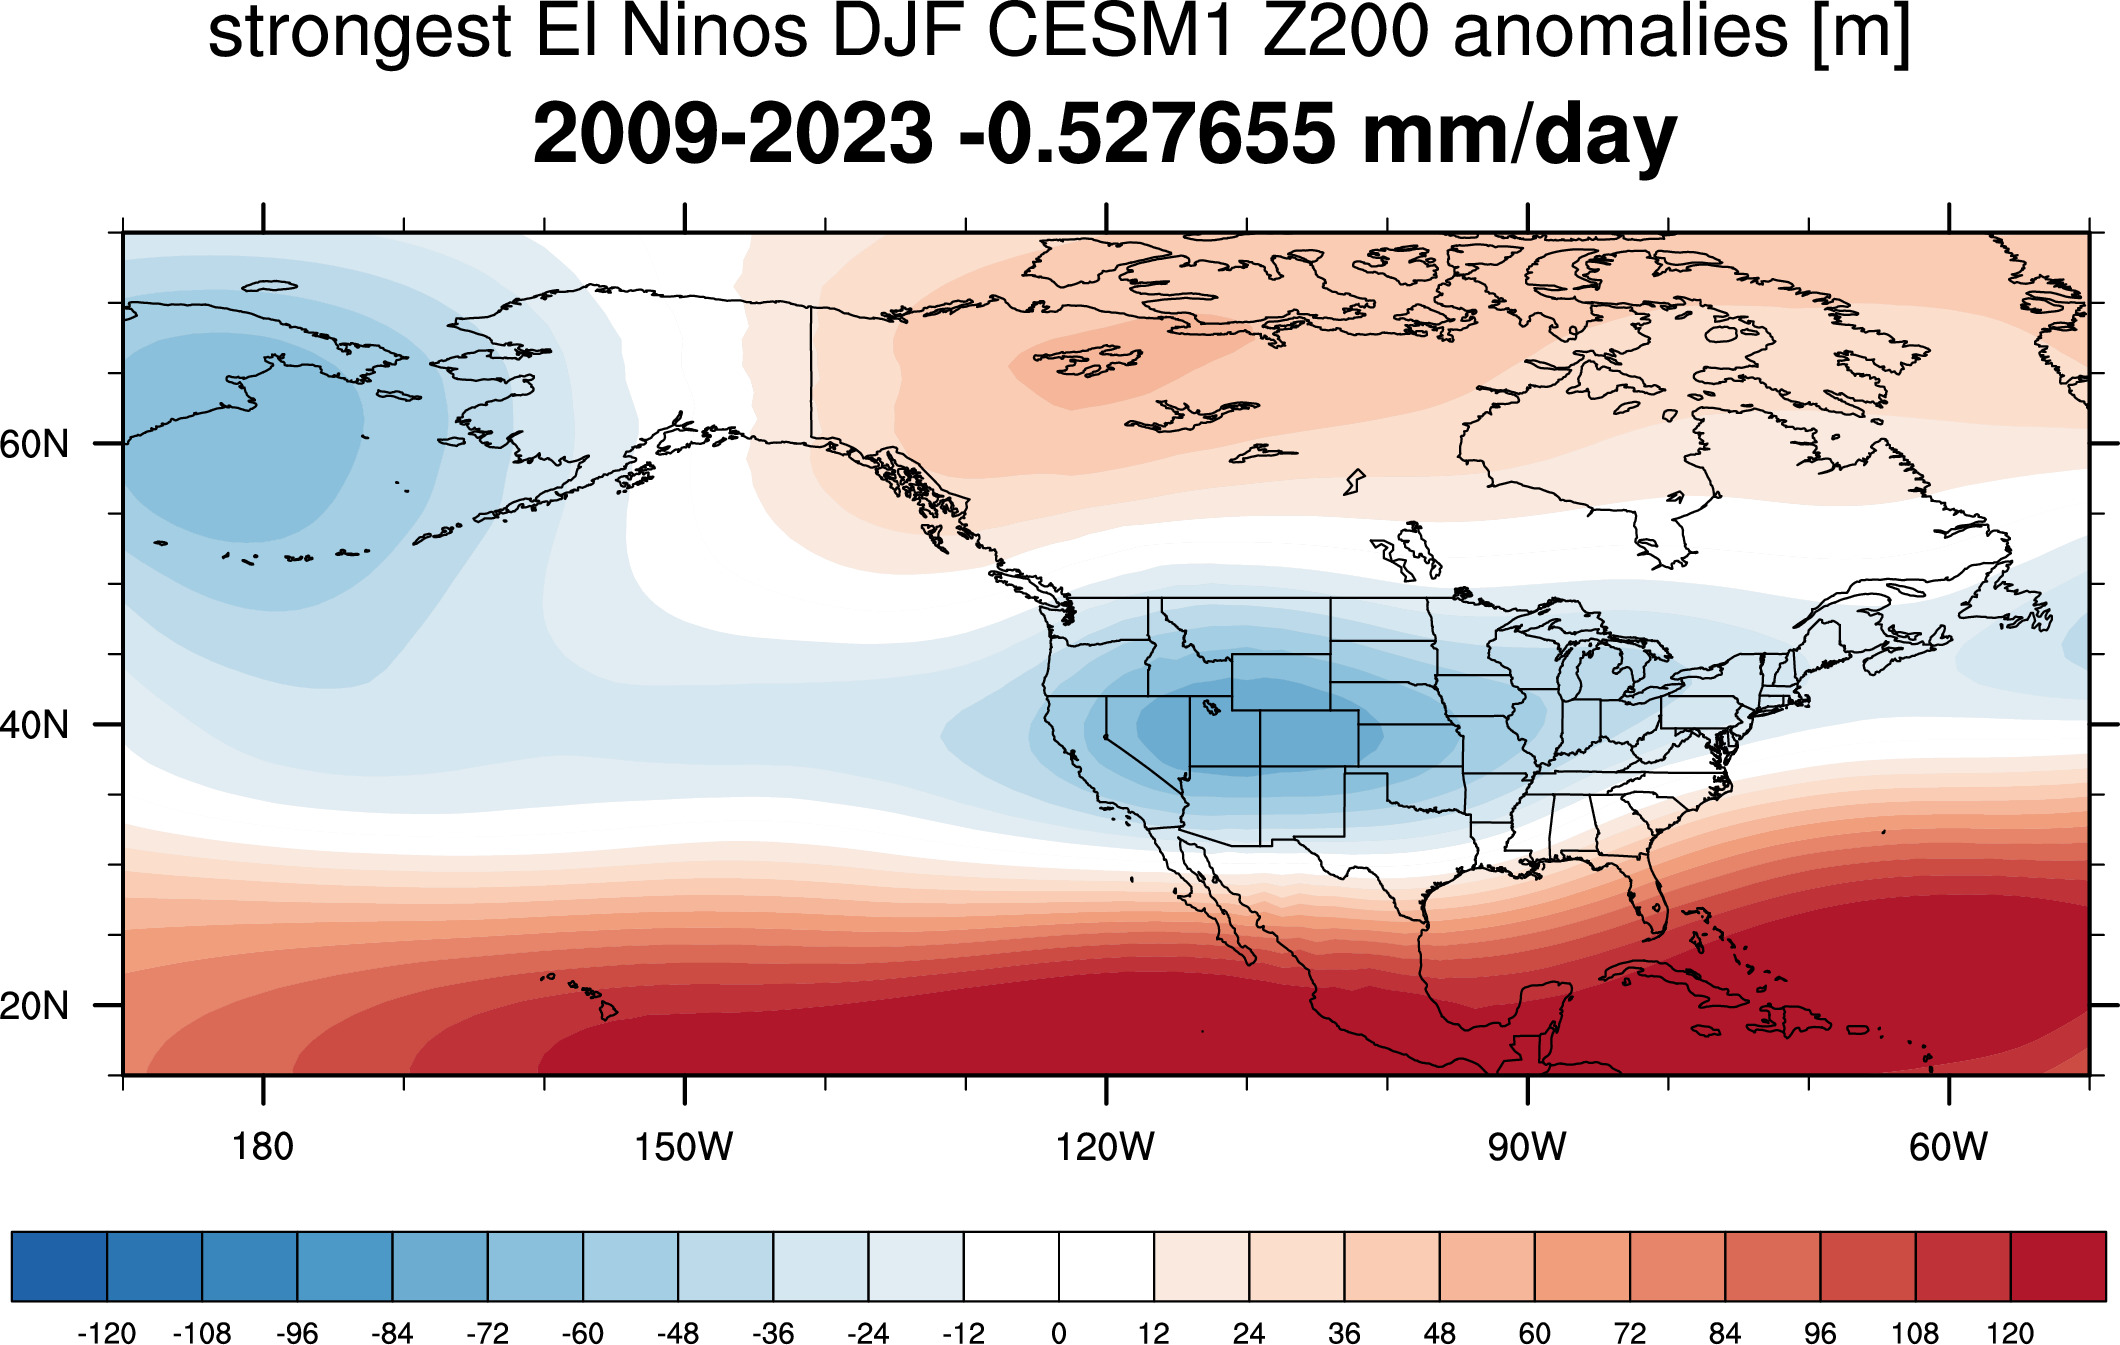 All:
All: 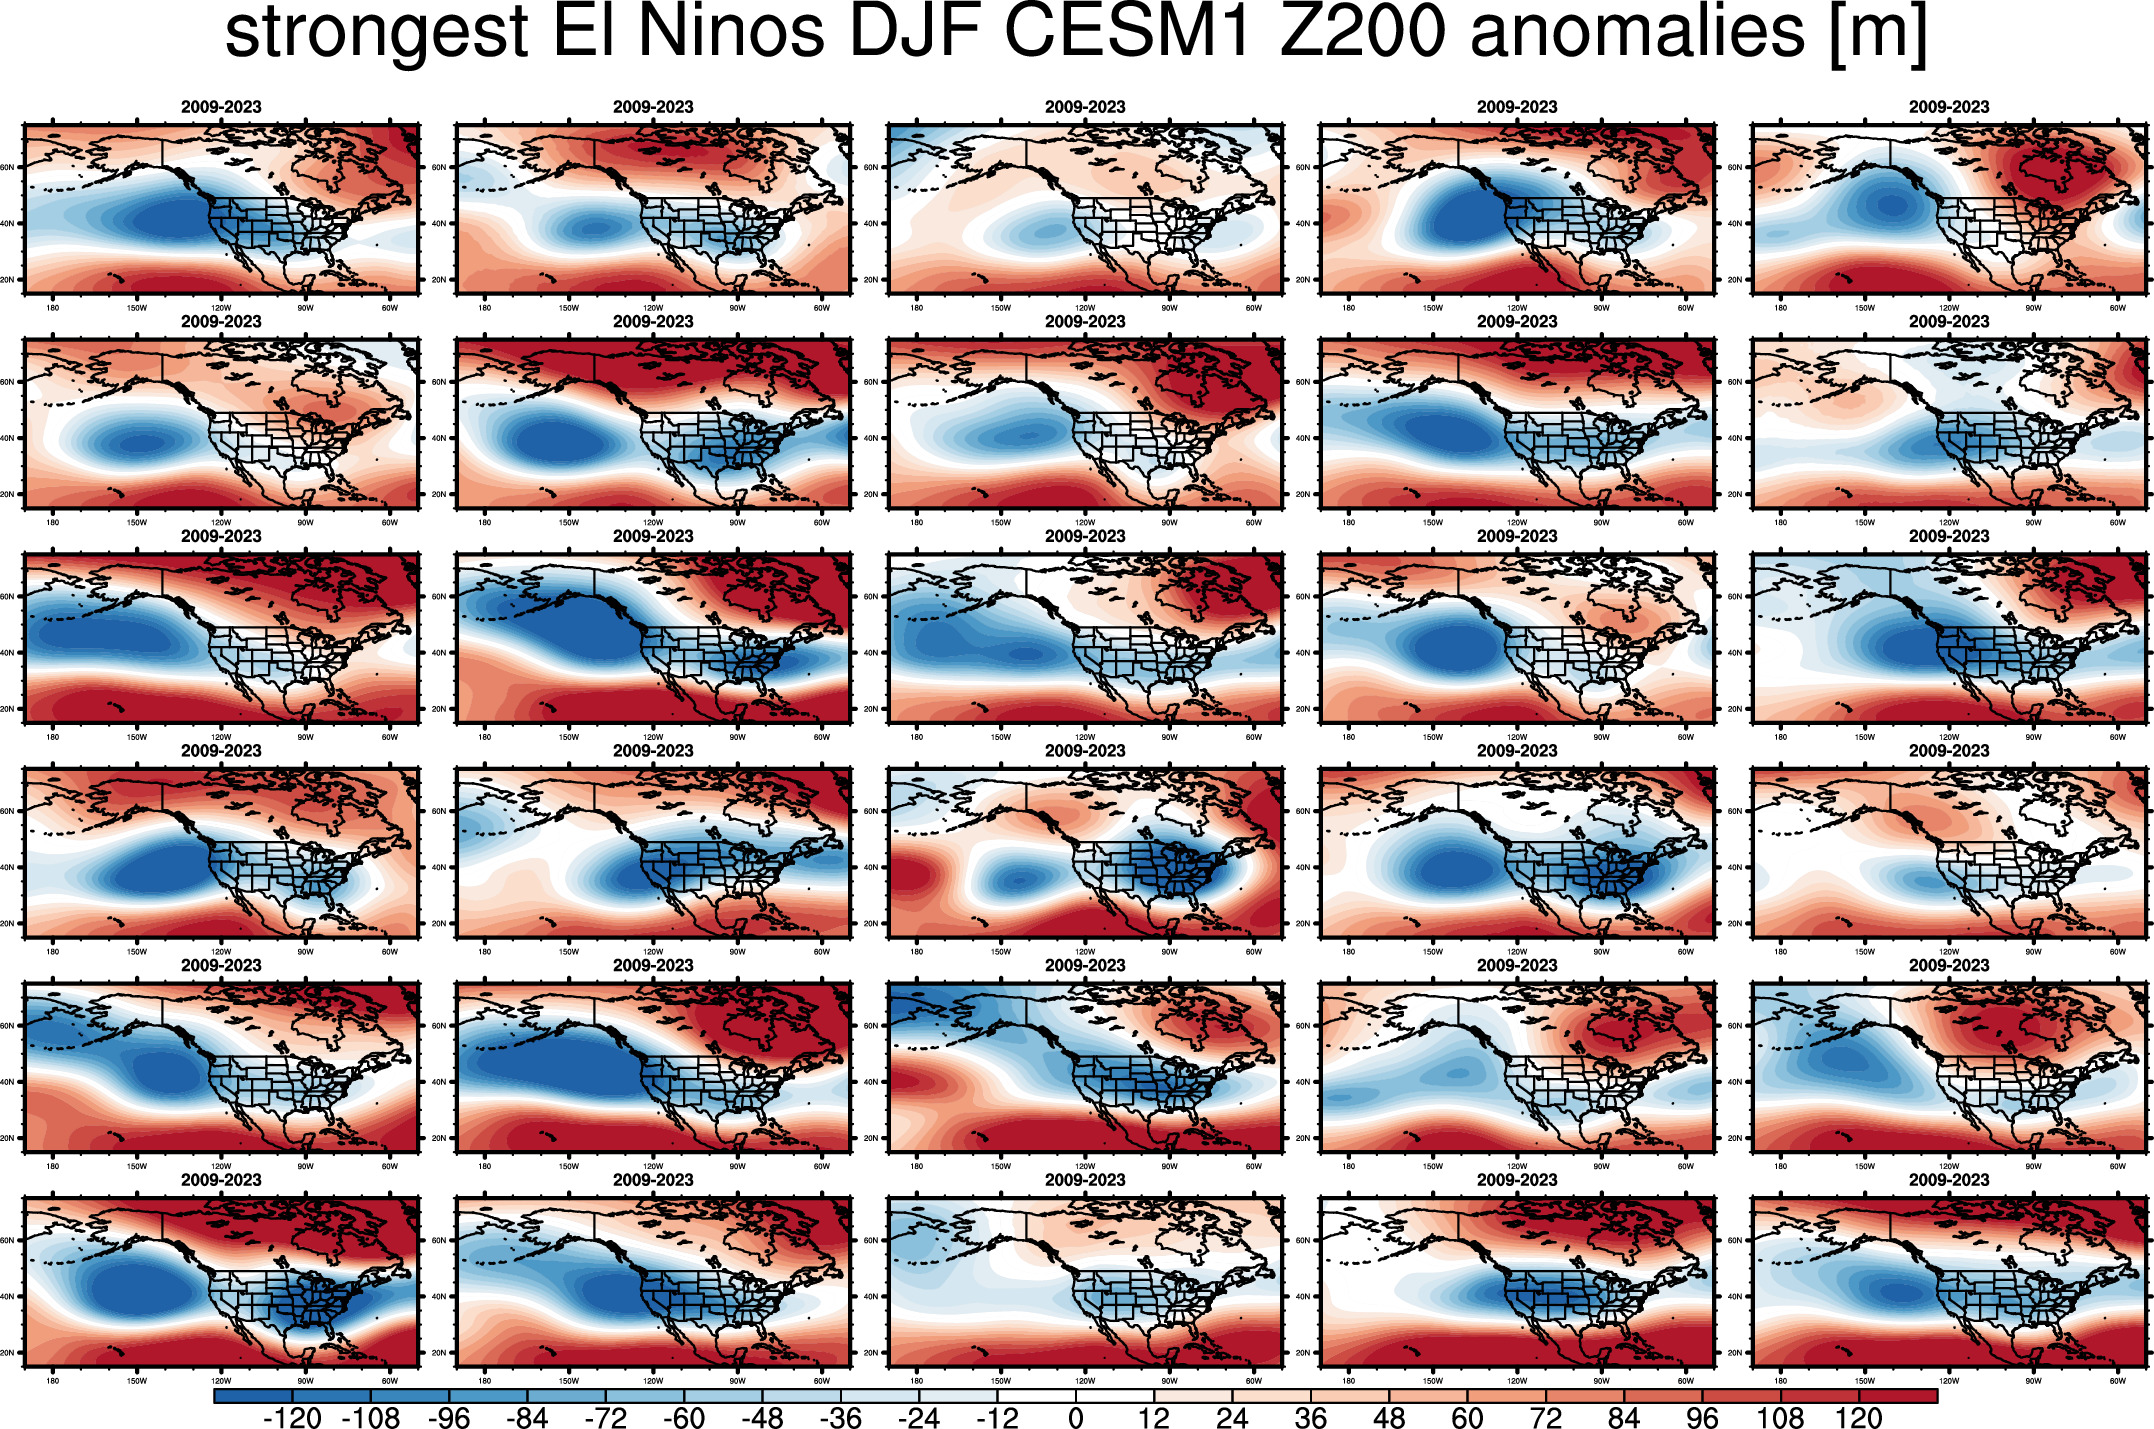
Differences with average
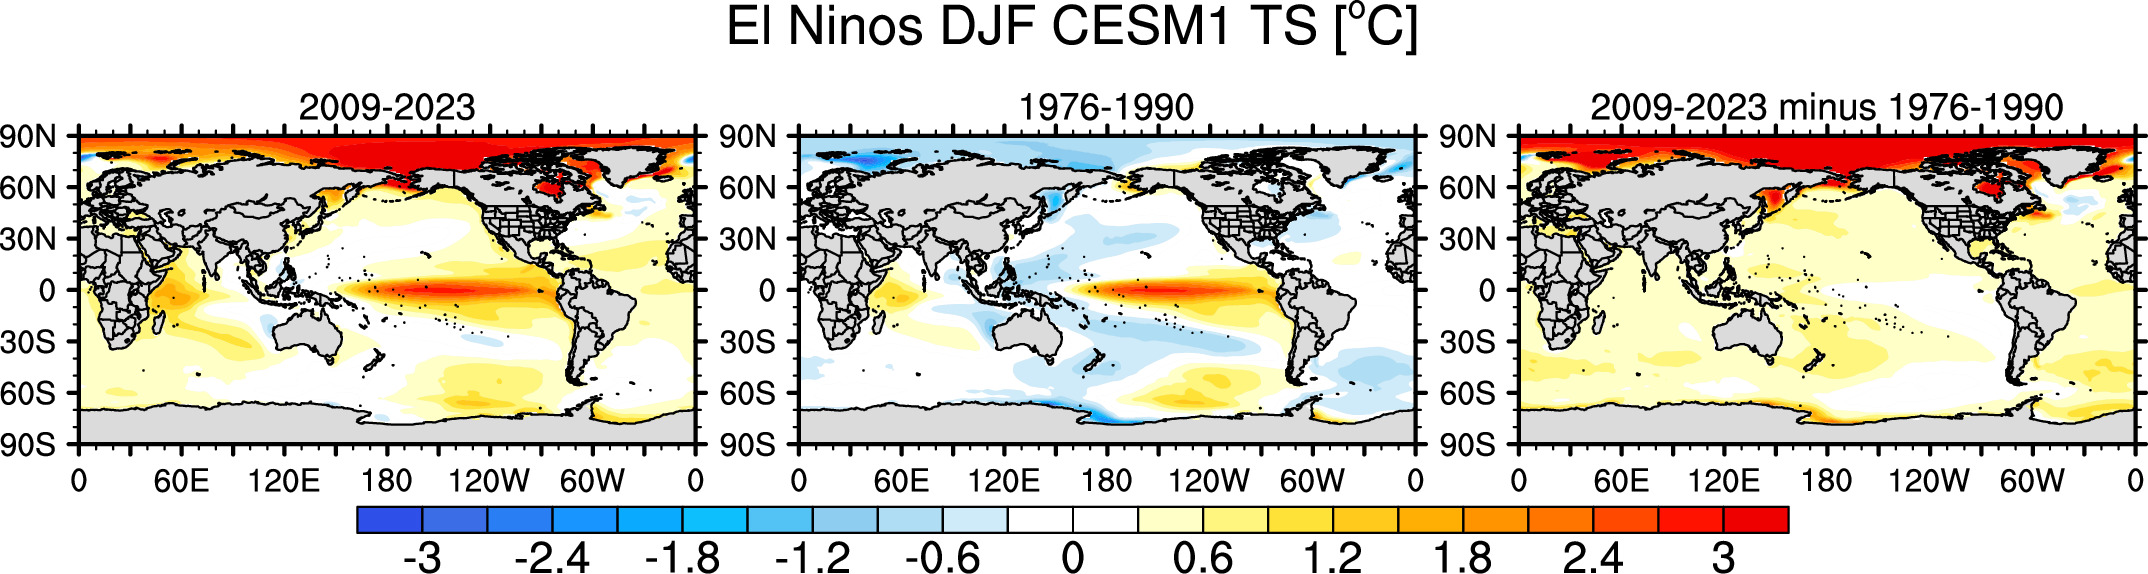
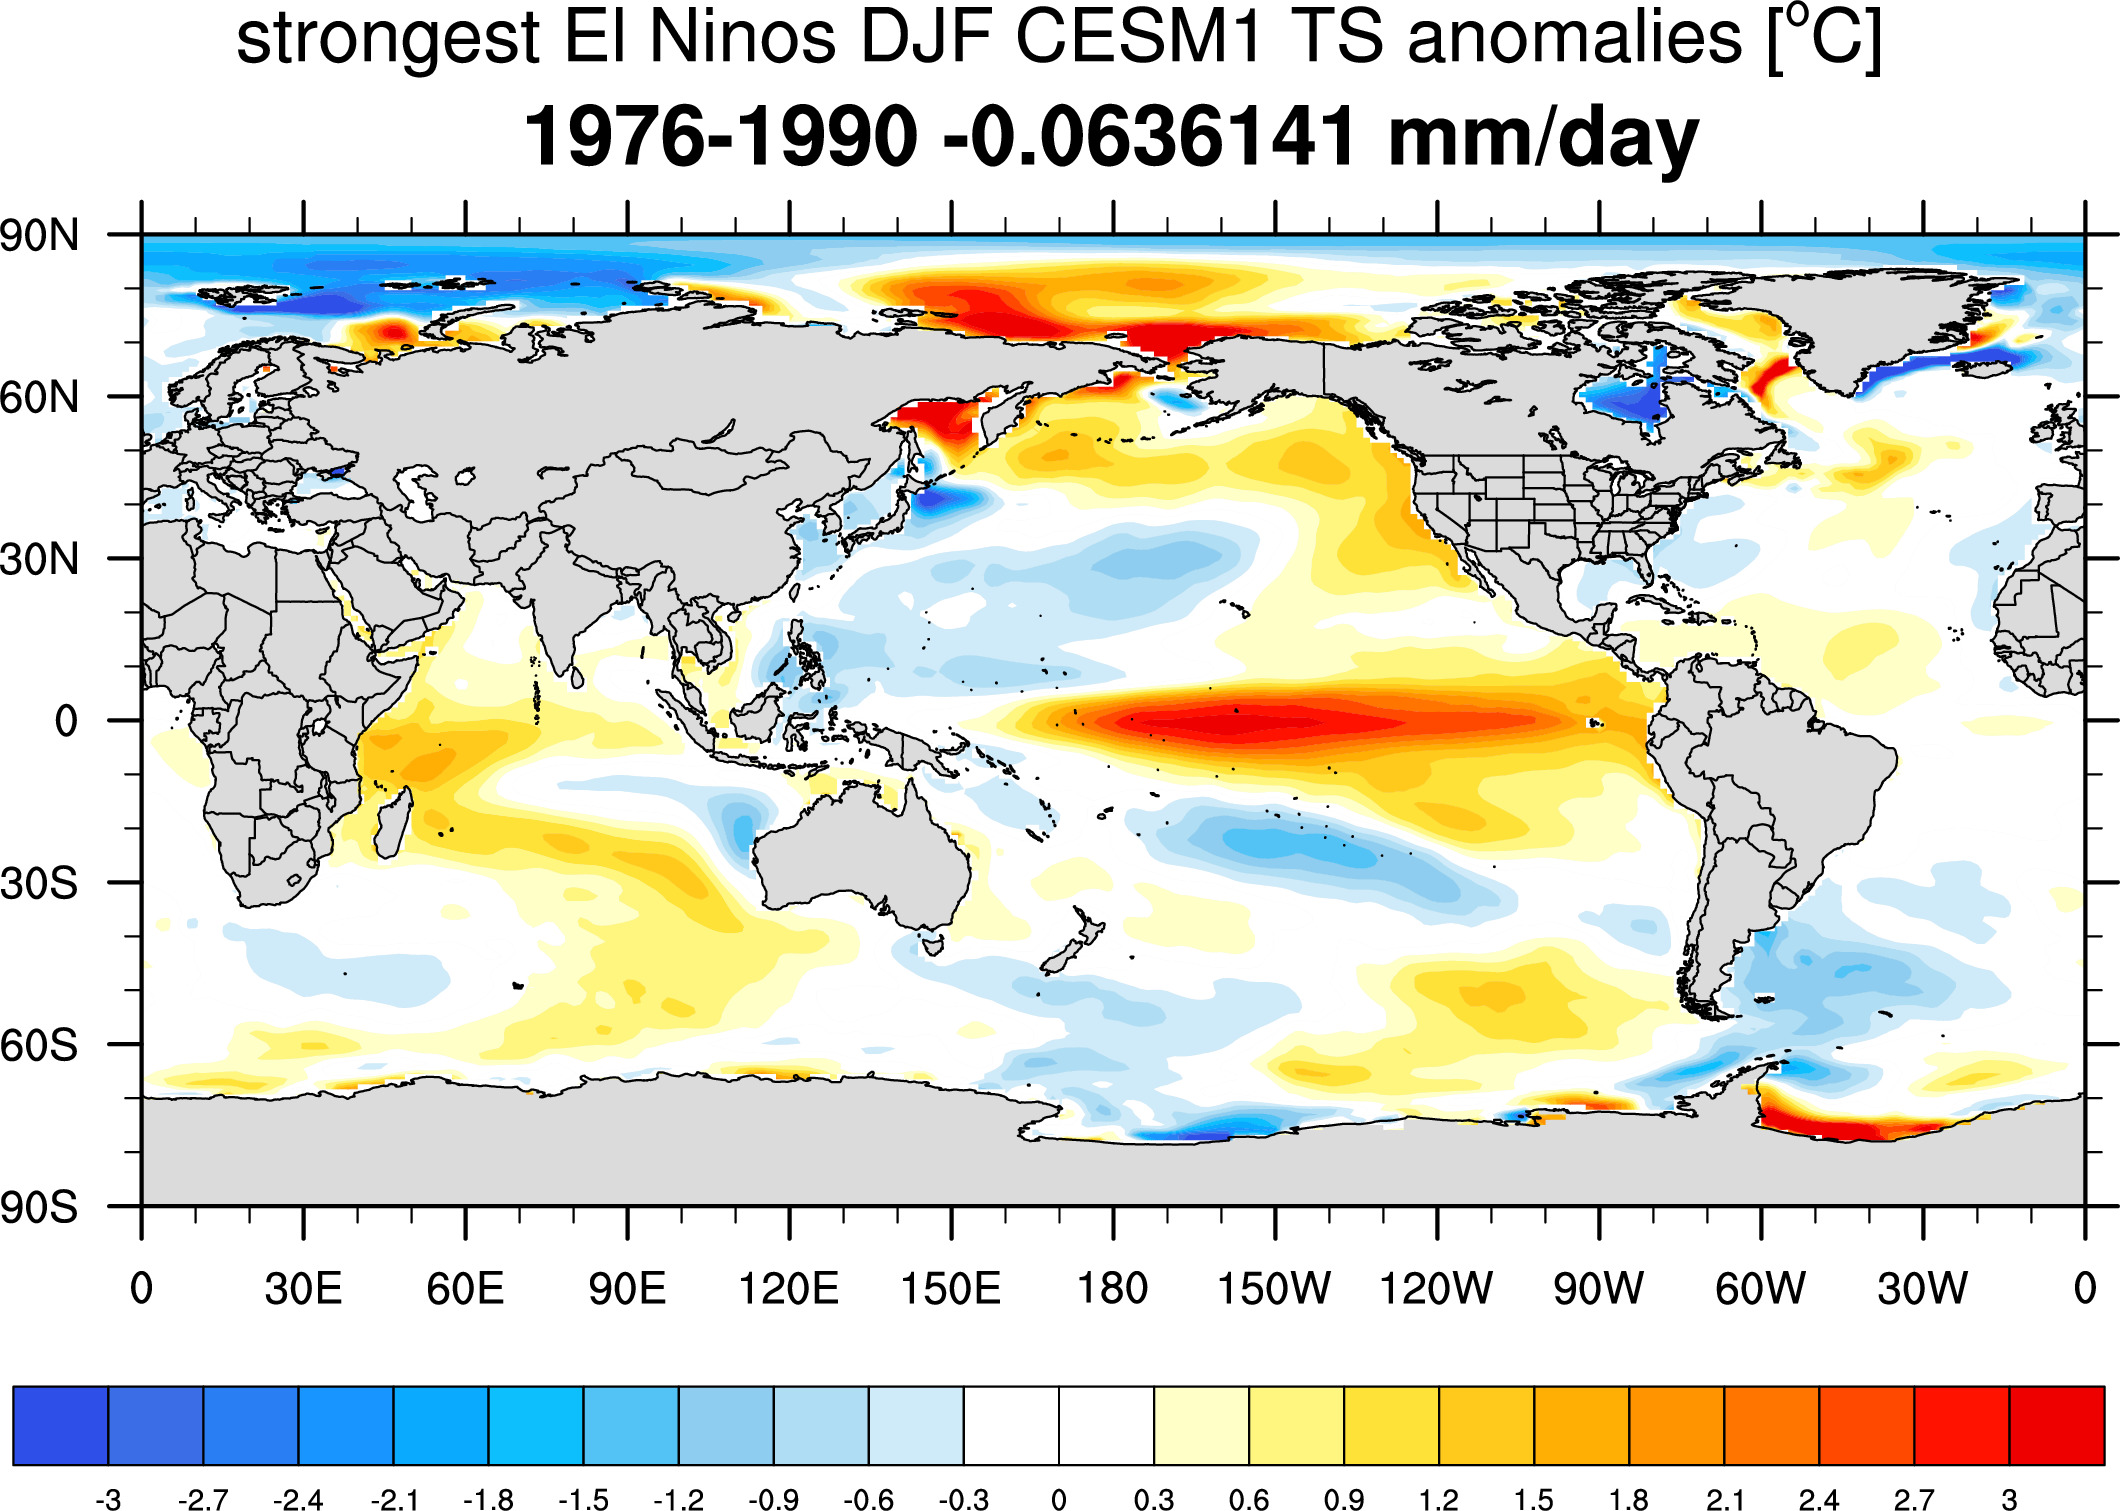
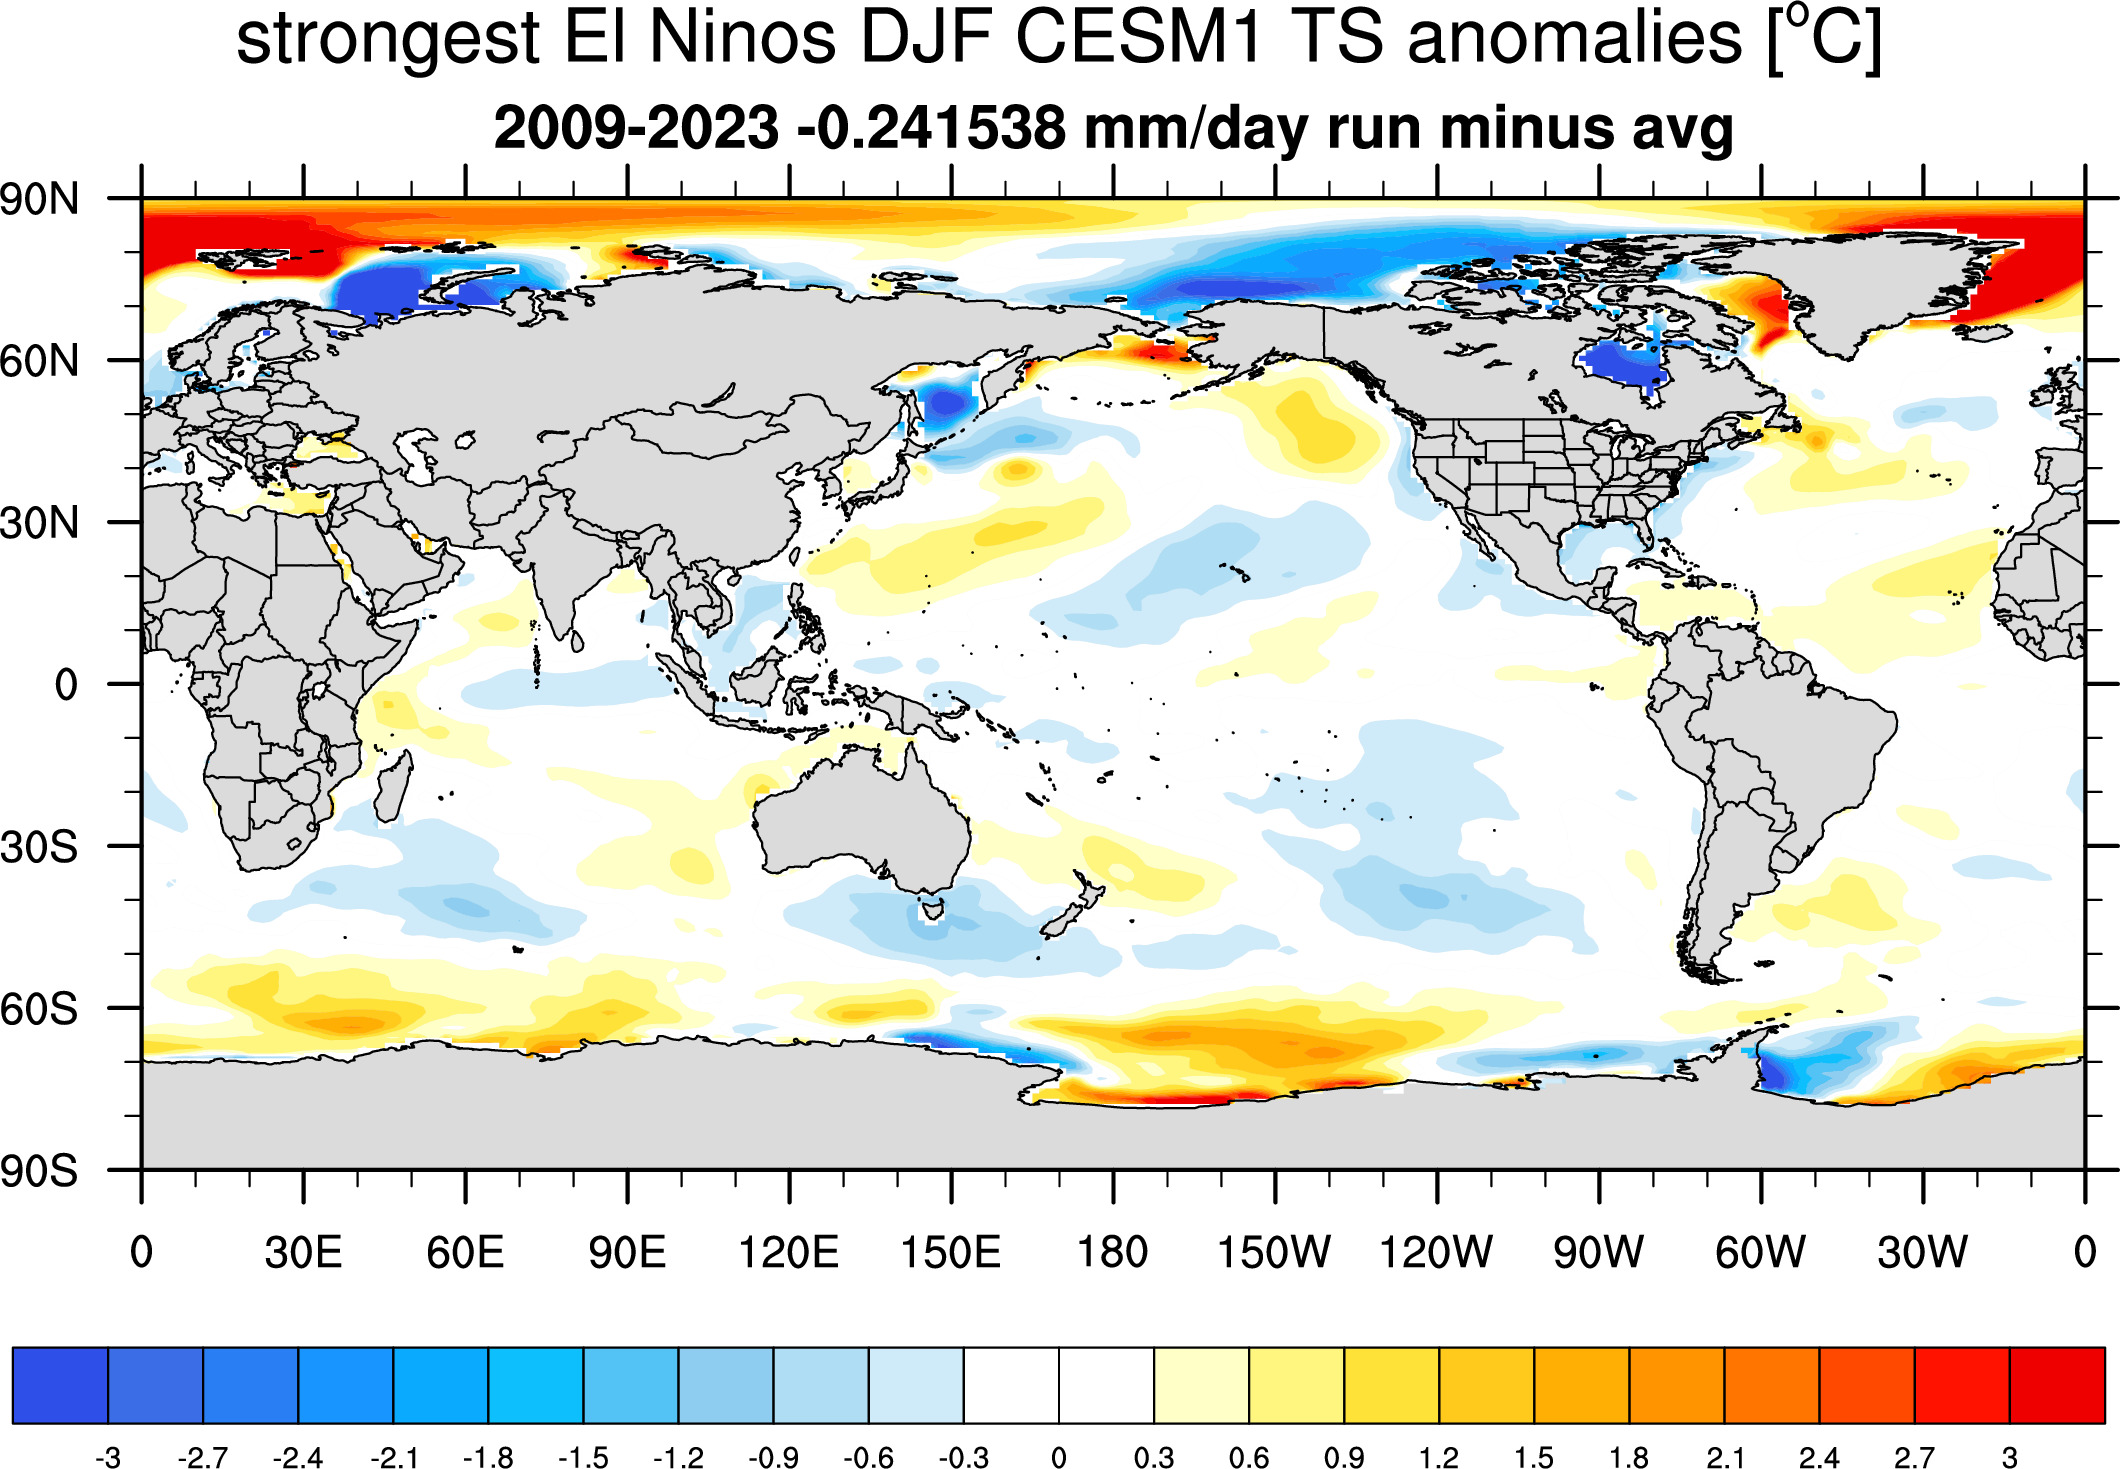
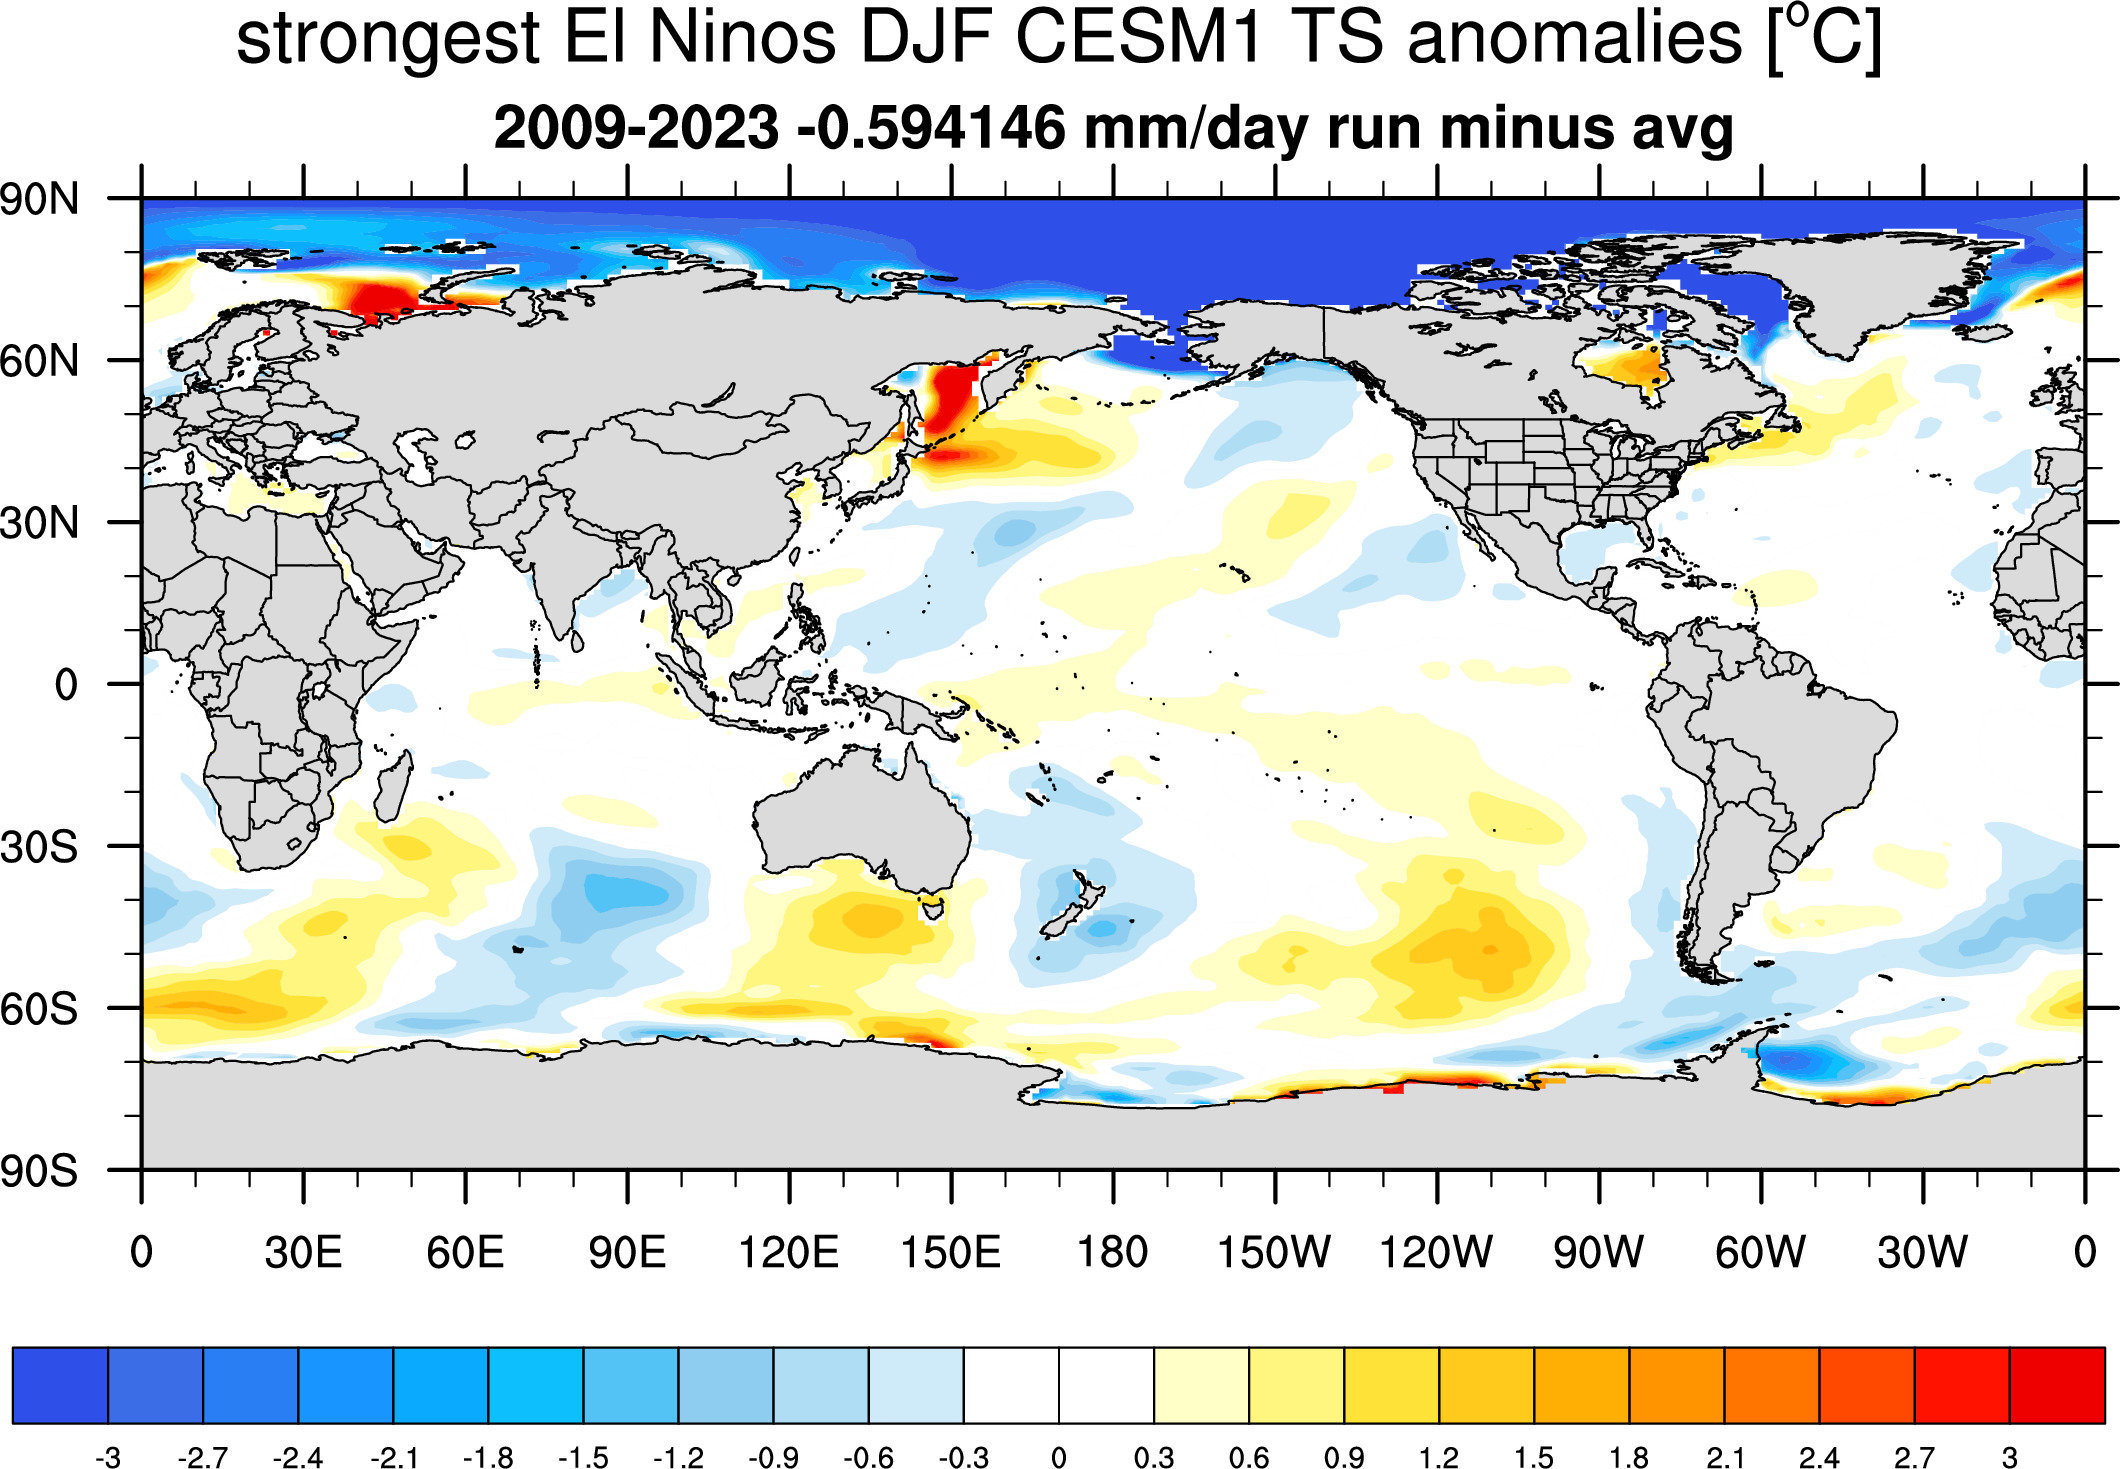
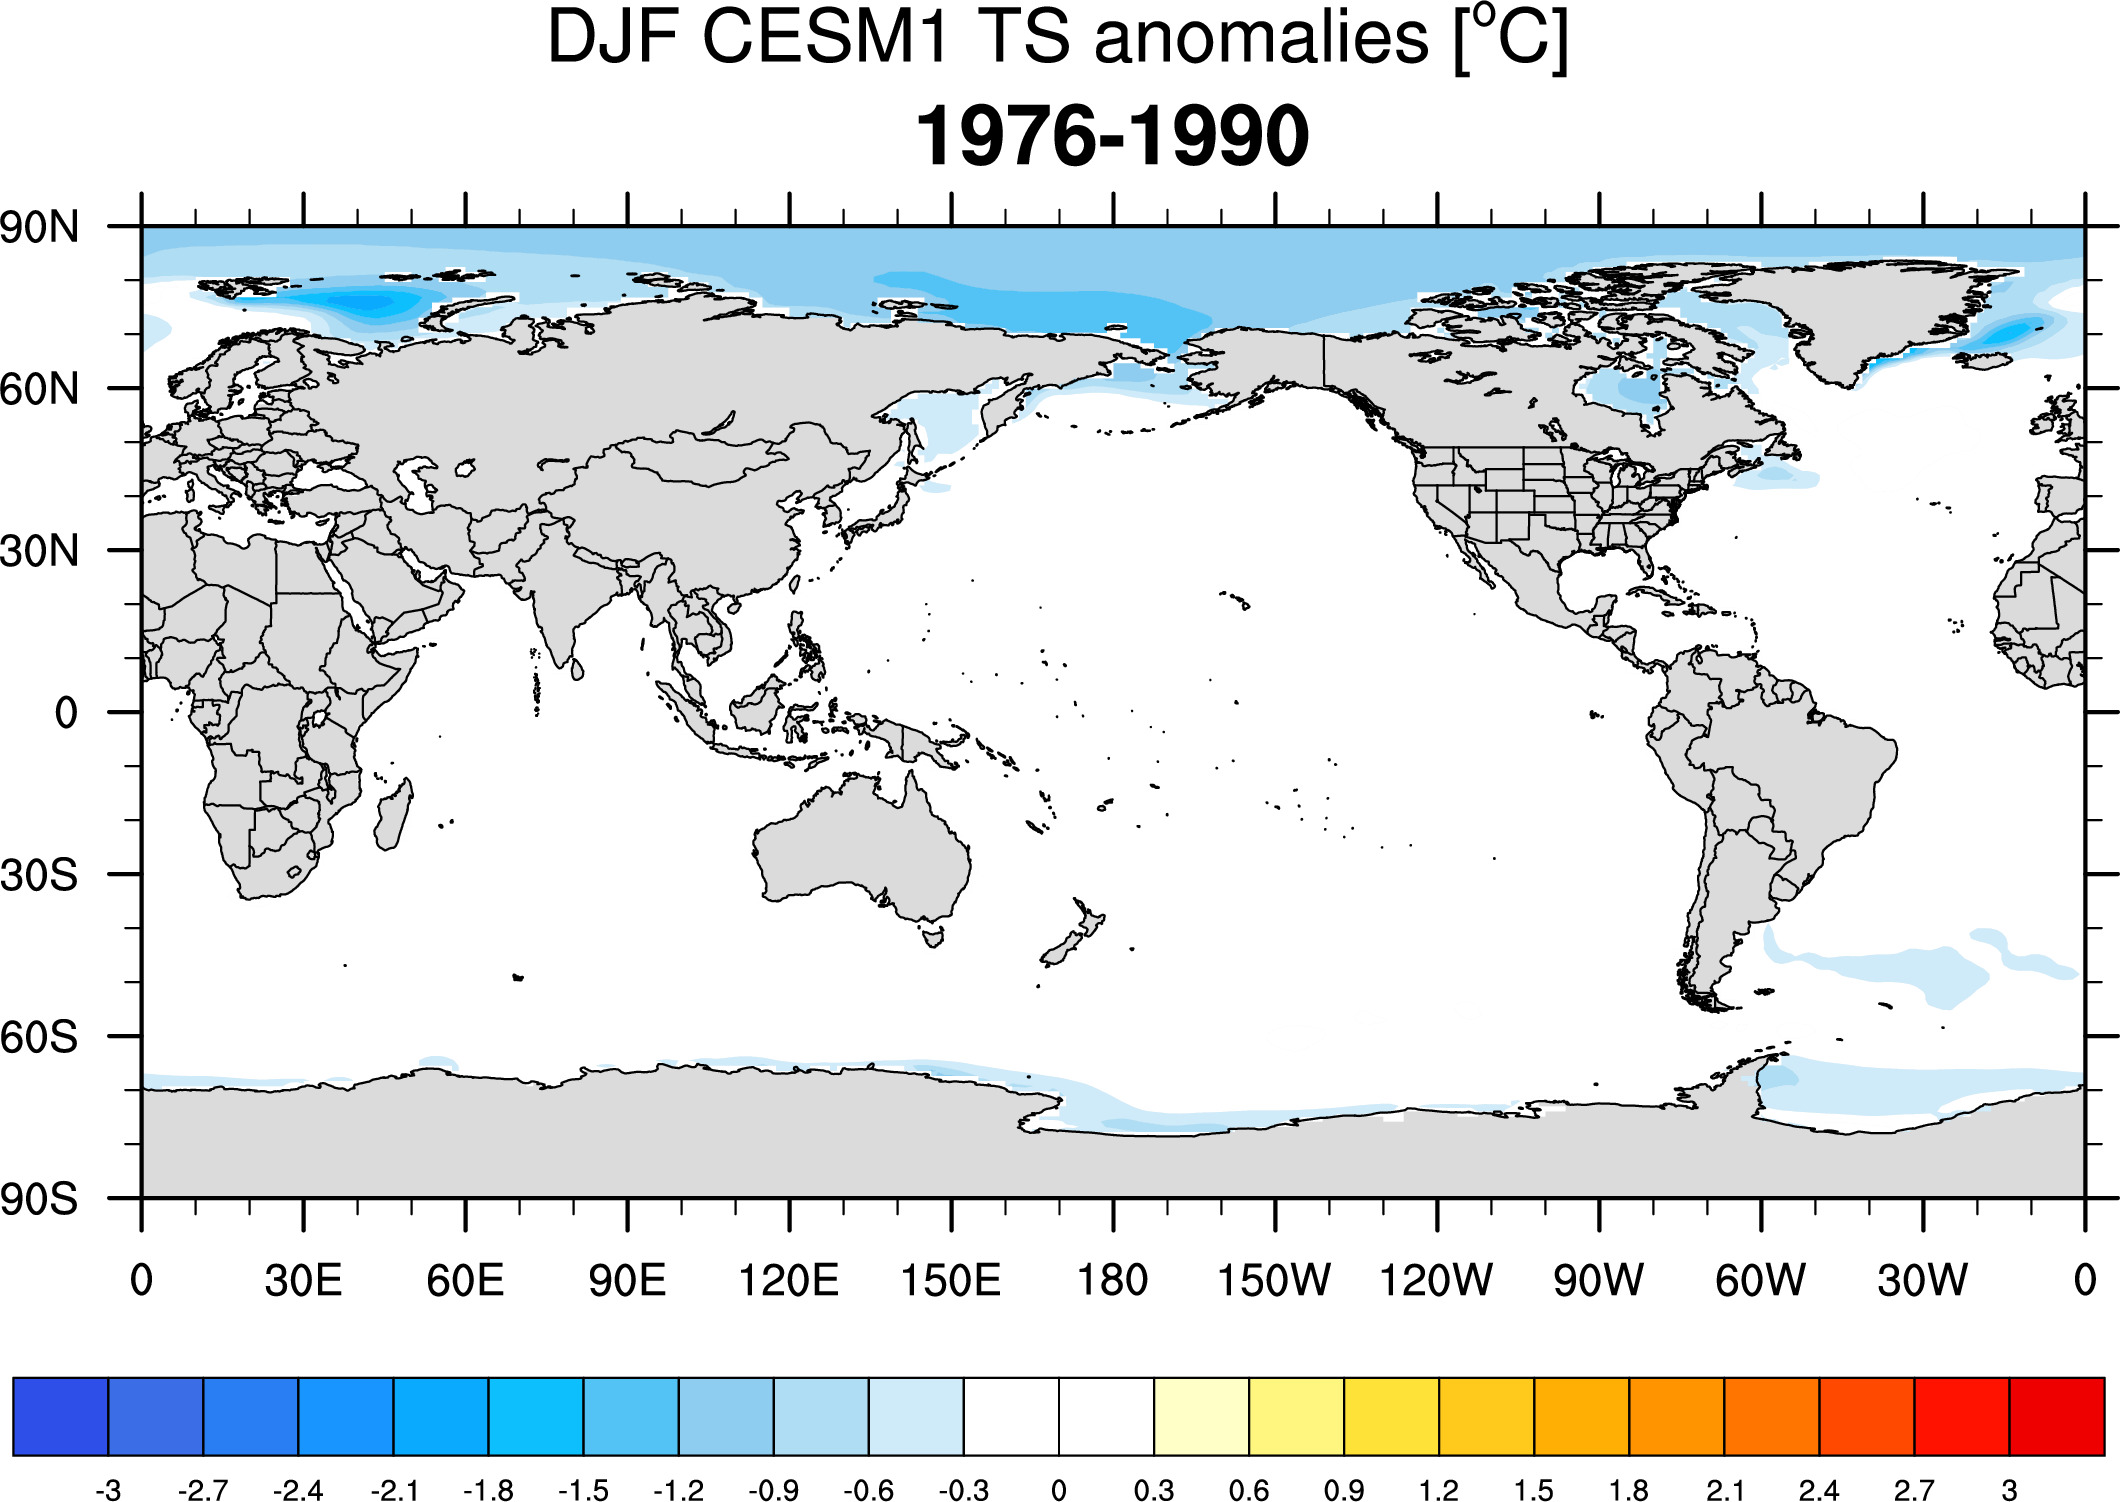
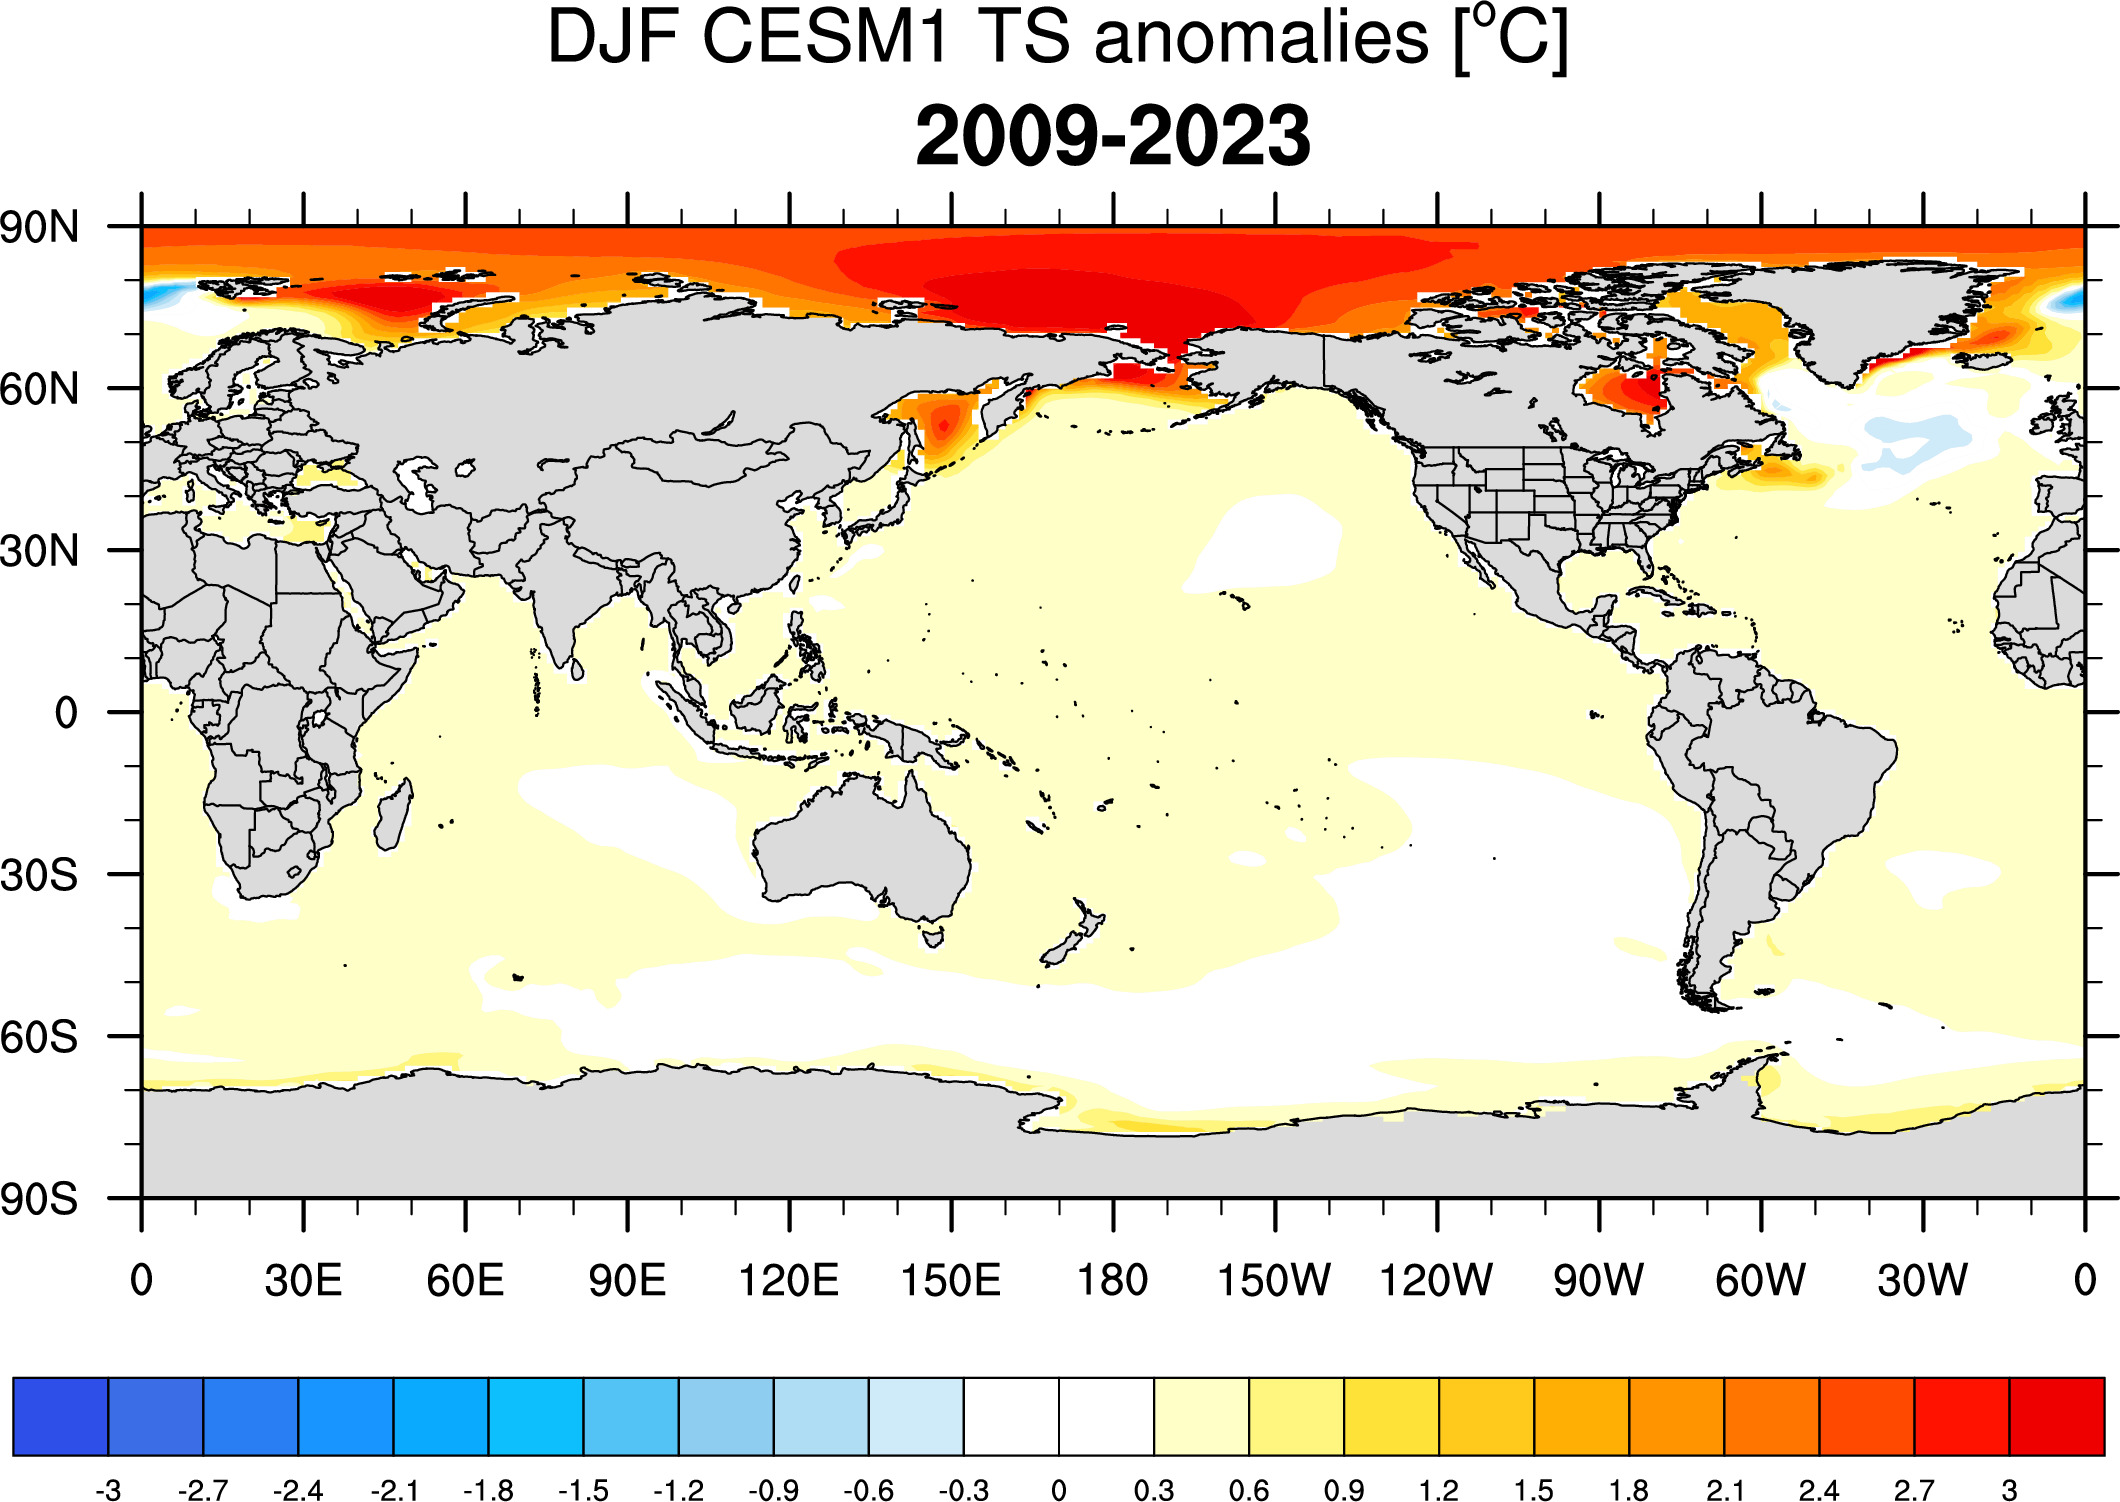
SST Anomaly Maps:
1976-1990: top "strongest" 3 individual runs:
 All:
All: 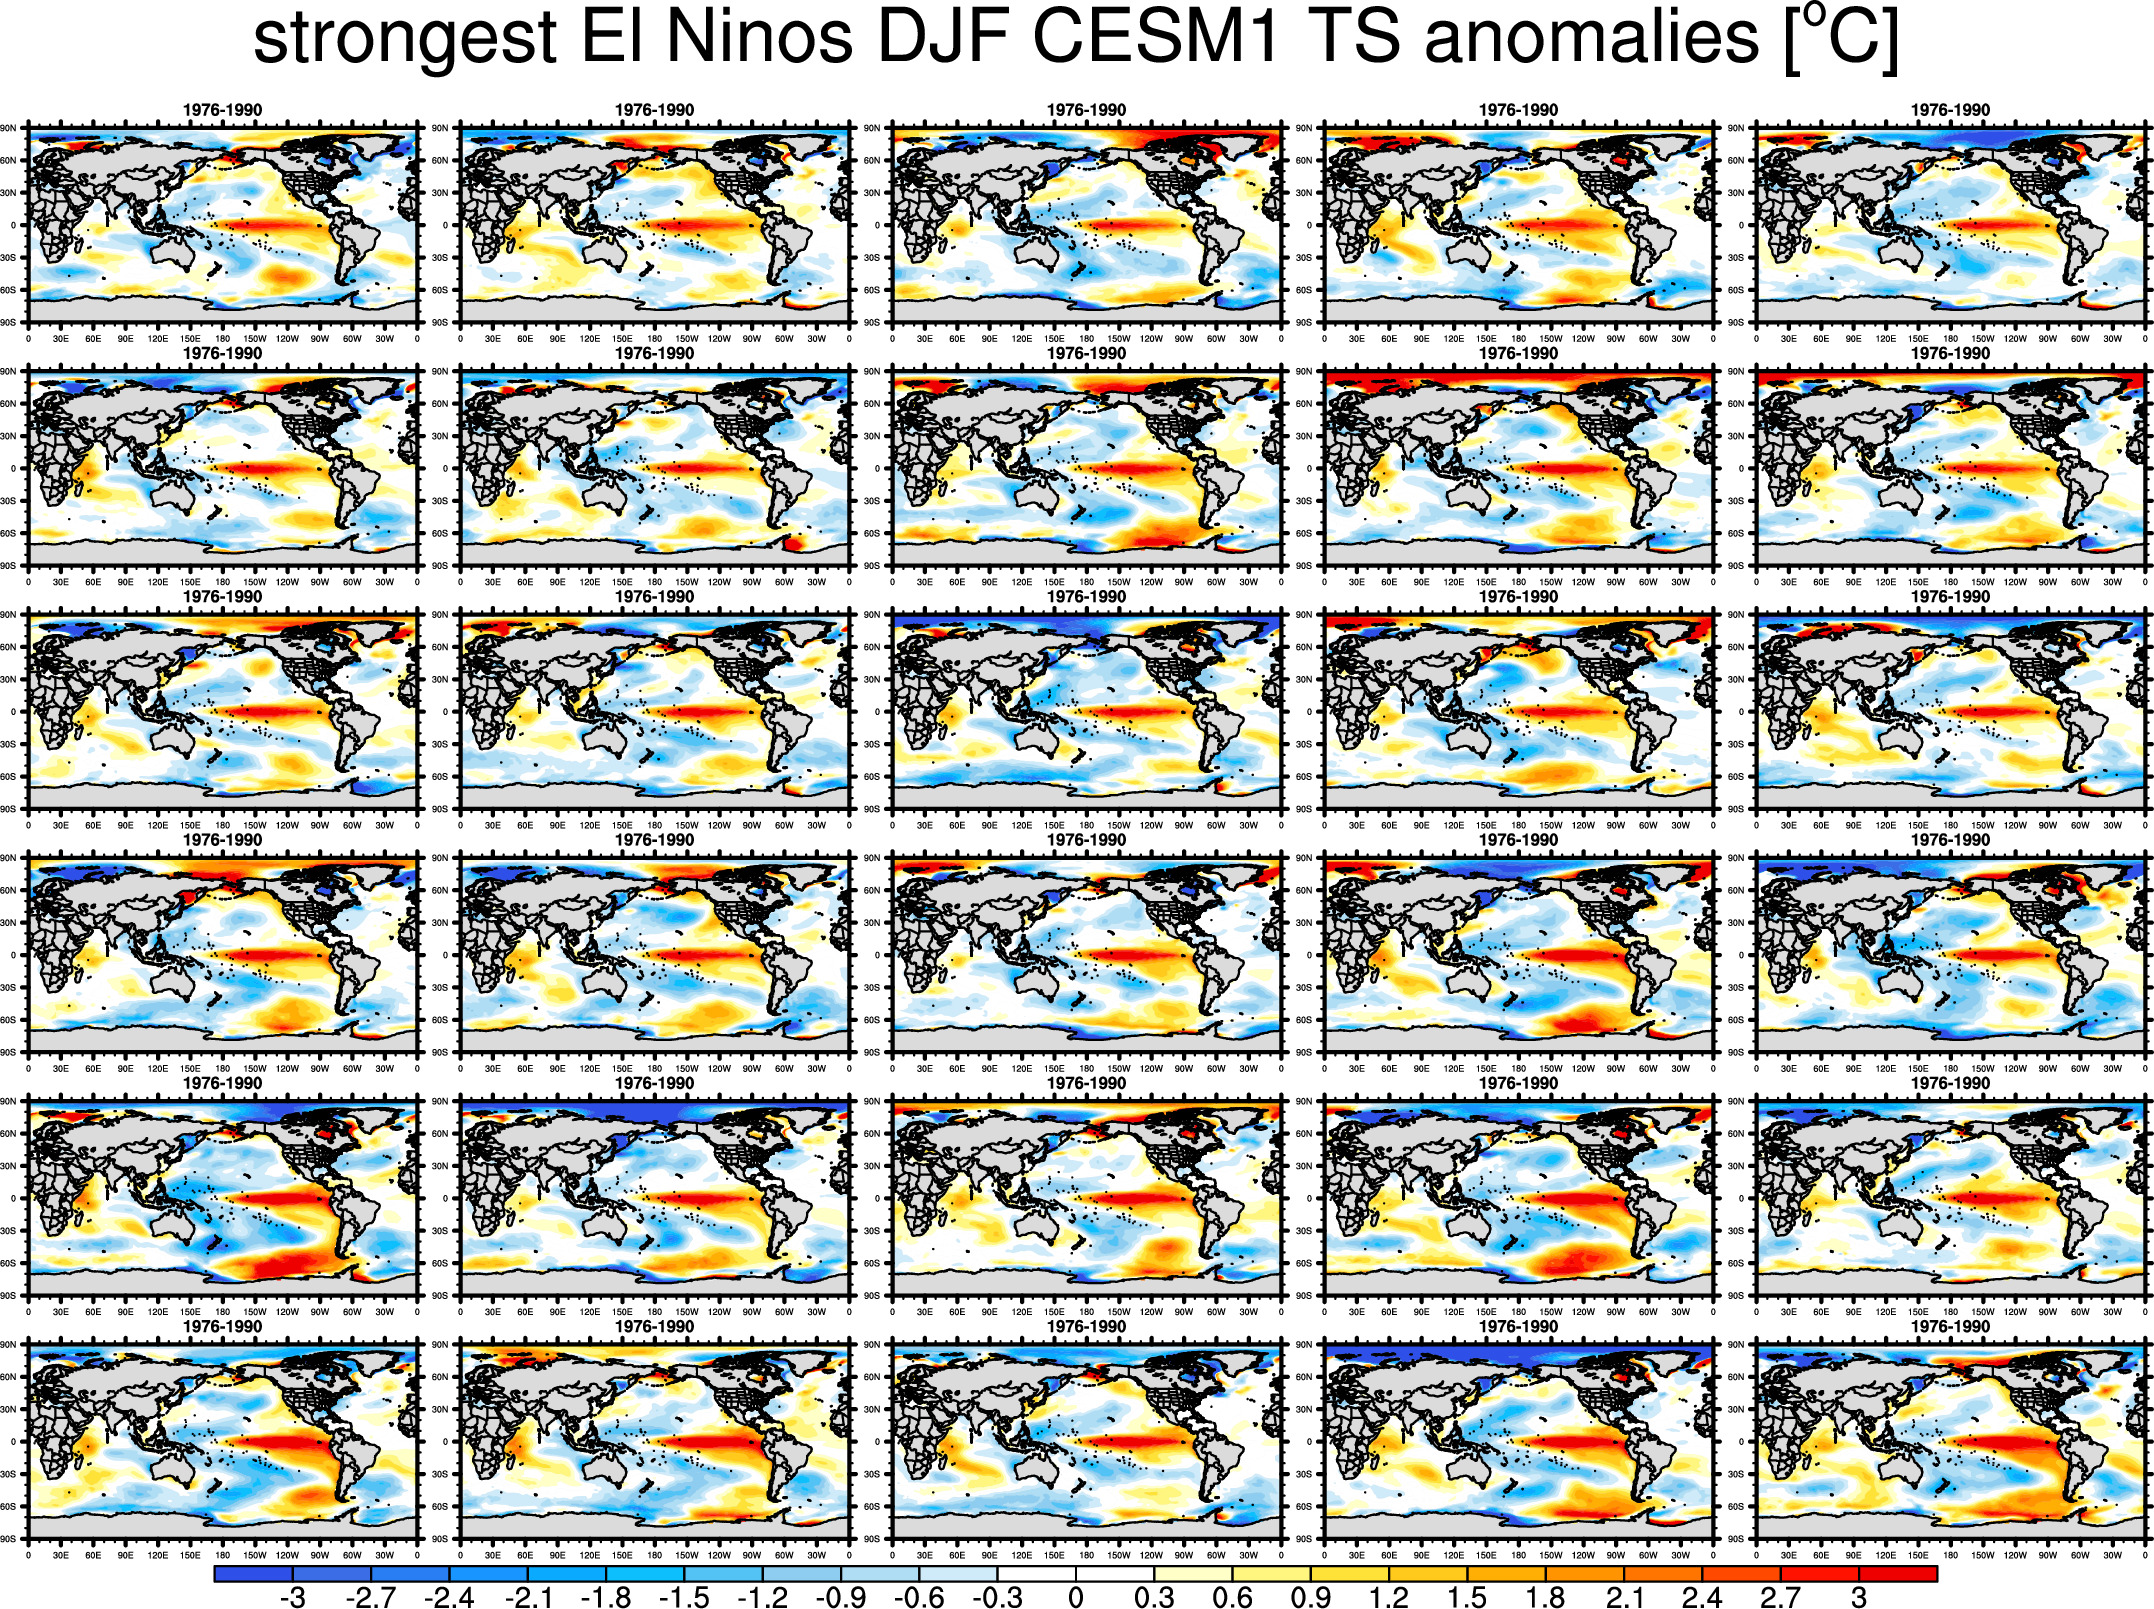
Differences with average
2009-2023: top "strongest" 3 individual runs:
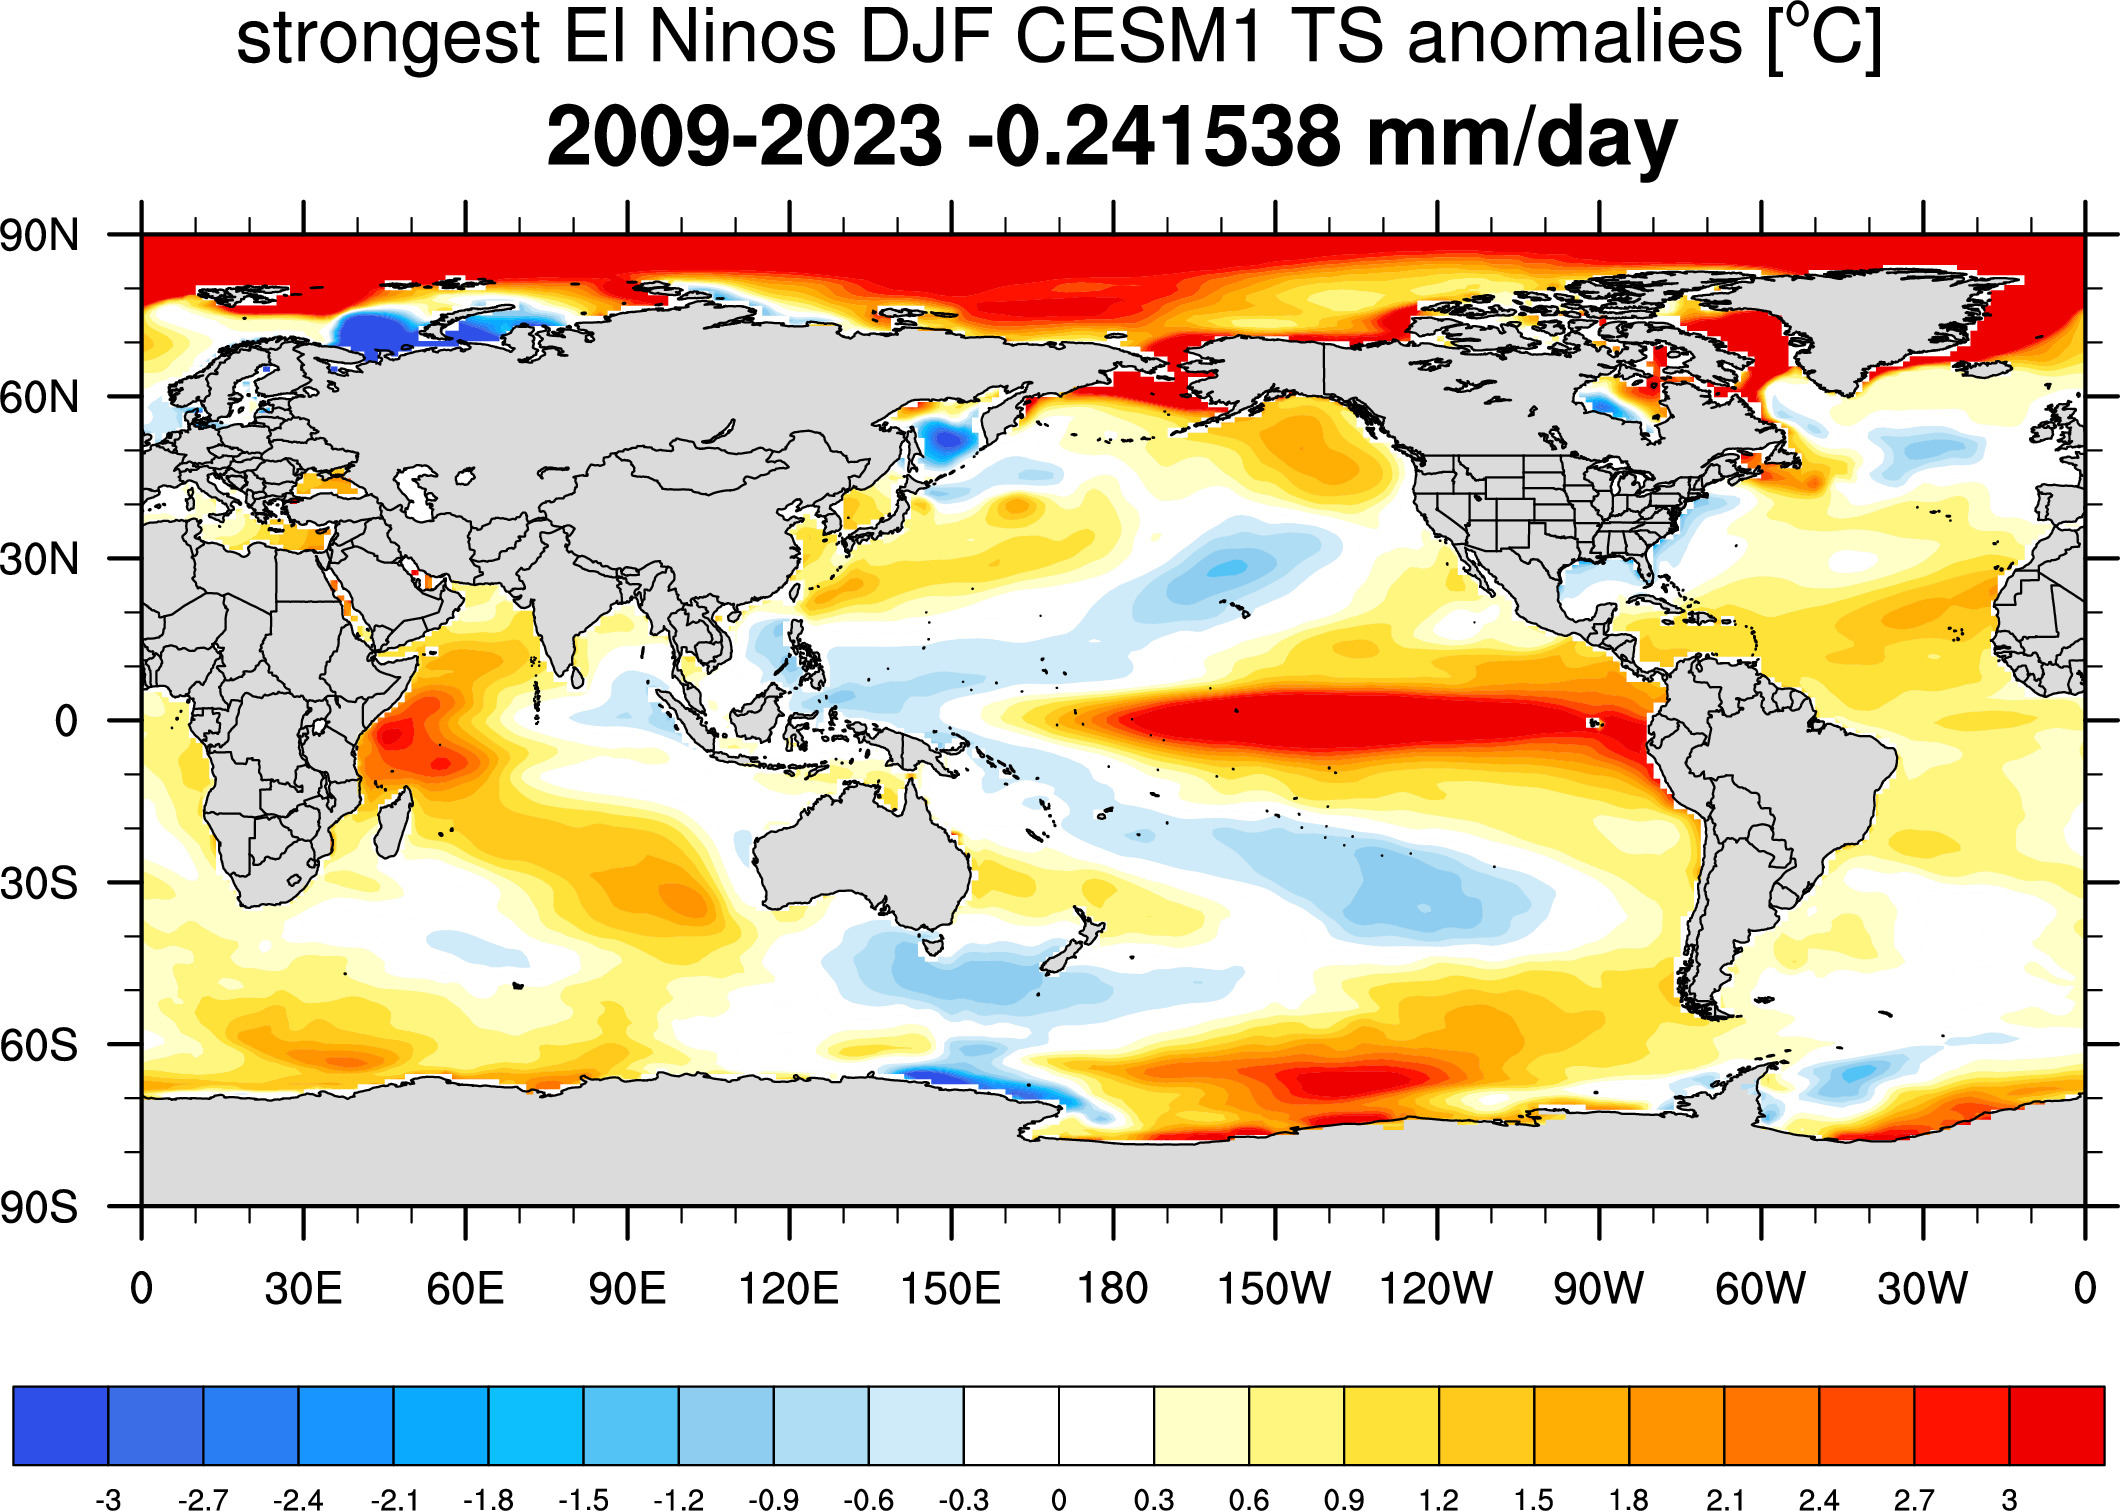
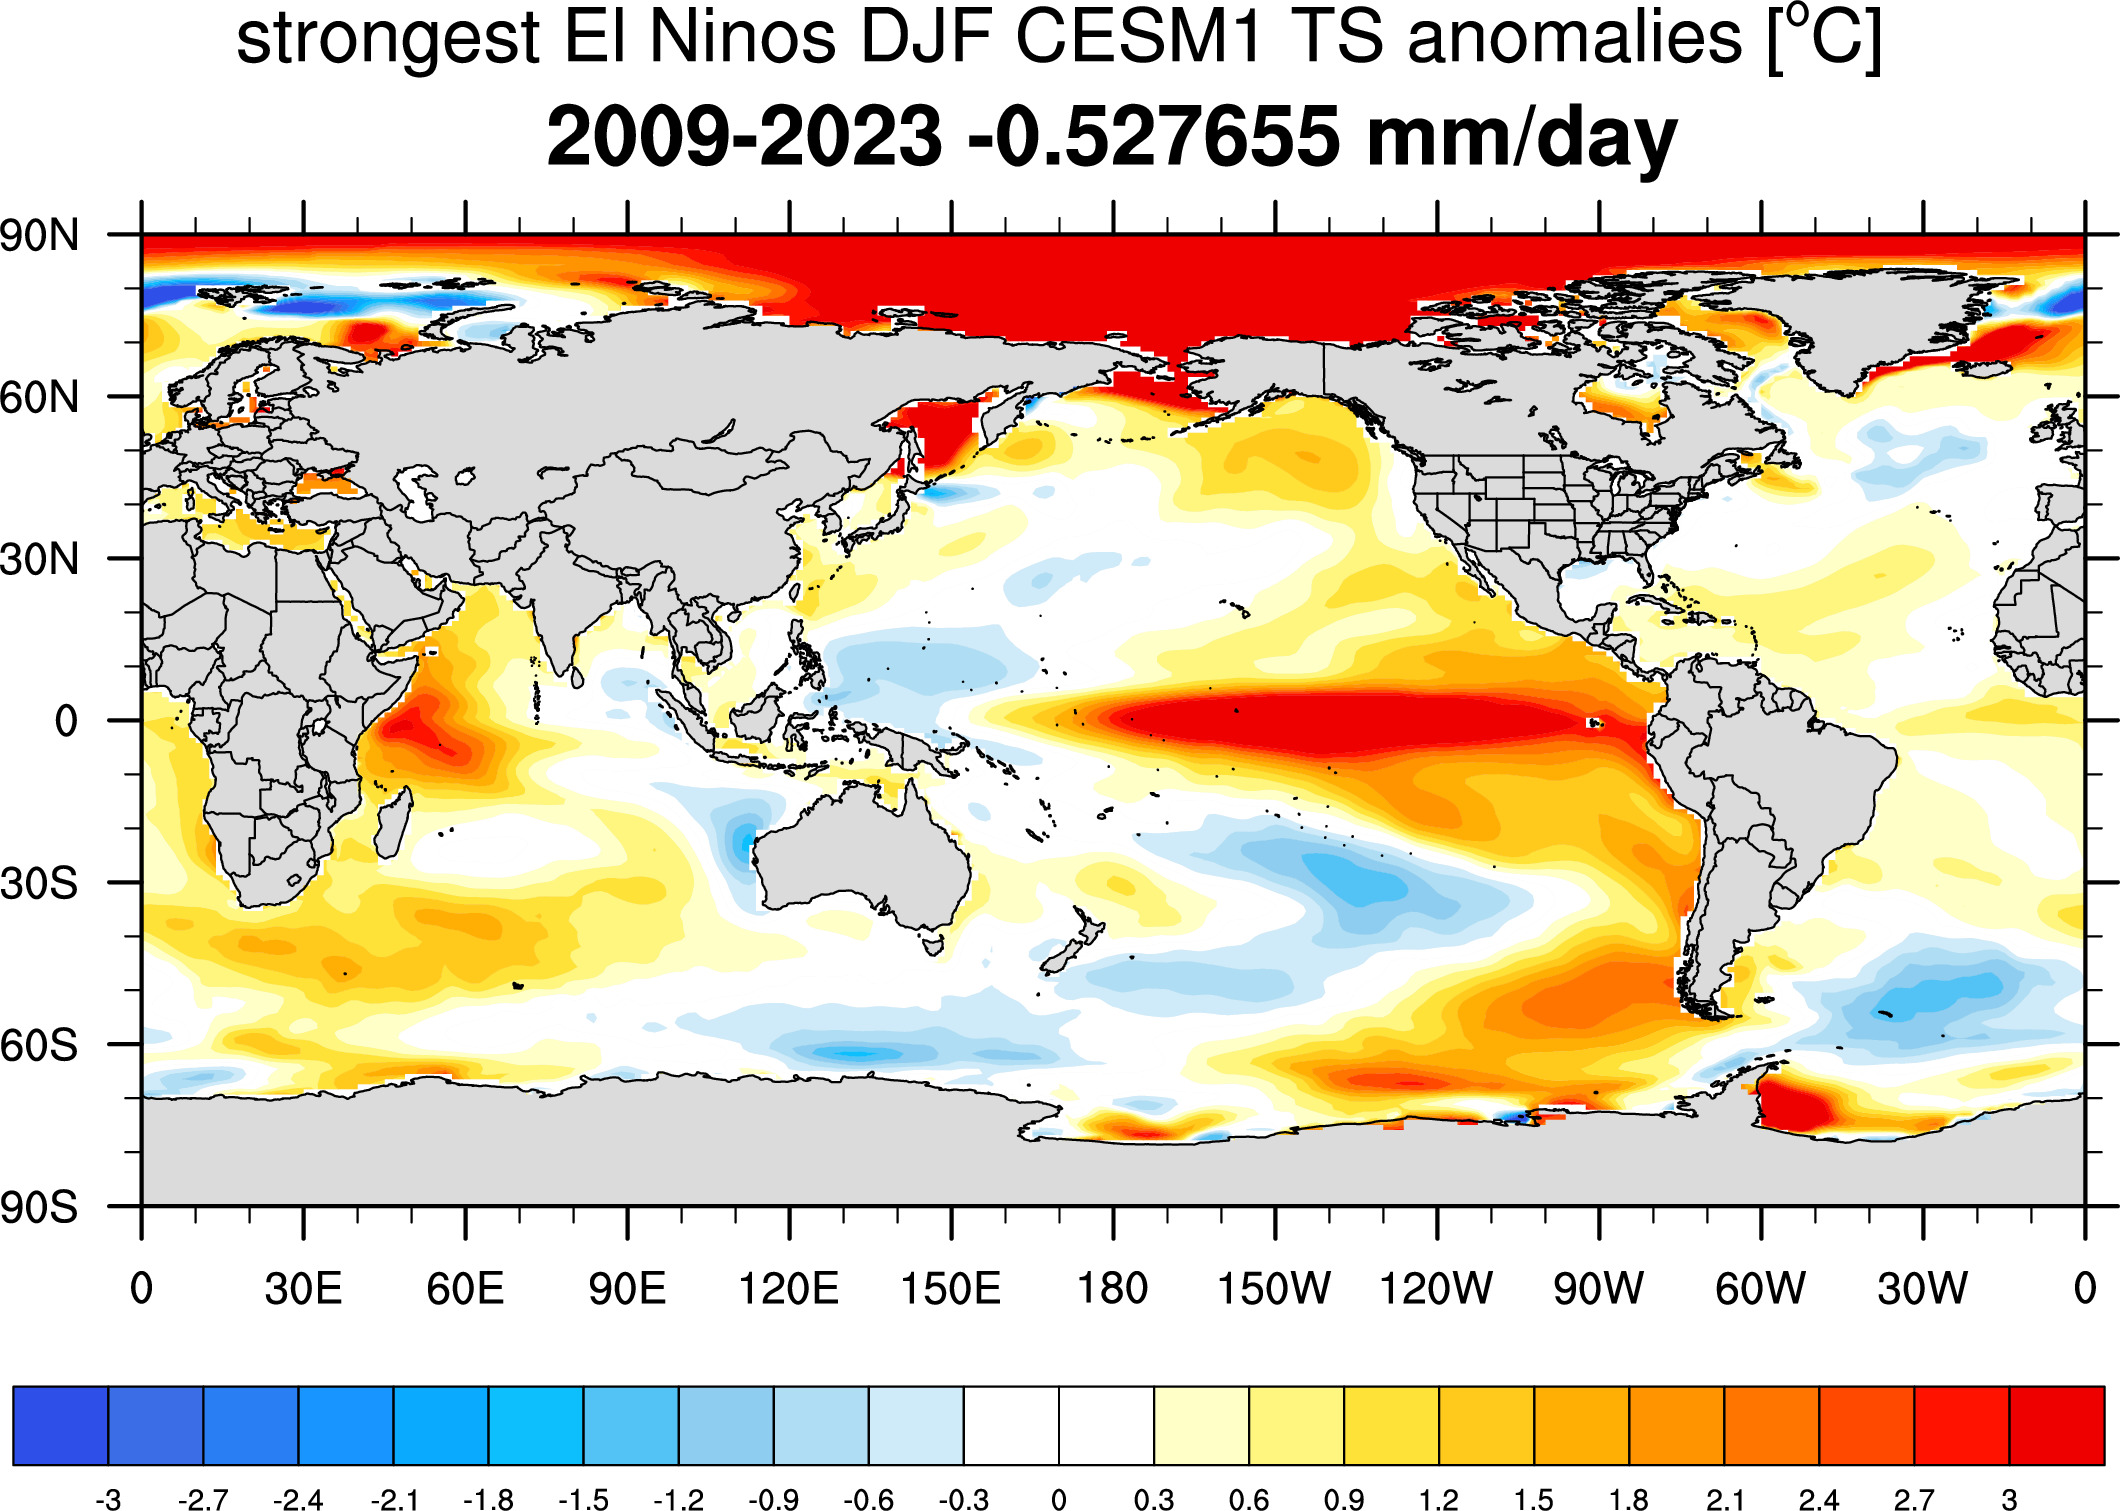 All:
All: 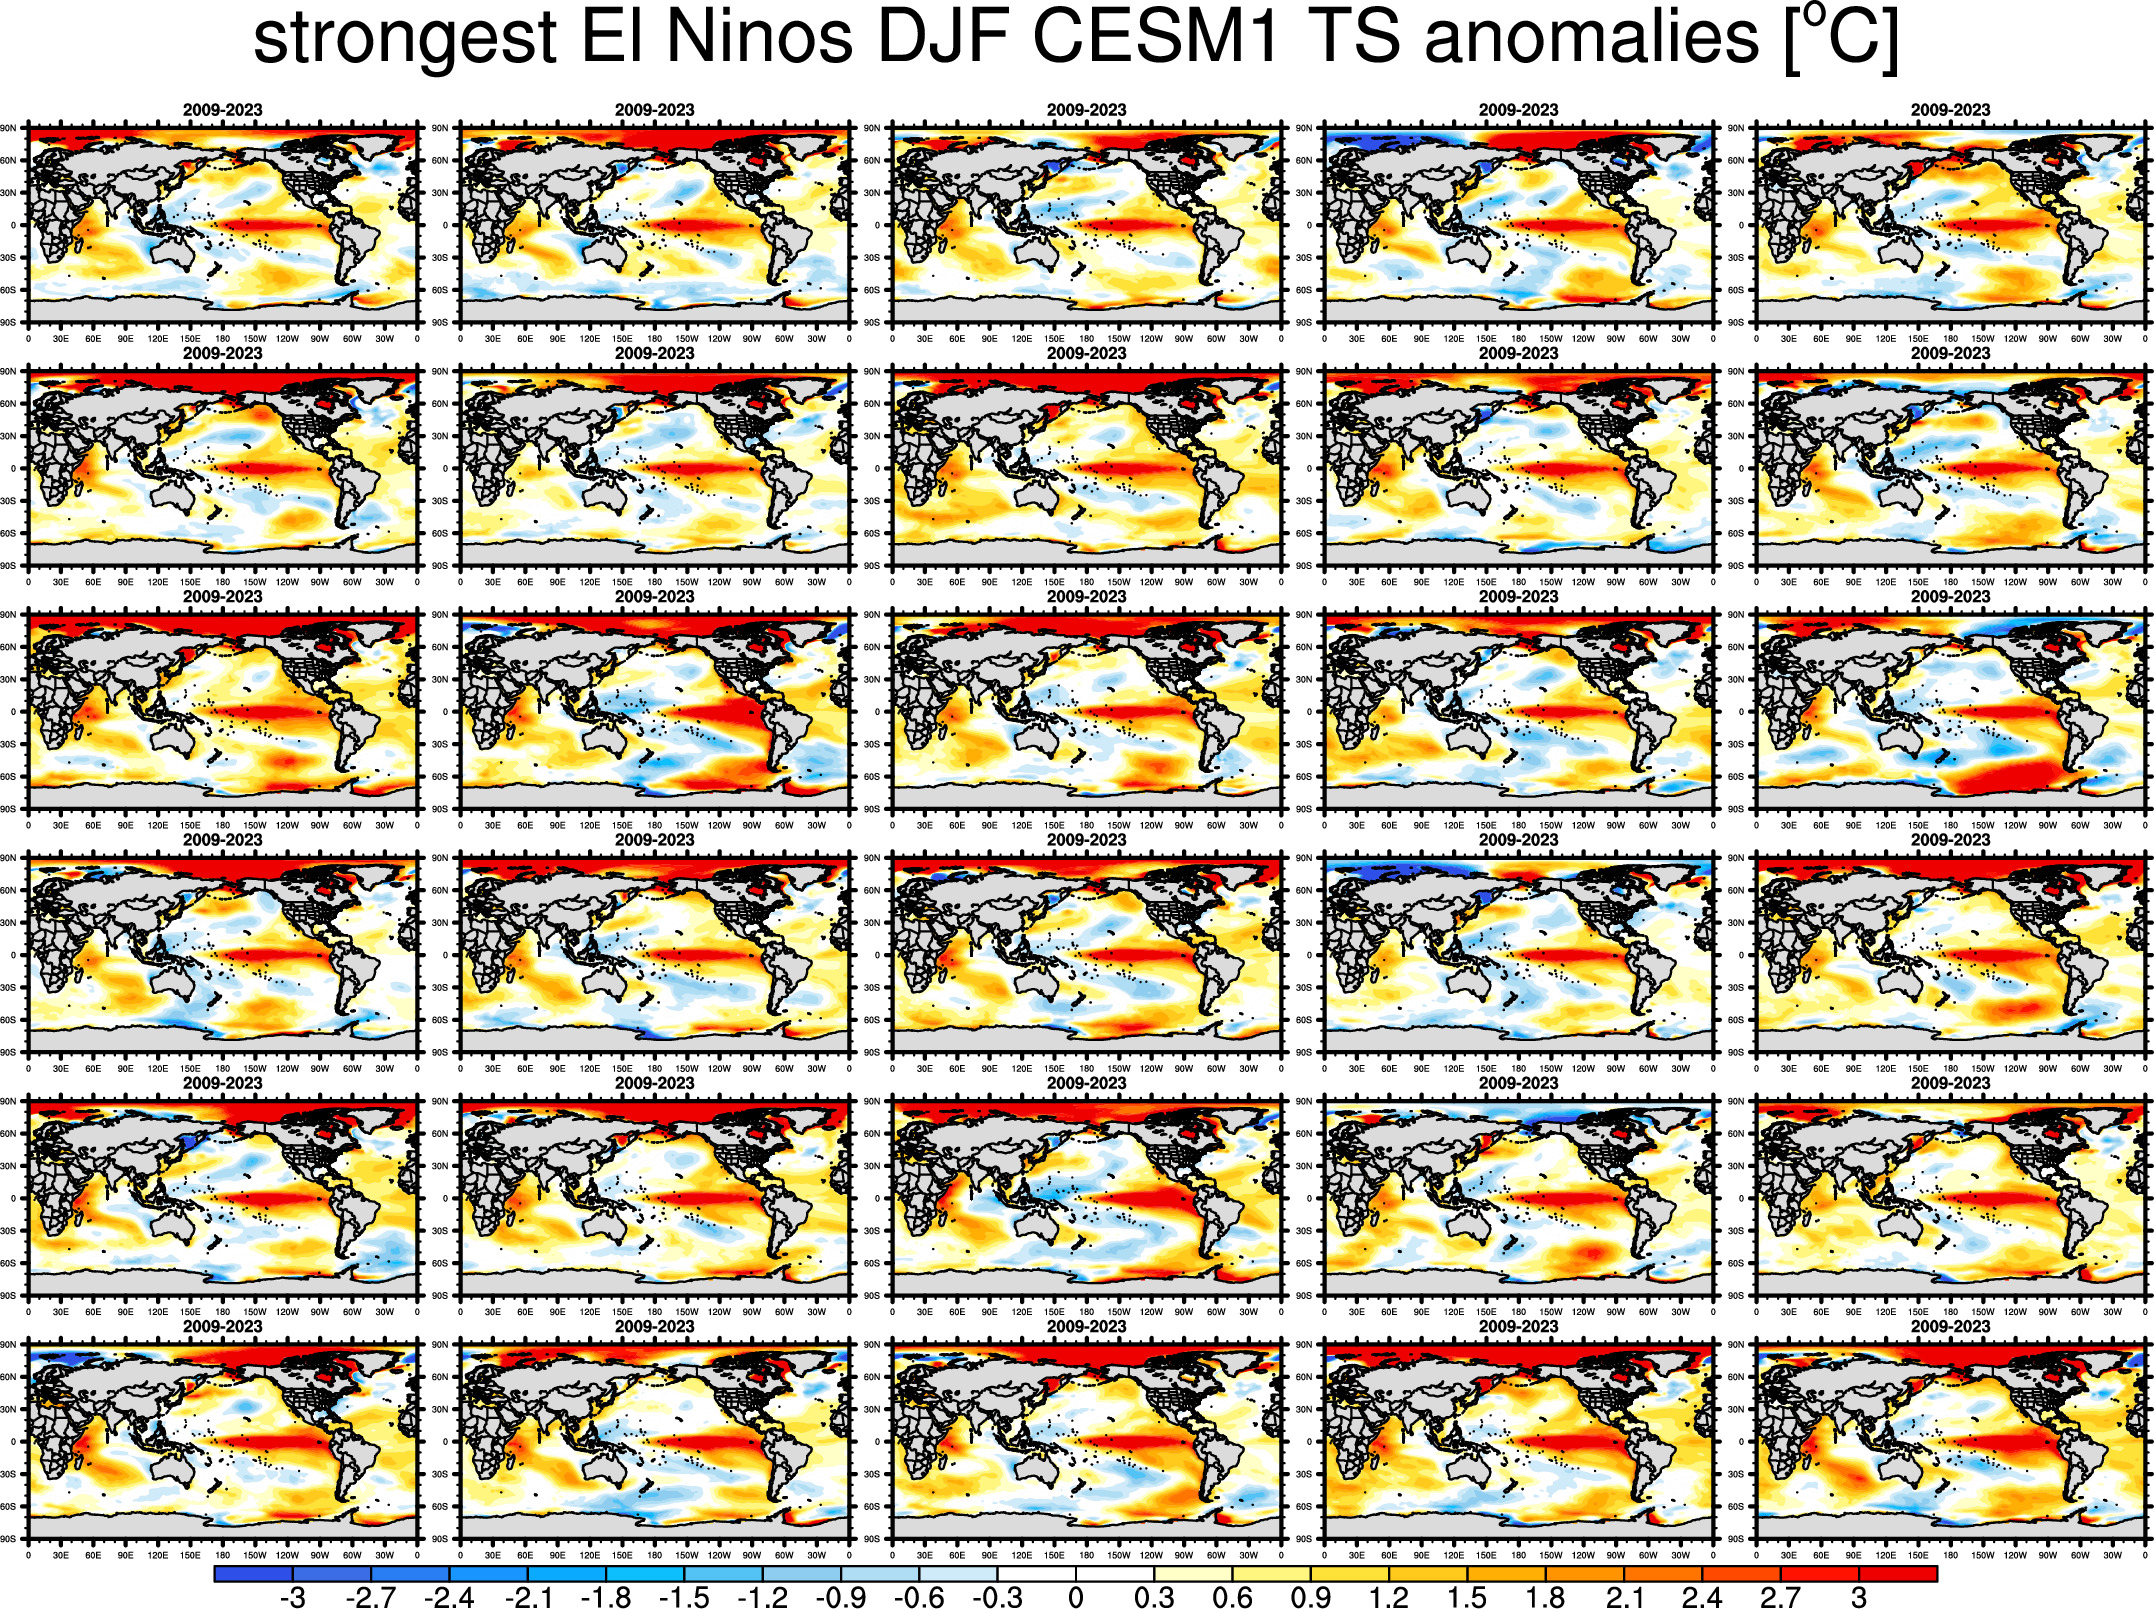
Differences with average
--------------------------------------------------------
SST Anomaly Maps
All years:
Strongest El Ninos:
Precipitation Anomaly Maps
All years:
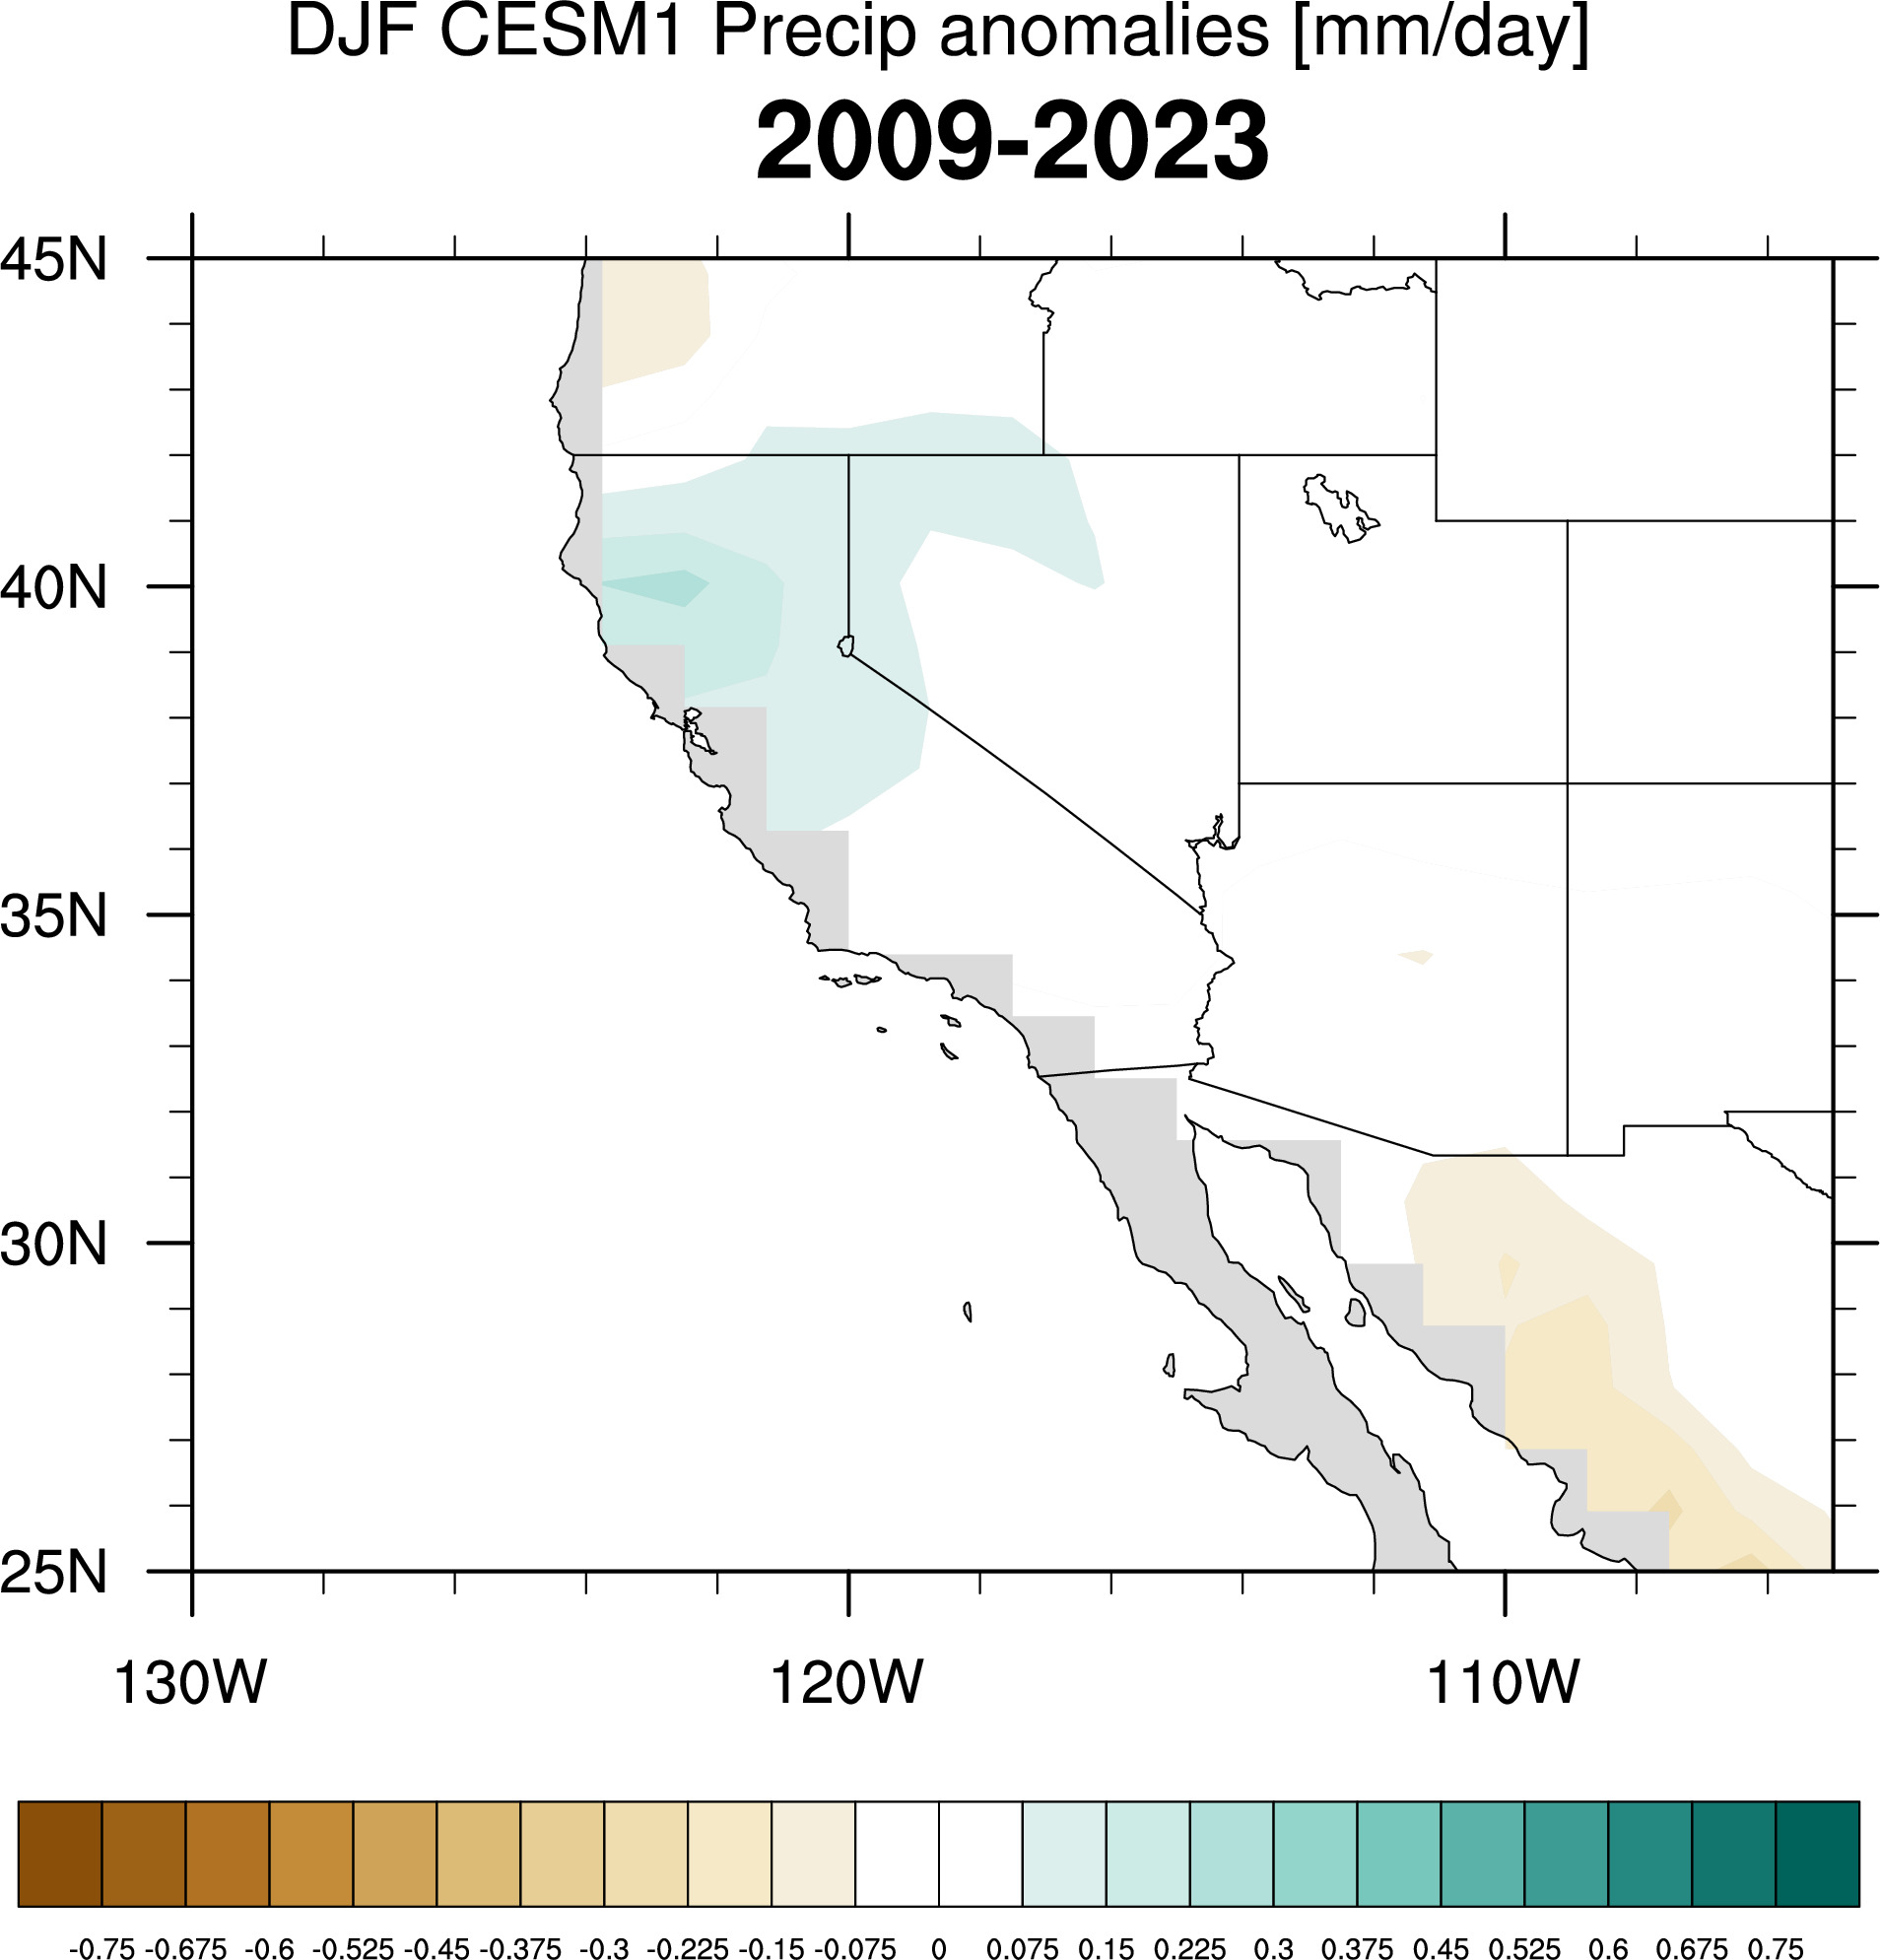
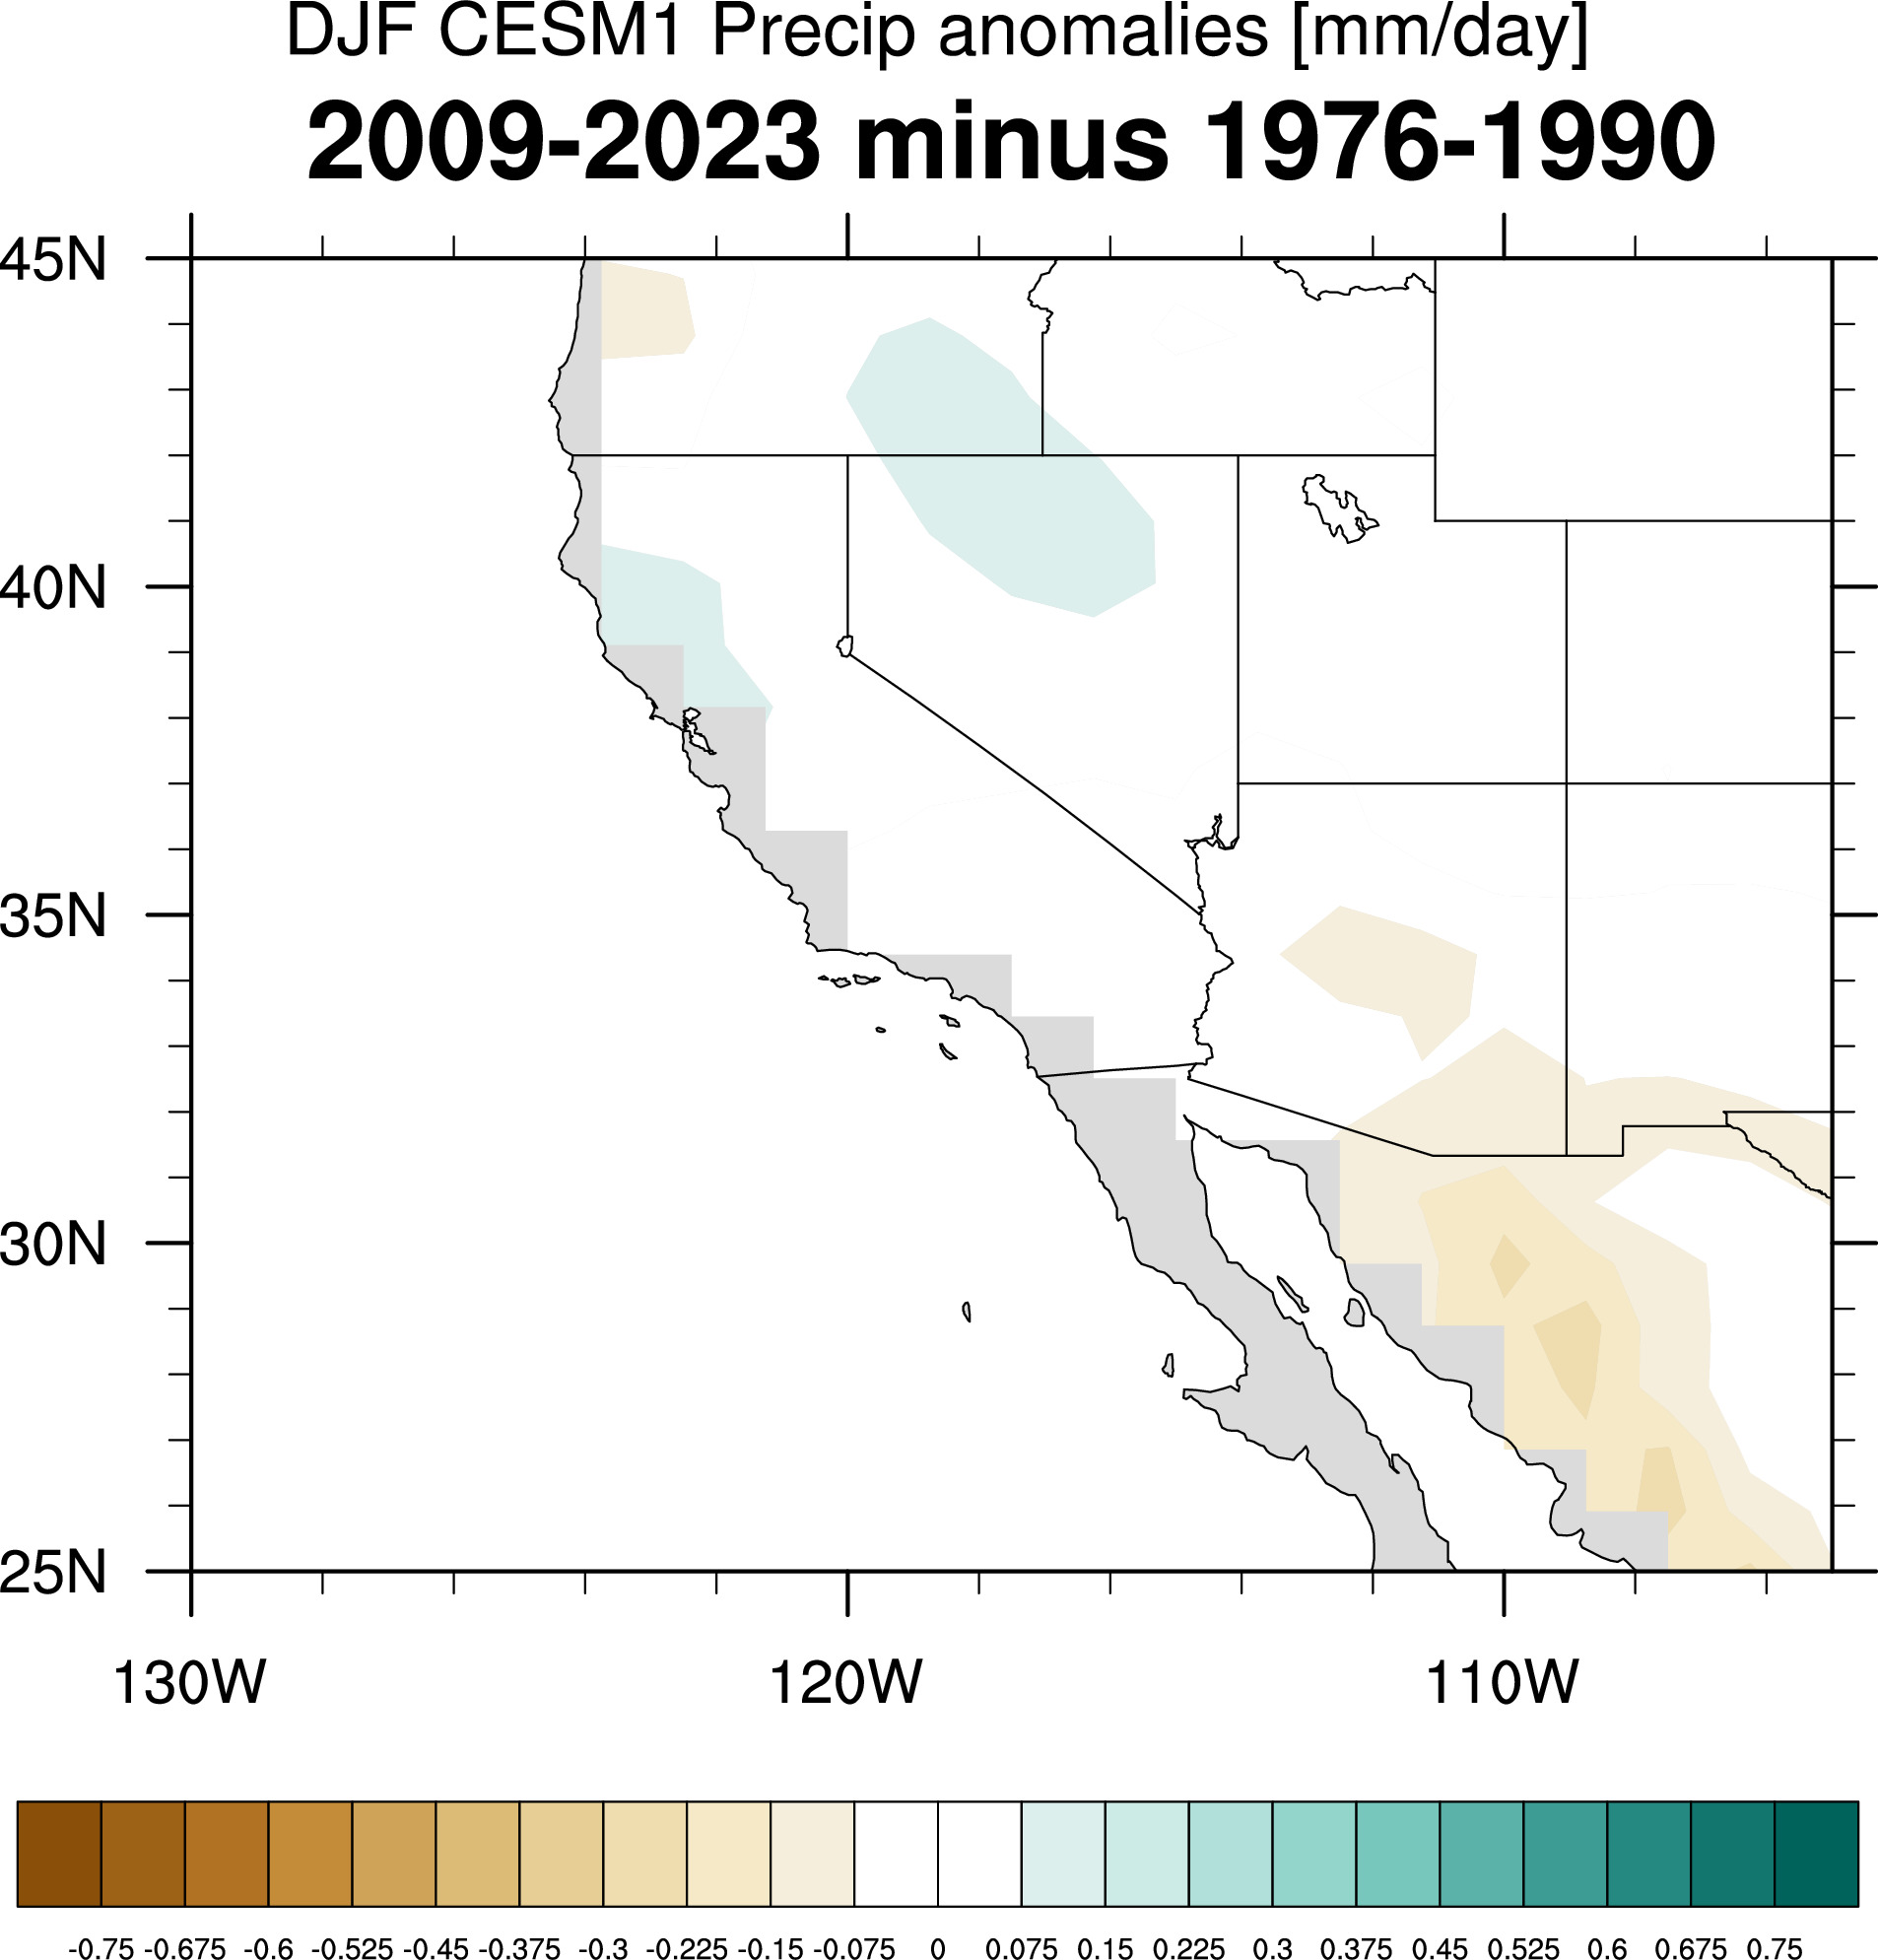
Strongest El Ninos:
Z200 Anomaly Maps
All years:
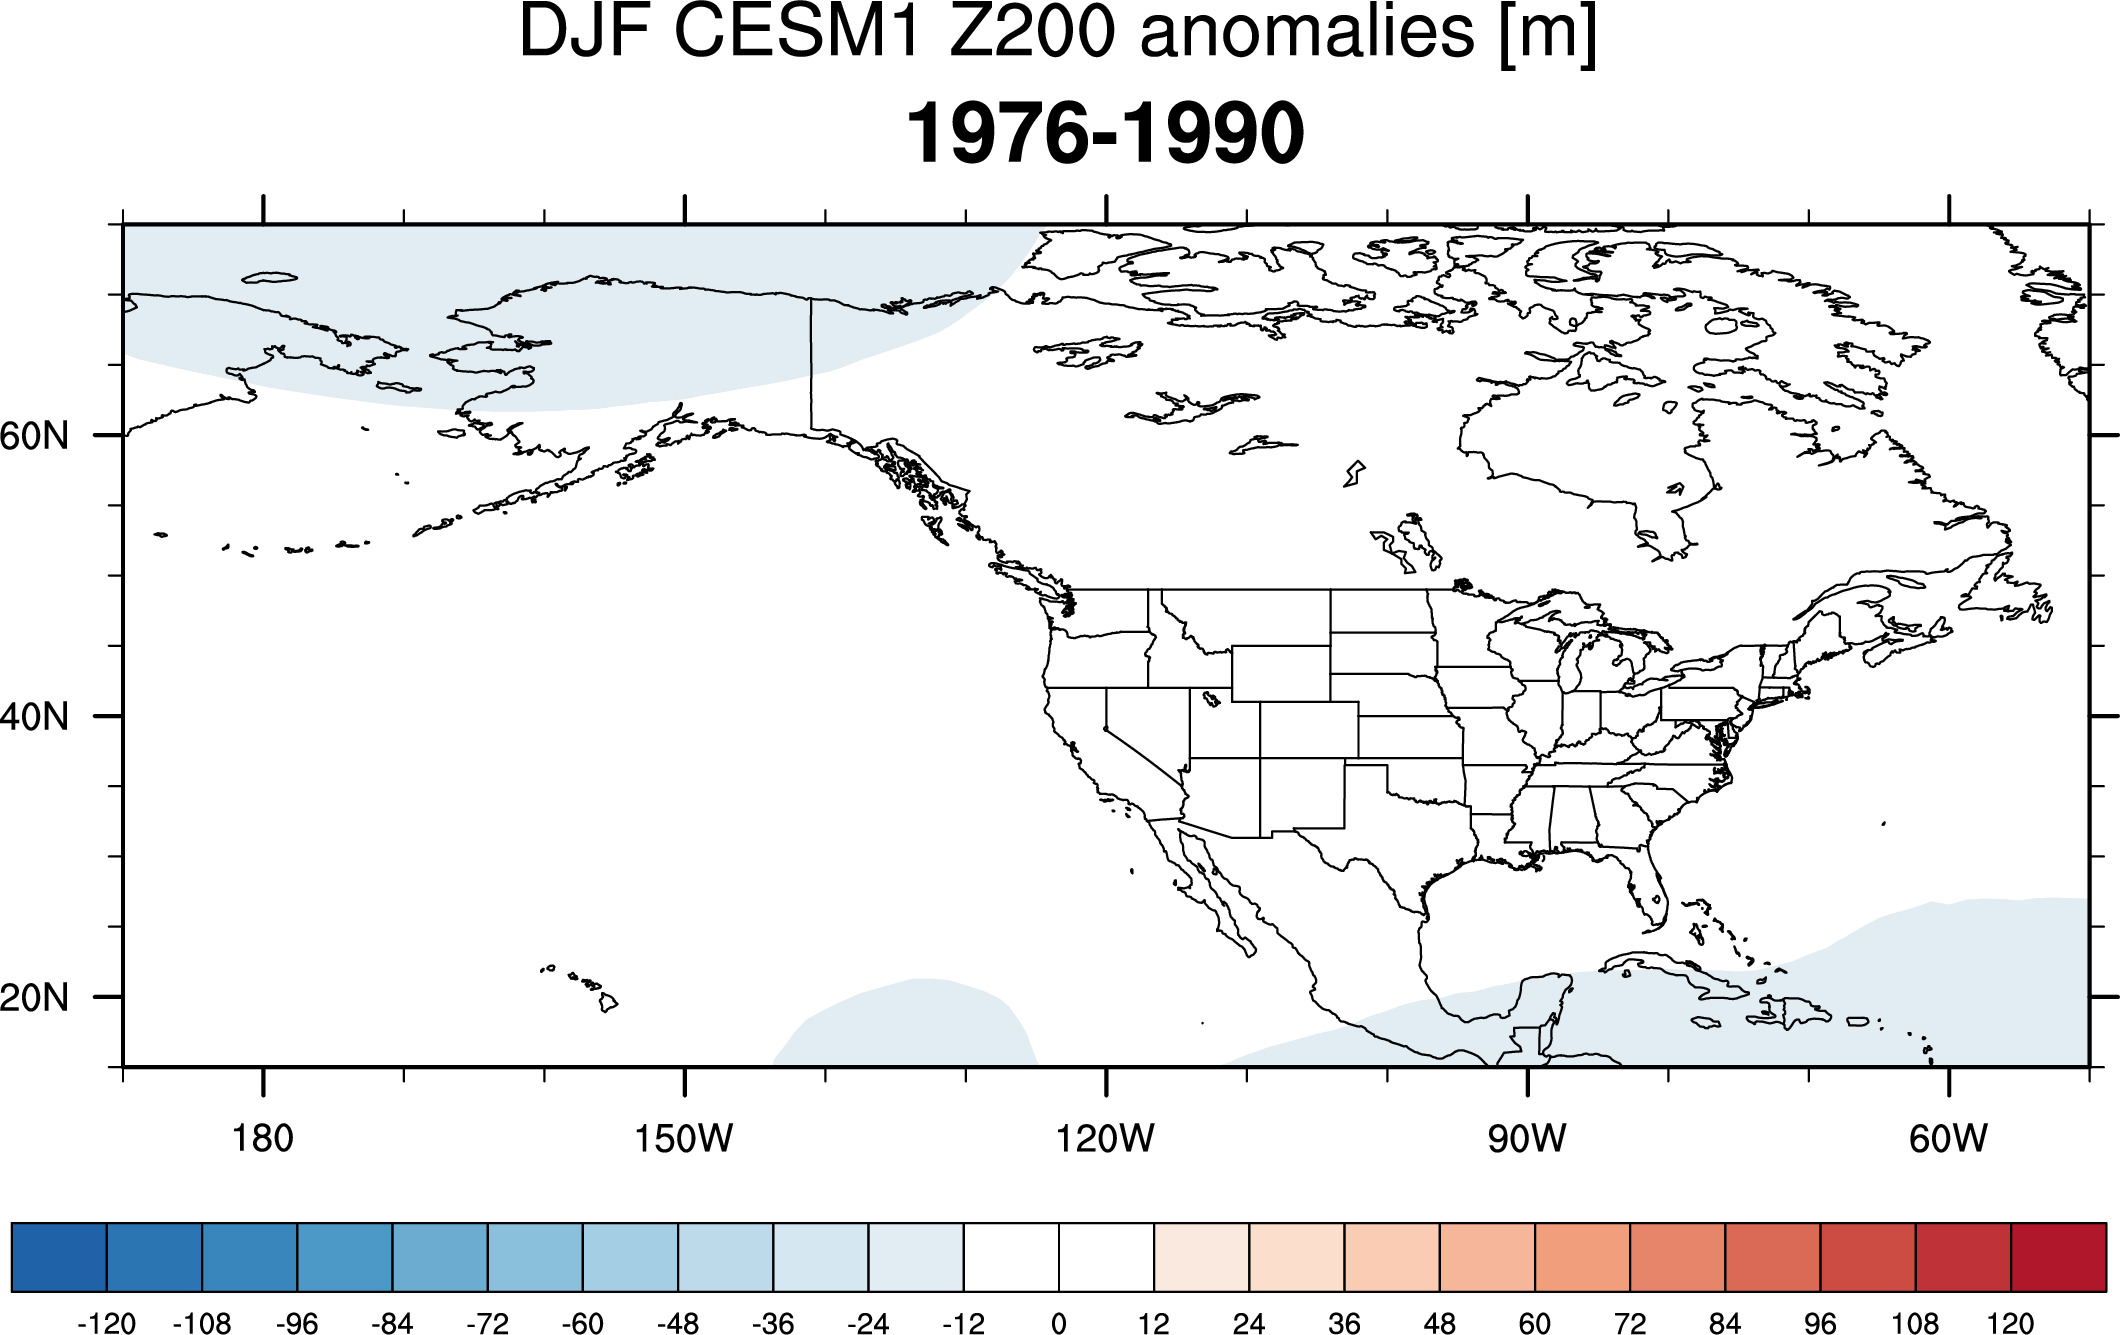
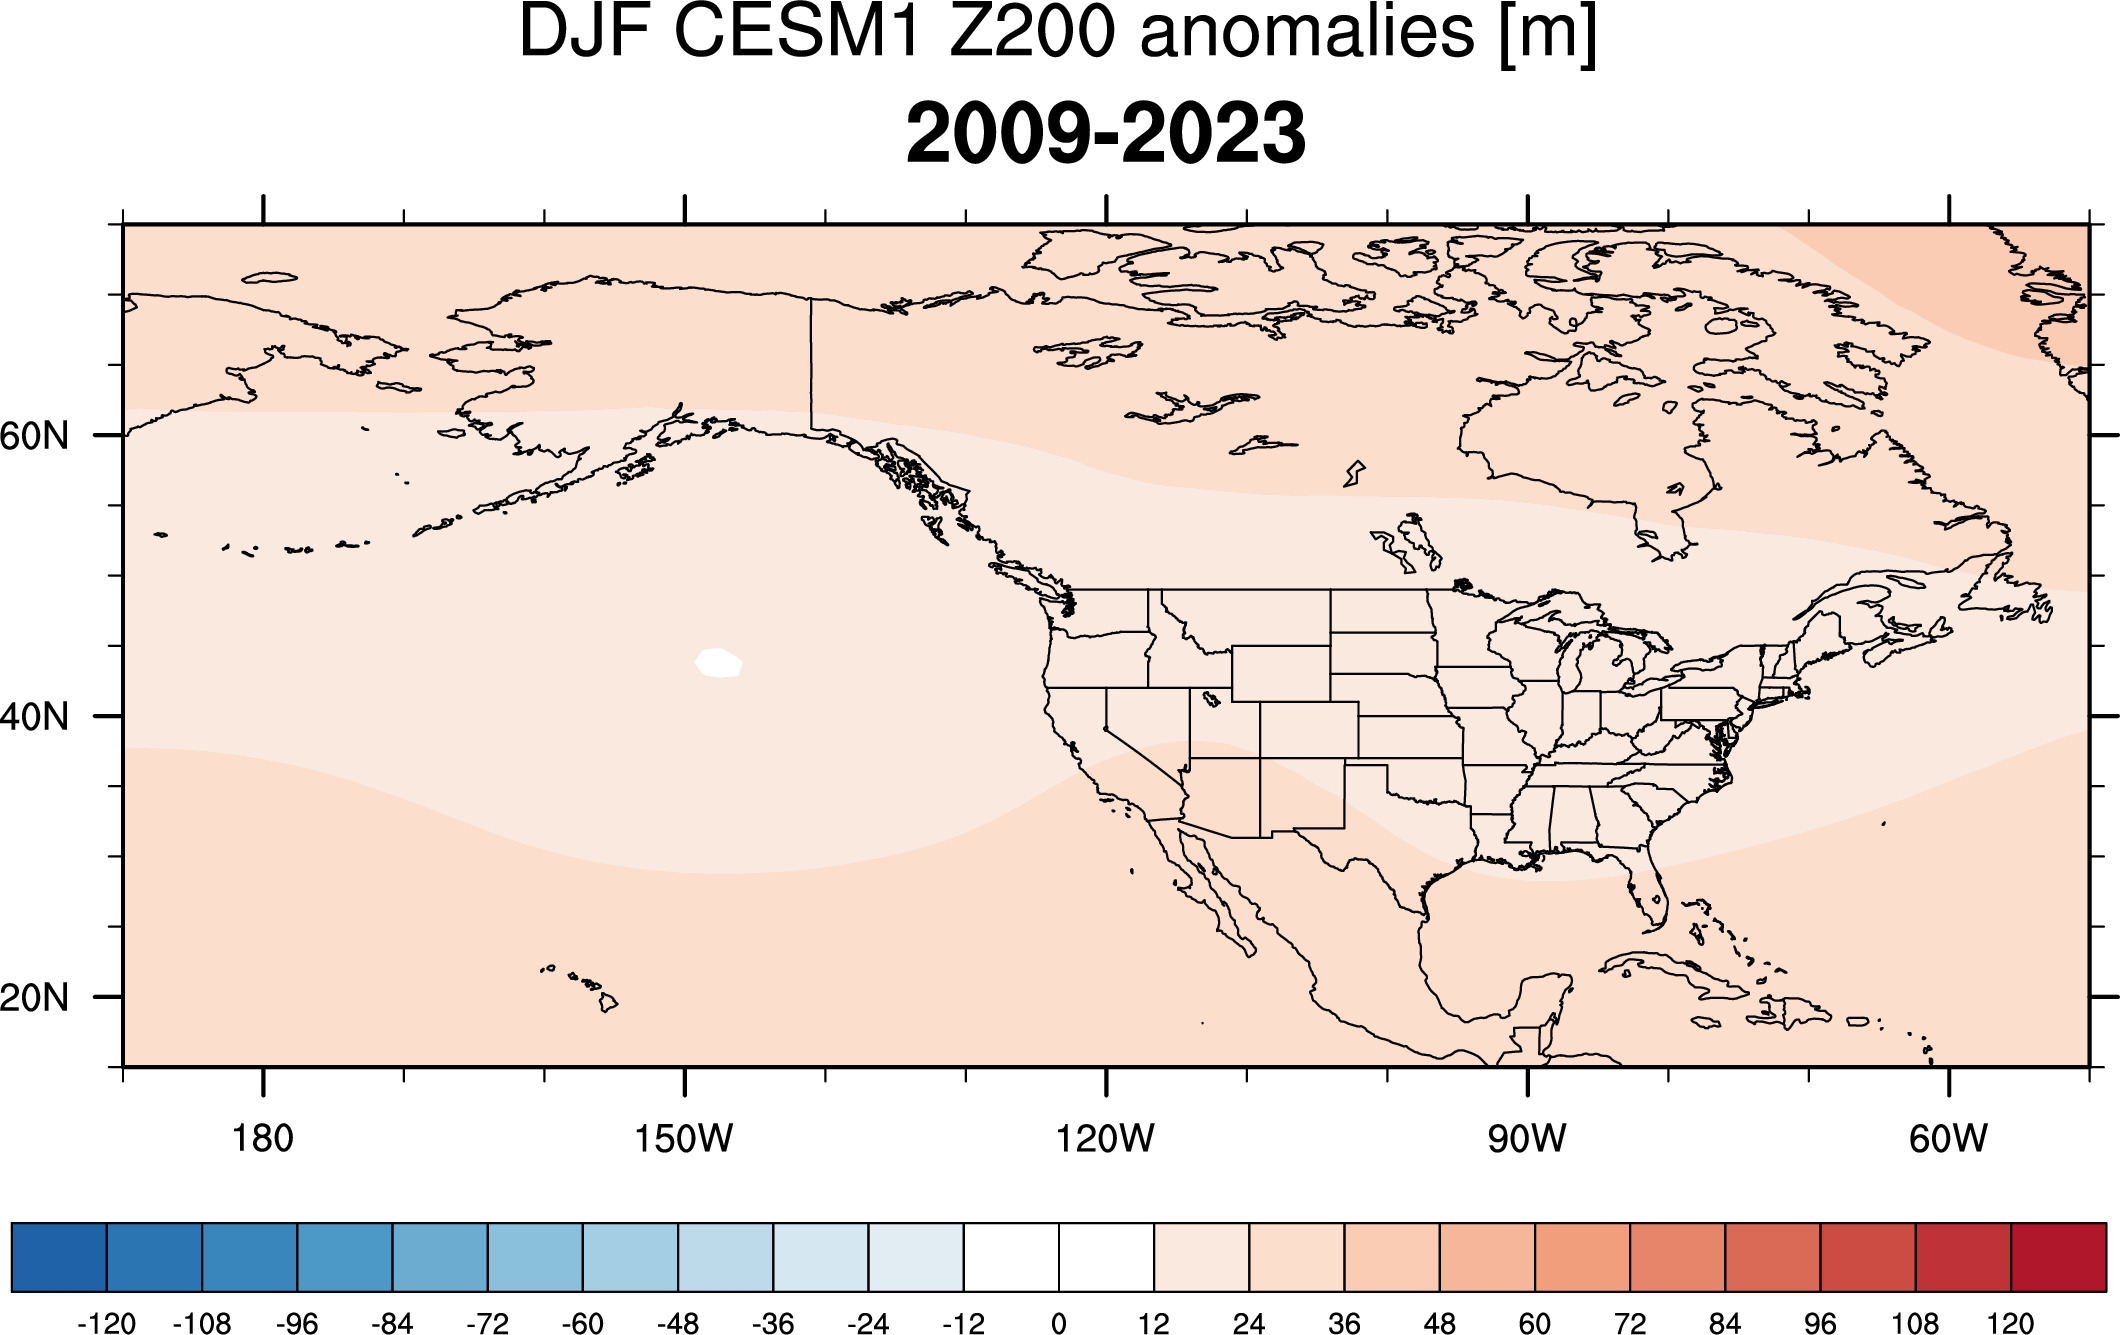
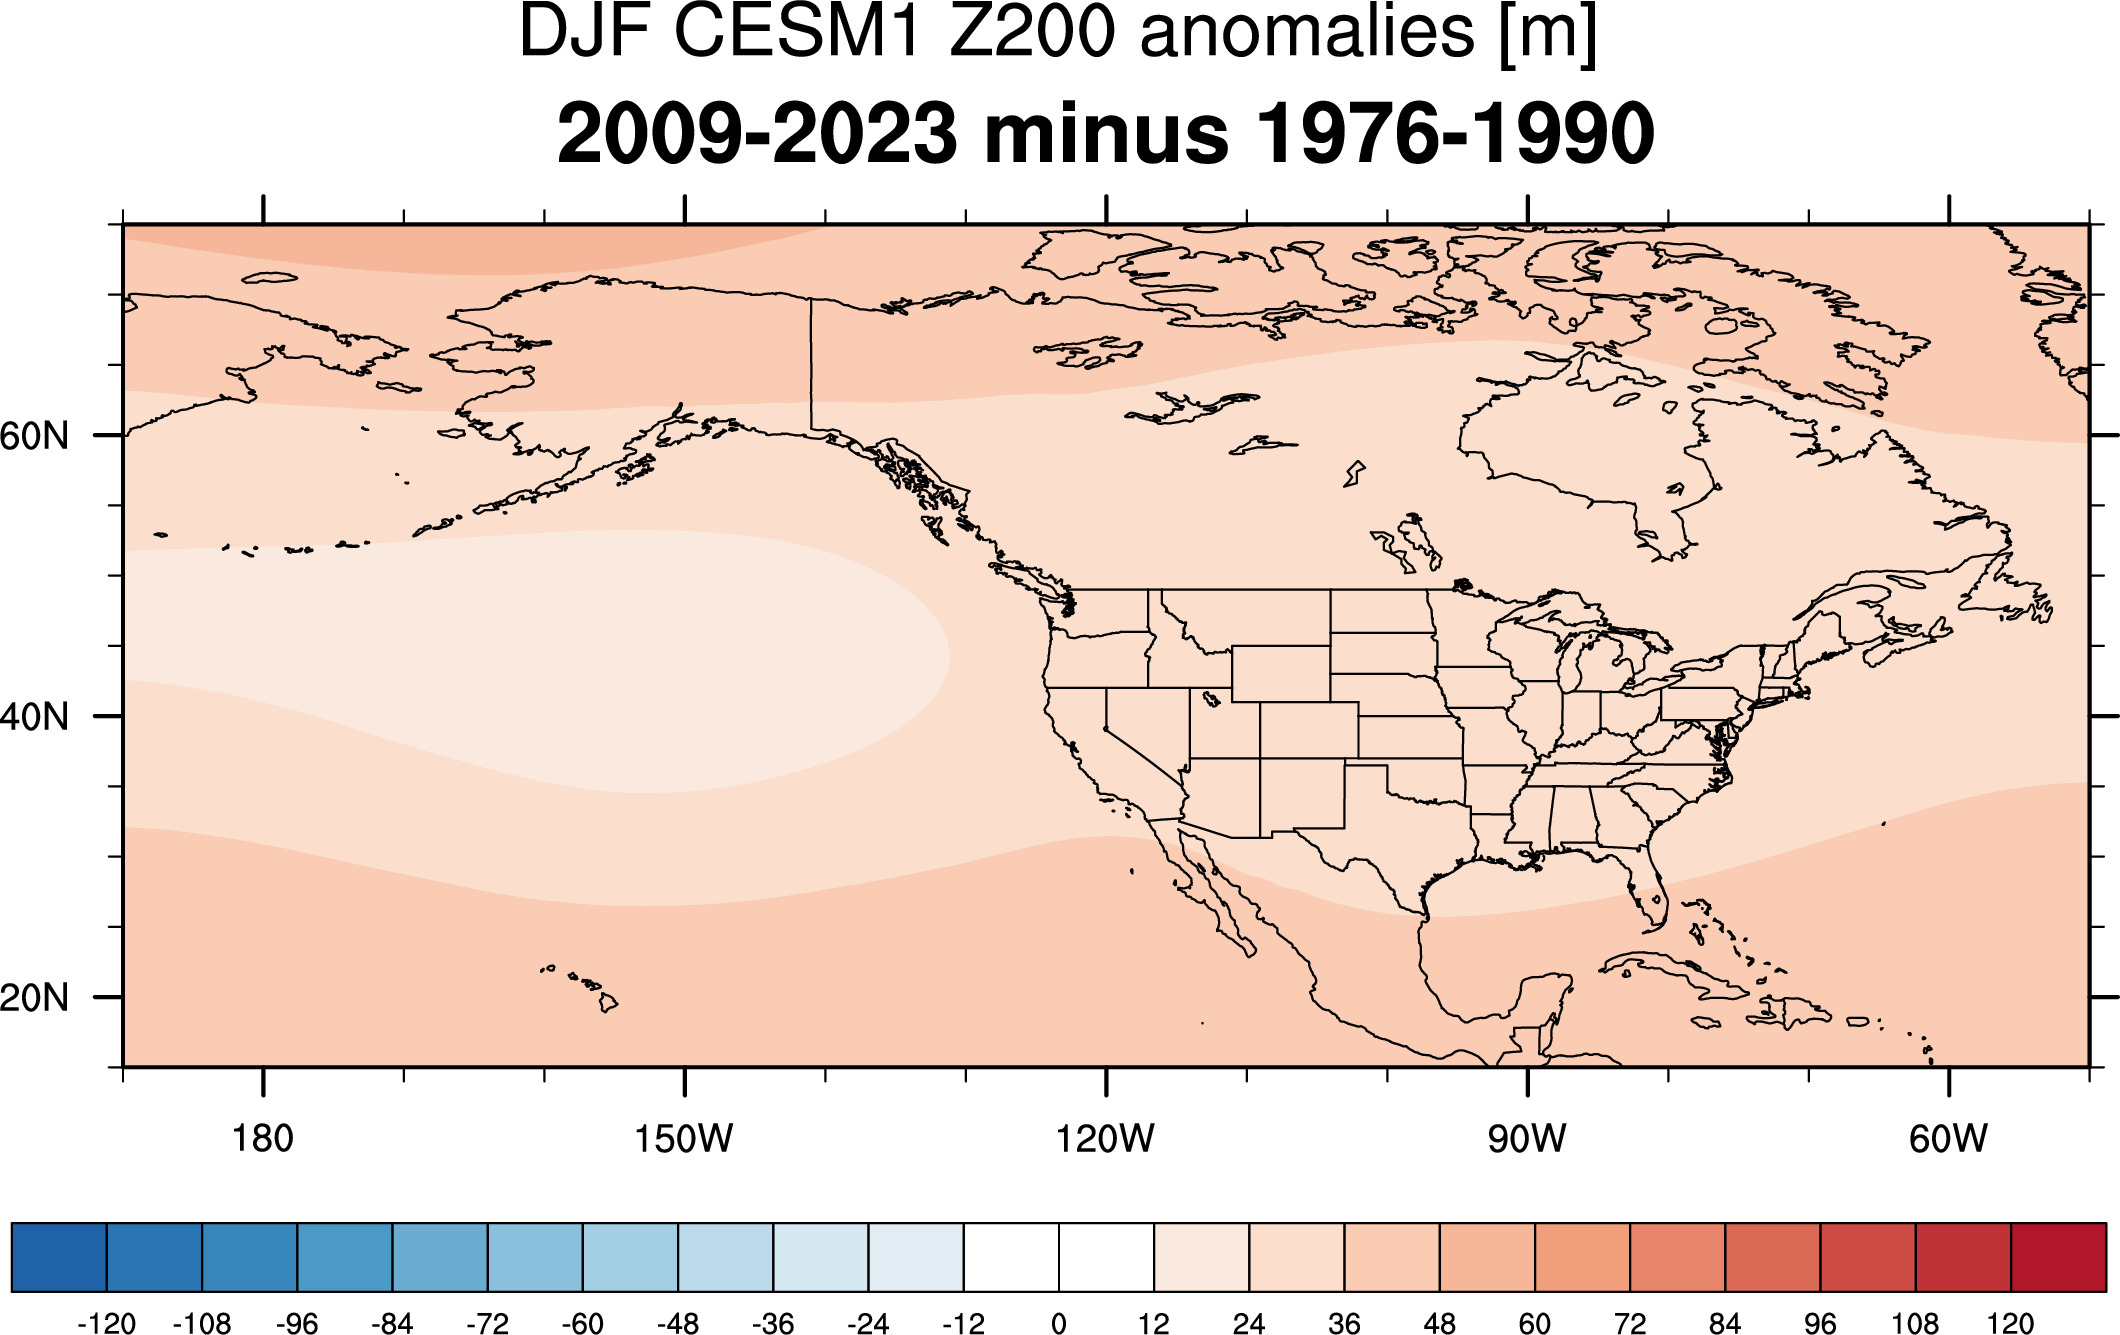
Strongest El Ninos:
_____________________________________________________________________________________
____________________________________________________________________________________
-------------------------------------------------------