Lesley L. Smith – Arctic Warming
All plots here preliminary.
Regarding Arctic warming
New!
from 2018
from 2017
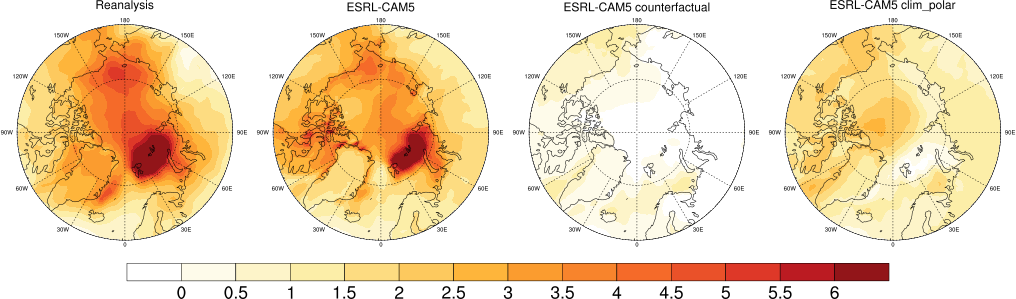
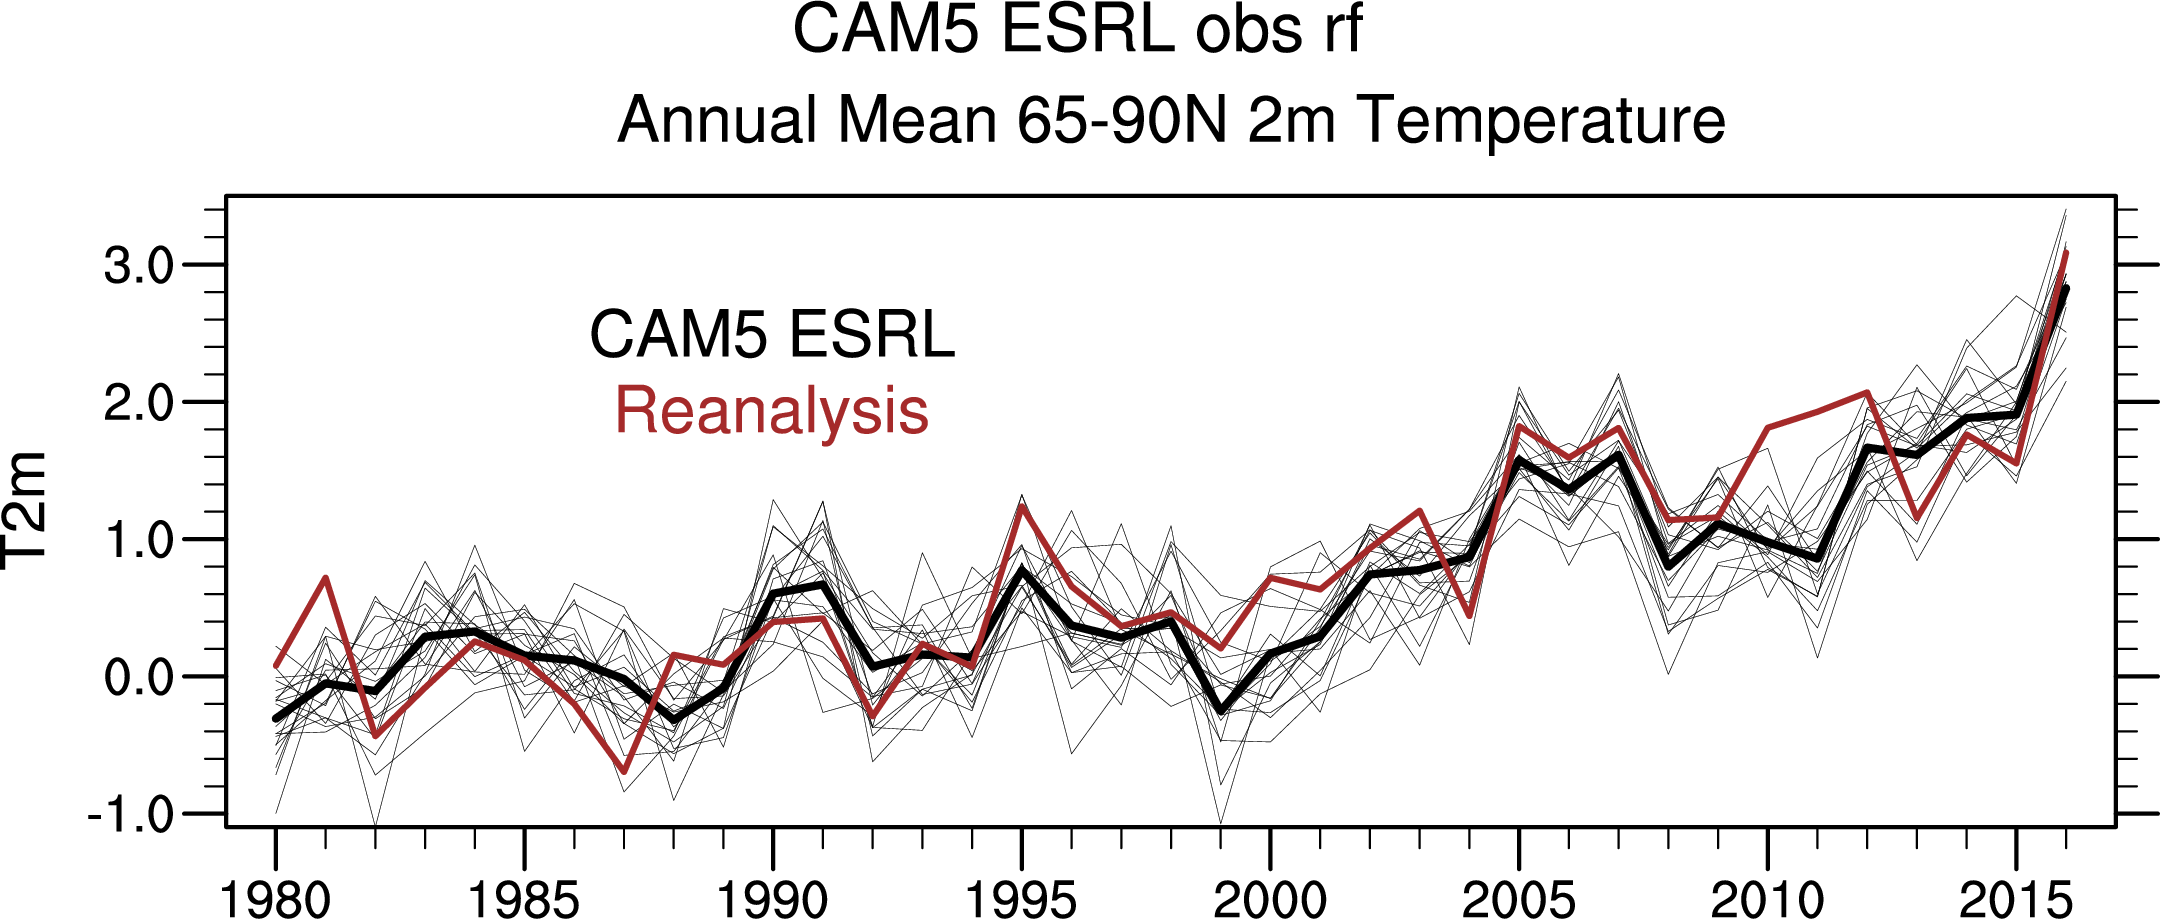
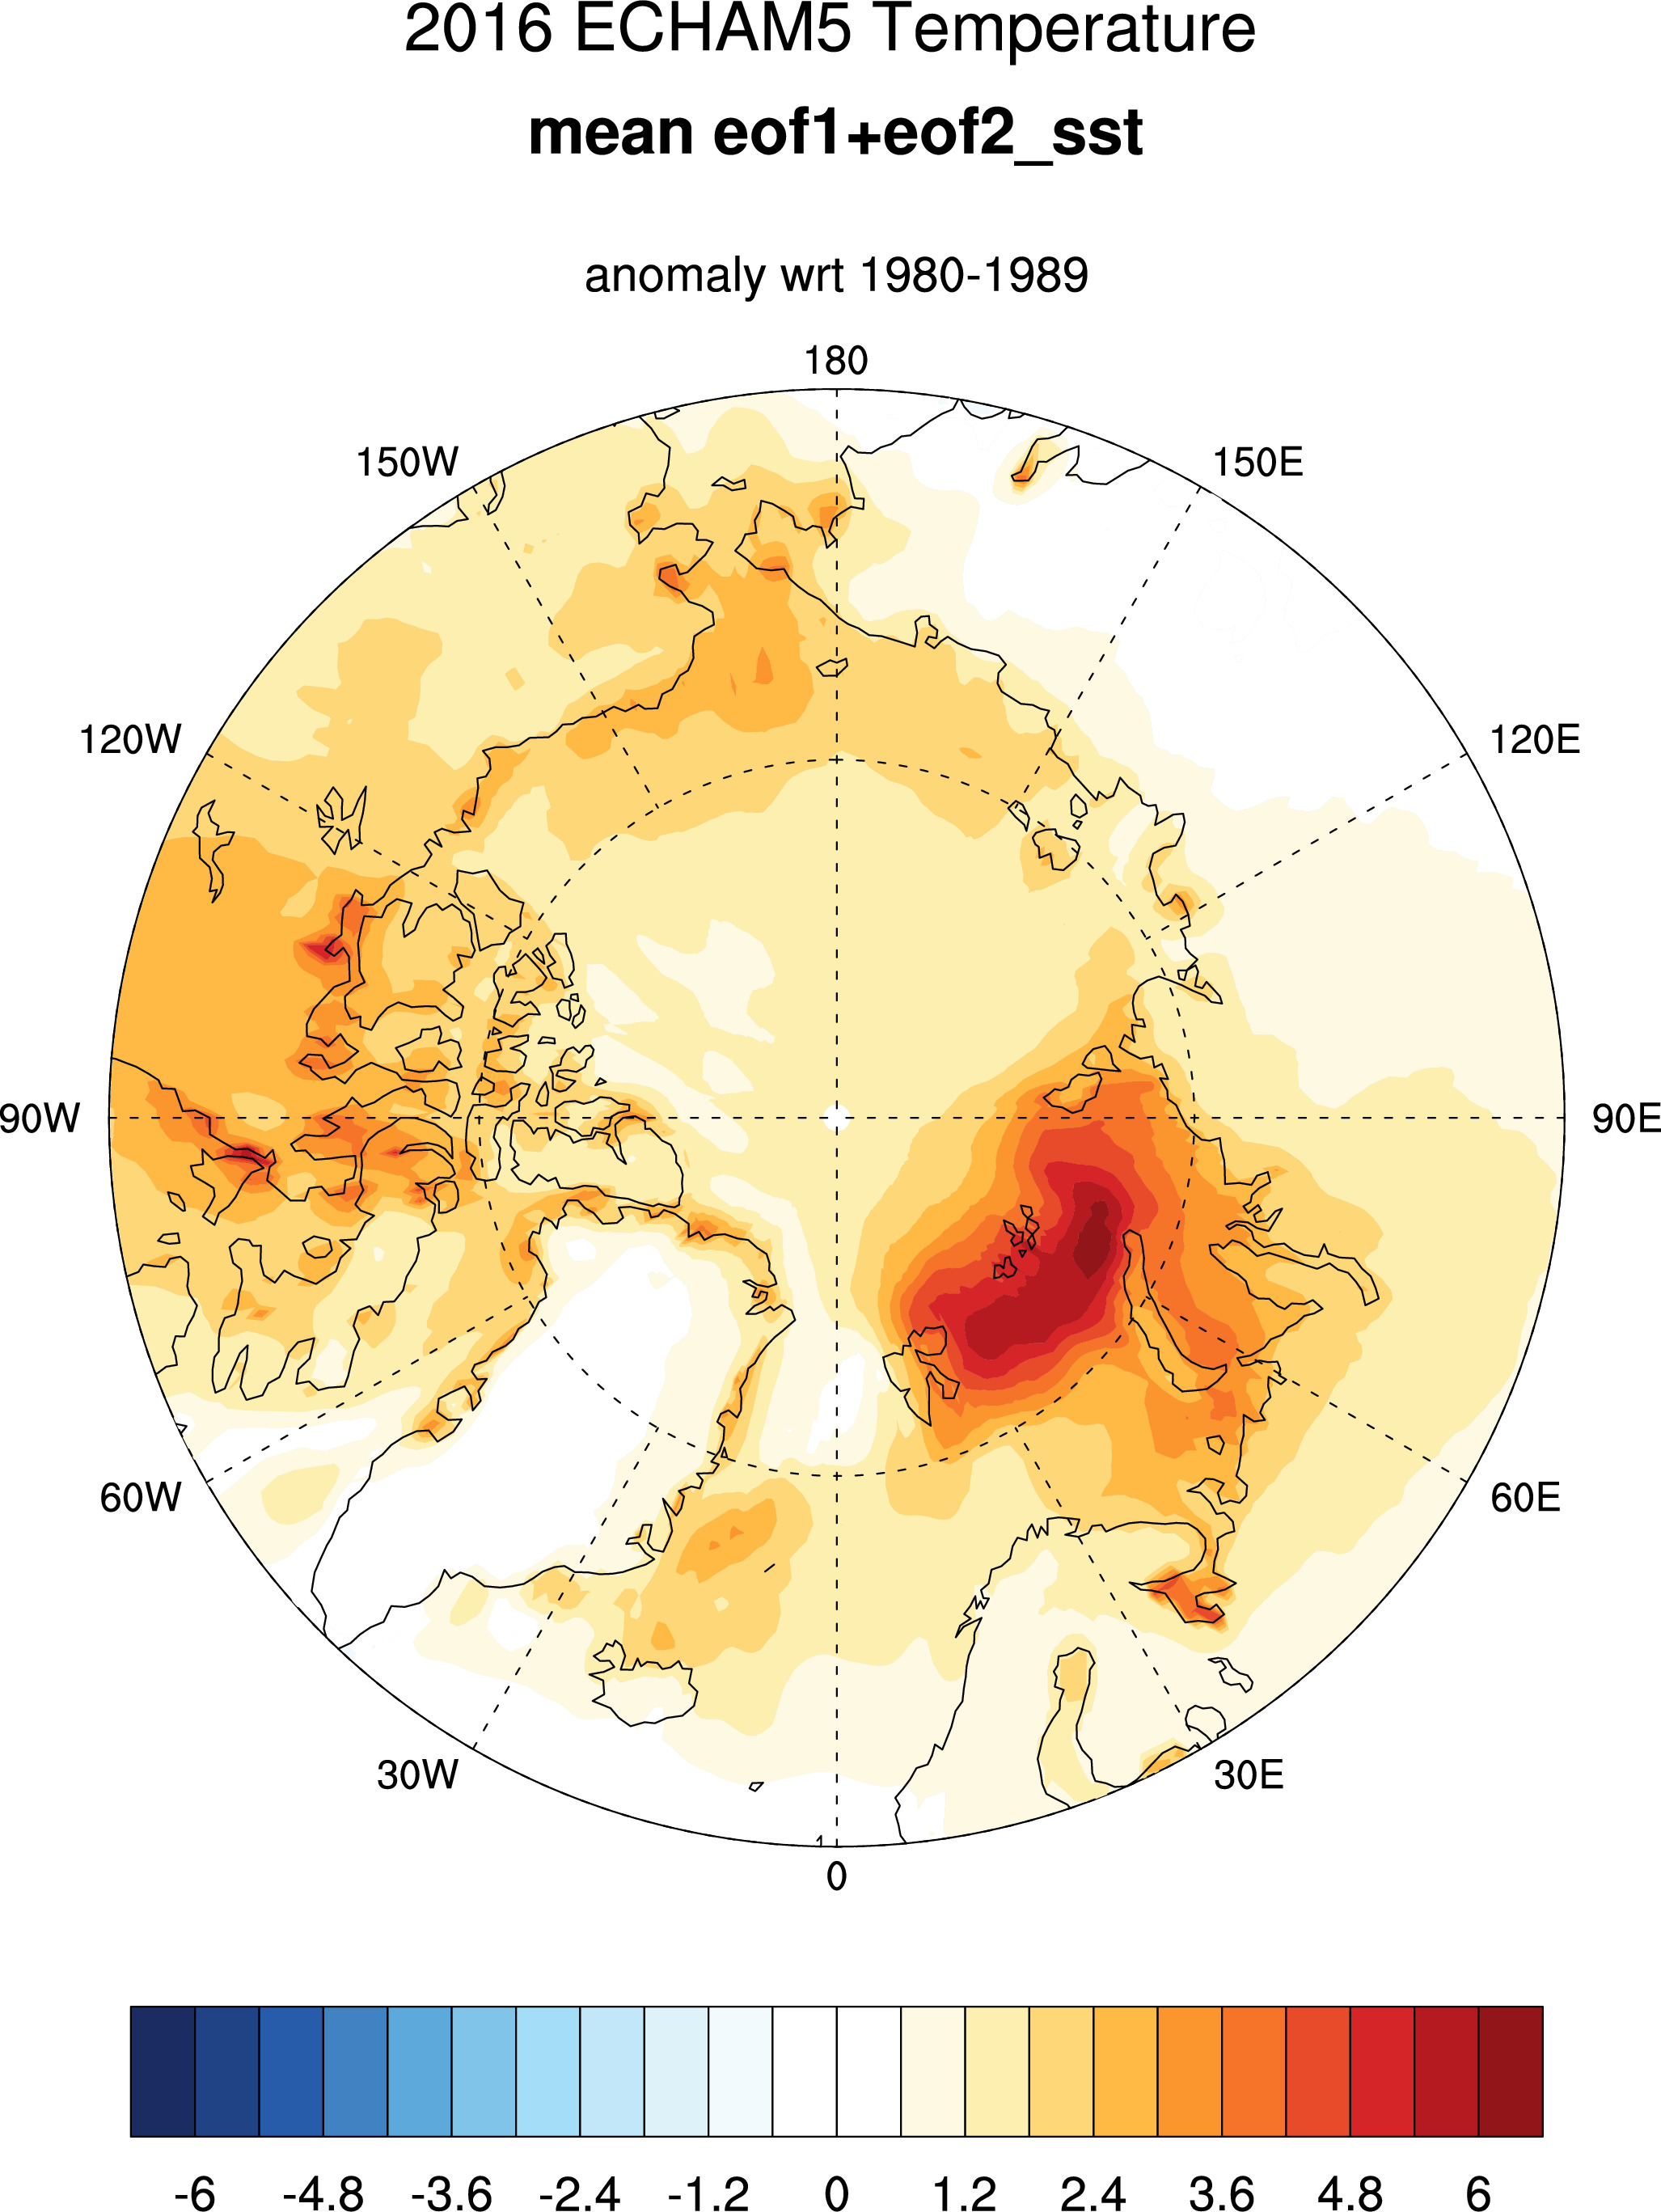
ESRL-CAM5 preliminary results:
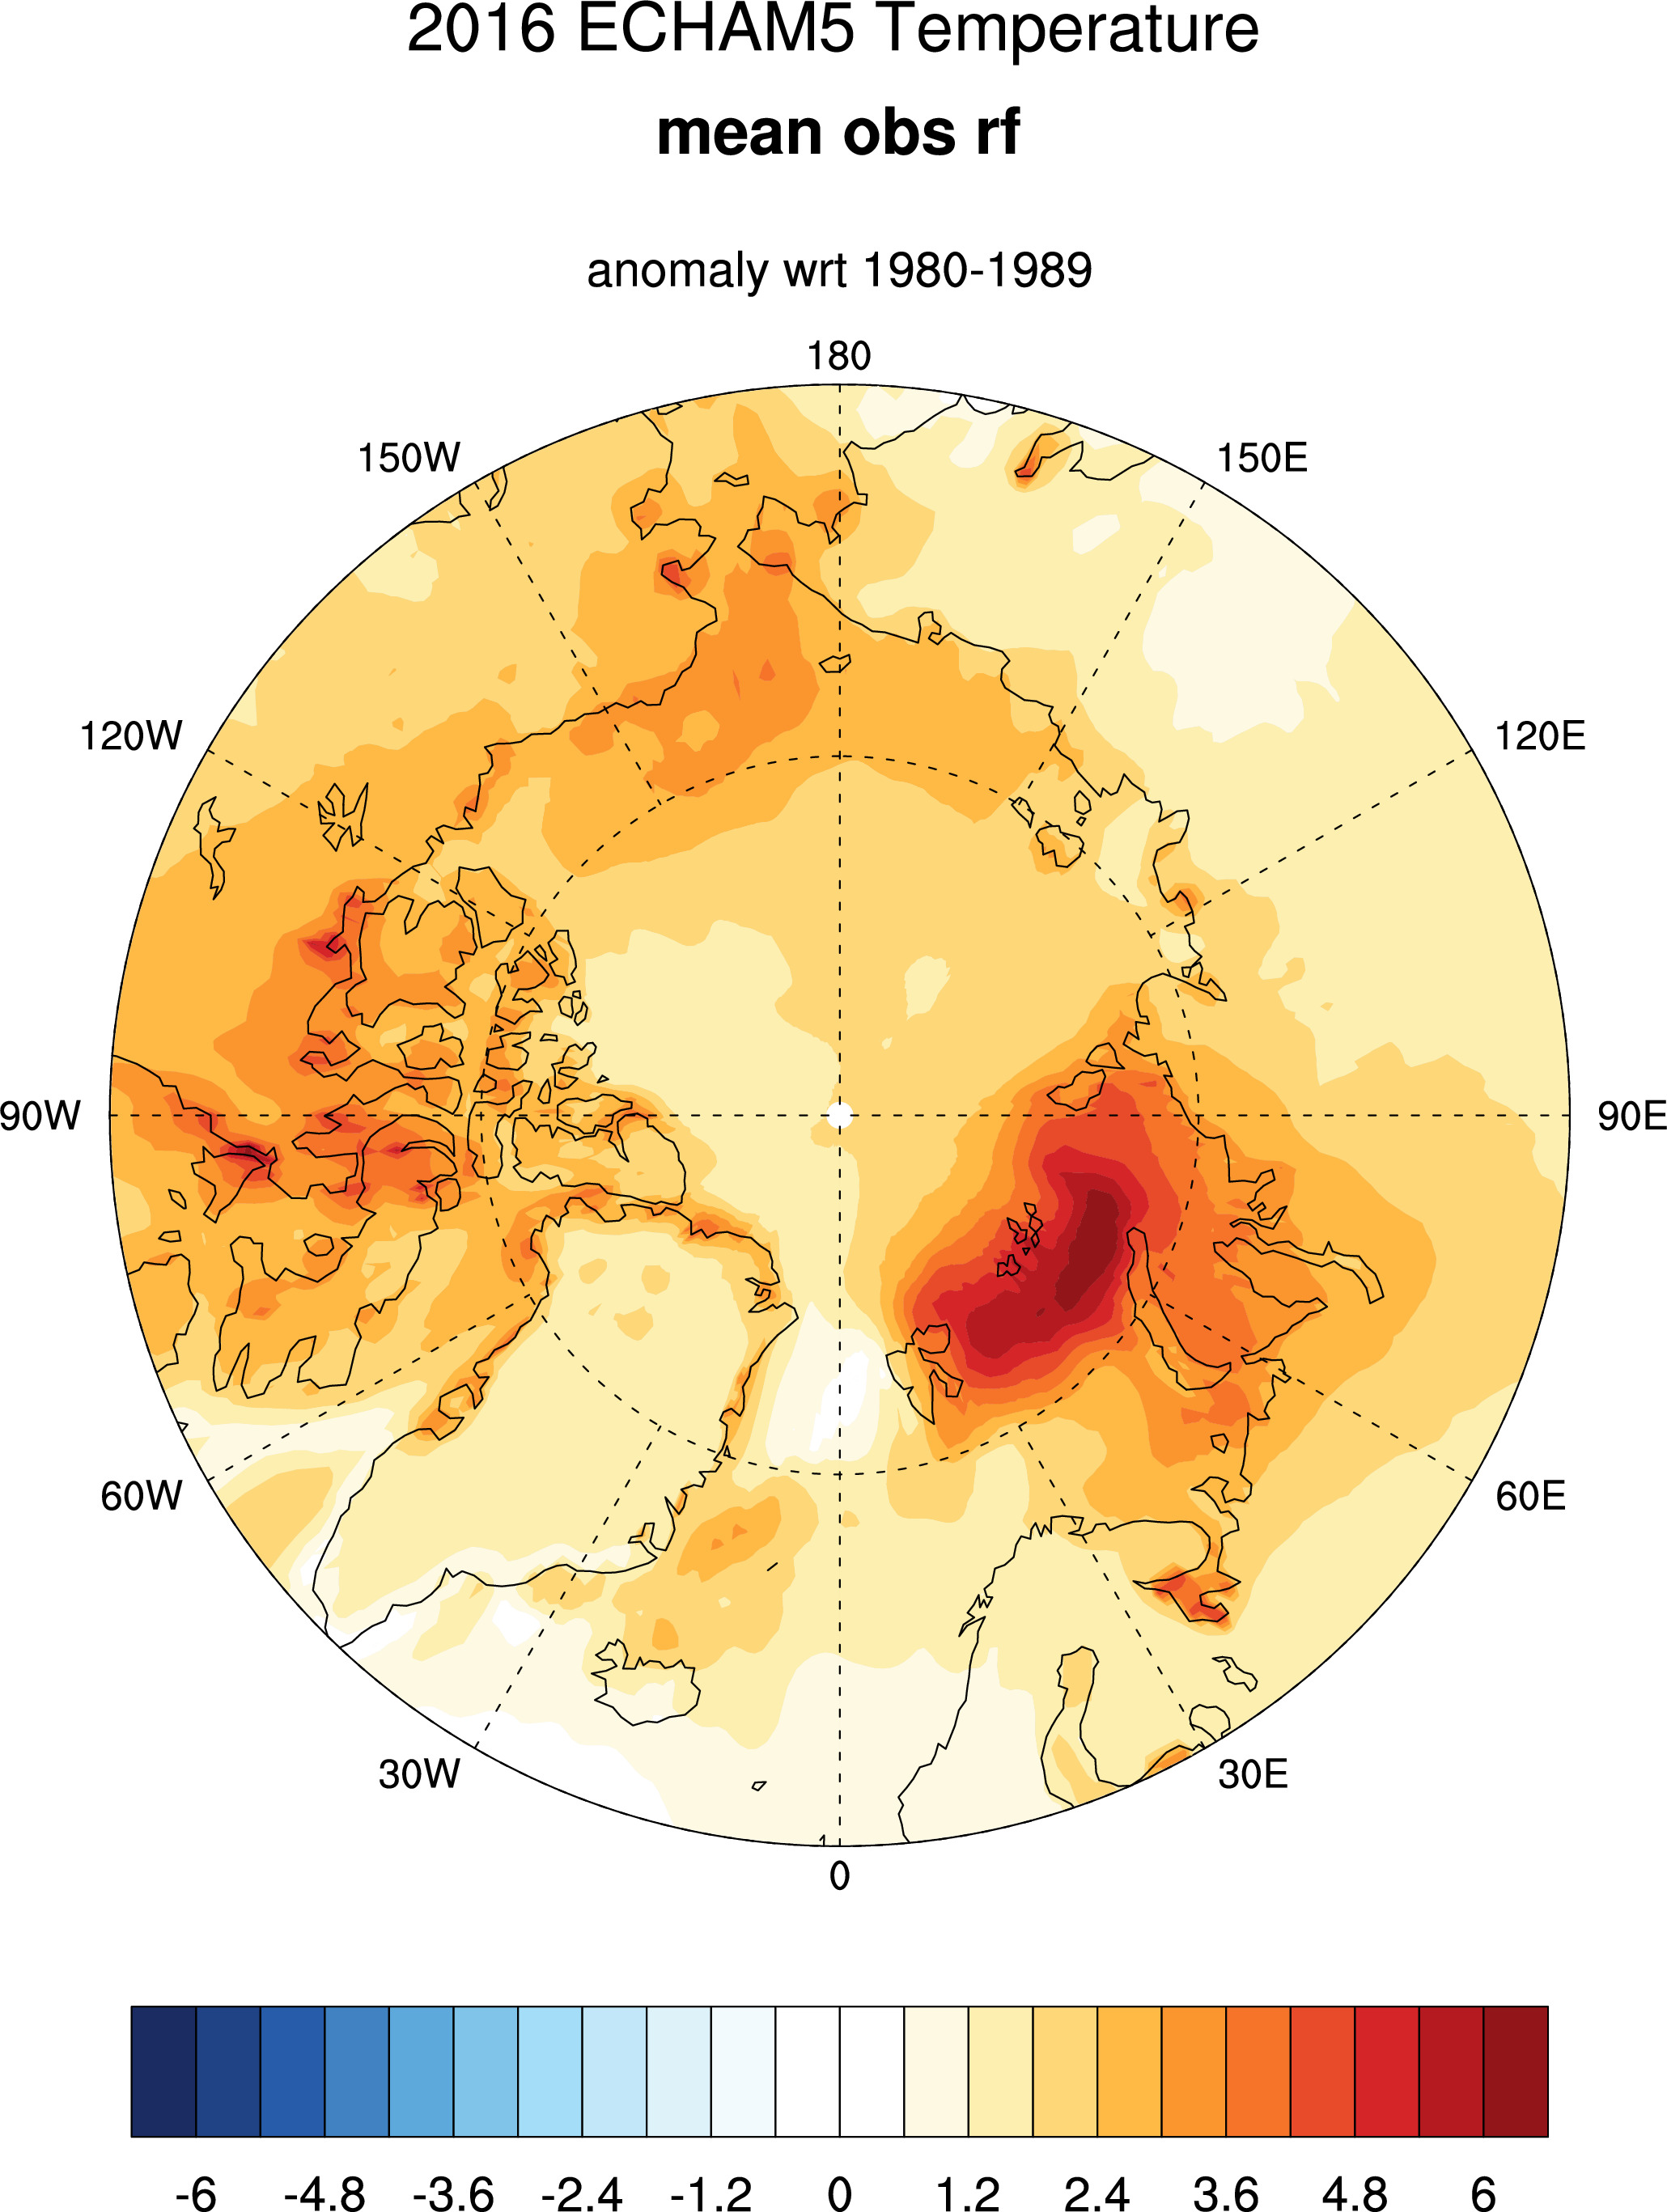
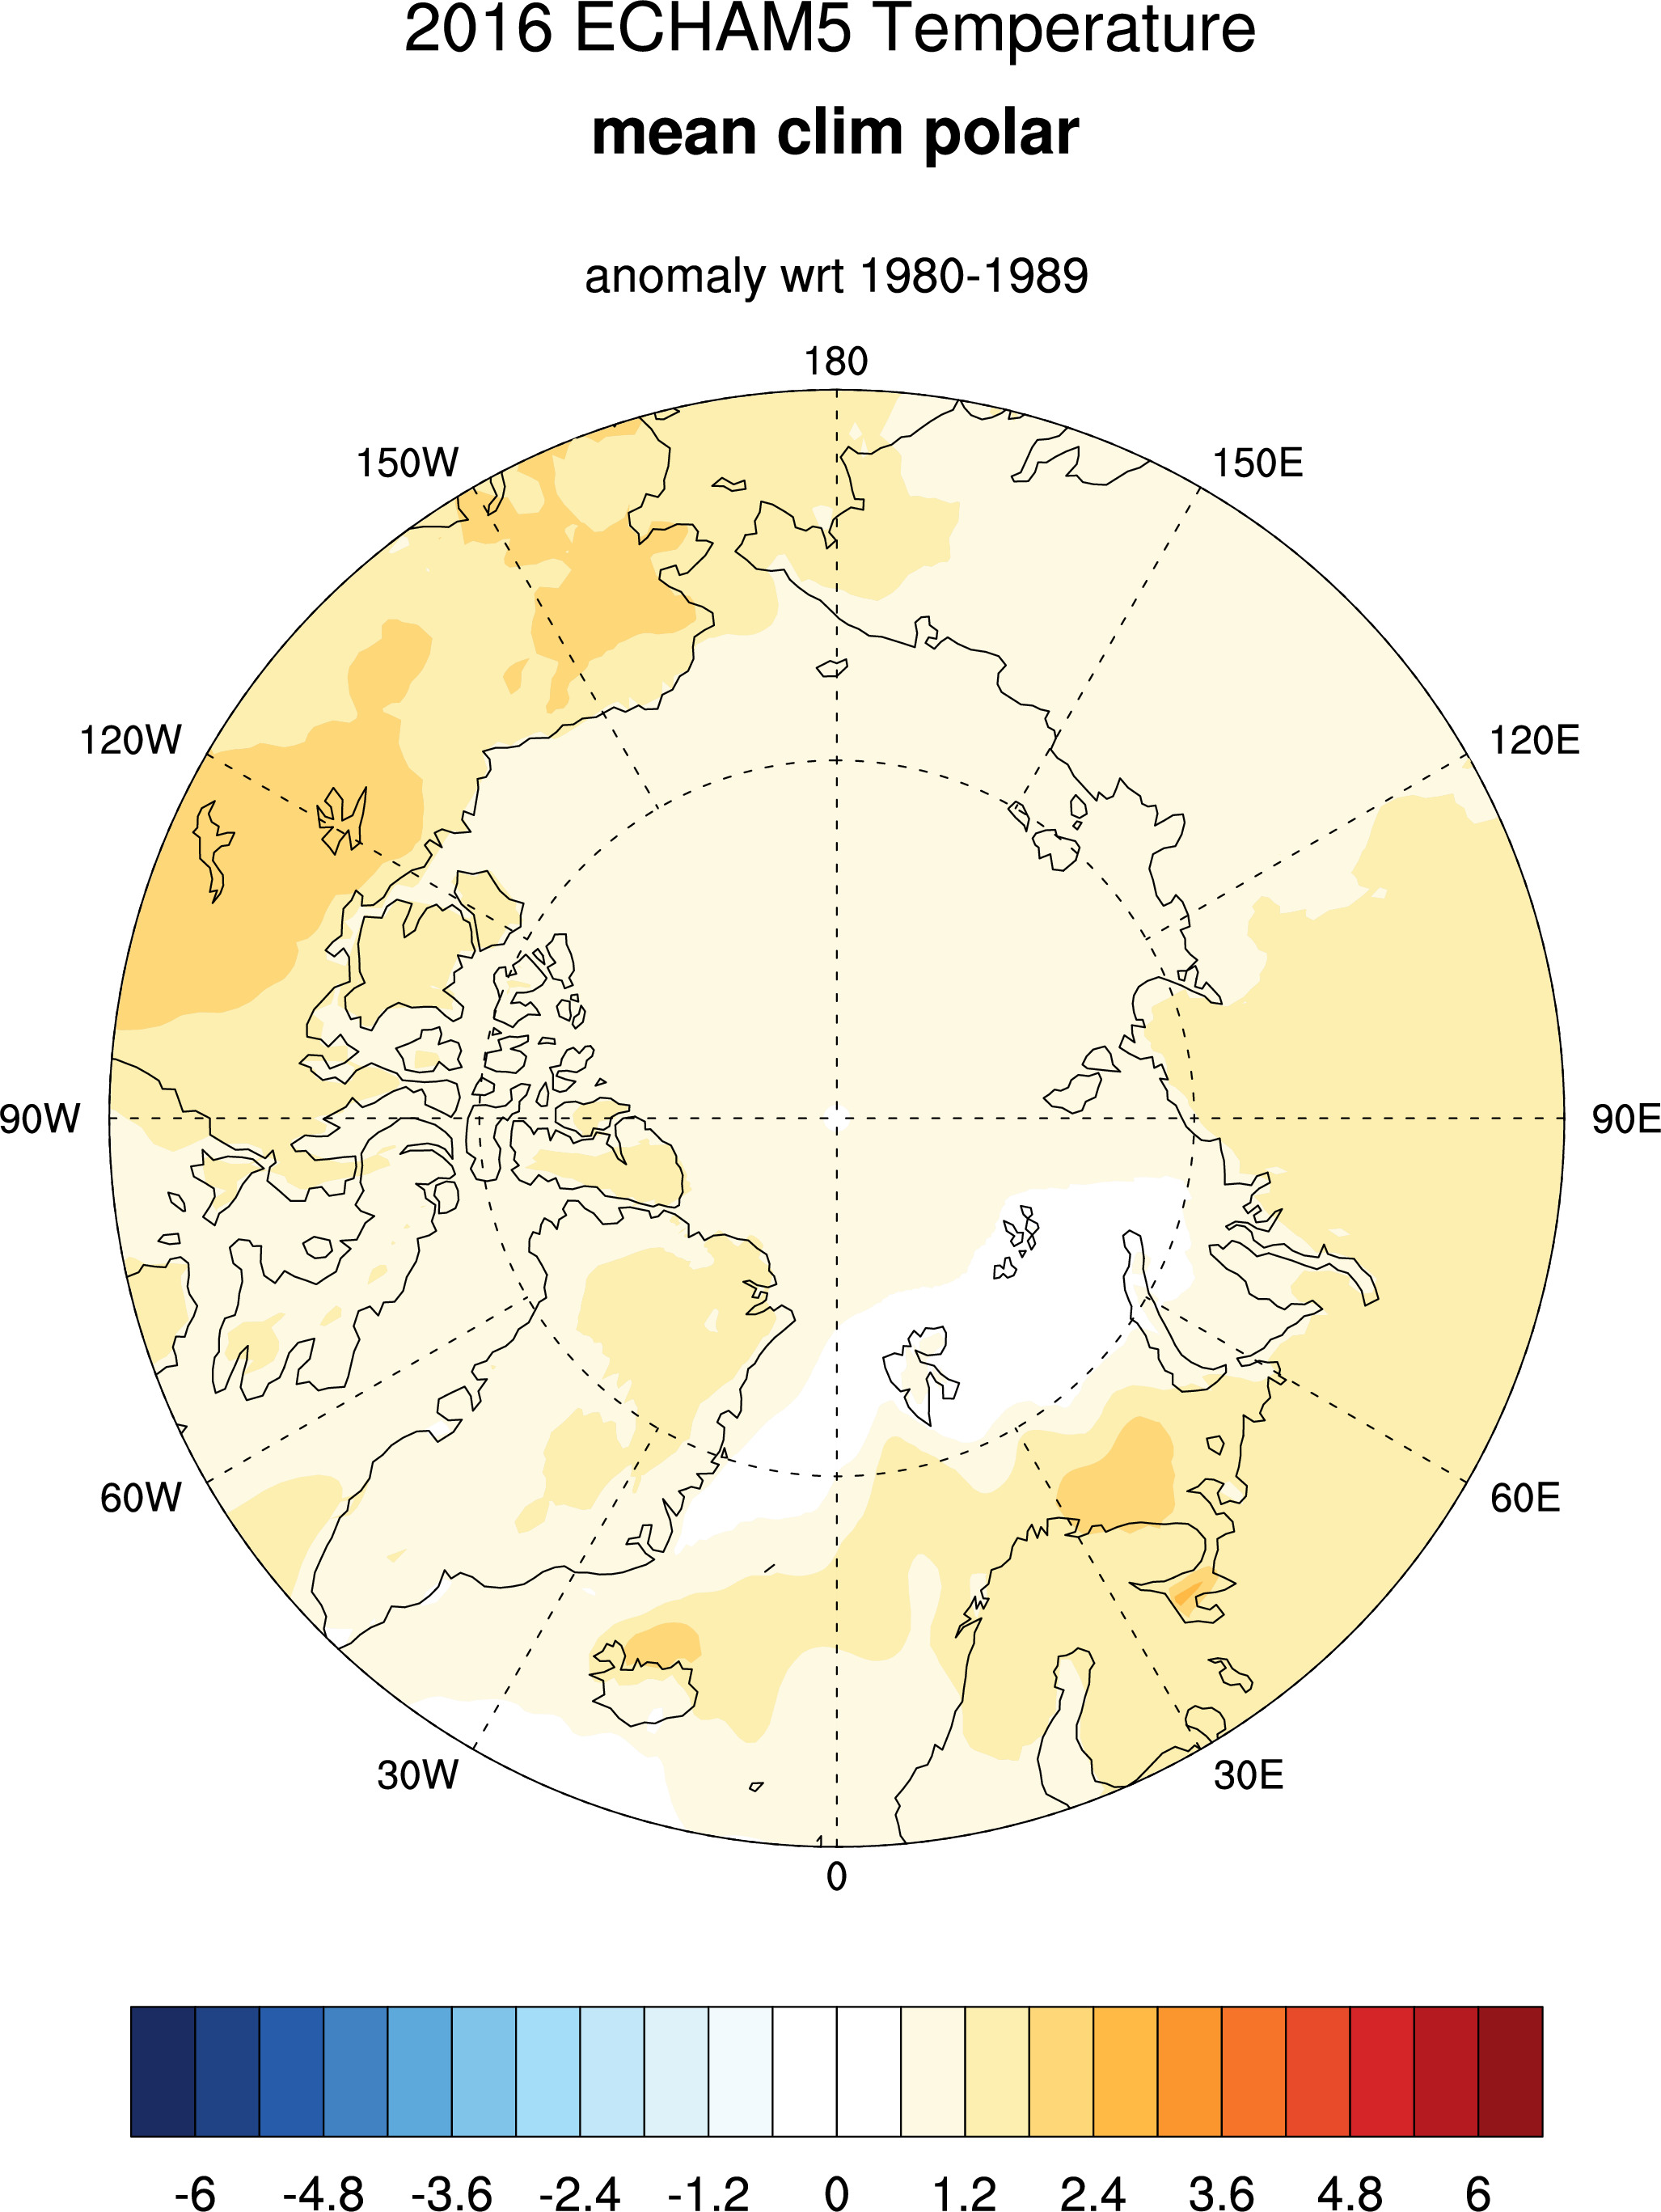
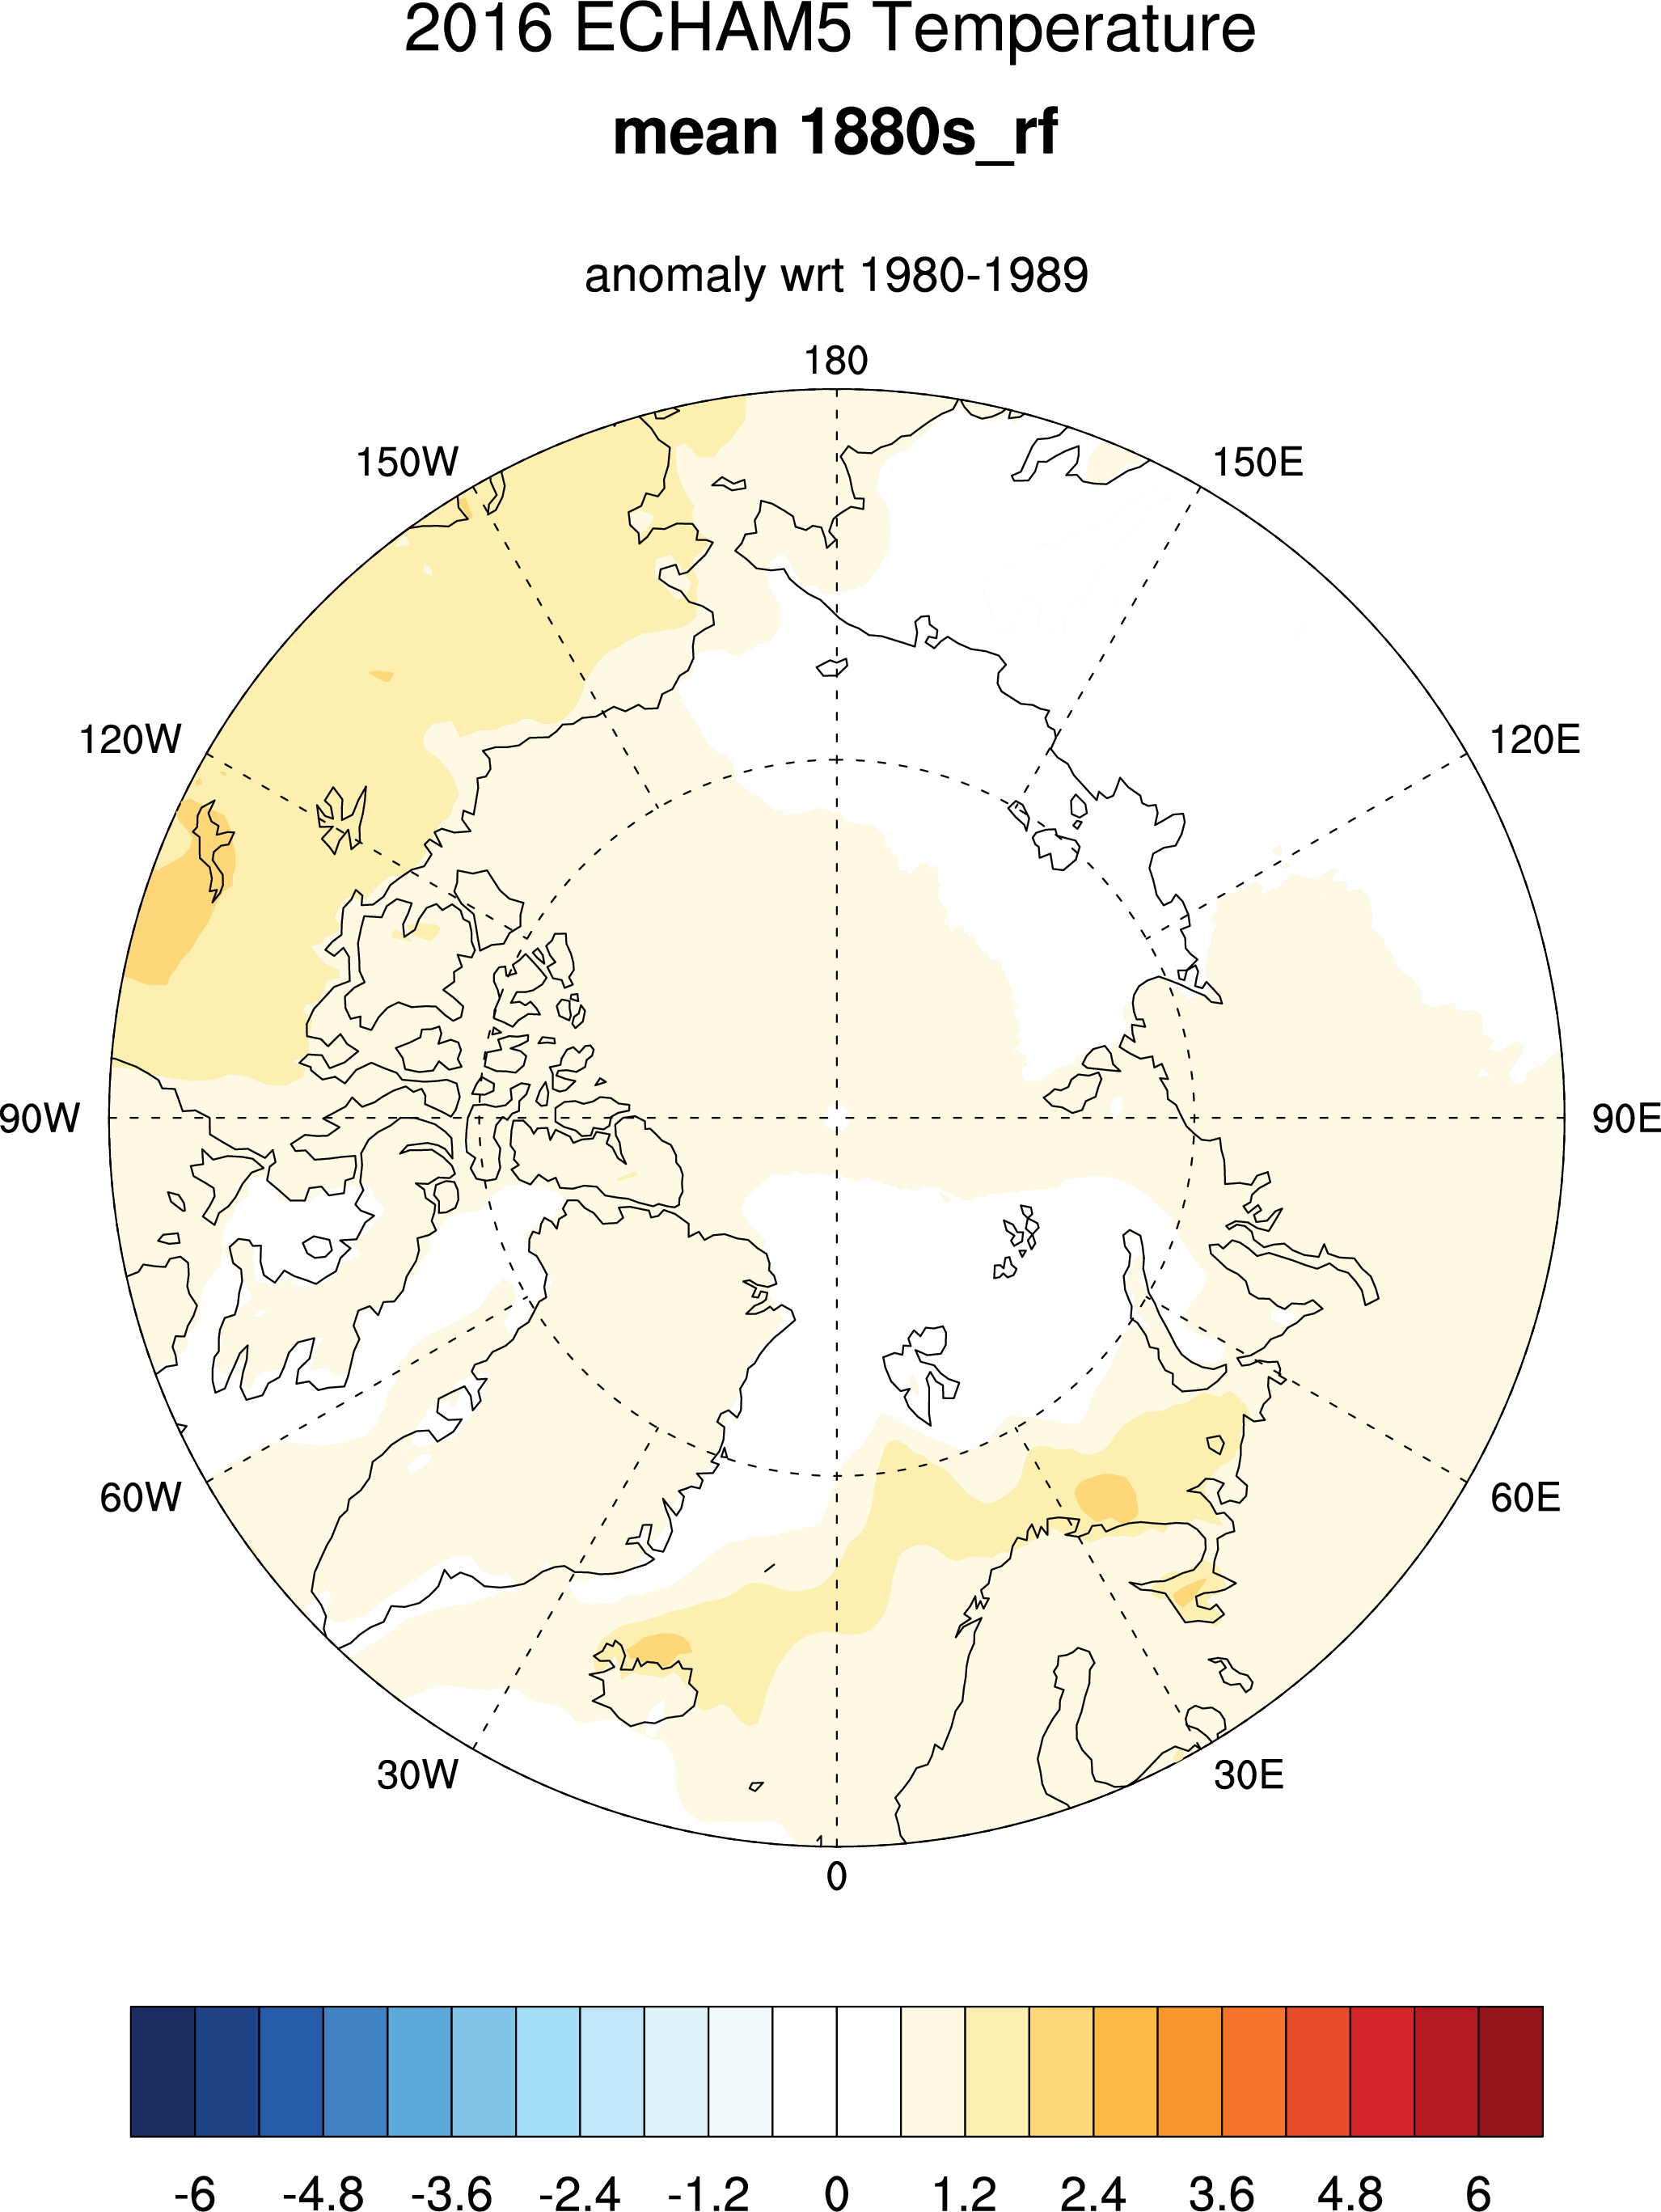
where anomalies computed wrt 1980-1989 factual run
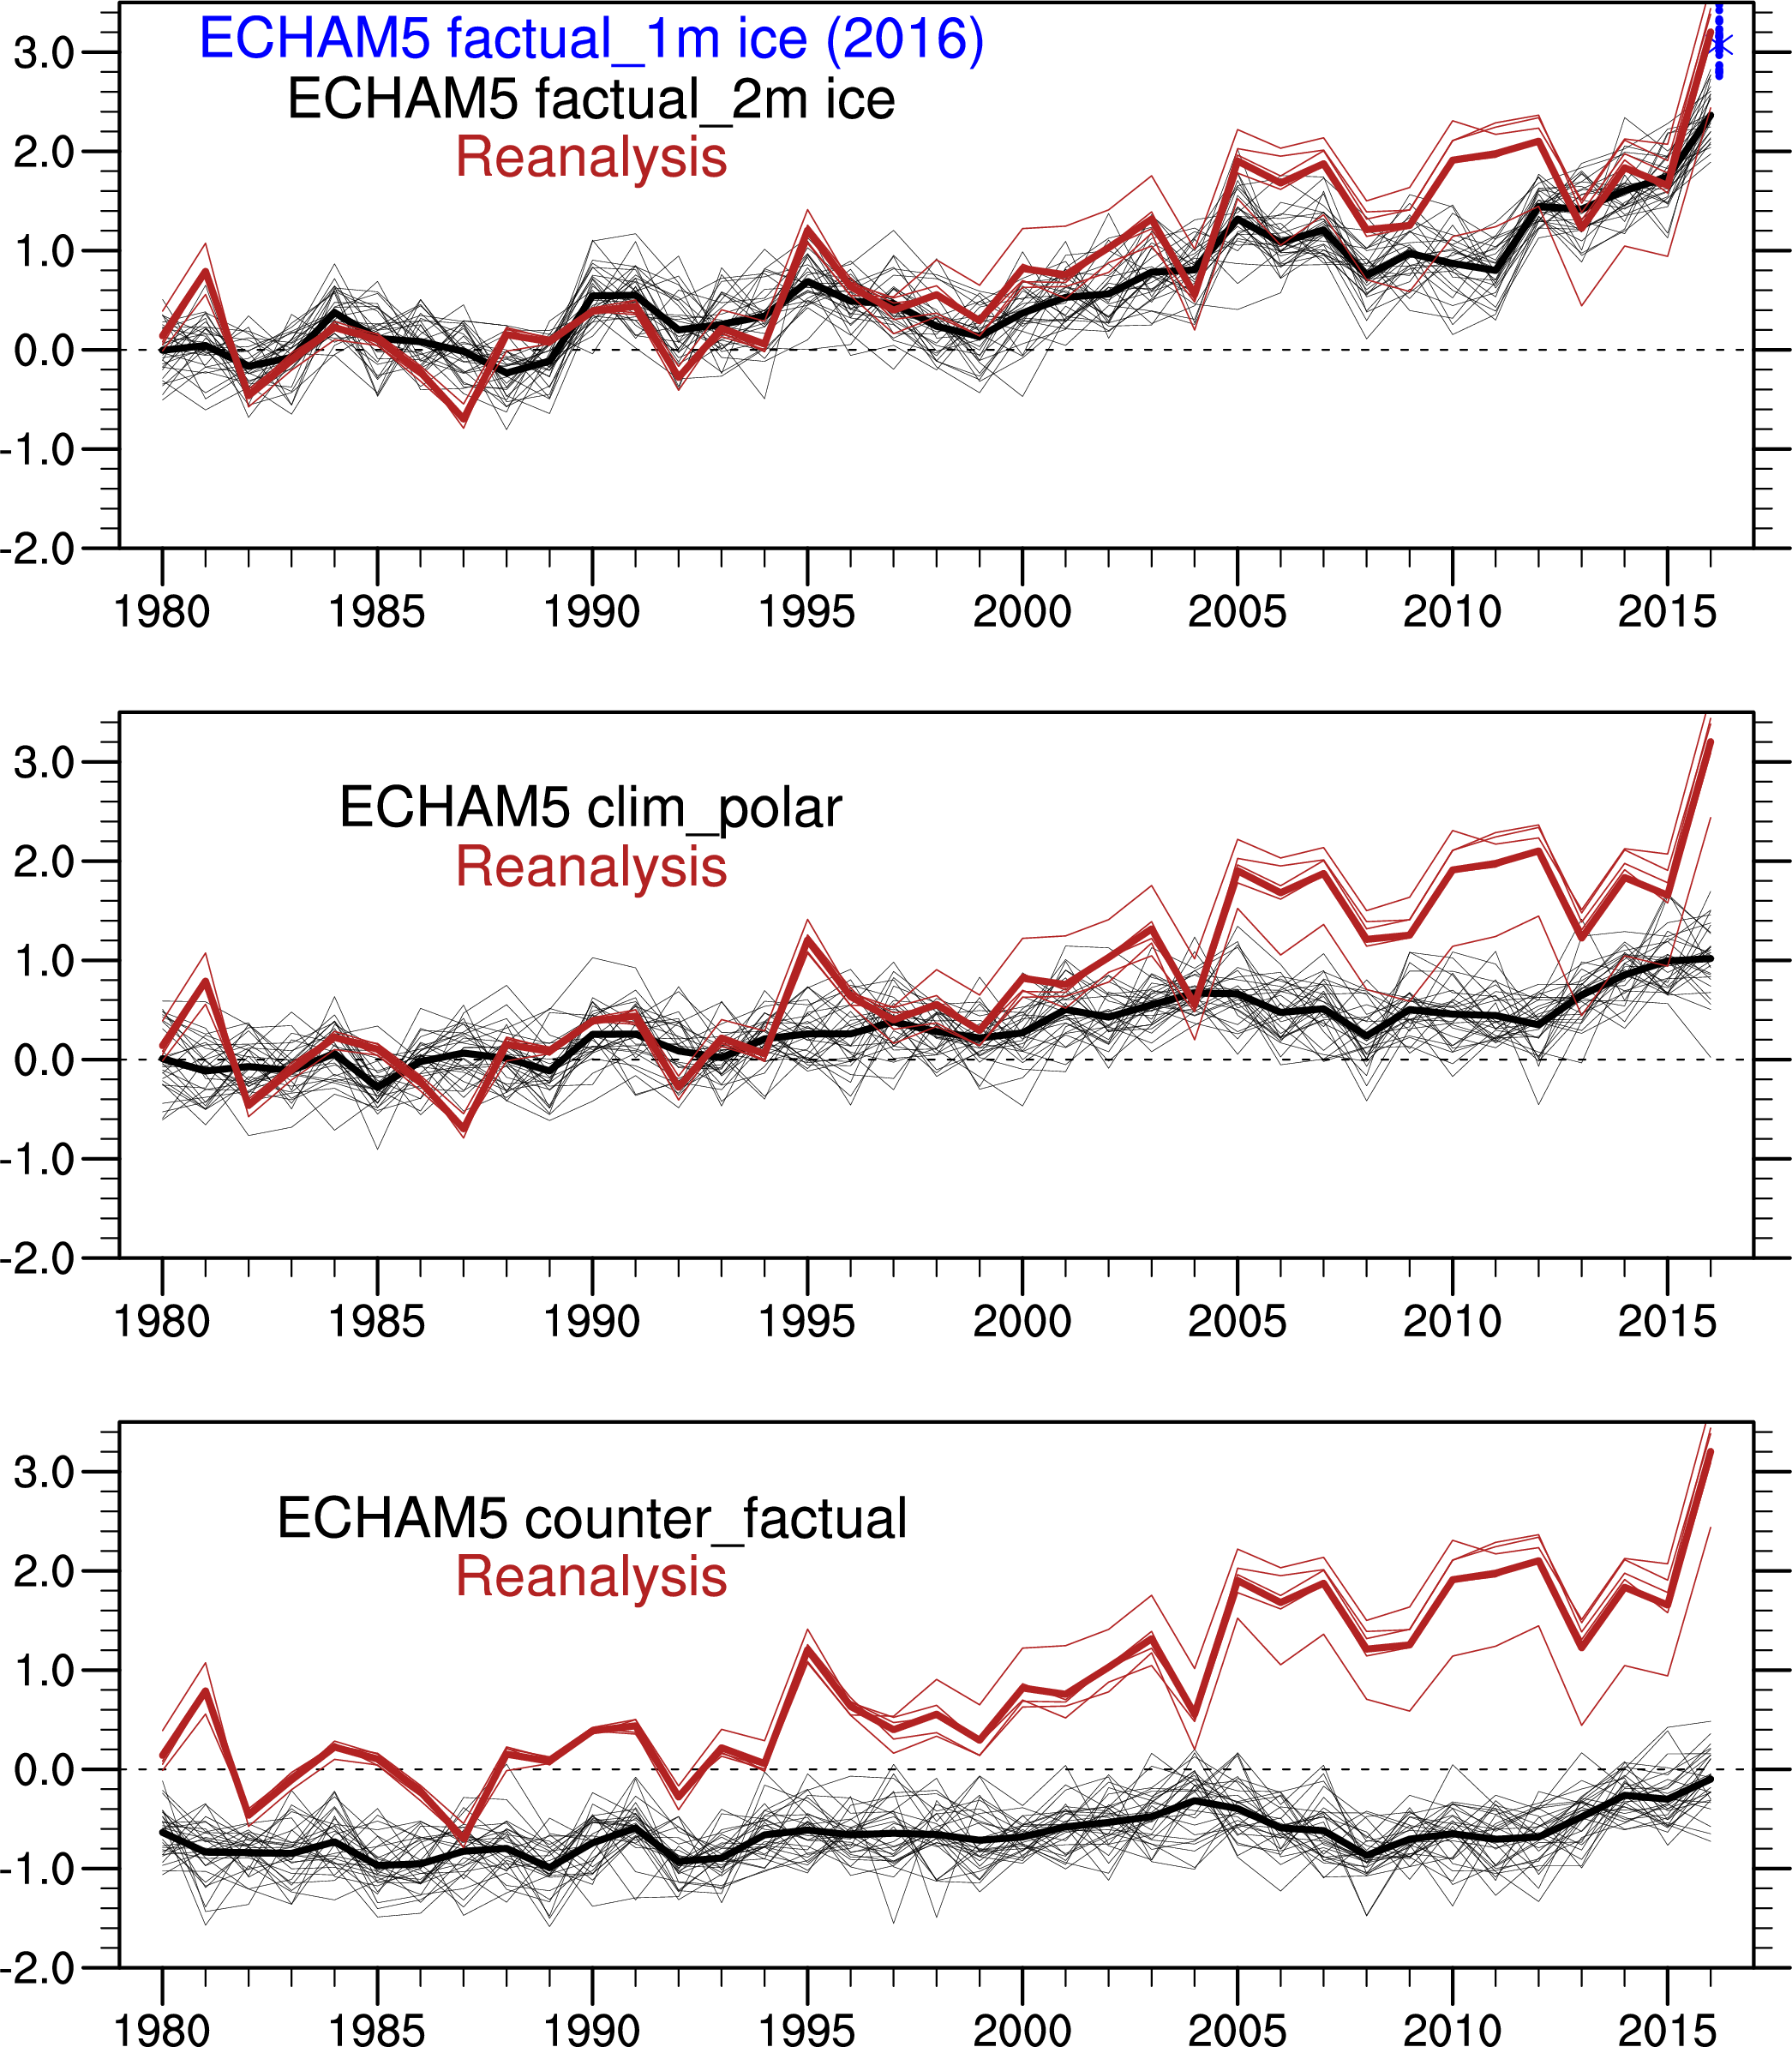
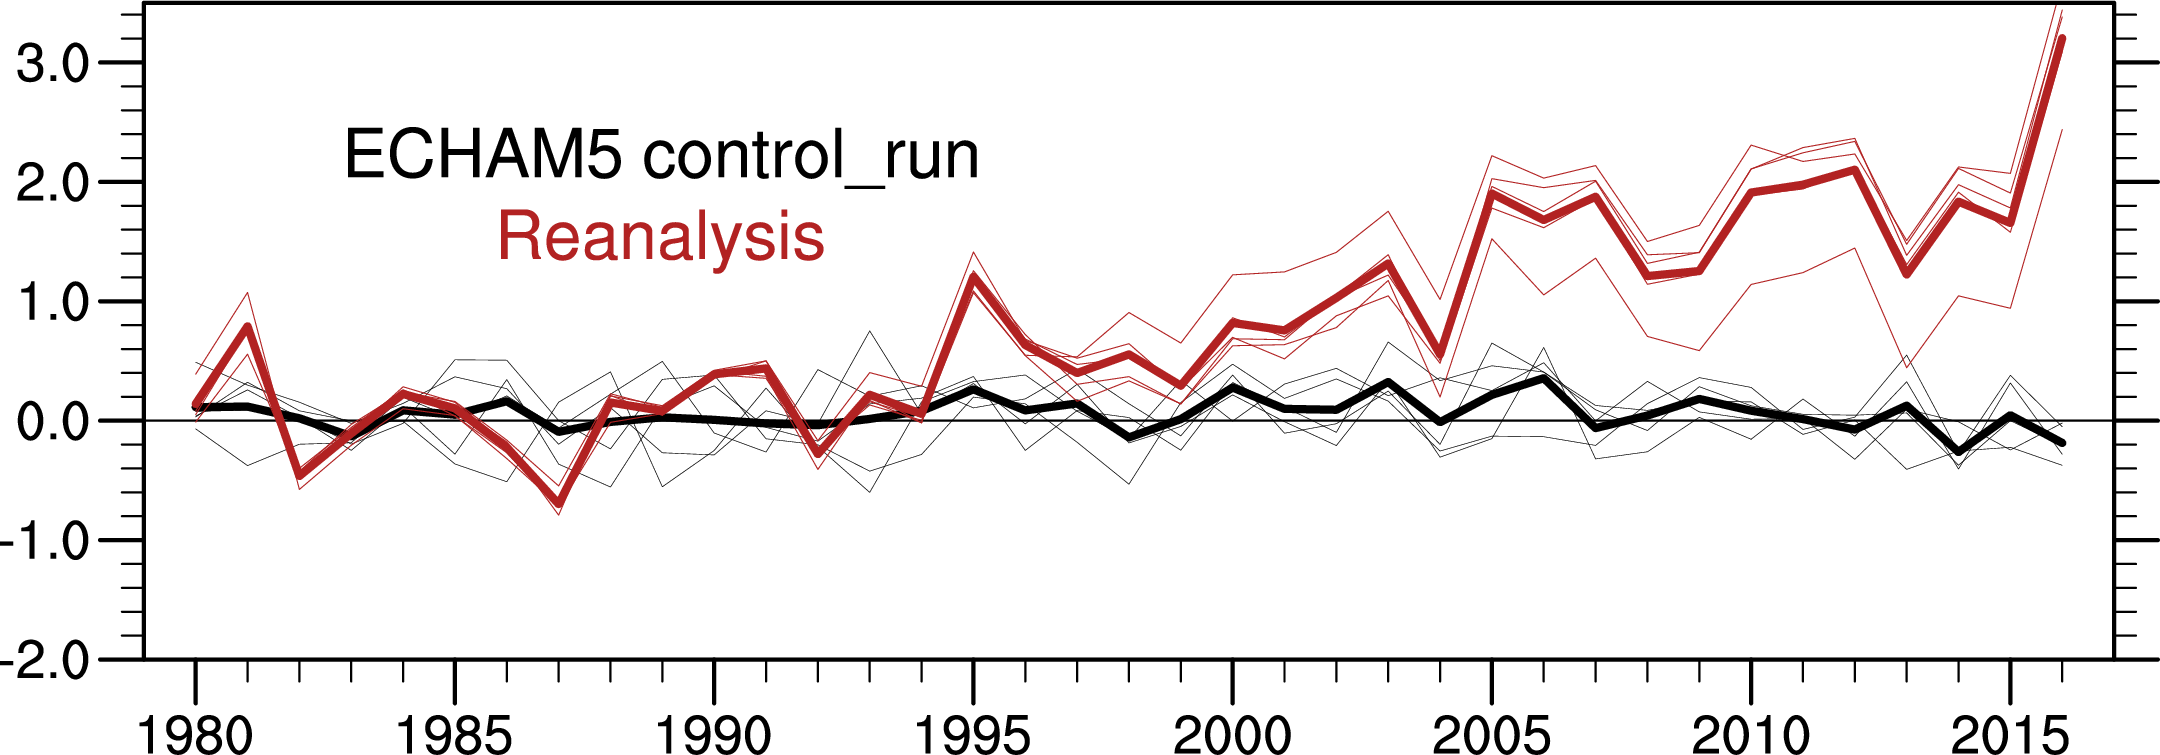
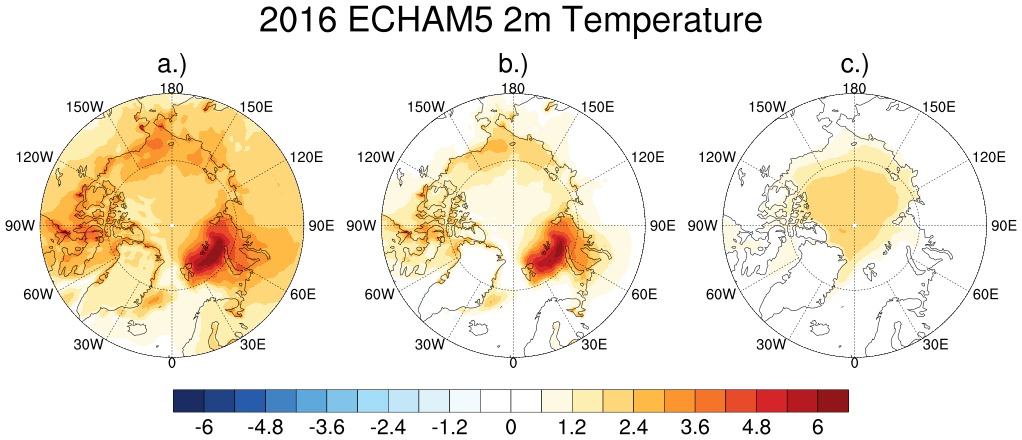
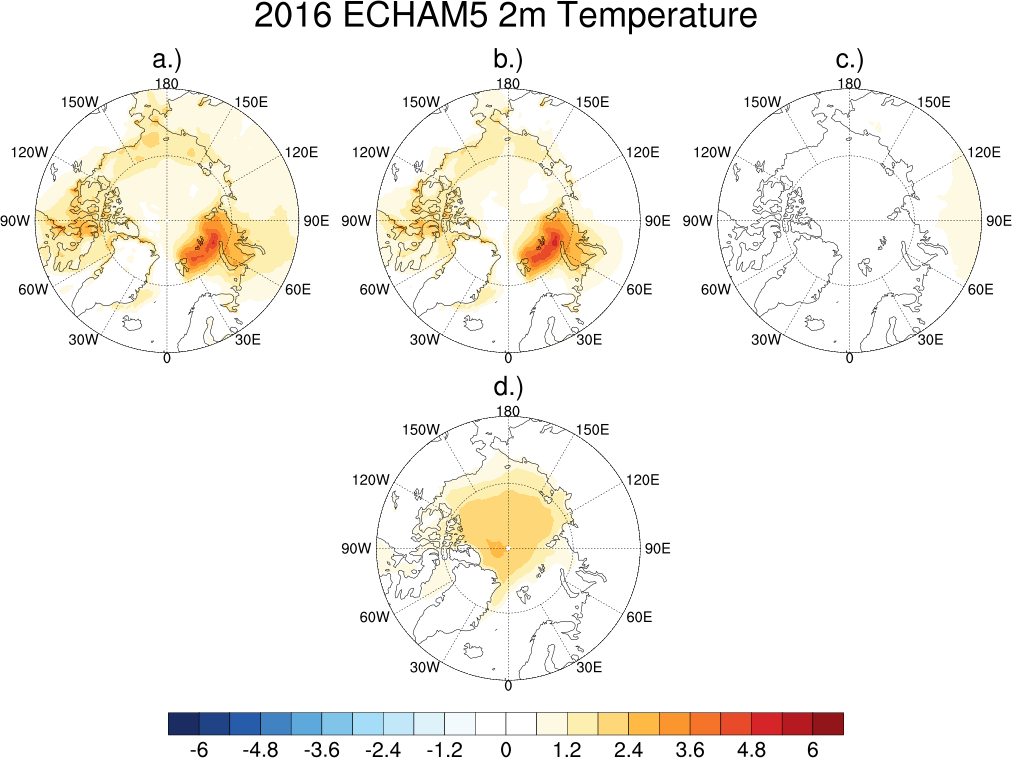
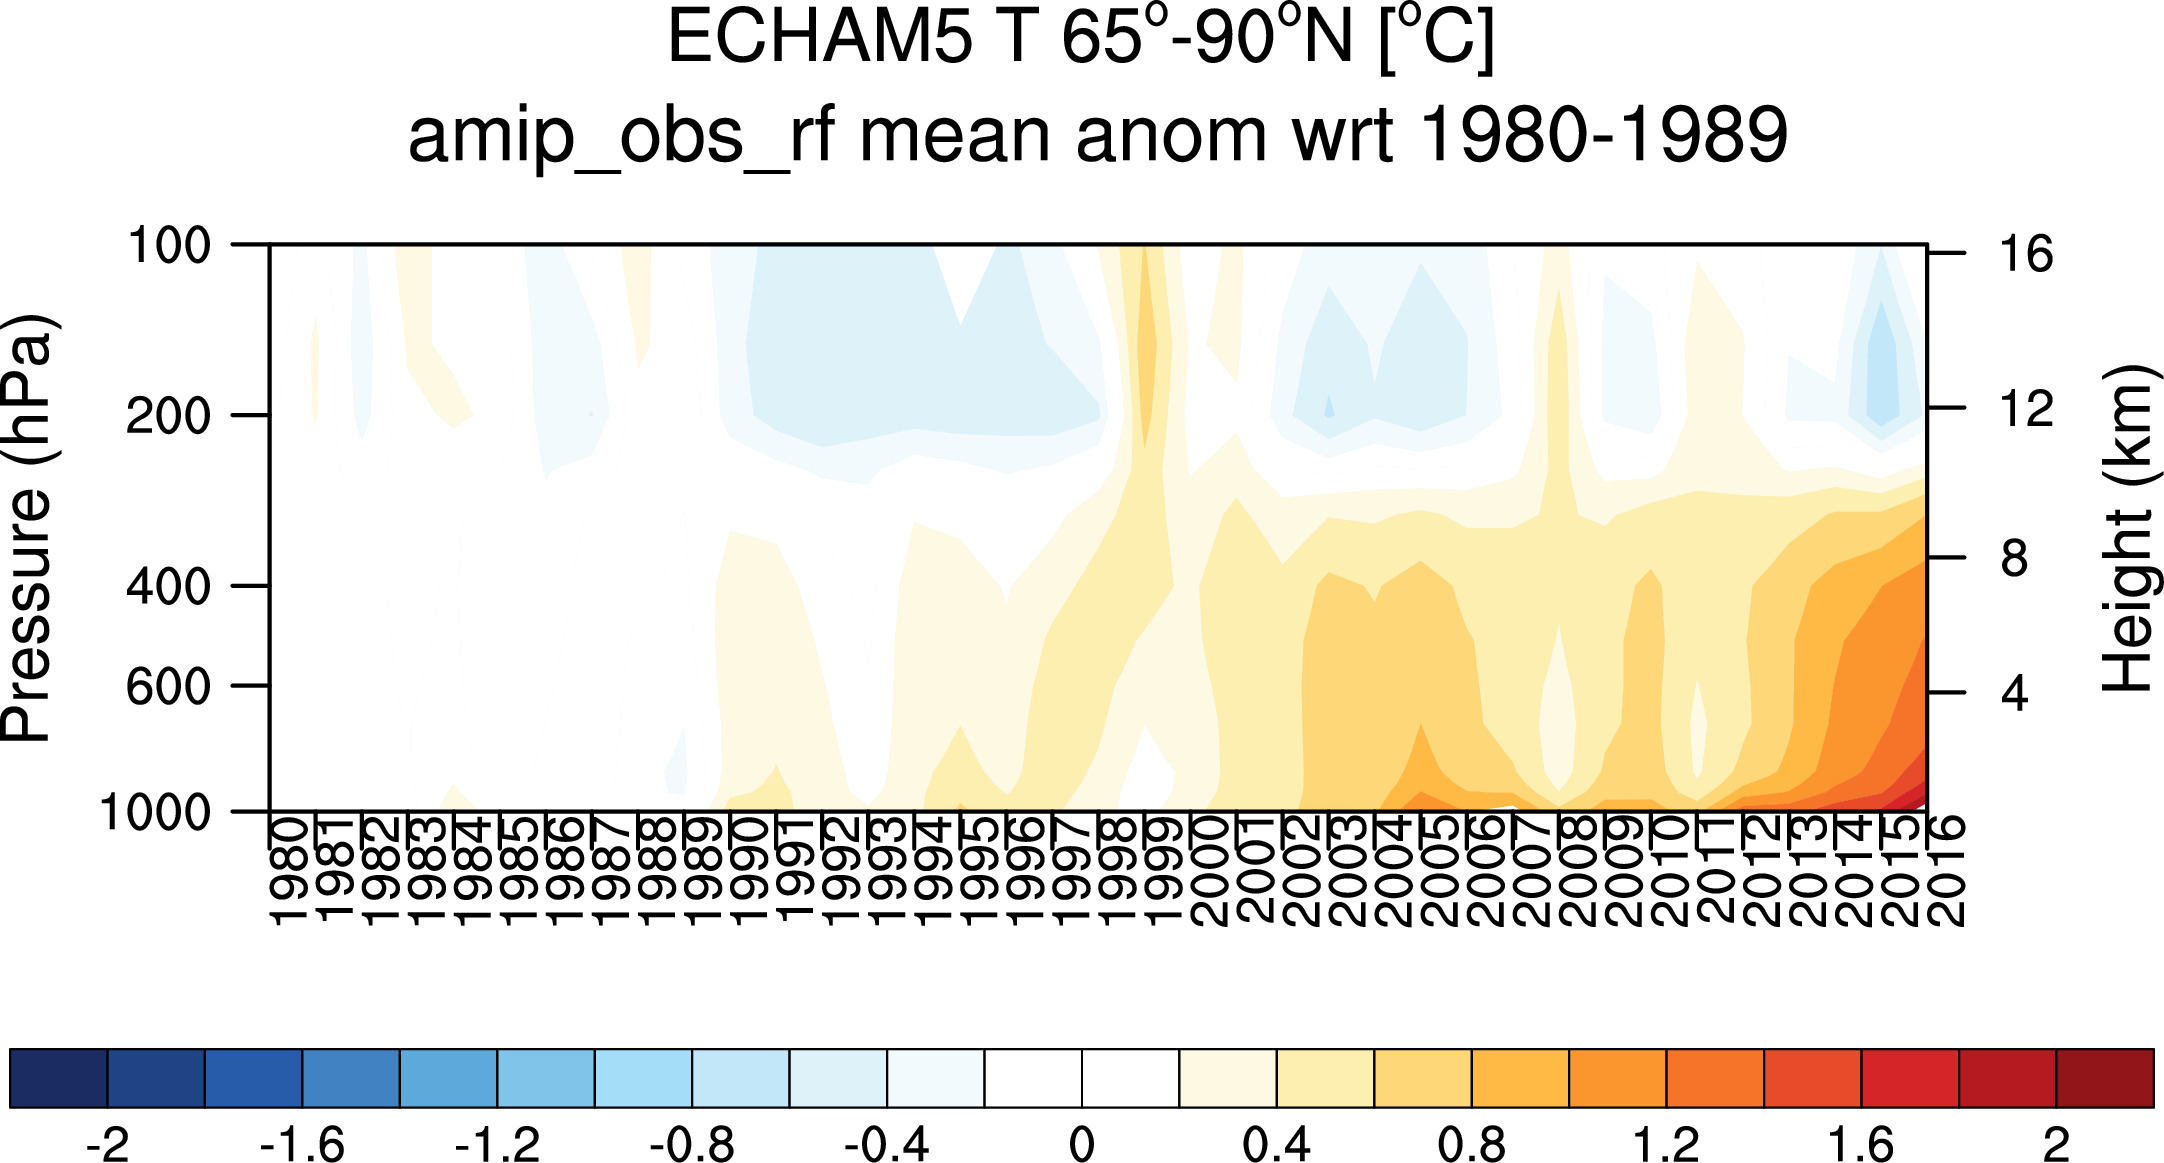
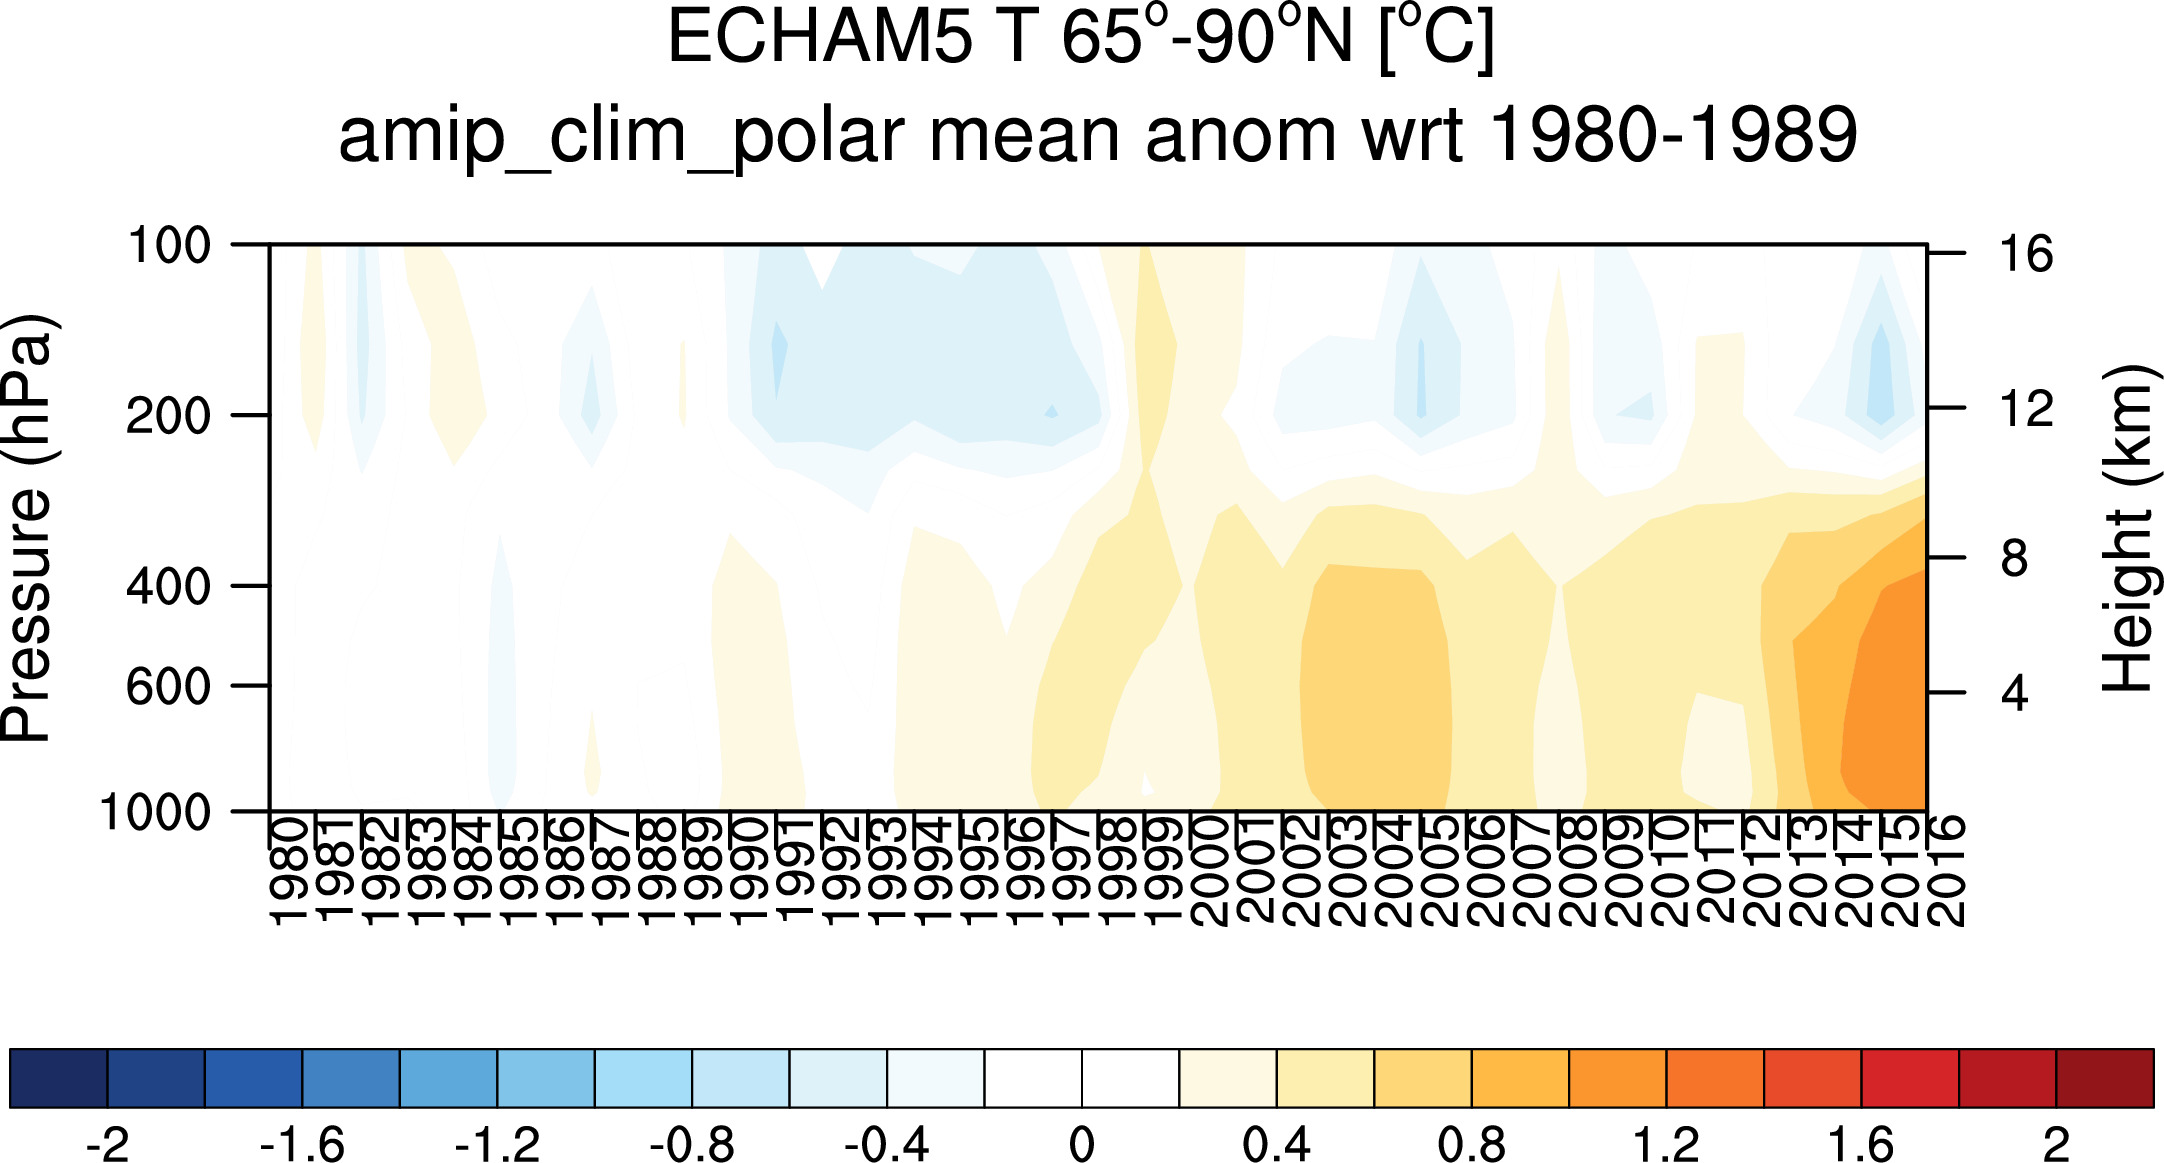
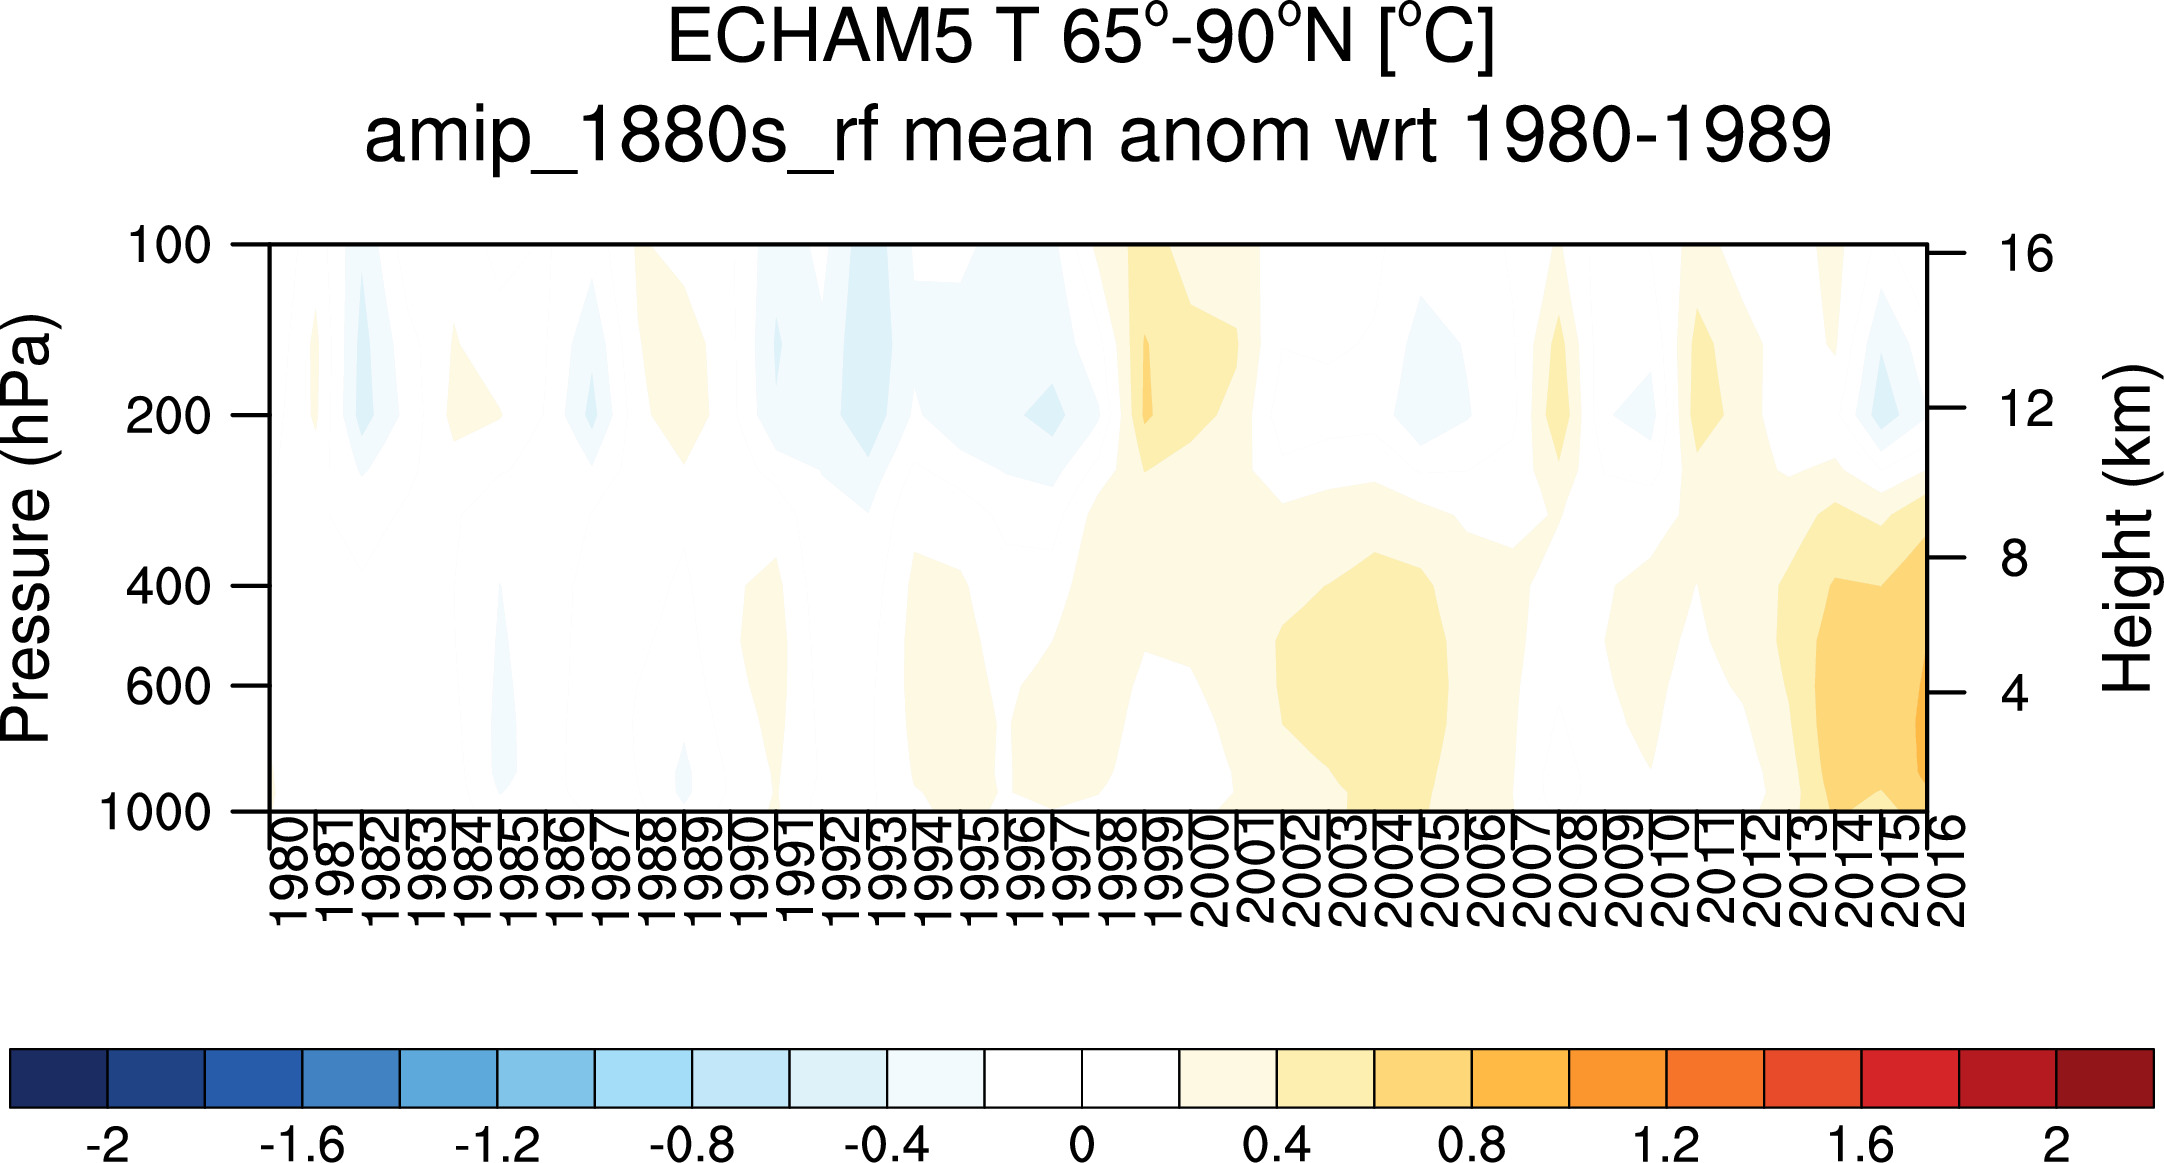
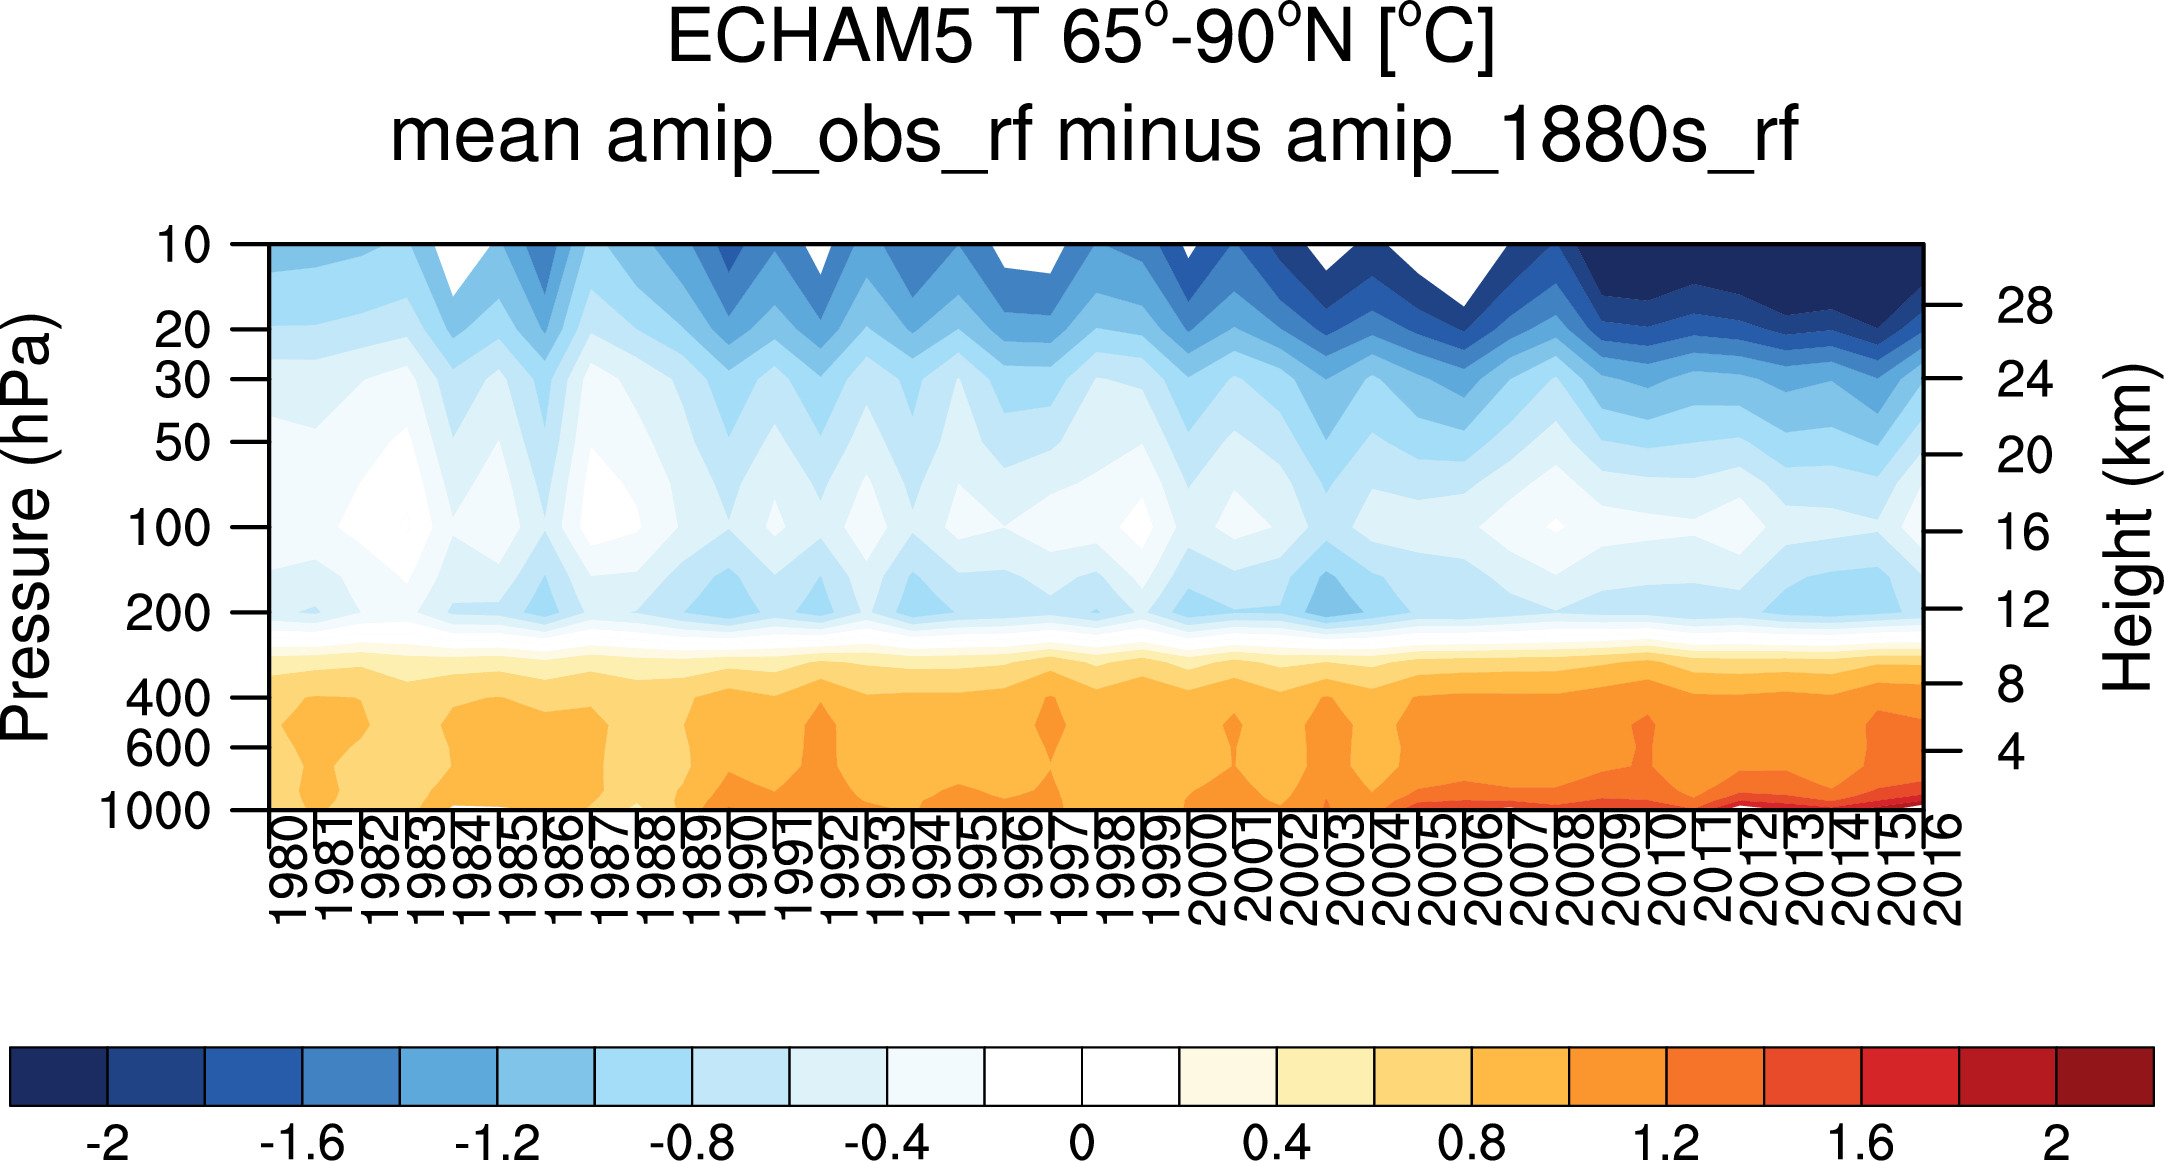
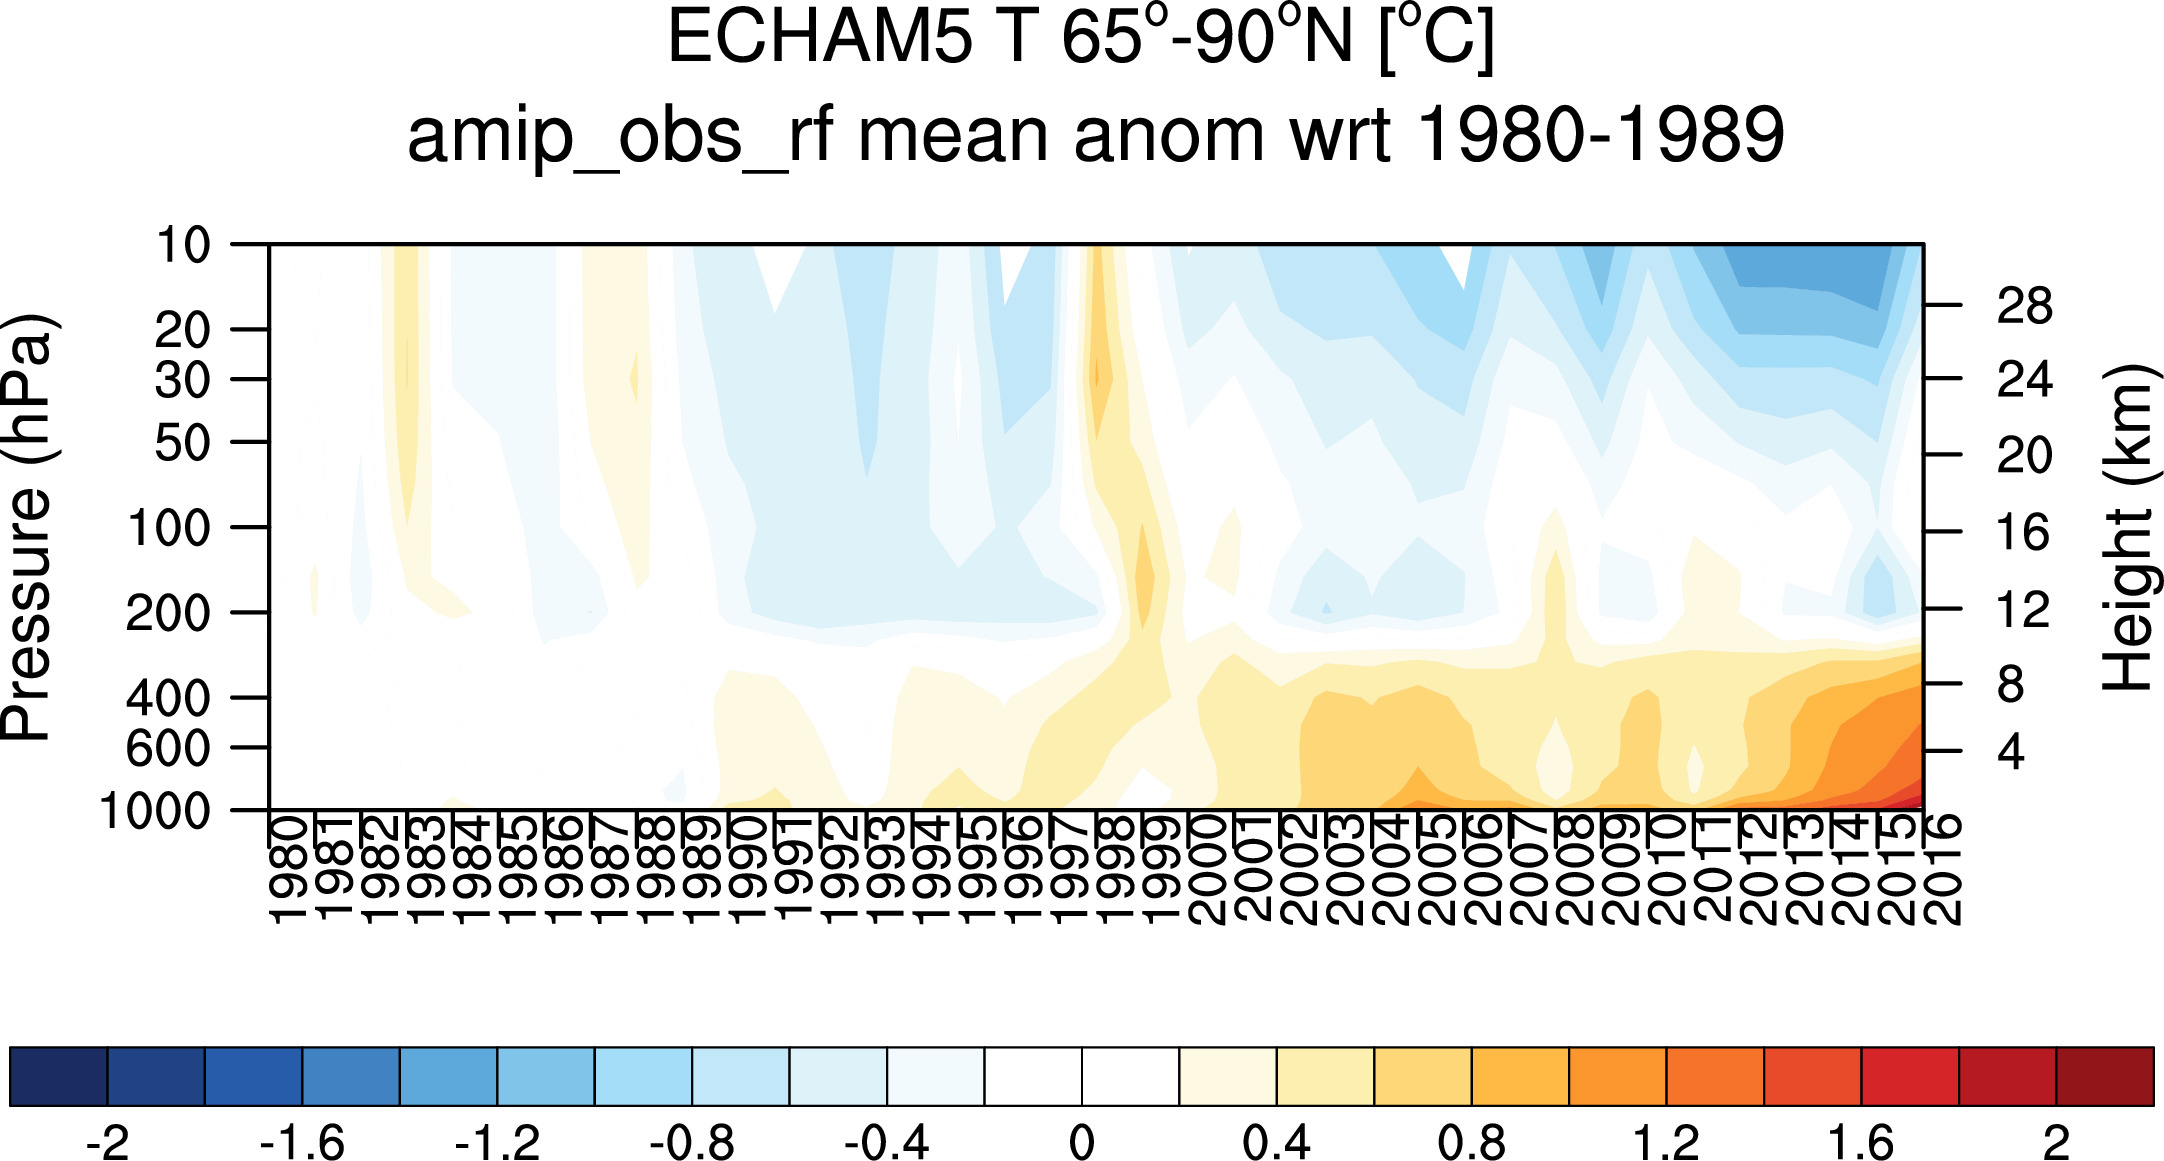
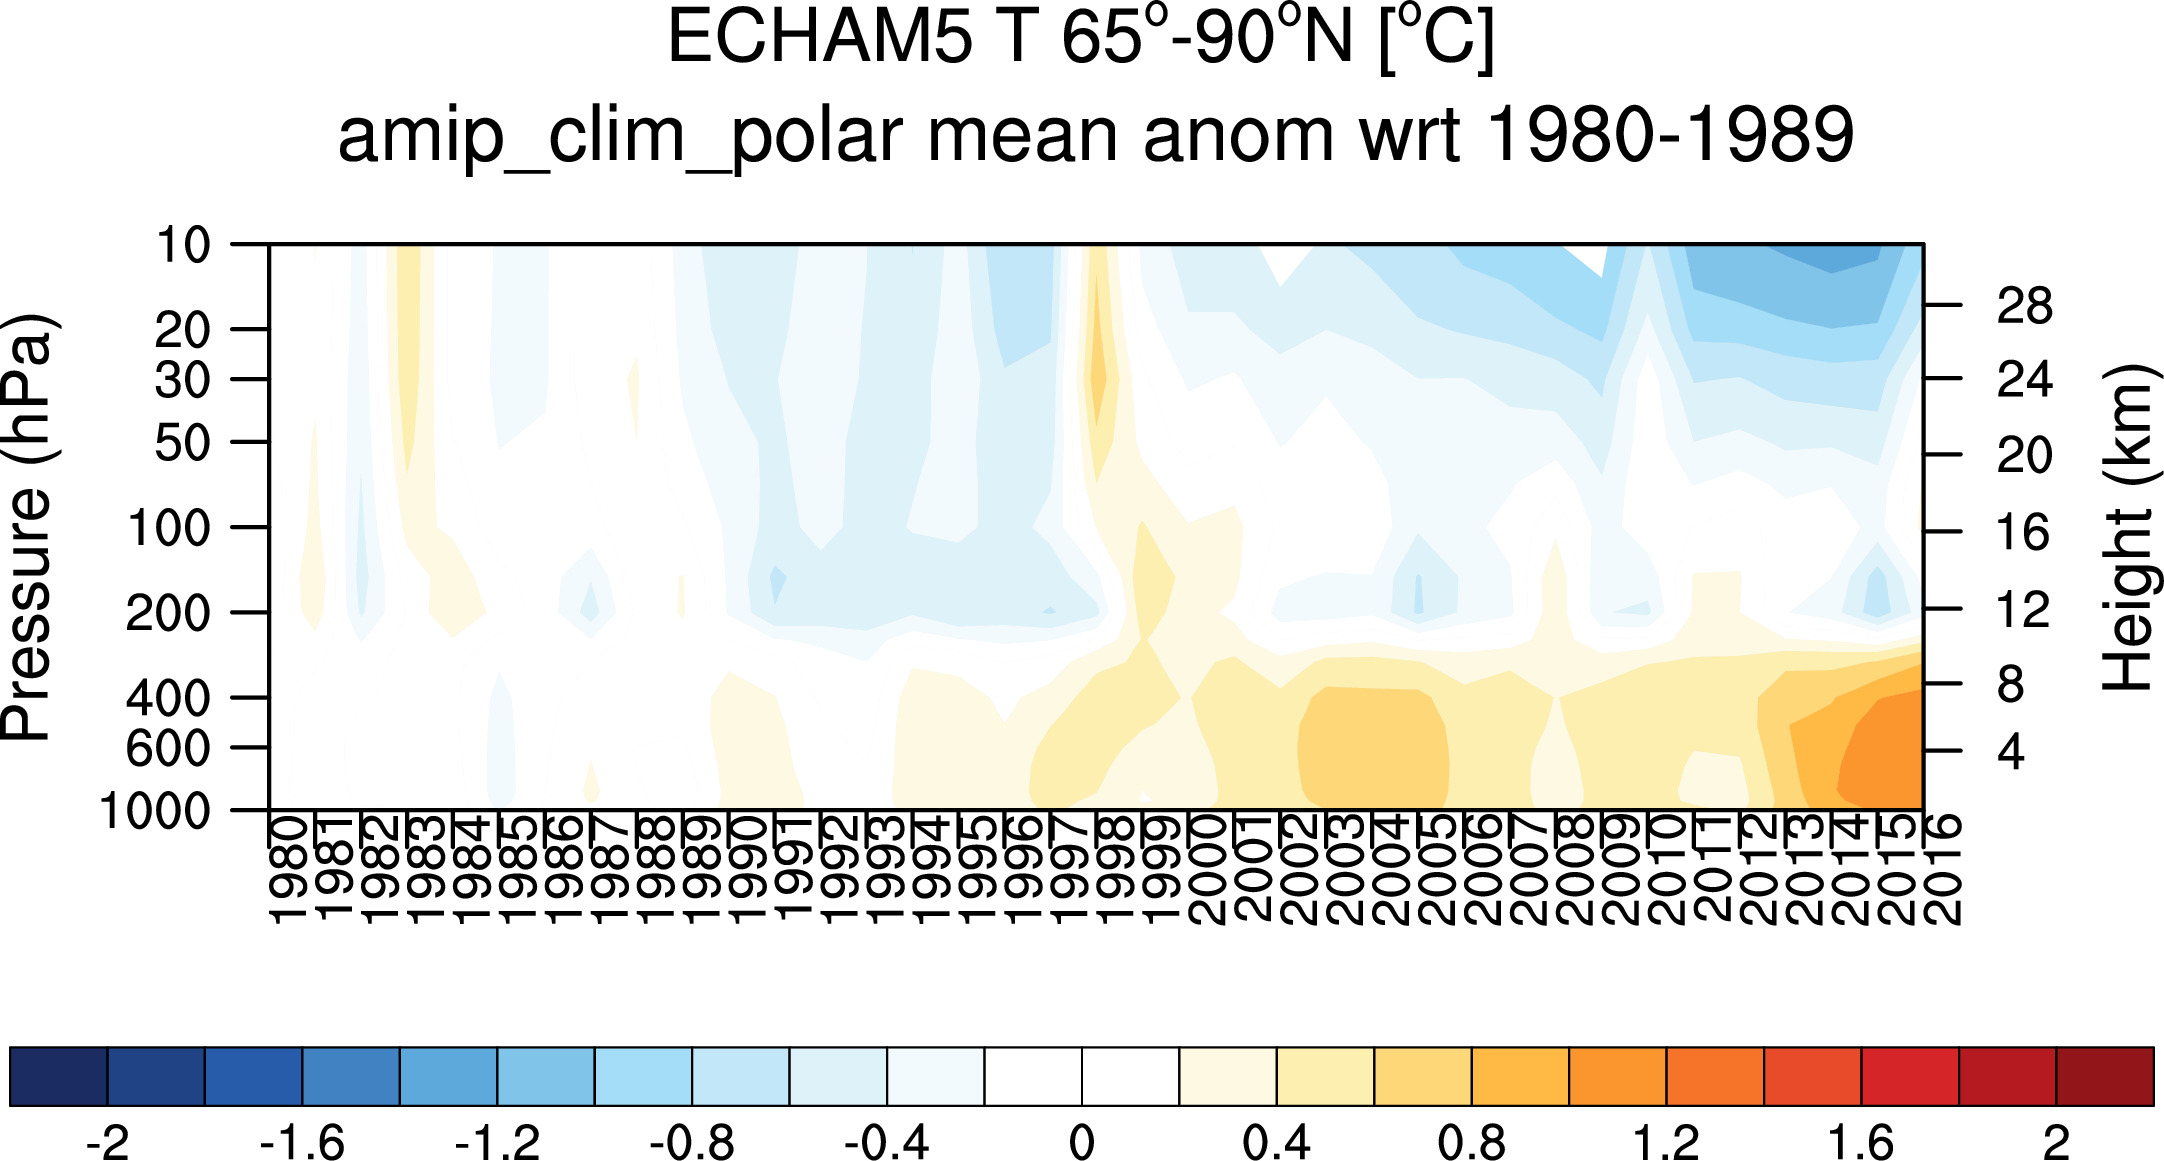
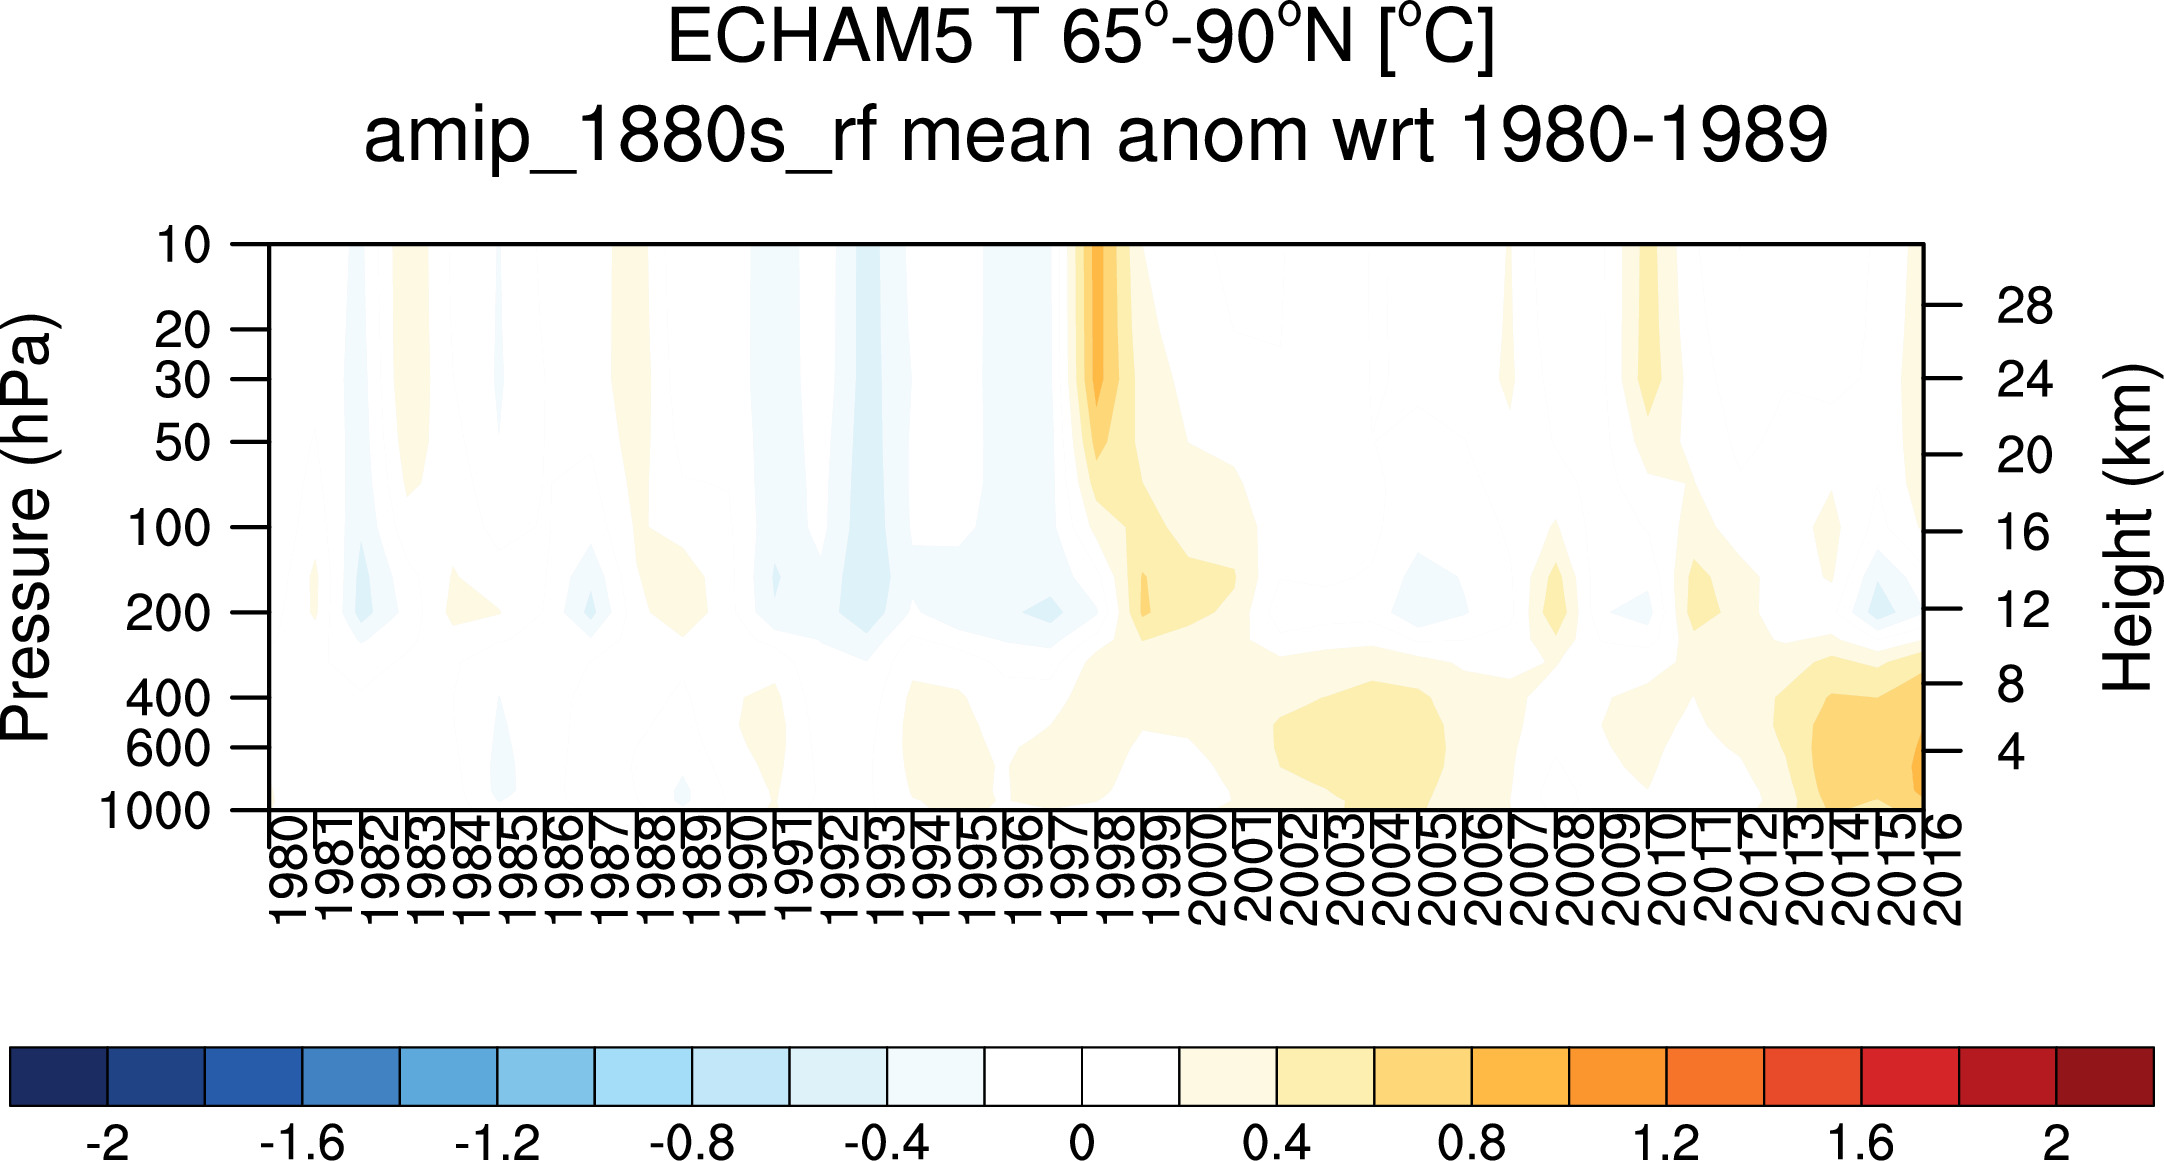
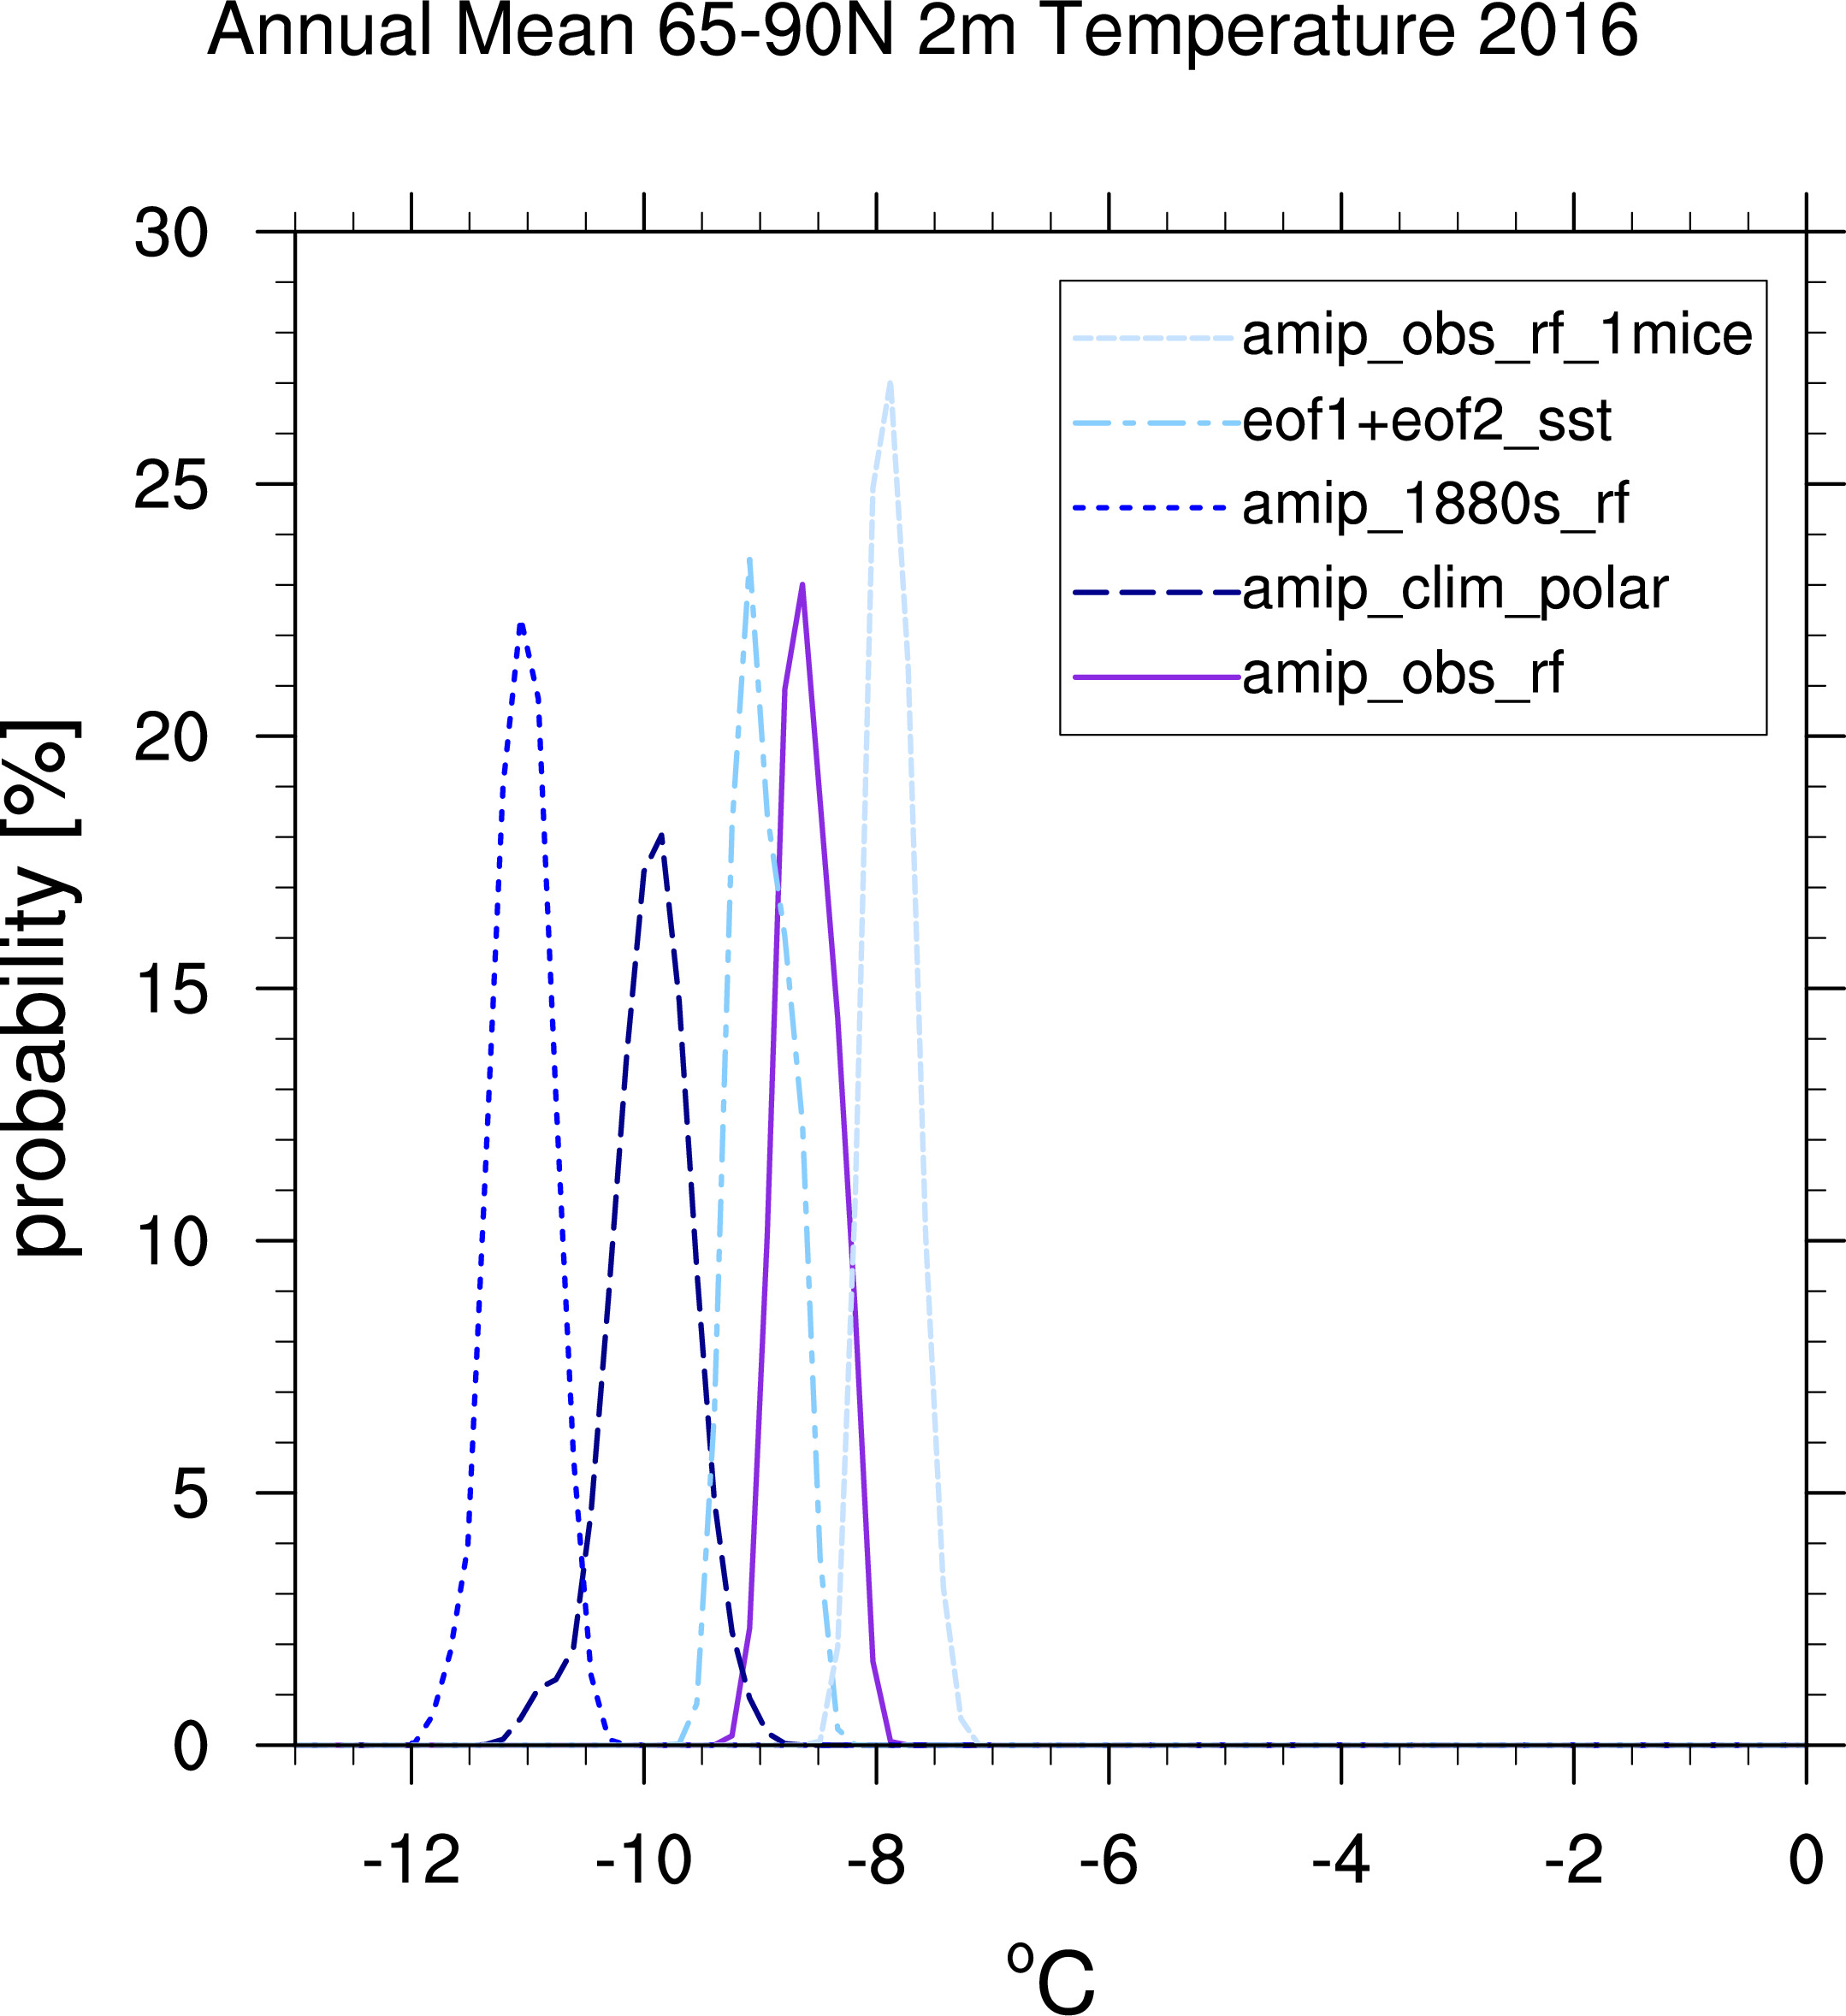
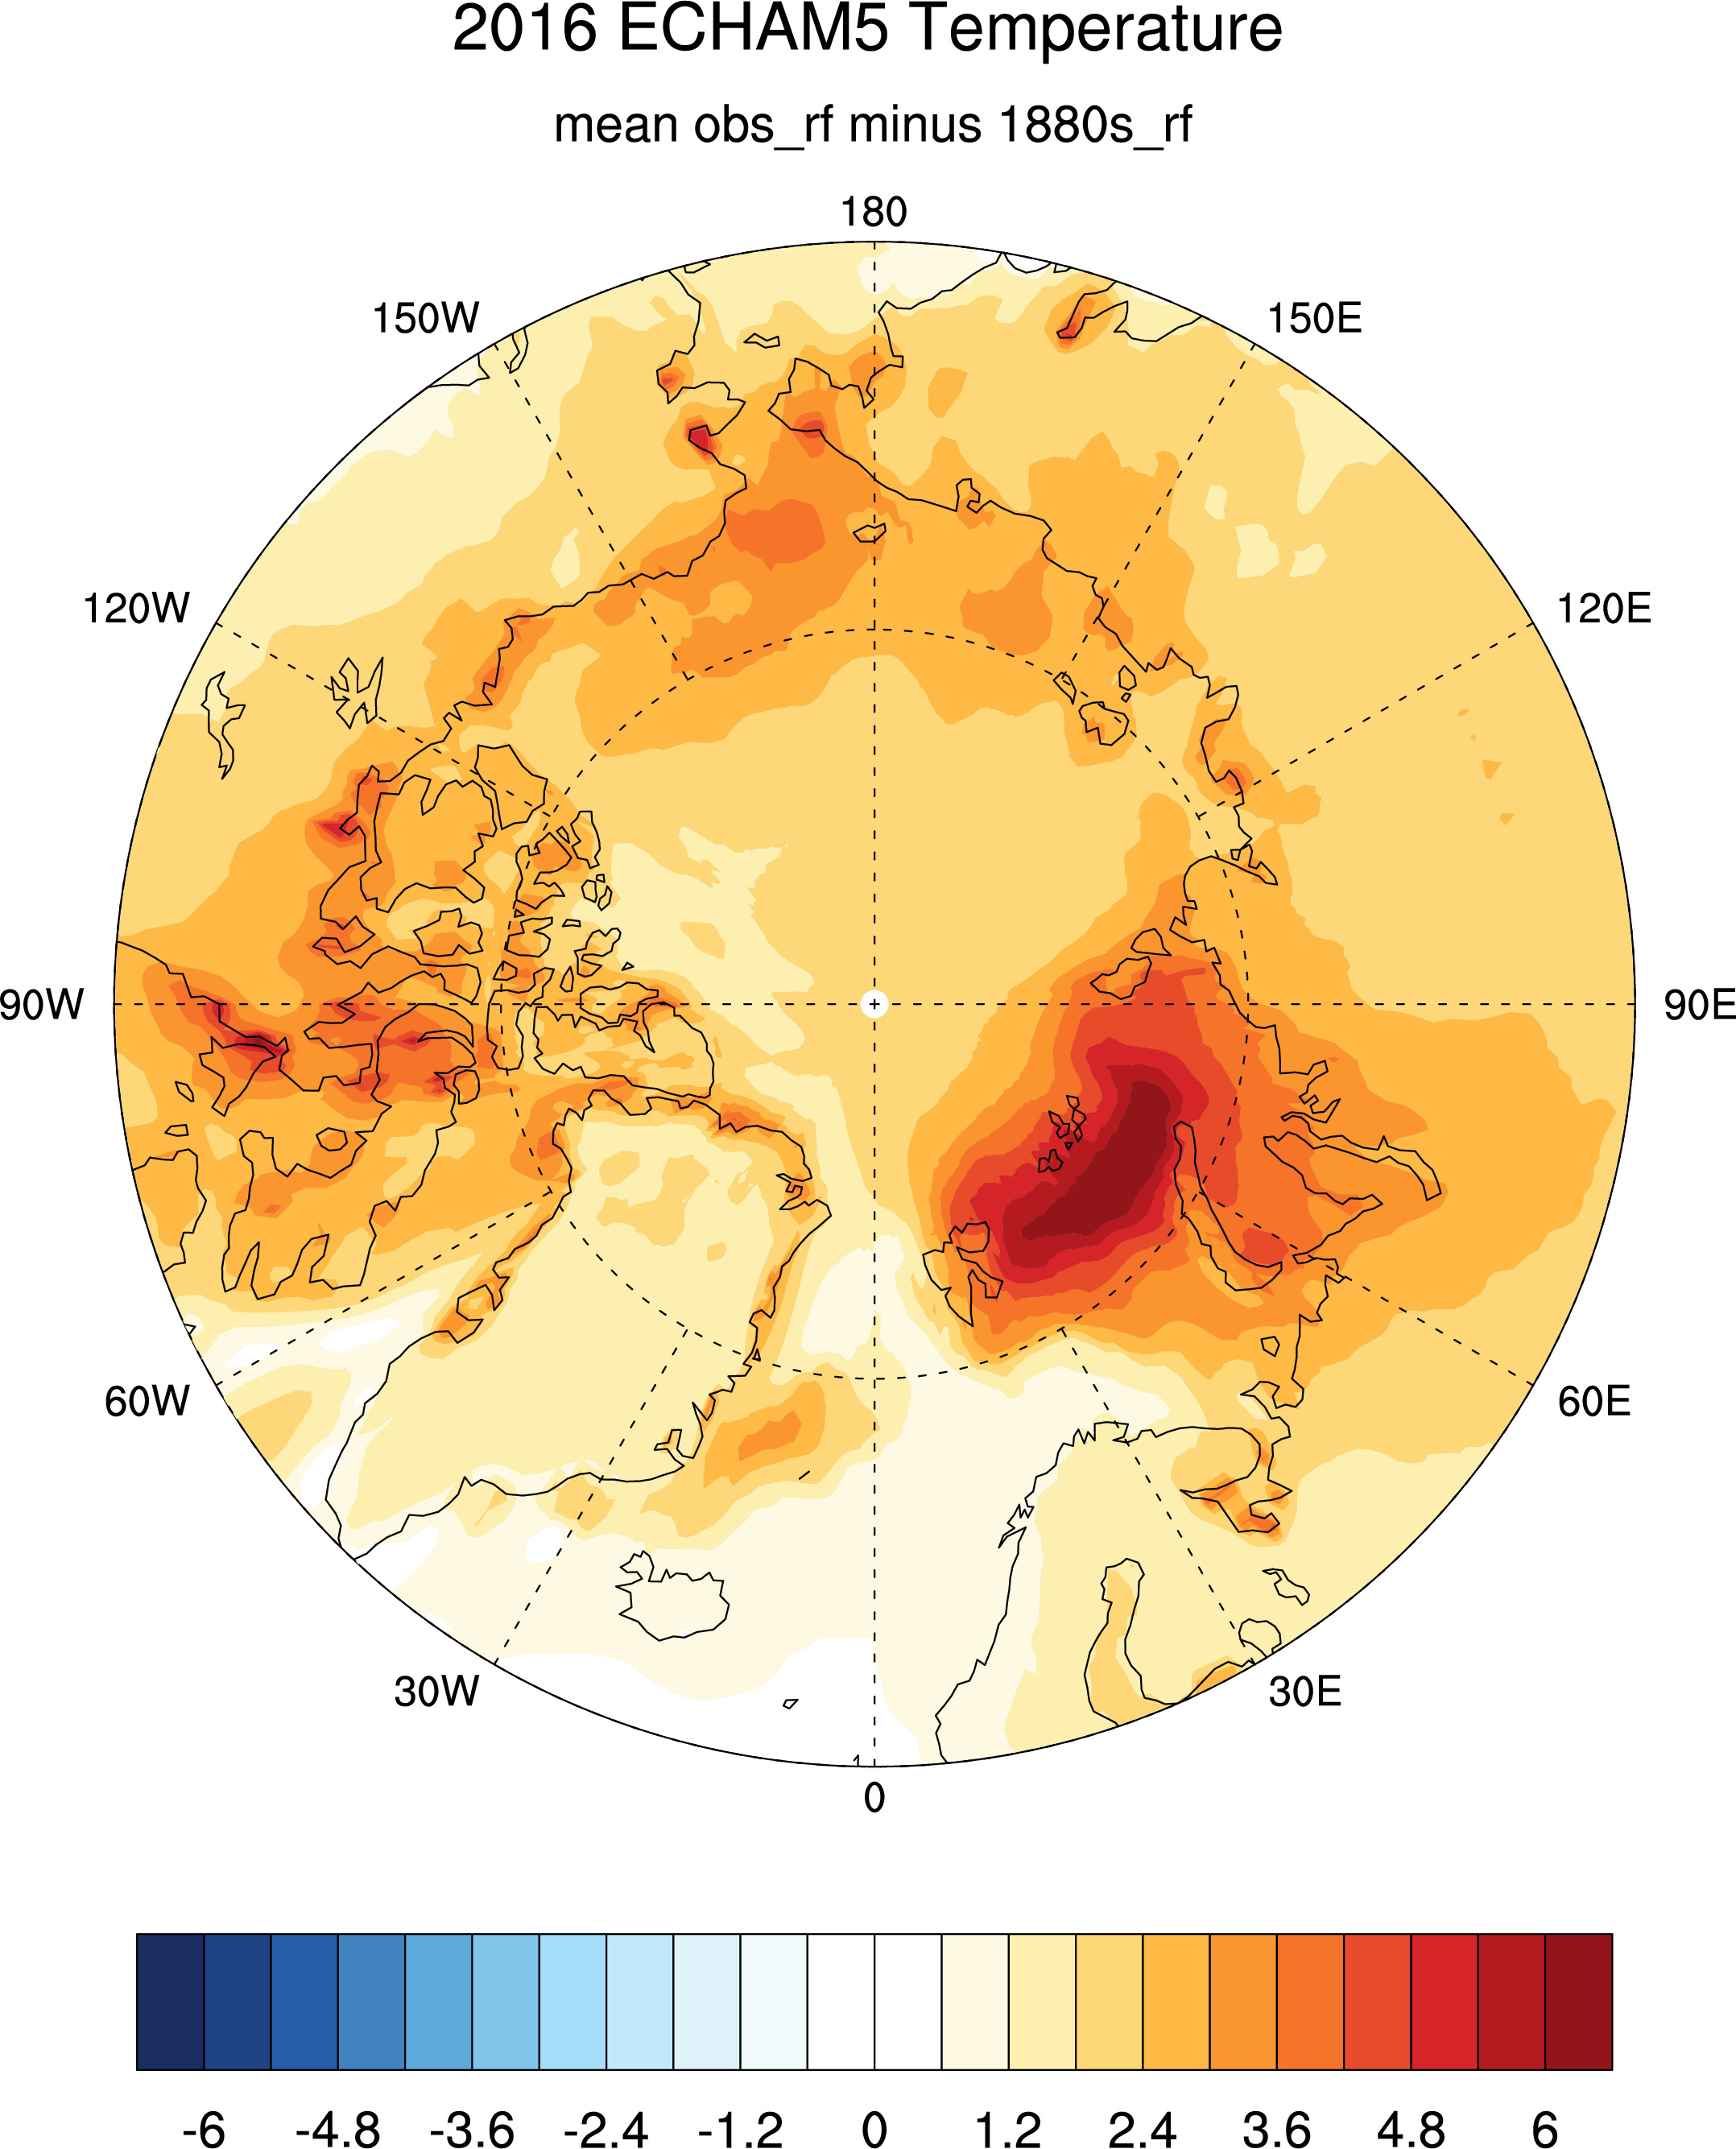
ECHAM5 results:
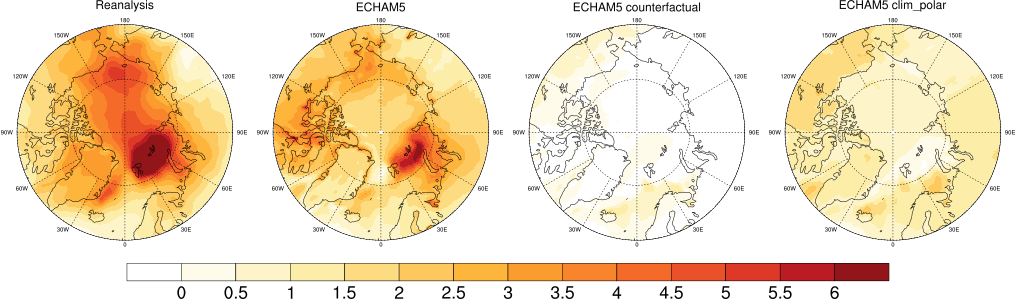
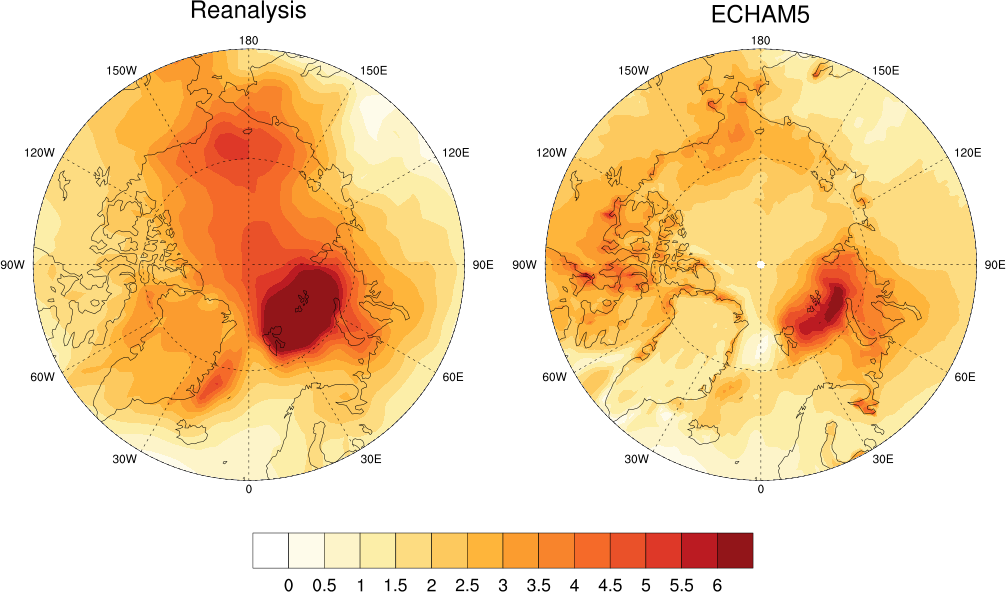
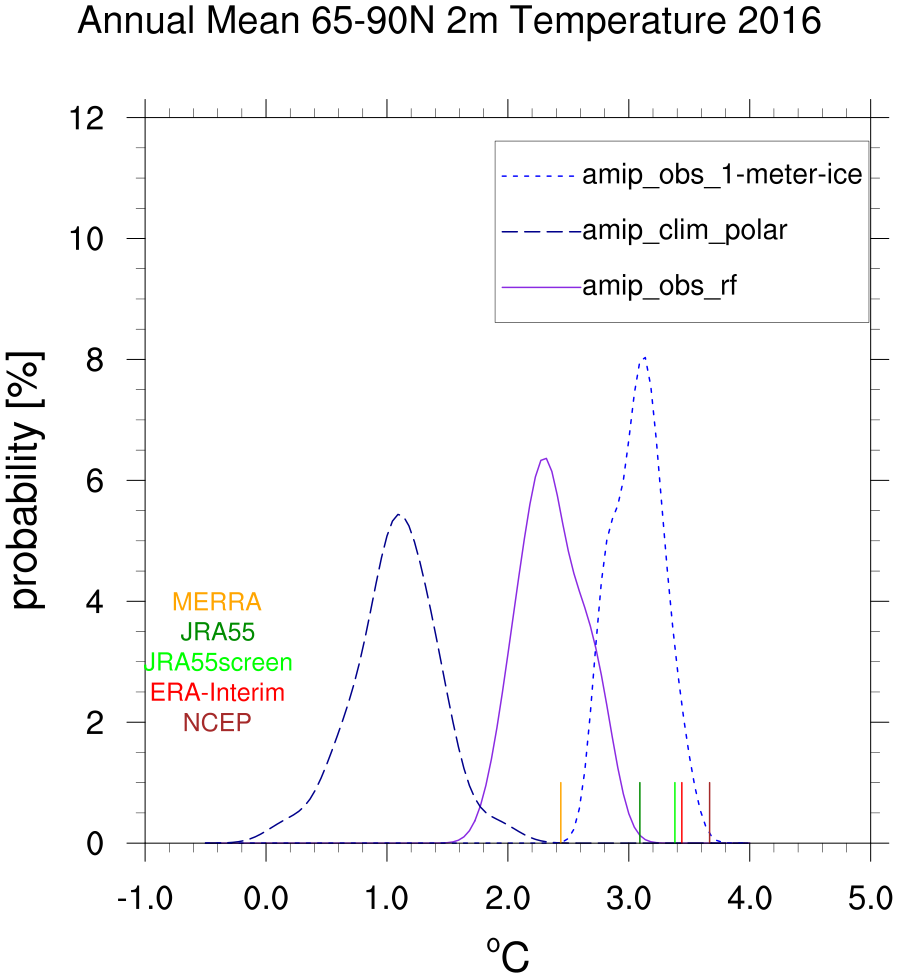
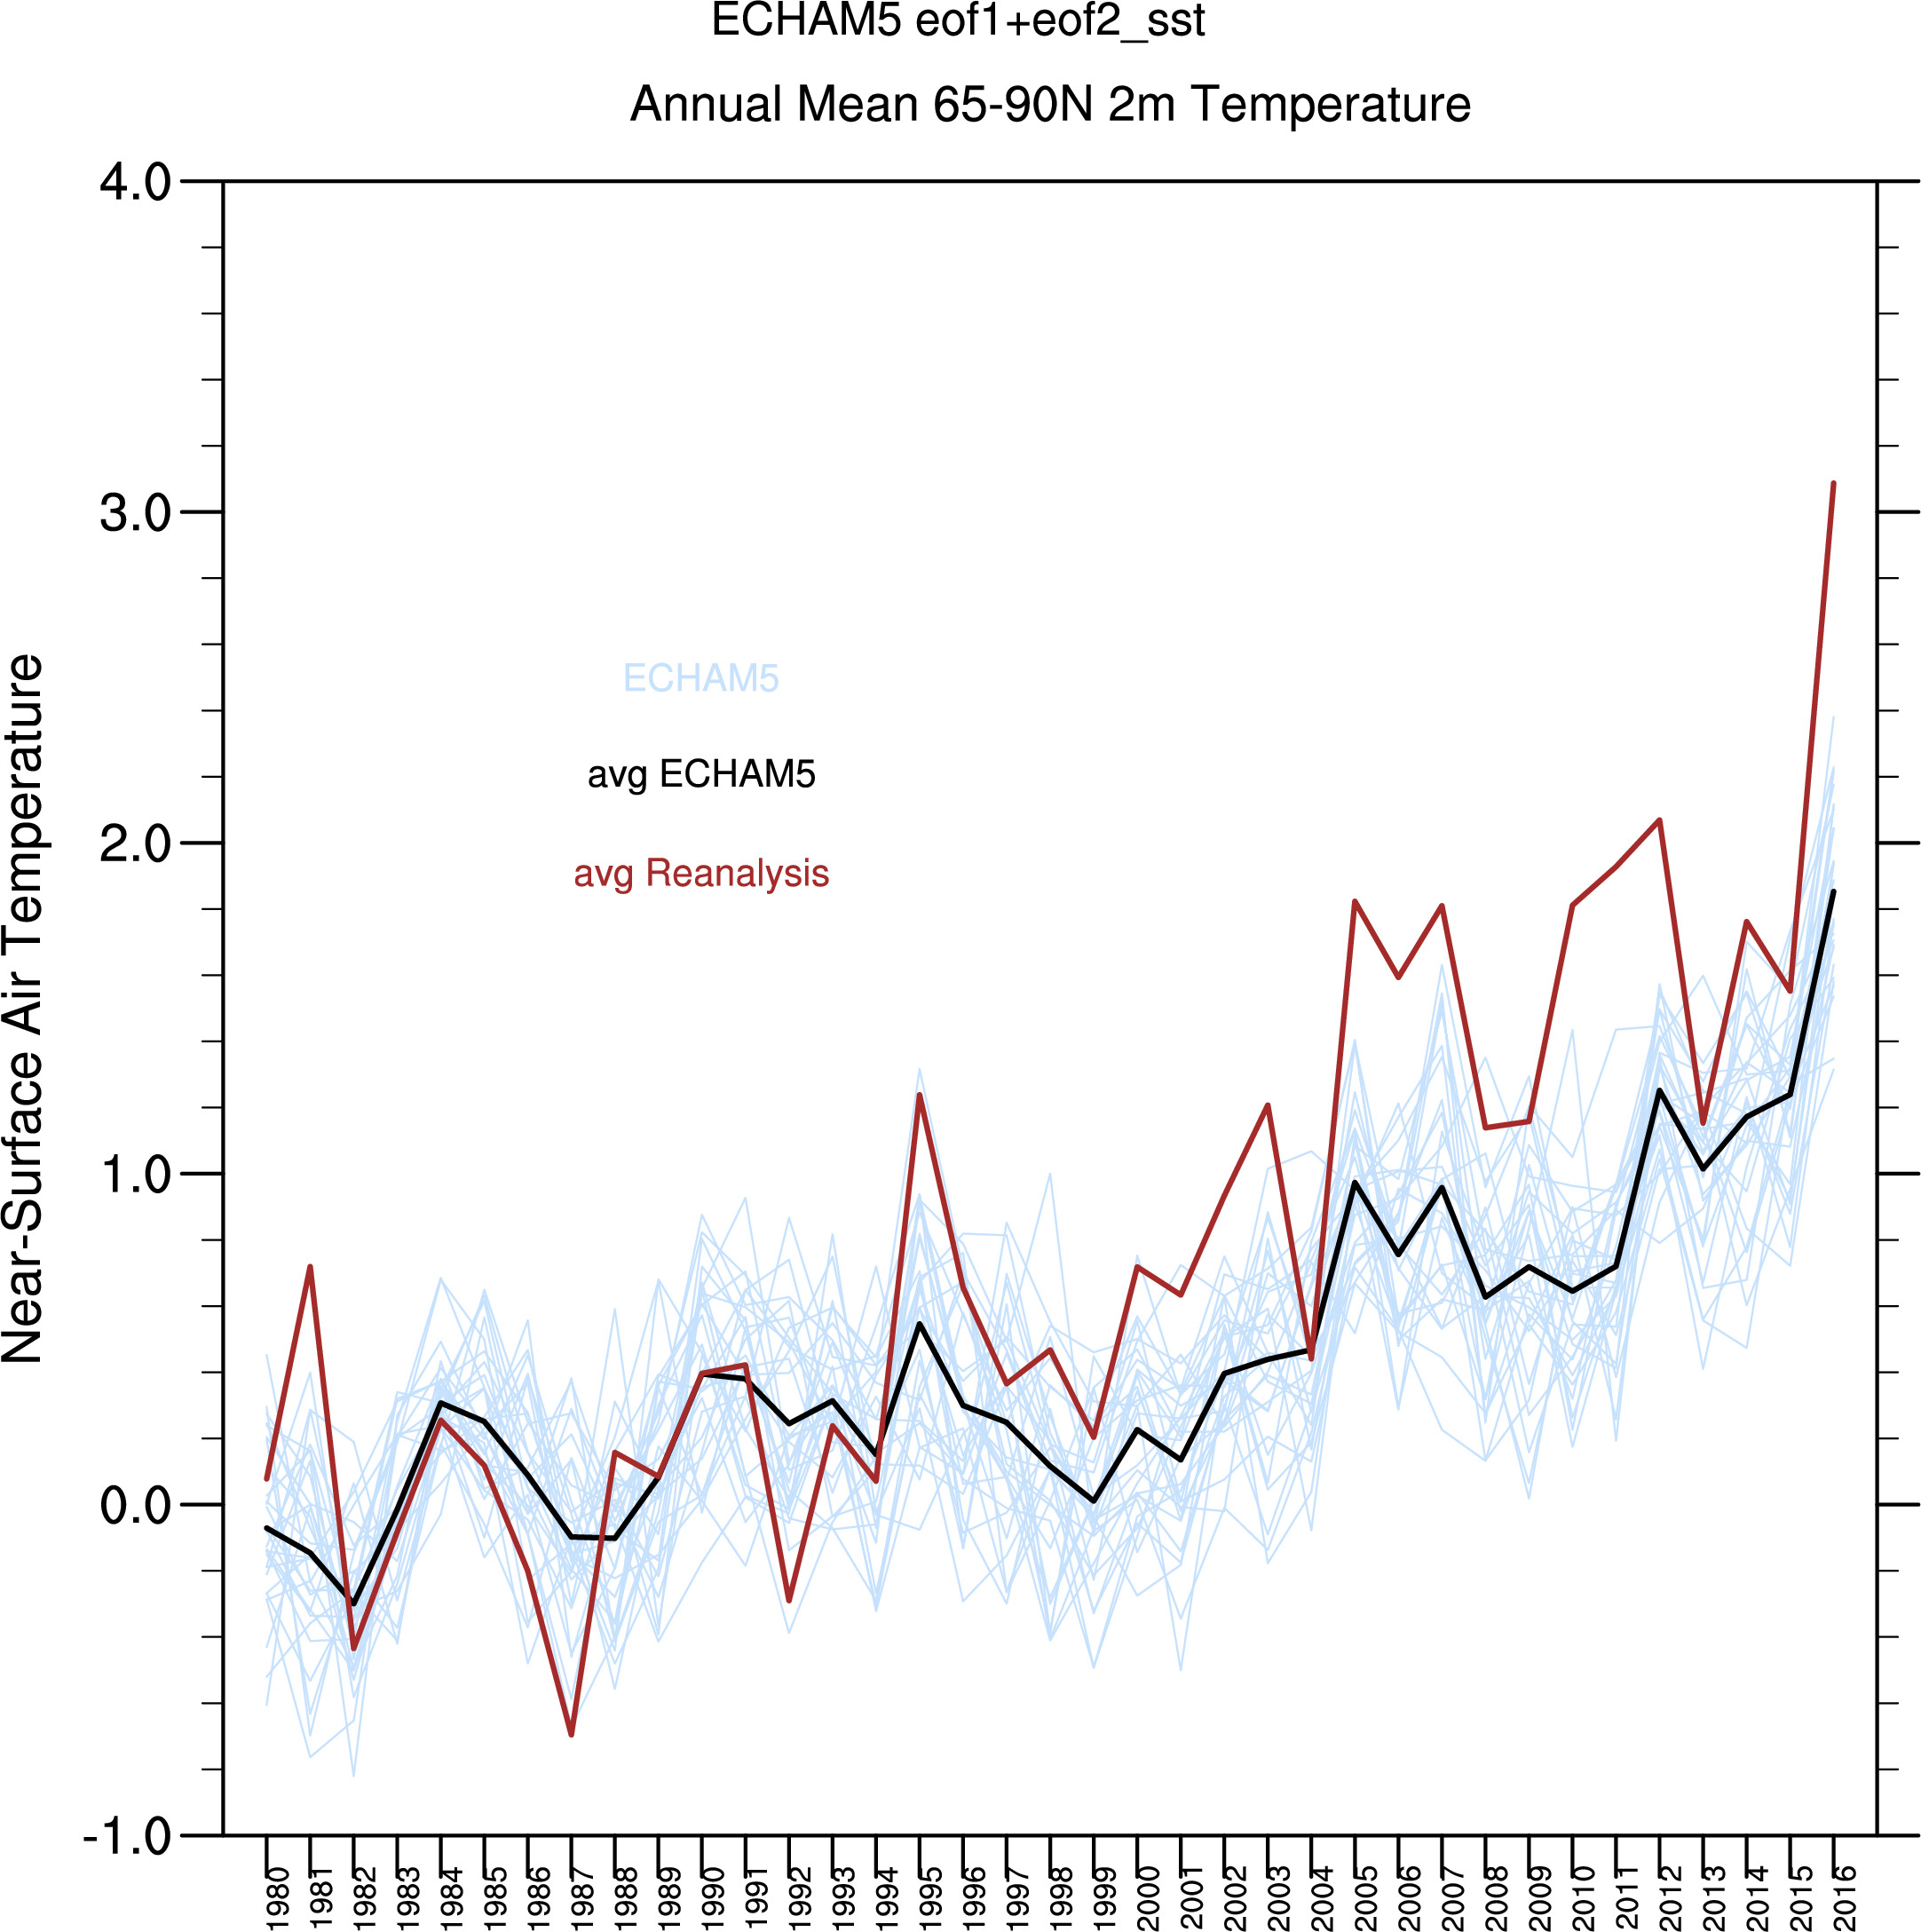
Re. Figure 1:
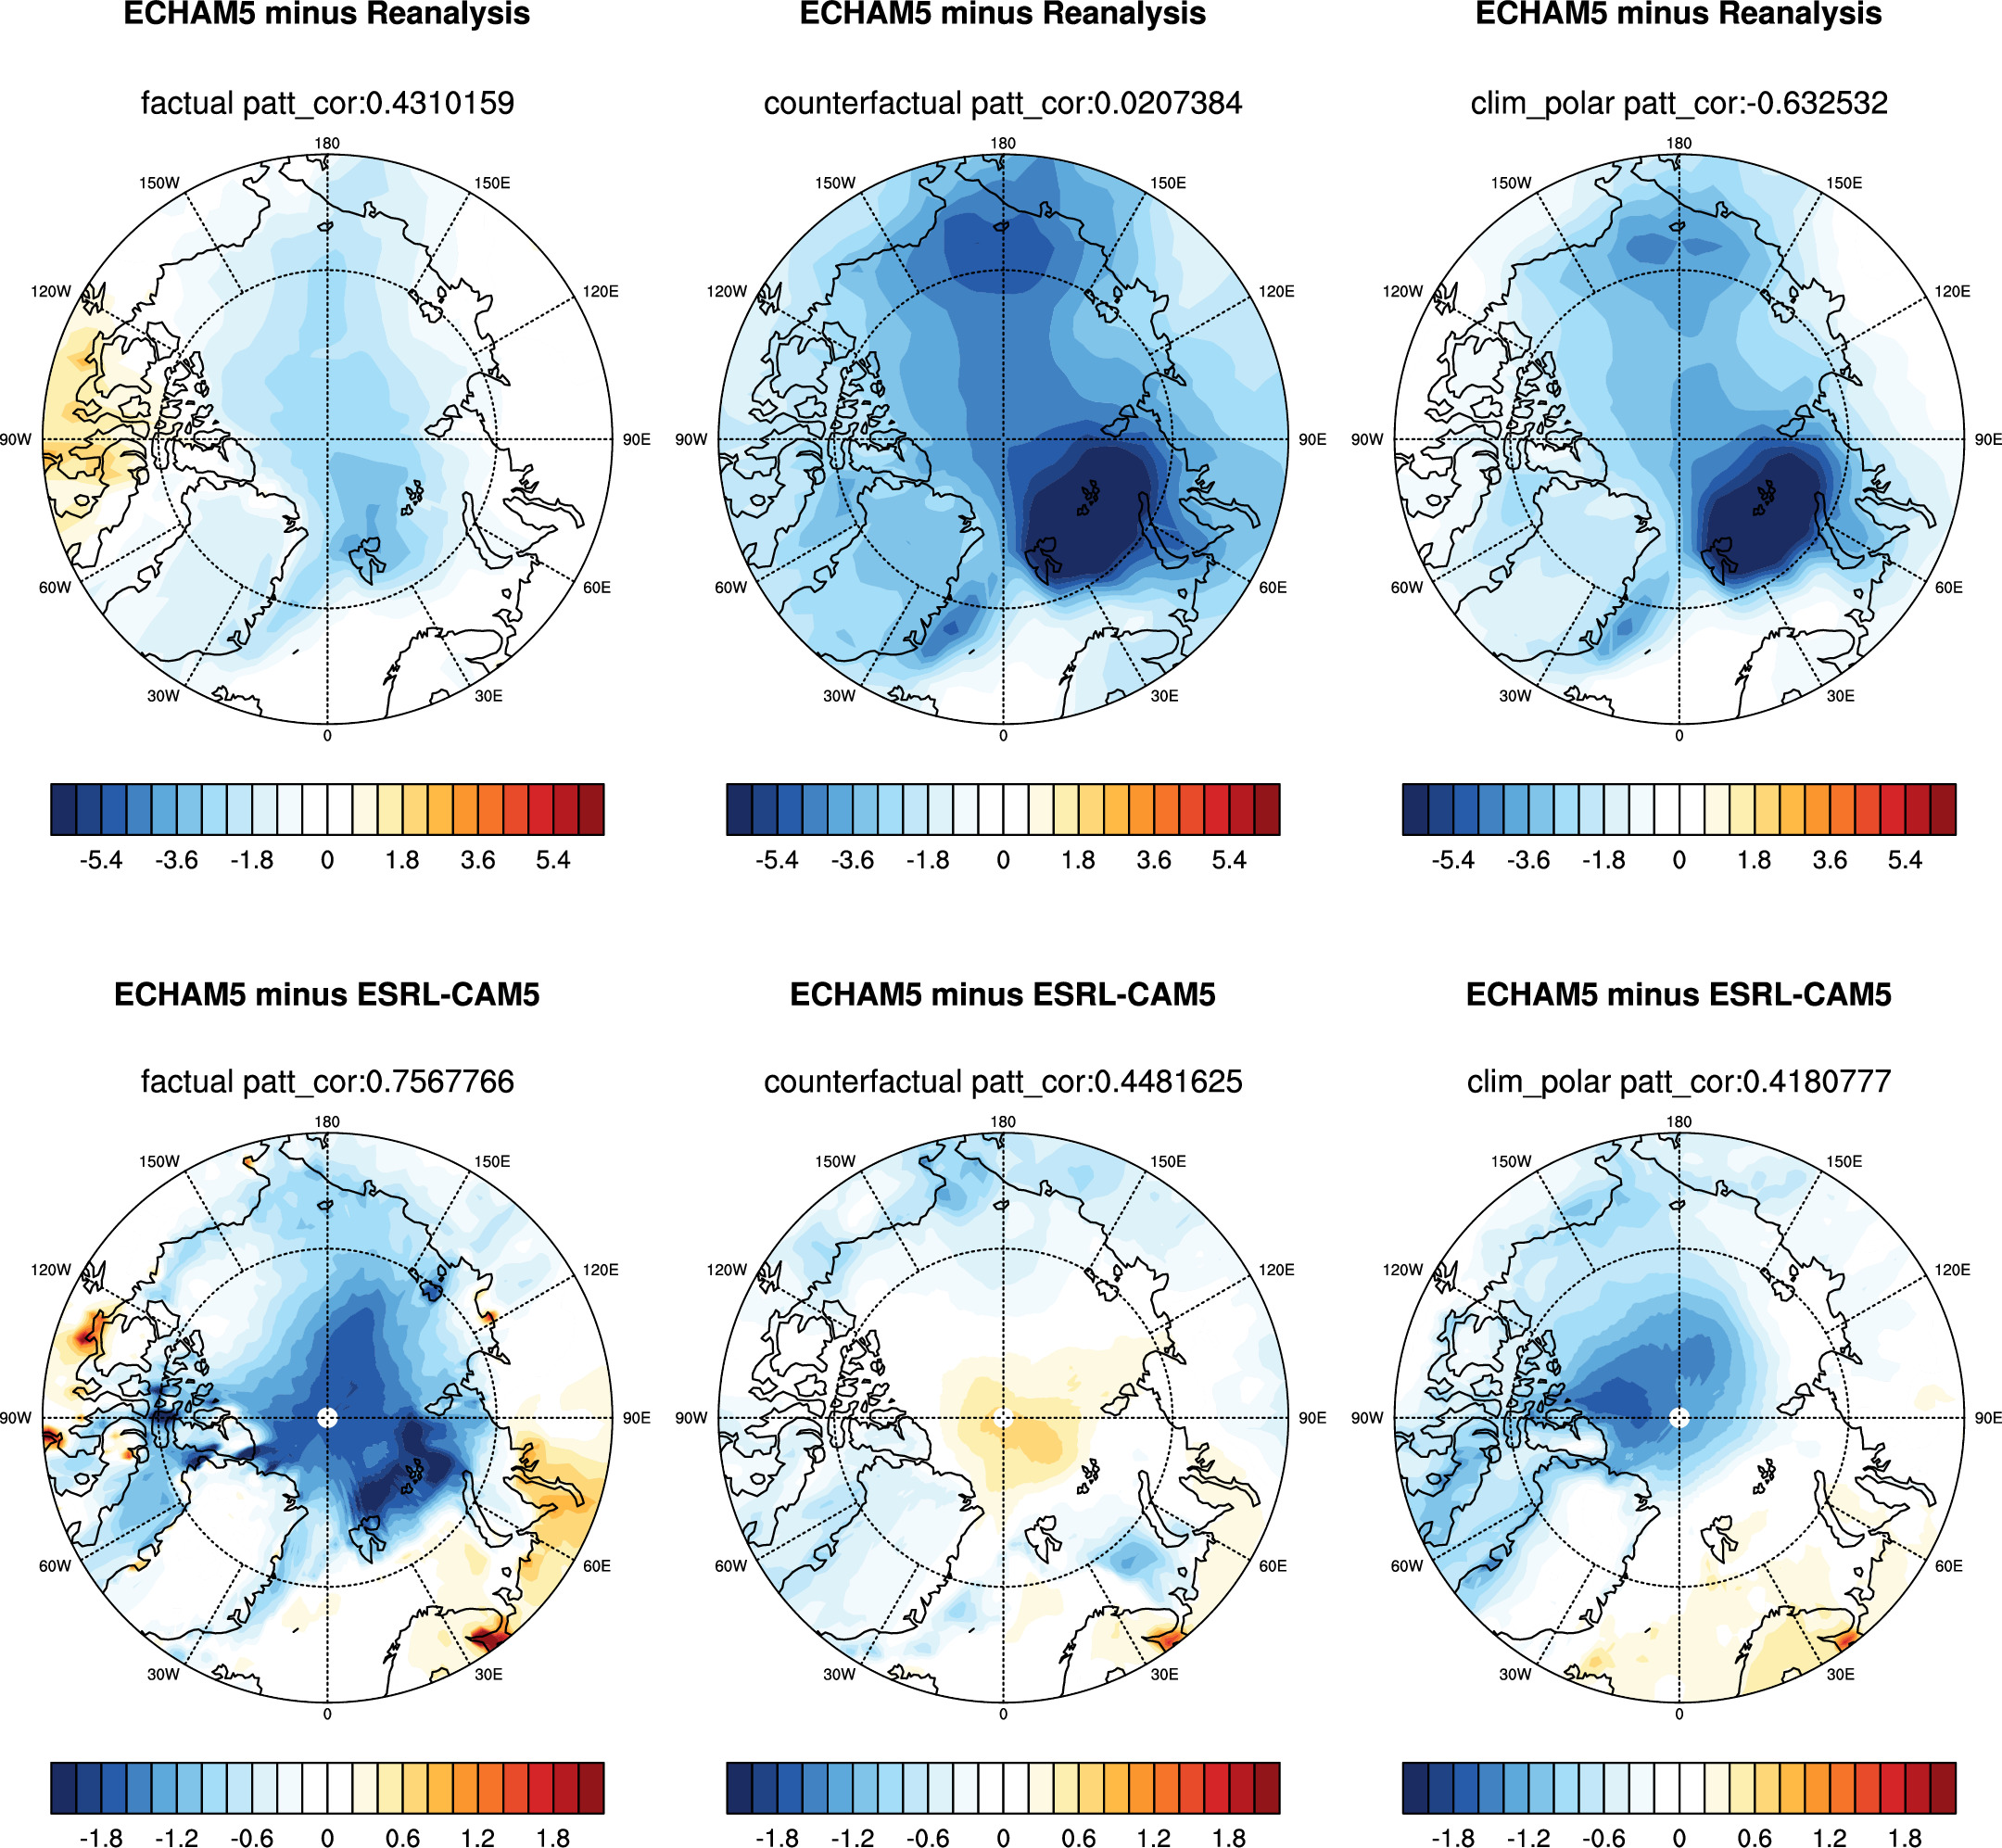
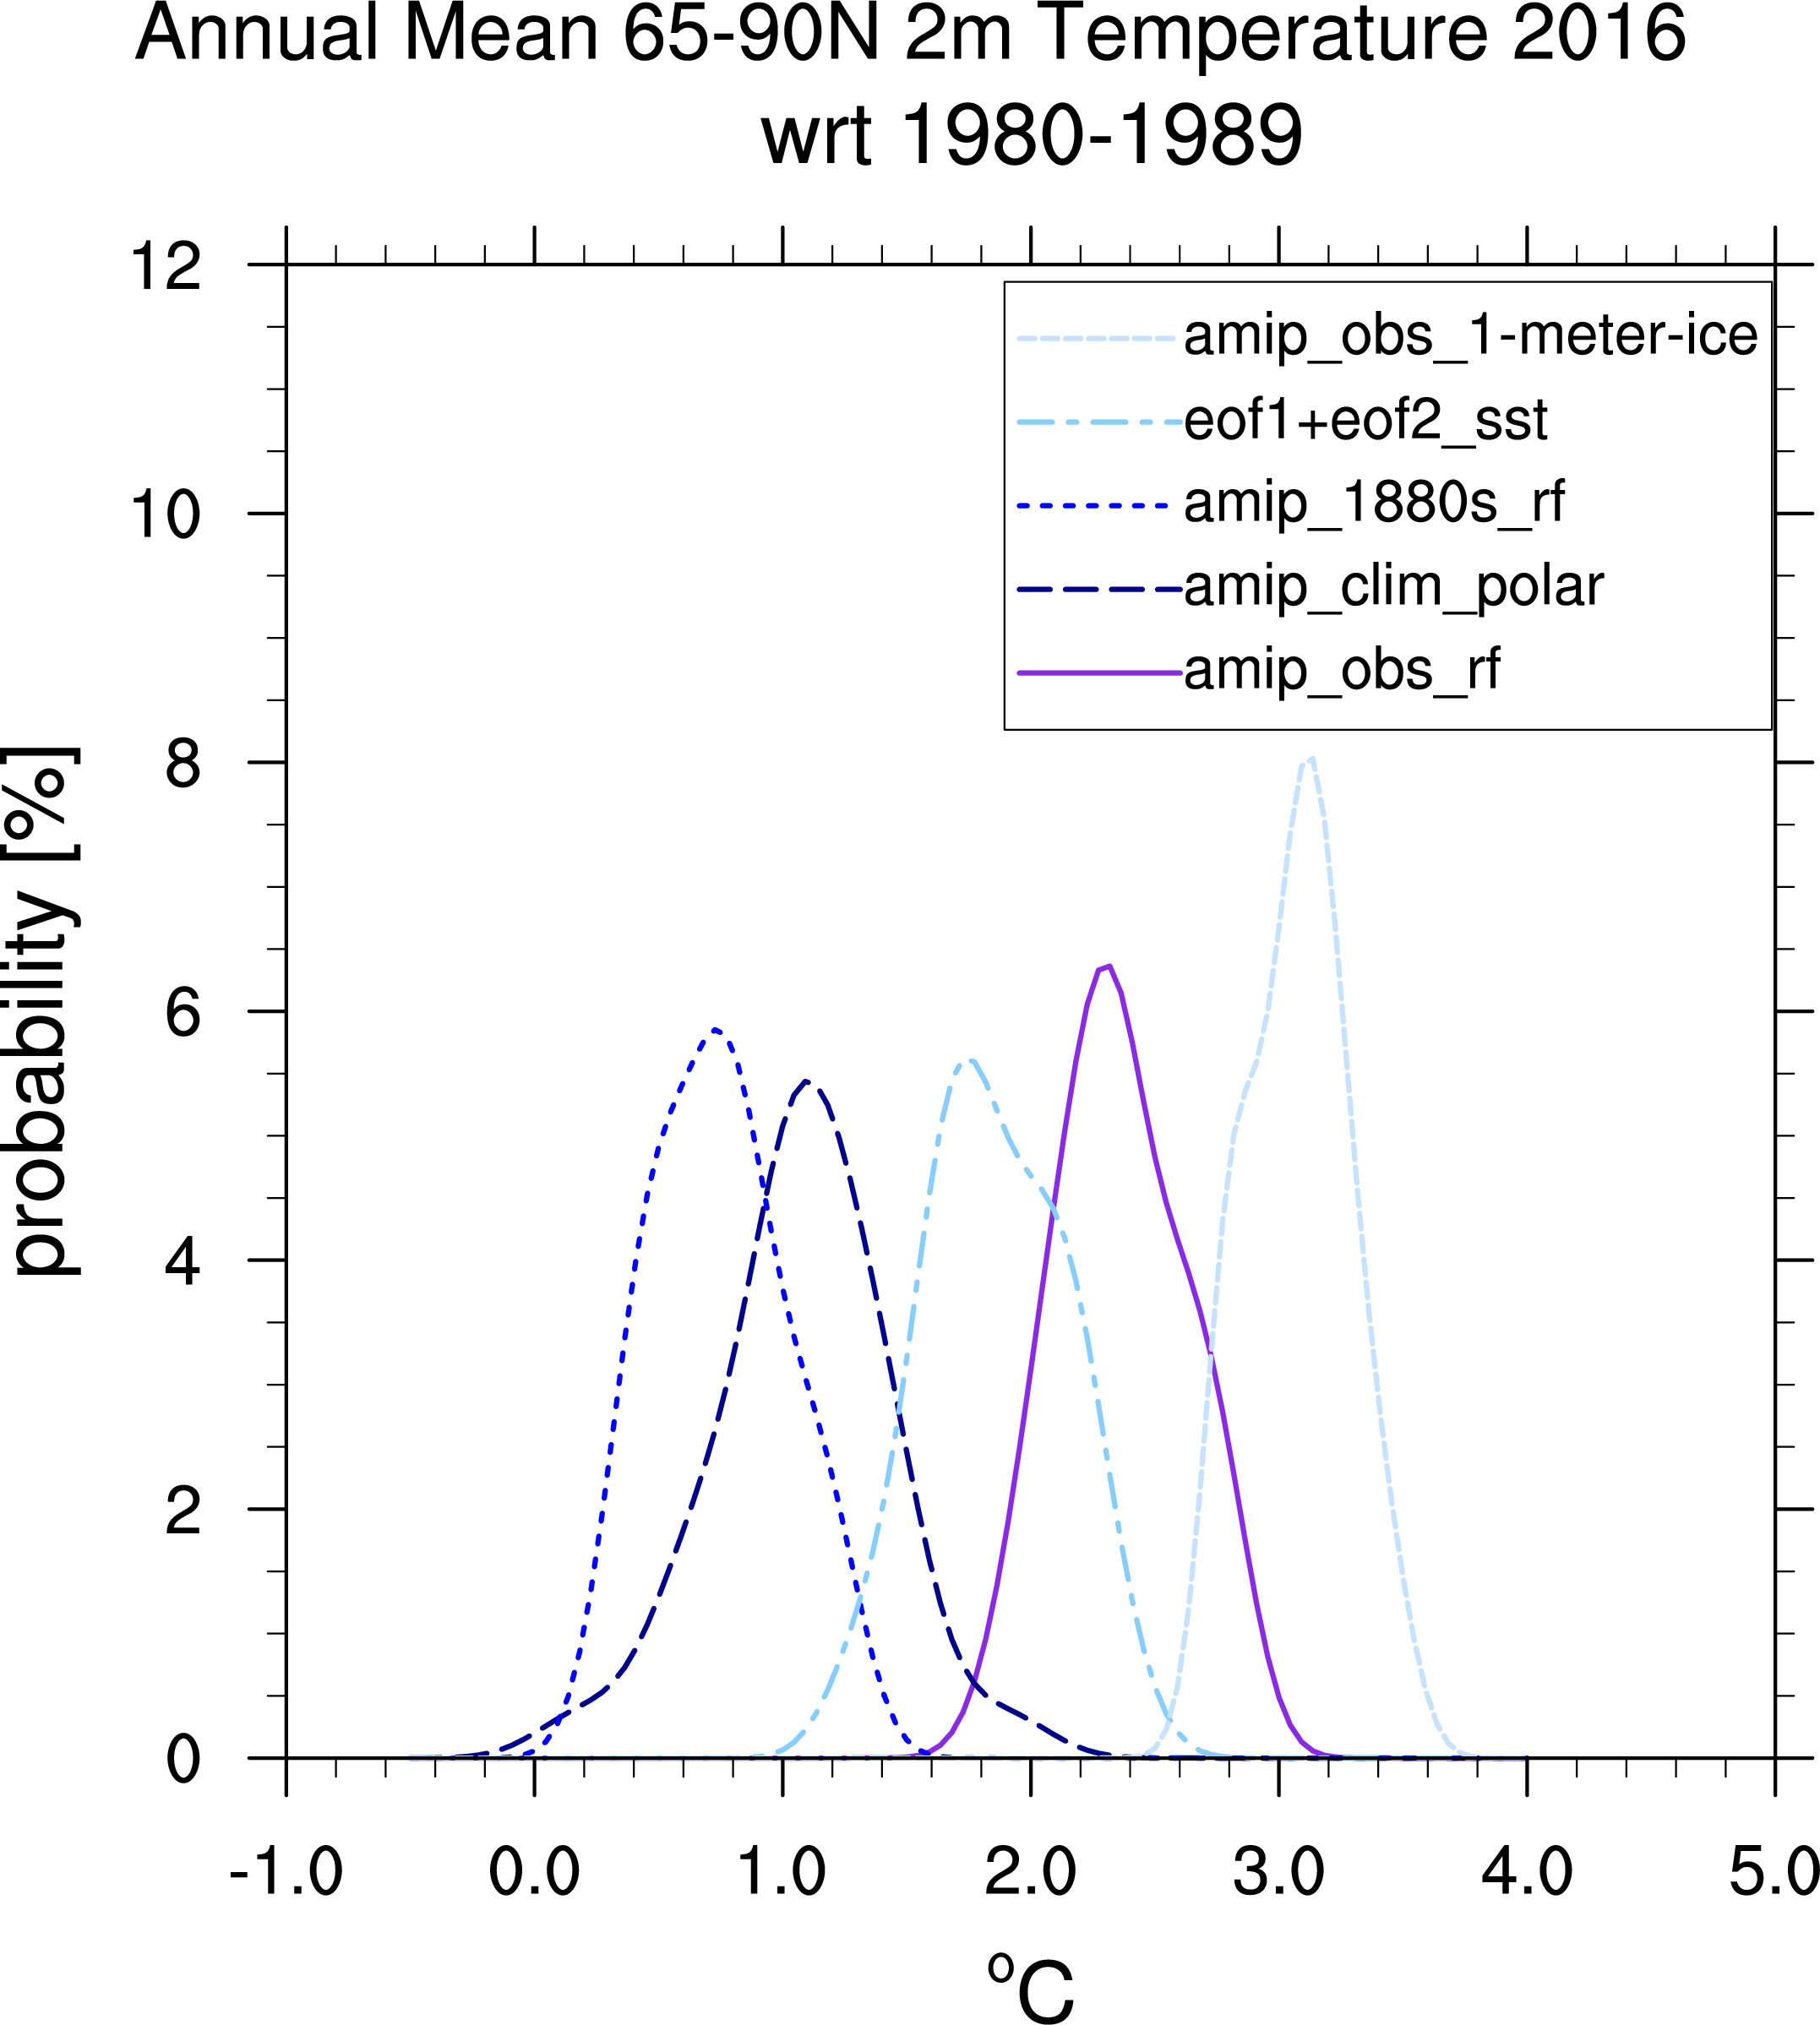
Re. Figure 4:
with respect to amip_obs_rf 1980-1989 means
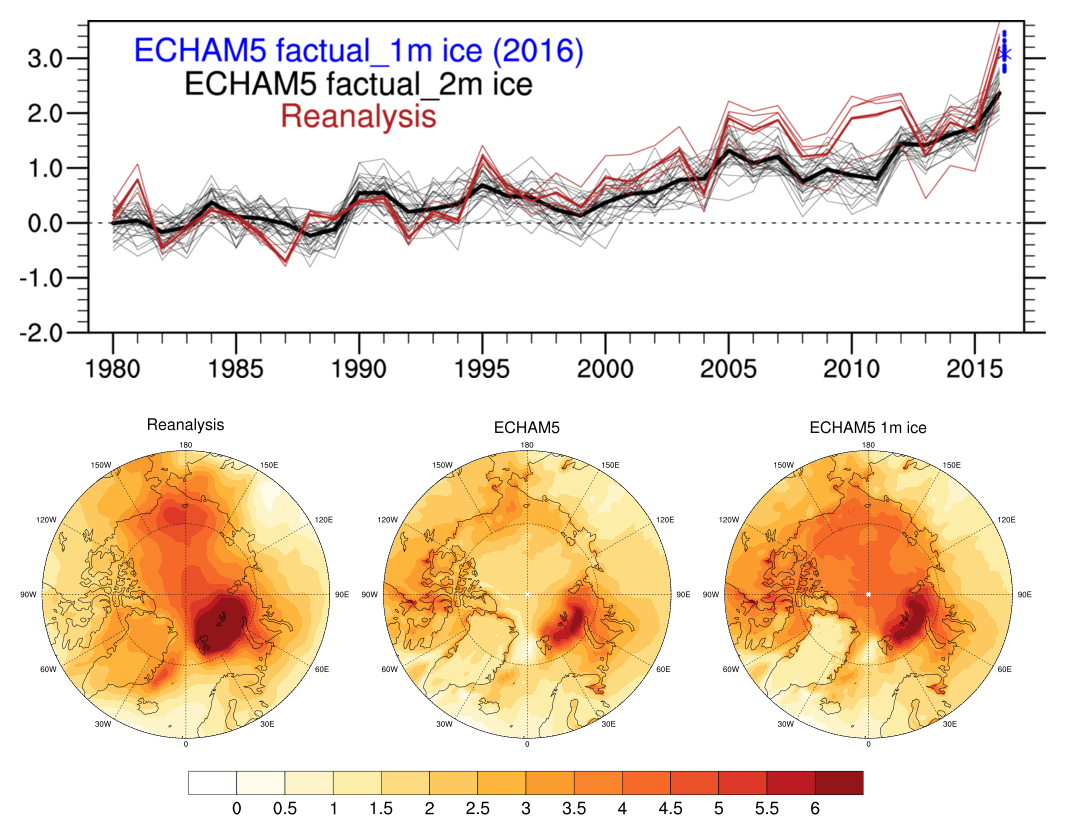
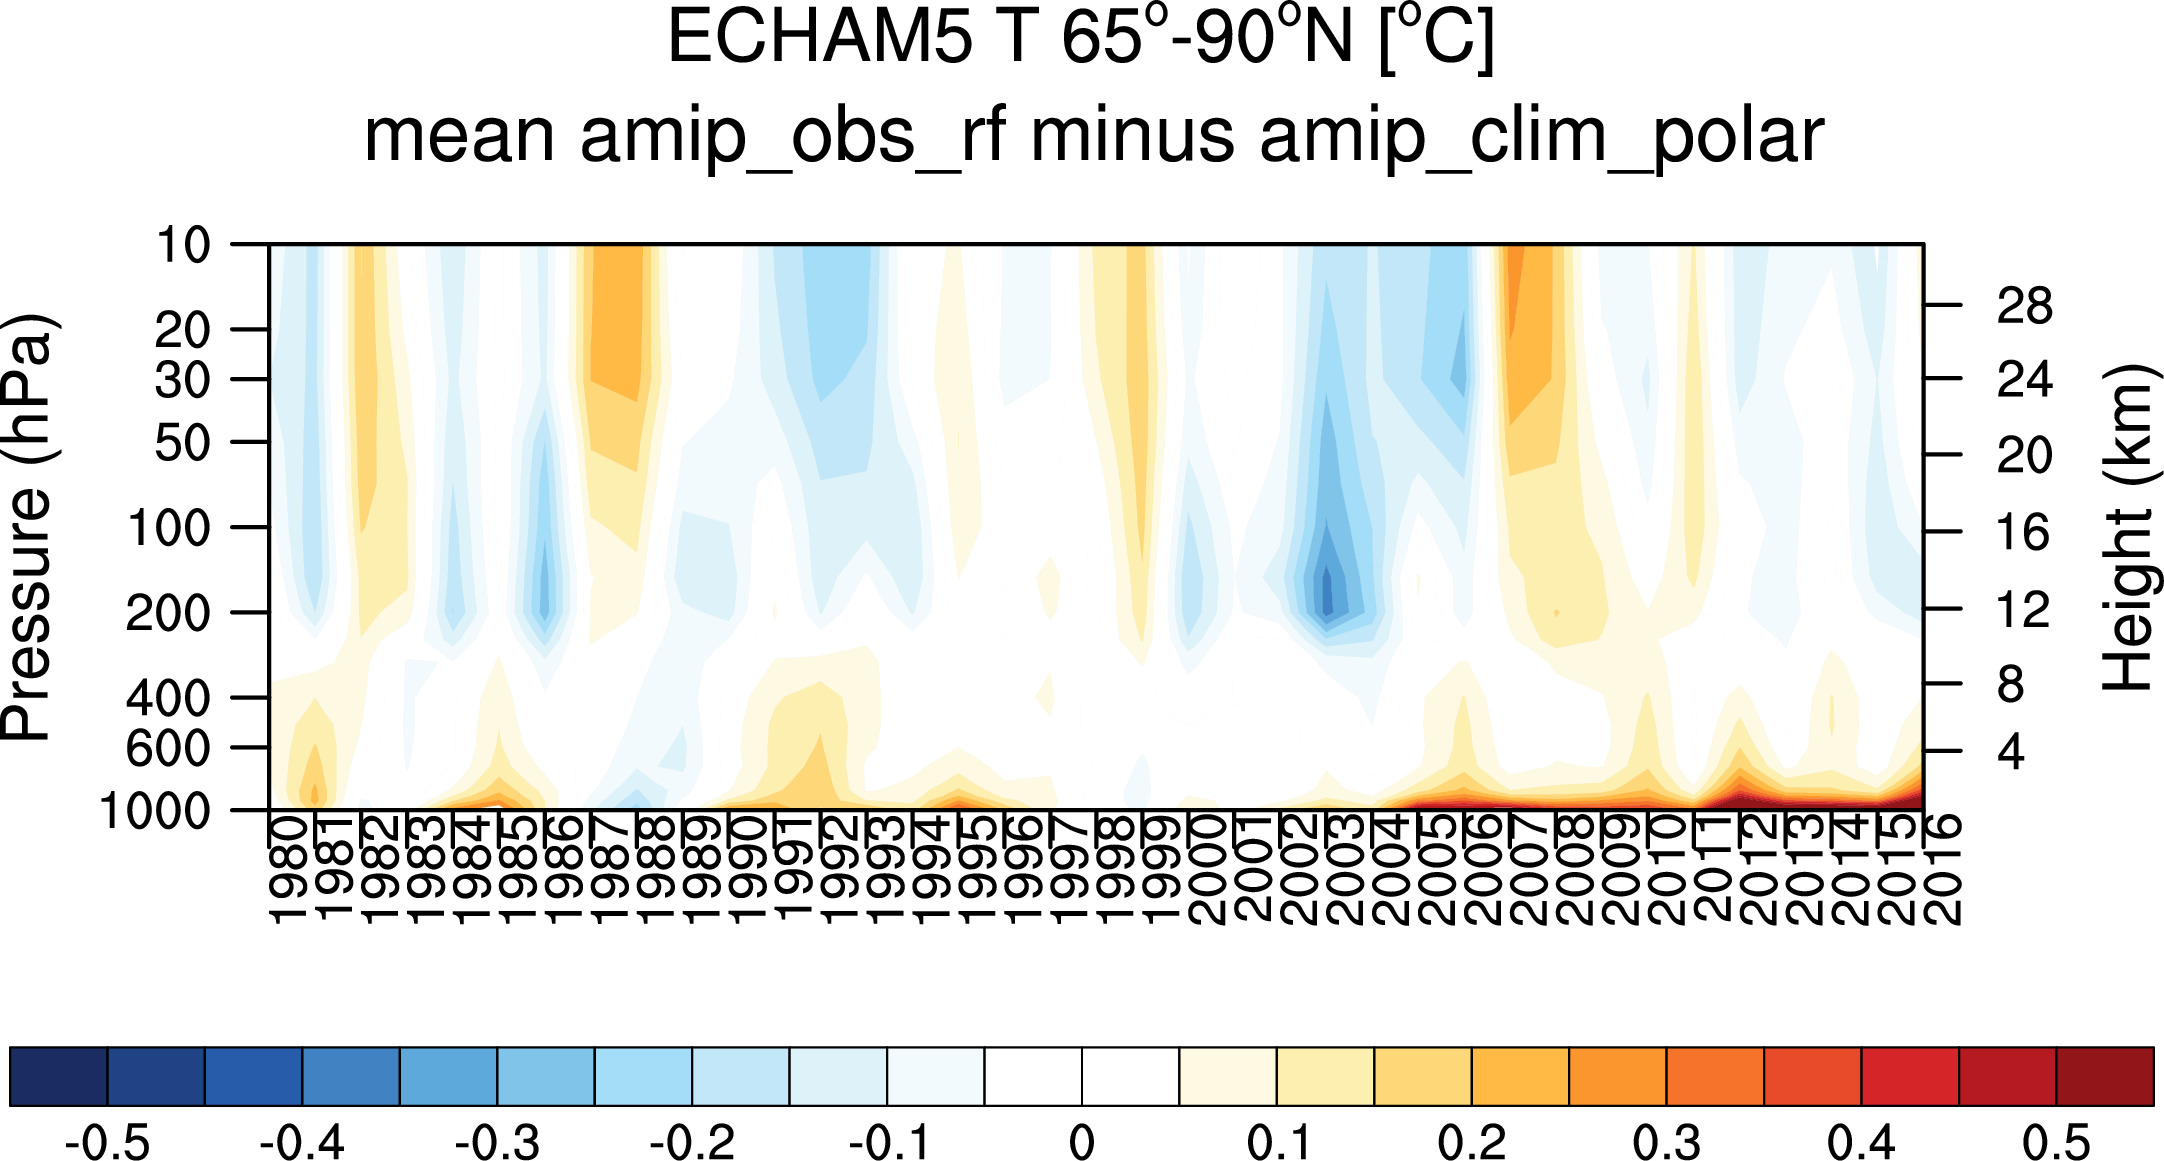
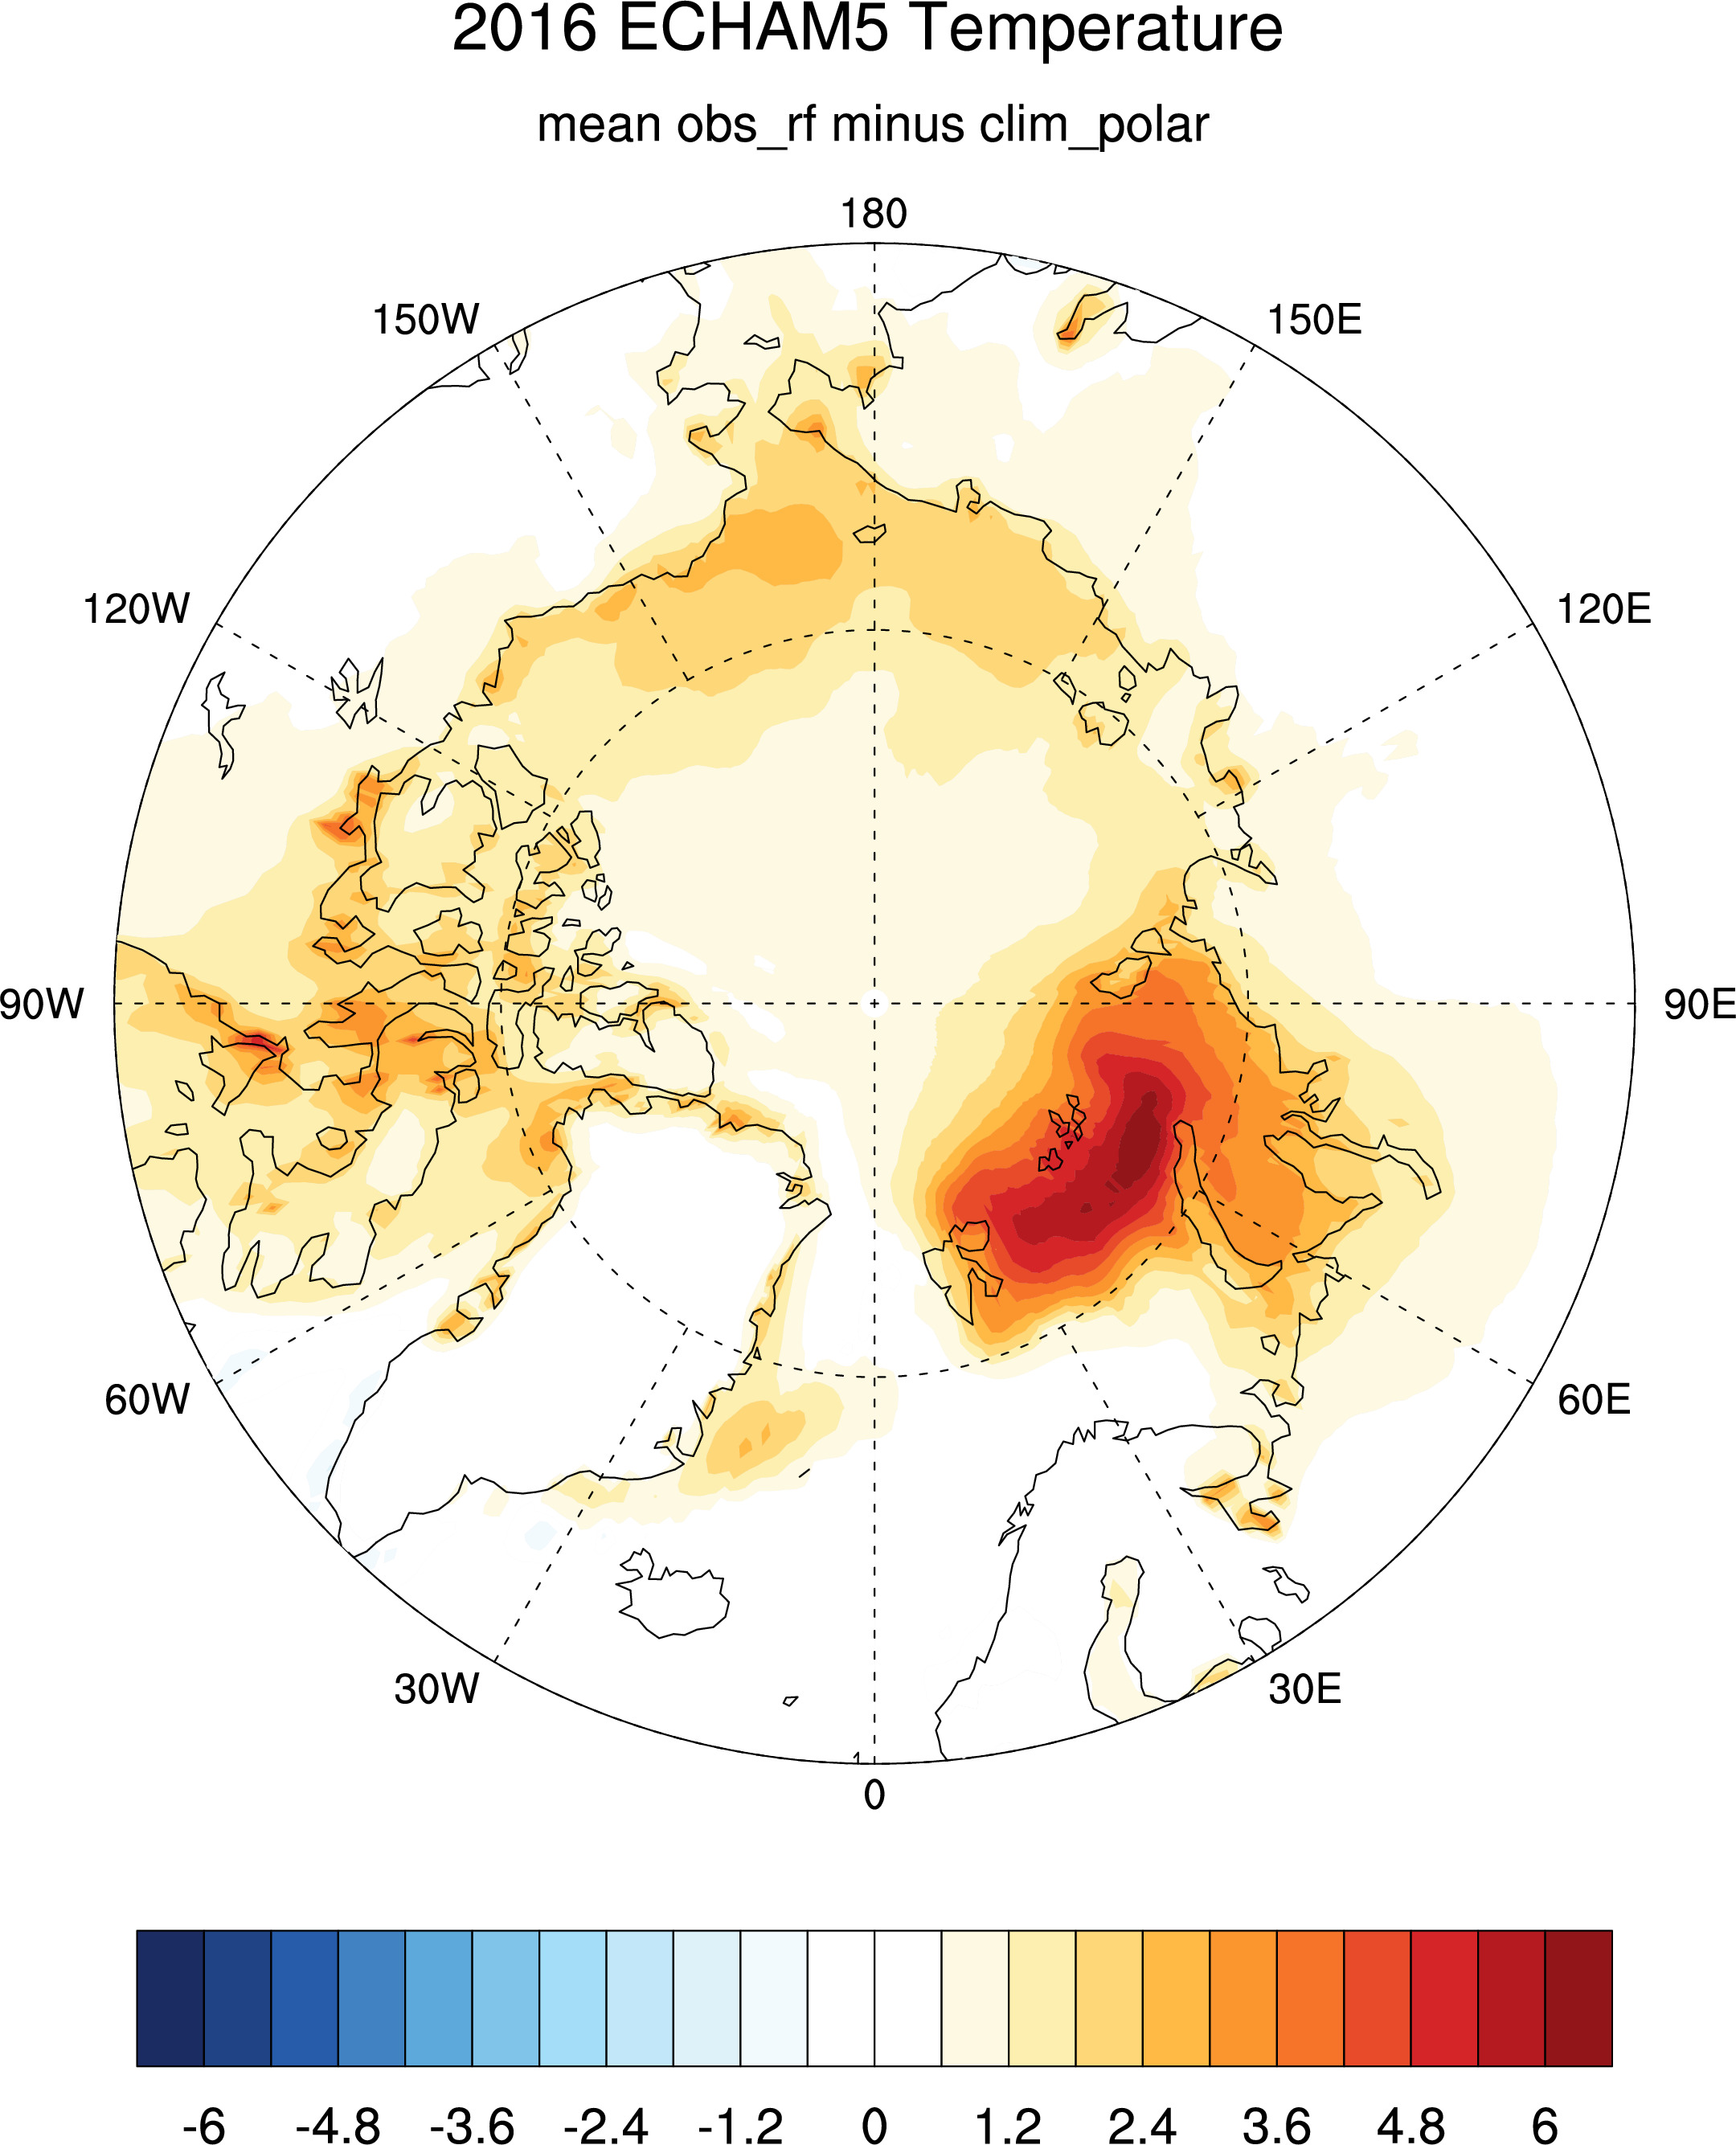
Re. Figure 6:
Anomalies with respect to amip_obs_rf climatology:
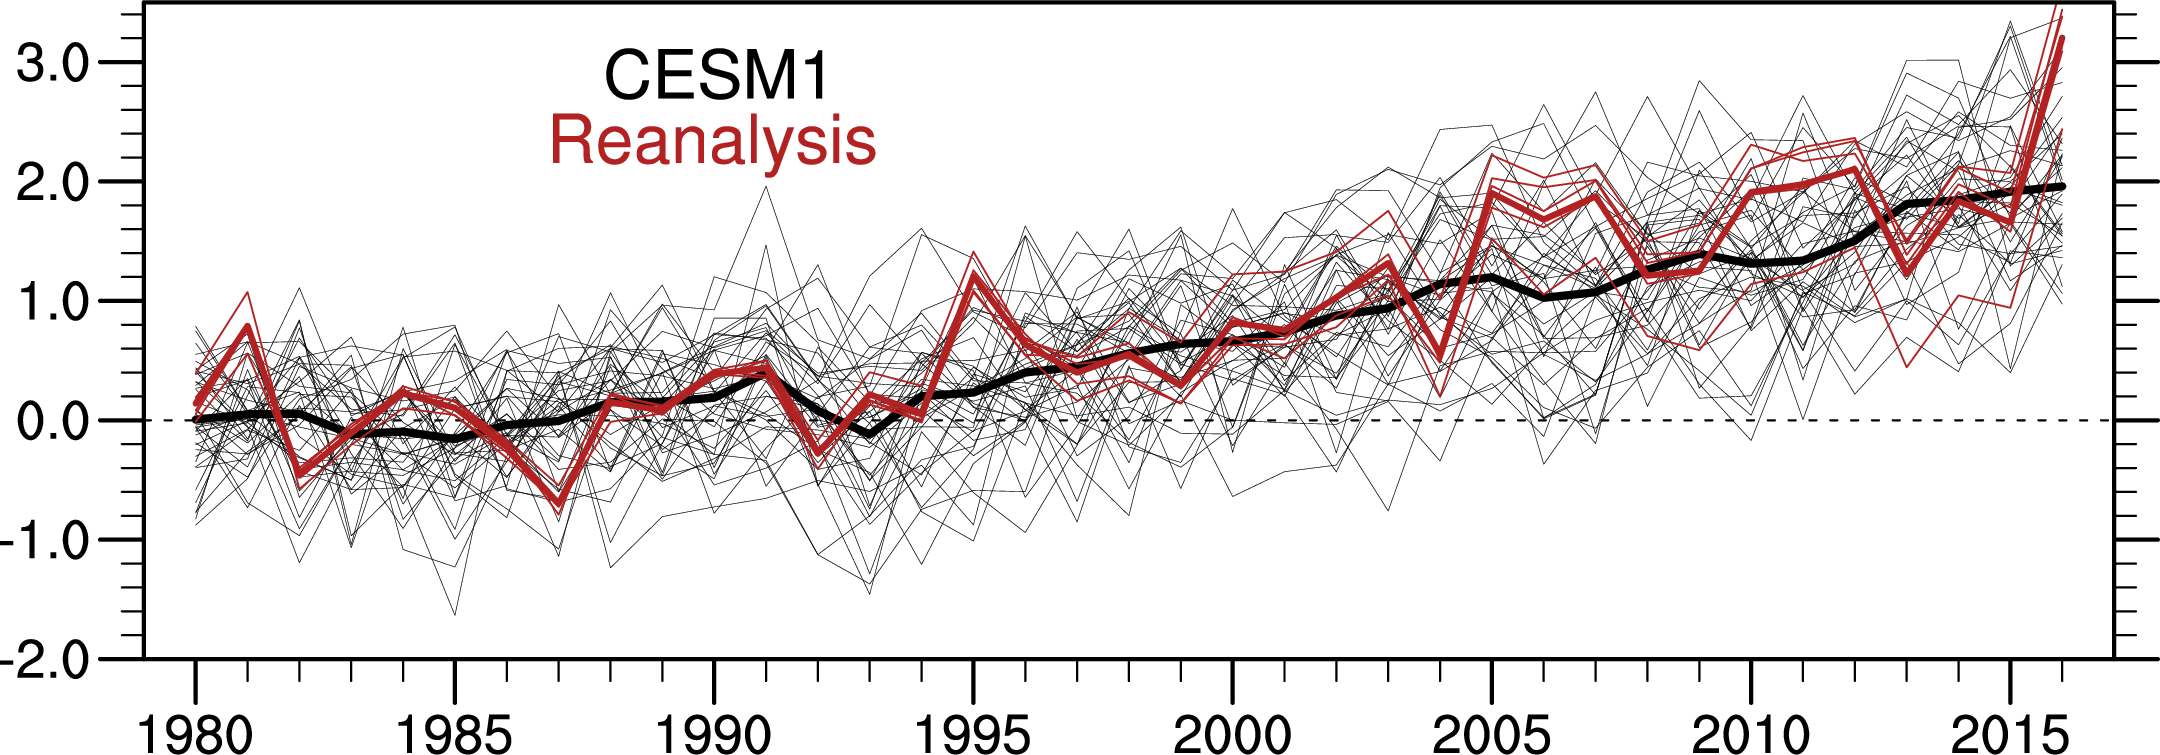
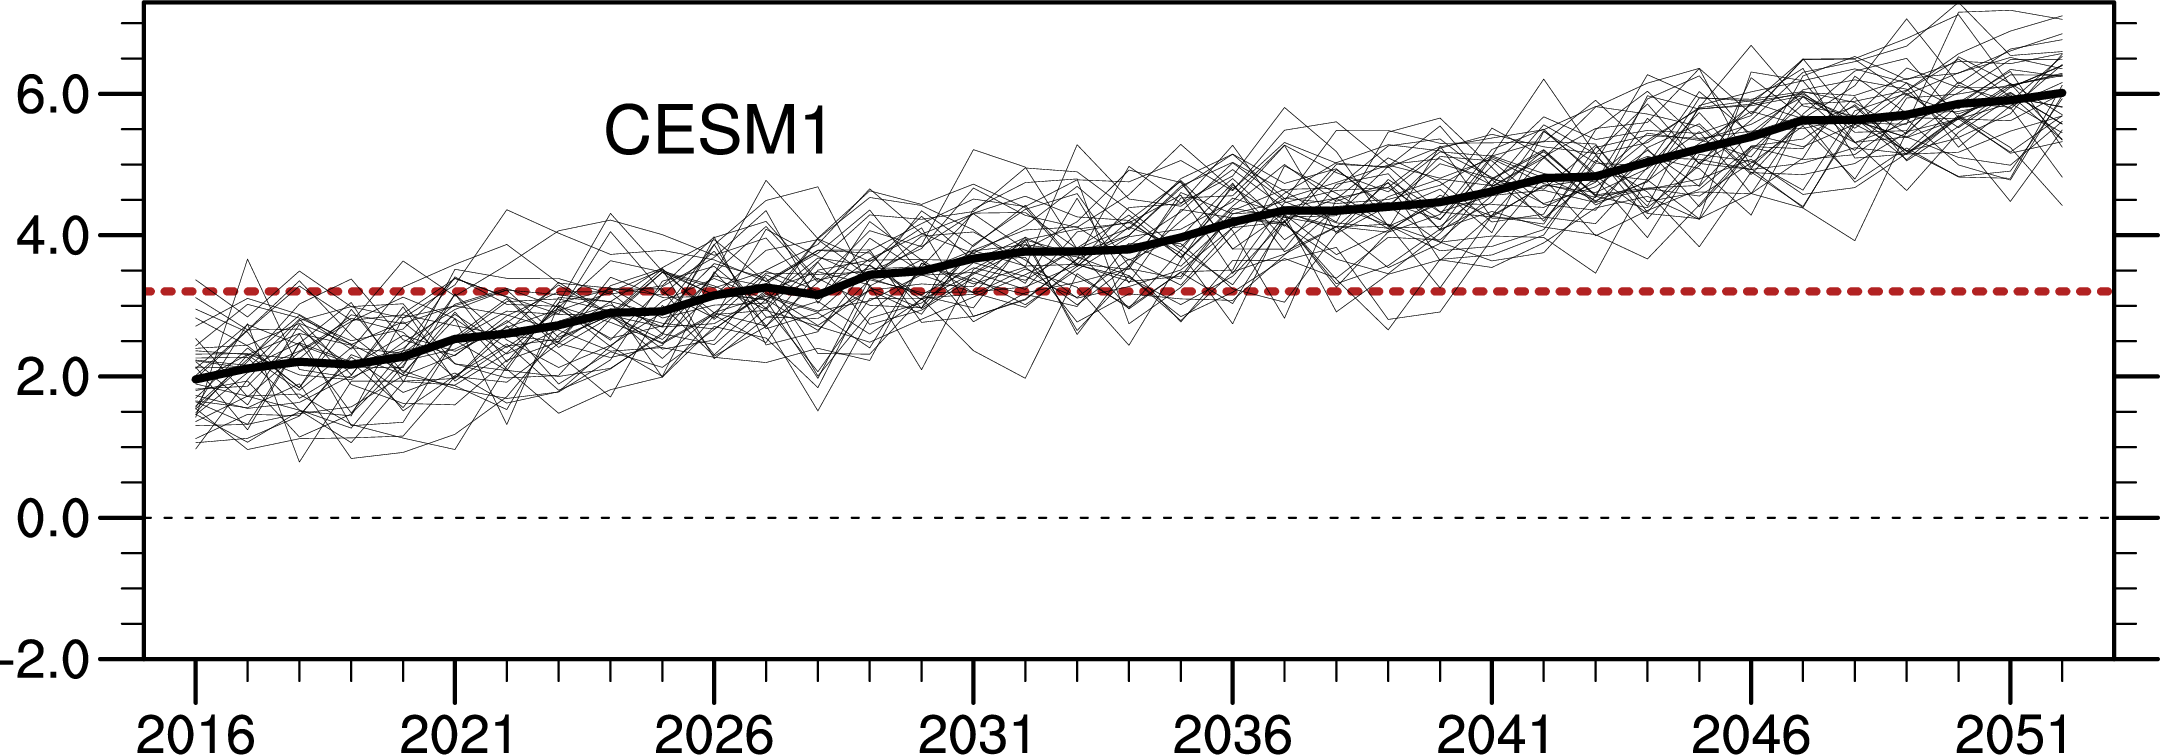
Annual T2m 65-90N CESM1 LENS where anomalies computed wrt 1980-1989:
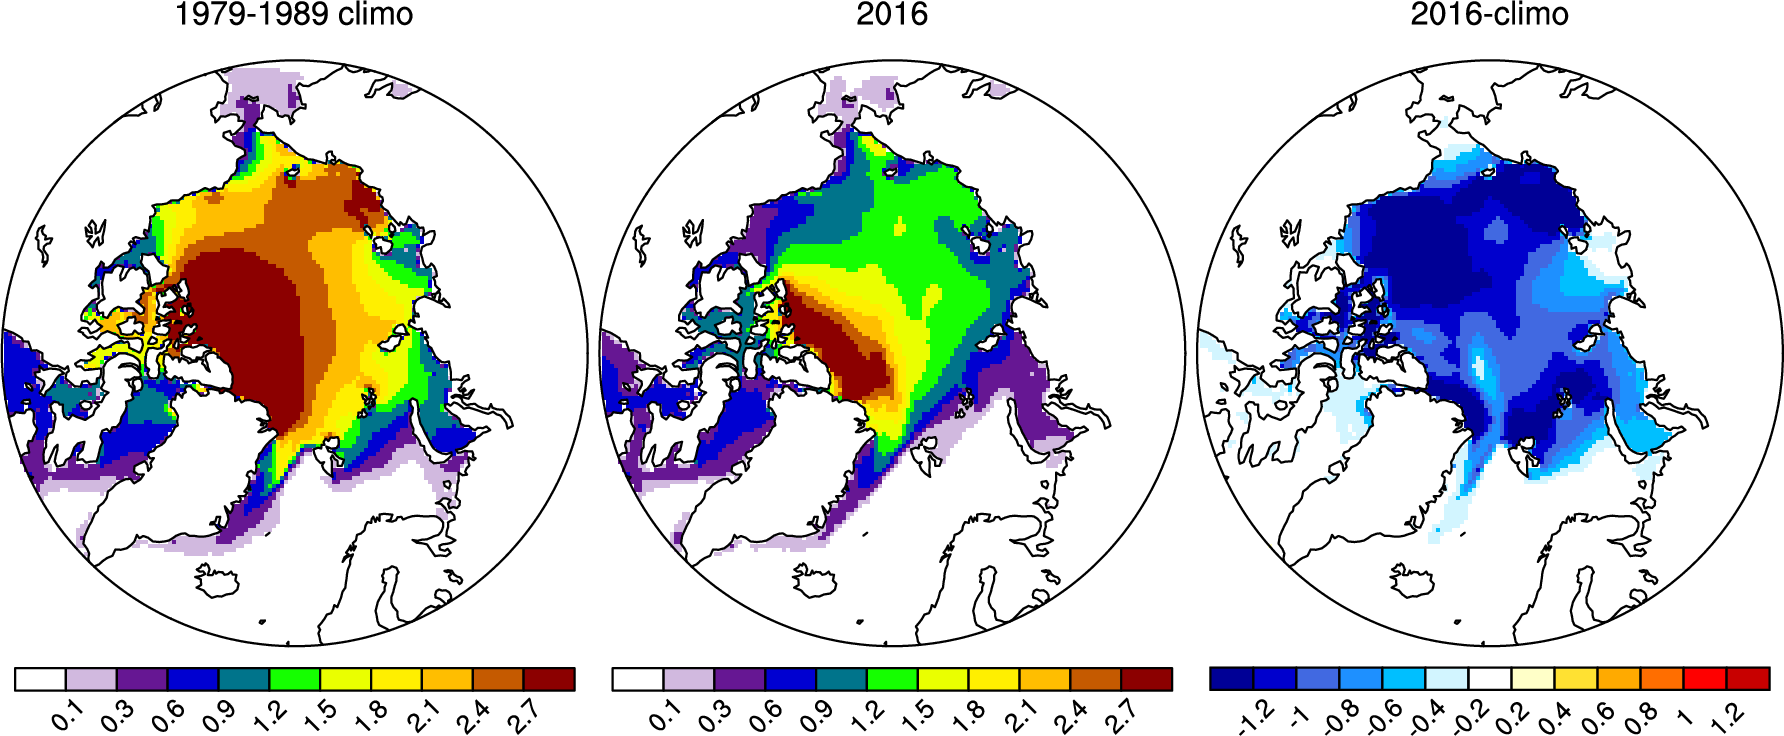
Pan-Arctic Ice-Ocean Modeling and Assimilation System (PIOMAS) Data:
with 1980-1989 climatology:

with 1979-1989 climatology:
------------------------------------------------------------------------
These are all anomalies:
ECHAM5
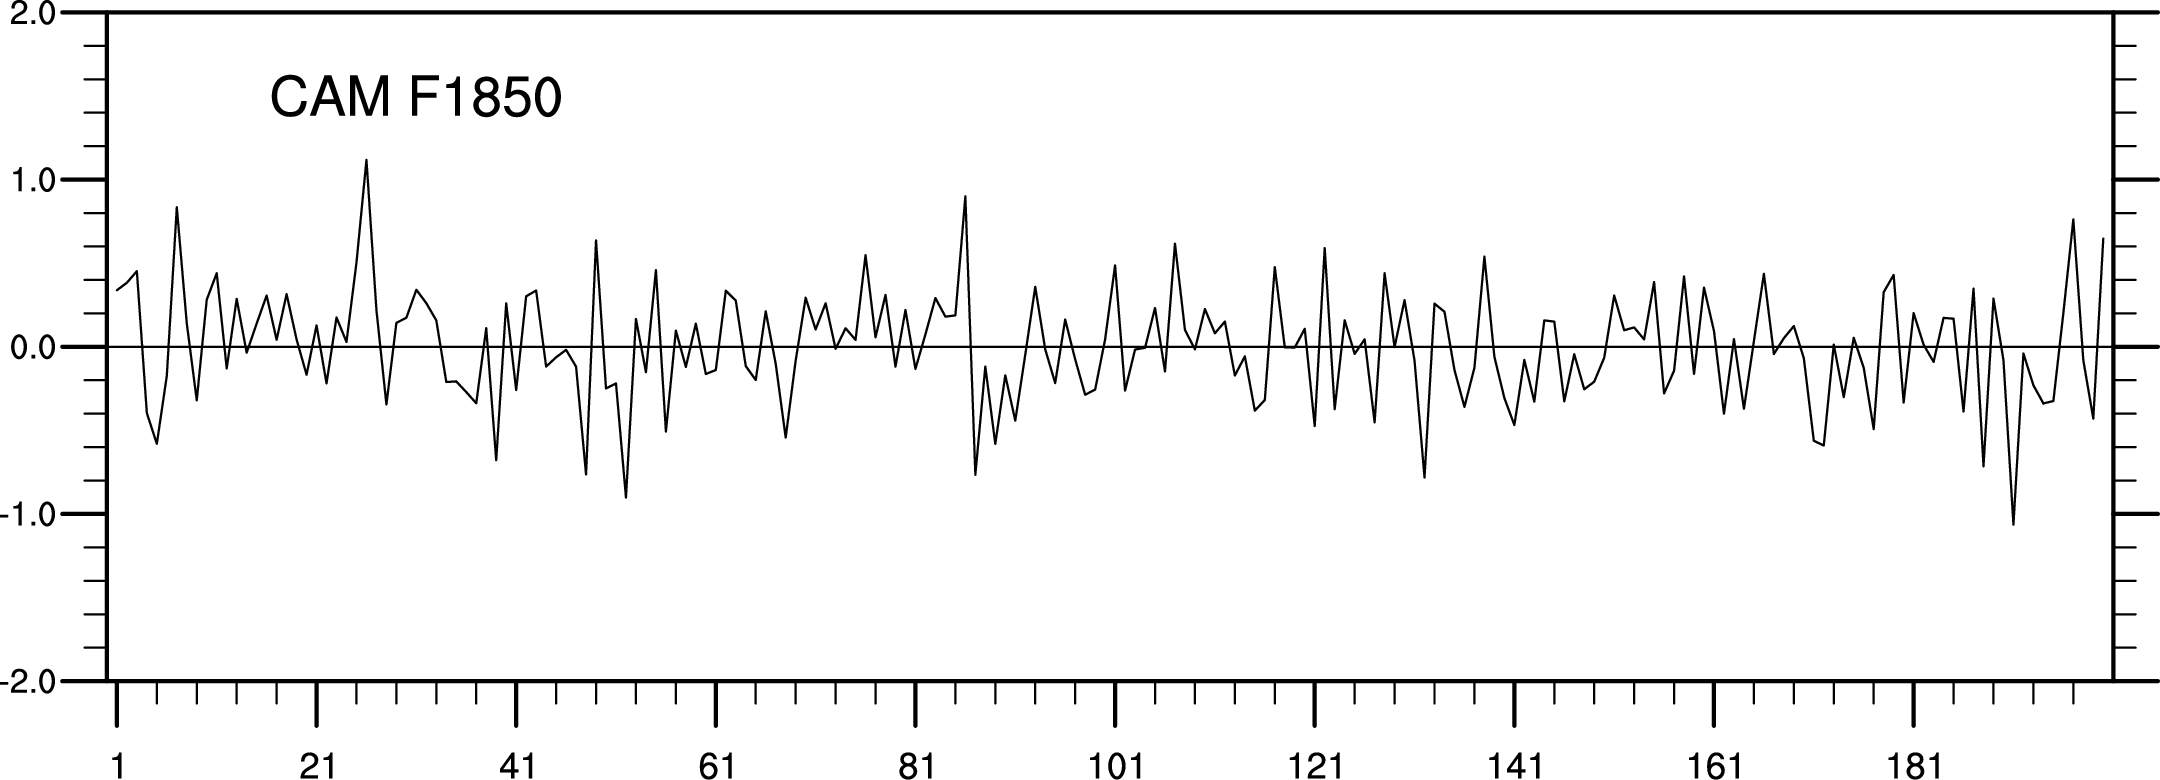
F2000 data divided into 5 pieces:
CAM
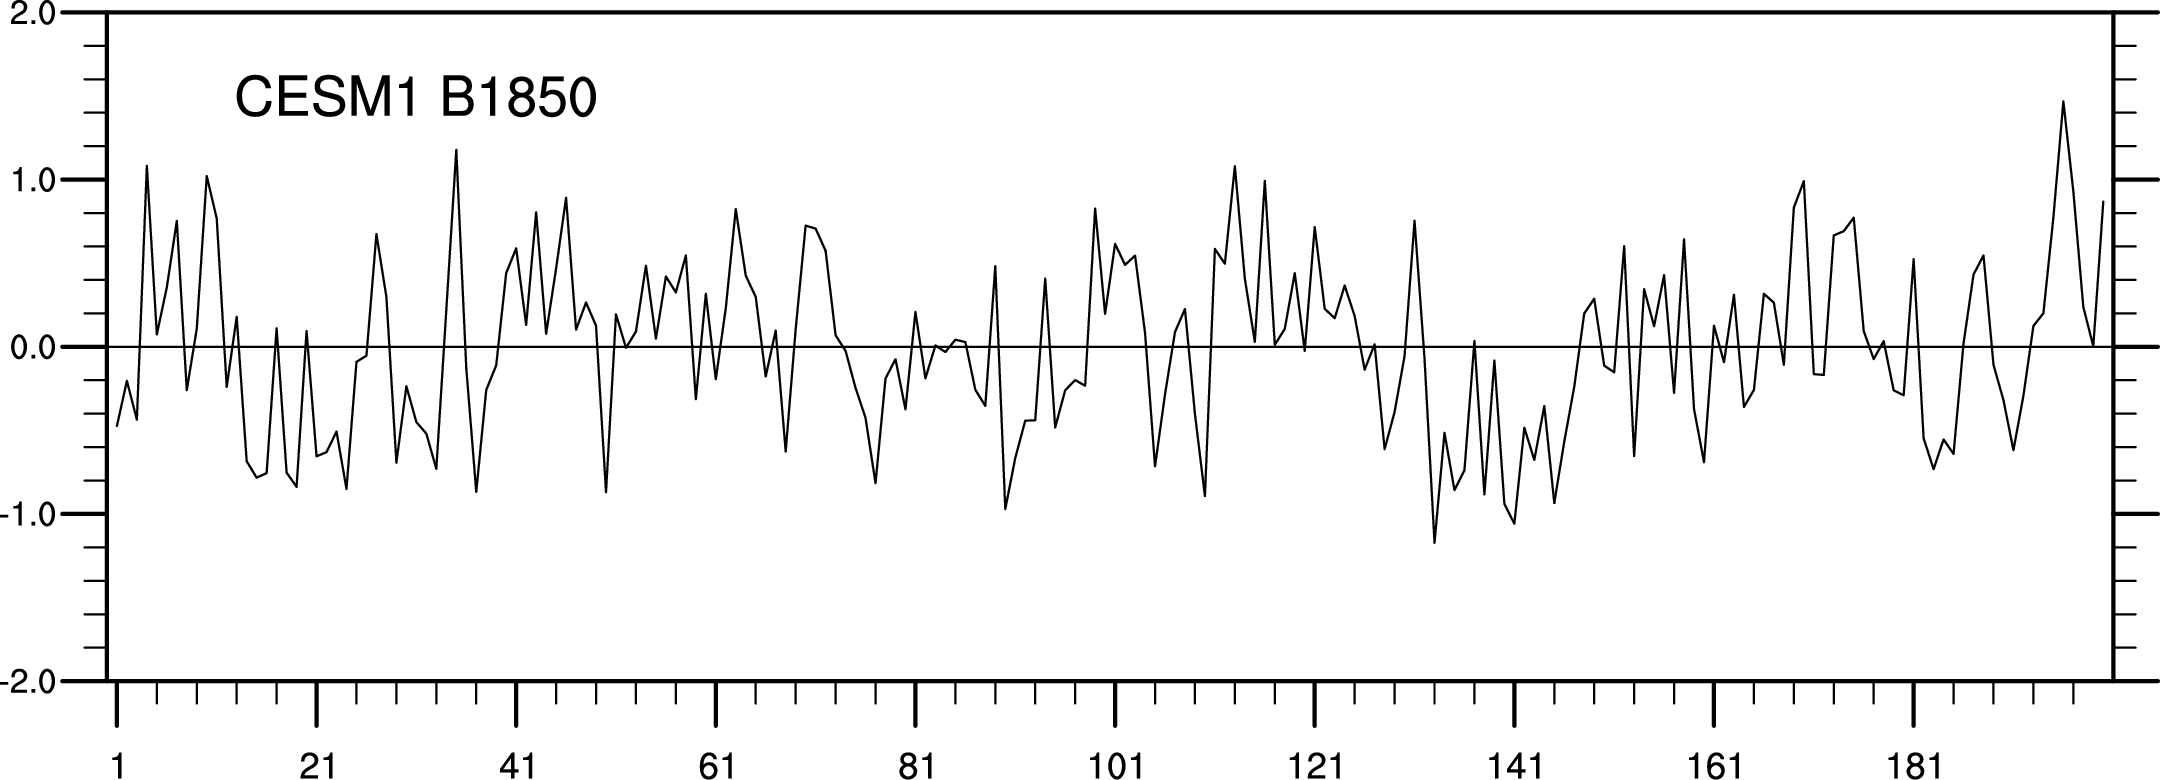
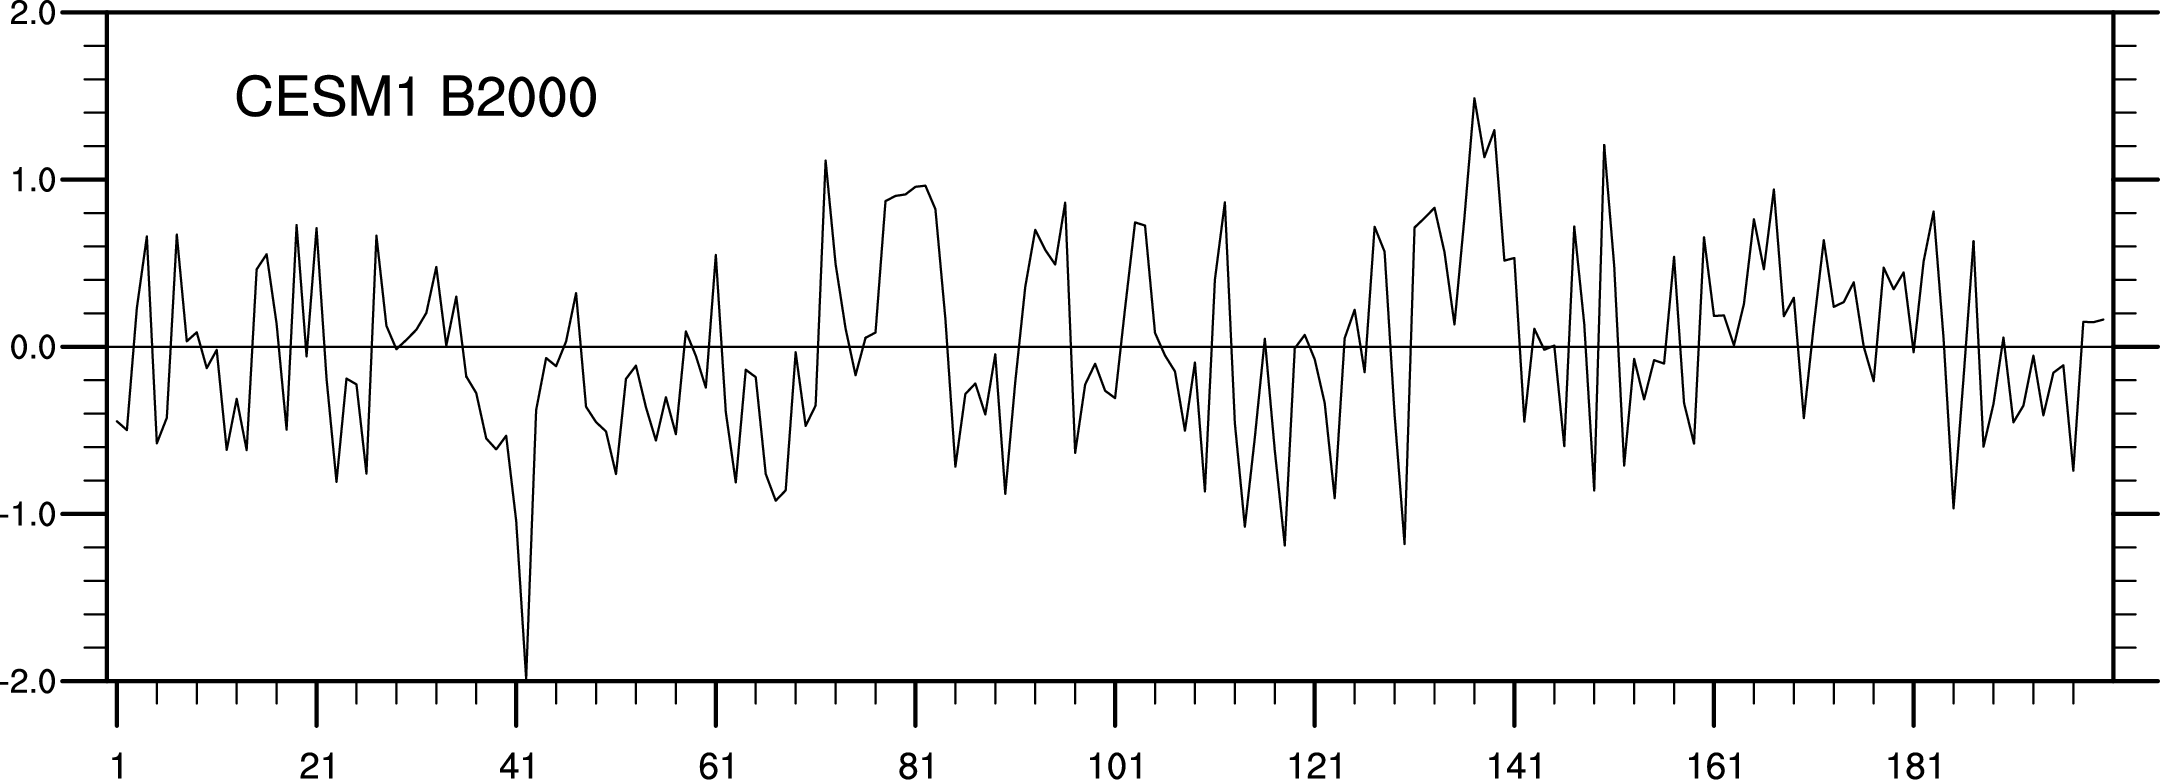
CESM1
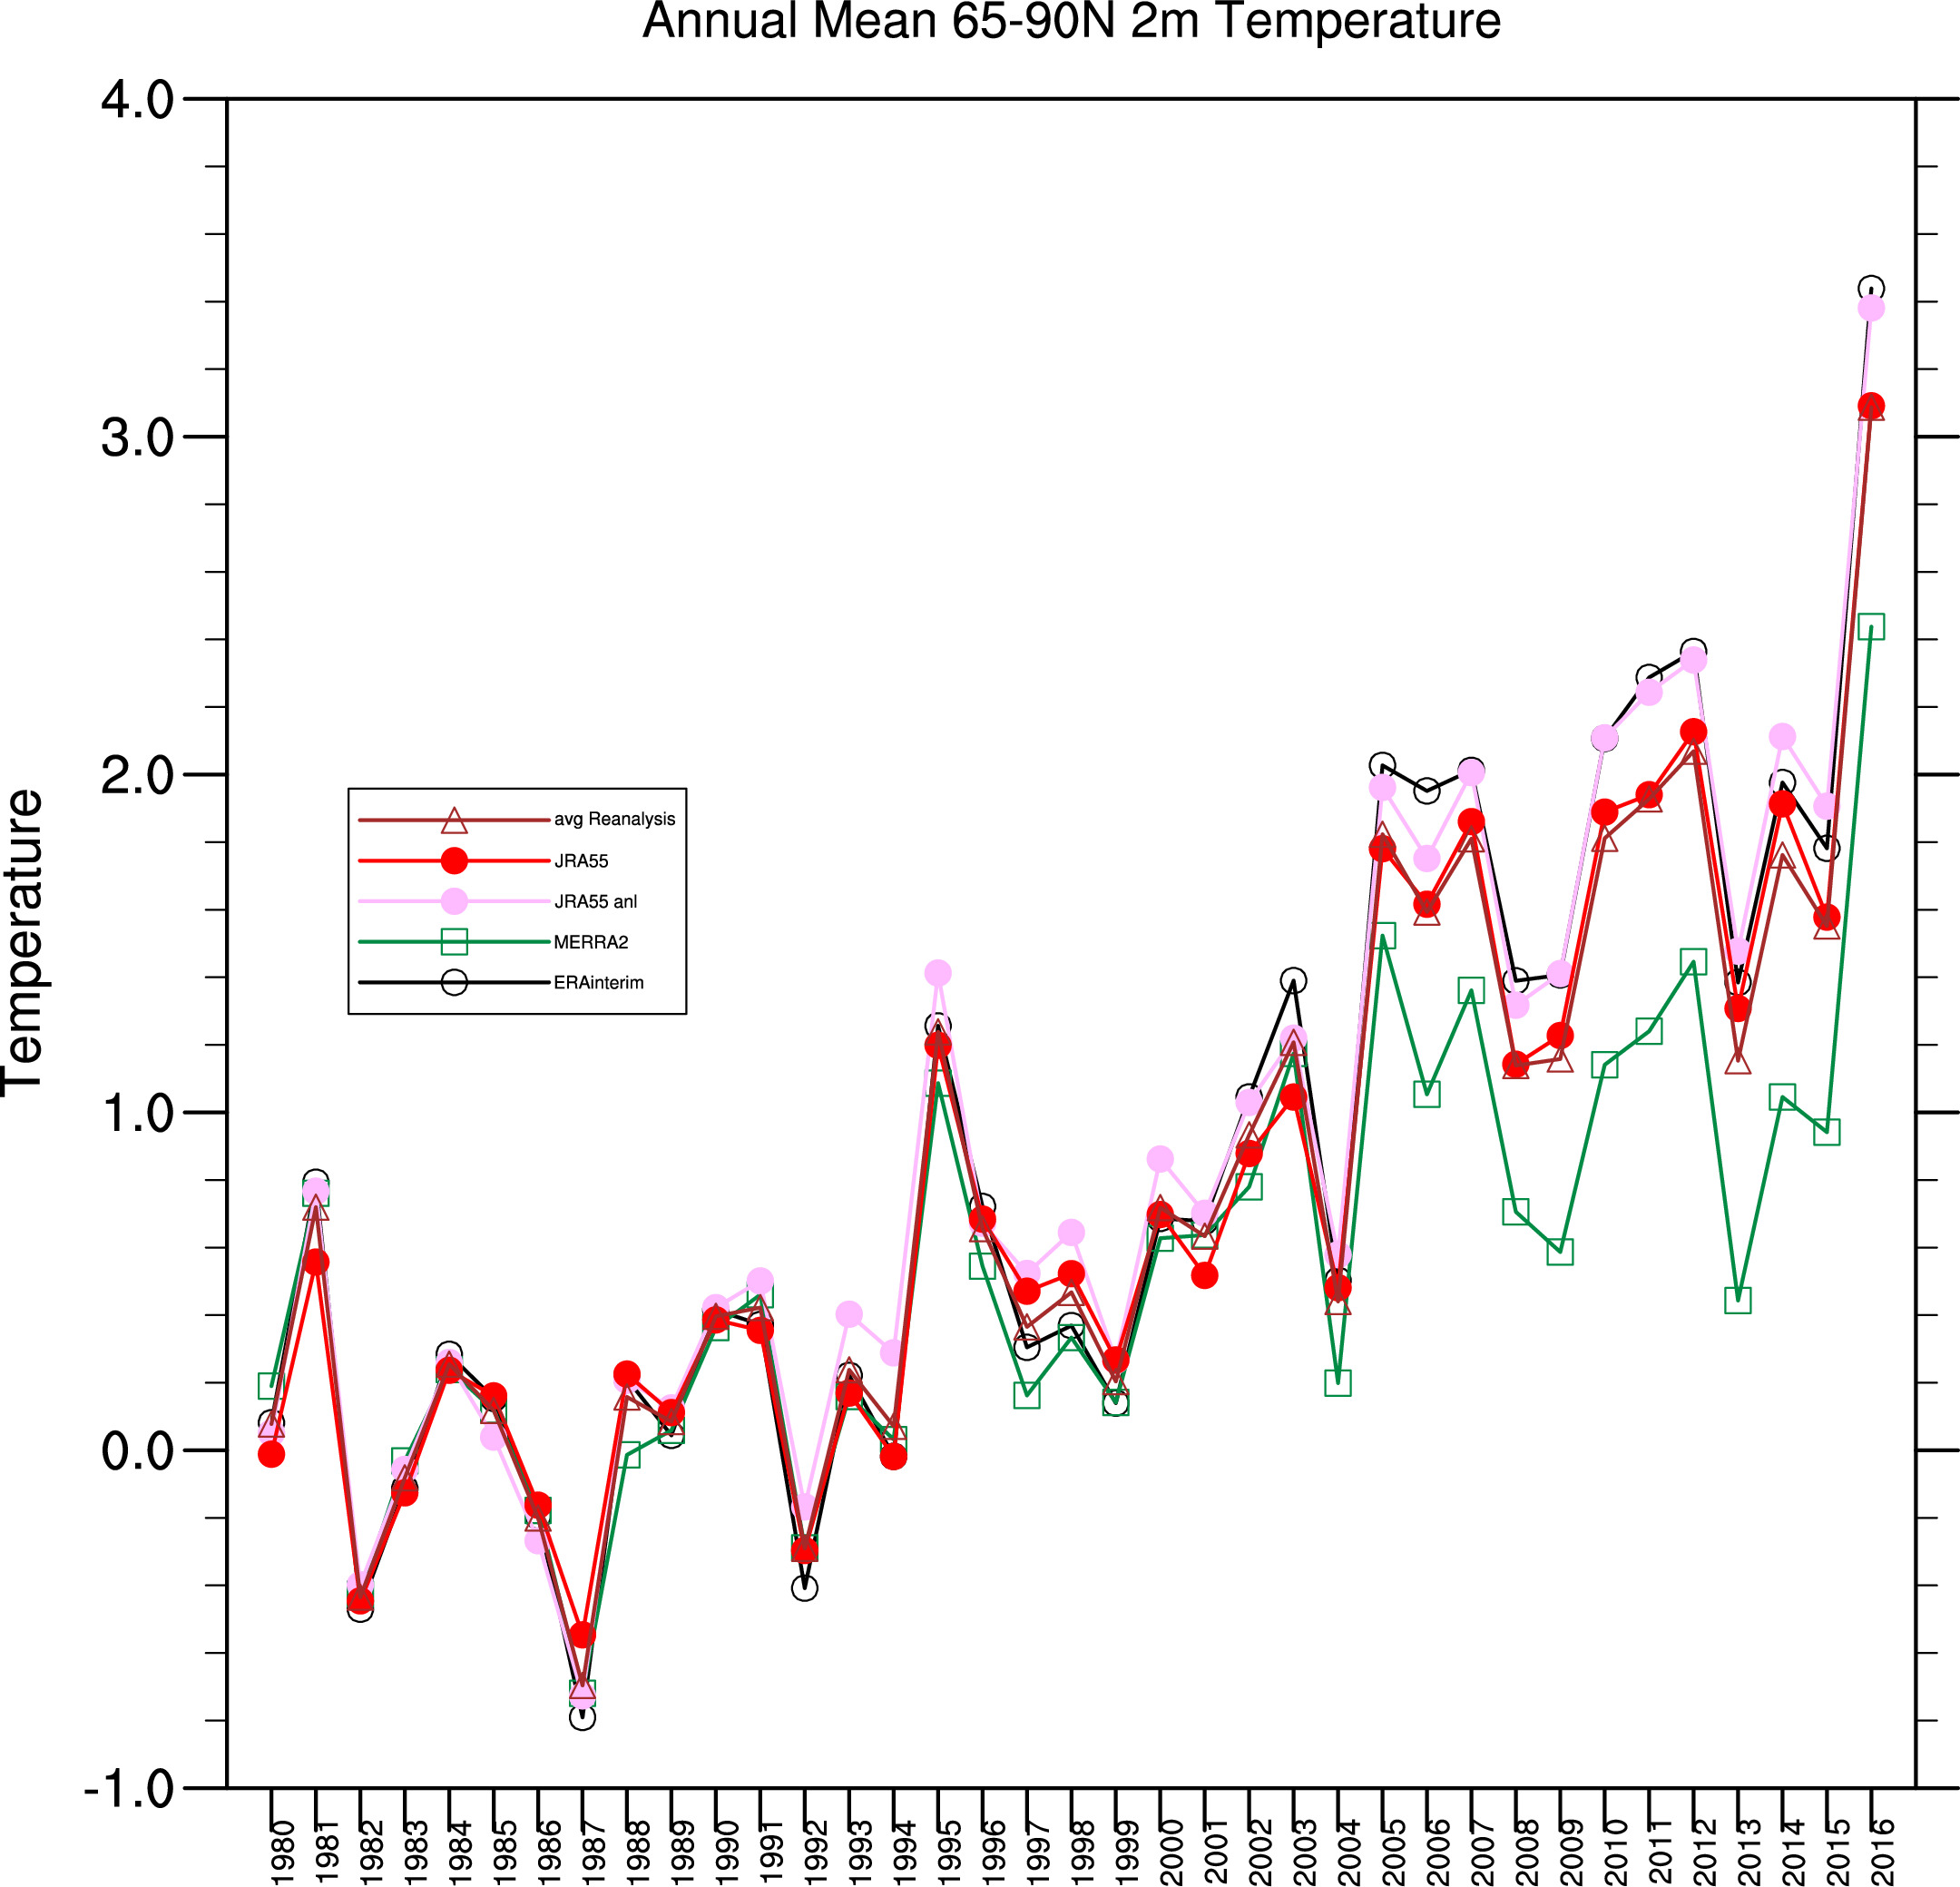
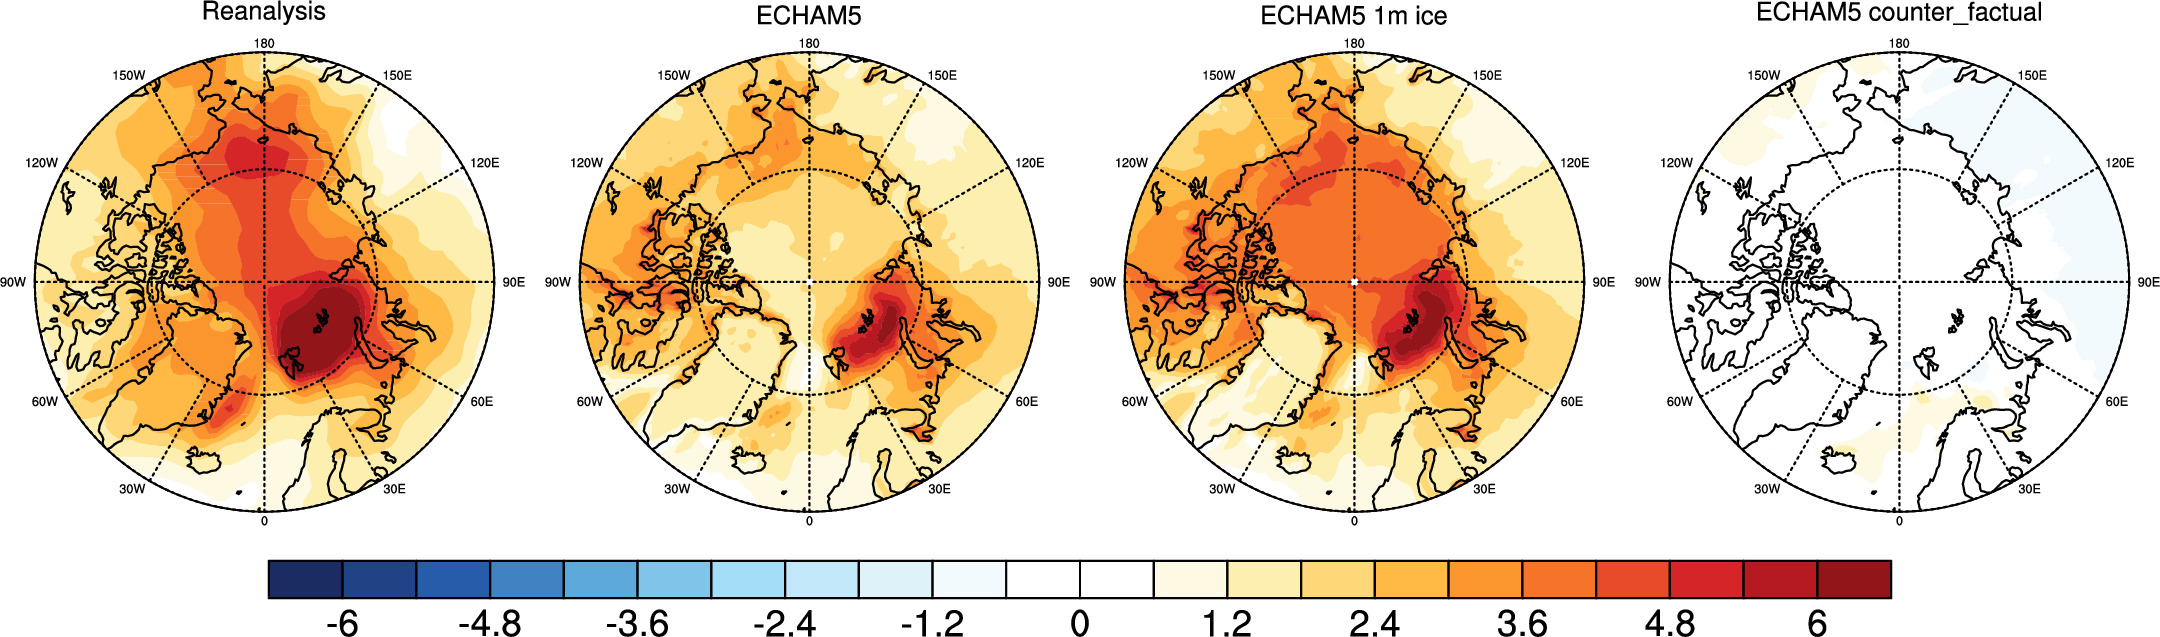
Re. Figure 1:
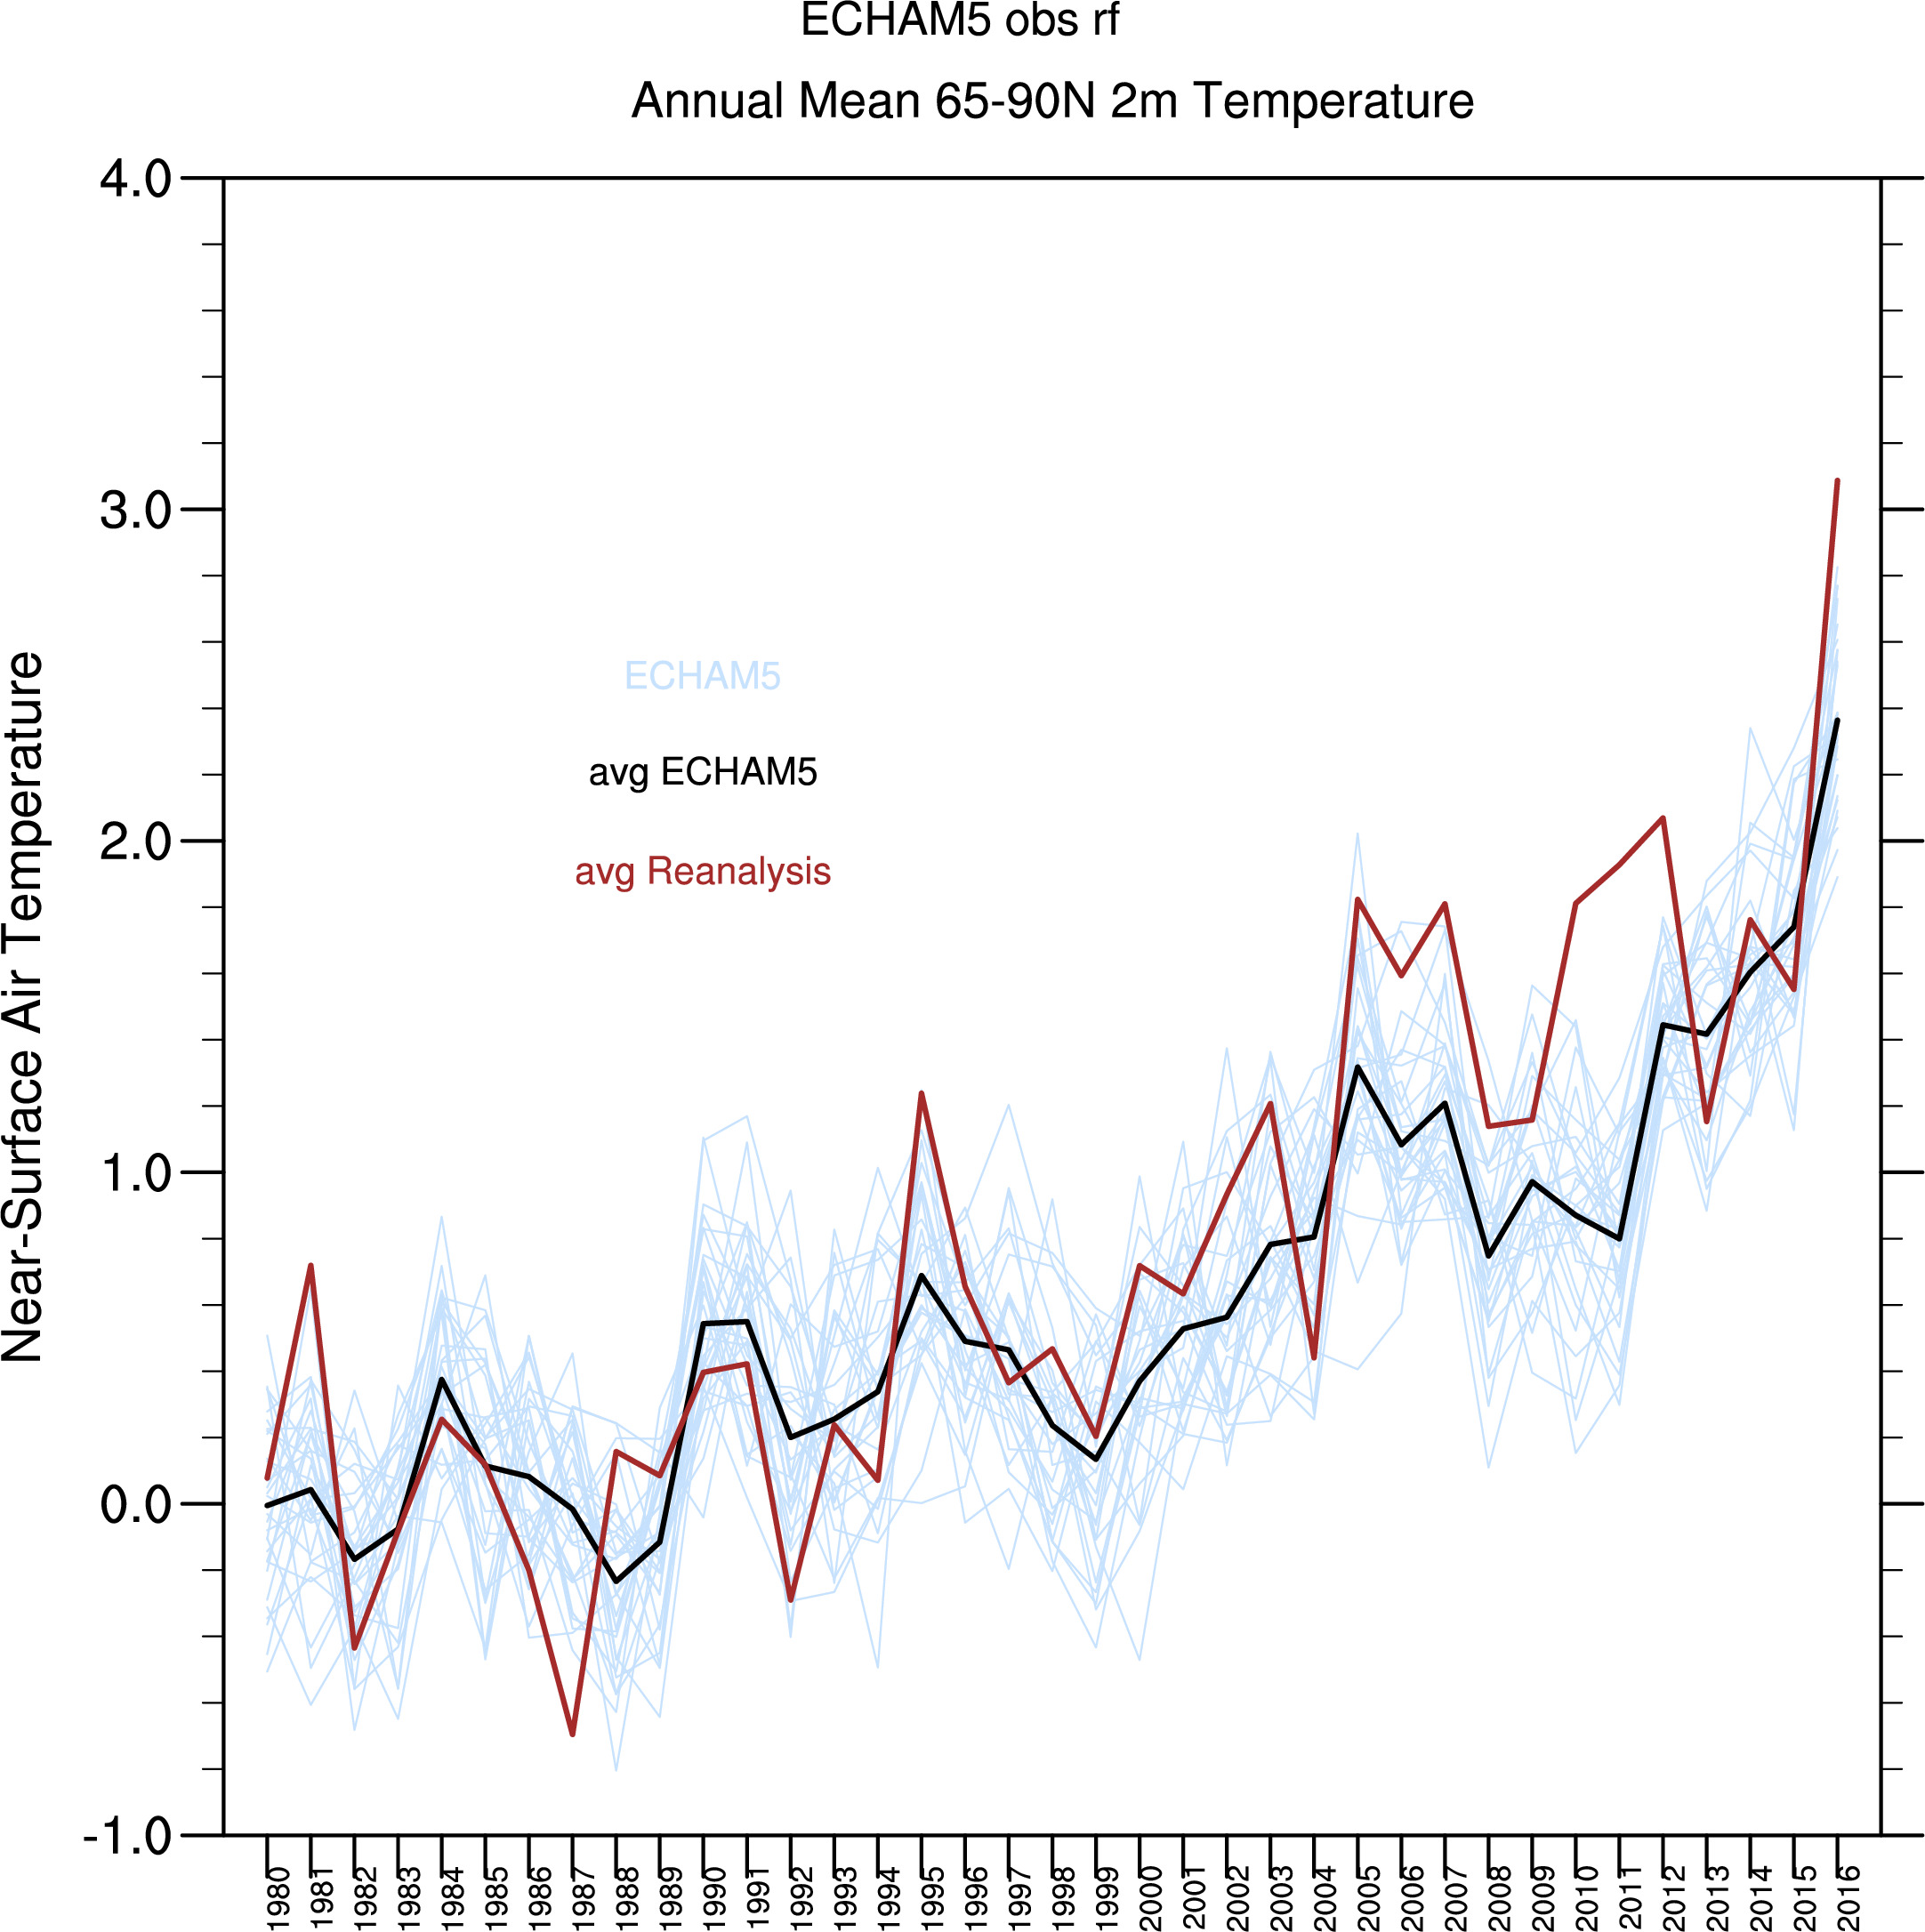
Weighted area average of T2m 65-90N: Reanalysis average: 3.135974 deg C
Weighted area average of T2m 65-90N: ECHAM5 average: 2.363974 deg C
Re. Figure 4:
with respect to amip_obs_rf 1980-1989 means
------------------------
These are 'anomalies', i.e. differences of the full fields:
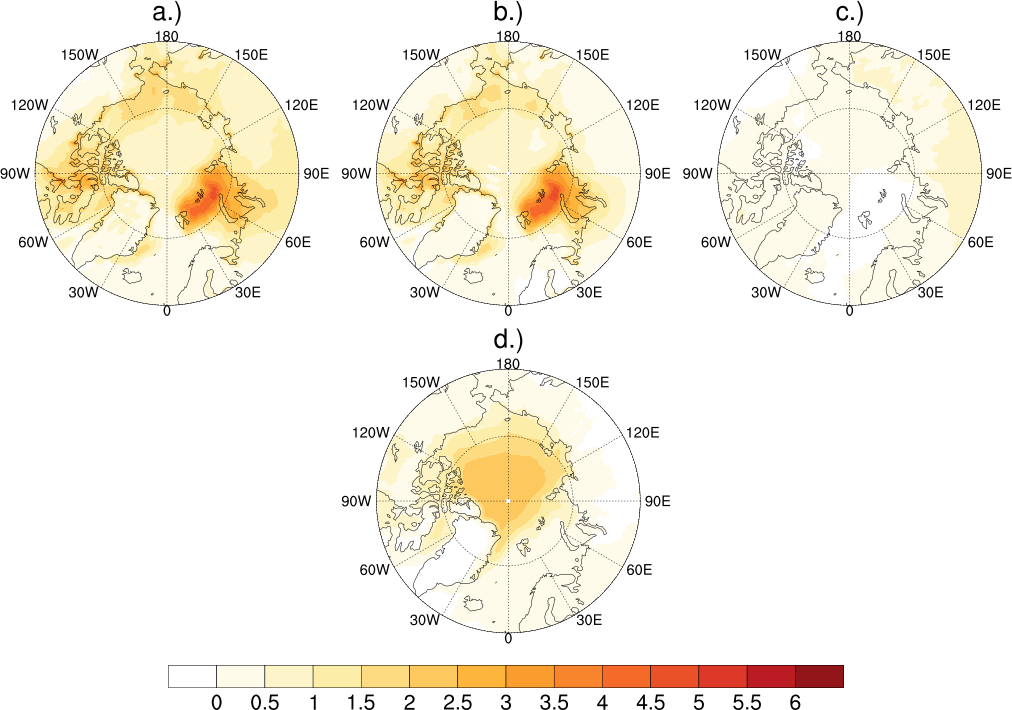
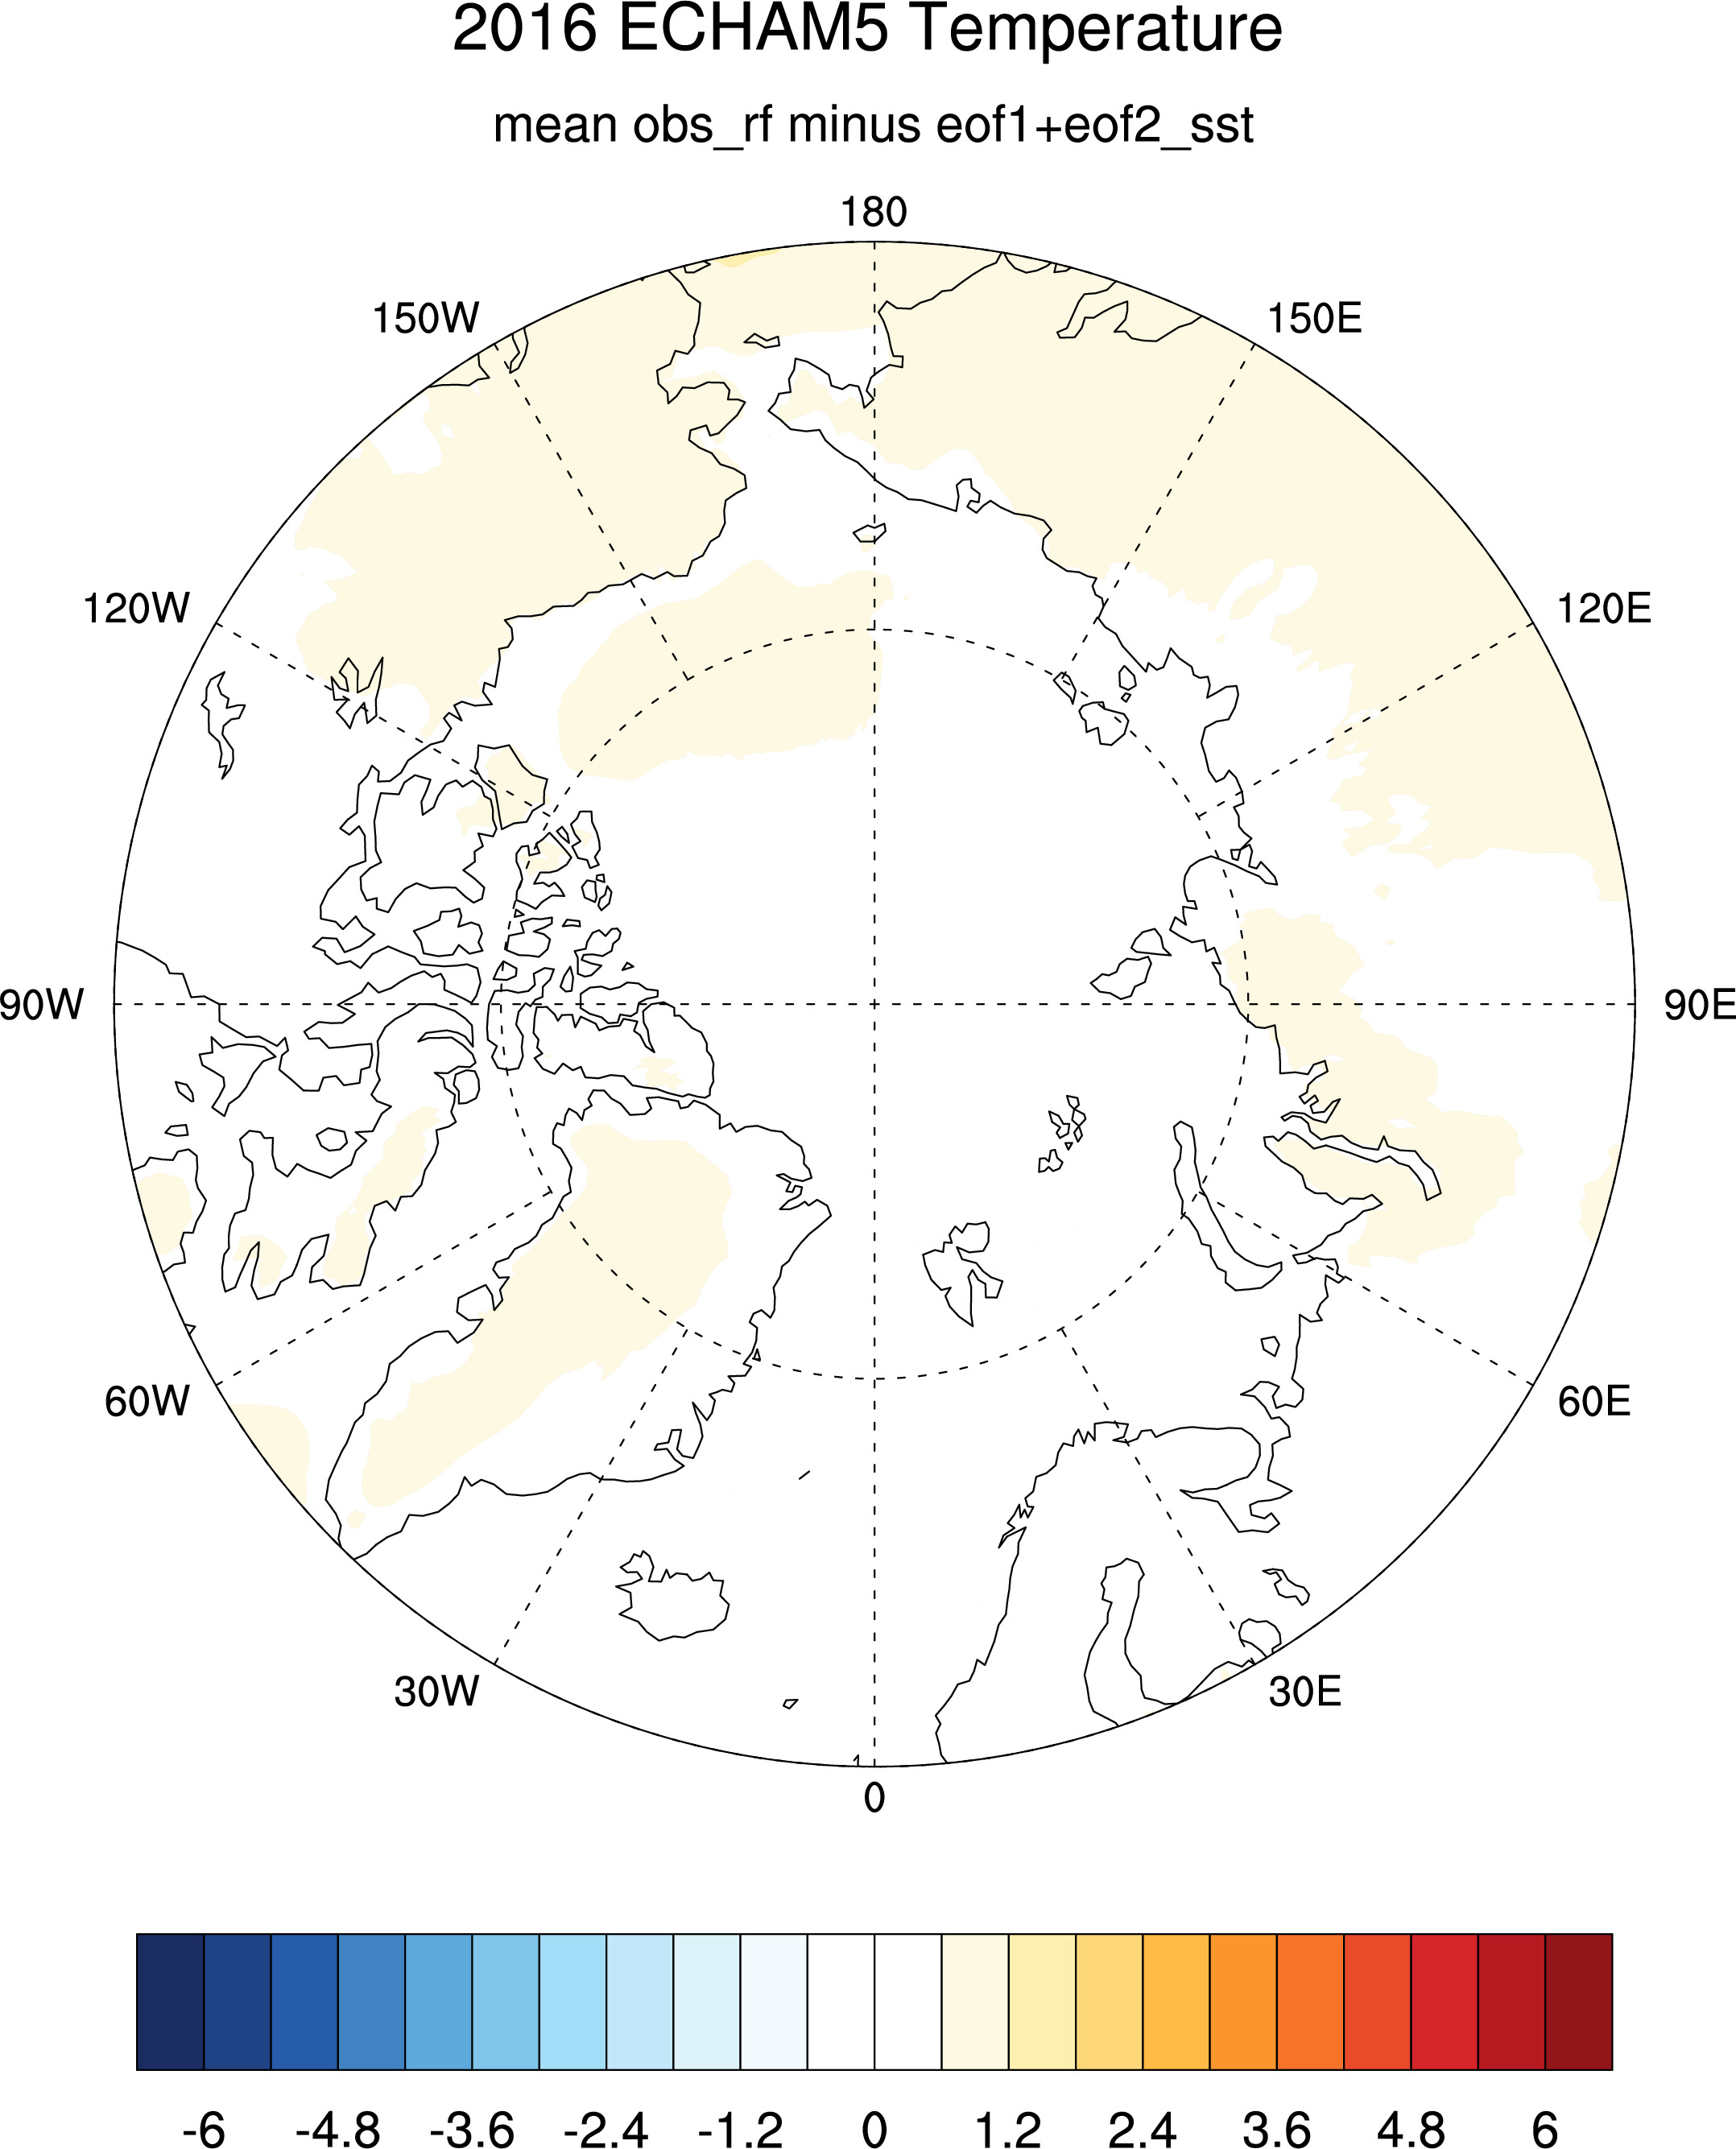
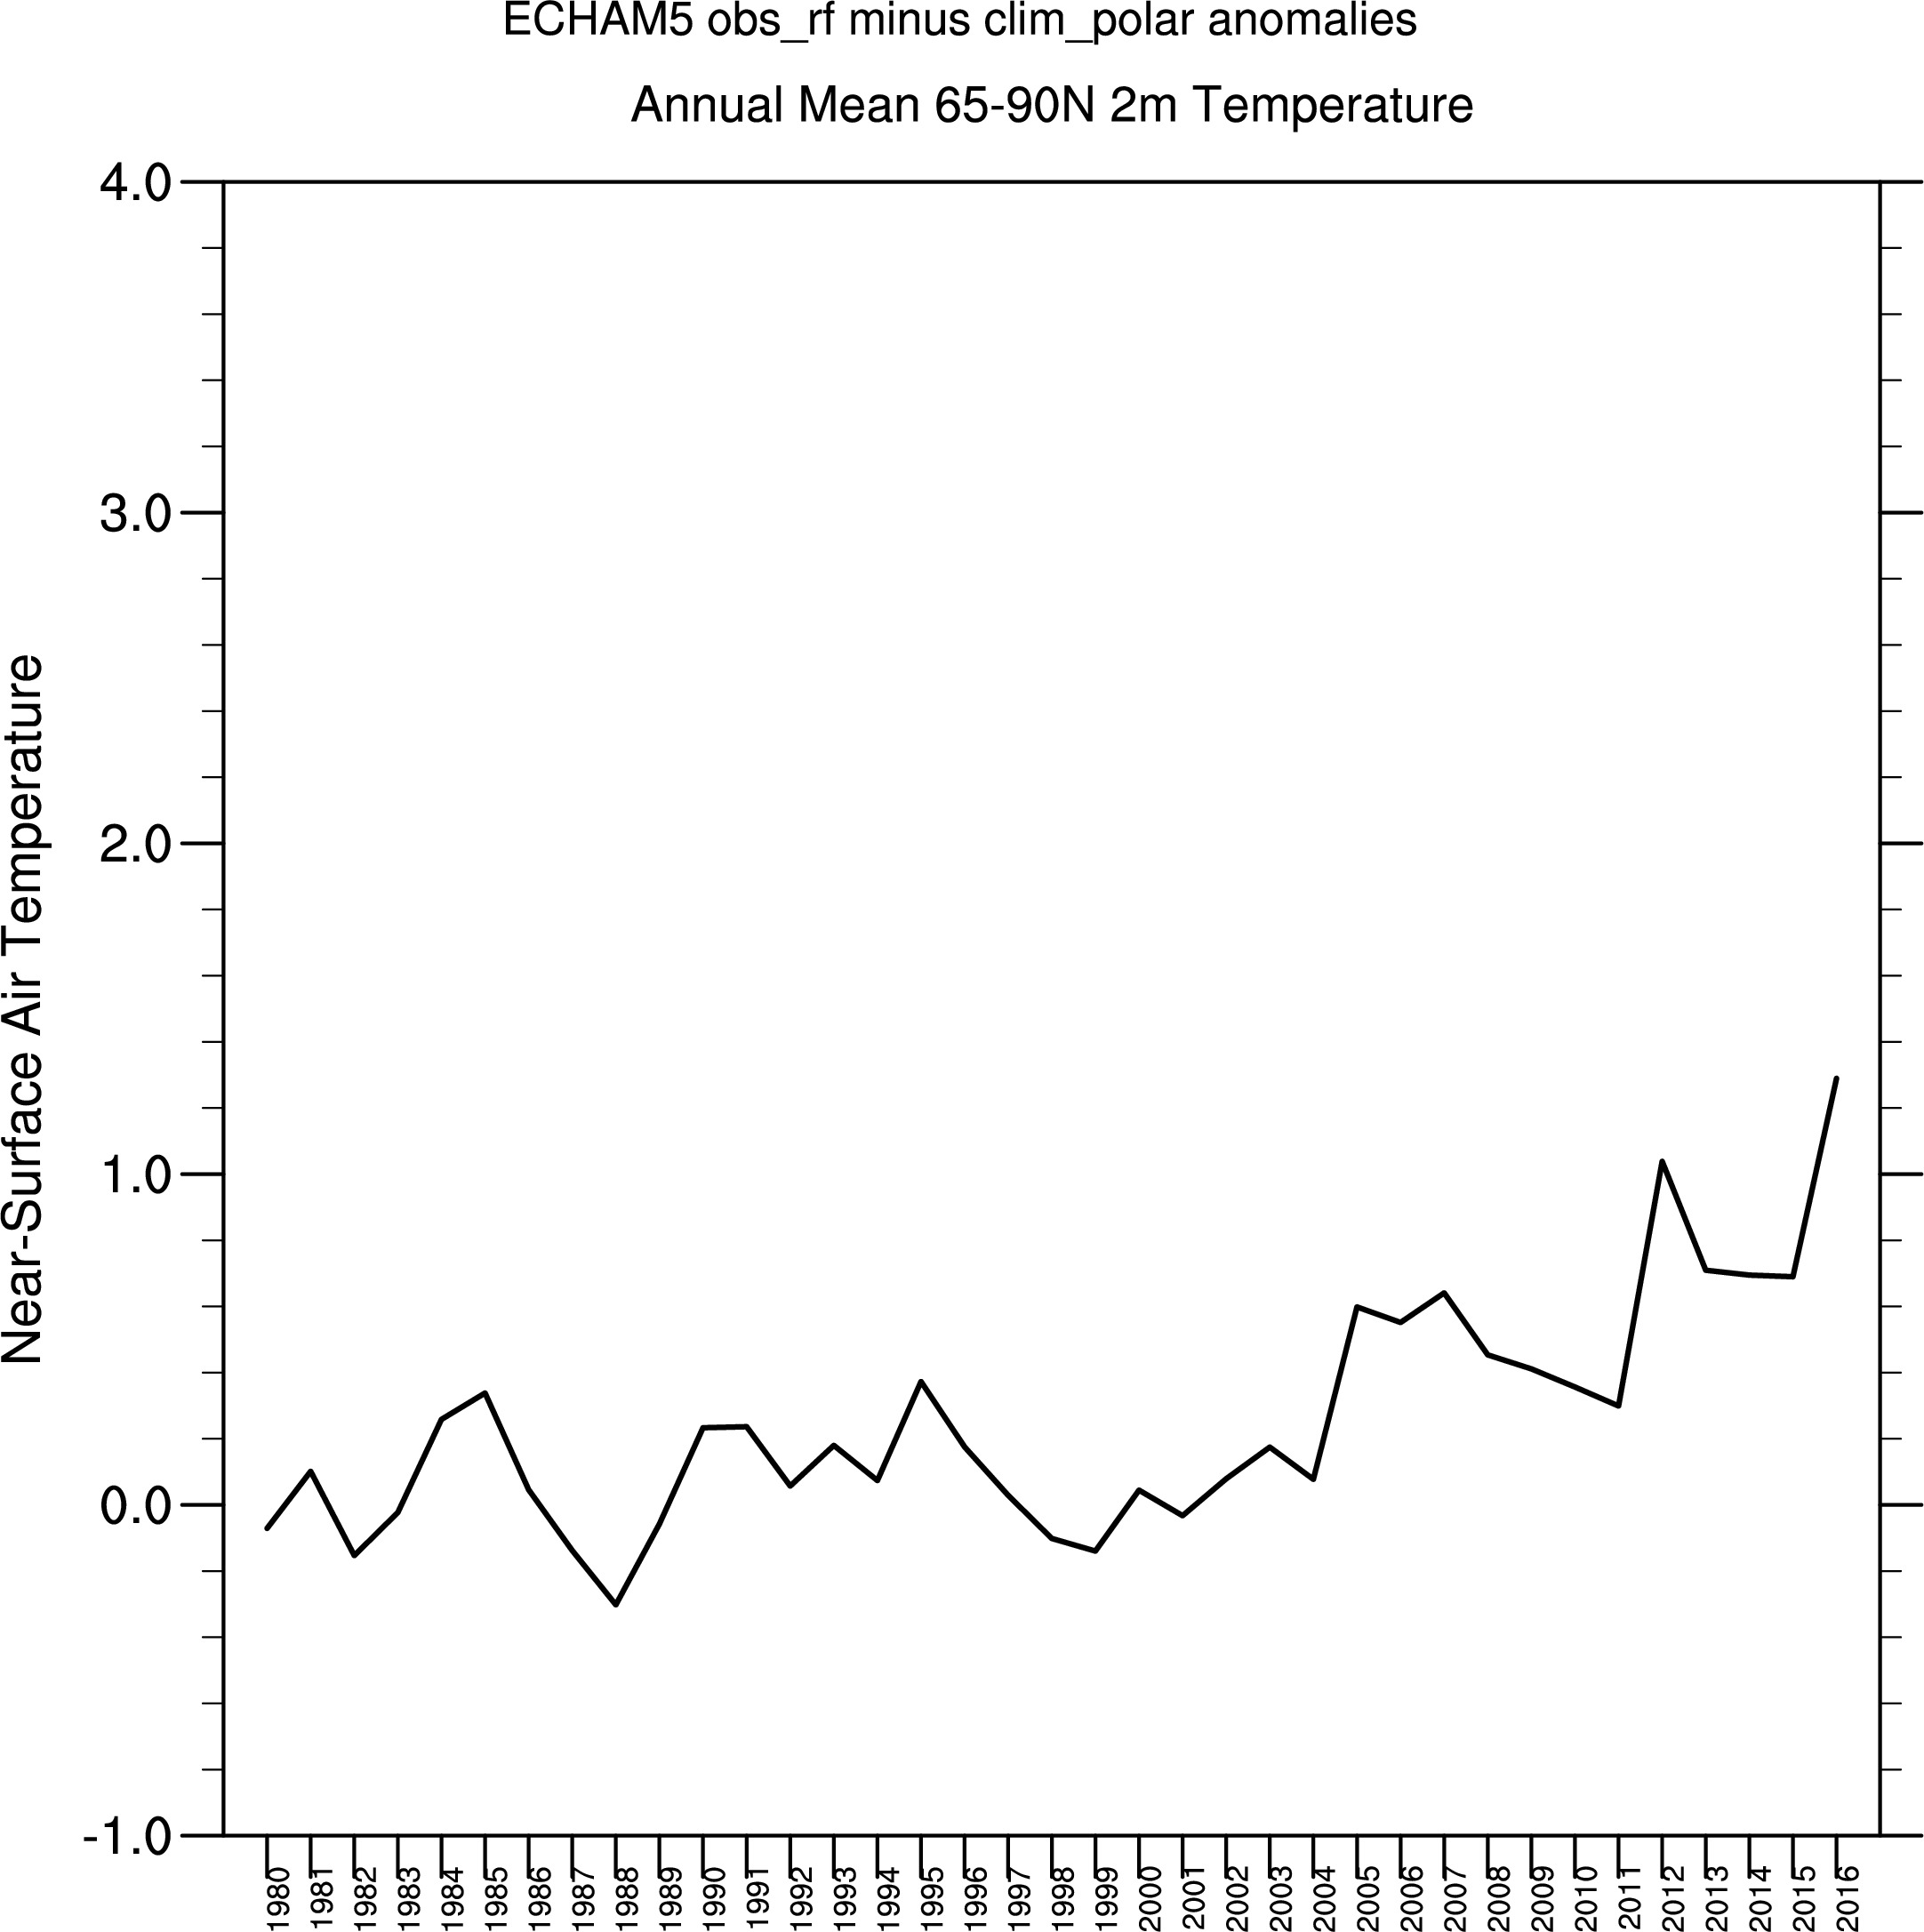
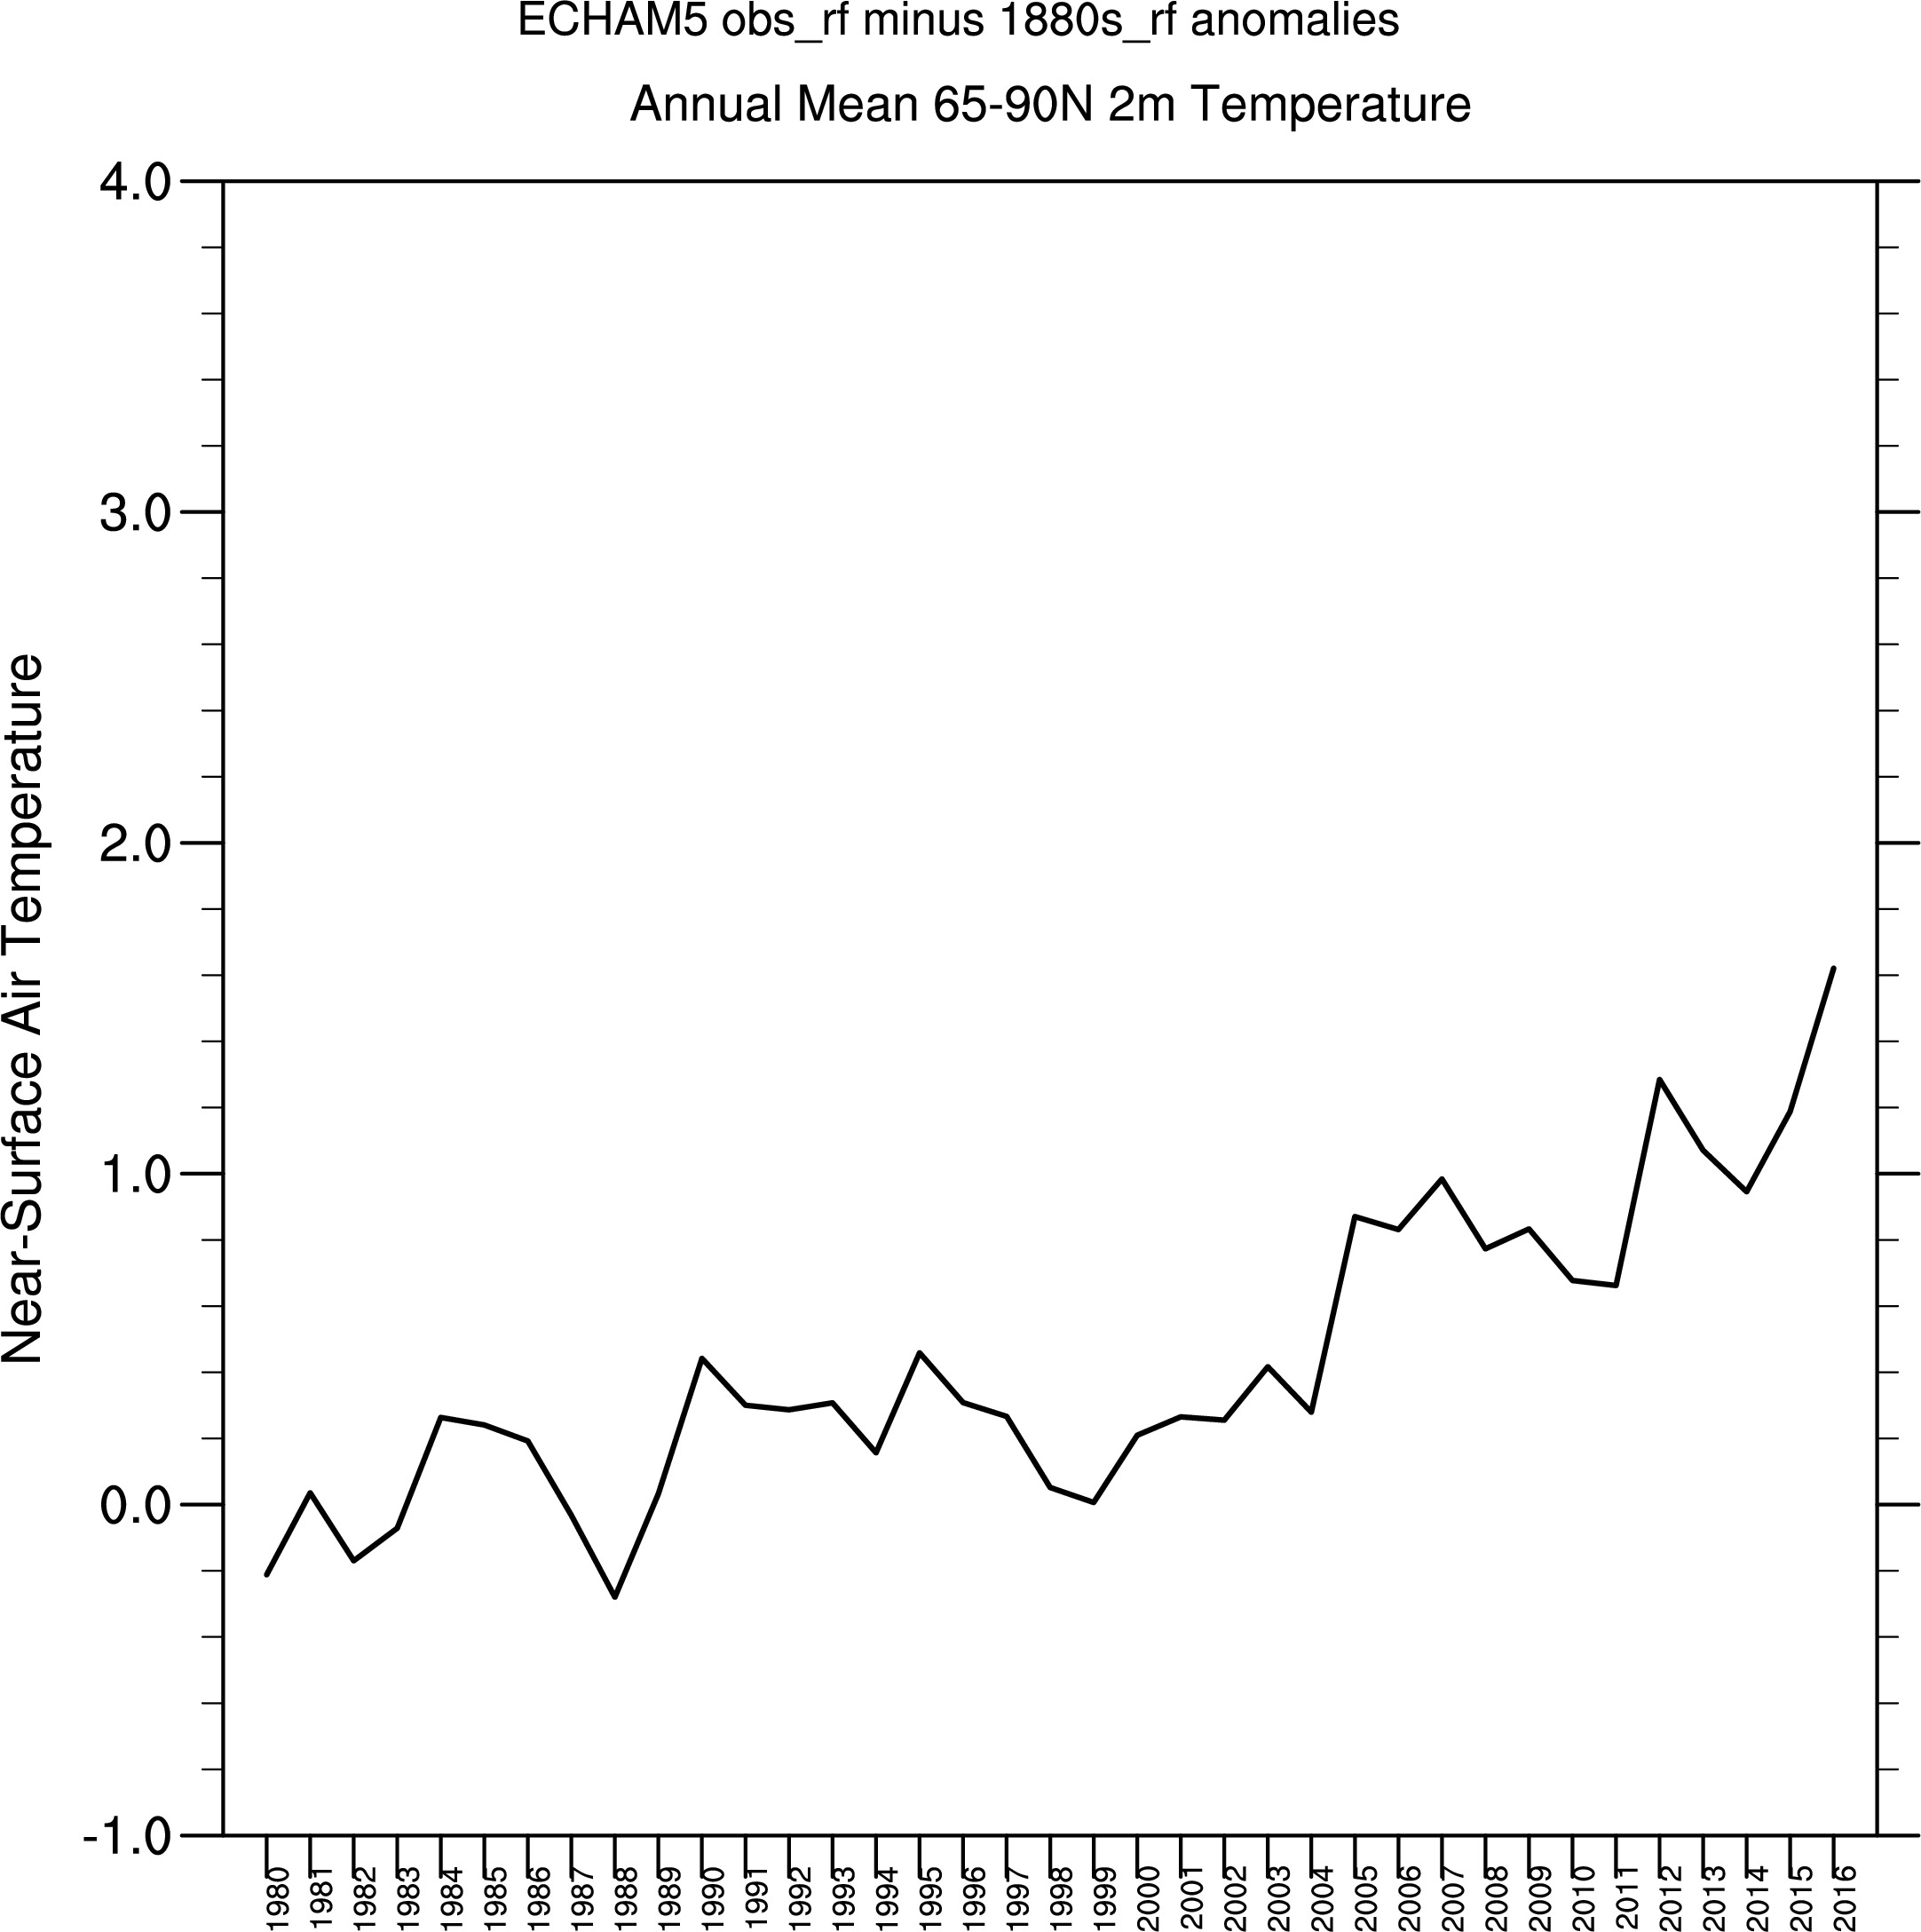
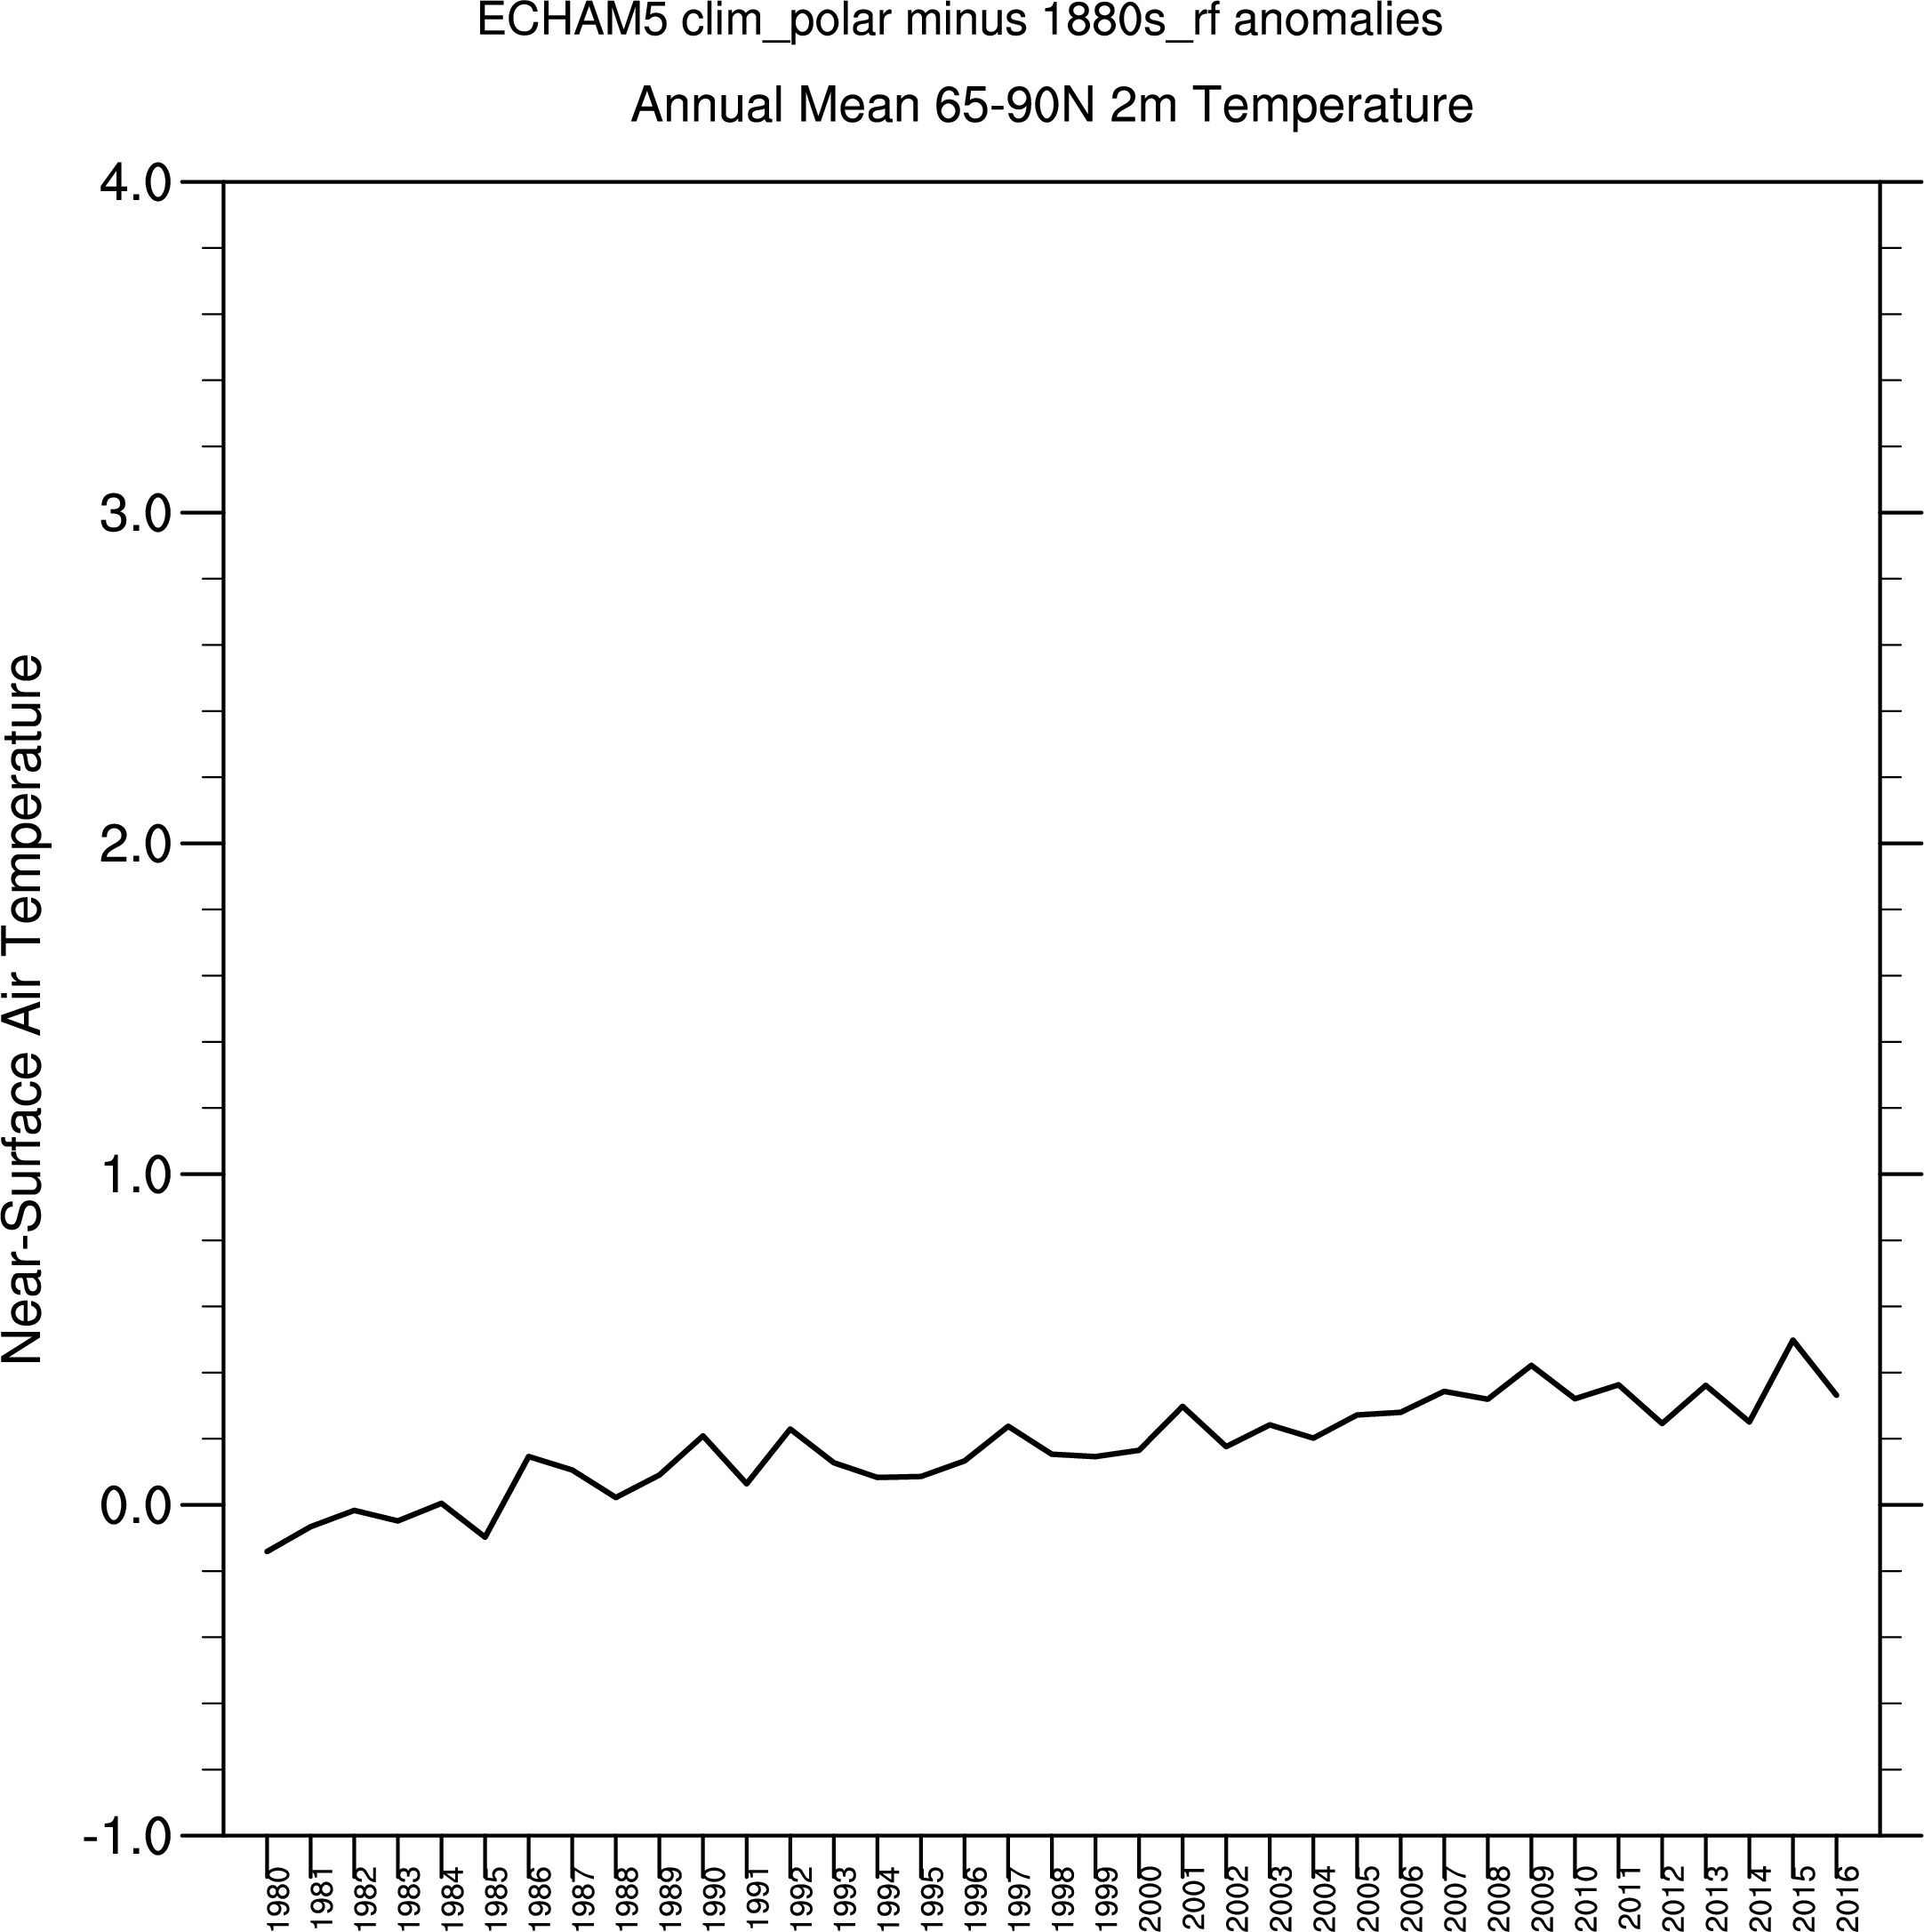
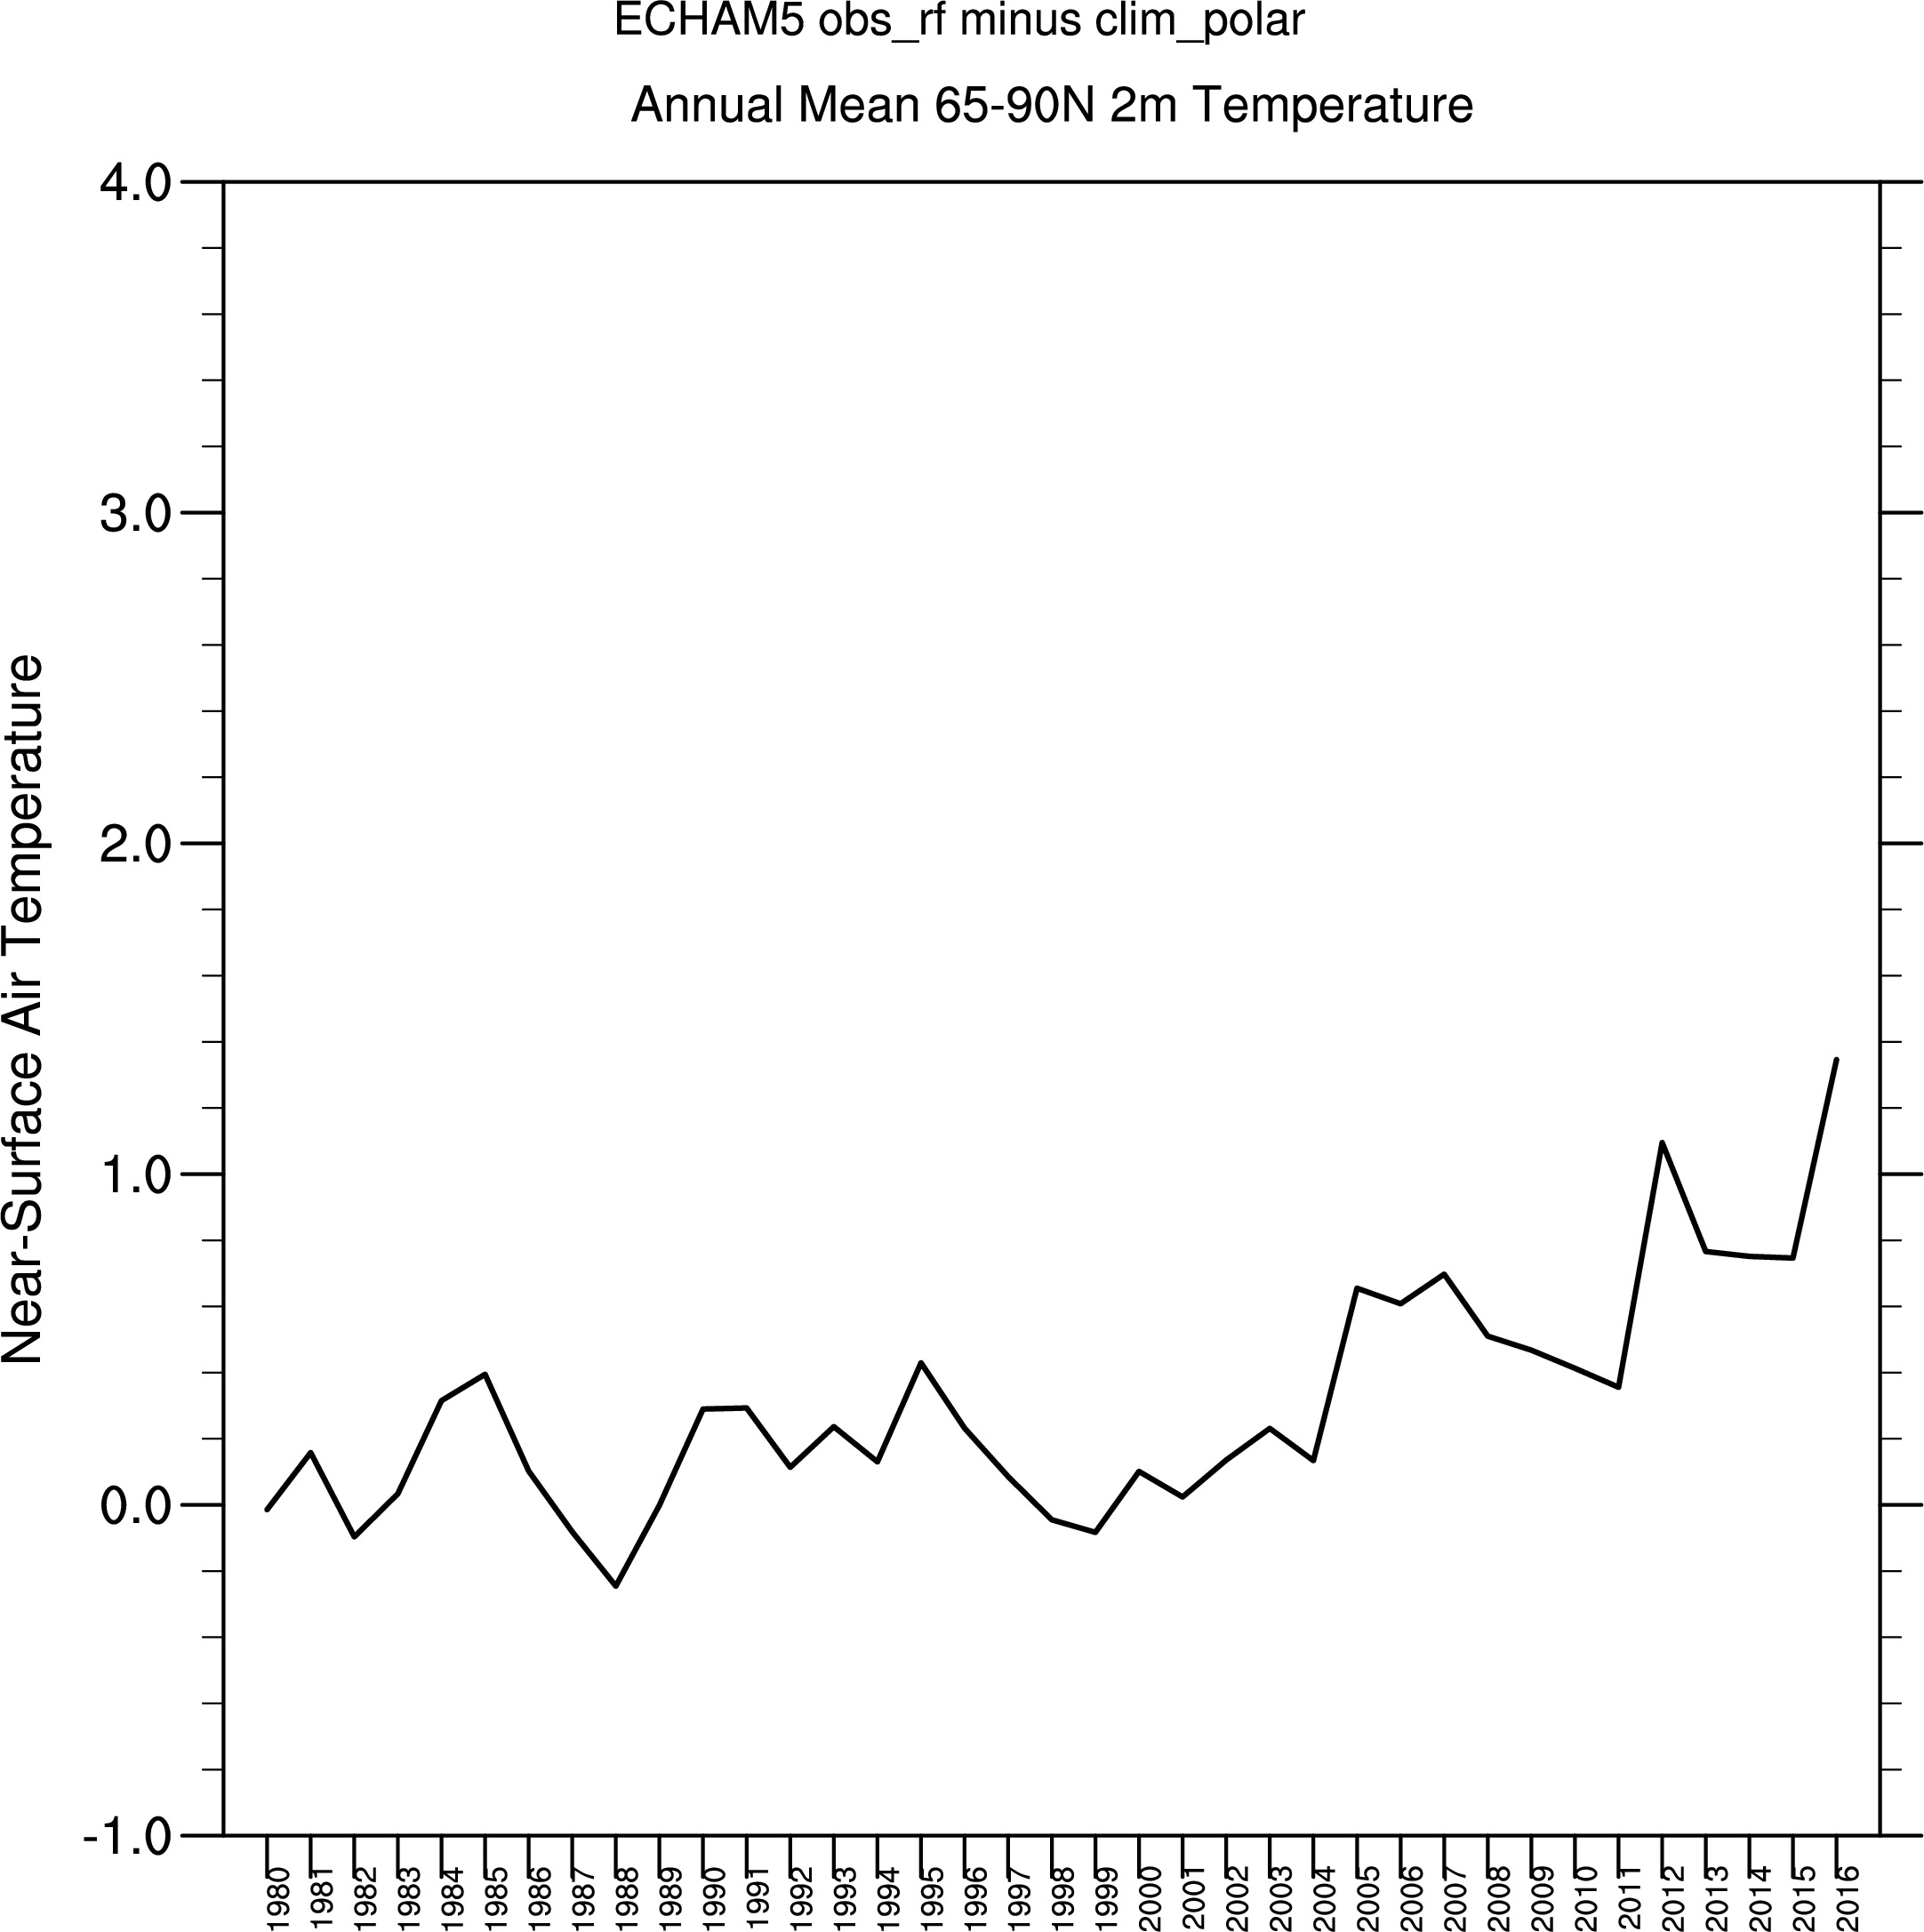
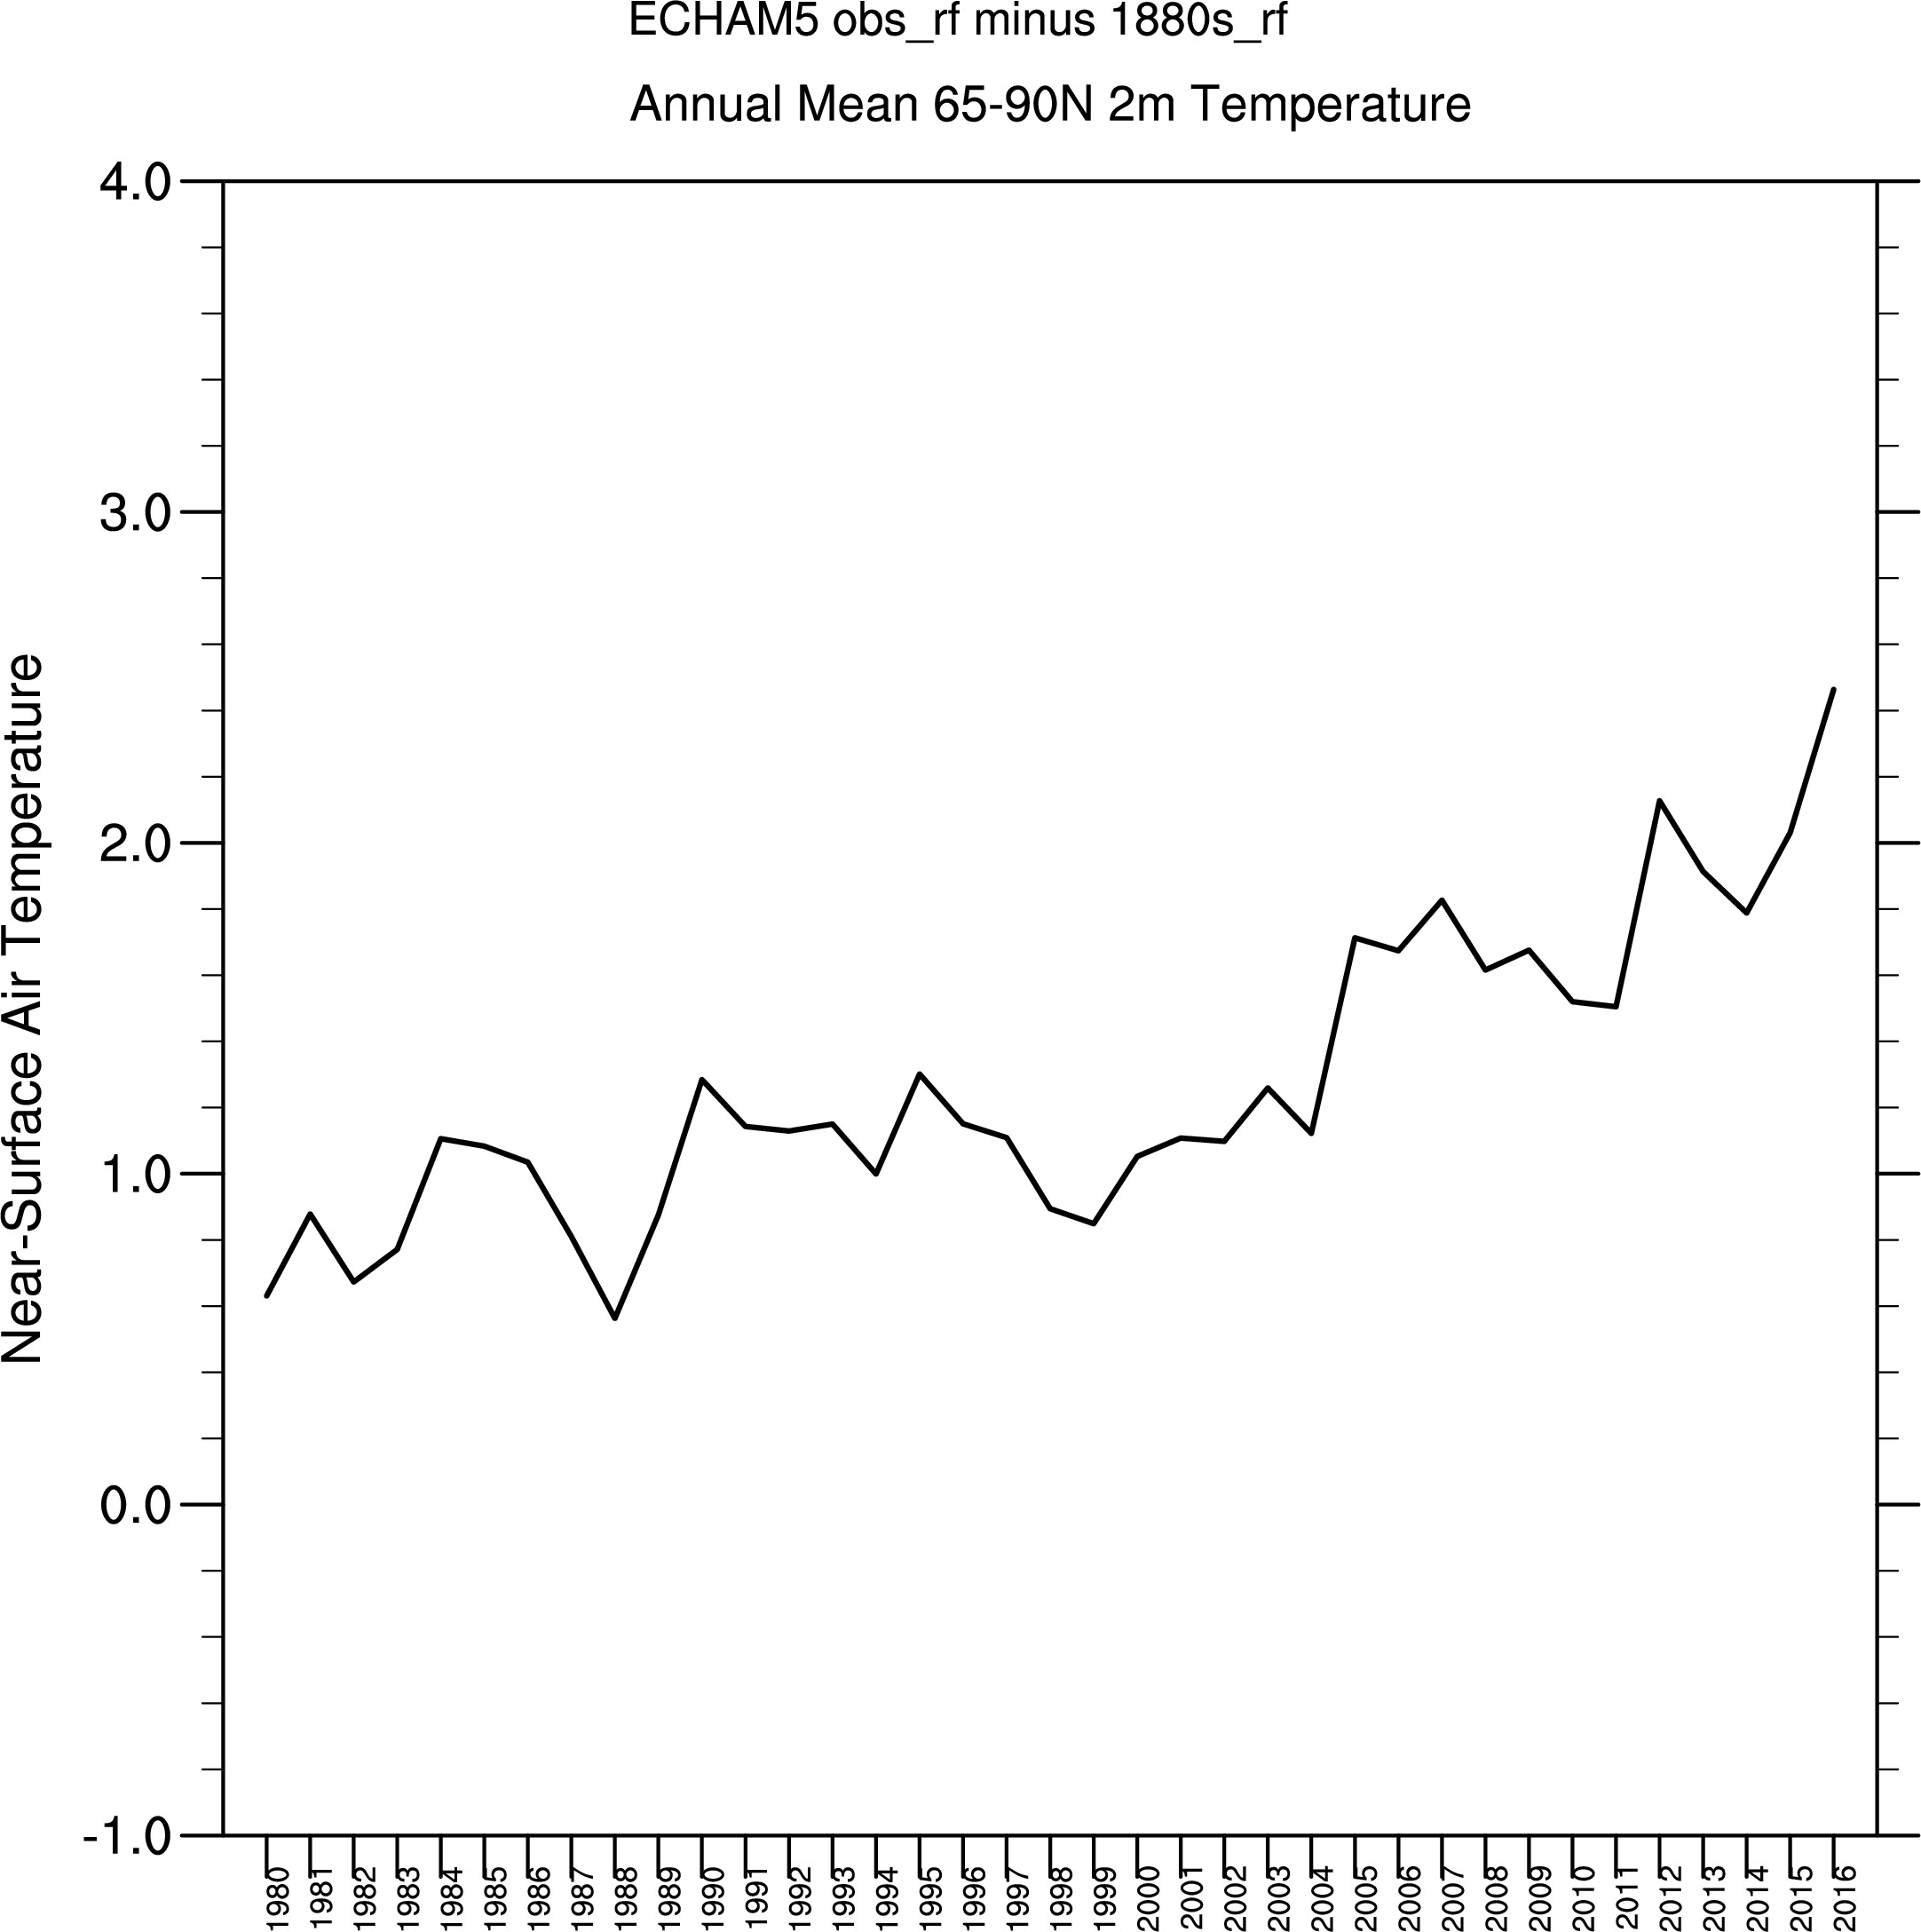
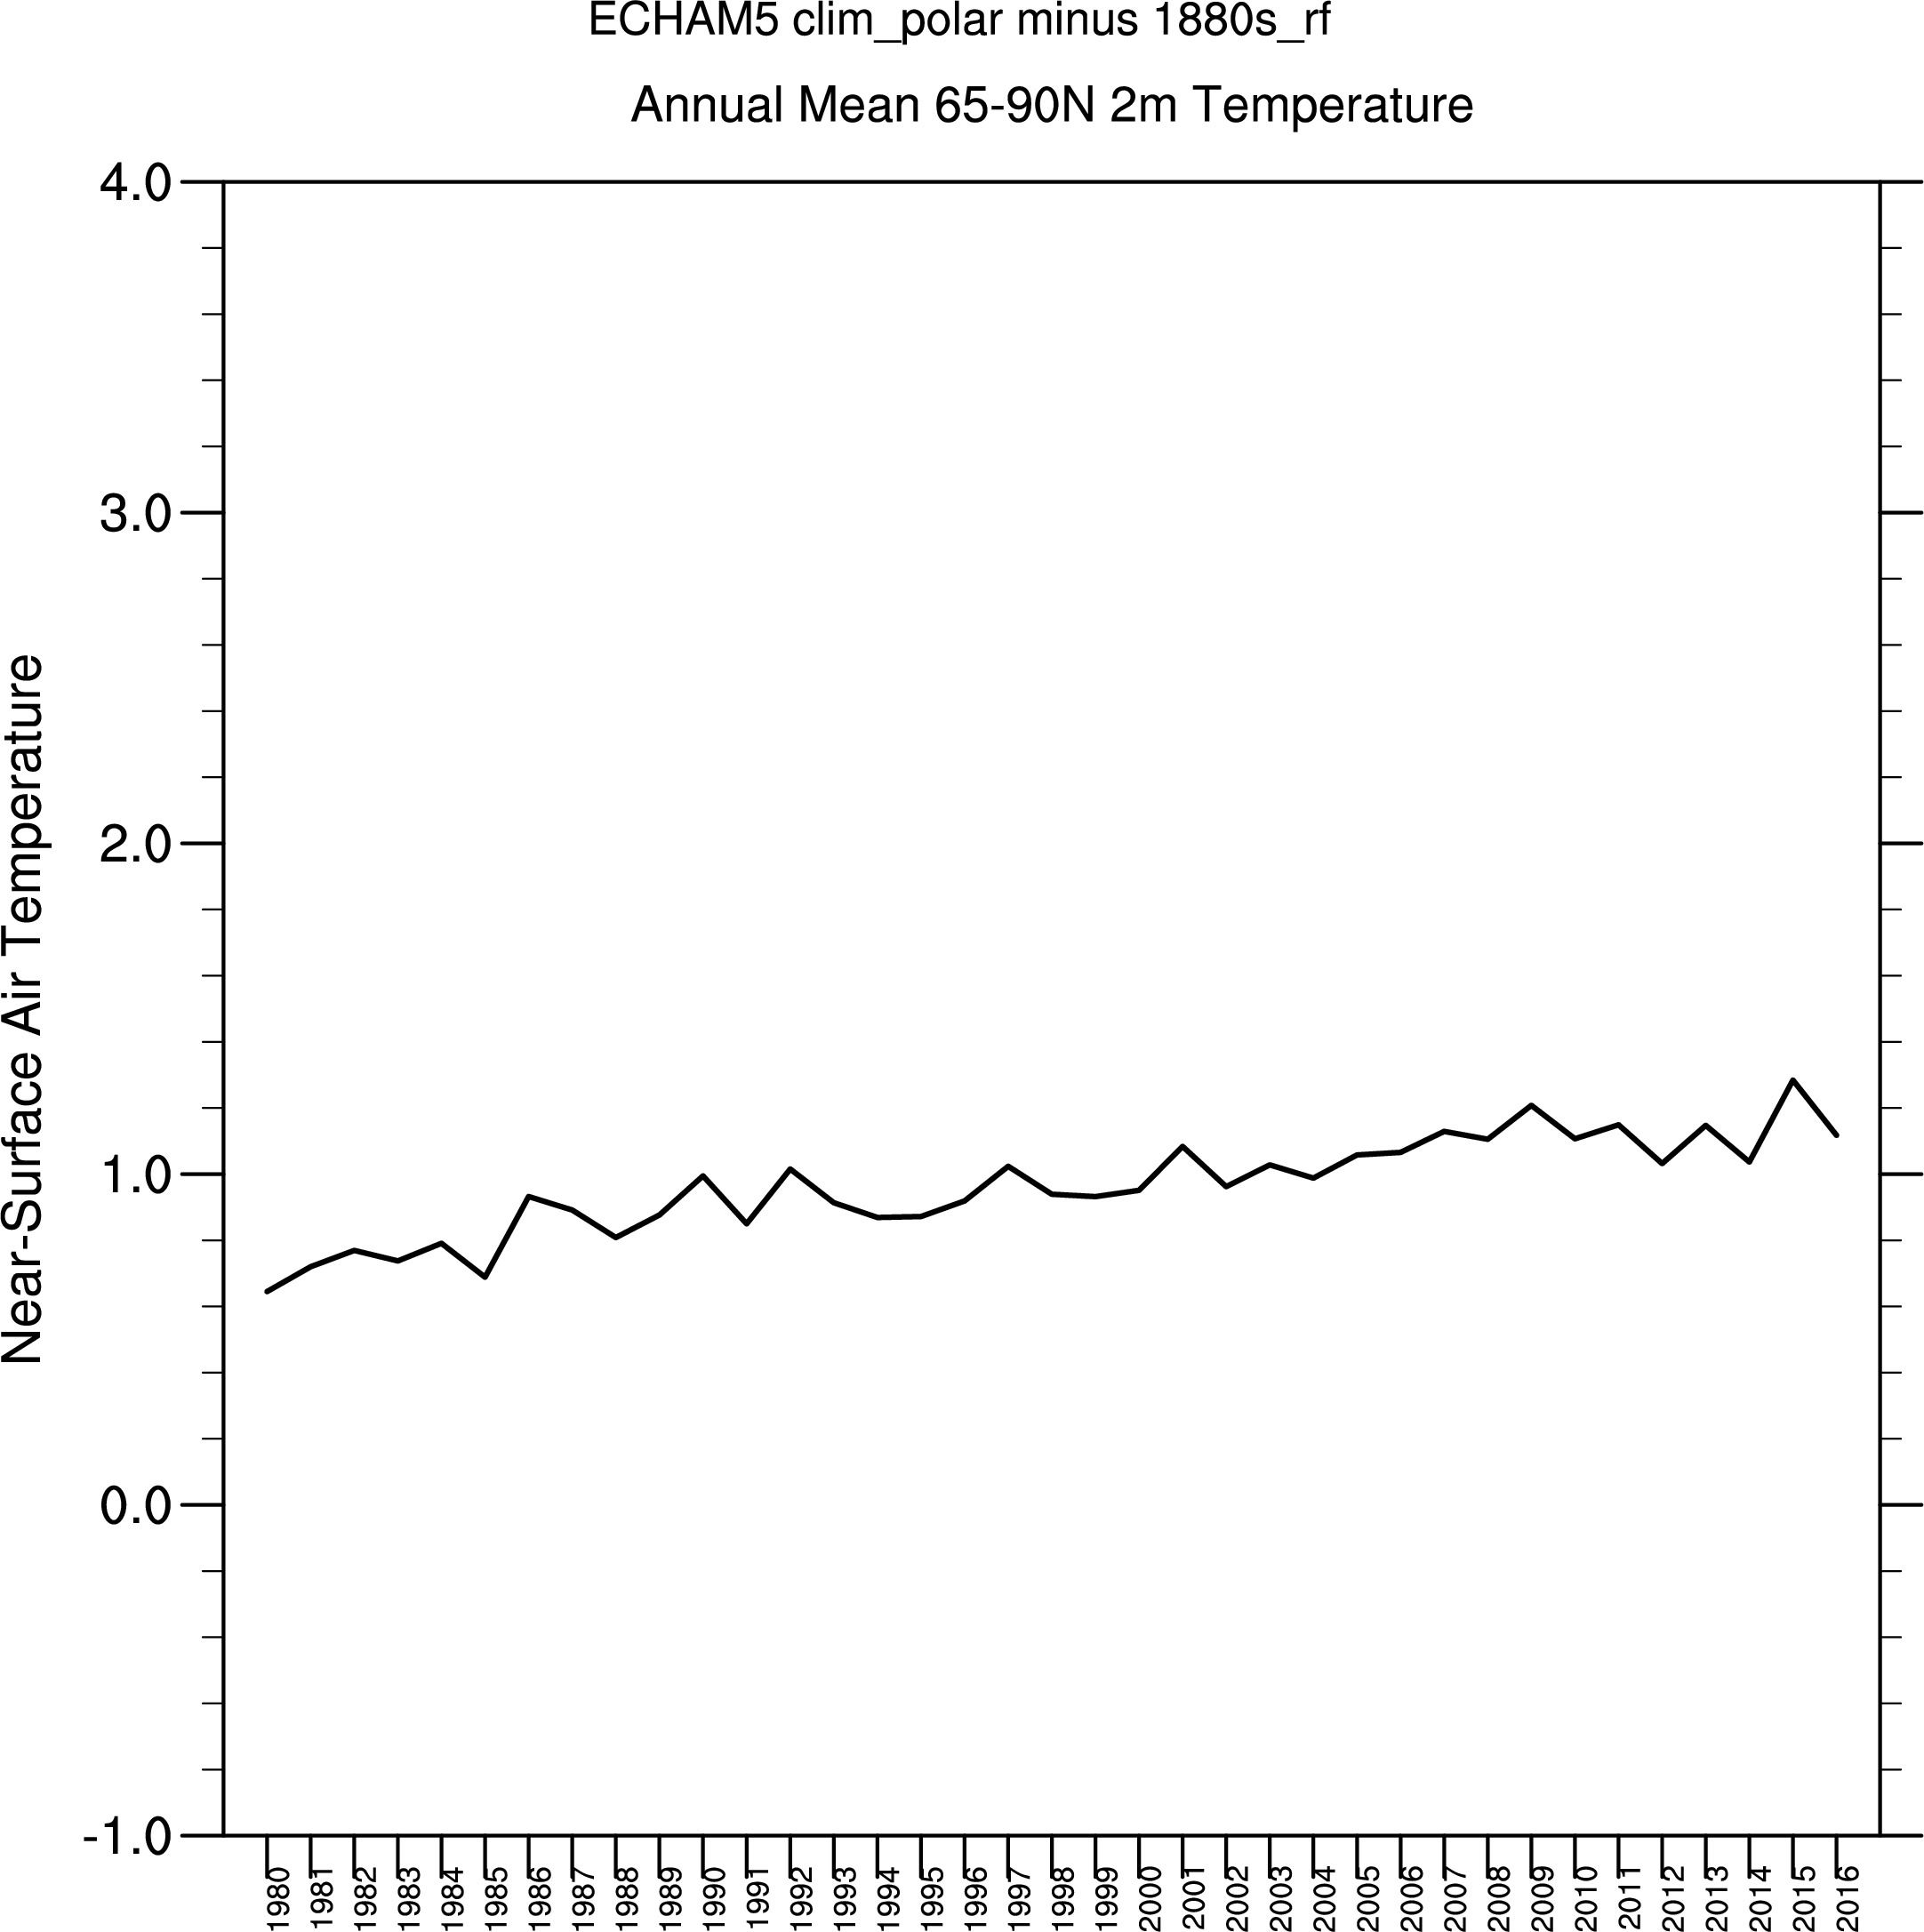
Re. NEW Figure 5: a.) factual minus counterfactual b.) factual minus clim_polar
c.) (factual minus counterfactual) minus (factual minus clim_polar)
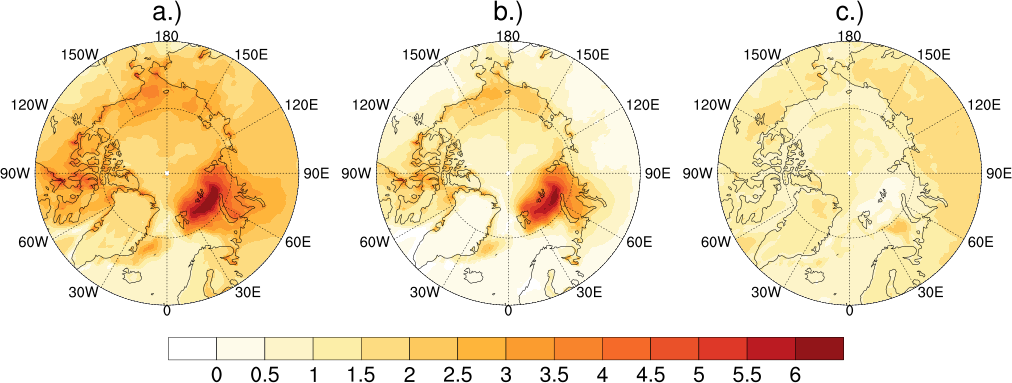
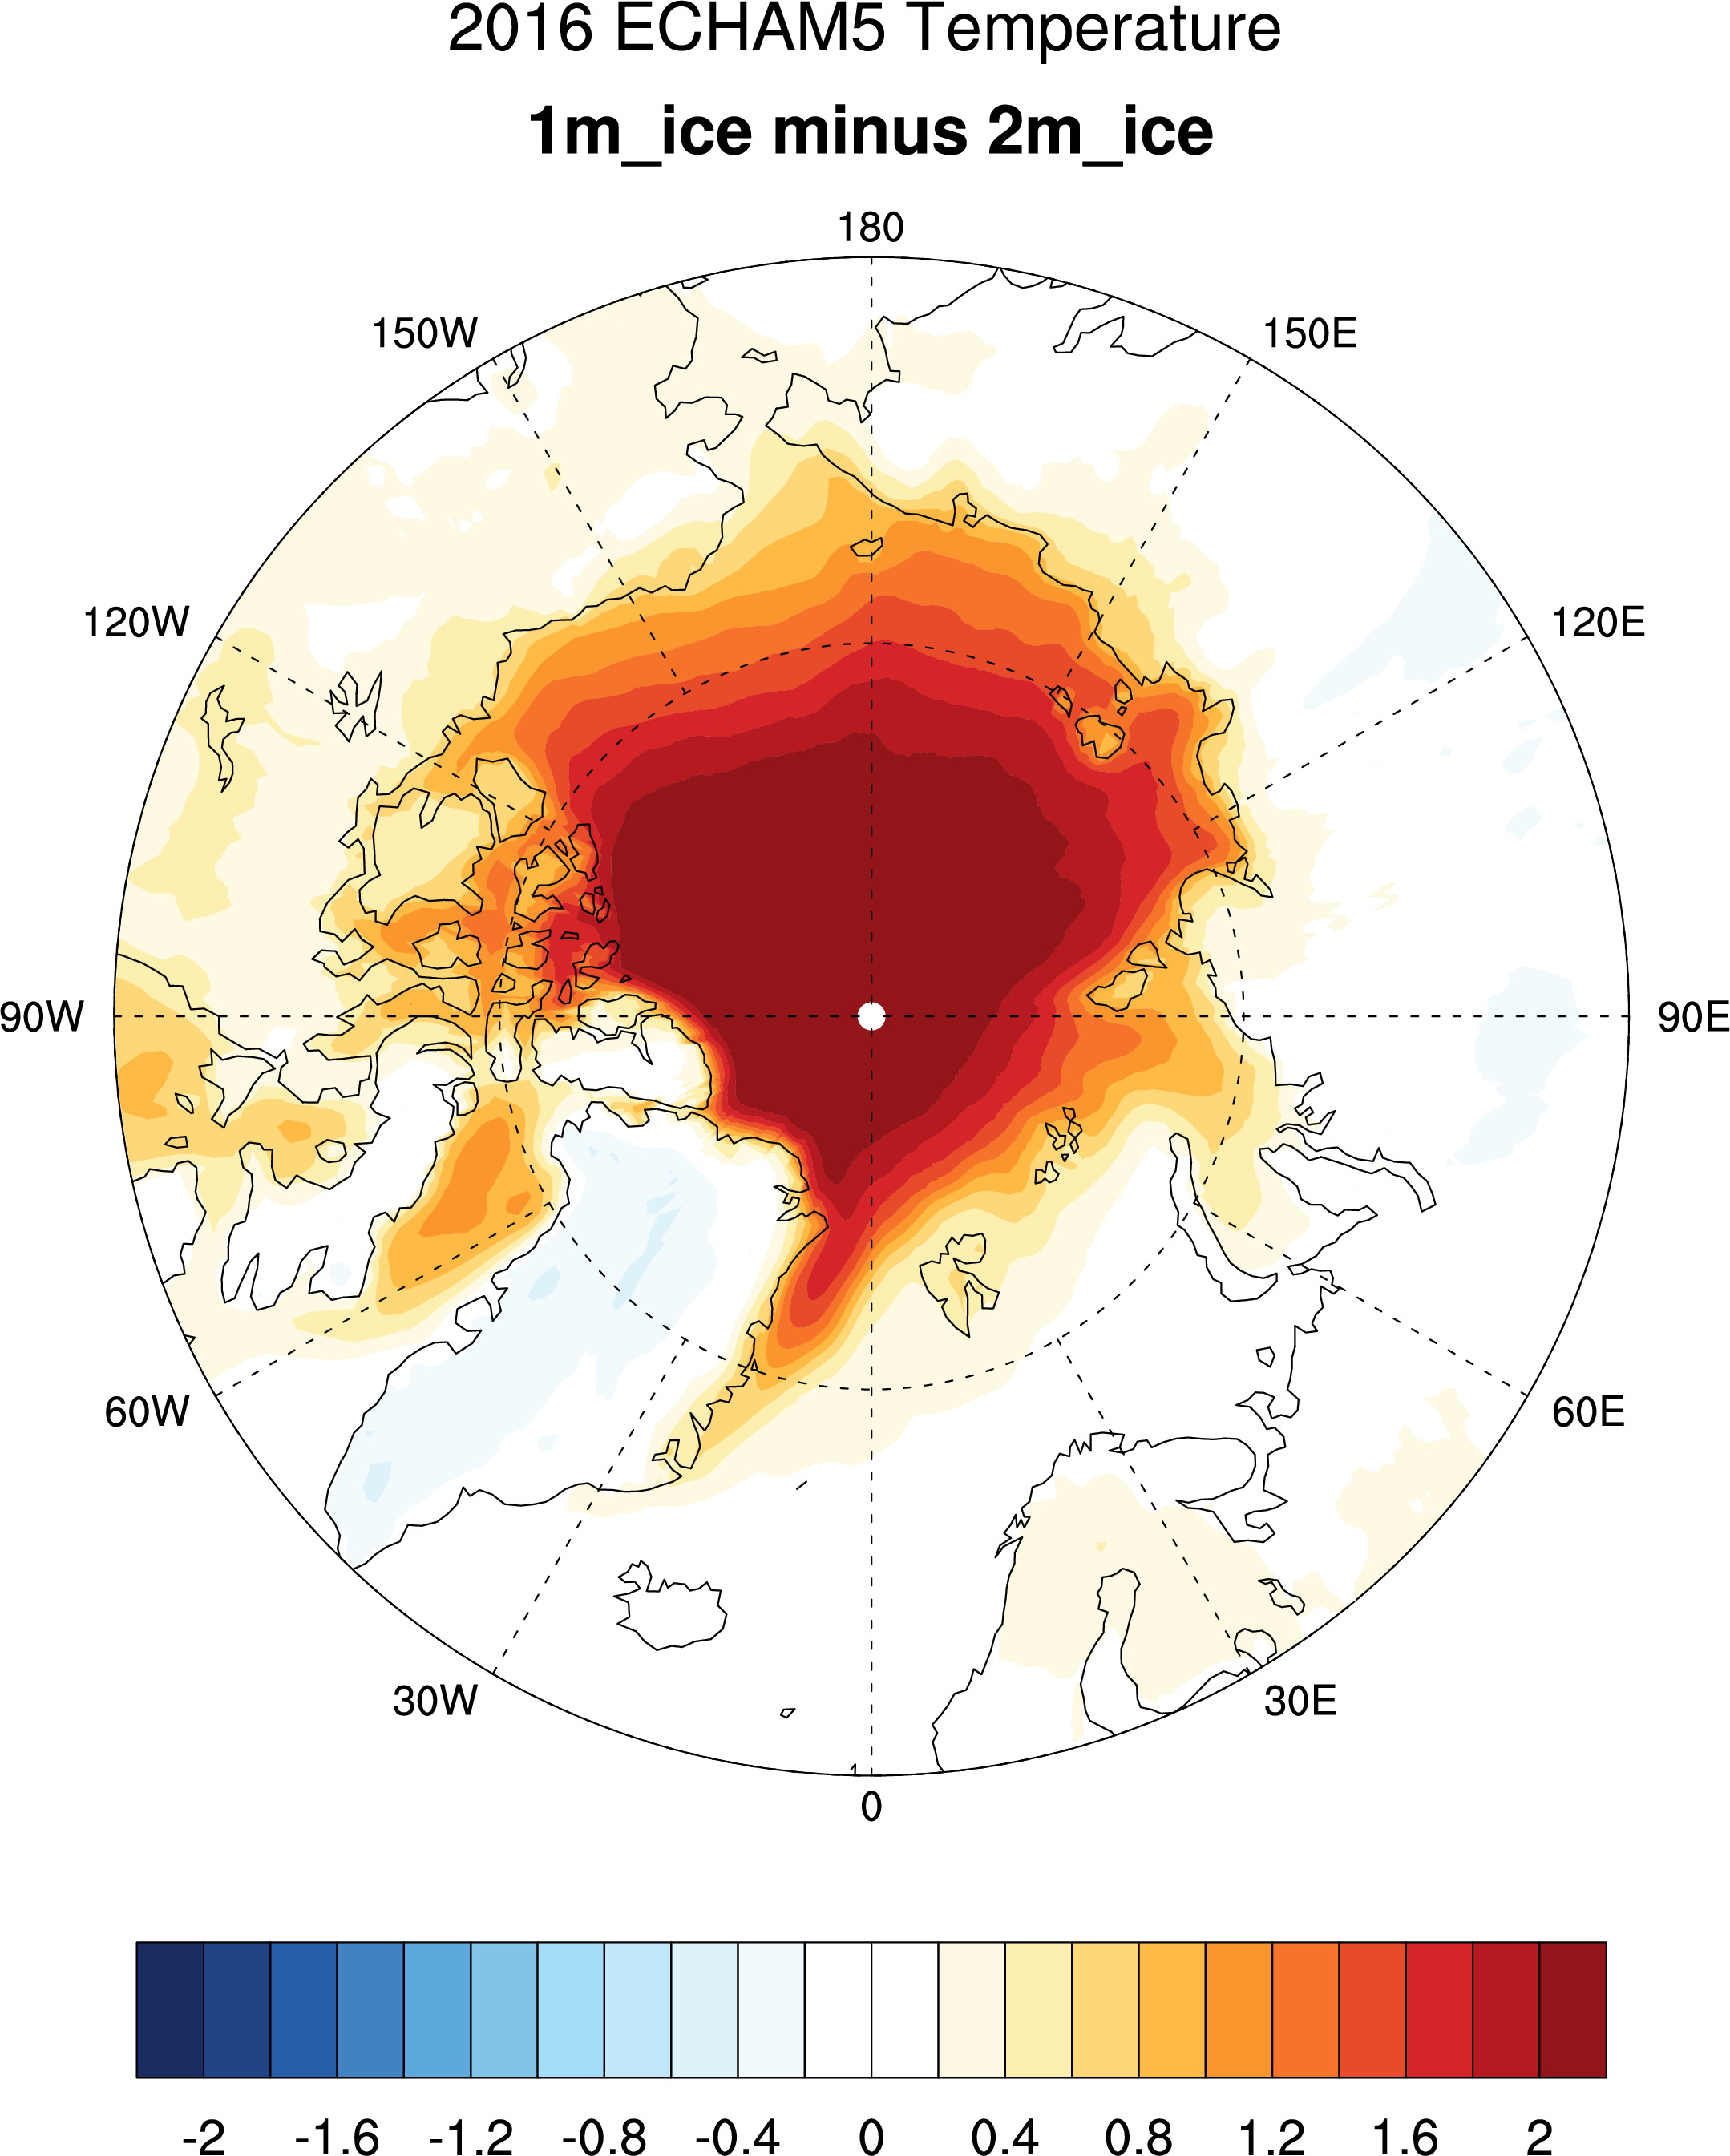
Re. Figure 5: a.) factual minus counterfactual b.) factual minus clim_polar c.) 1m ice minus 2m ice
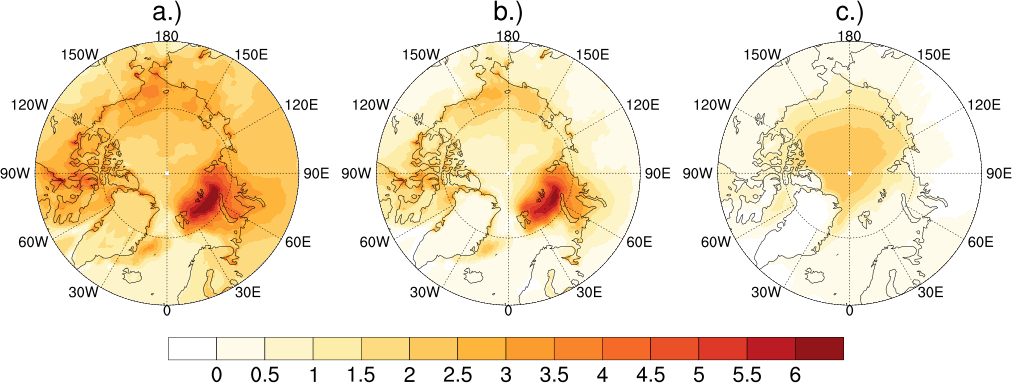
where the weighted area average of above differences are: a.)2.463562 deg C;
b.) 1.346158 deg C; c.) 0.710208 deg C
These are anomaly differences:
Re. Figure 5: a.) factual minus counterfactual b.) factual minus clim_polar c.) clim_polar minus counterfactual d.) 1m ice minus 2m ice
--------------------------
These are all anomalies:
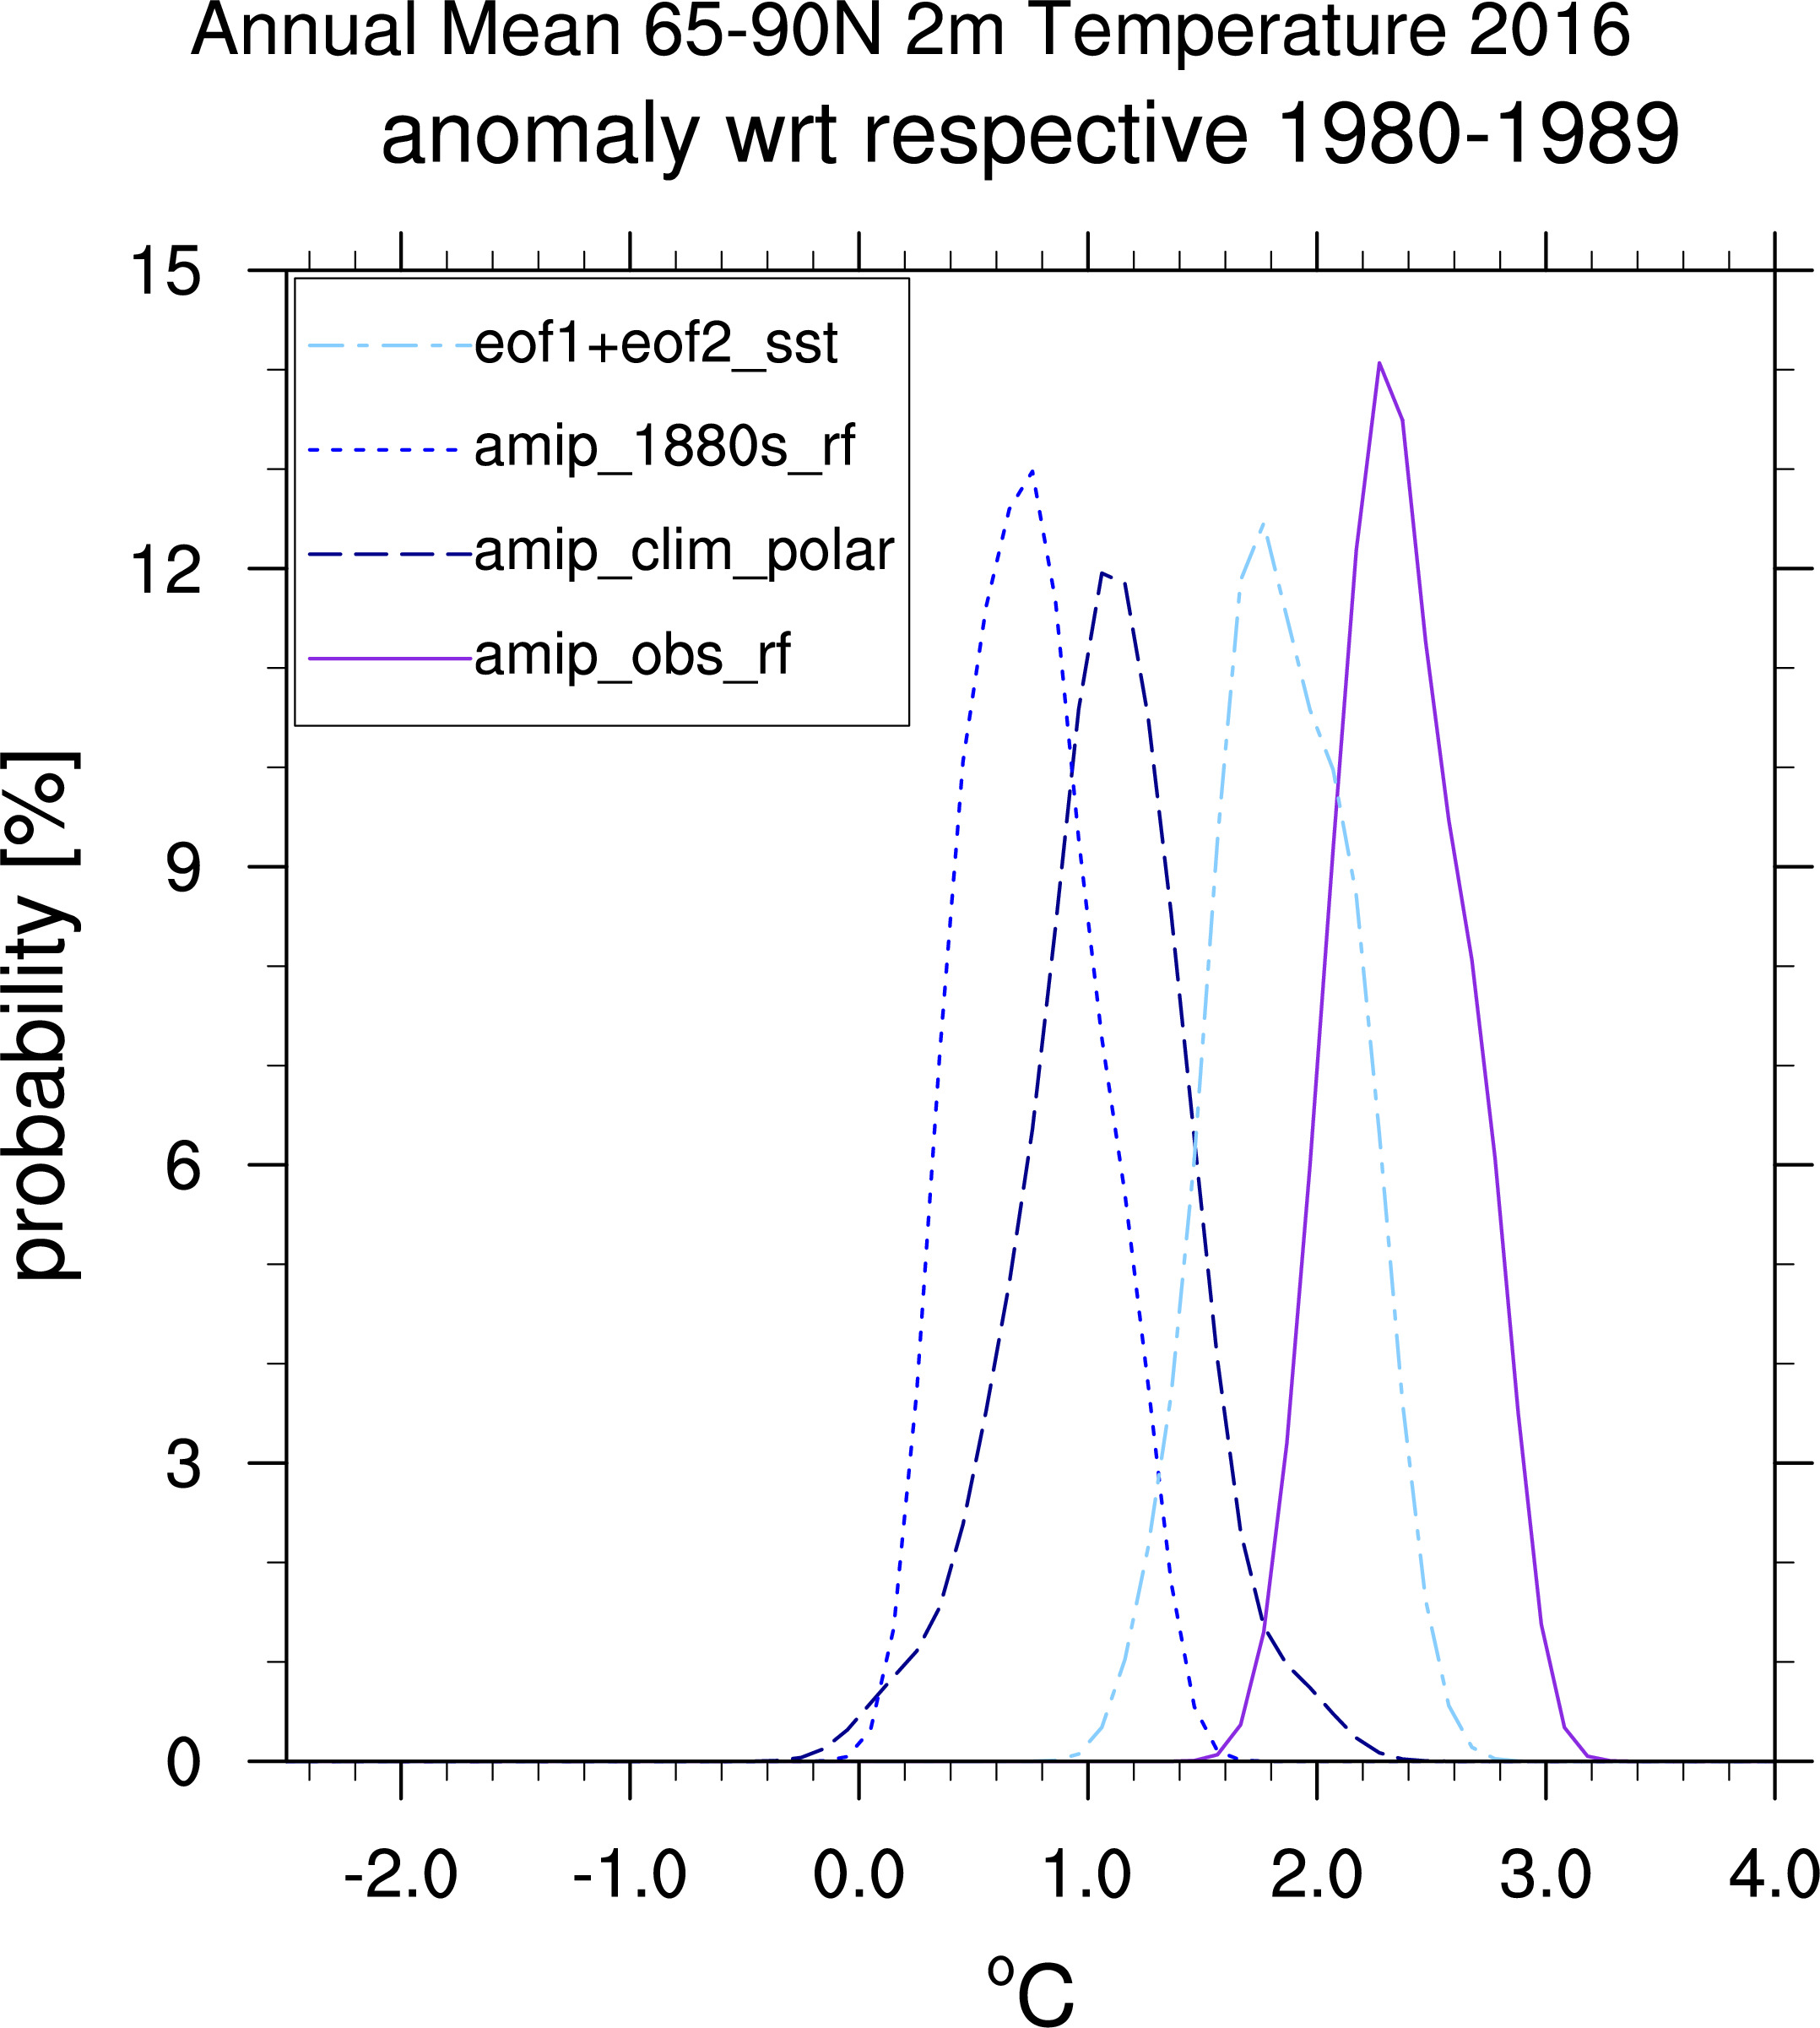
Re. Figure 6:
Anomalies with respect to amip_obs_rf climatology:
Anomalies with respect to respective climatologies:
-----------------
These are all anomalies:
Re. Figure S2:
------------------------------------------------------------------------
------------------------------------------------------------------------------------------------------------------------------------------------------------
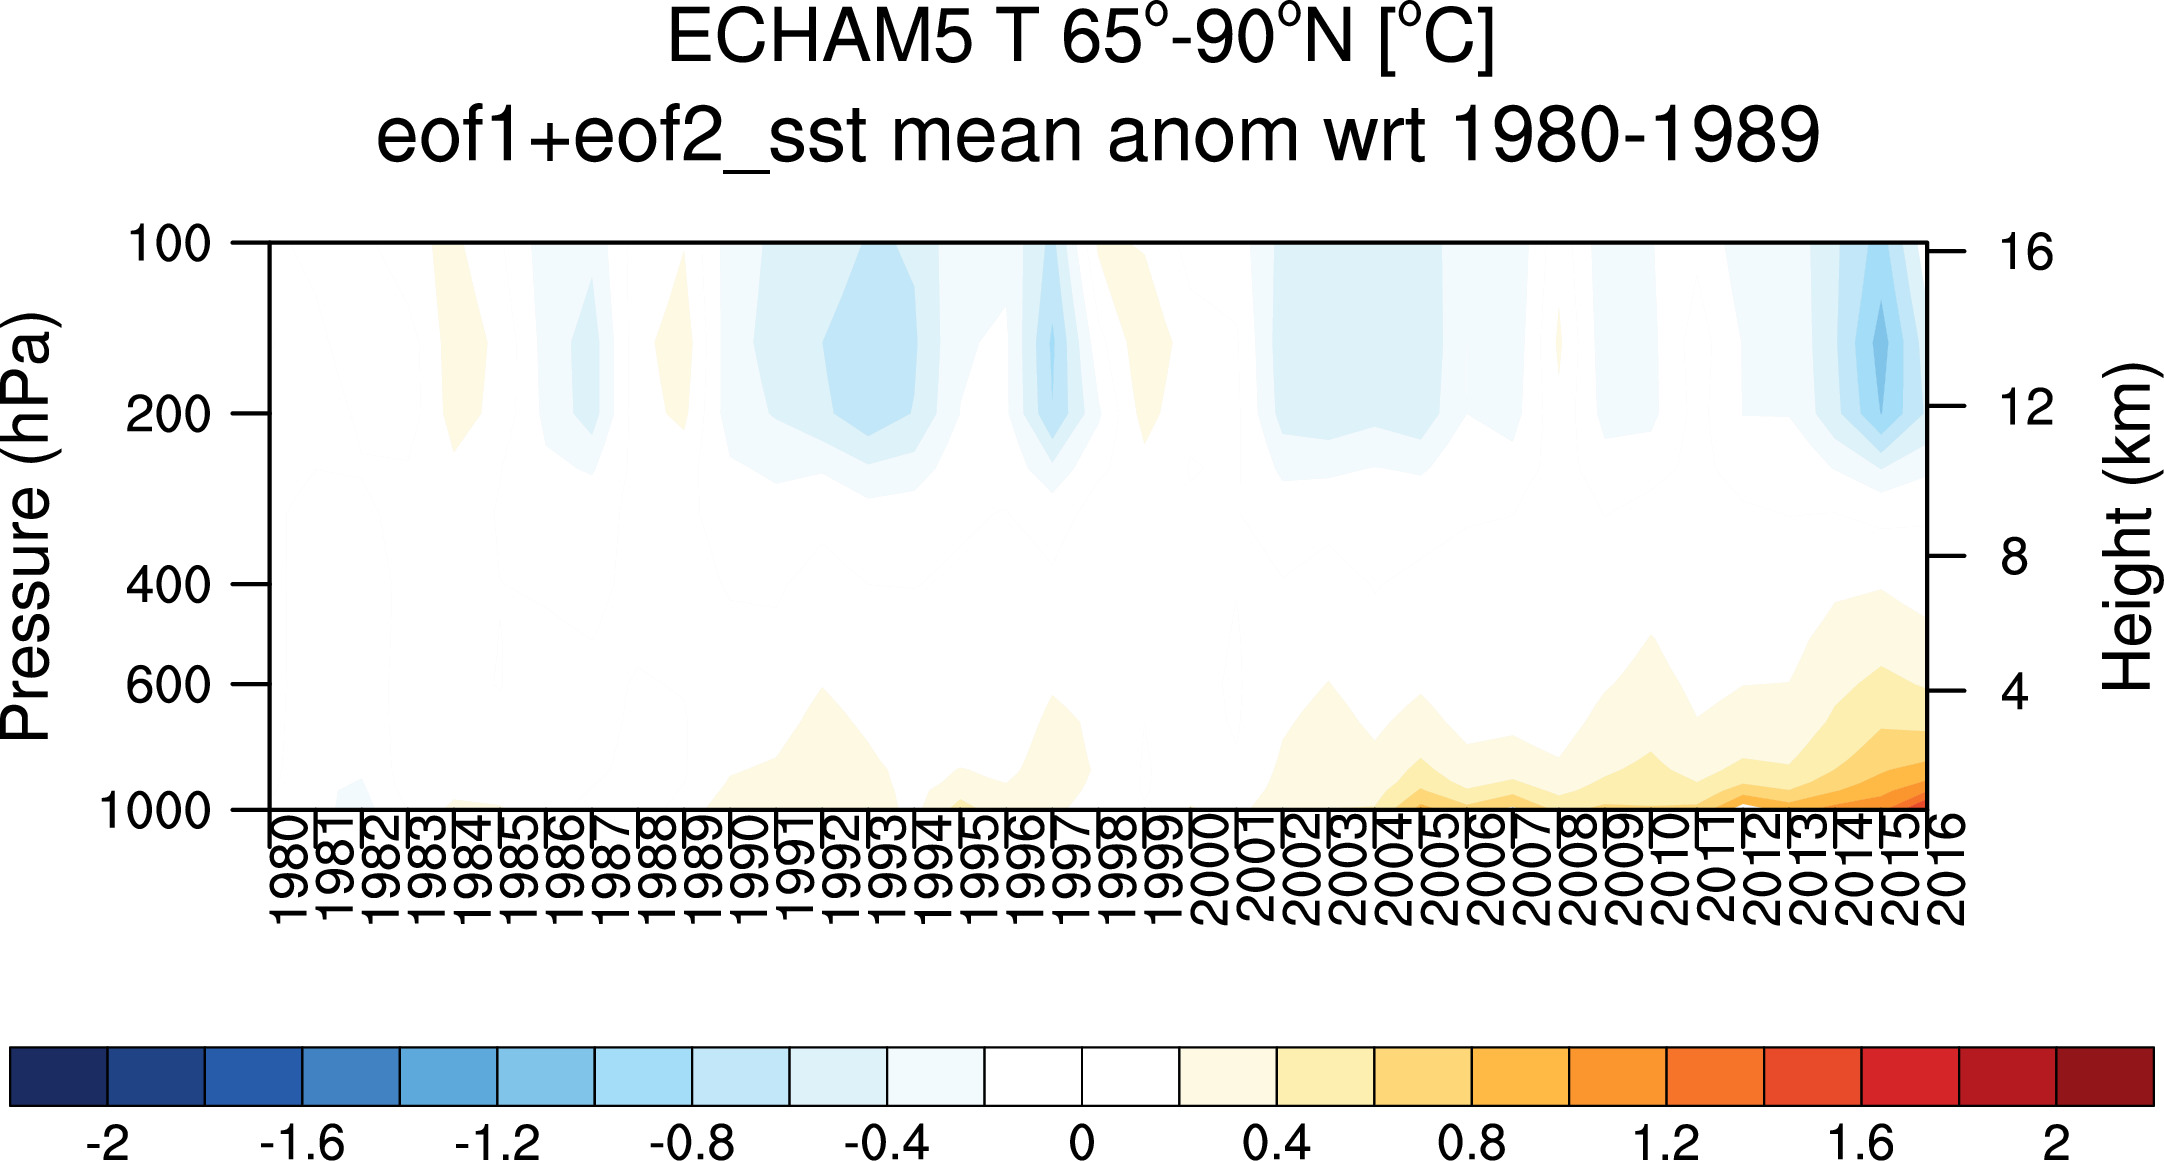
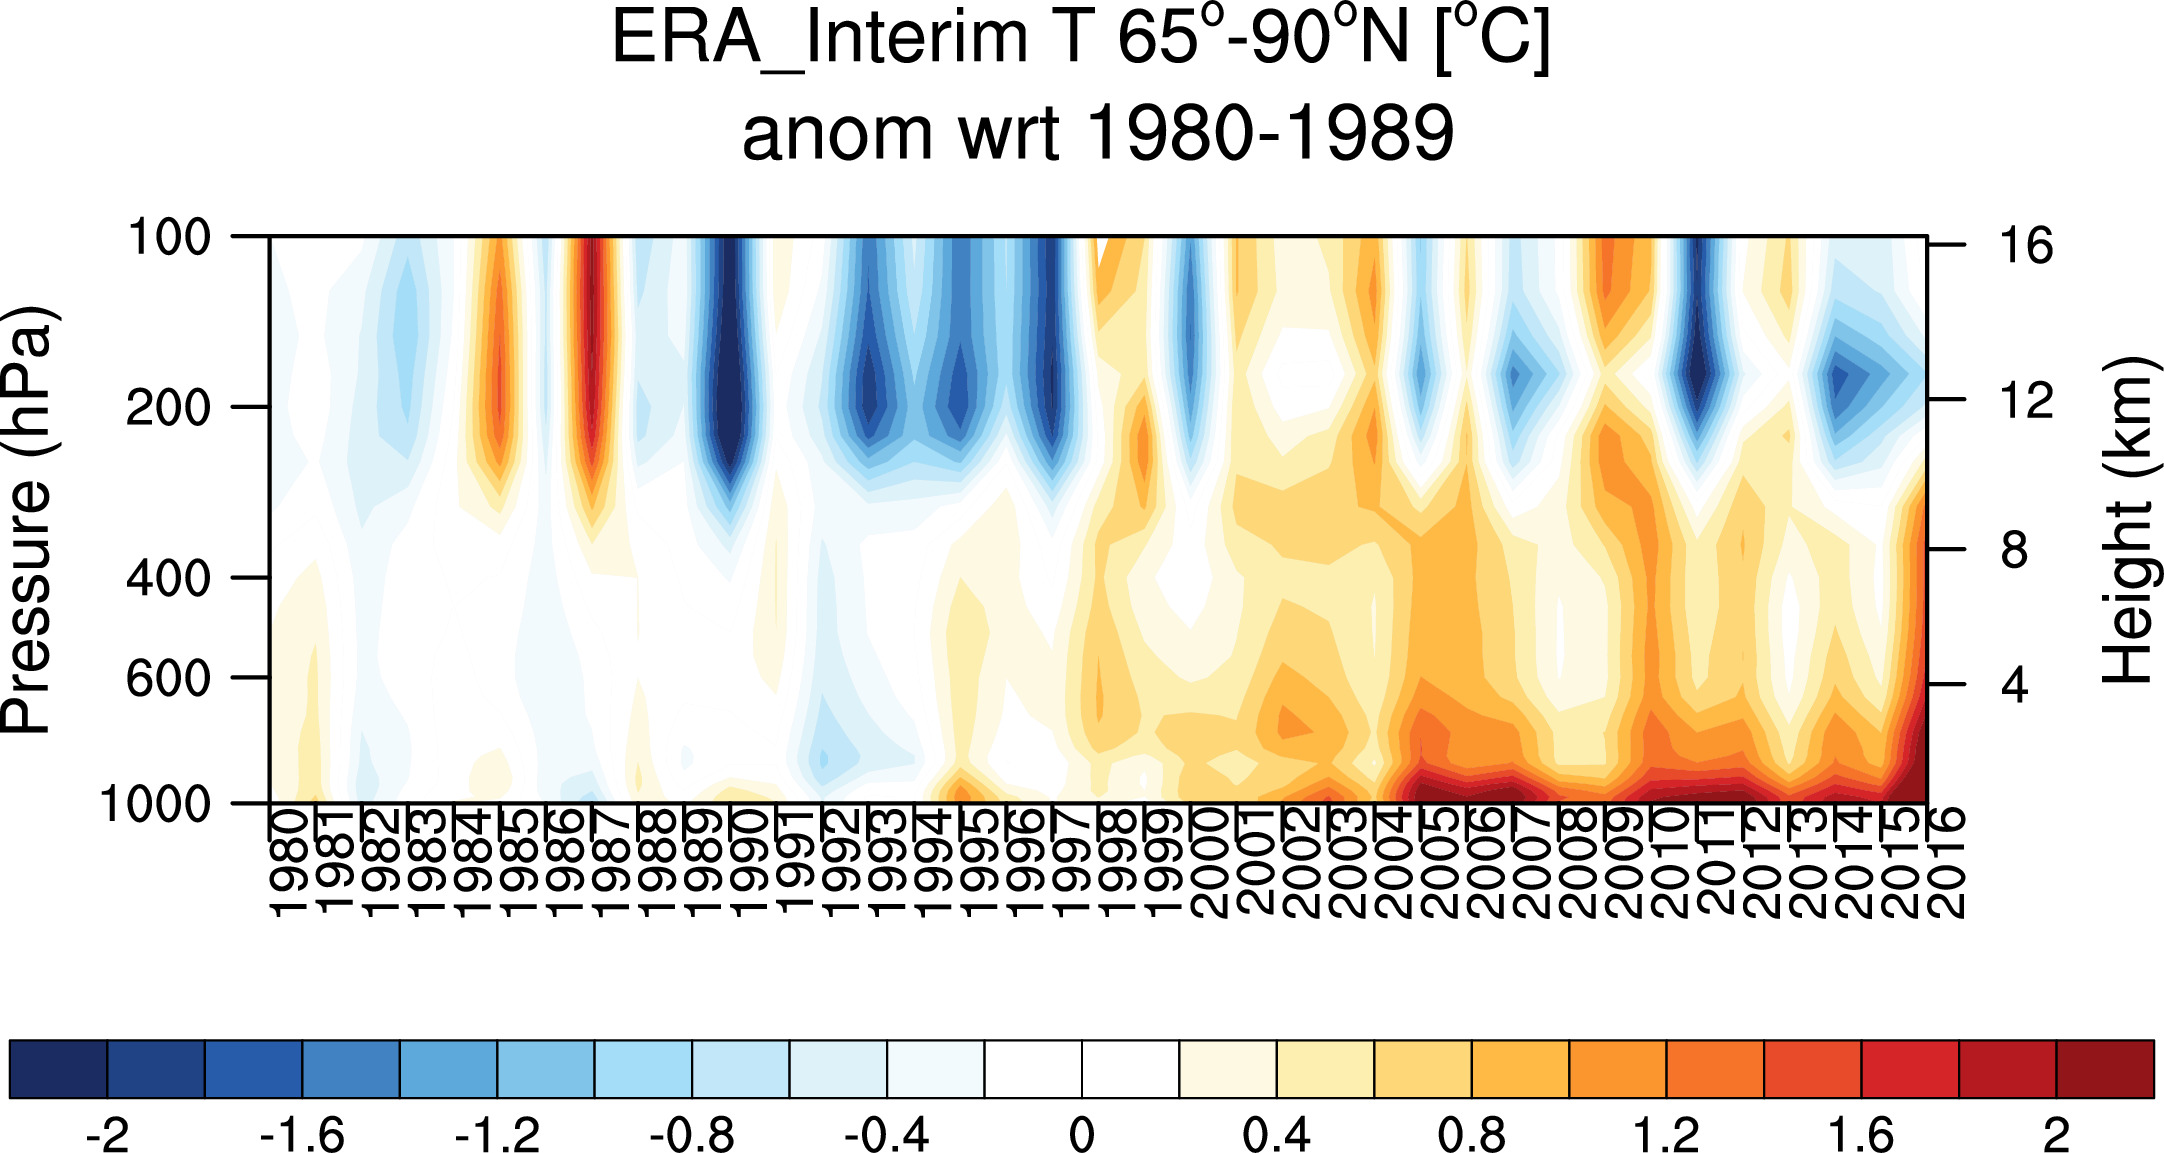
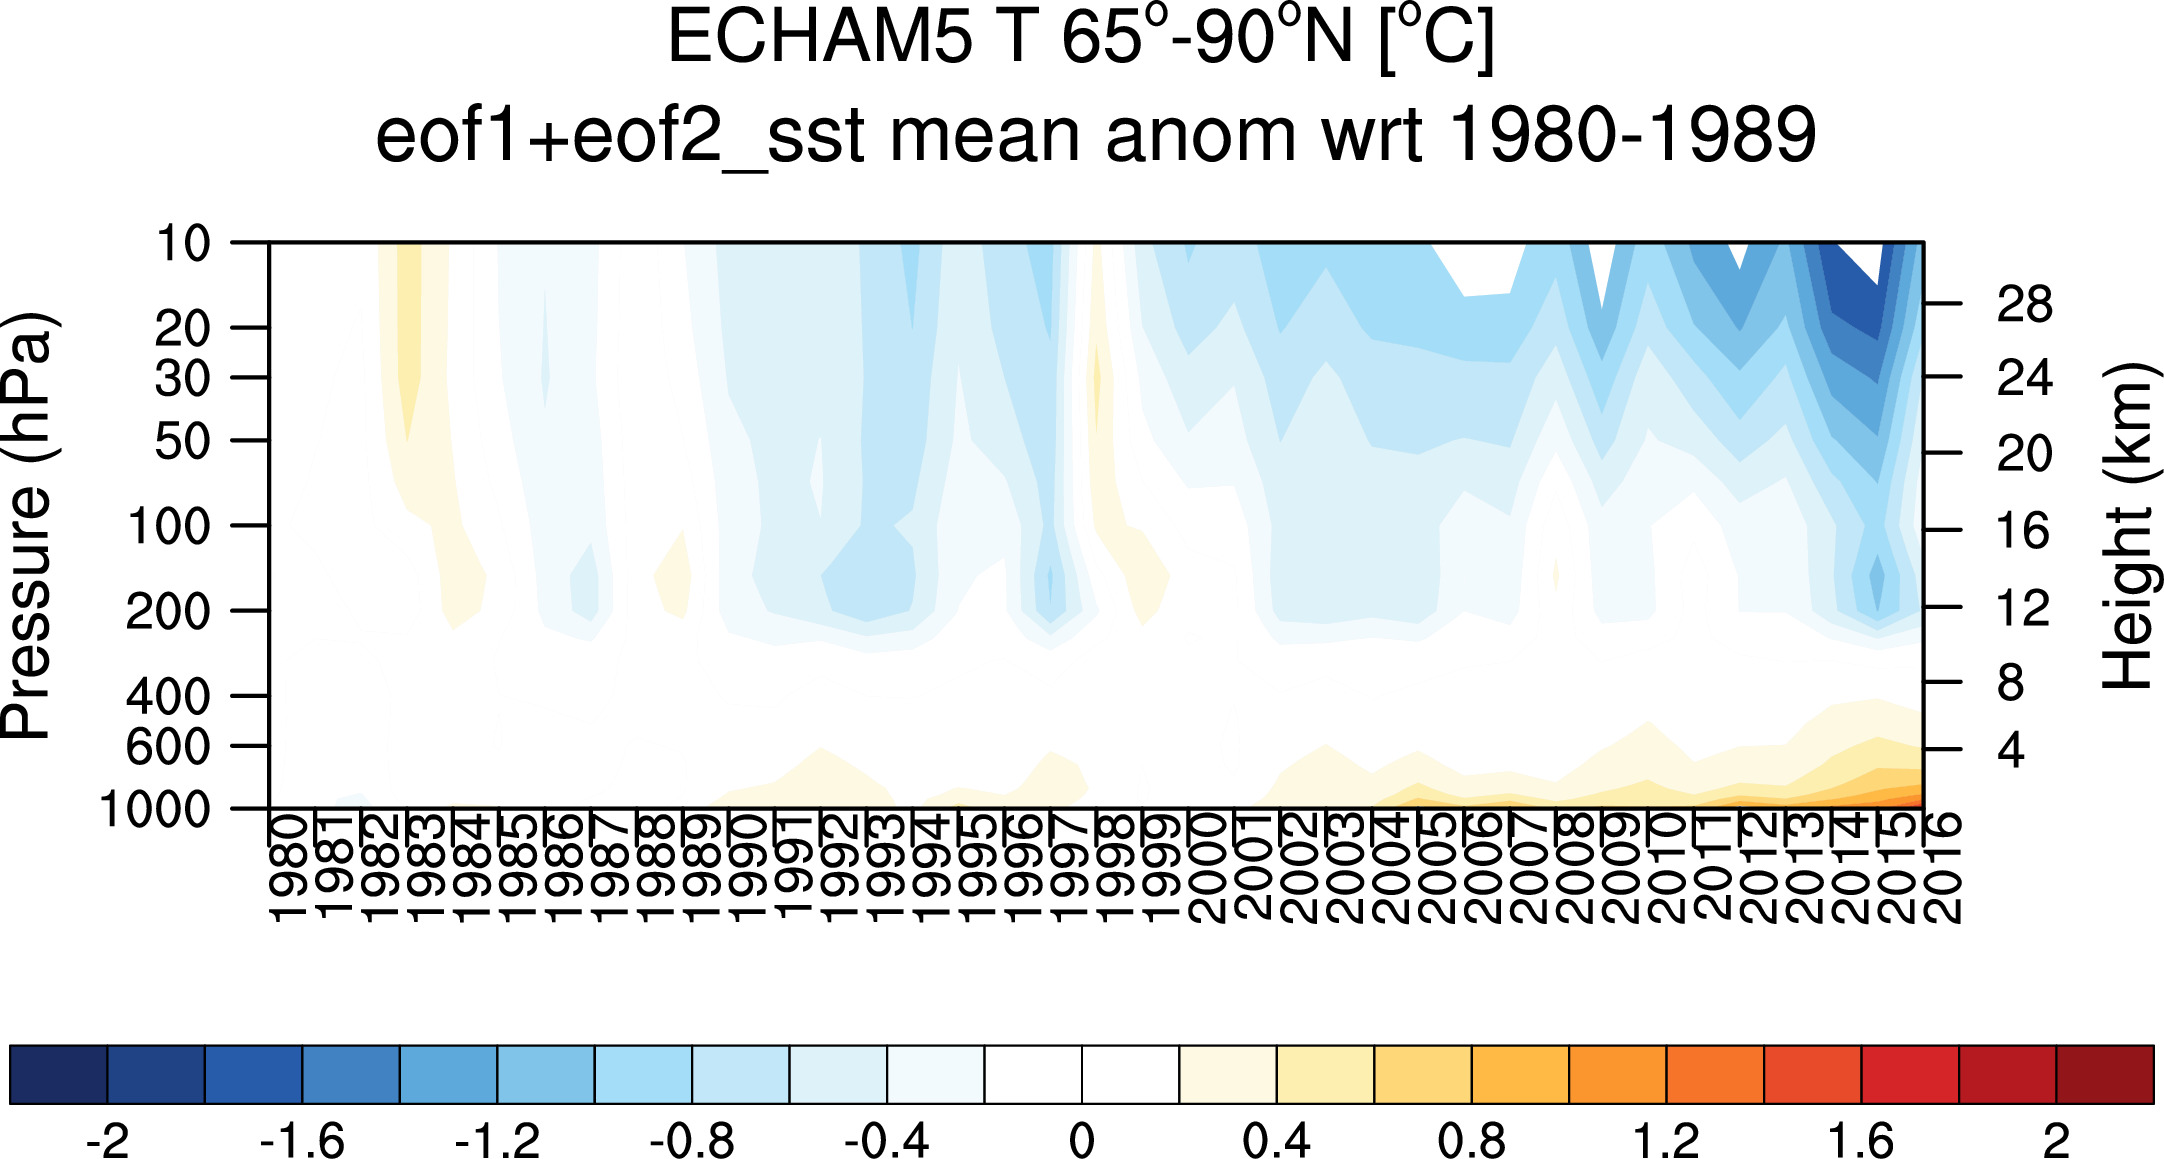
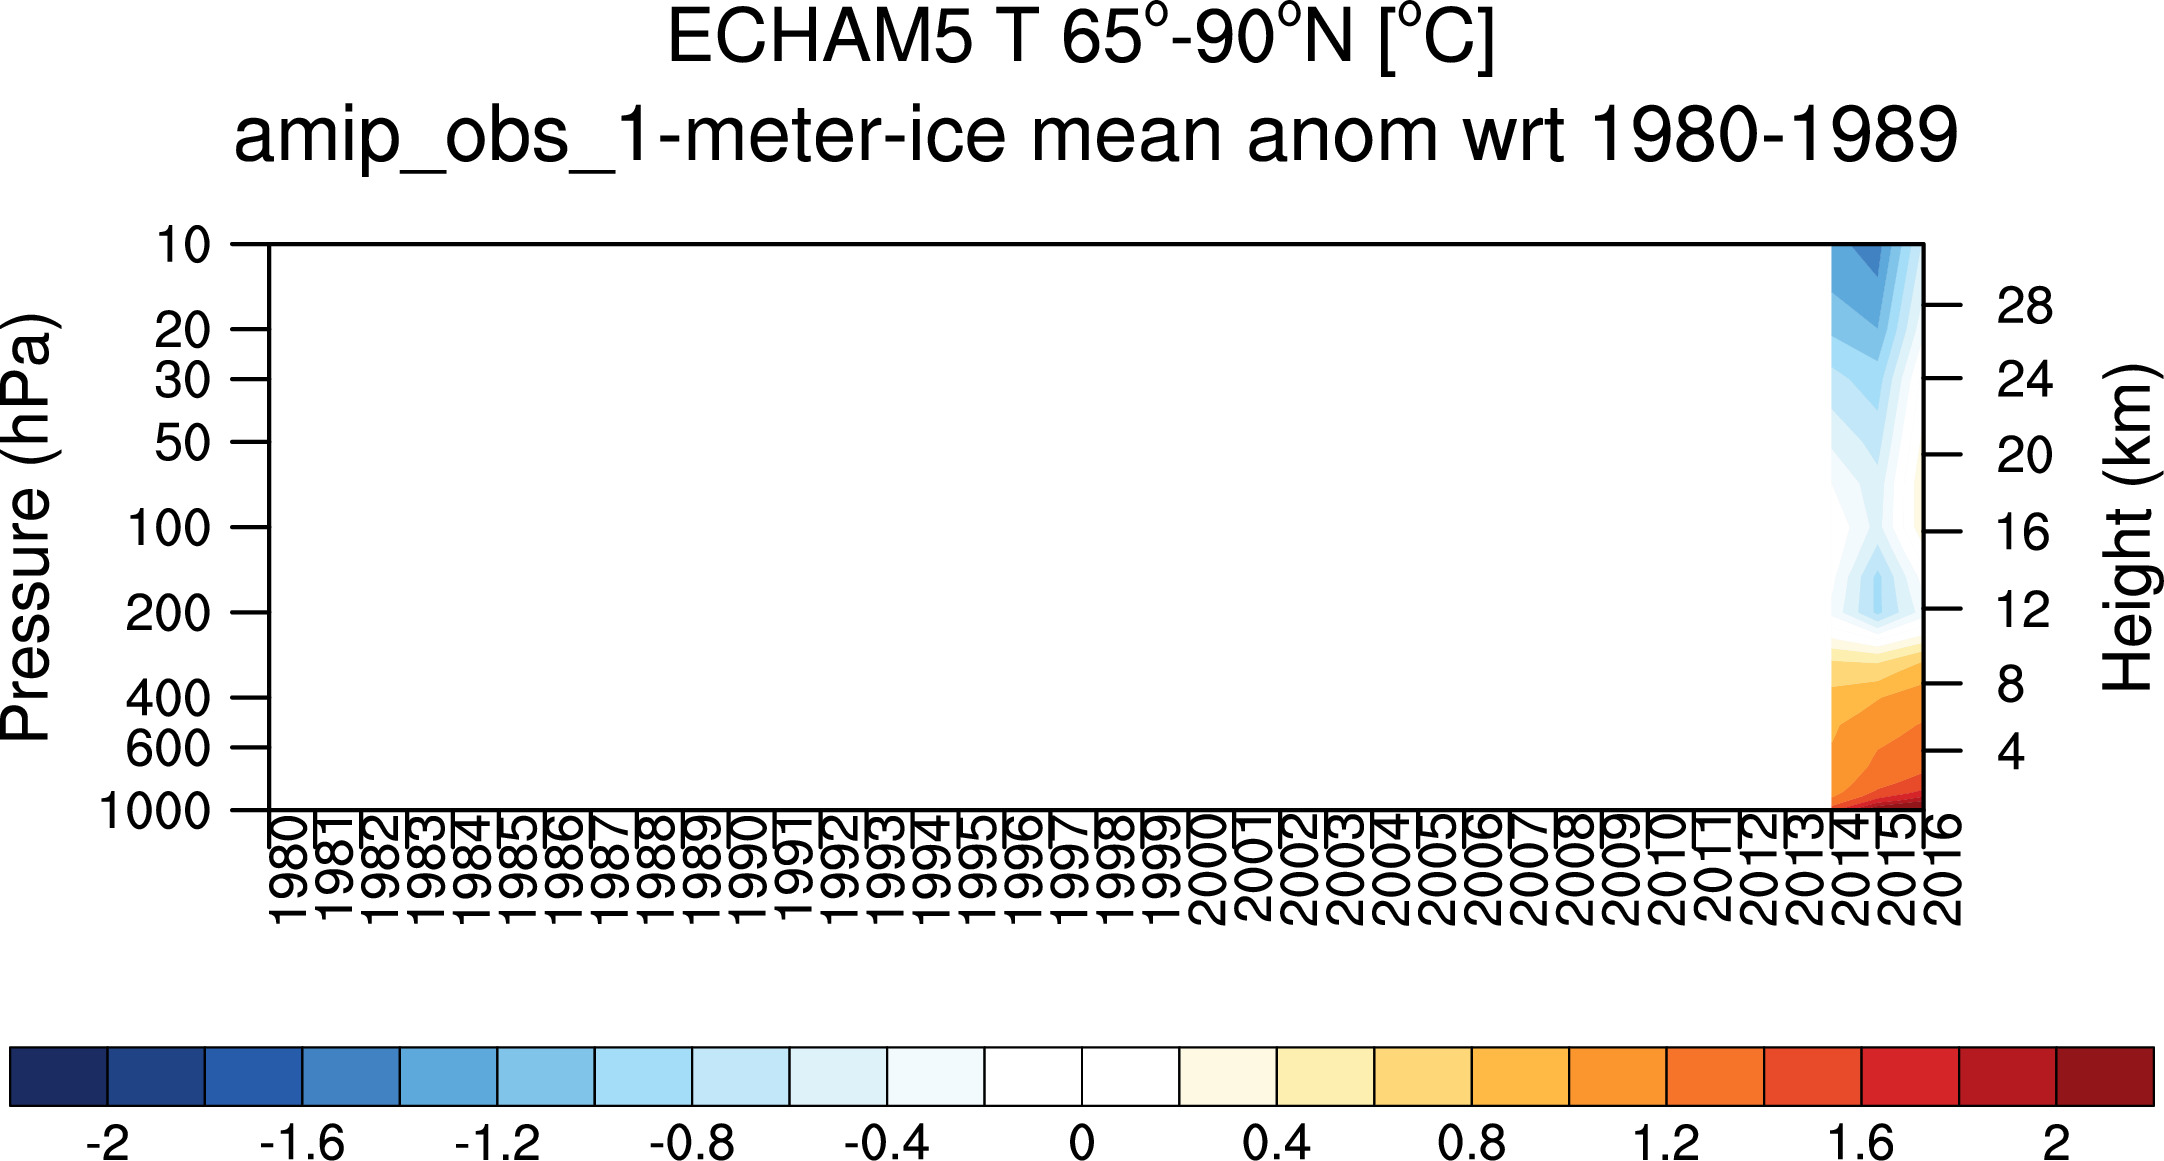
Vertical structure
Up to 100mb
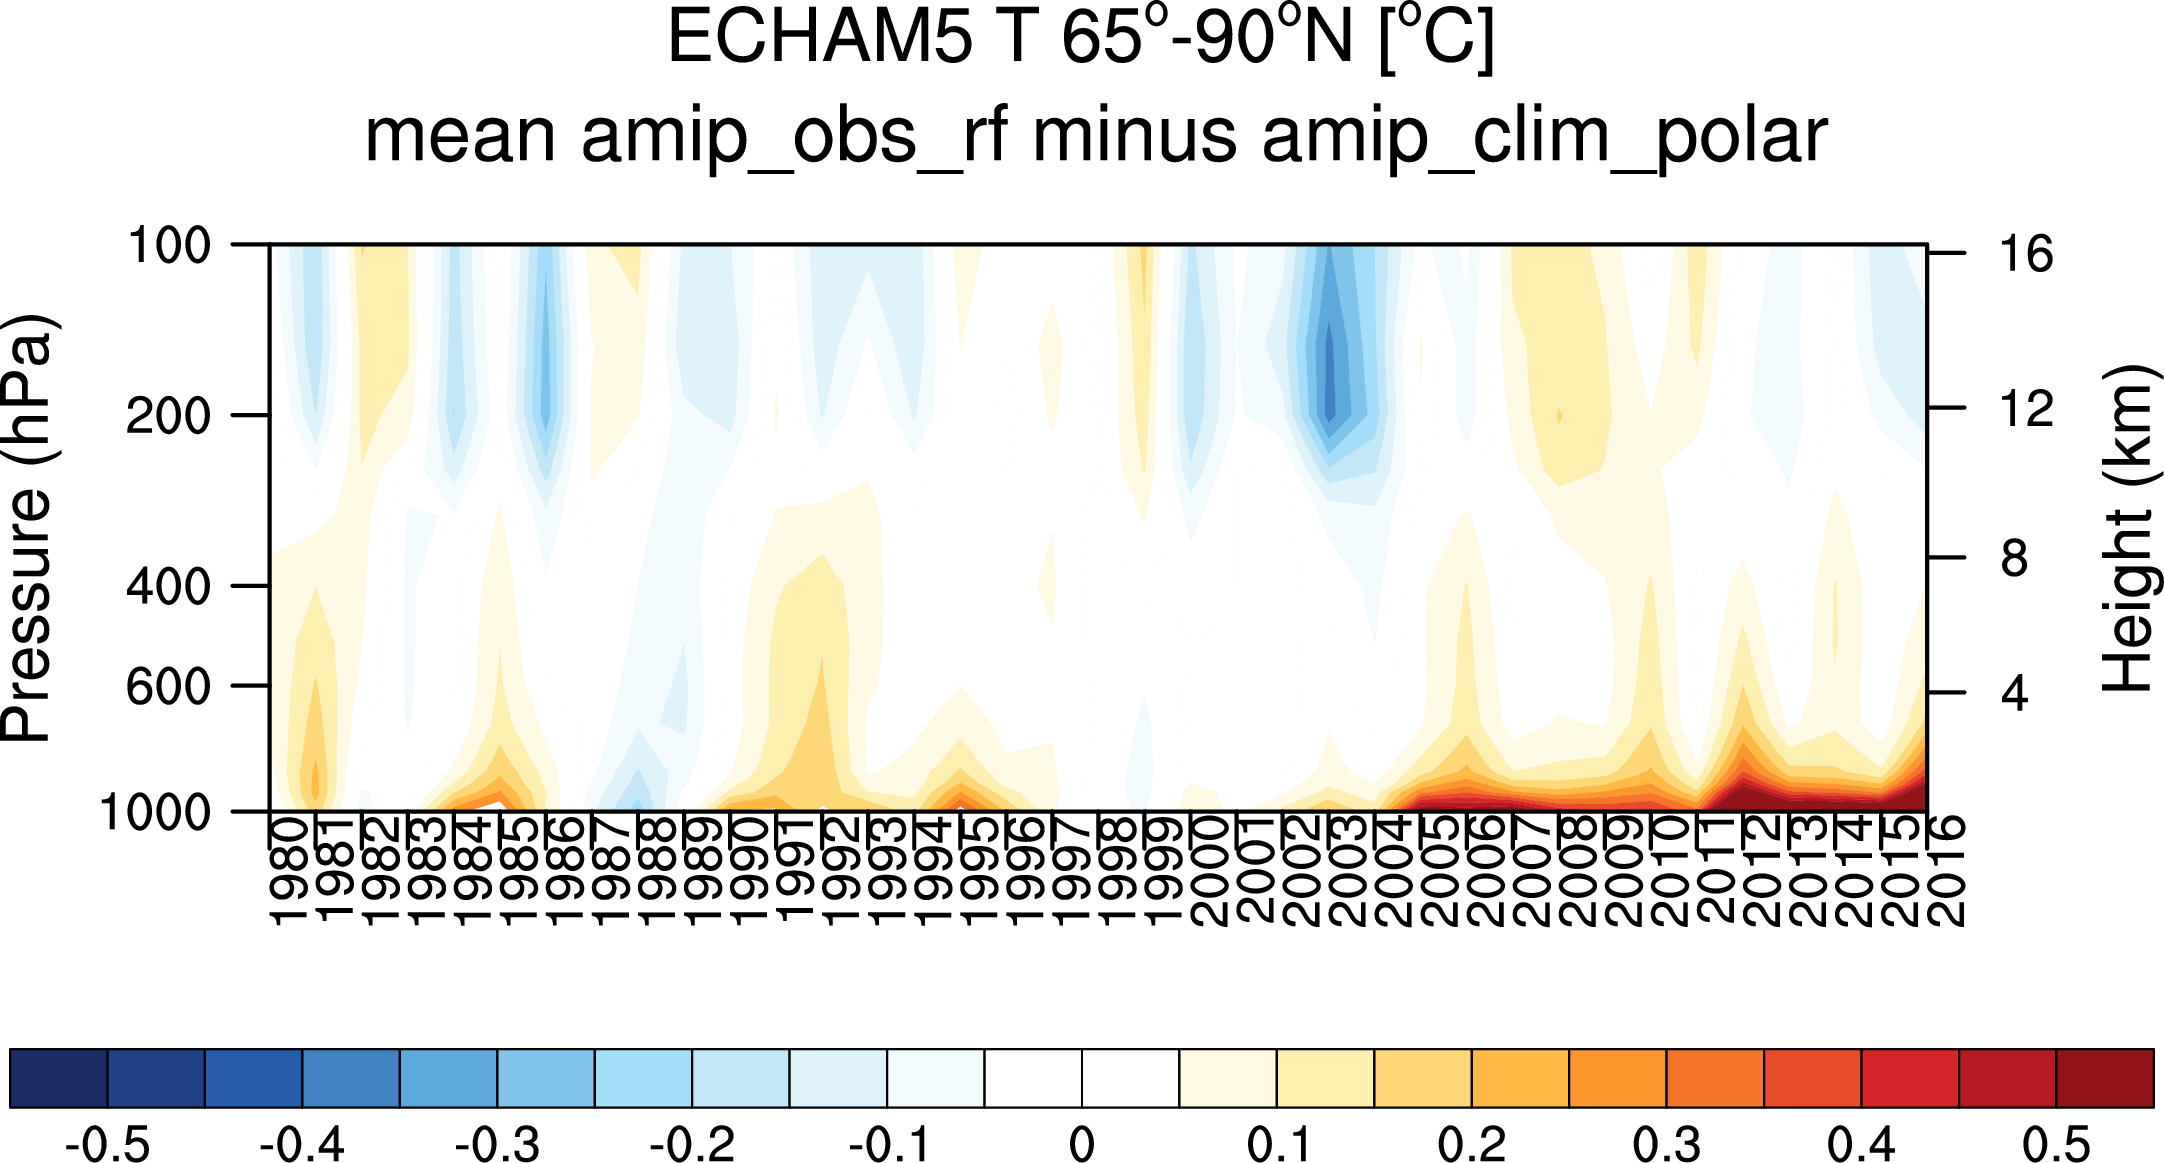
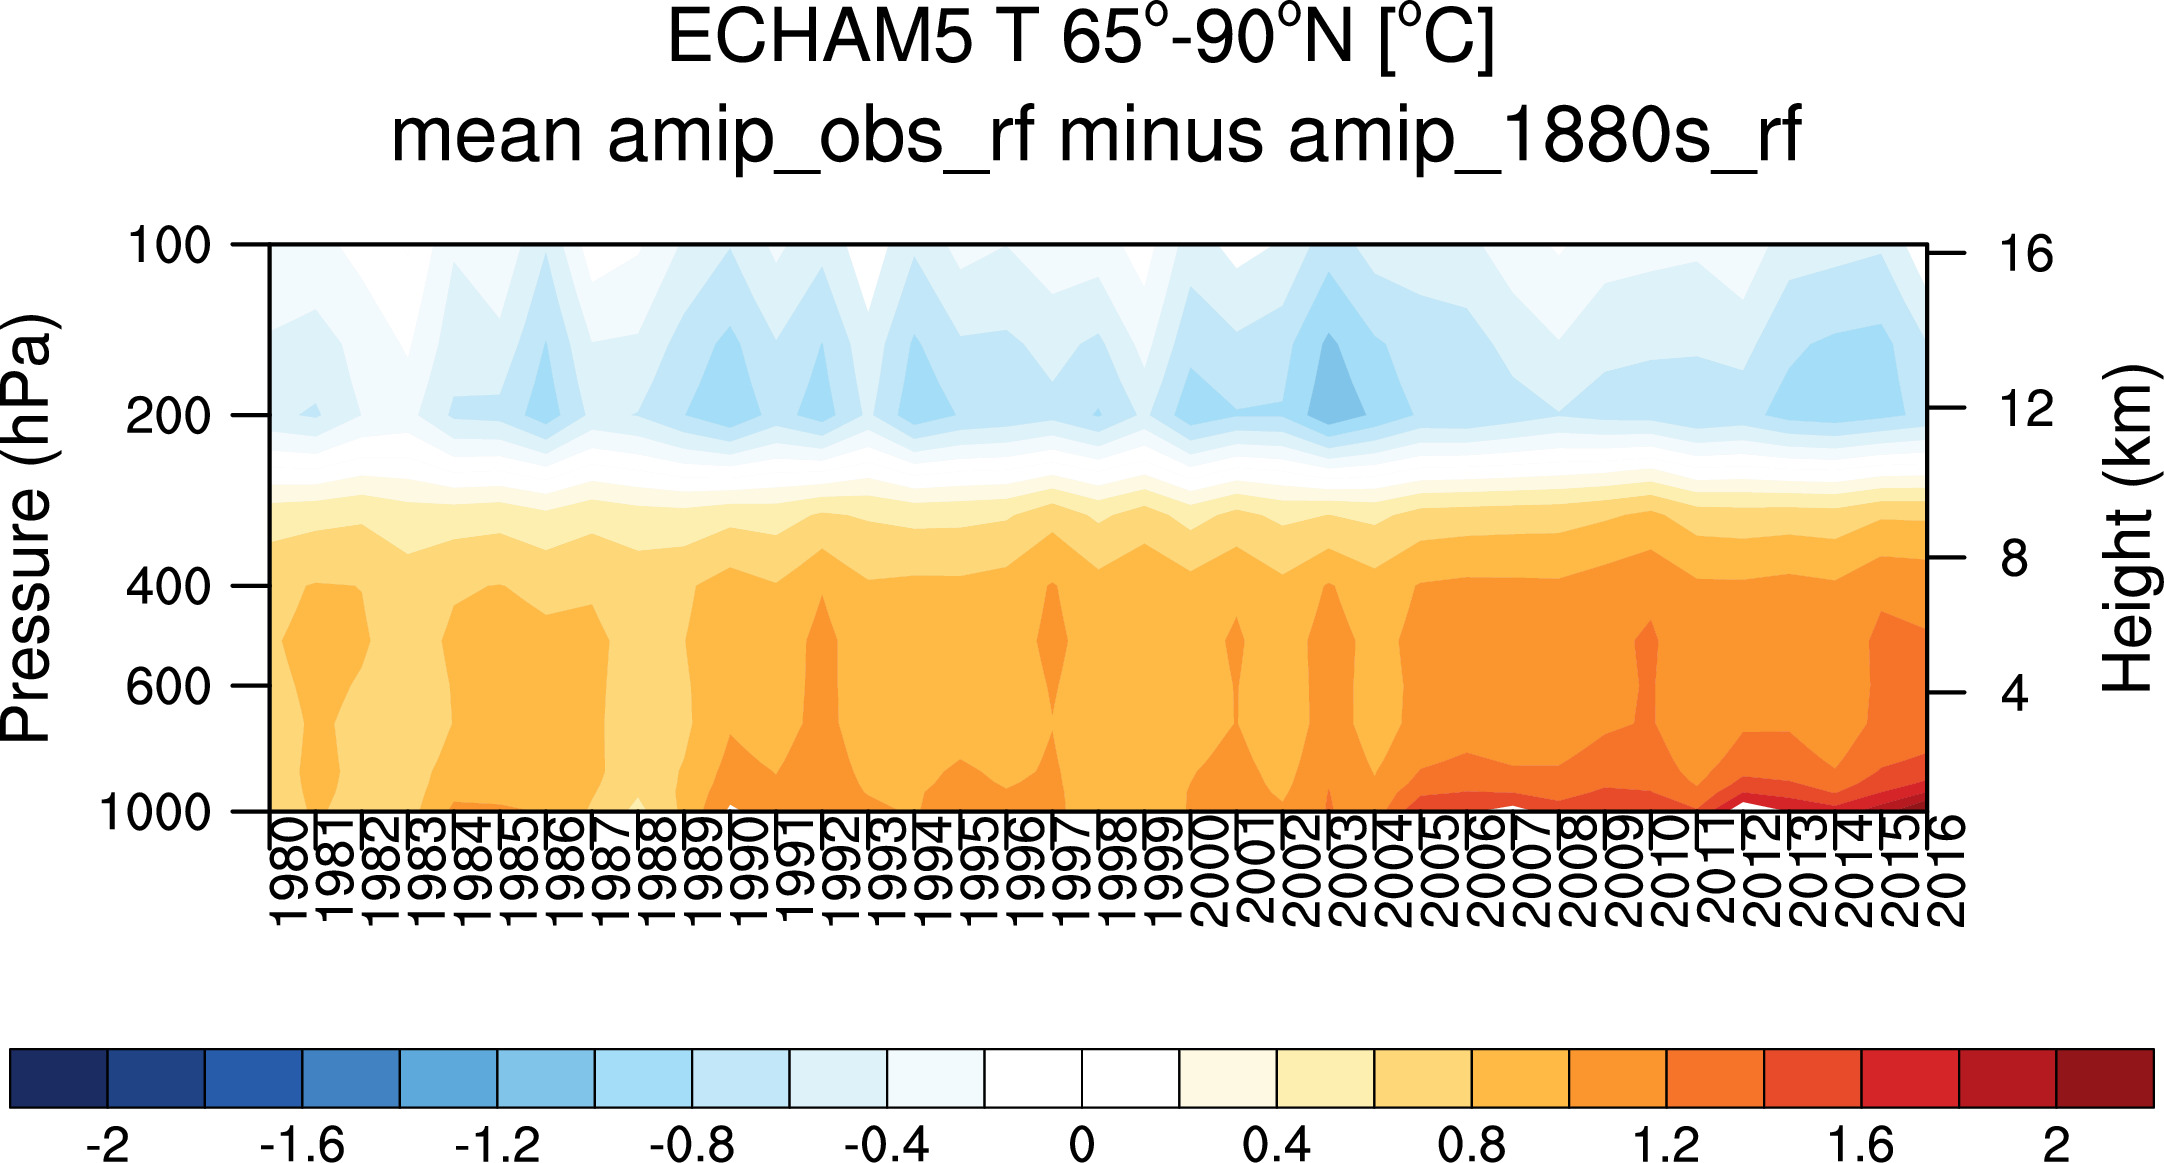
where no climatologies subtracted for above 2 plots.
--------------------------------------
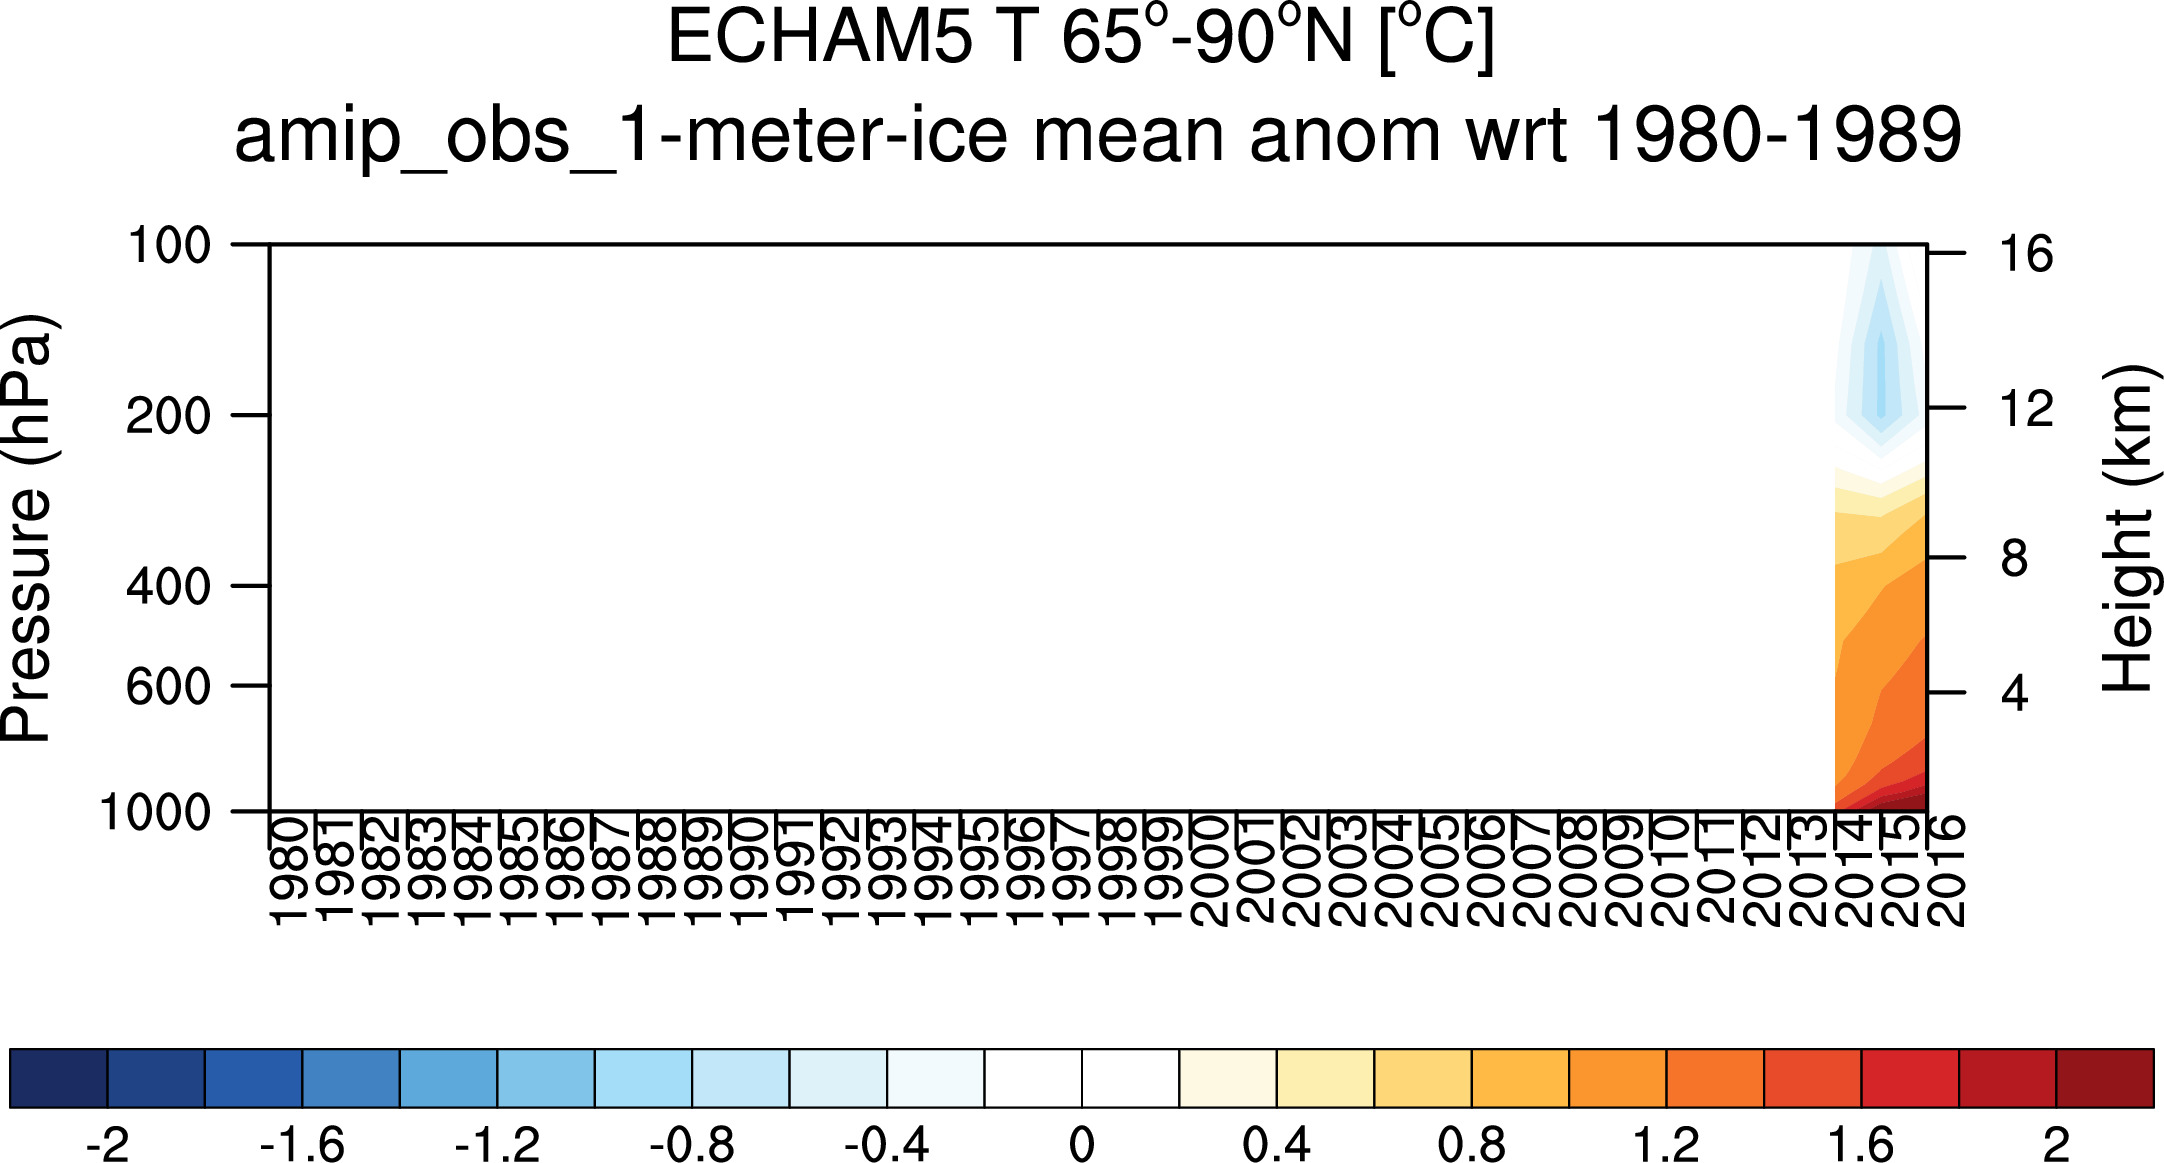
where for the 1m_ice case, the amip_obs_rf 1980-1989 climatology was removed.
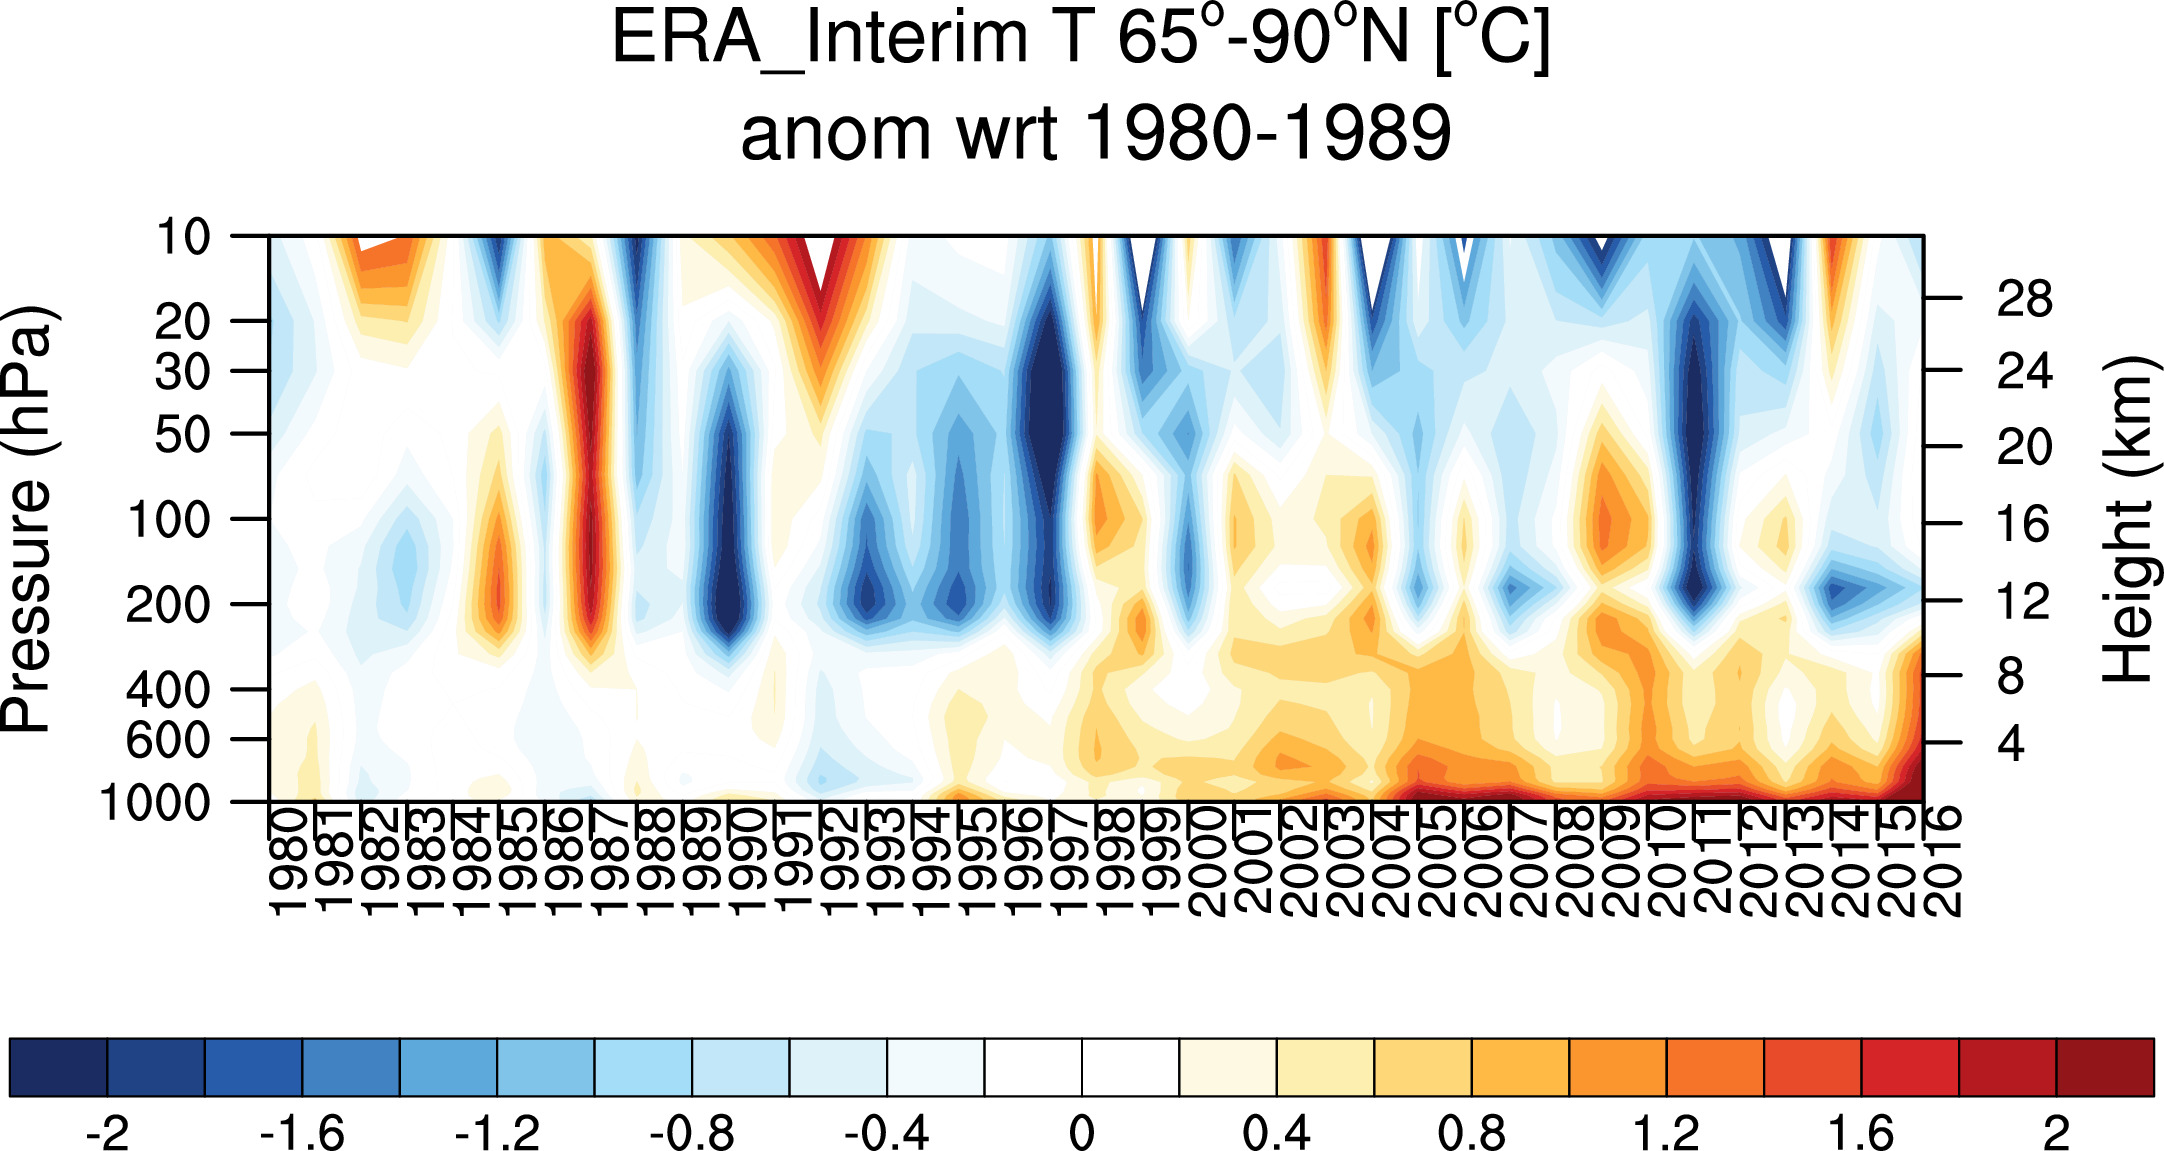
For comparison, ERA-Interim
Higher than 100mb
where no climatologies subtracted for above 2 plots.
----
where for the 1m_ice case, the amip_obs_rf 1980-1989 climatology was removed.
For comparison, ERA-Interim
----------------------
Comparing different experiments
where above plots created using all 30 ensemble members.
-------------------
---------------------------------------------------------------------------------------------------
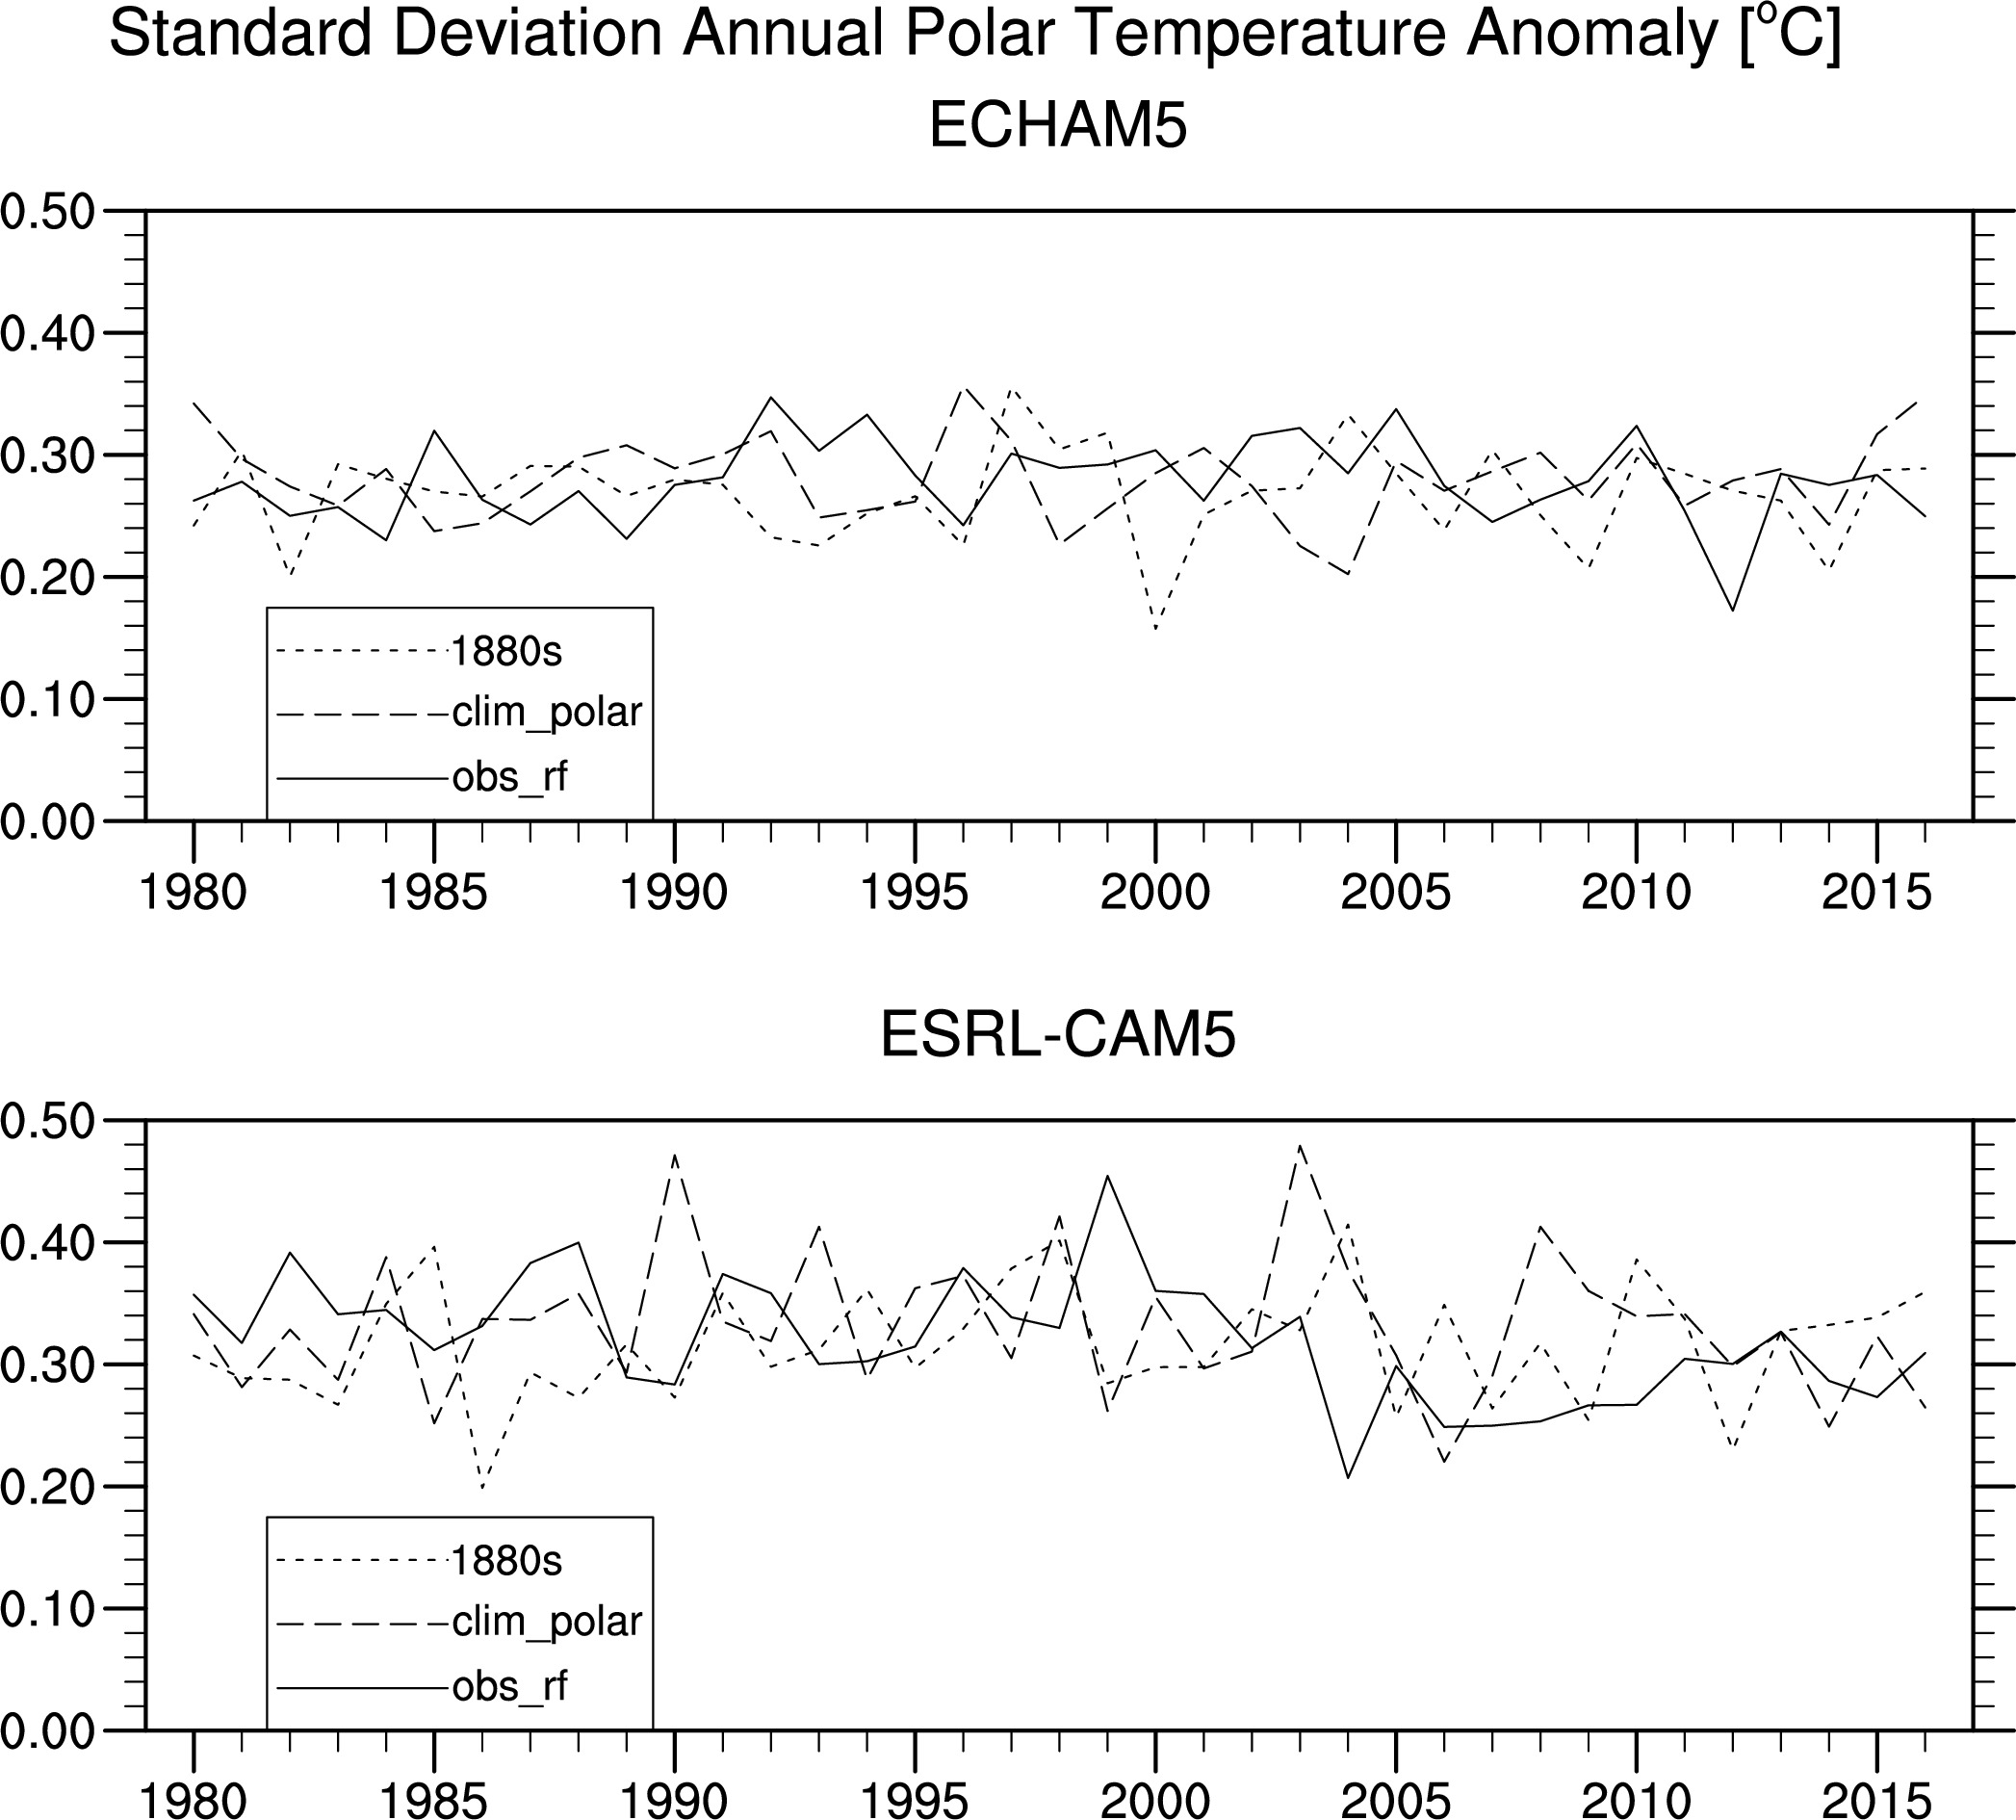
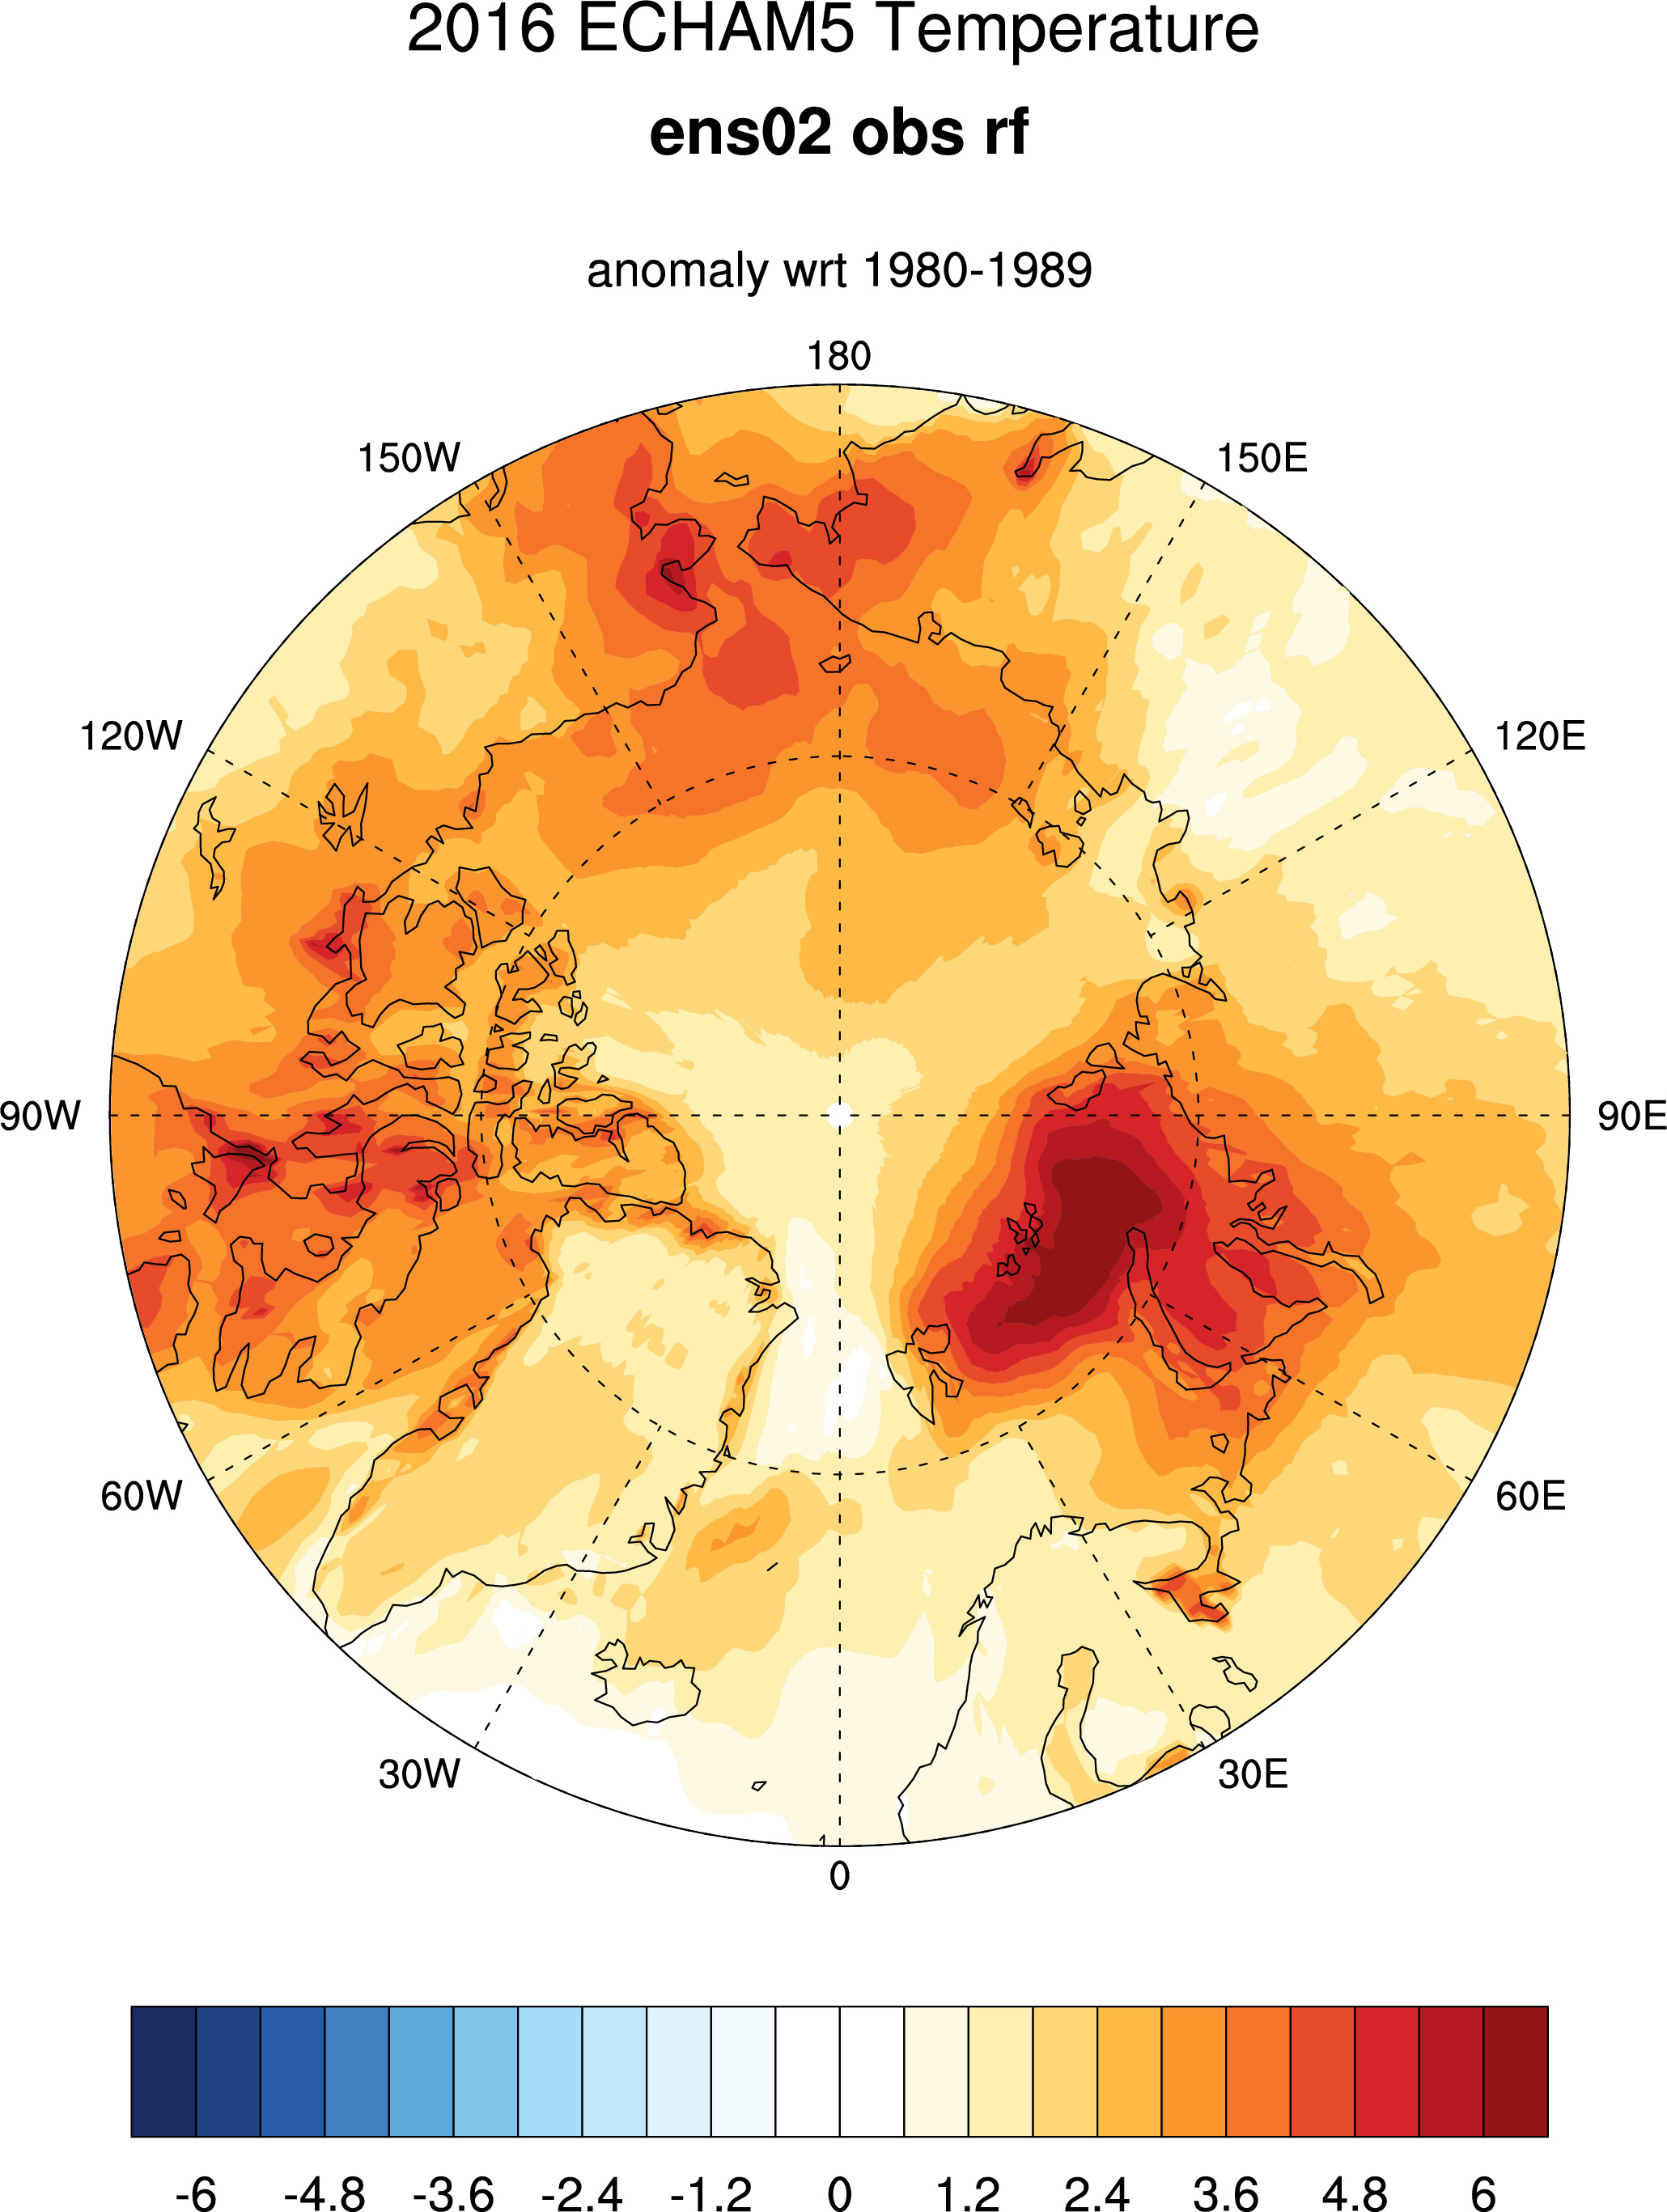
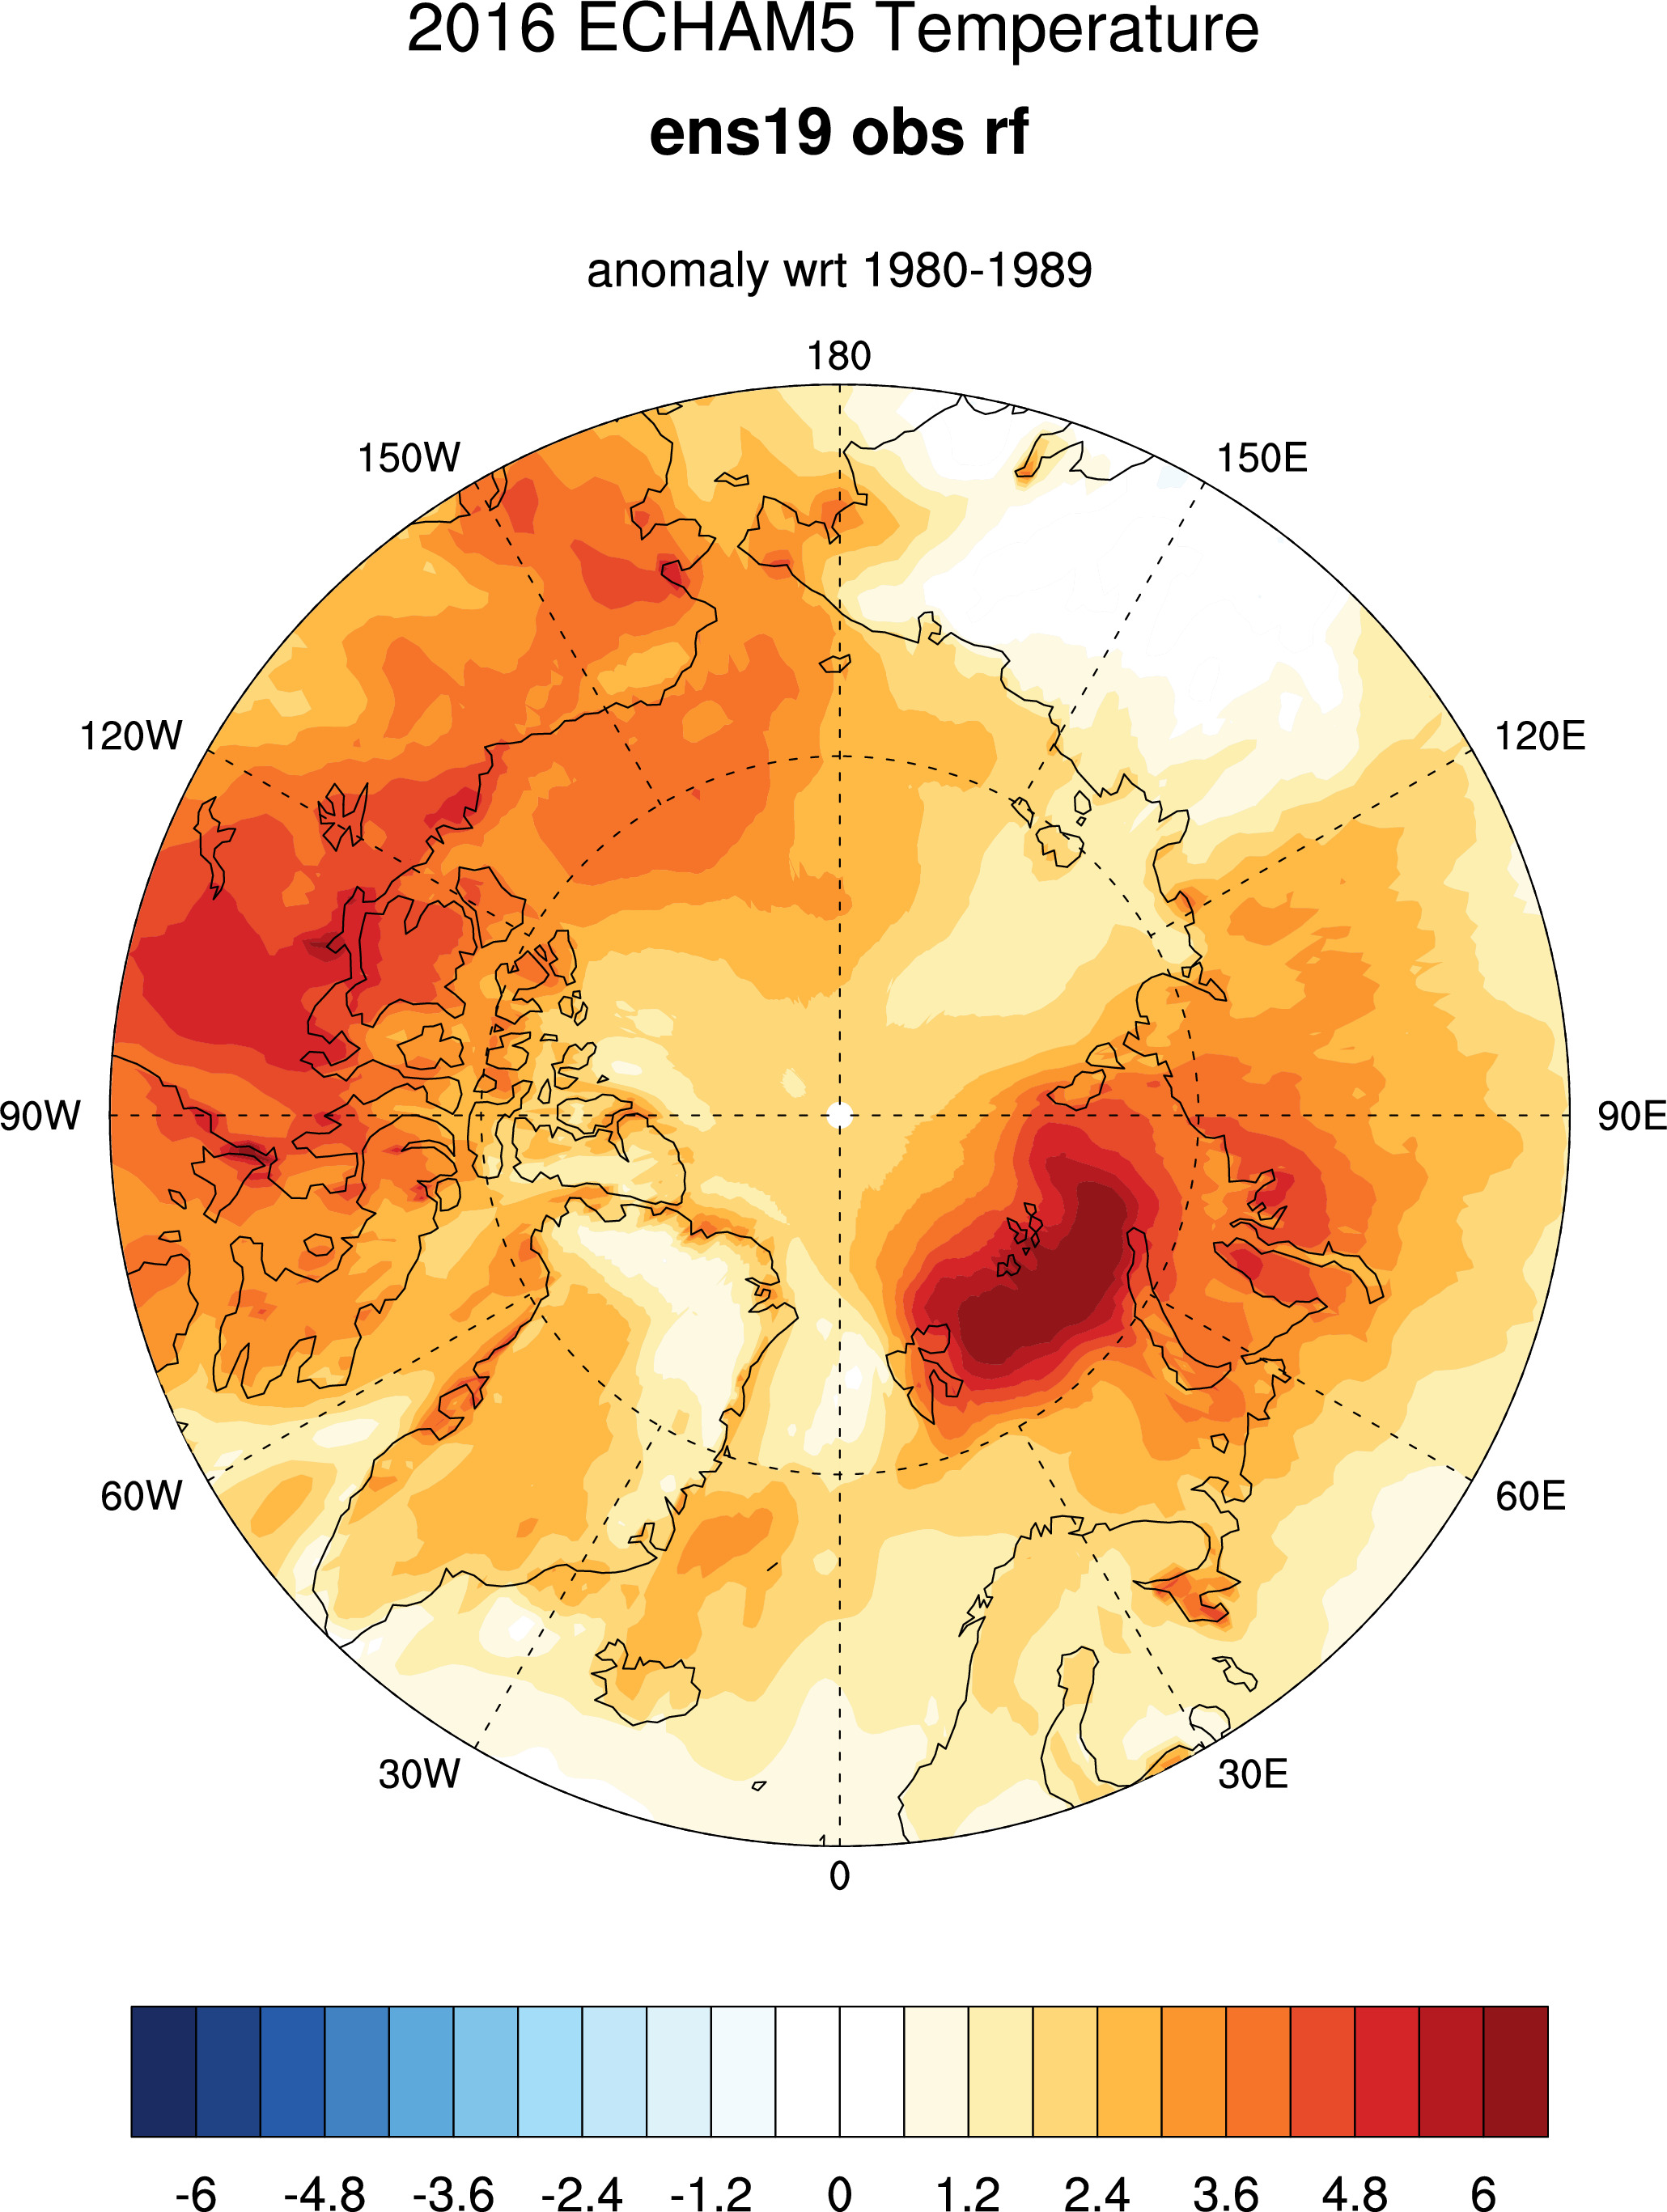
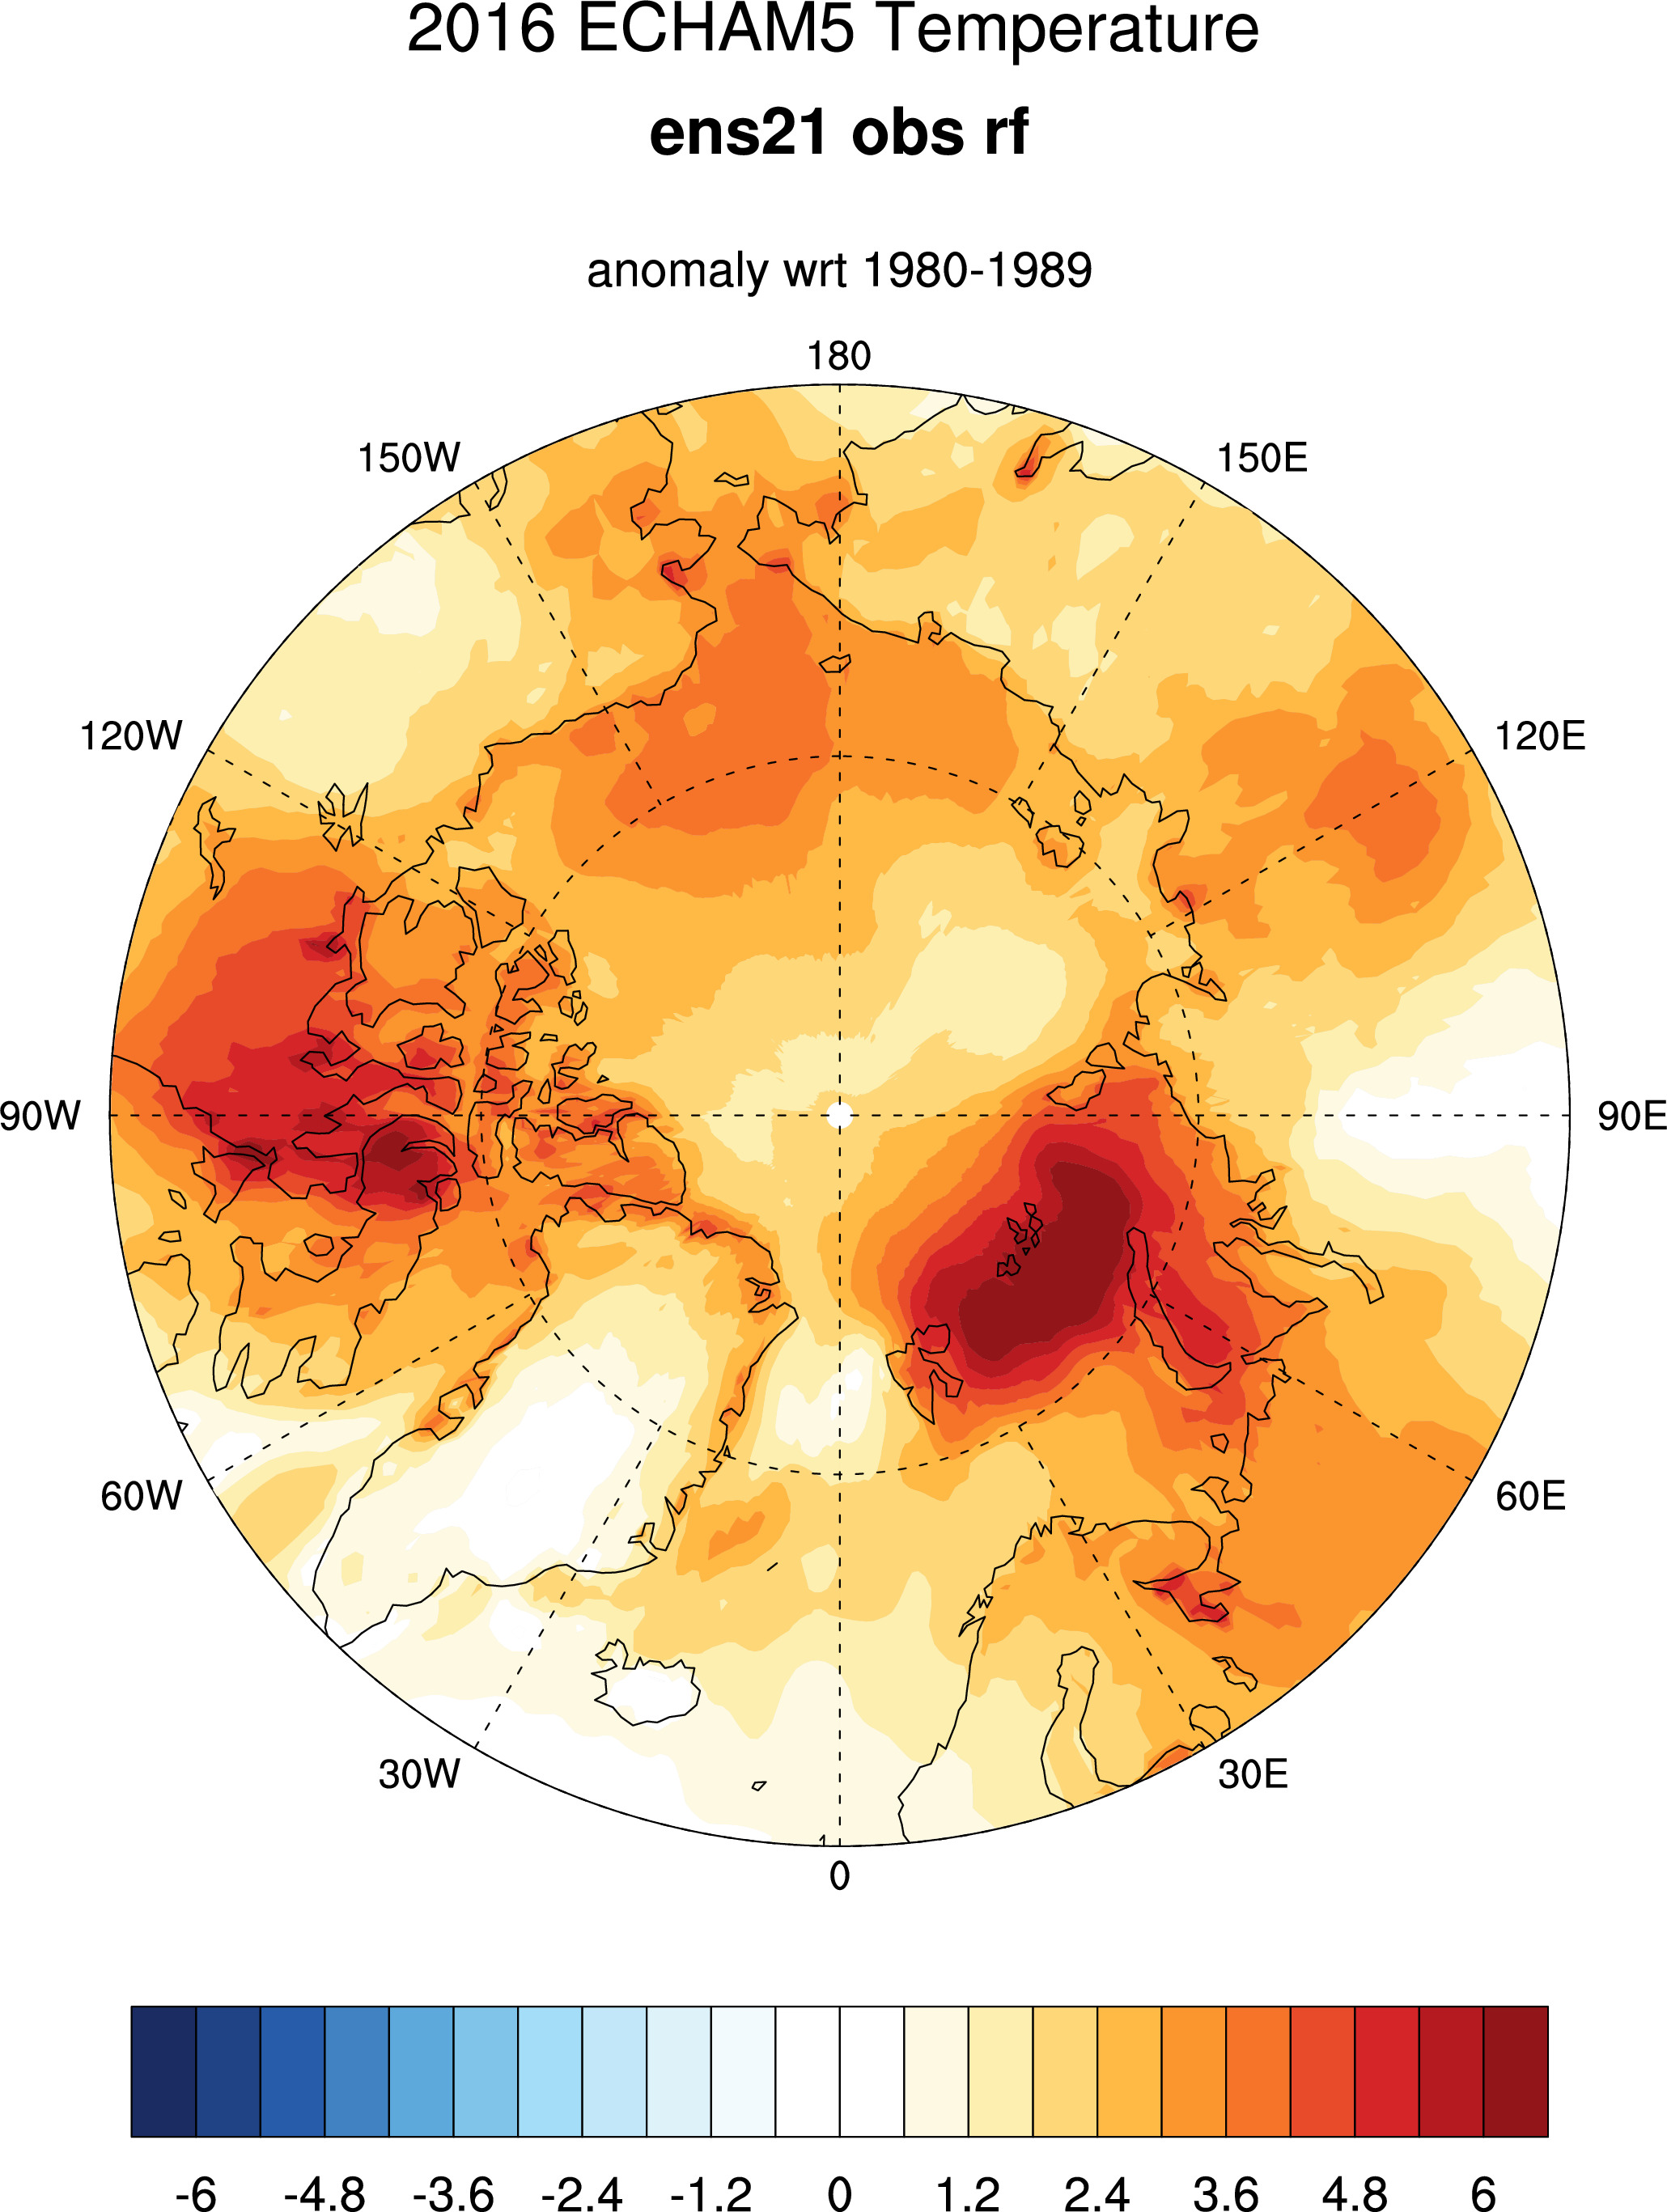
Polar anomaly maps (for single experiments)
--------------------------------------------------------------------------------------------------
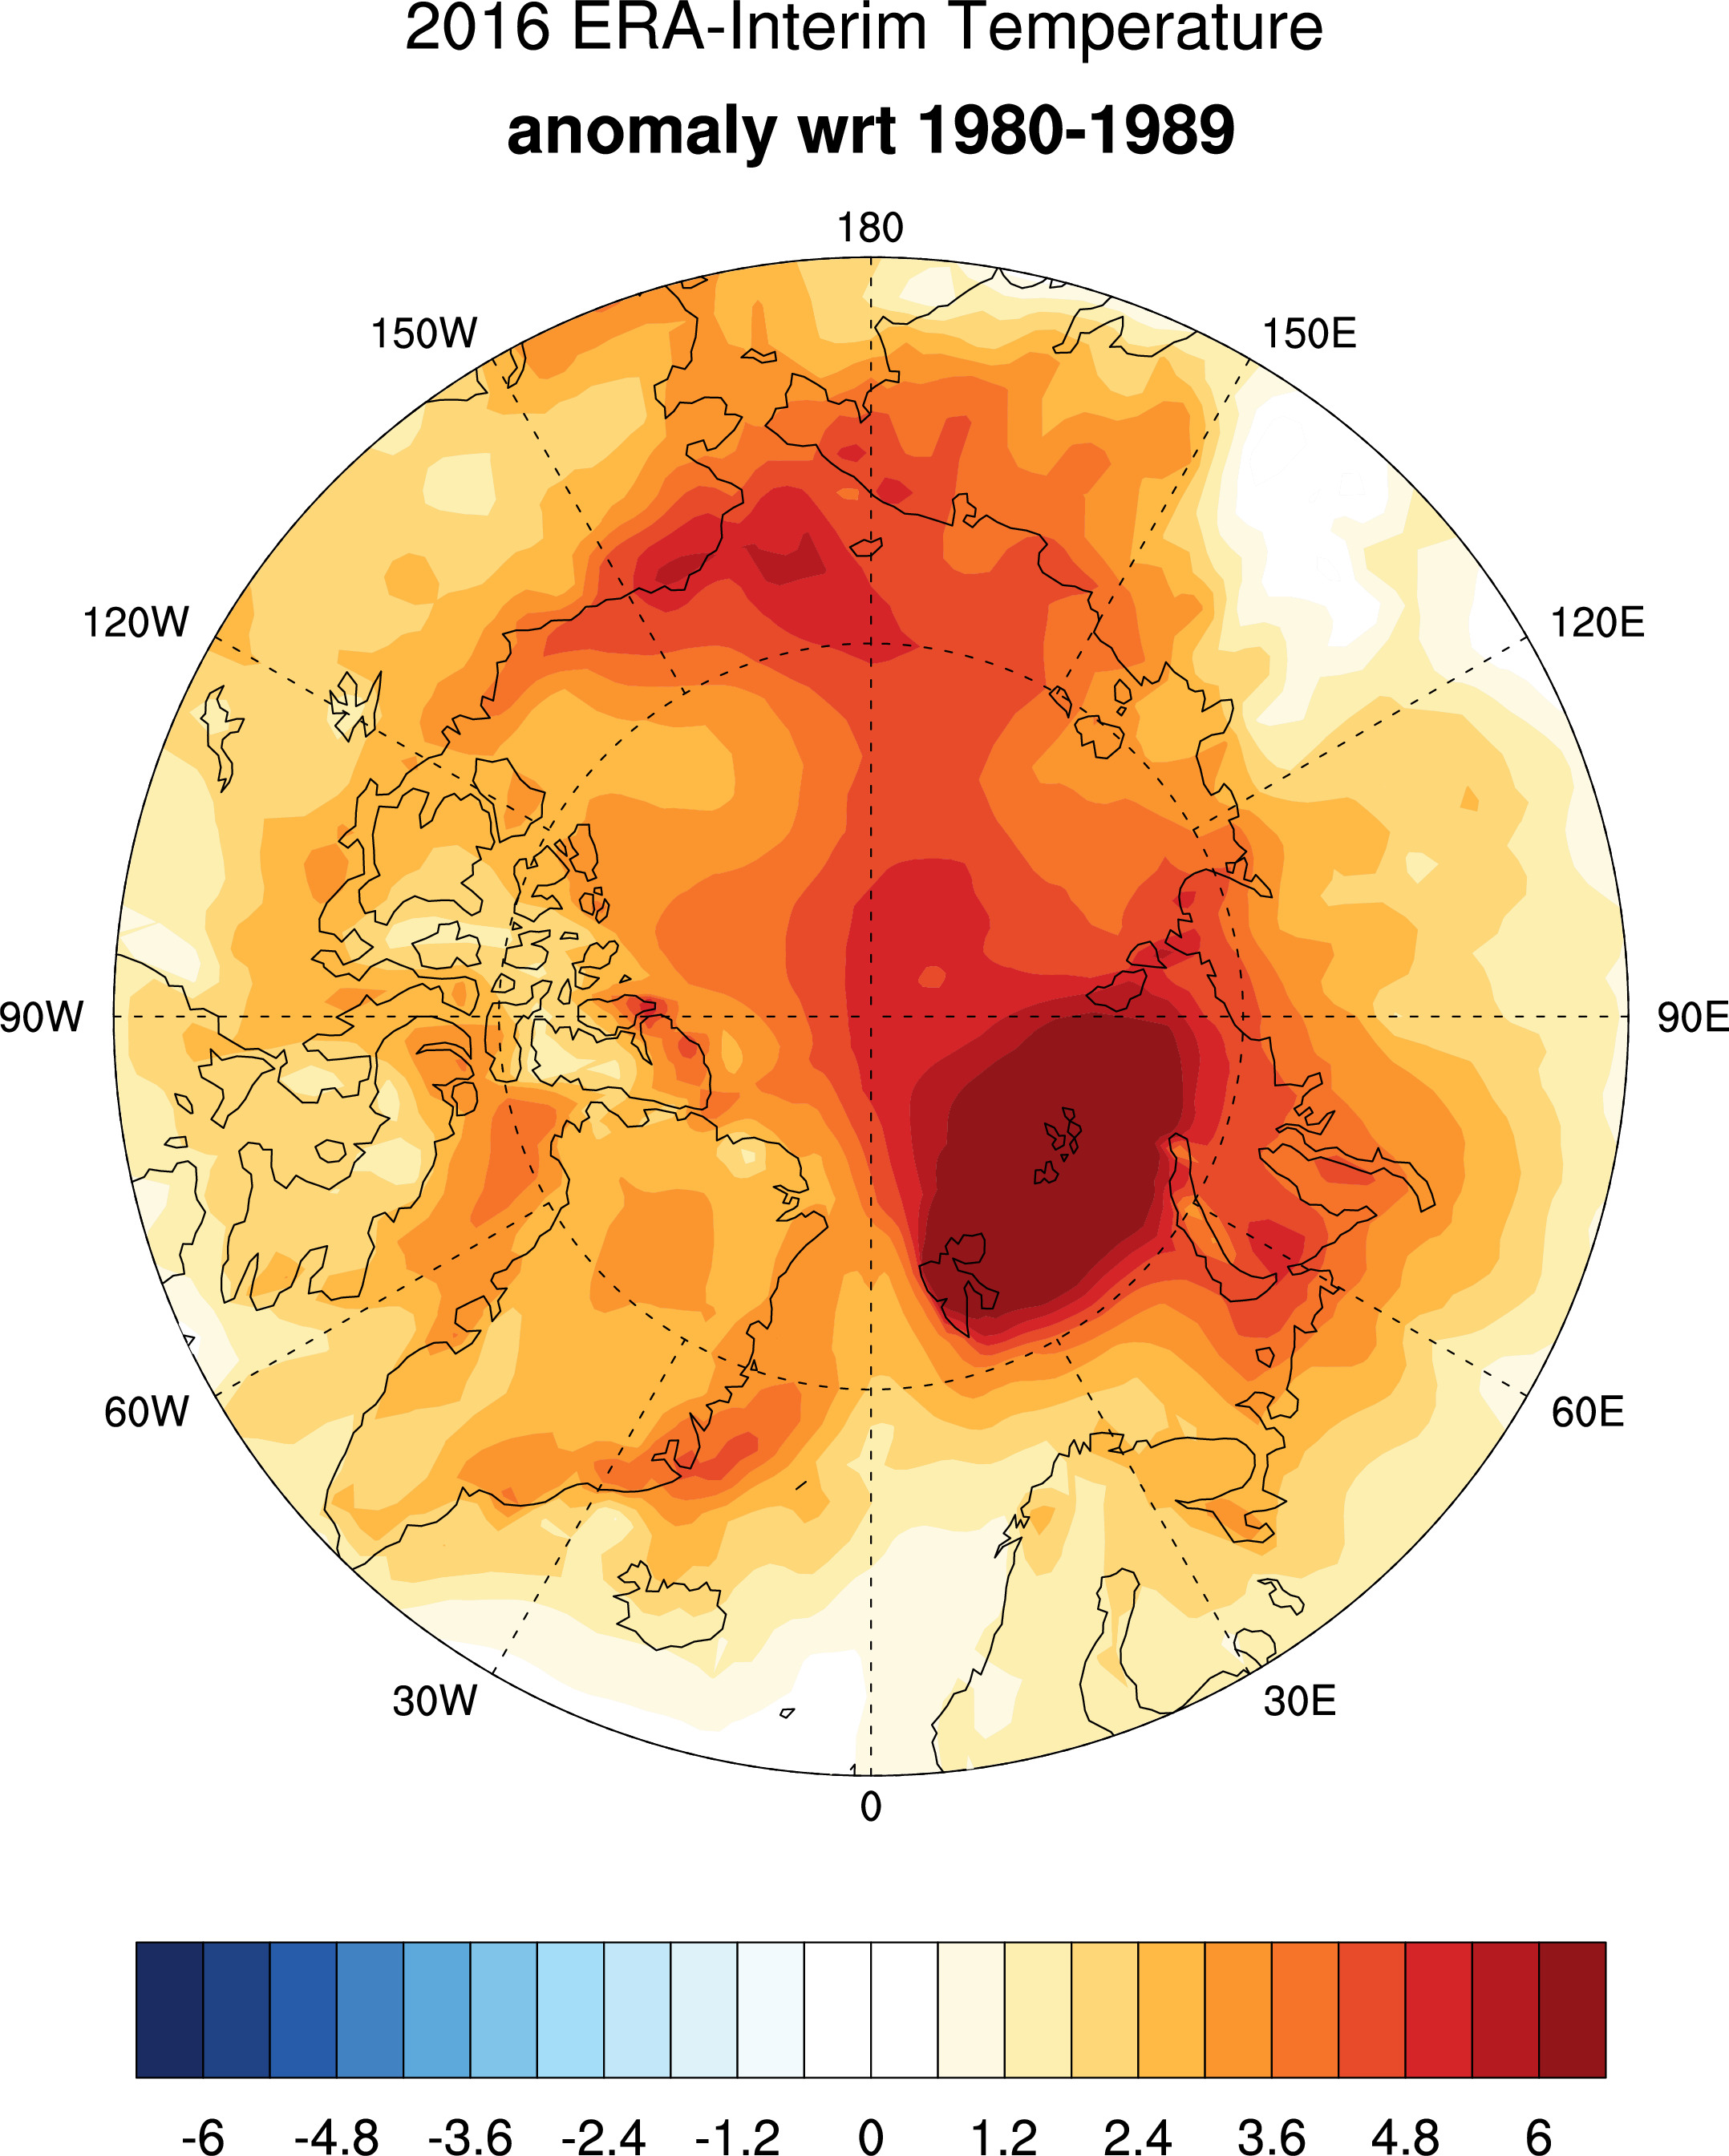
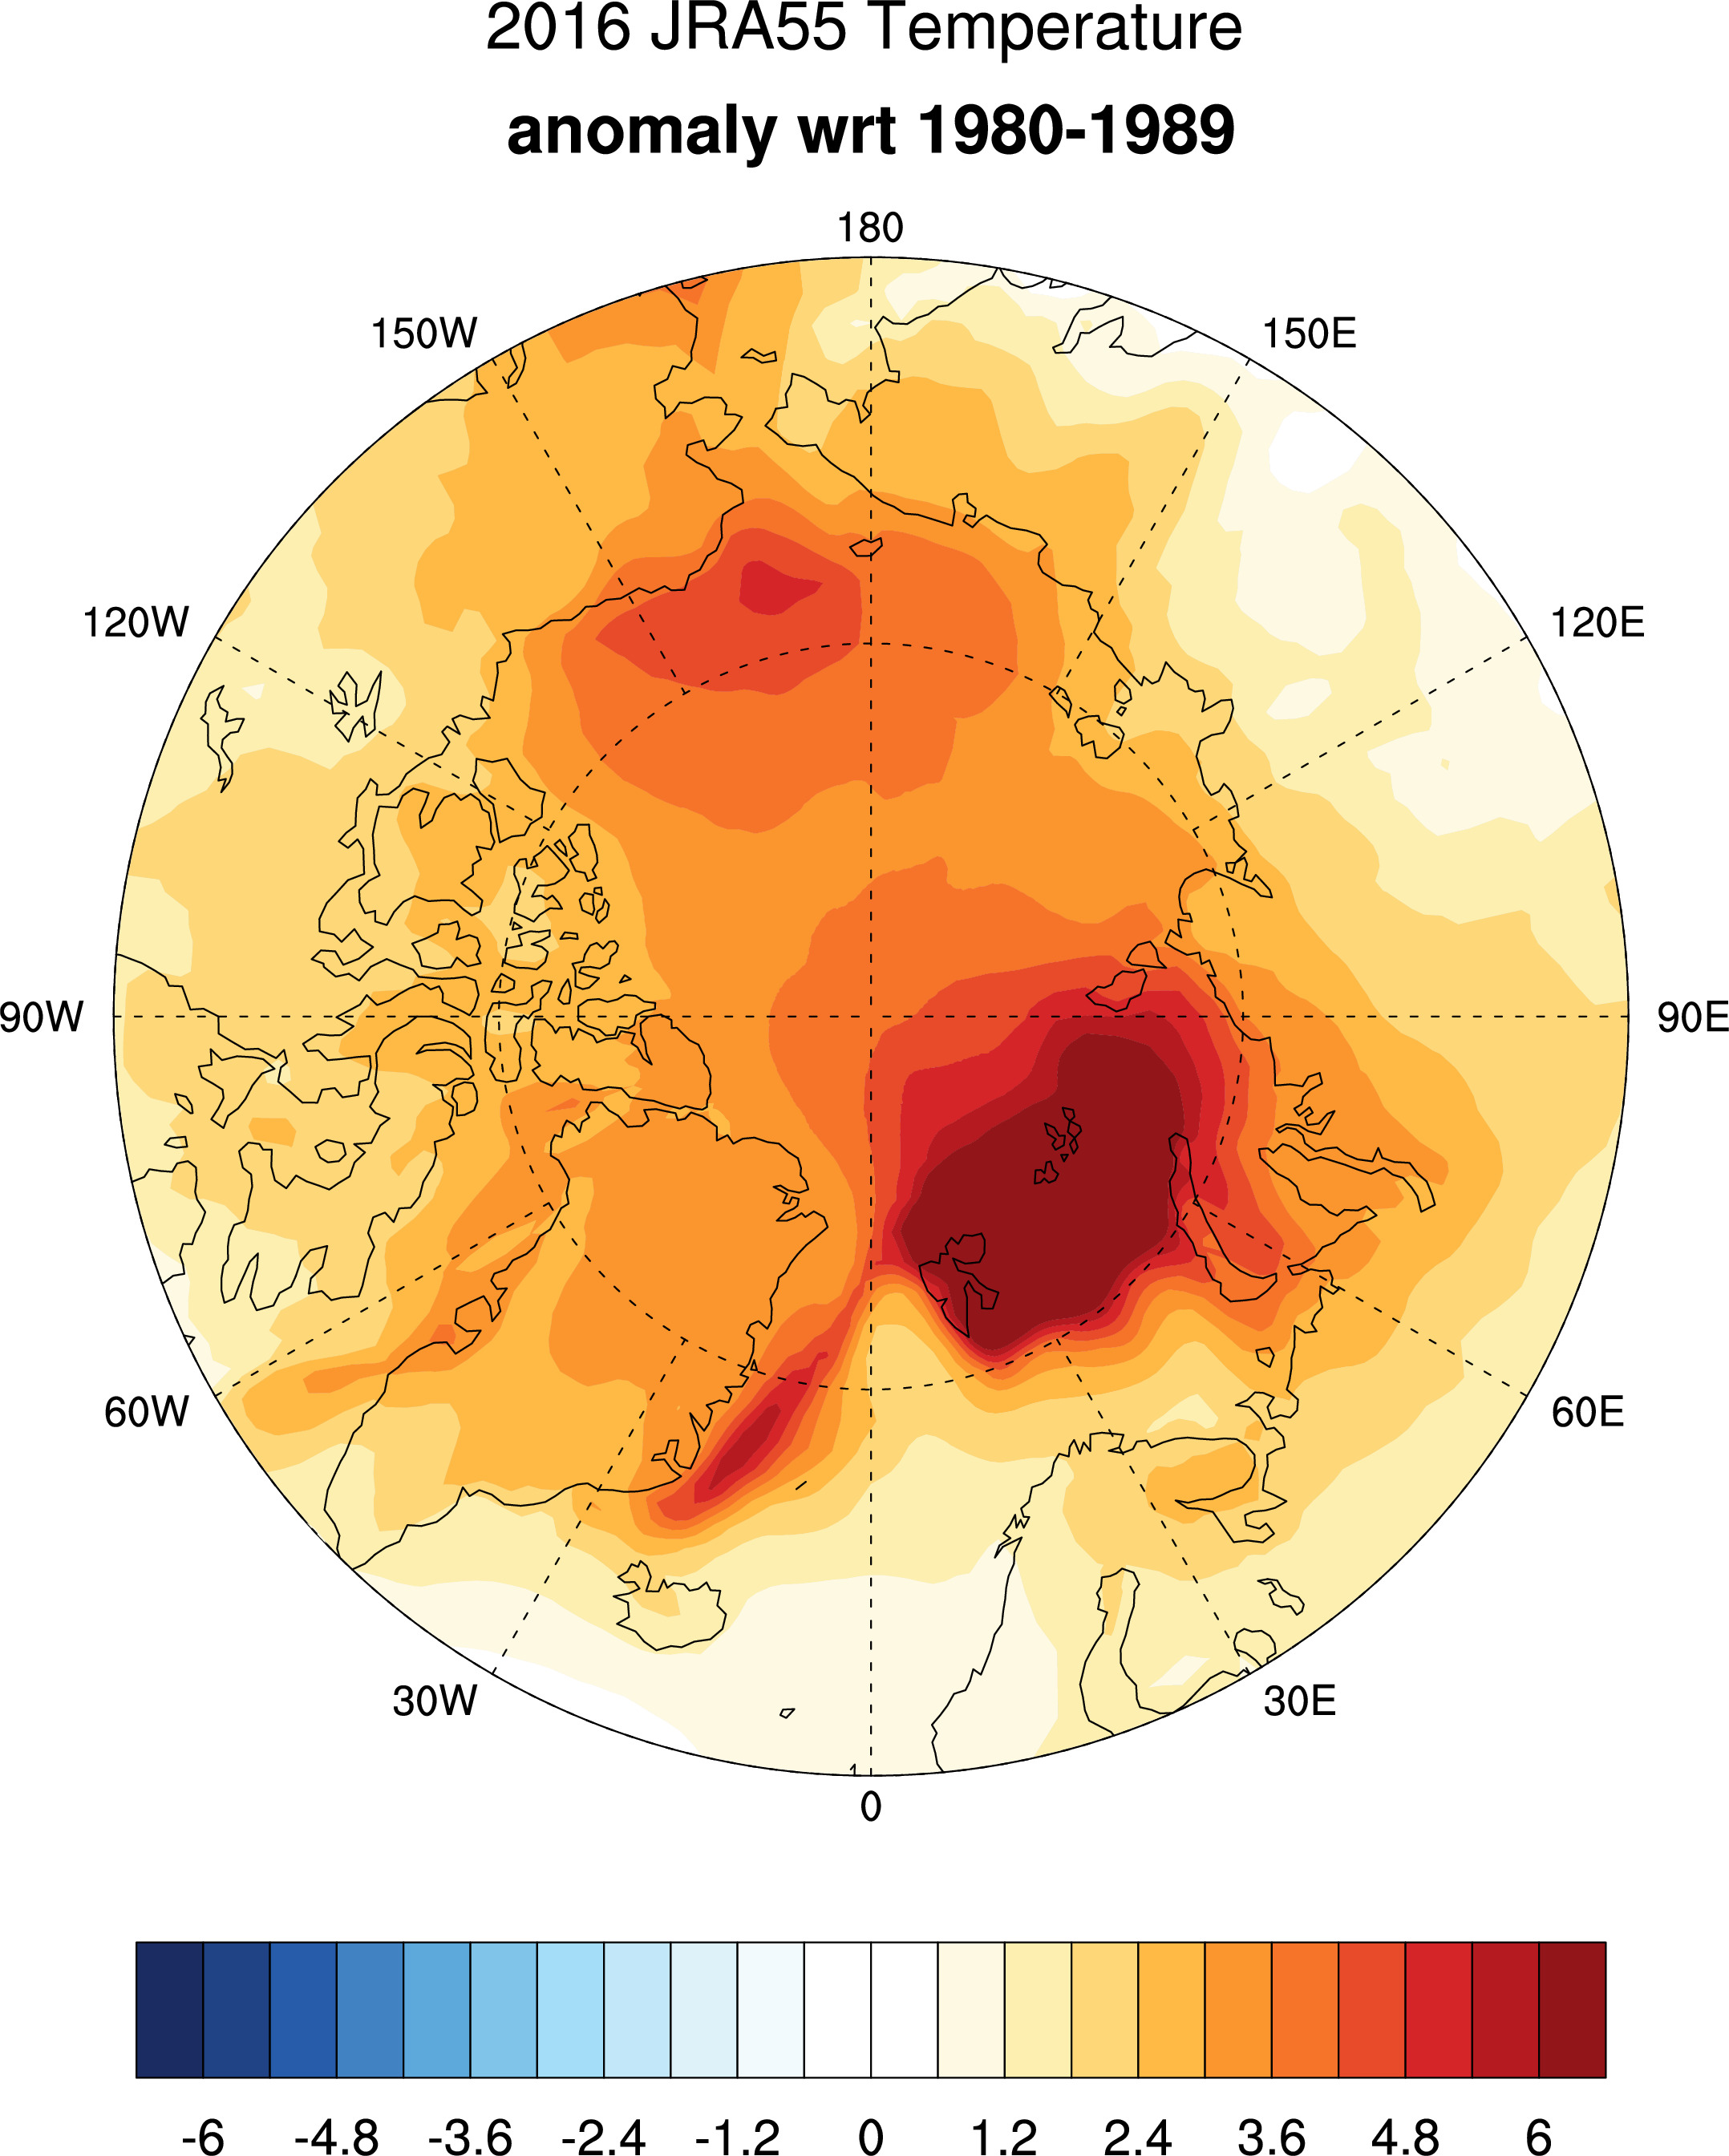
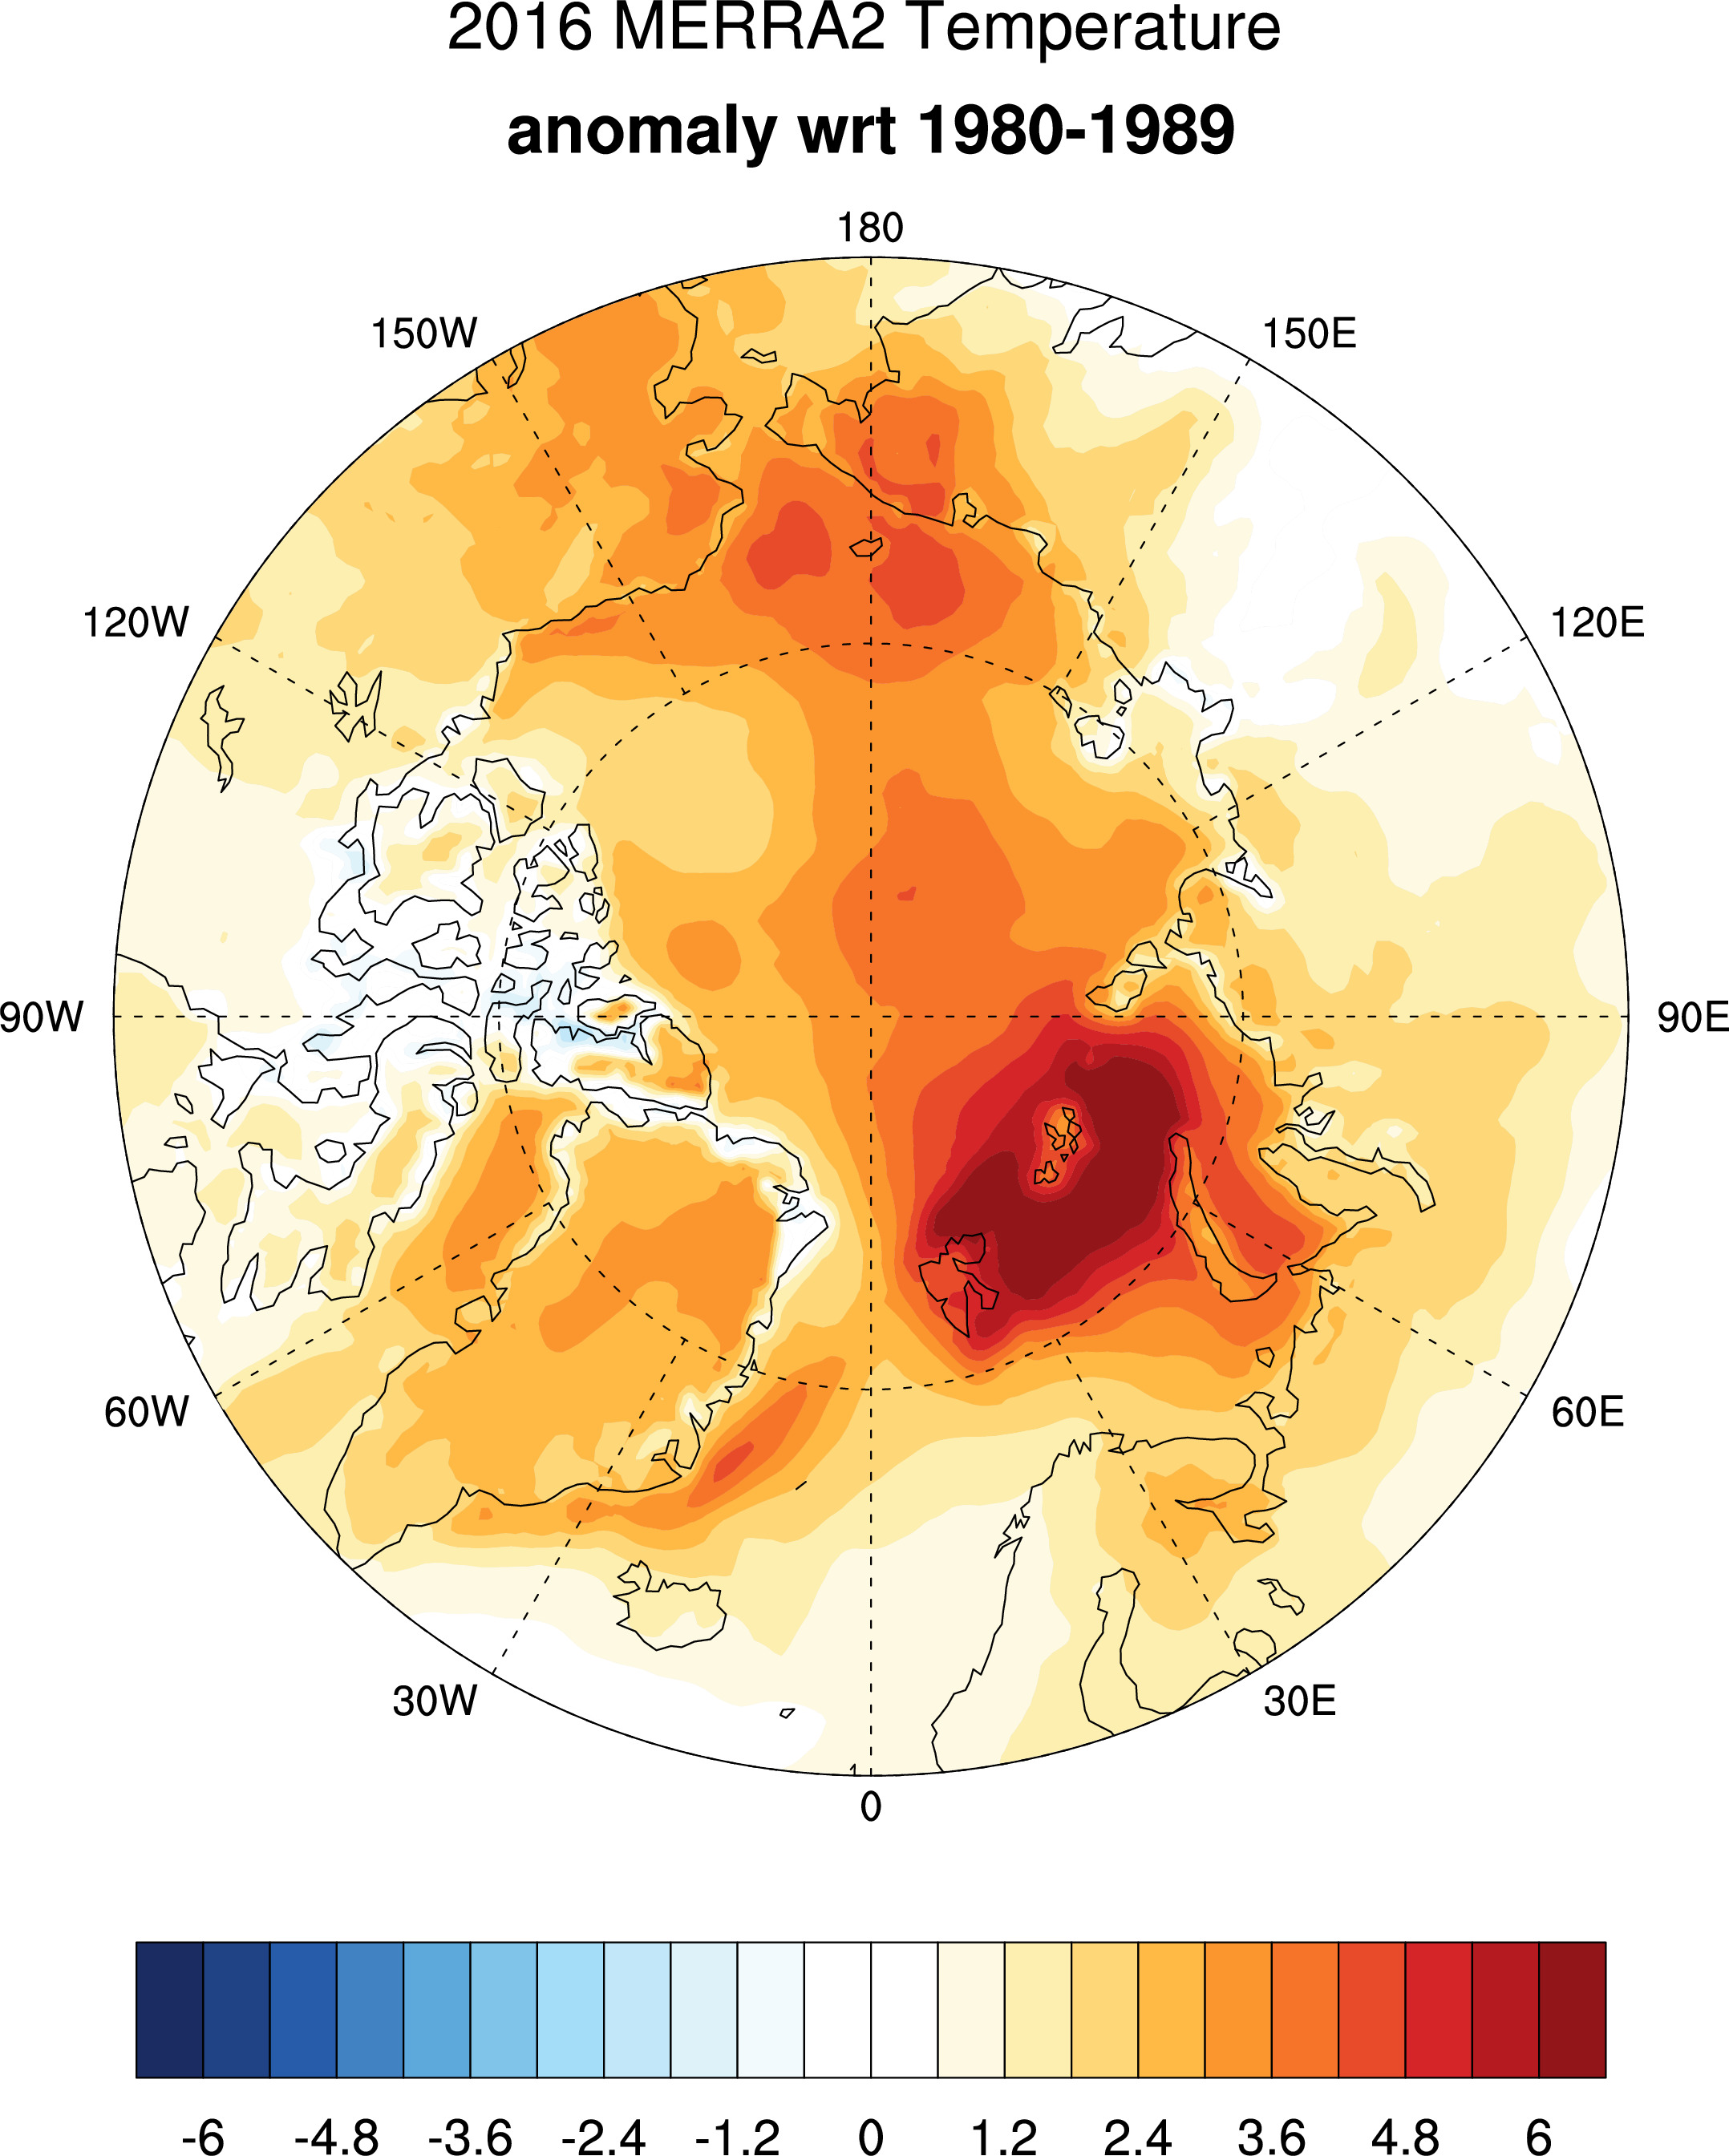
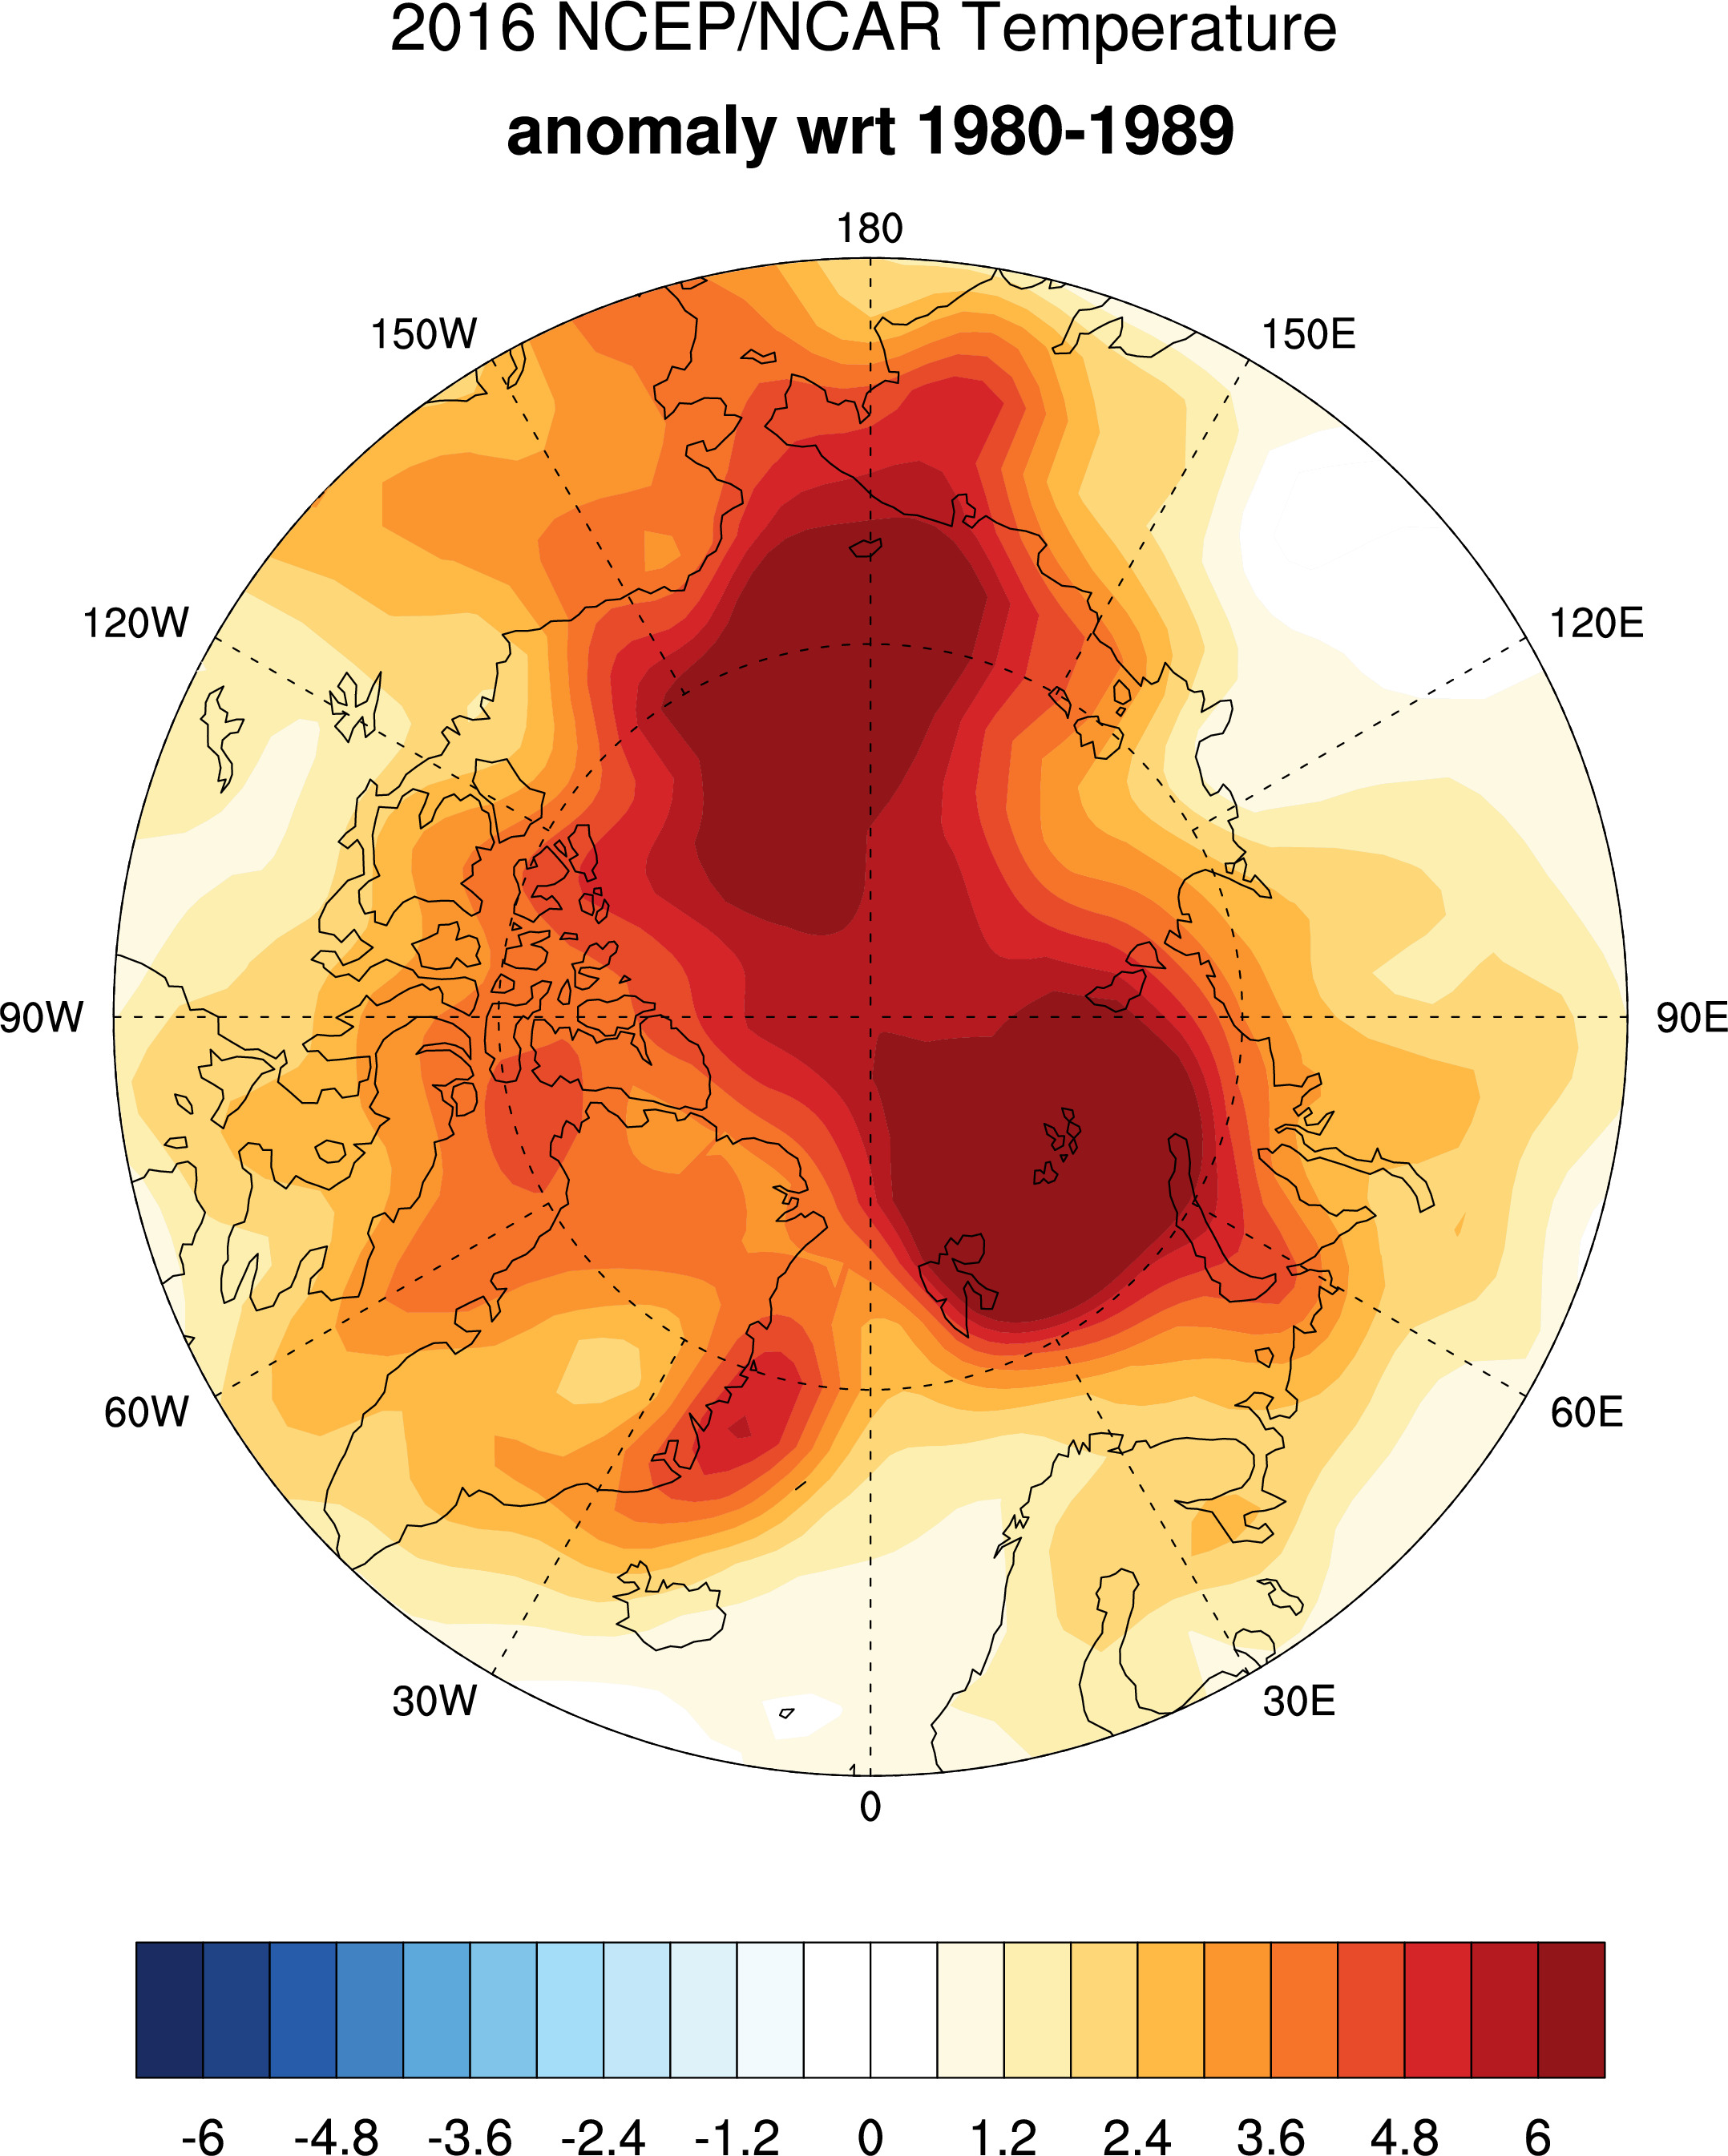
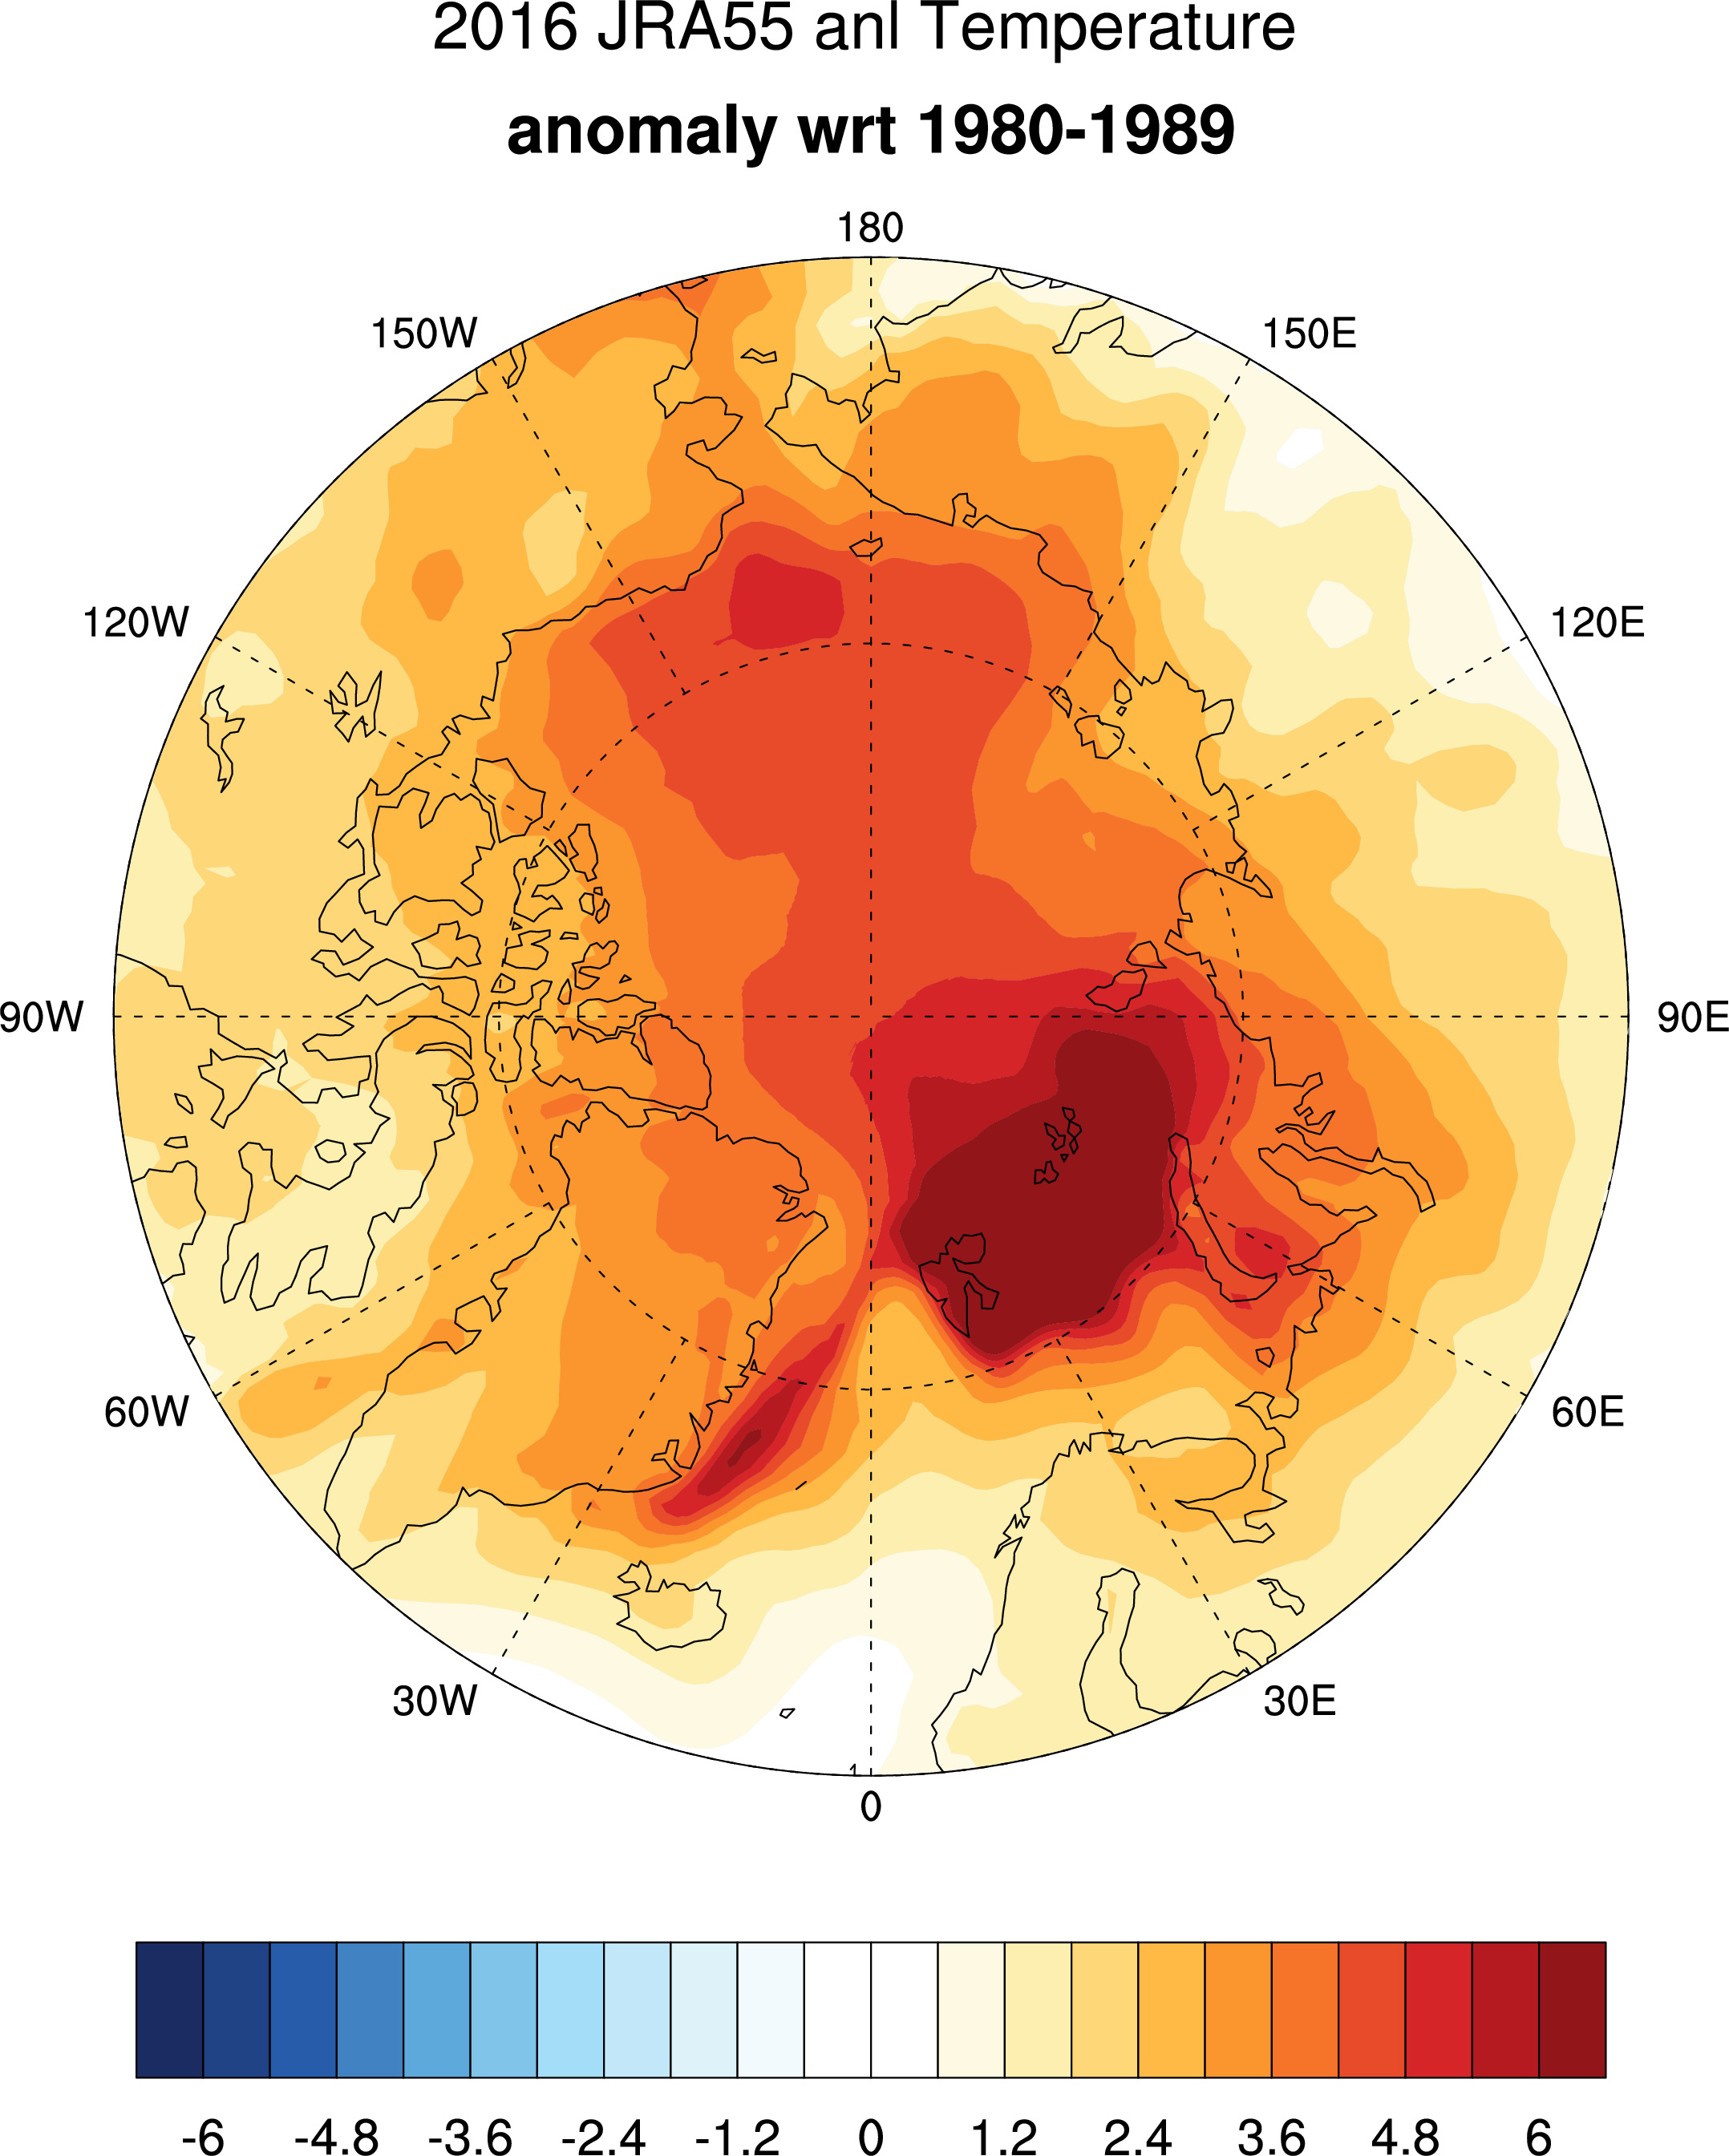
For Reference, Reanalyses polar anomaly maps
-------------------------------------------------------------------------------------------------------------------
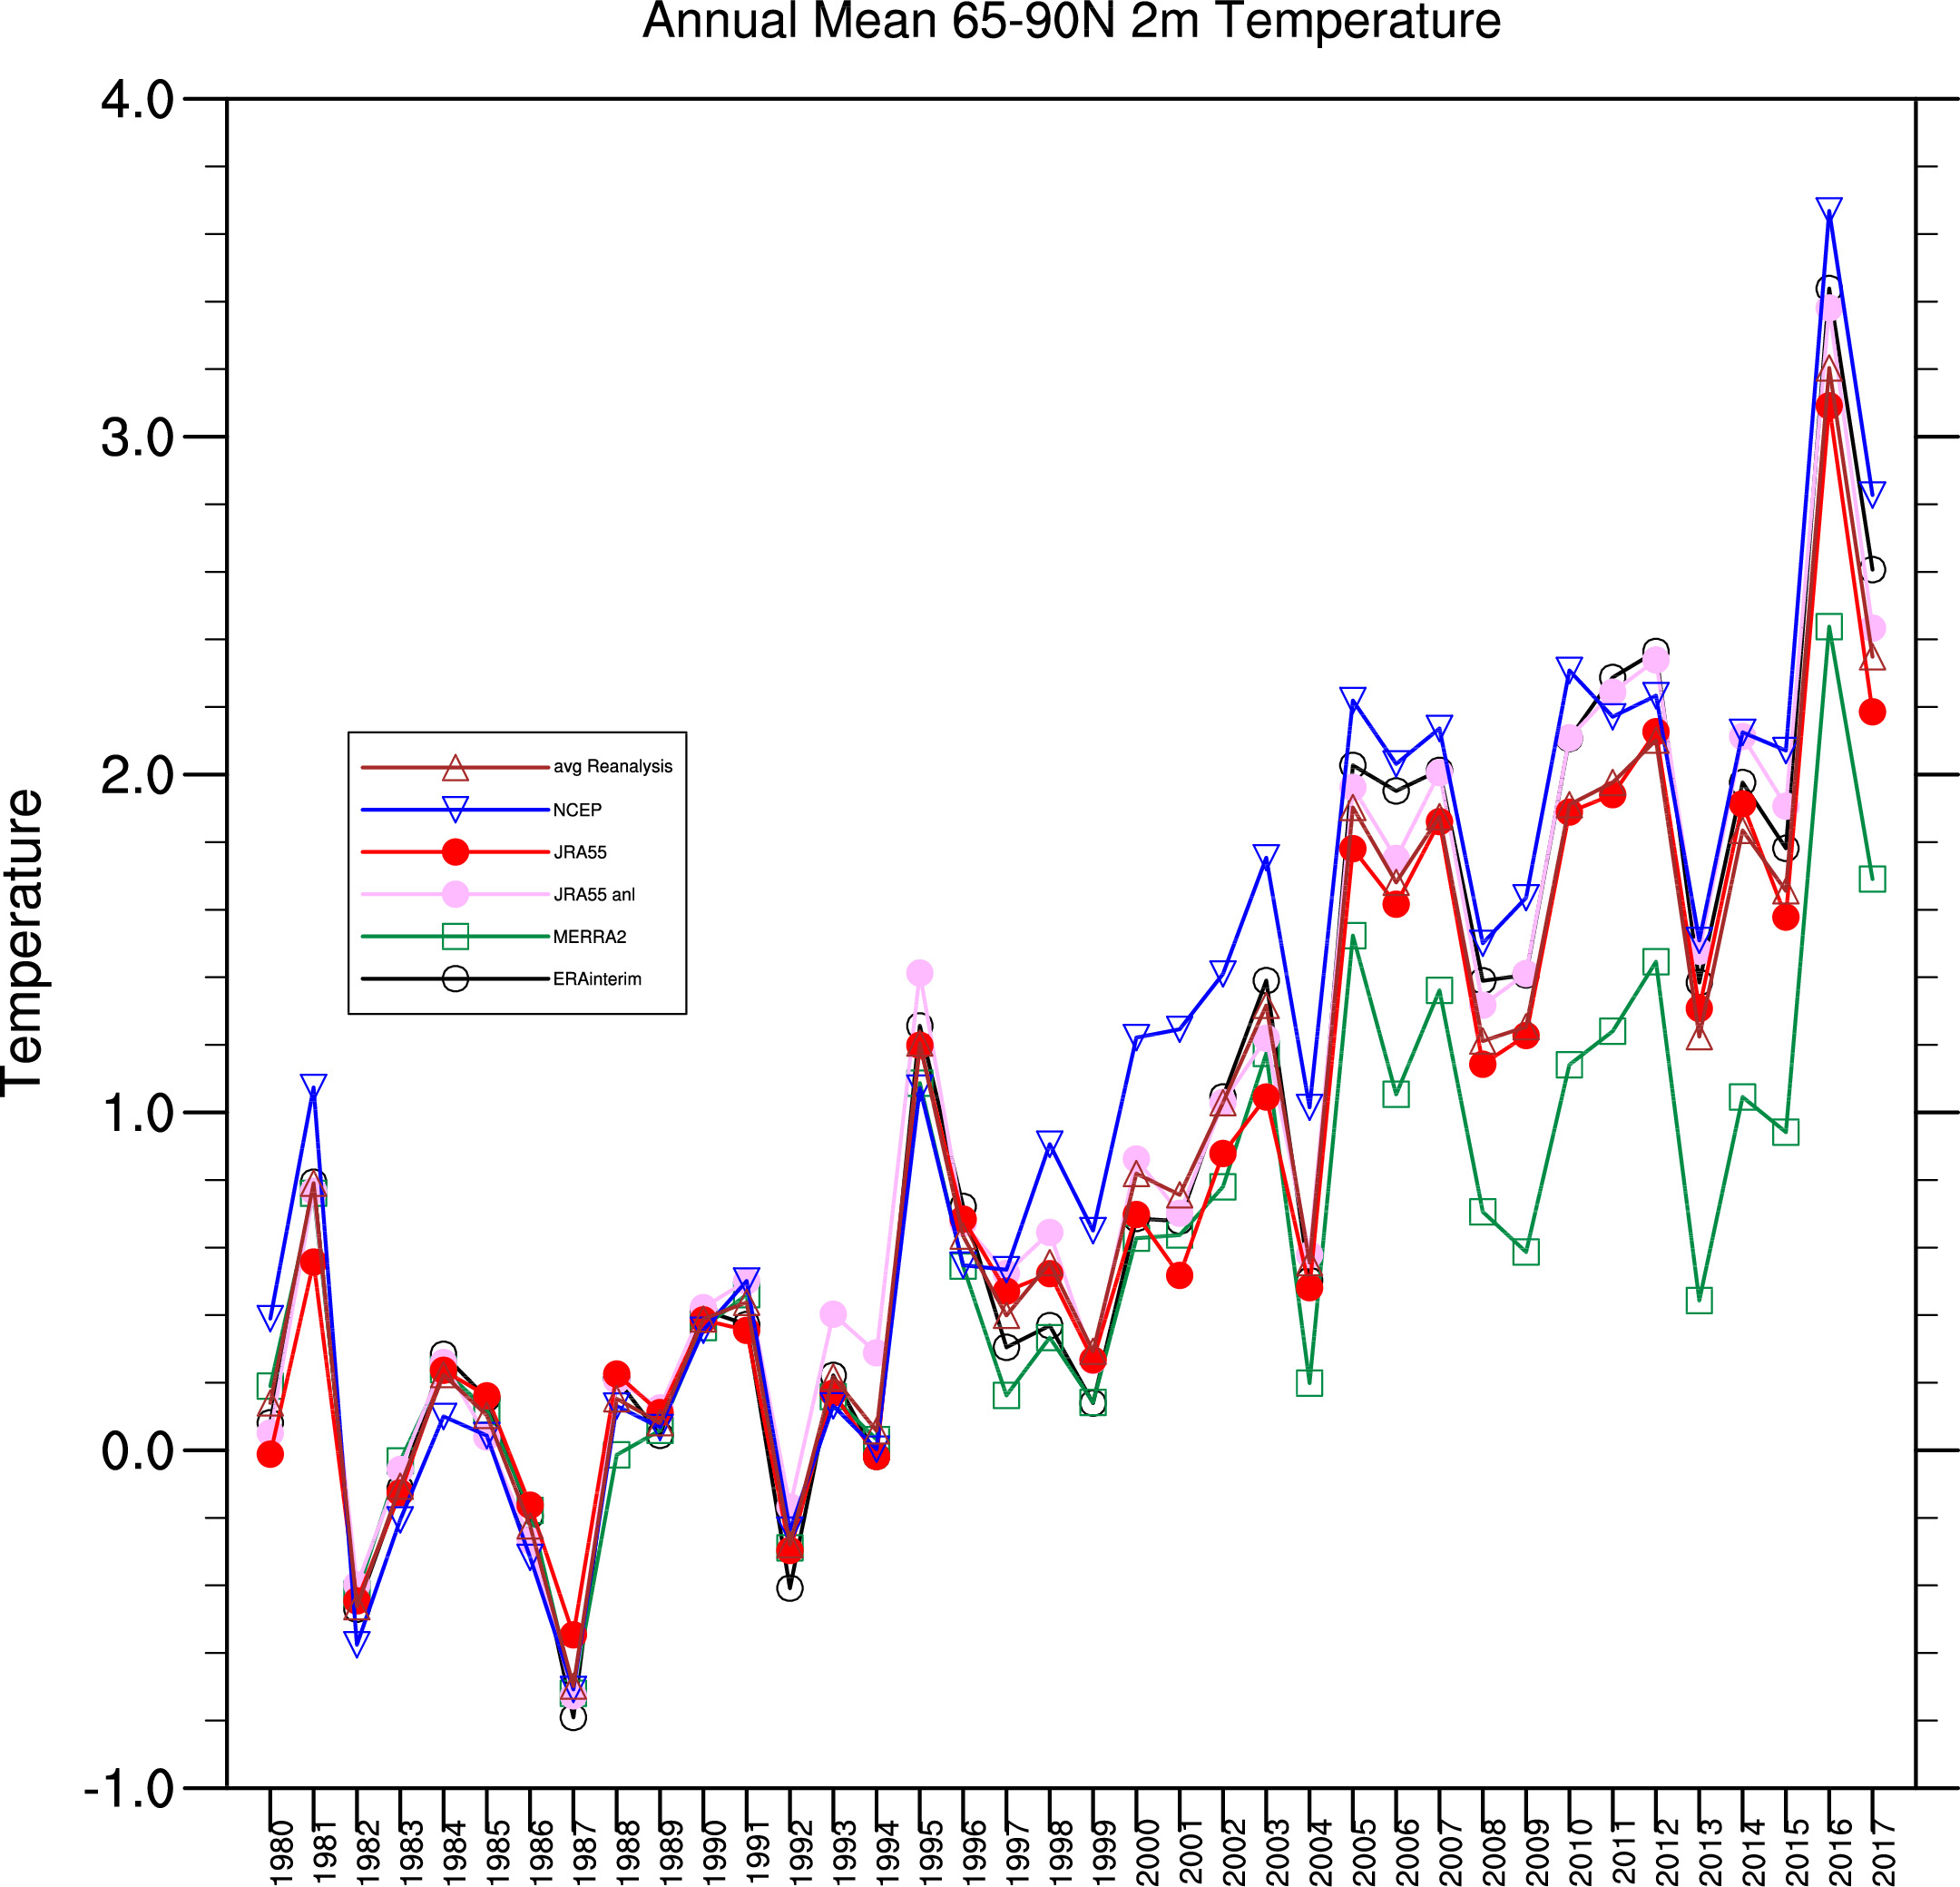
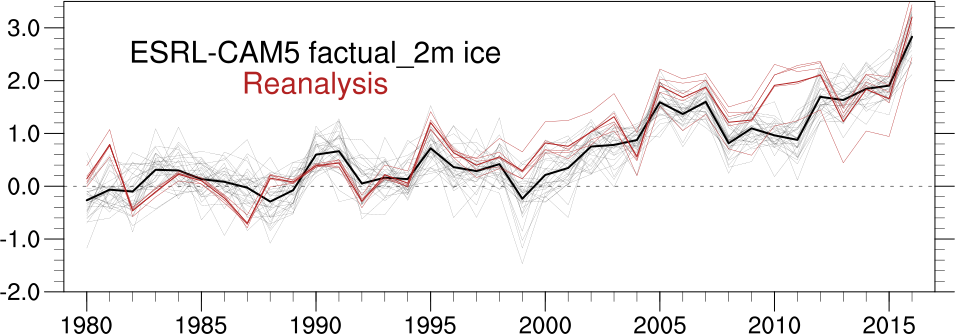
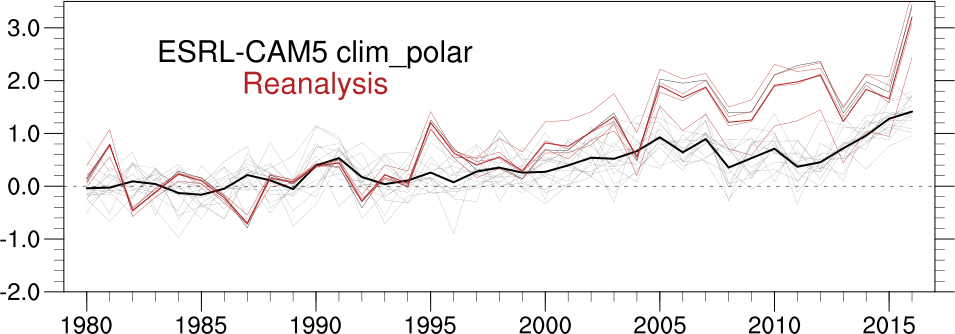
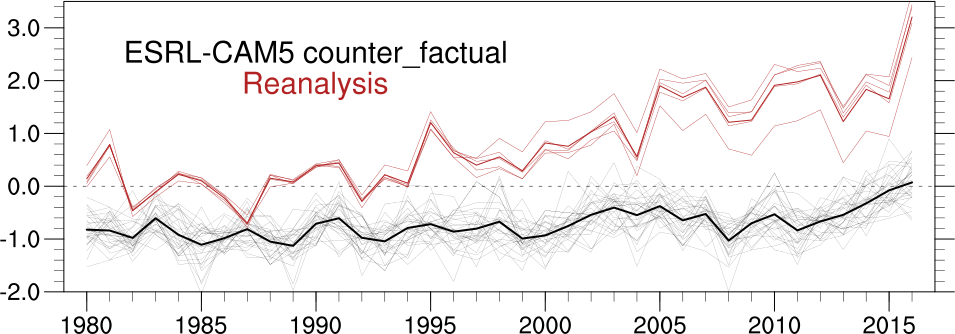
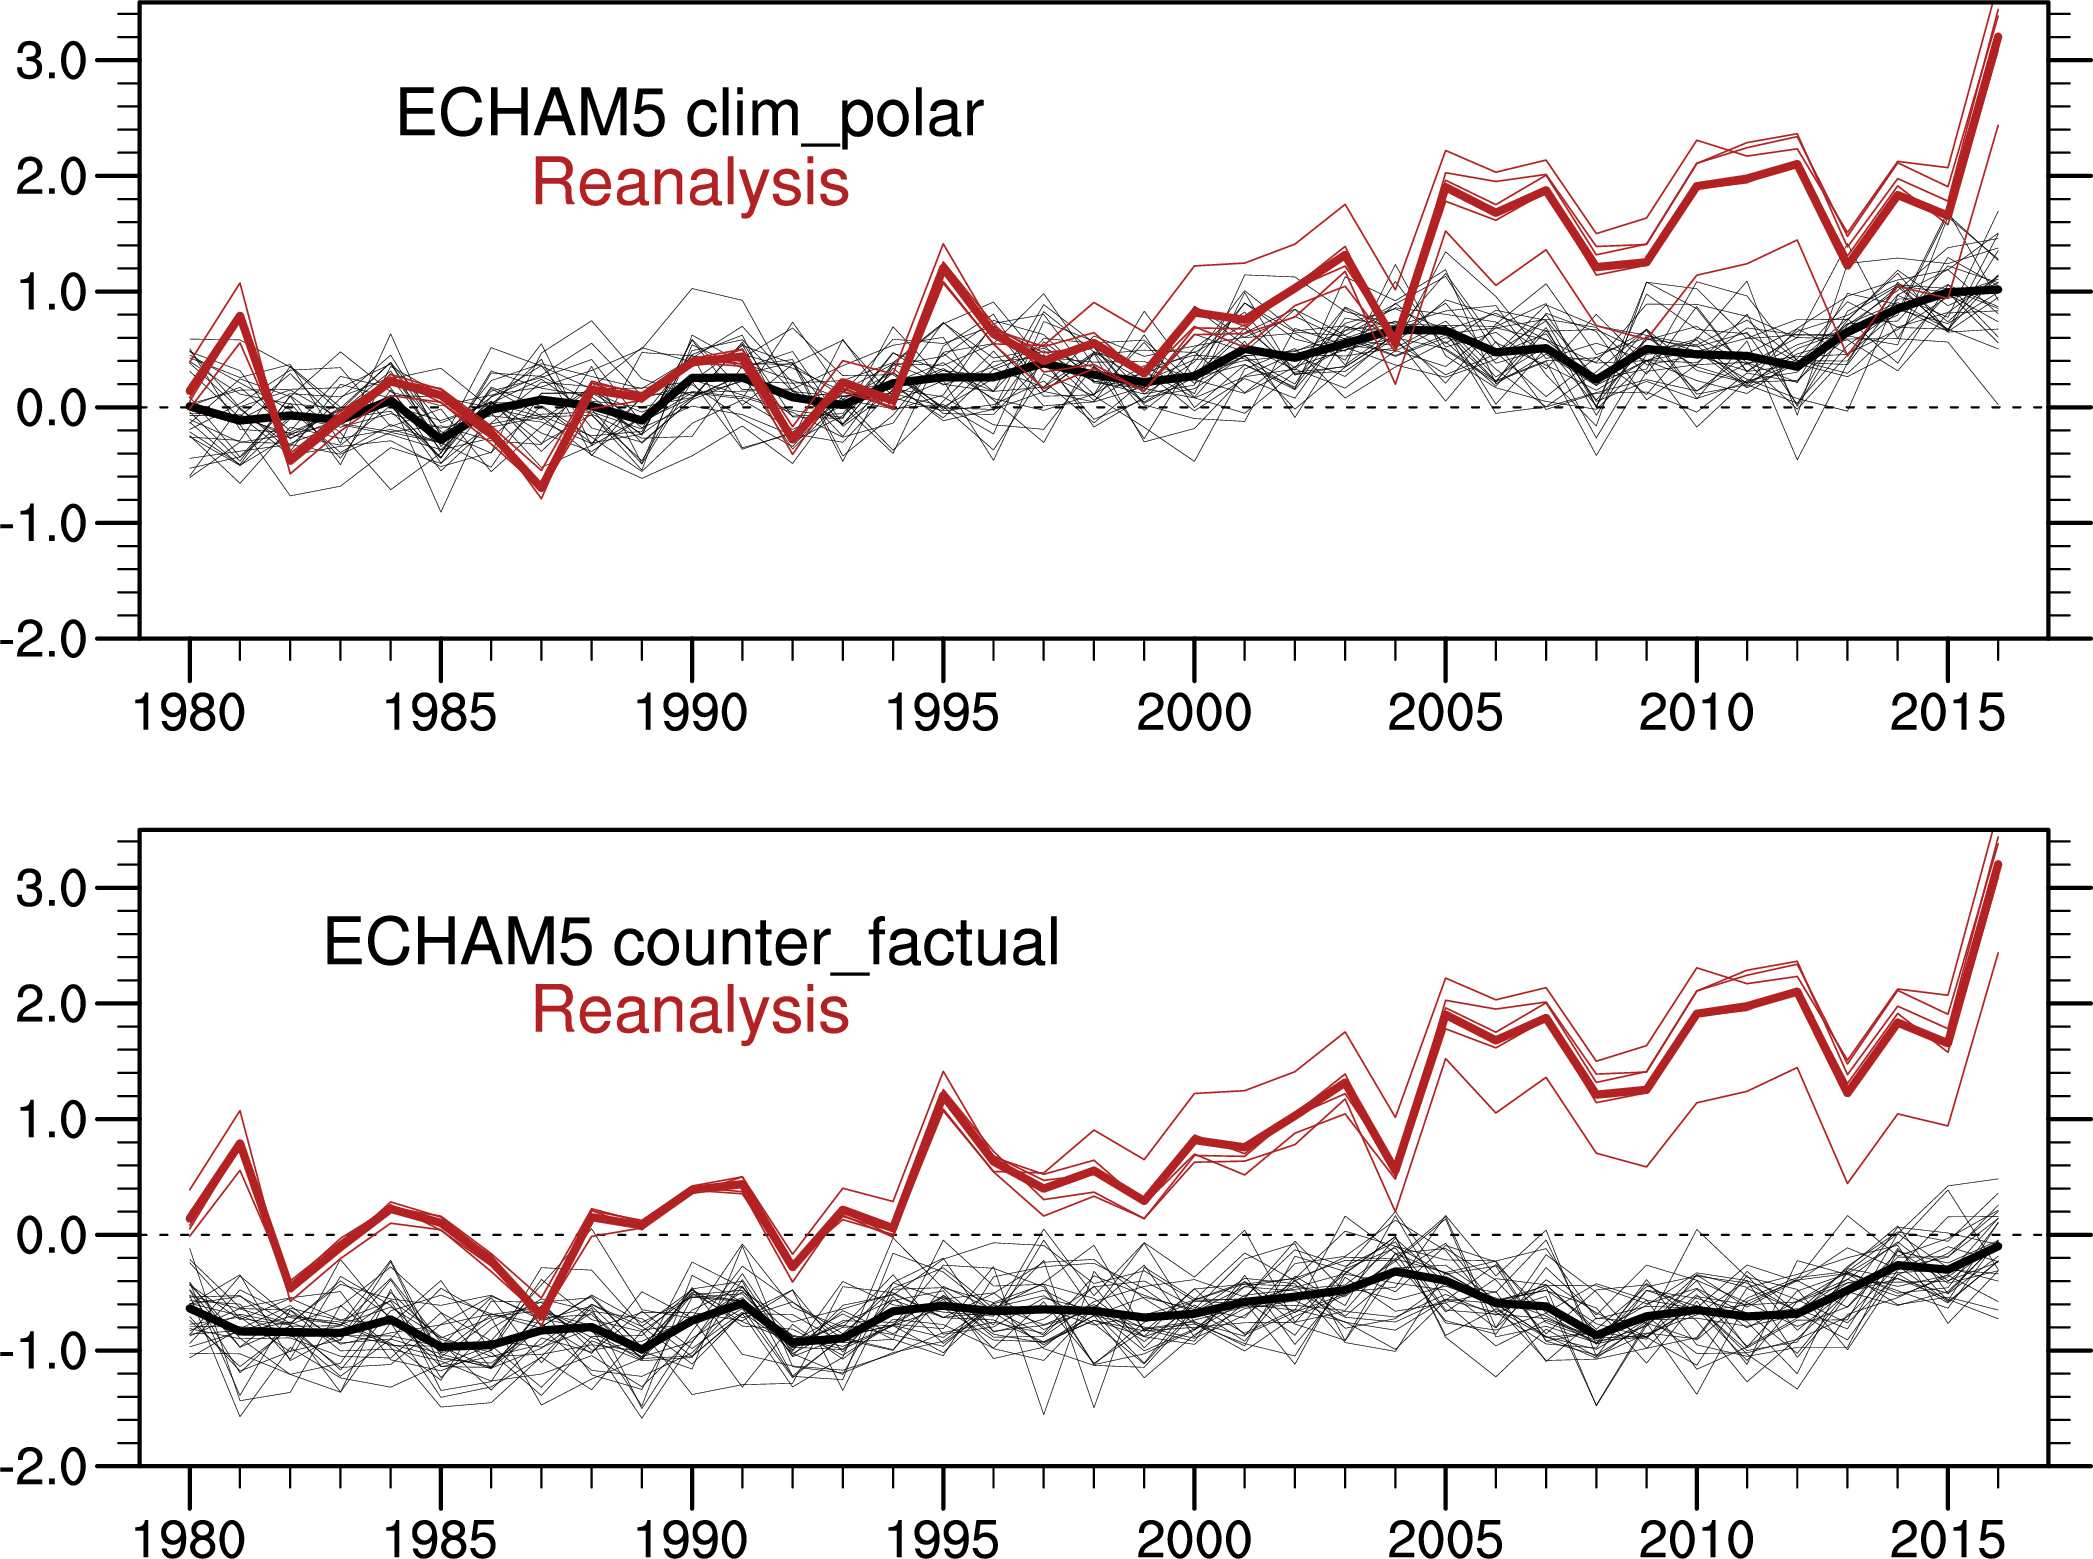
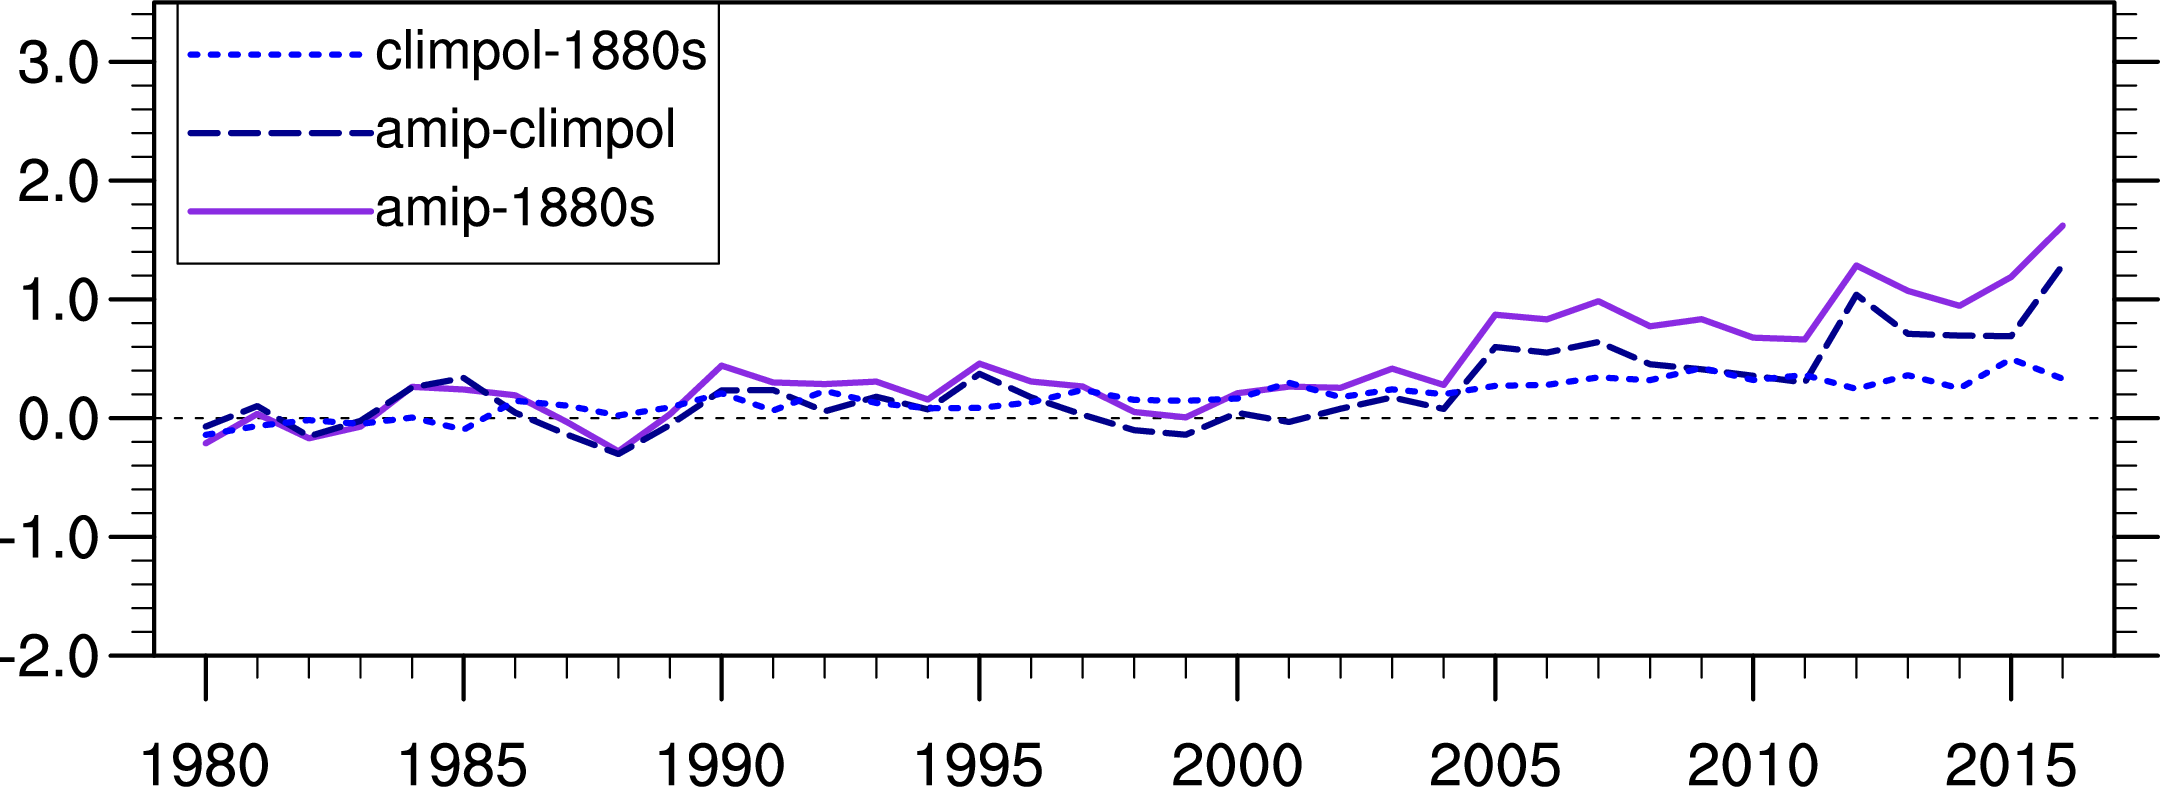
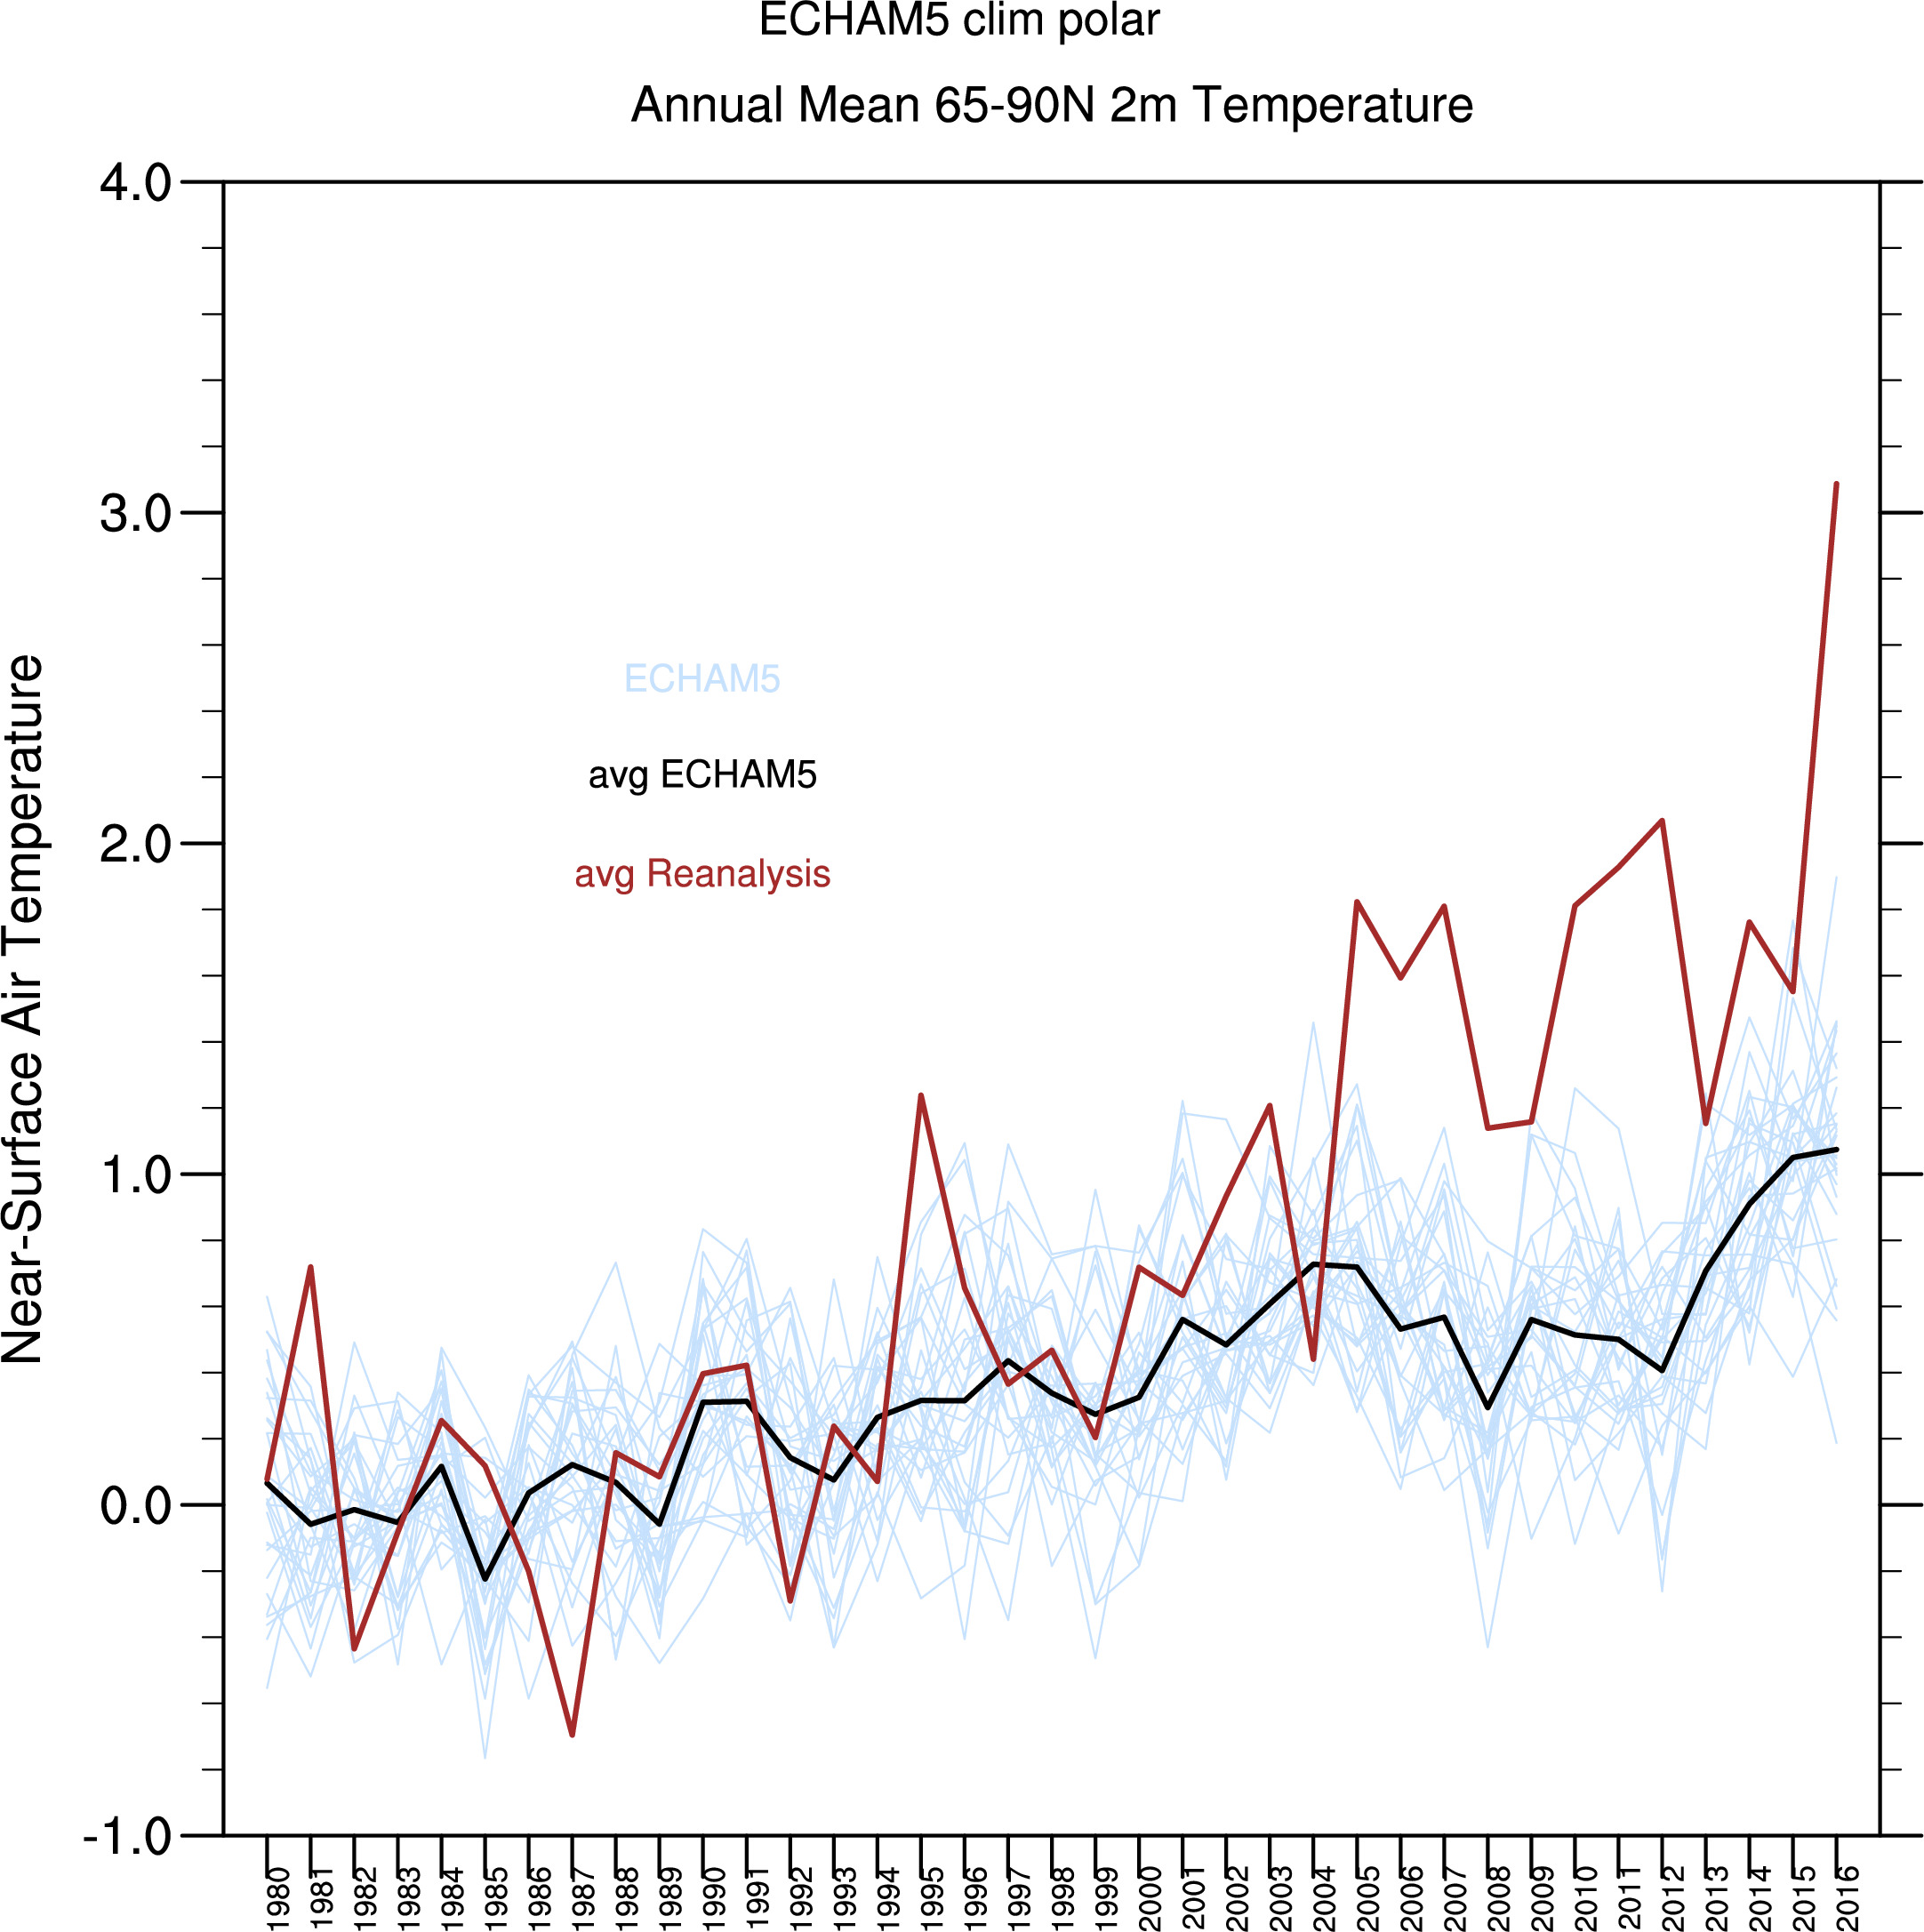
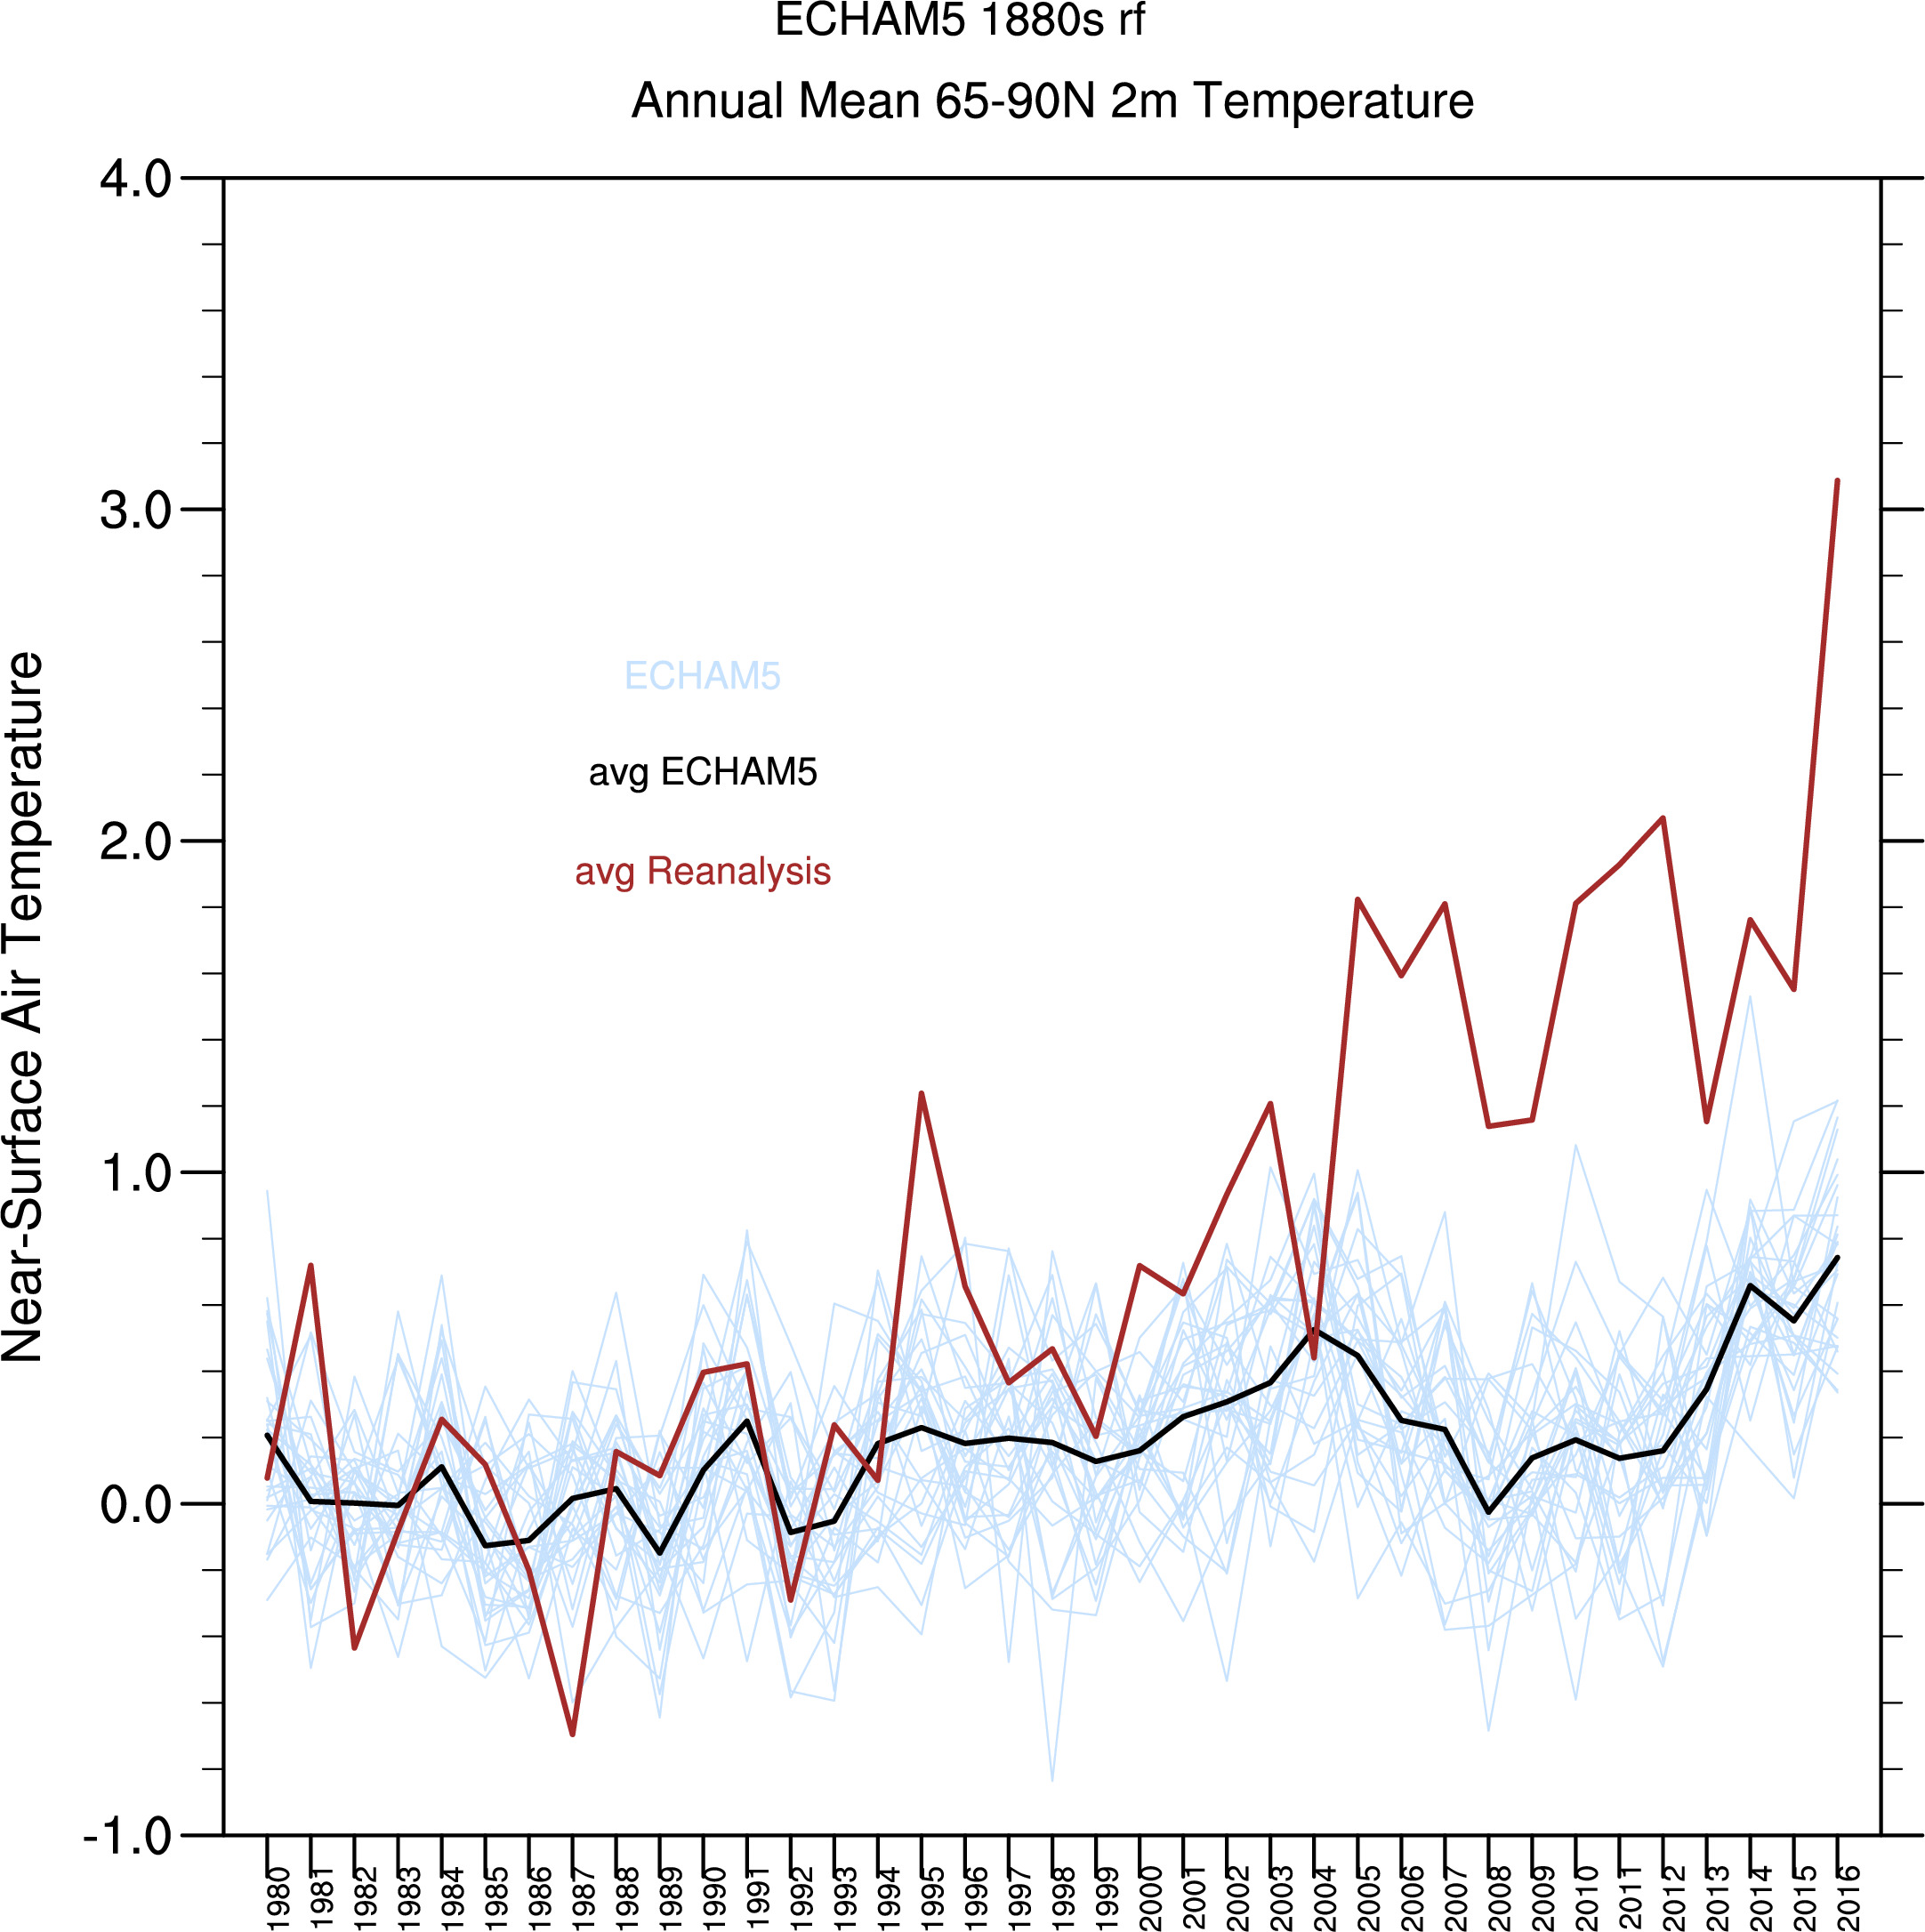
Time series
Anomalies (1980-1989 climatologies removed)
Mean of standard deviations among above obs_rf runs=0.277927 oC
Standard Deviation of ensemble average obs_rf above=0.599255 oC
2016 maps corresponding to top 3 obs_rf ensemble members above
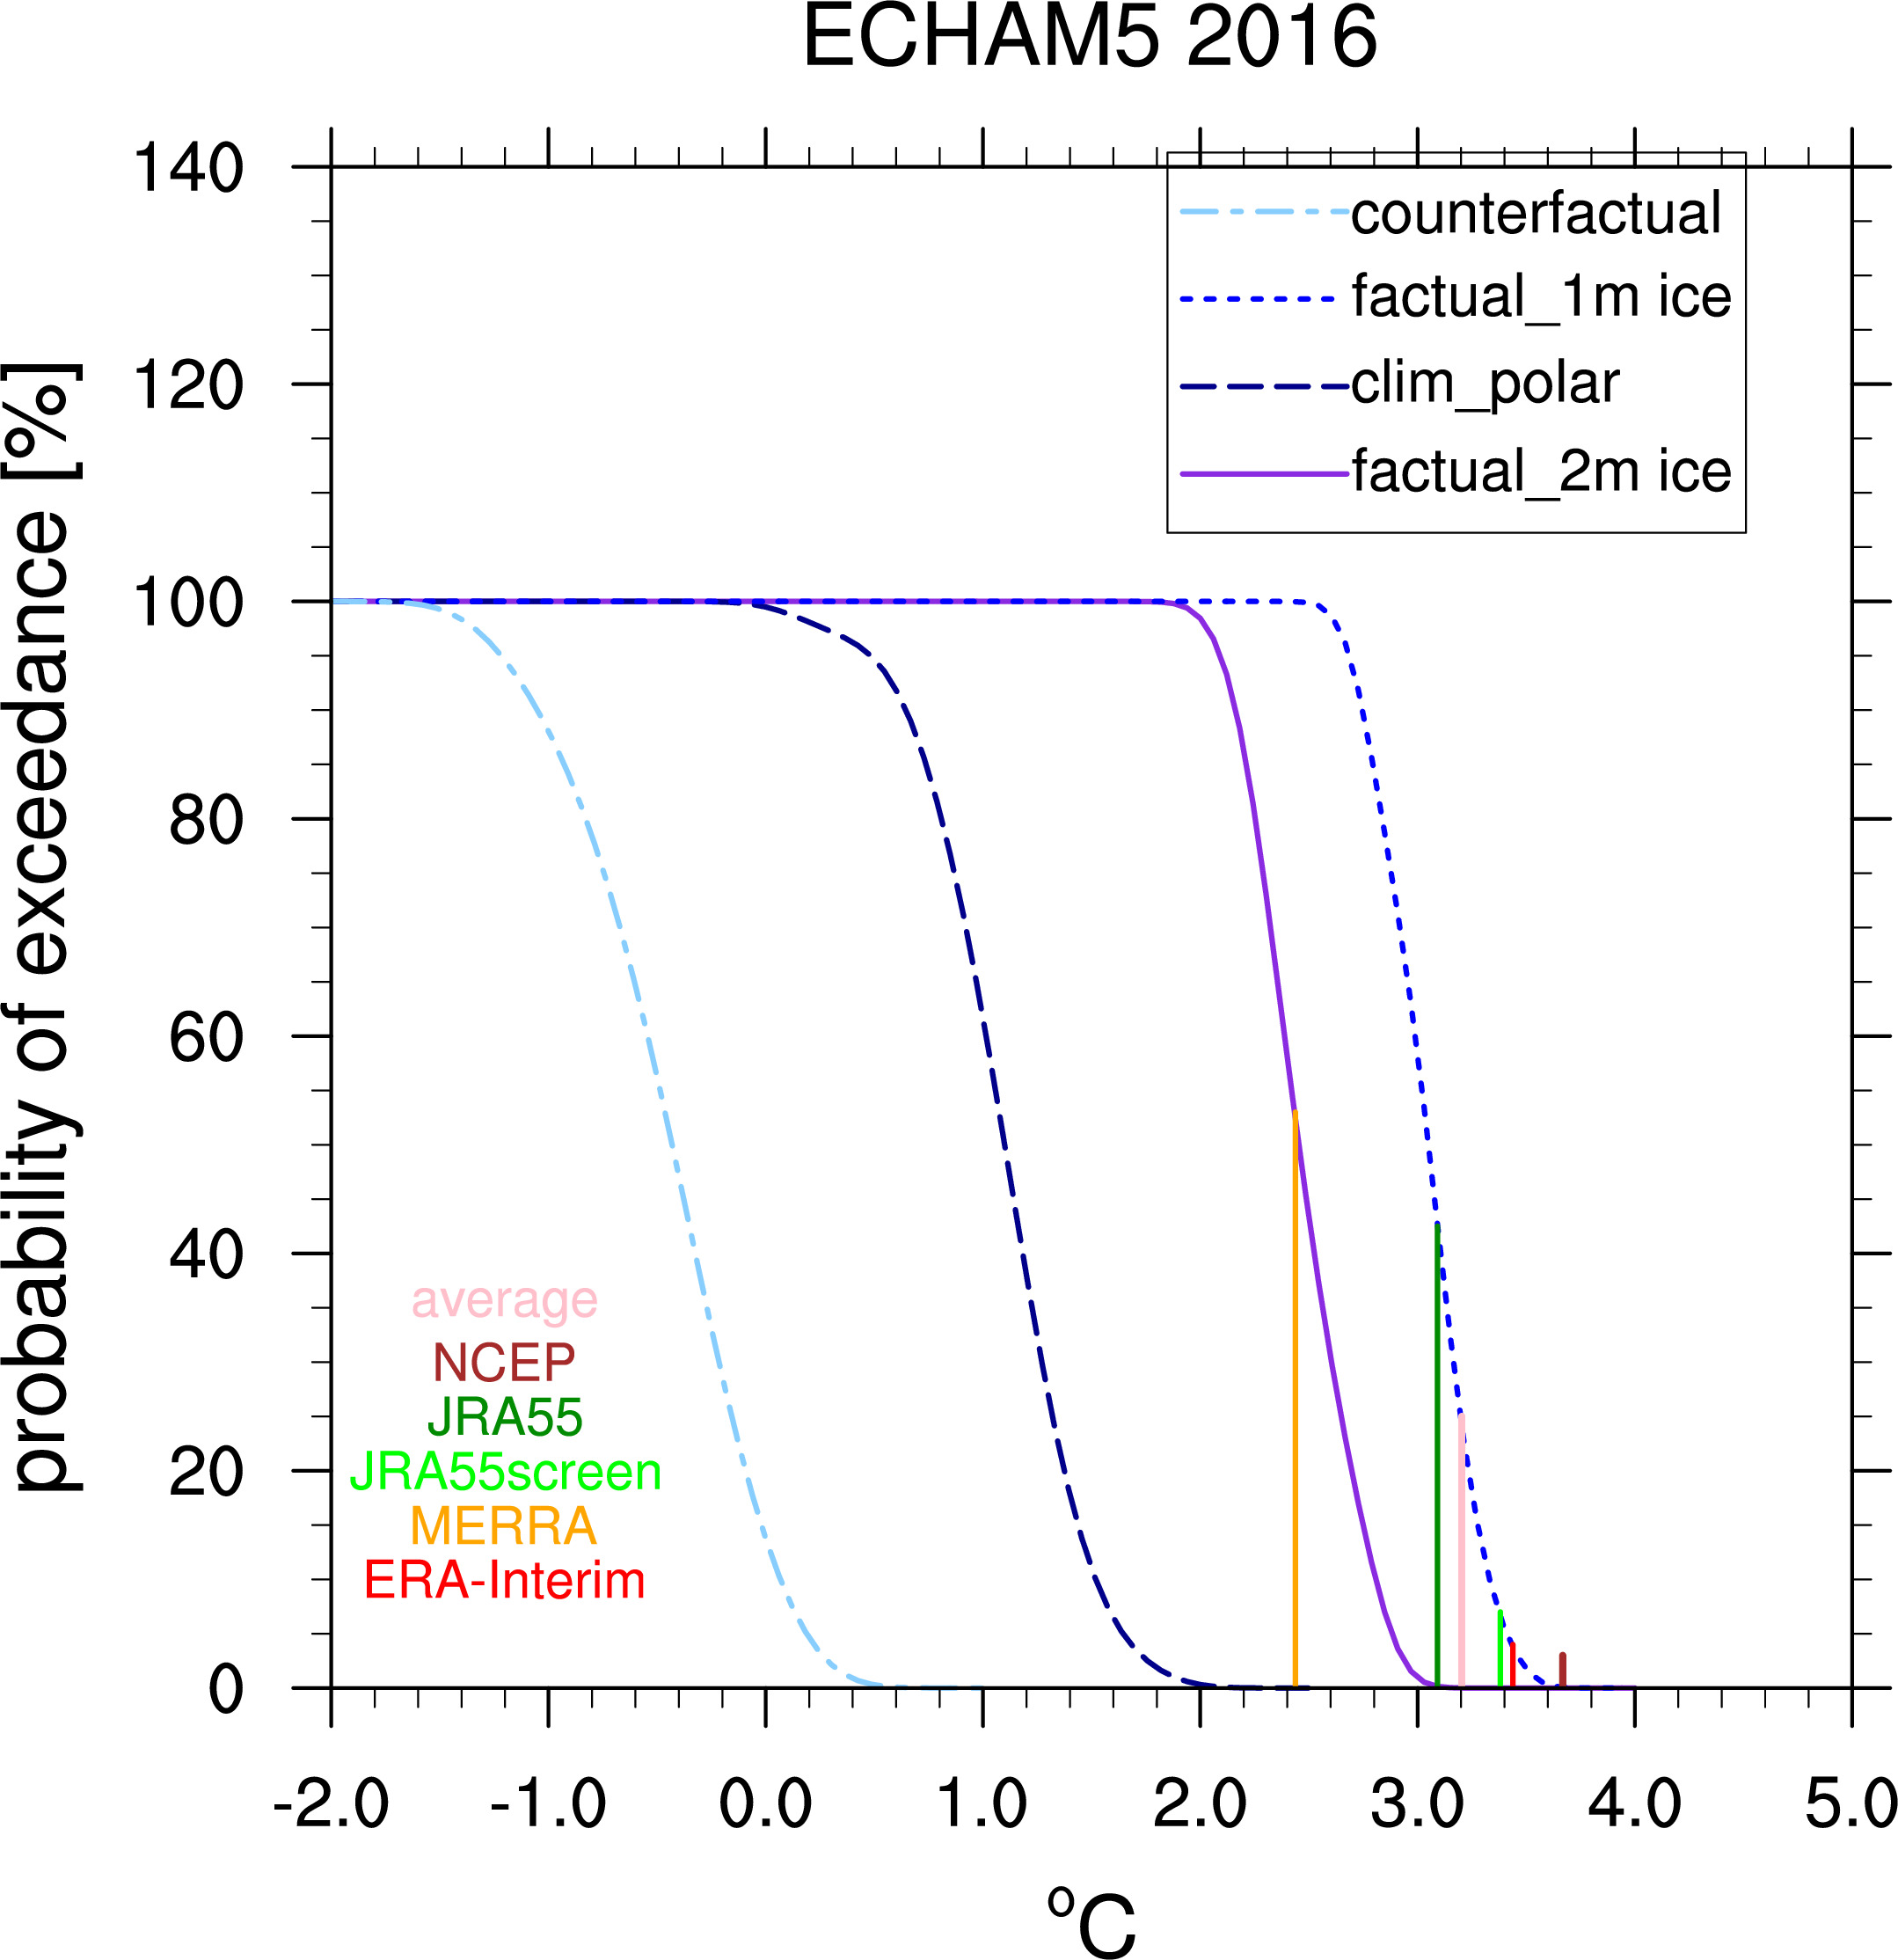
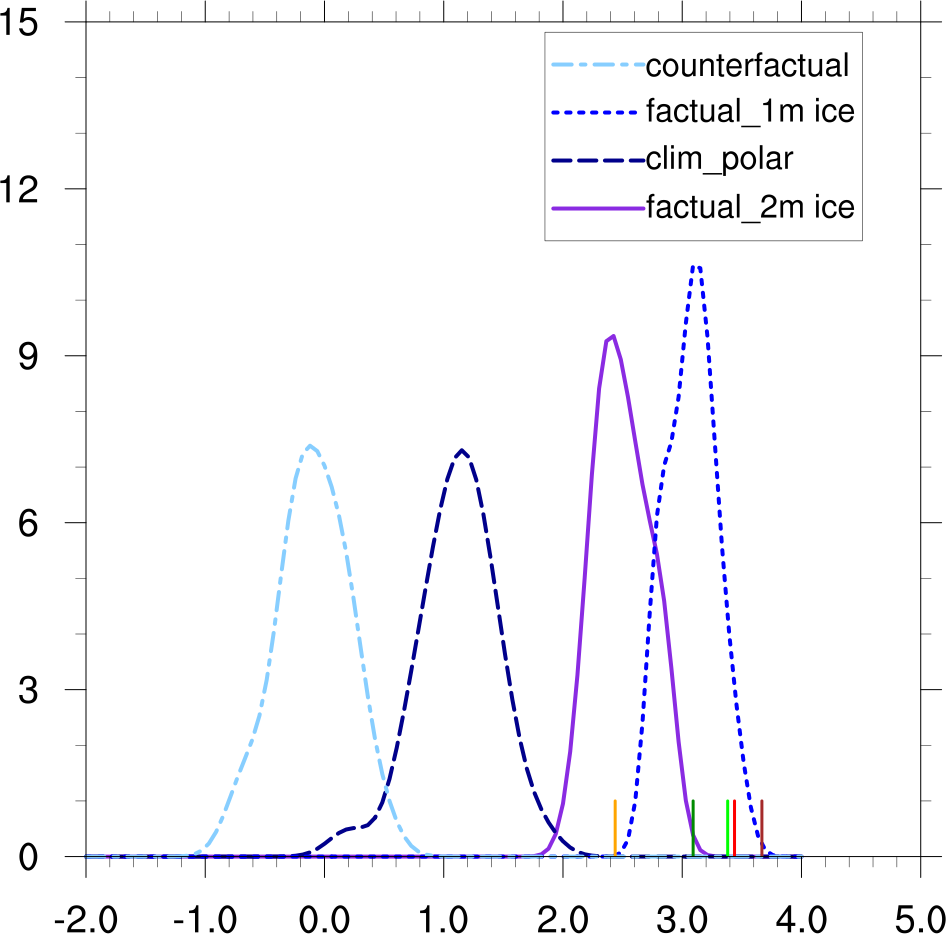
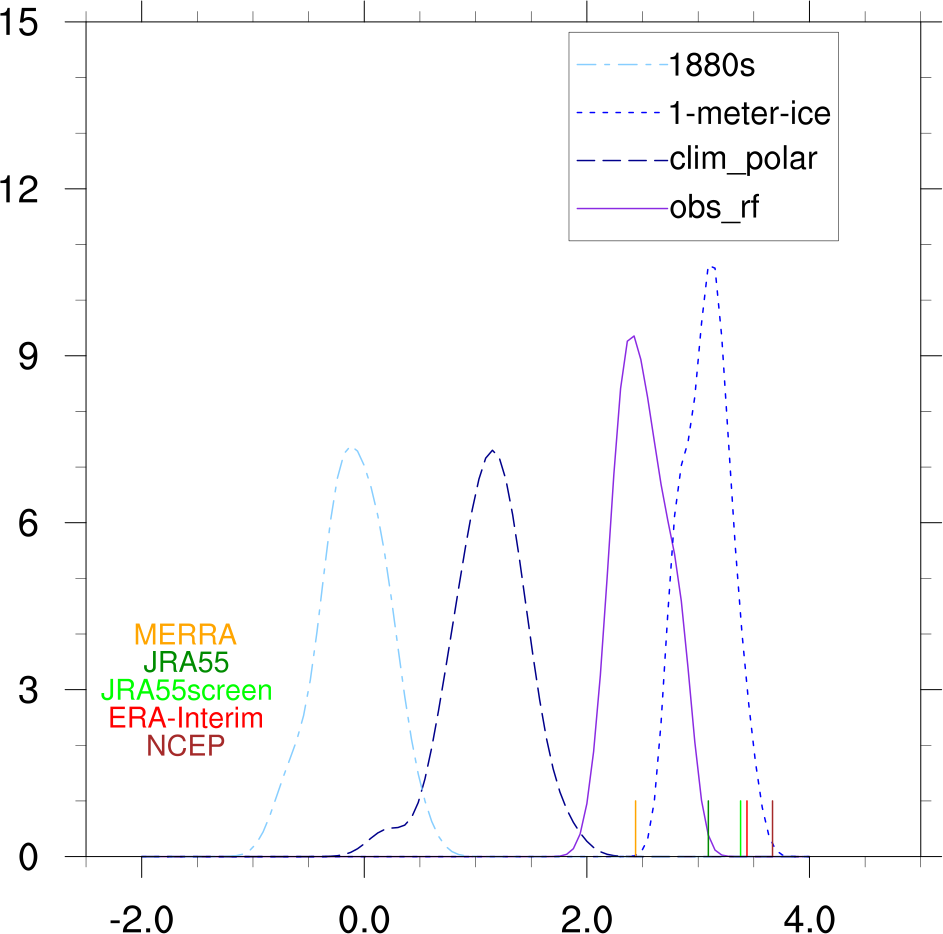
pdfs of above 2016 anomalies
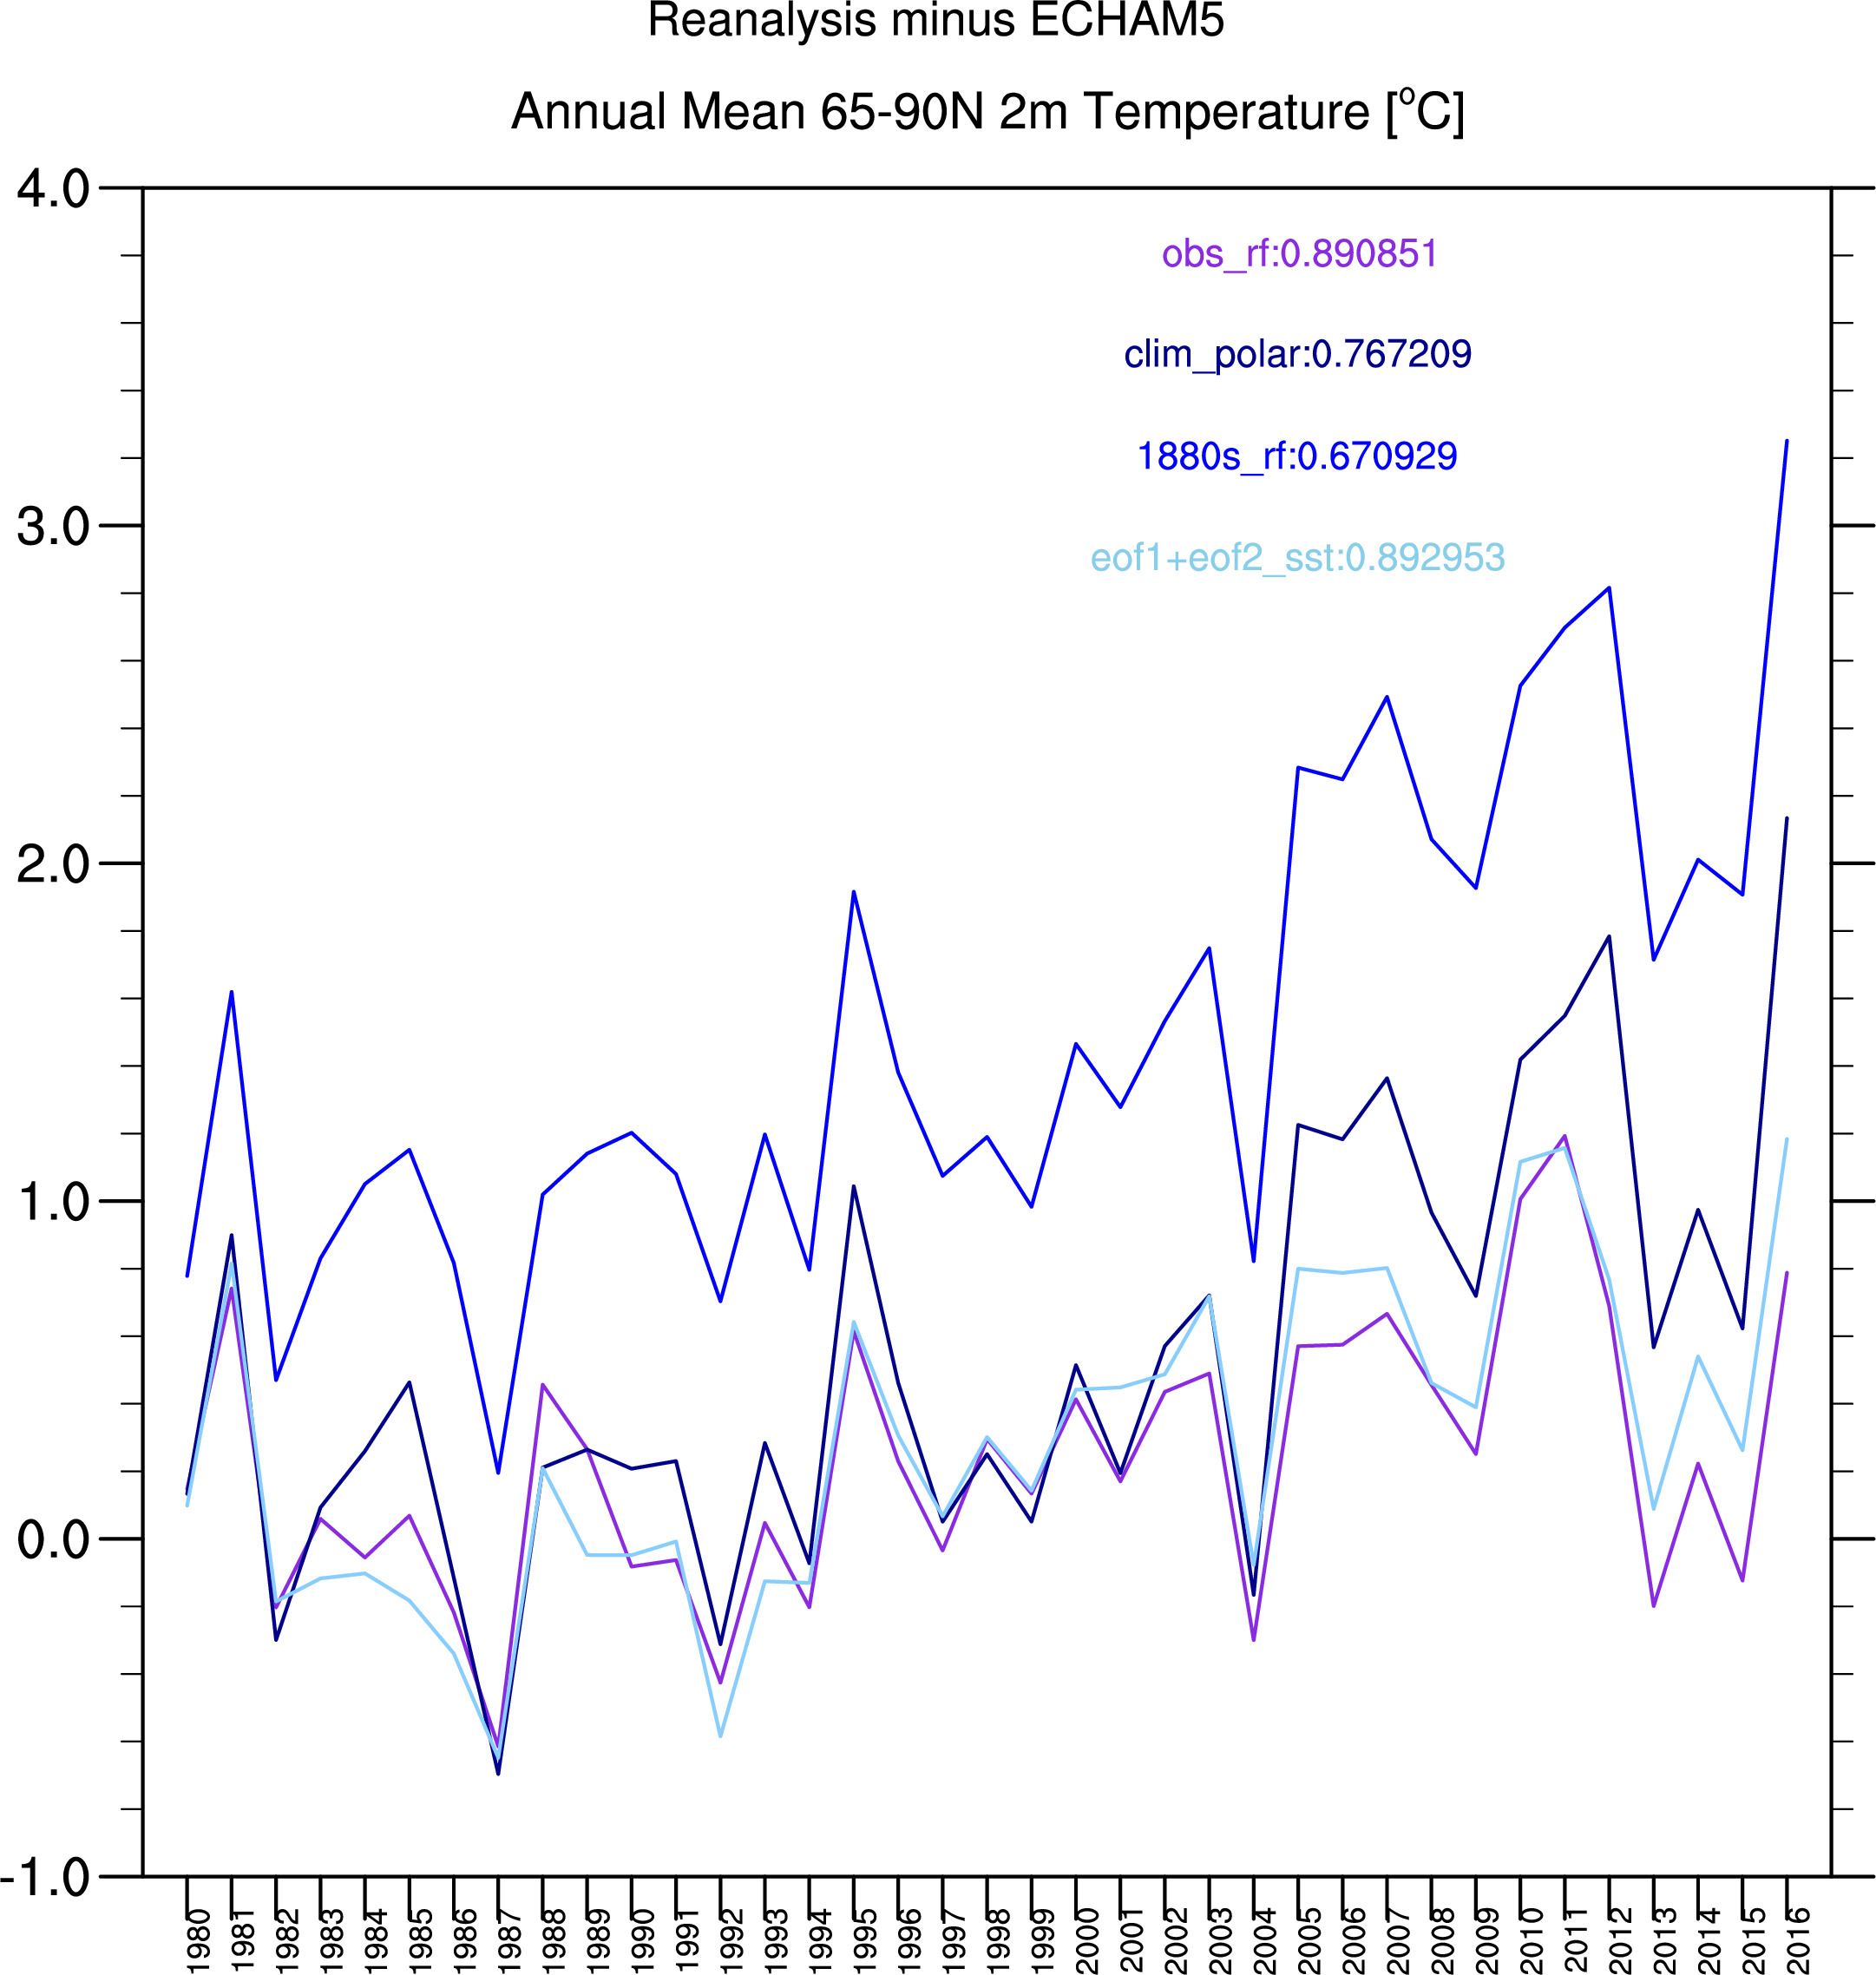
Time series anomaly differences
Time series differences
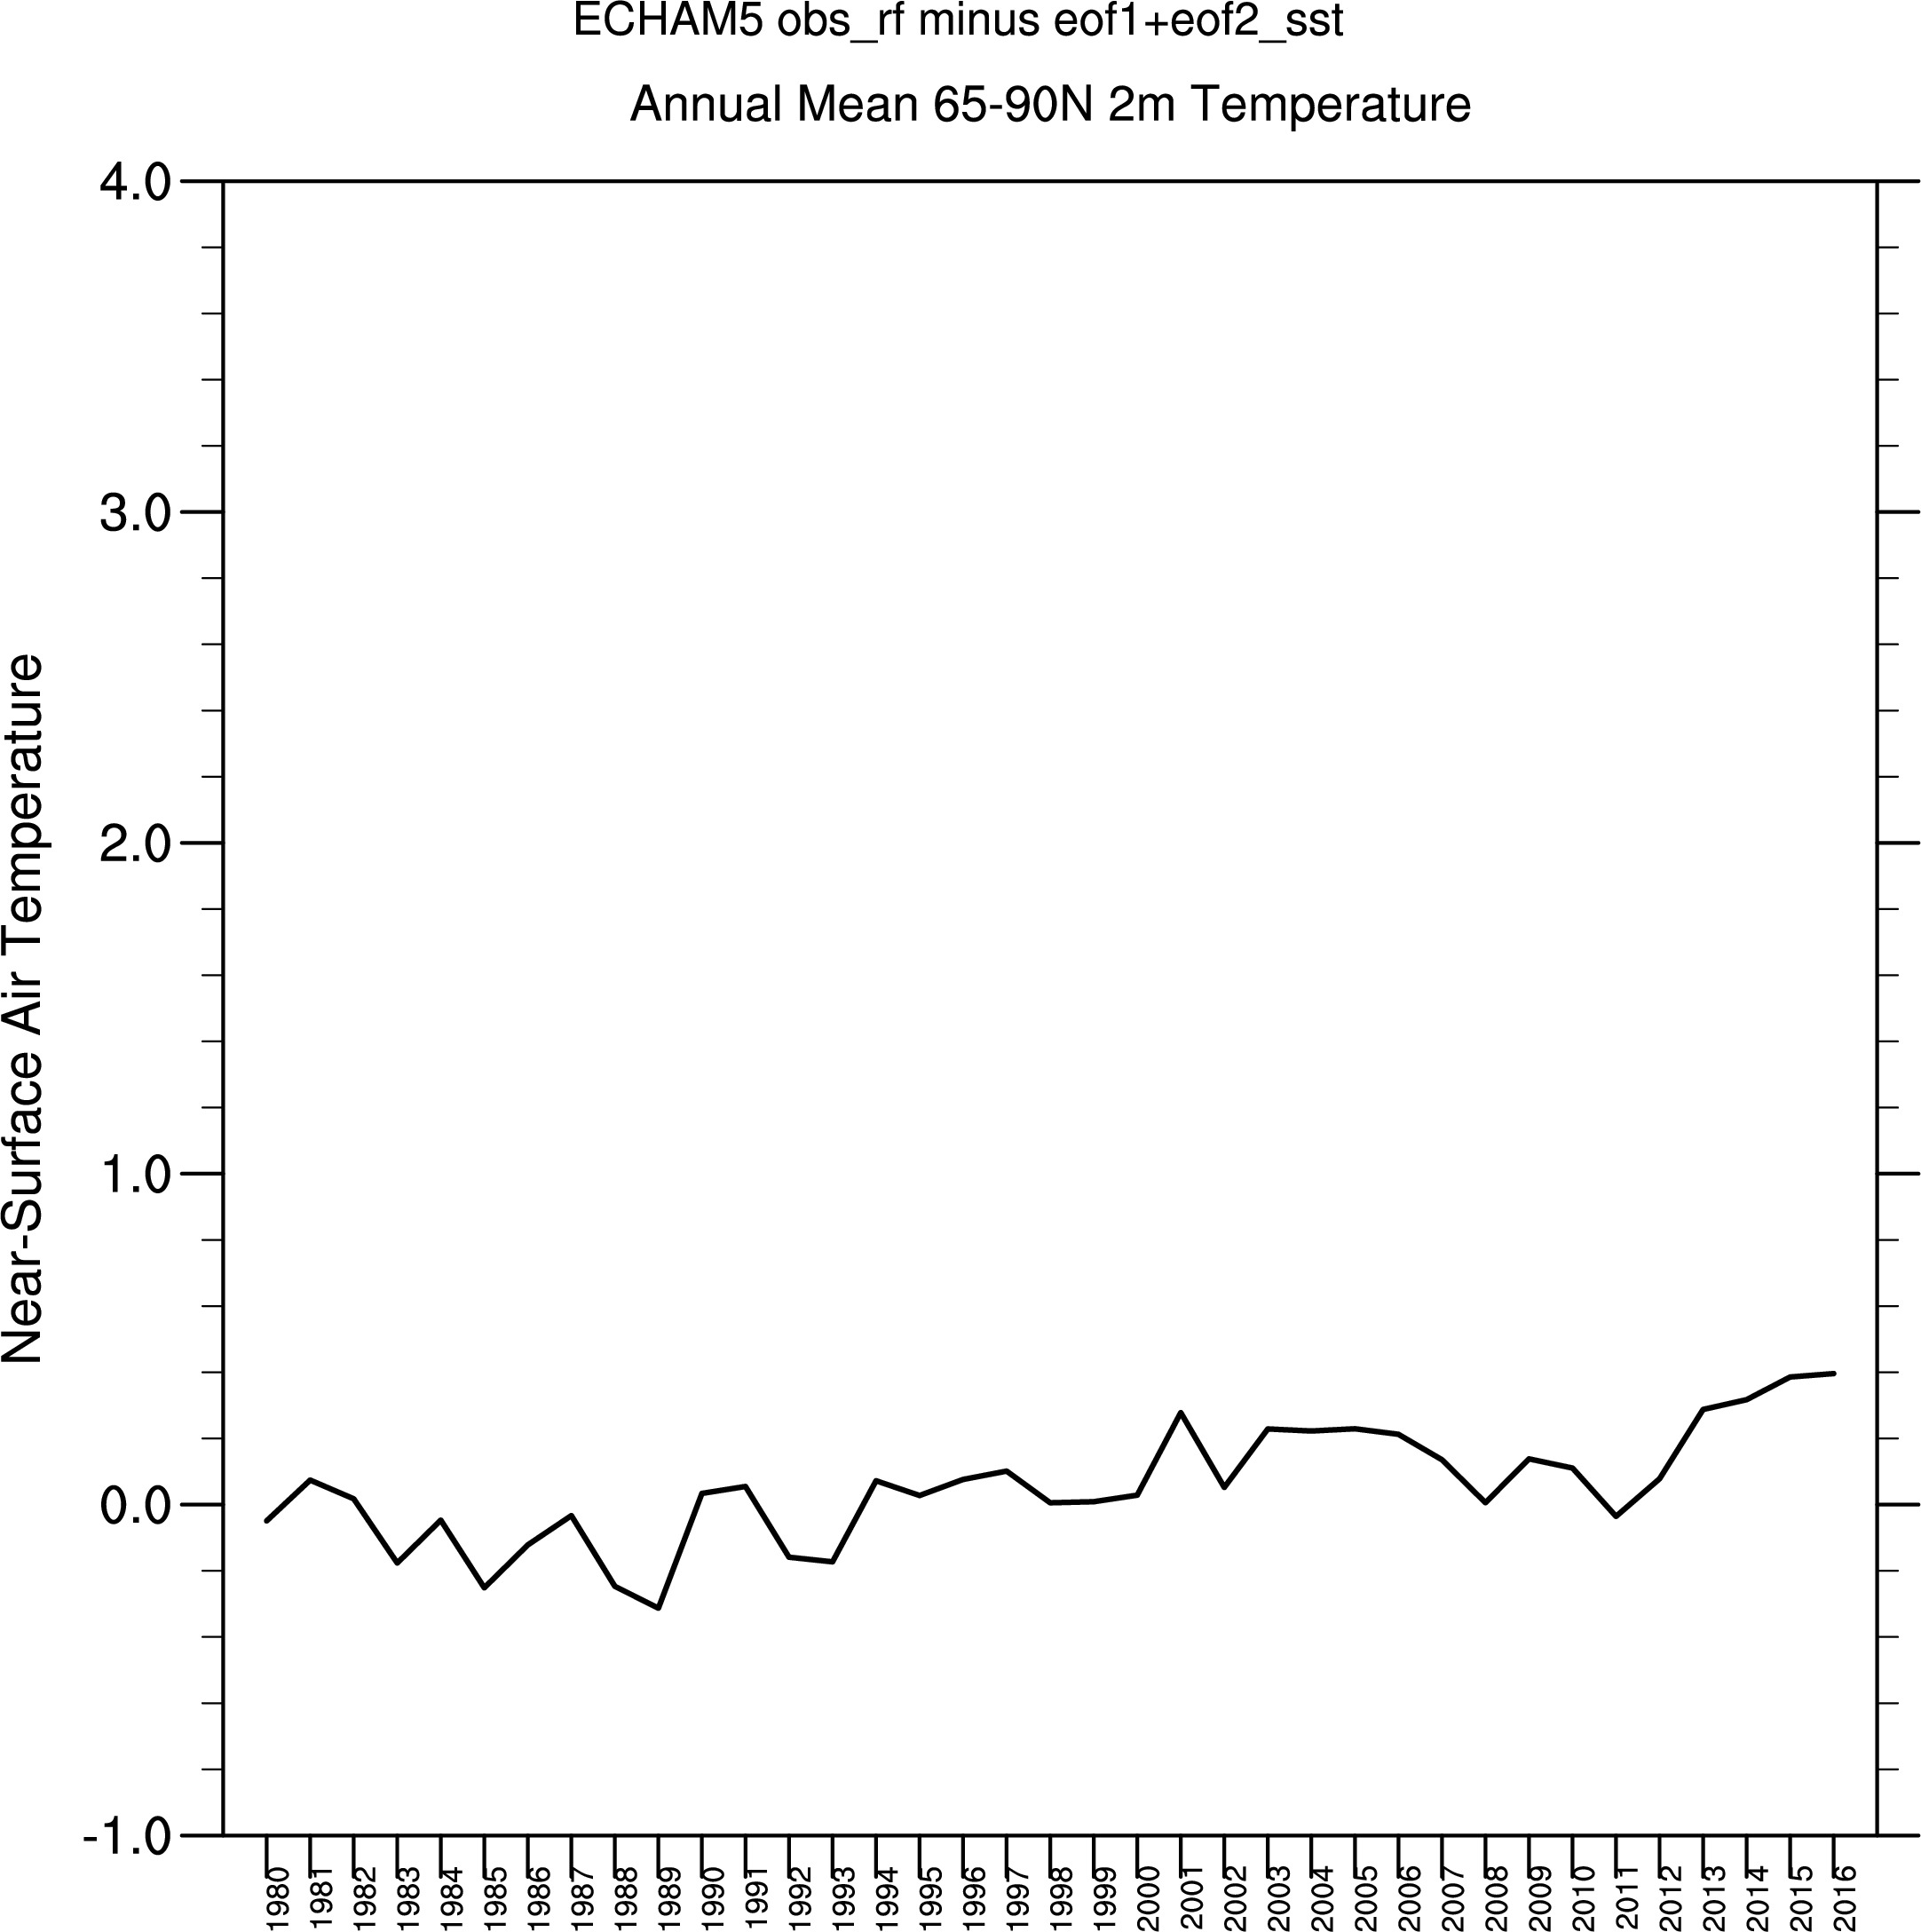
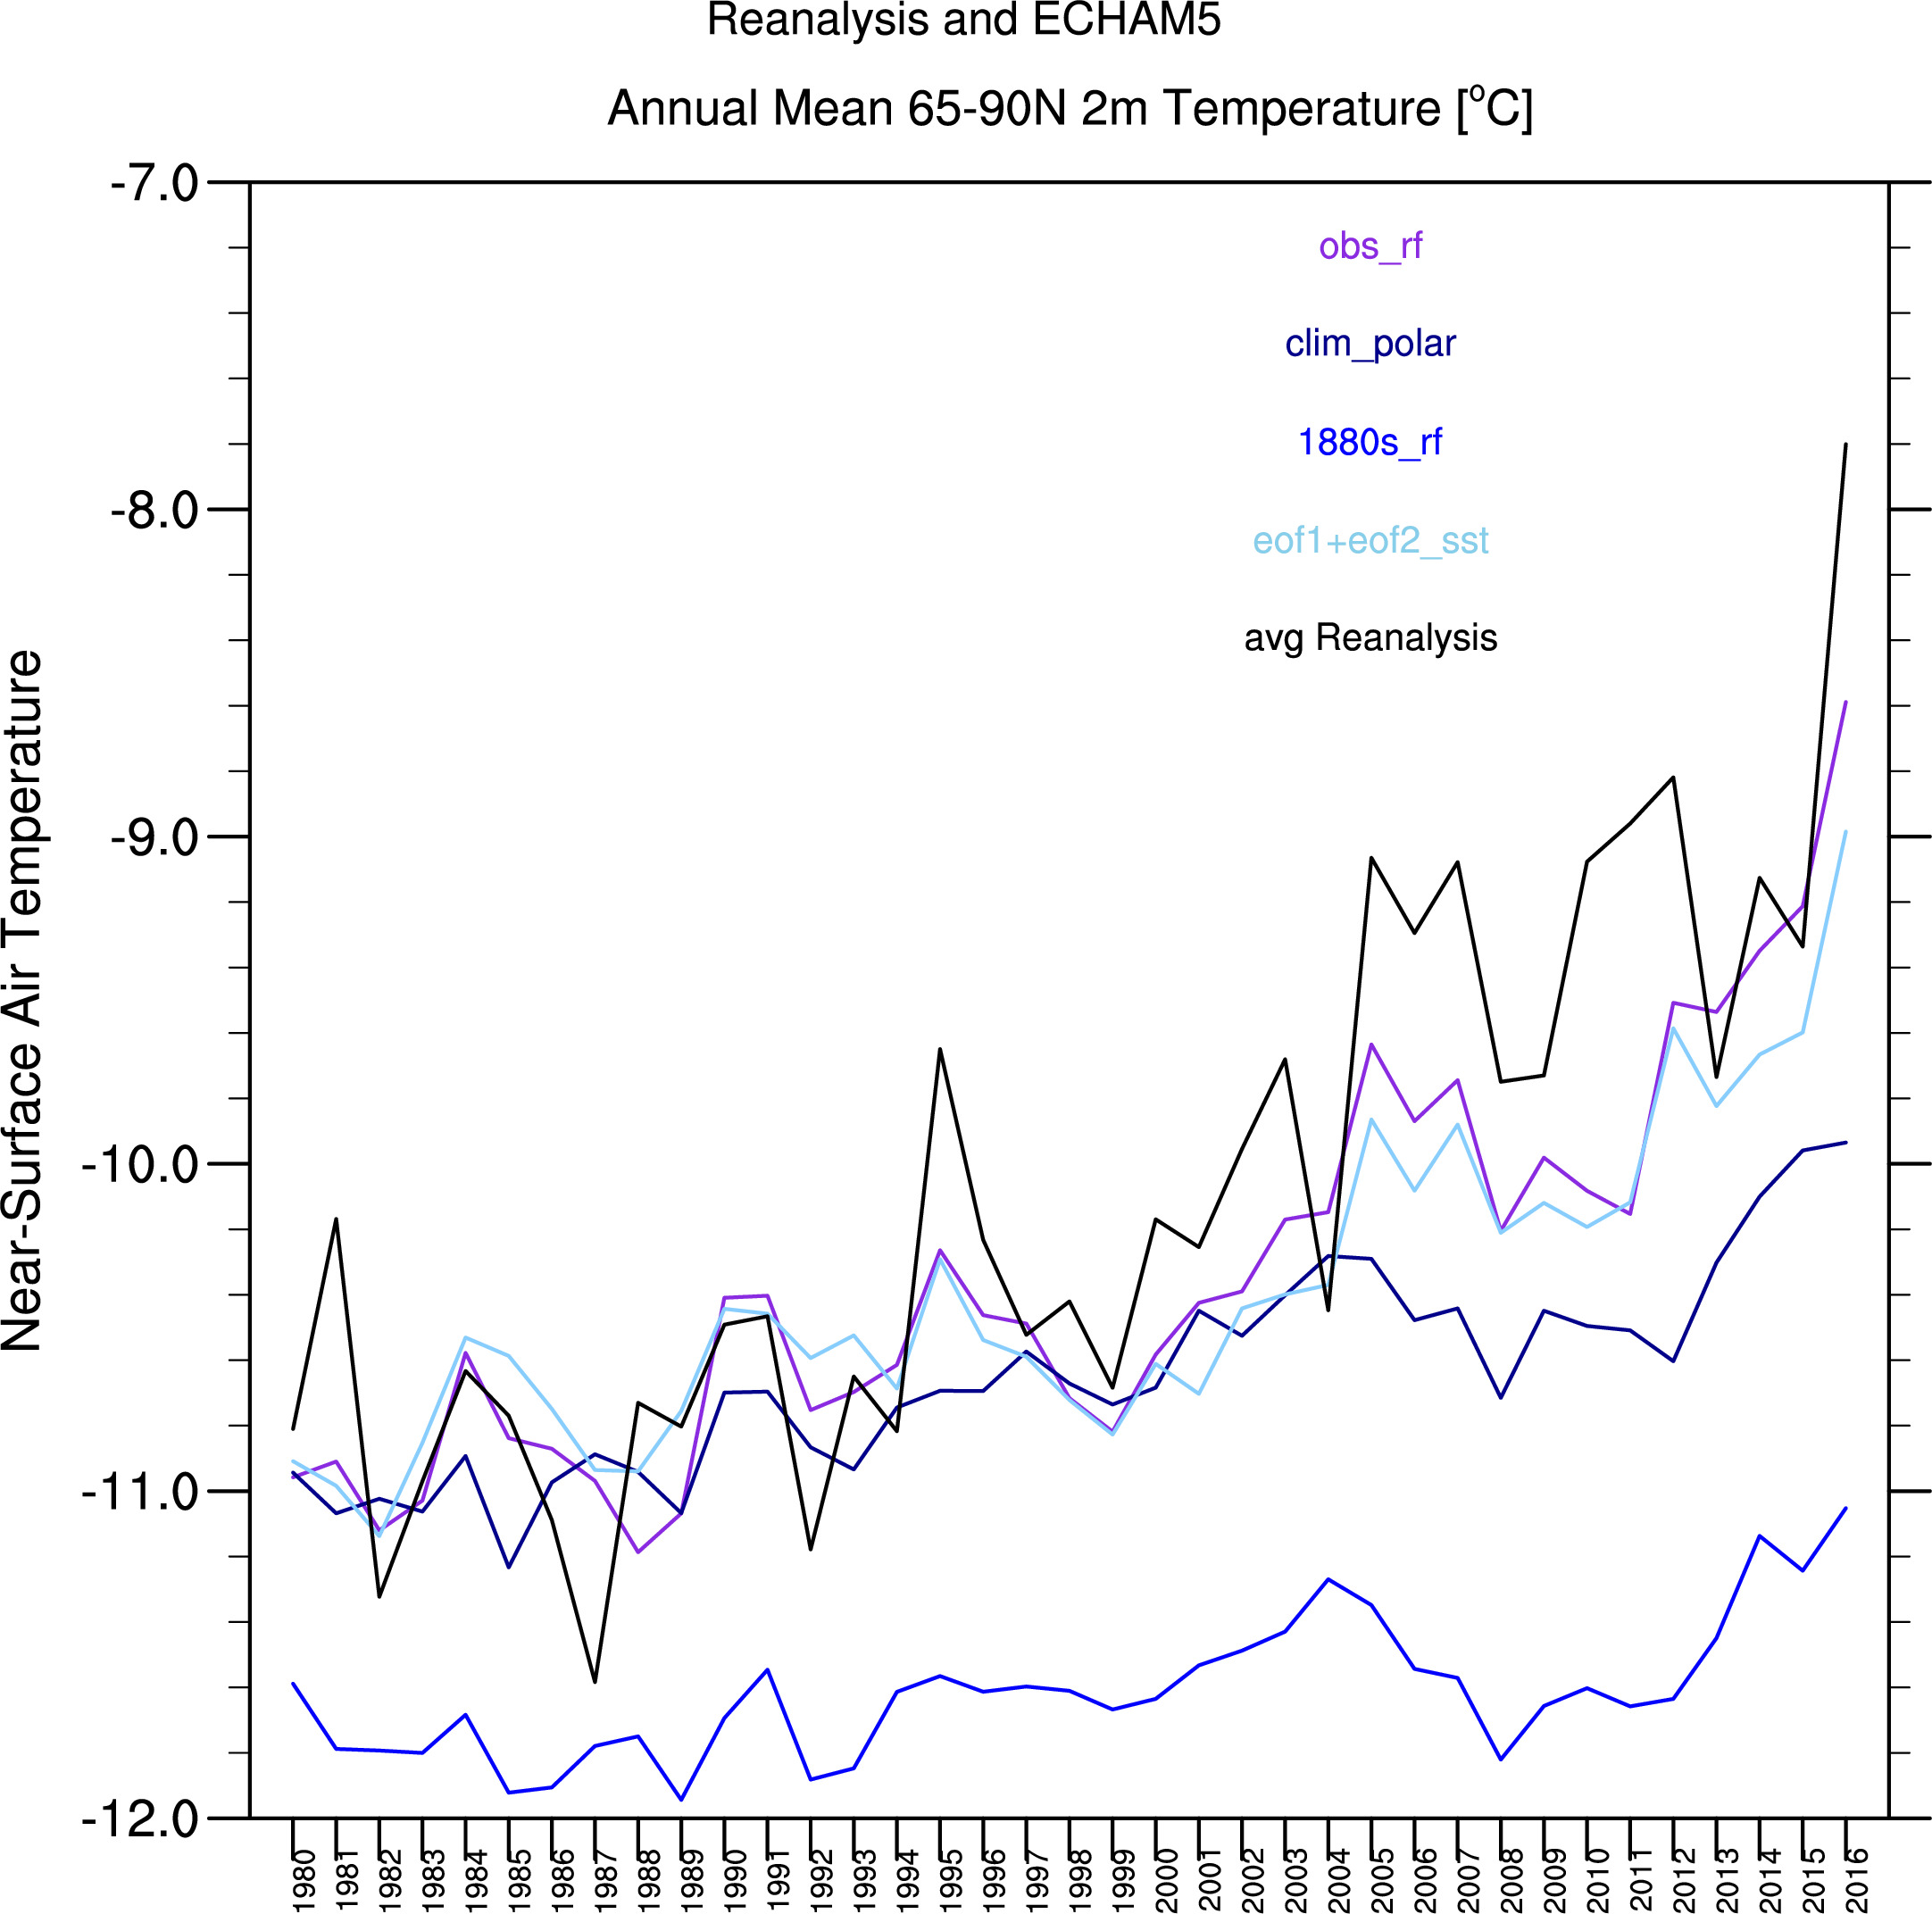
Time series ECHAM5 compared with avg Reanalysis
-----------------------------------------------------------------------------------------------------------
For reference, Reanalyses anomalies