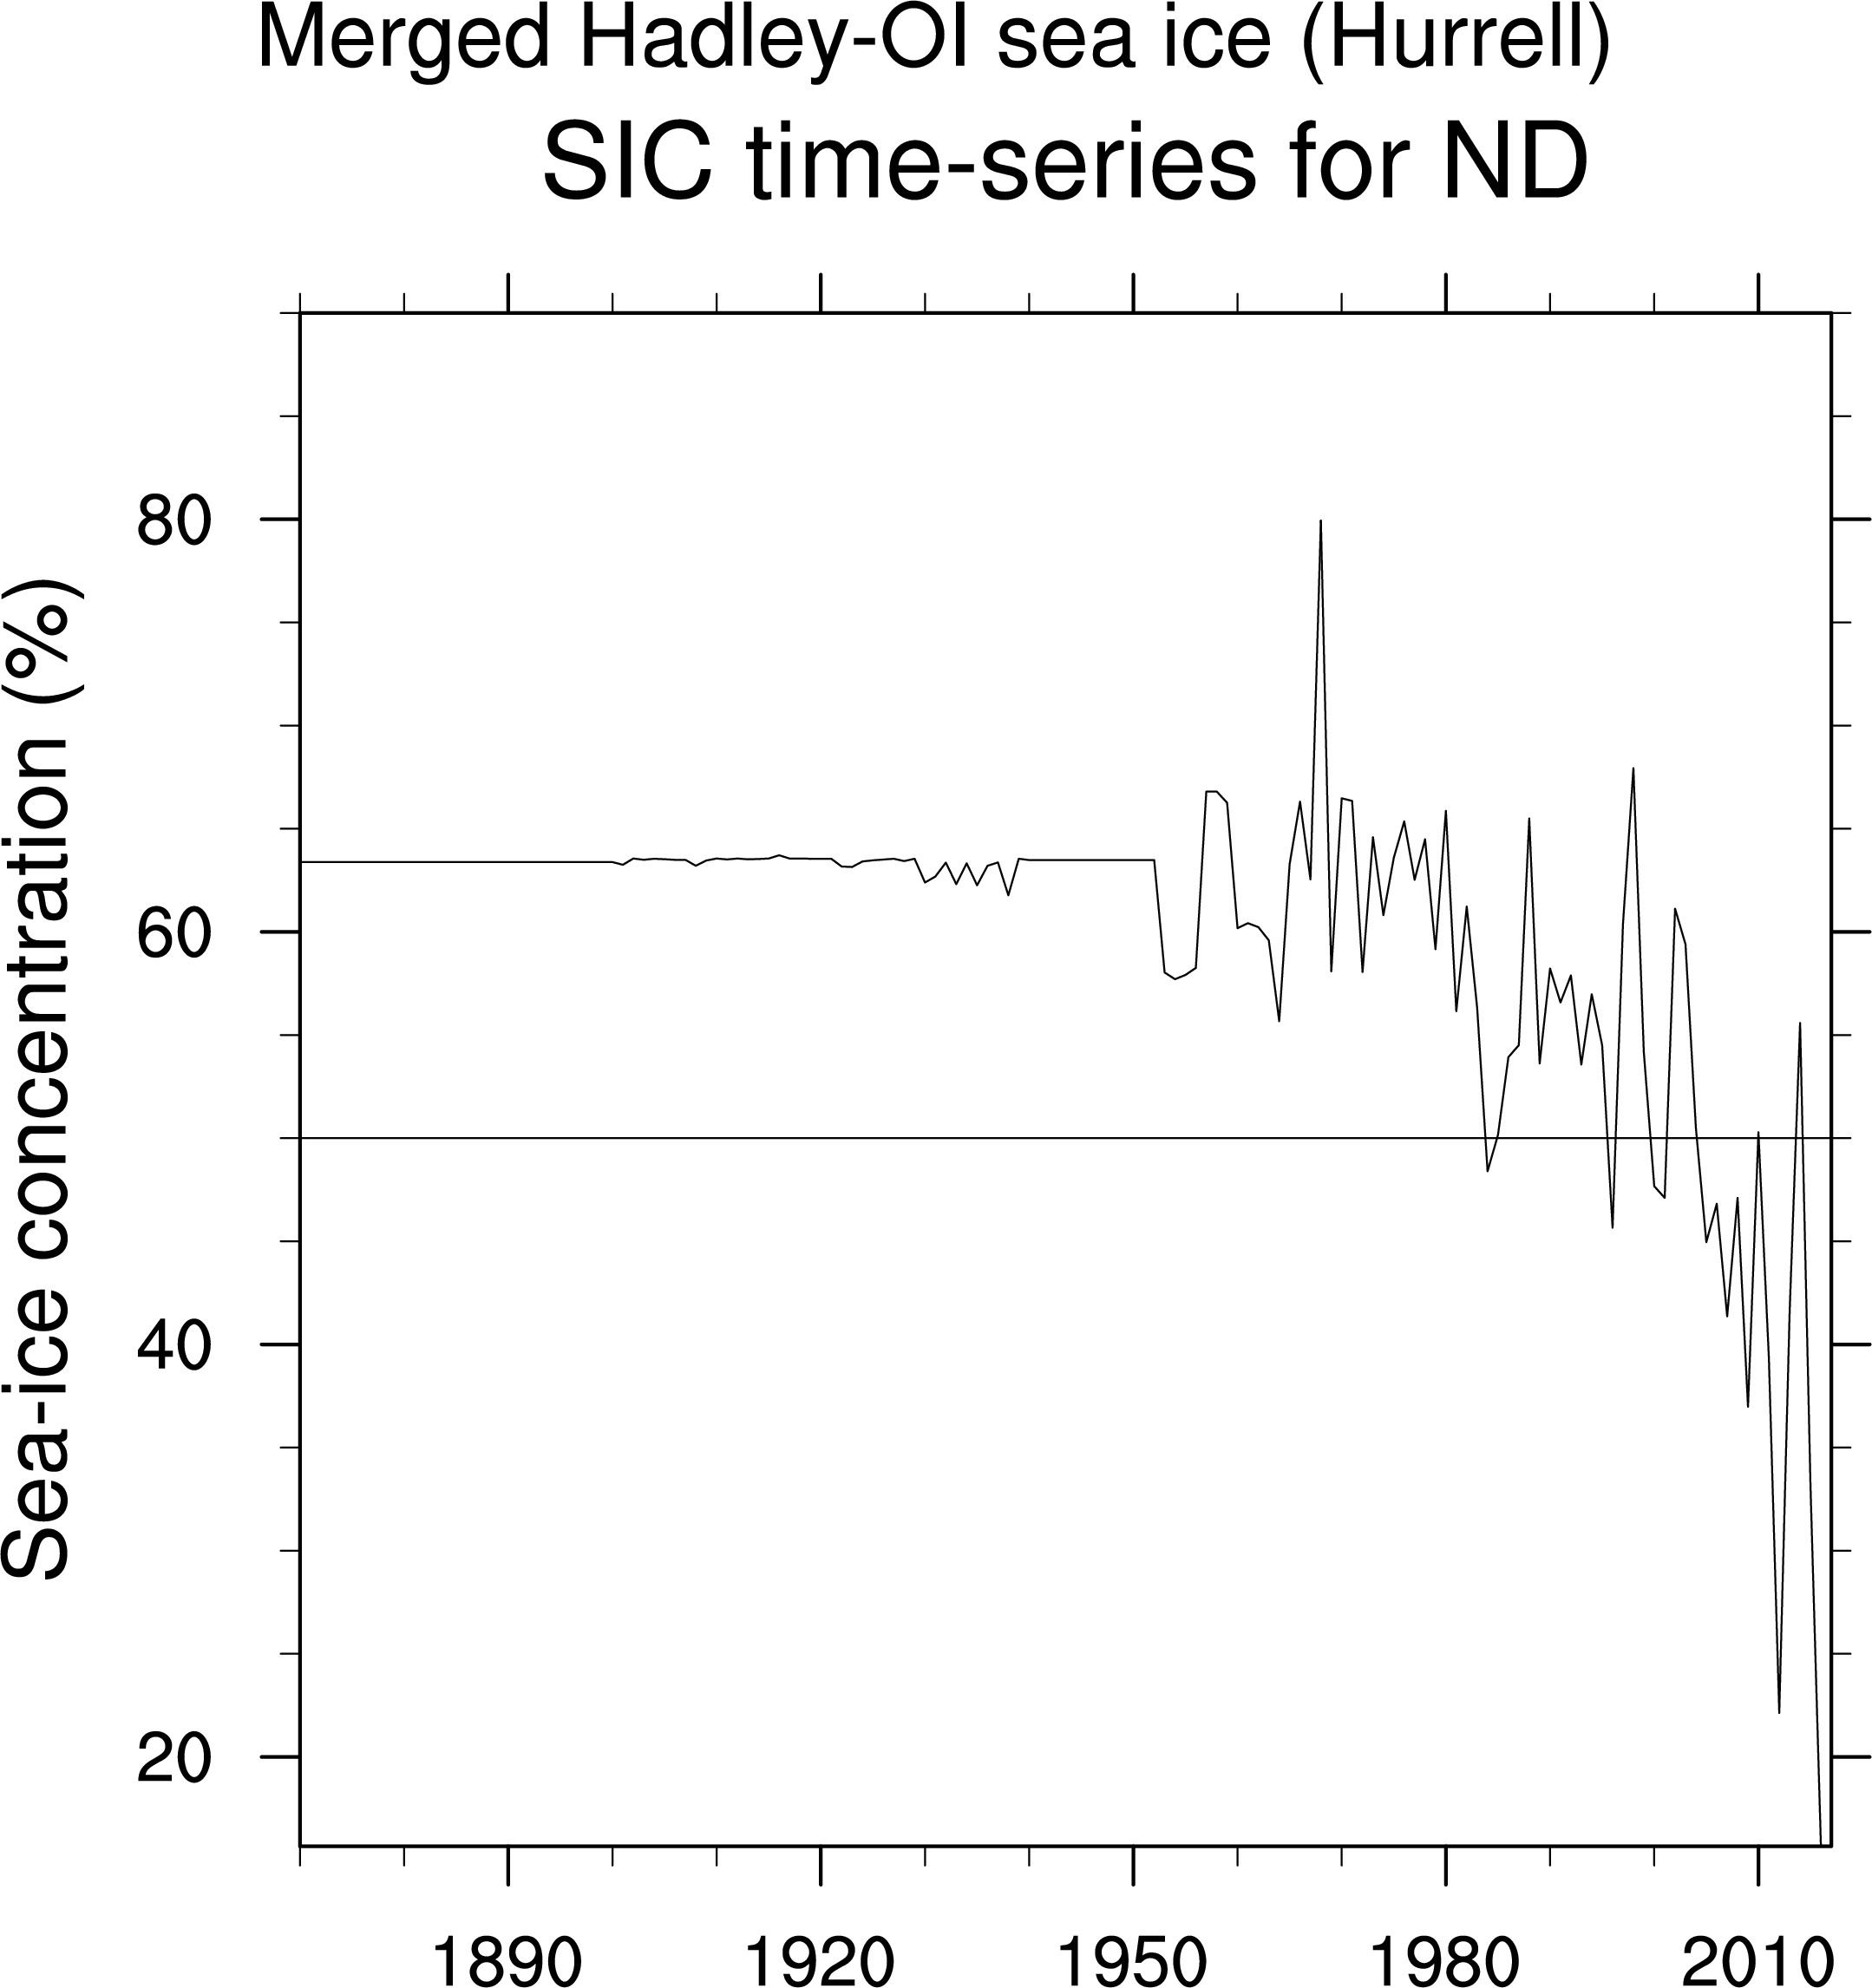
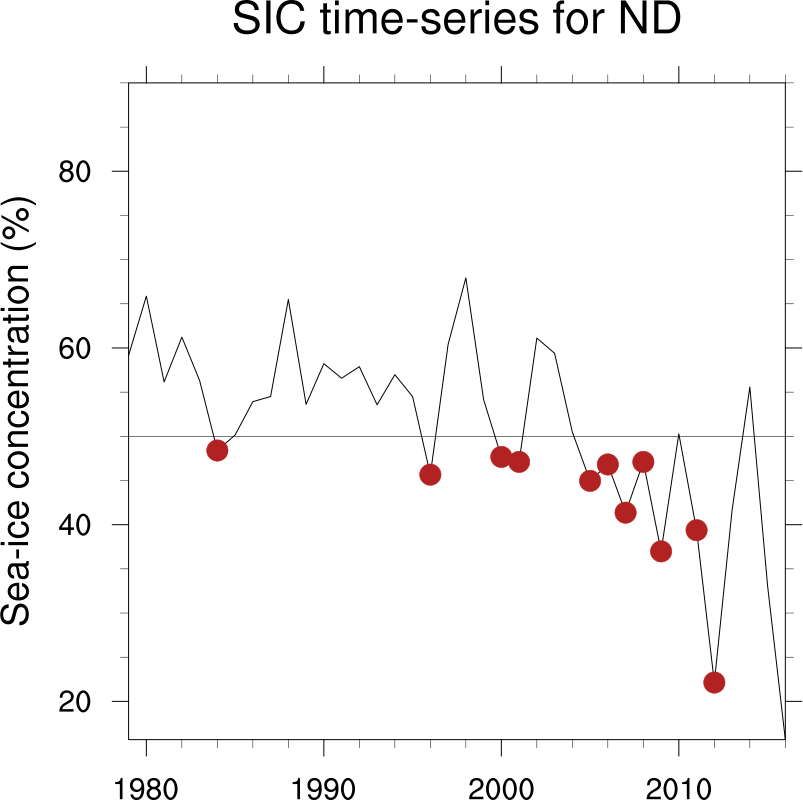
– Arctic Sea Ice Loss
All plots here preliminary.
go here for standardizations over each month
go here for Jan Feb standardizations
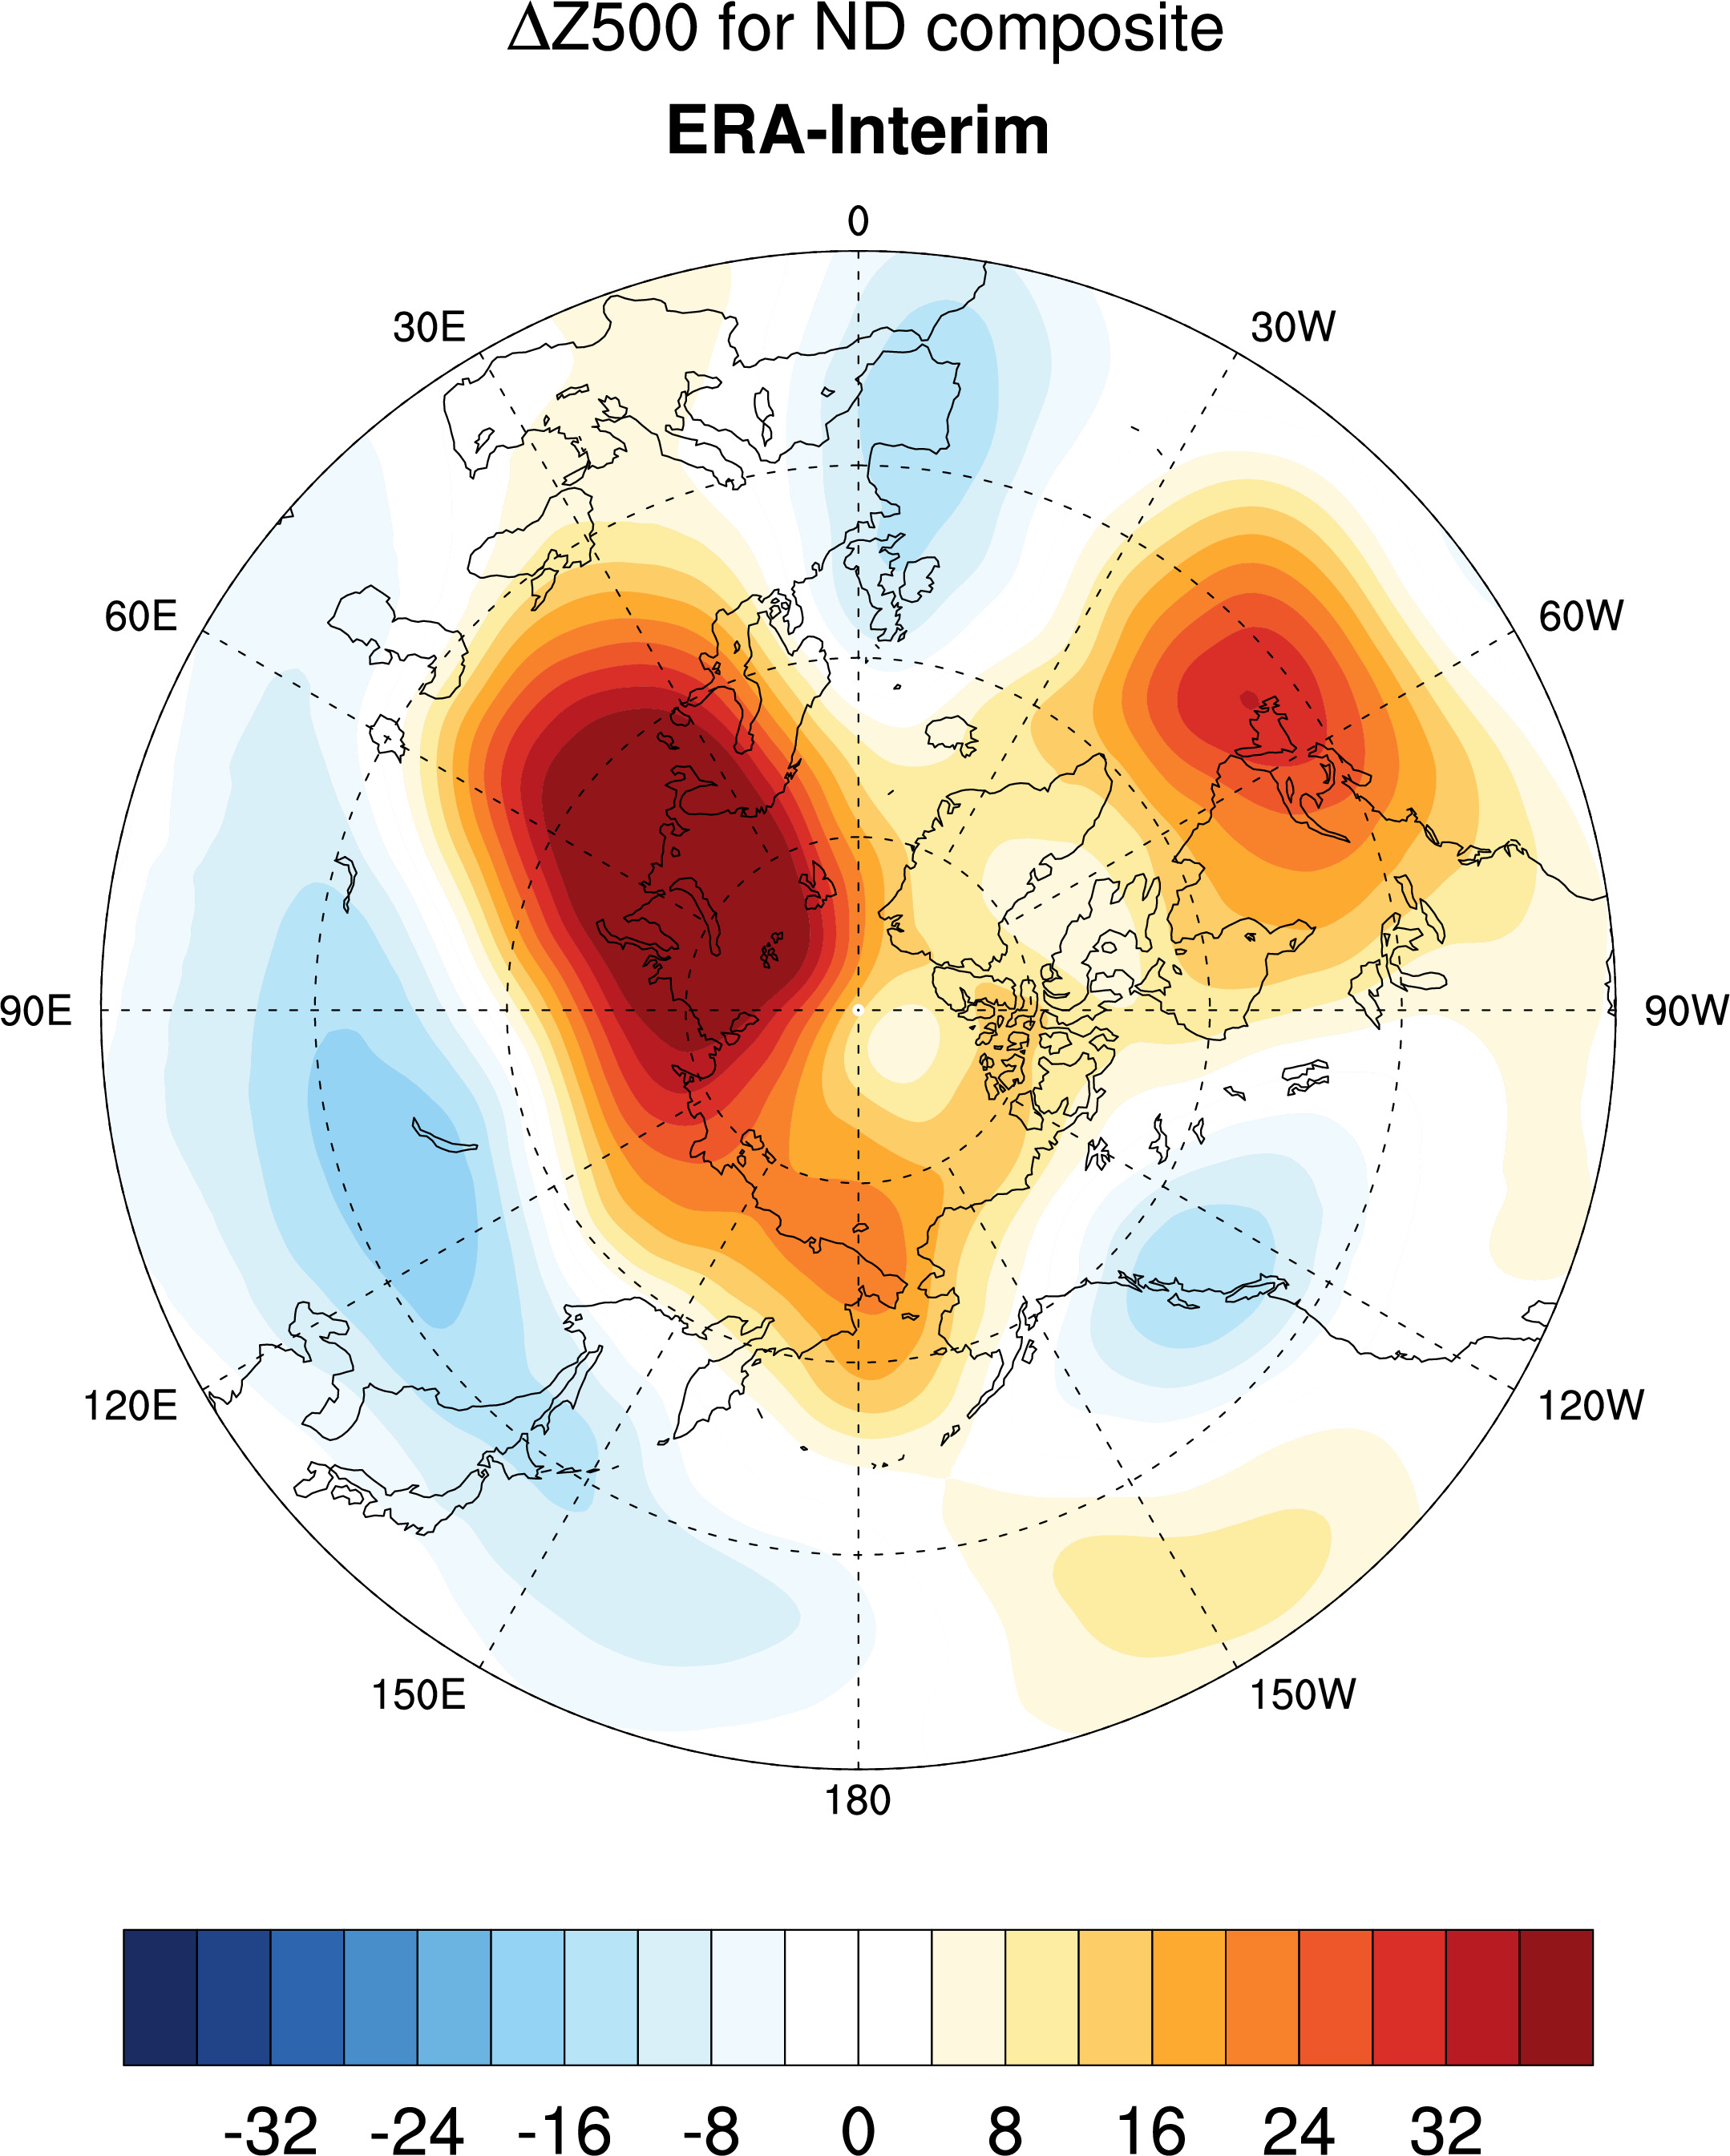
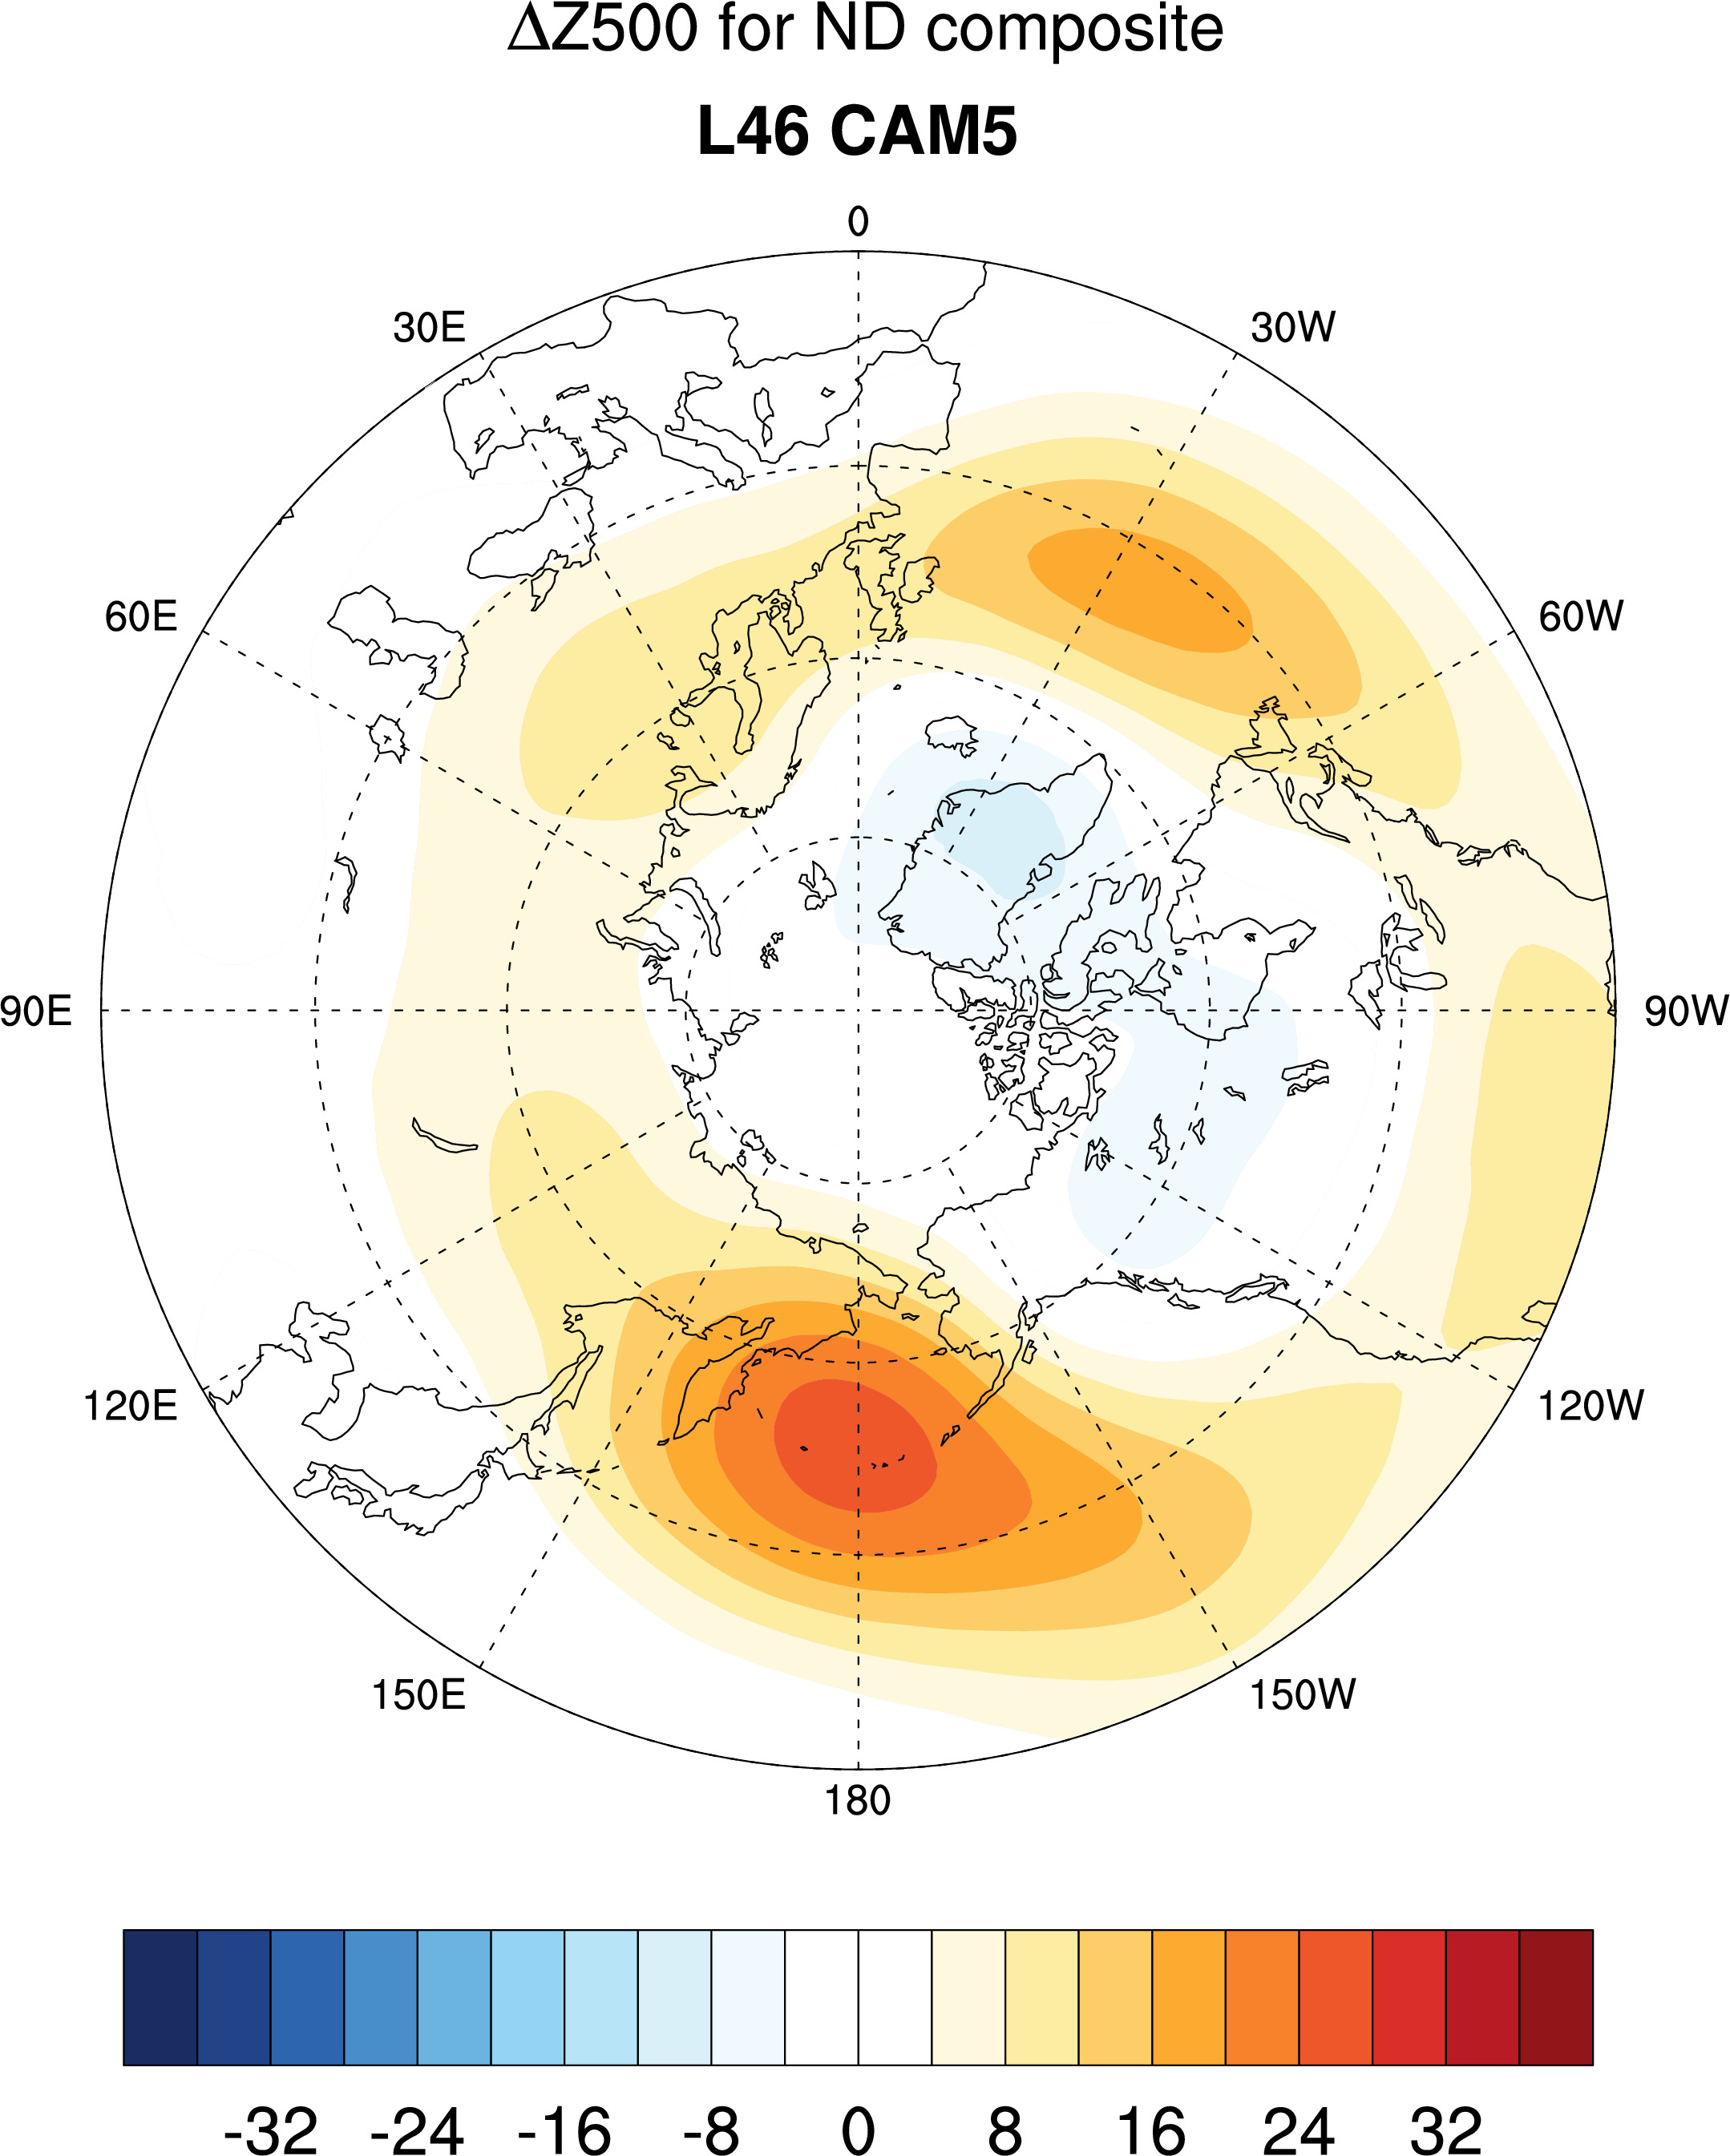
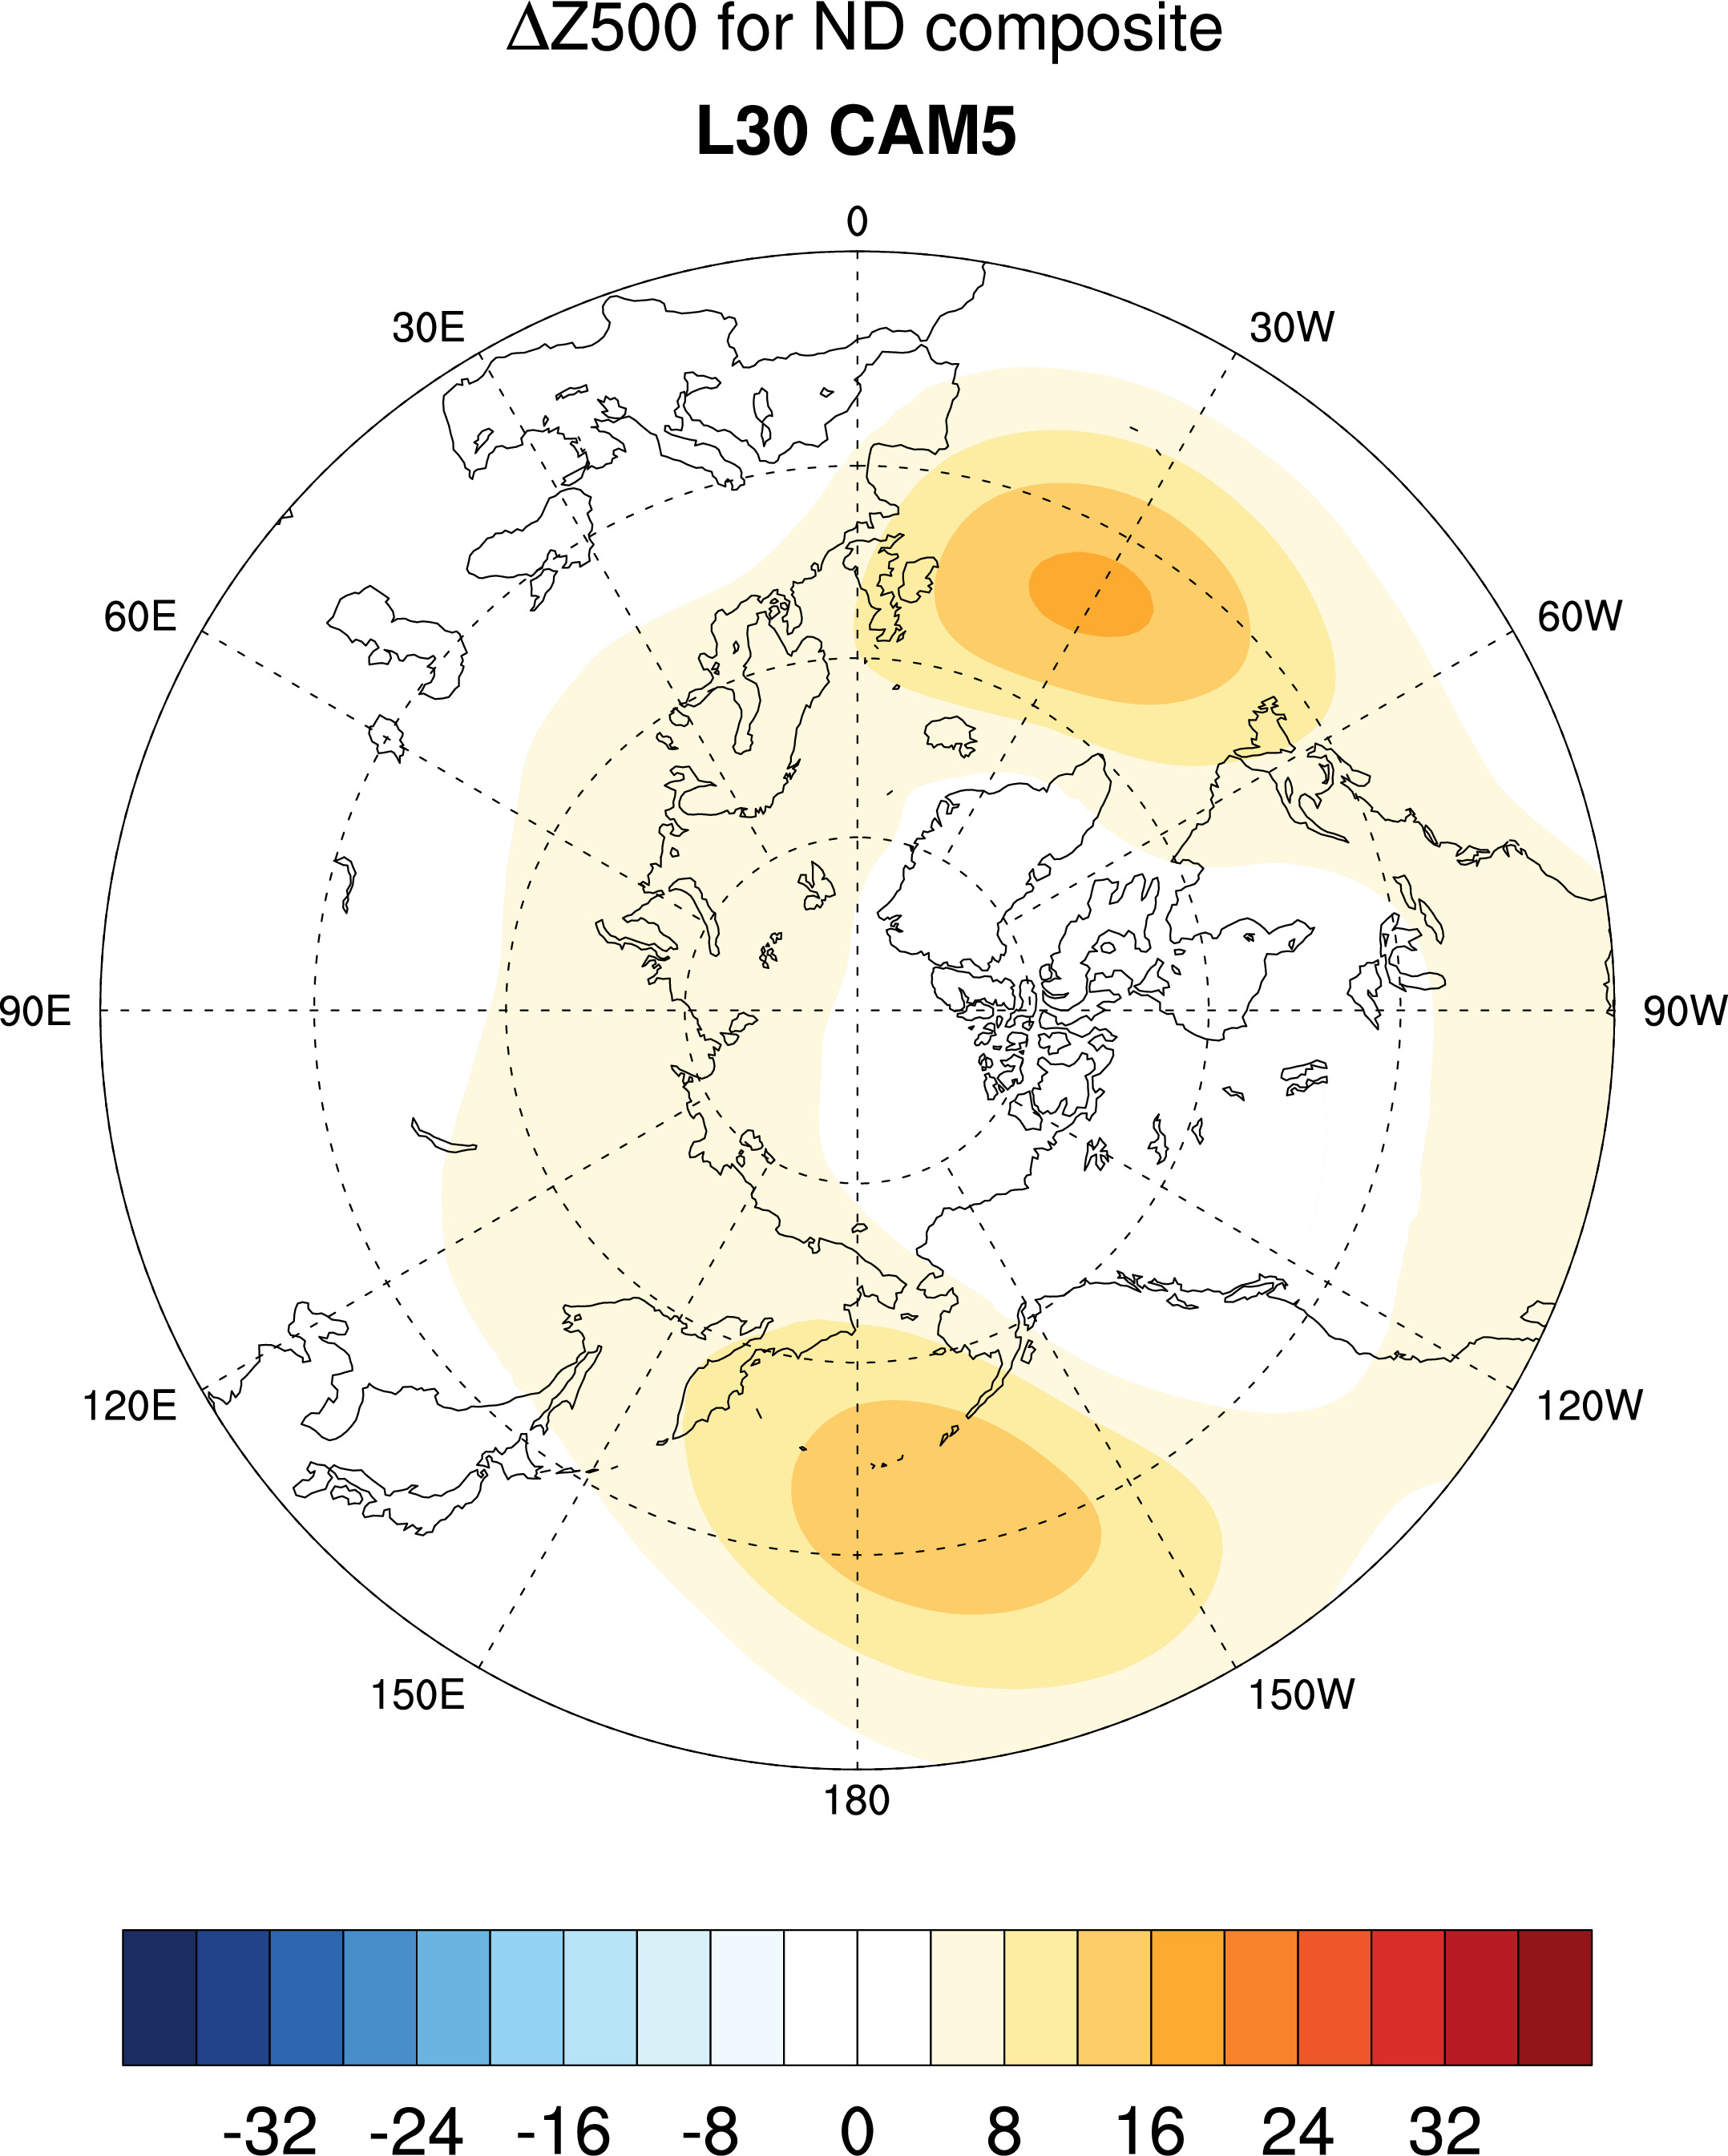
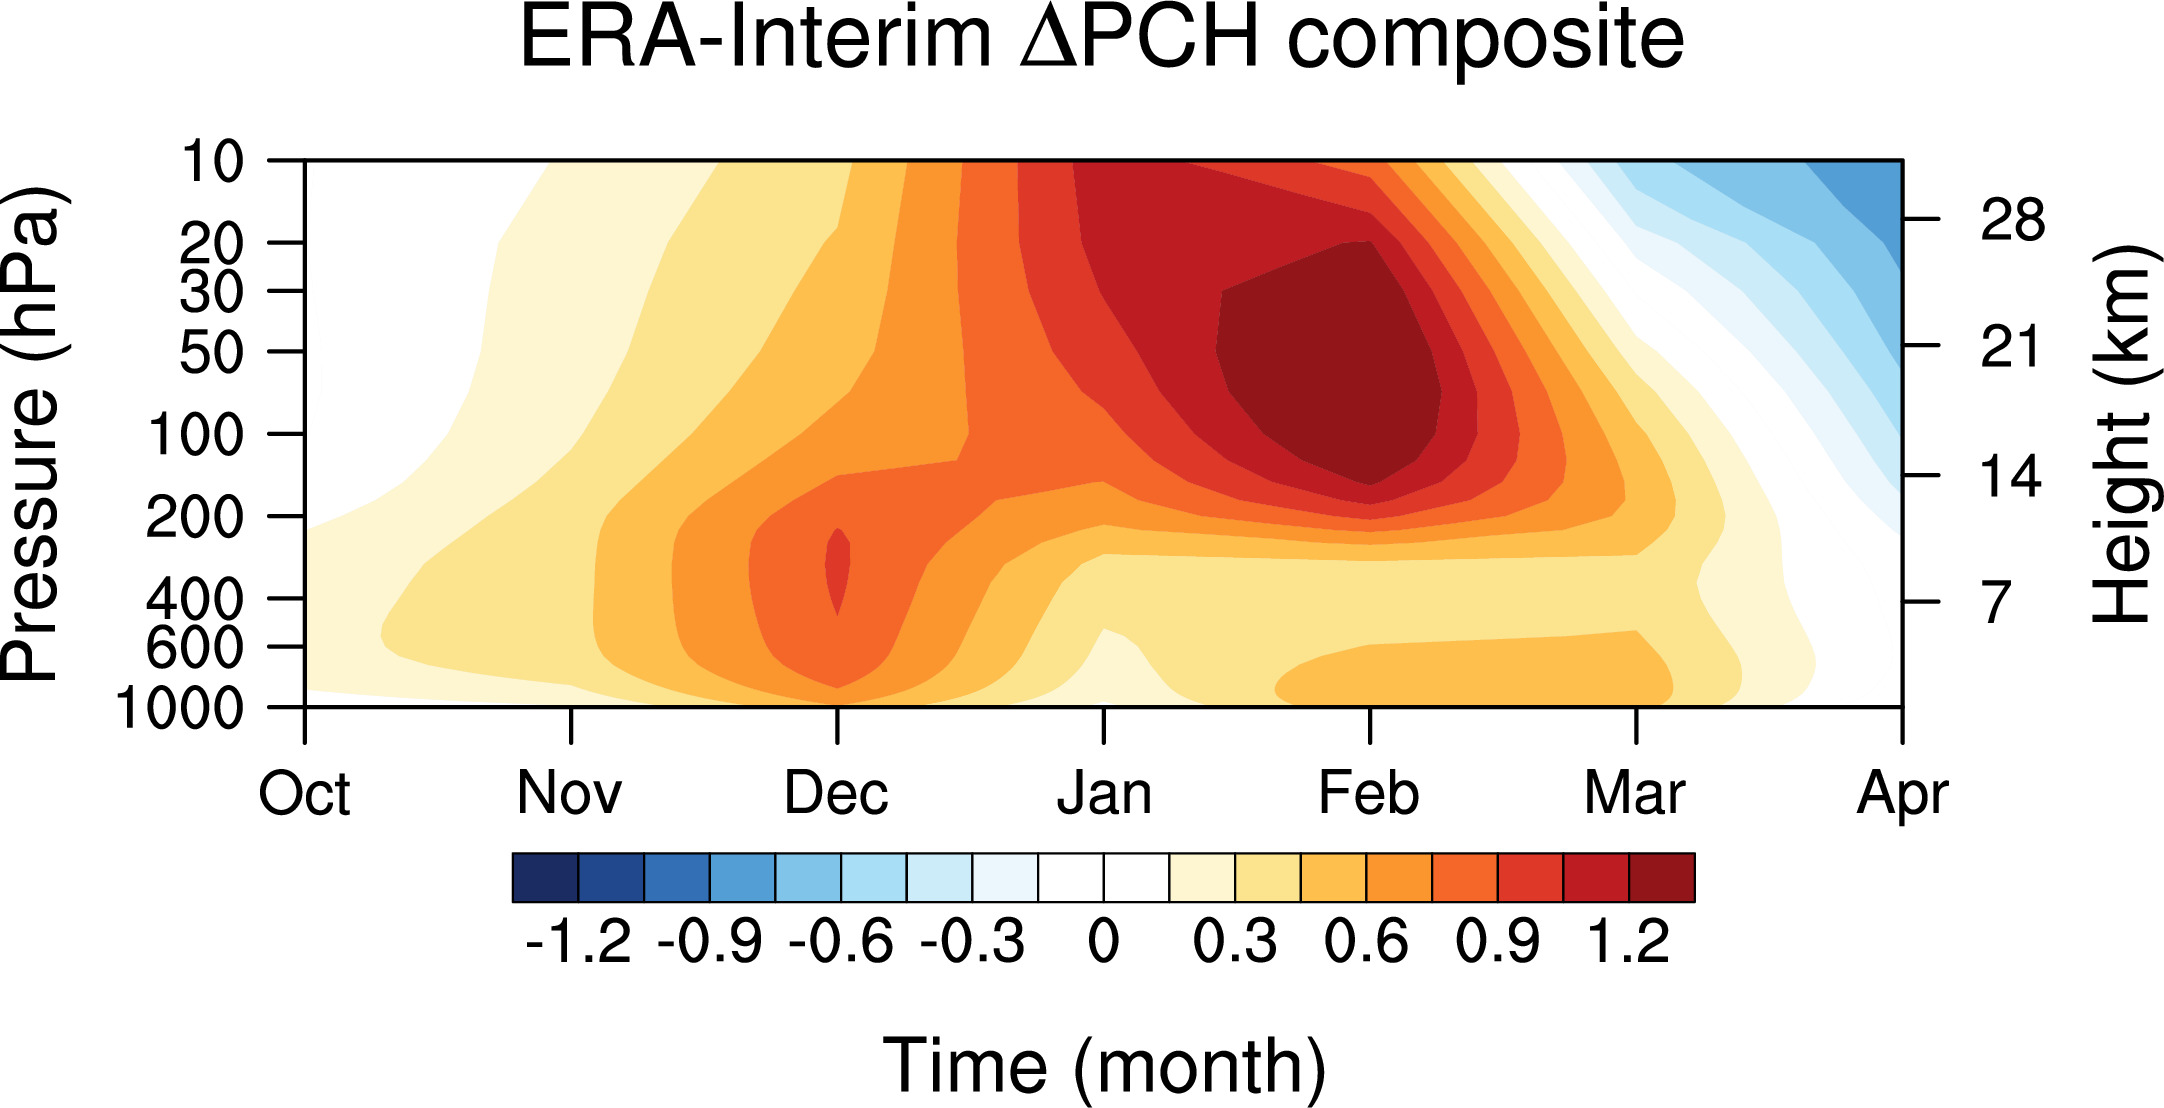
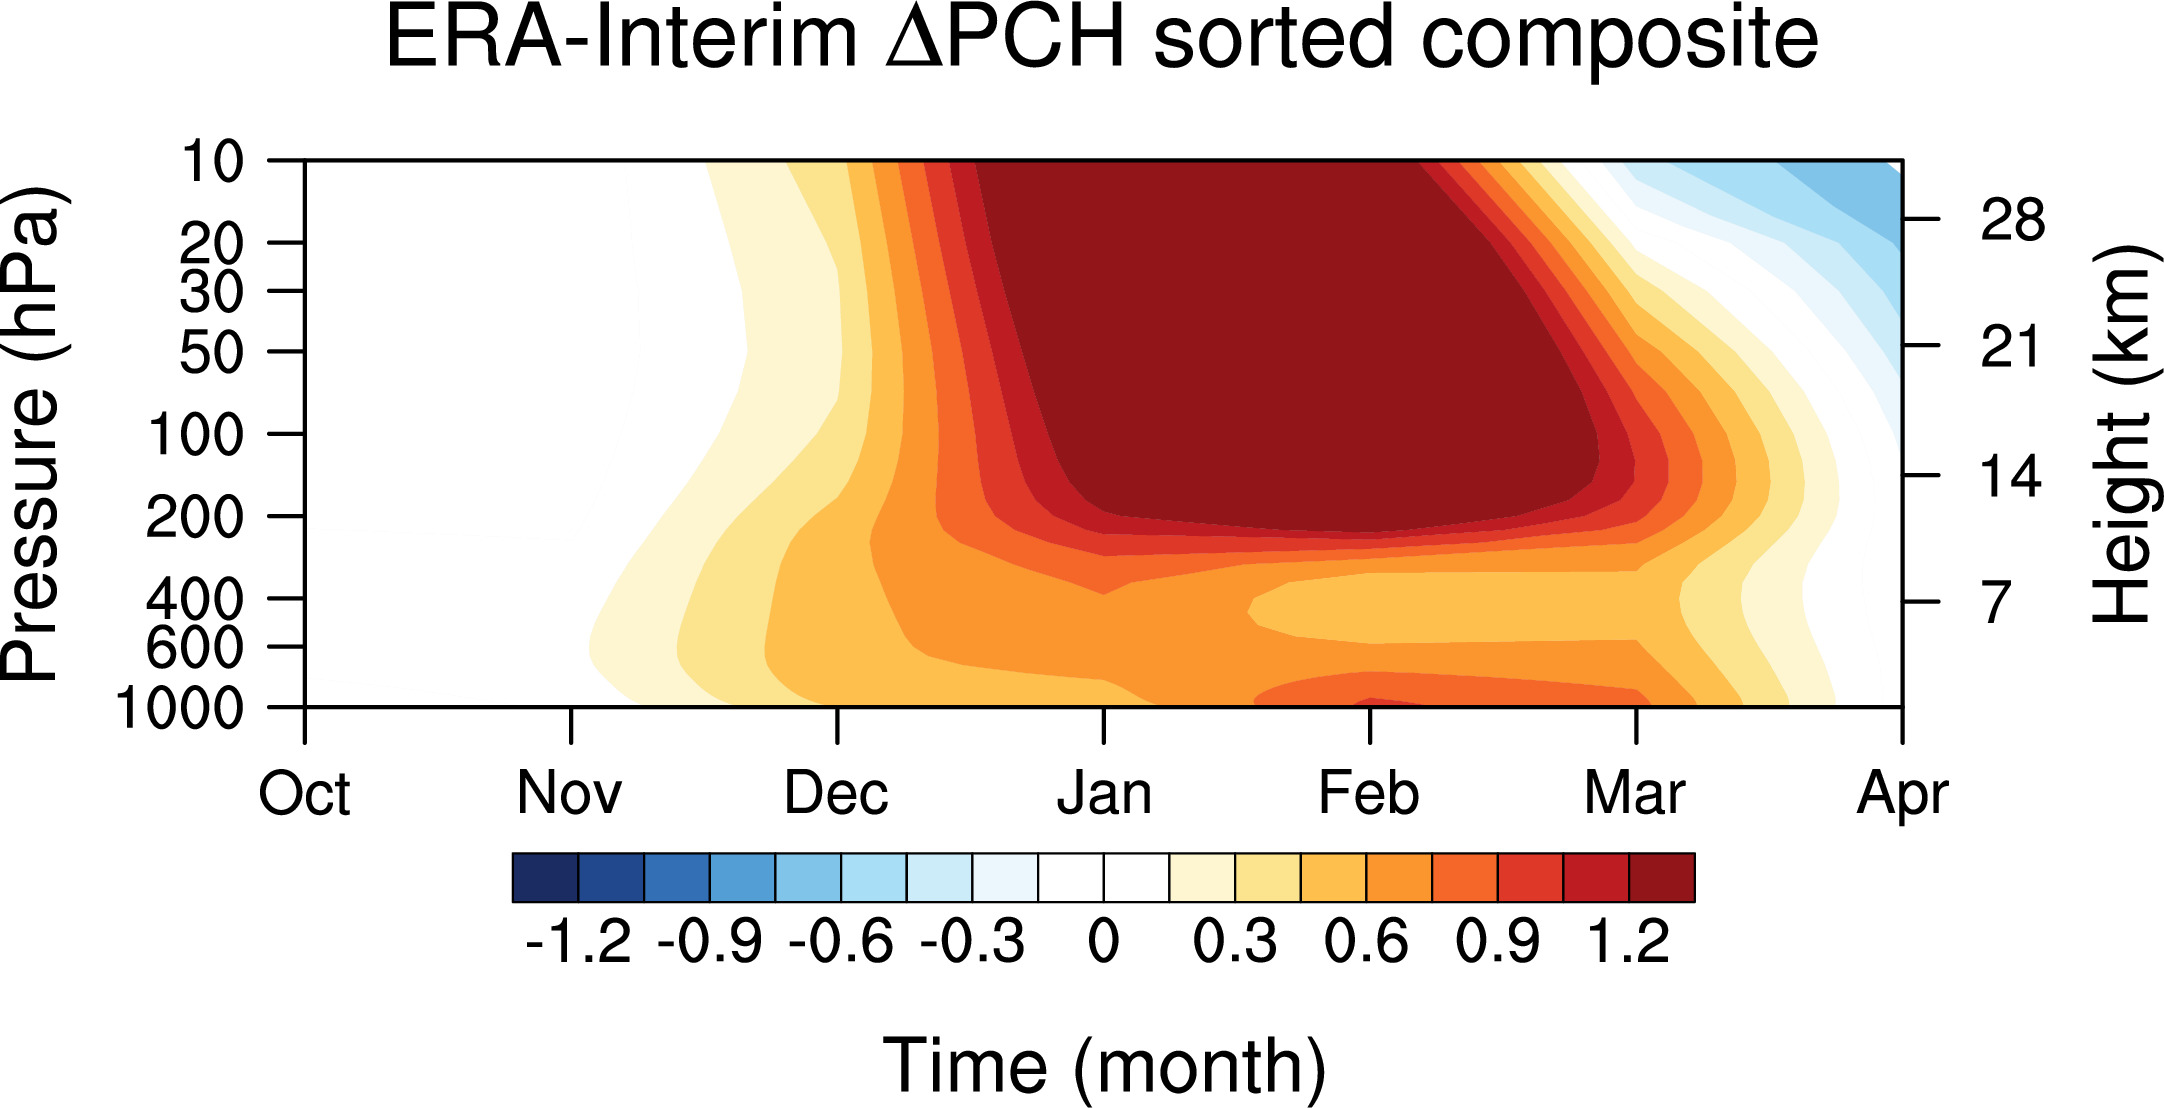
Relationship between stratospheric polar vortex and Arctic sea-ice loss January 2017
New!
-----------------------------------------
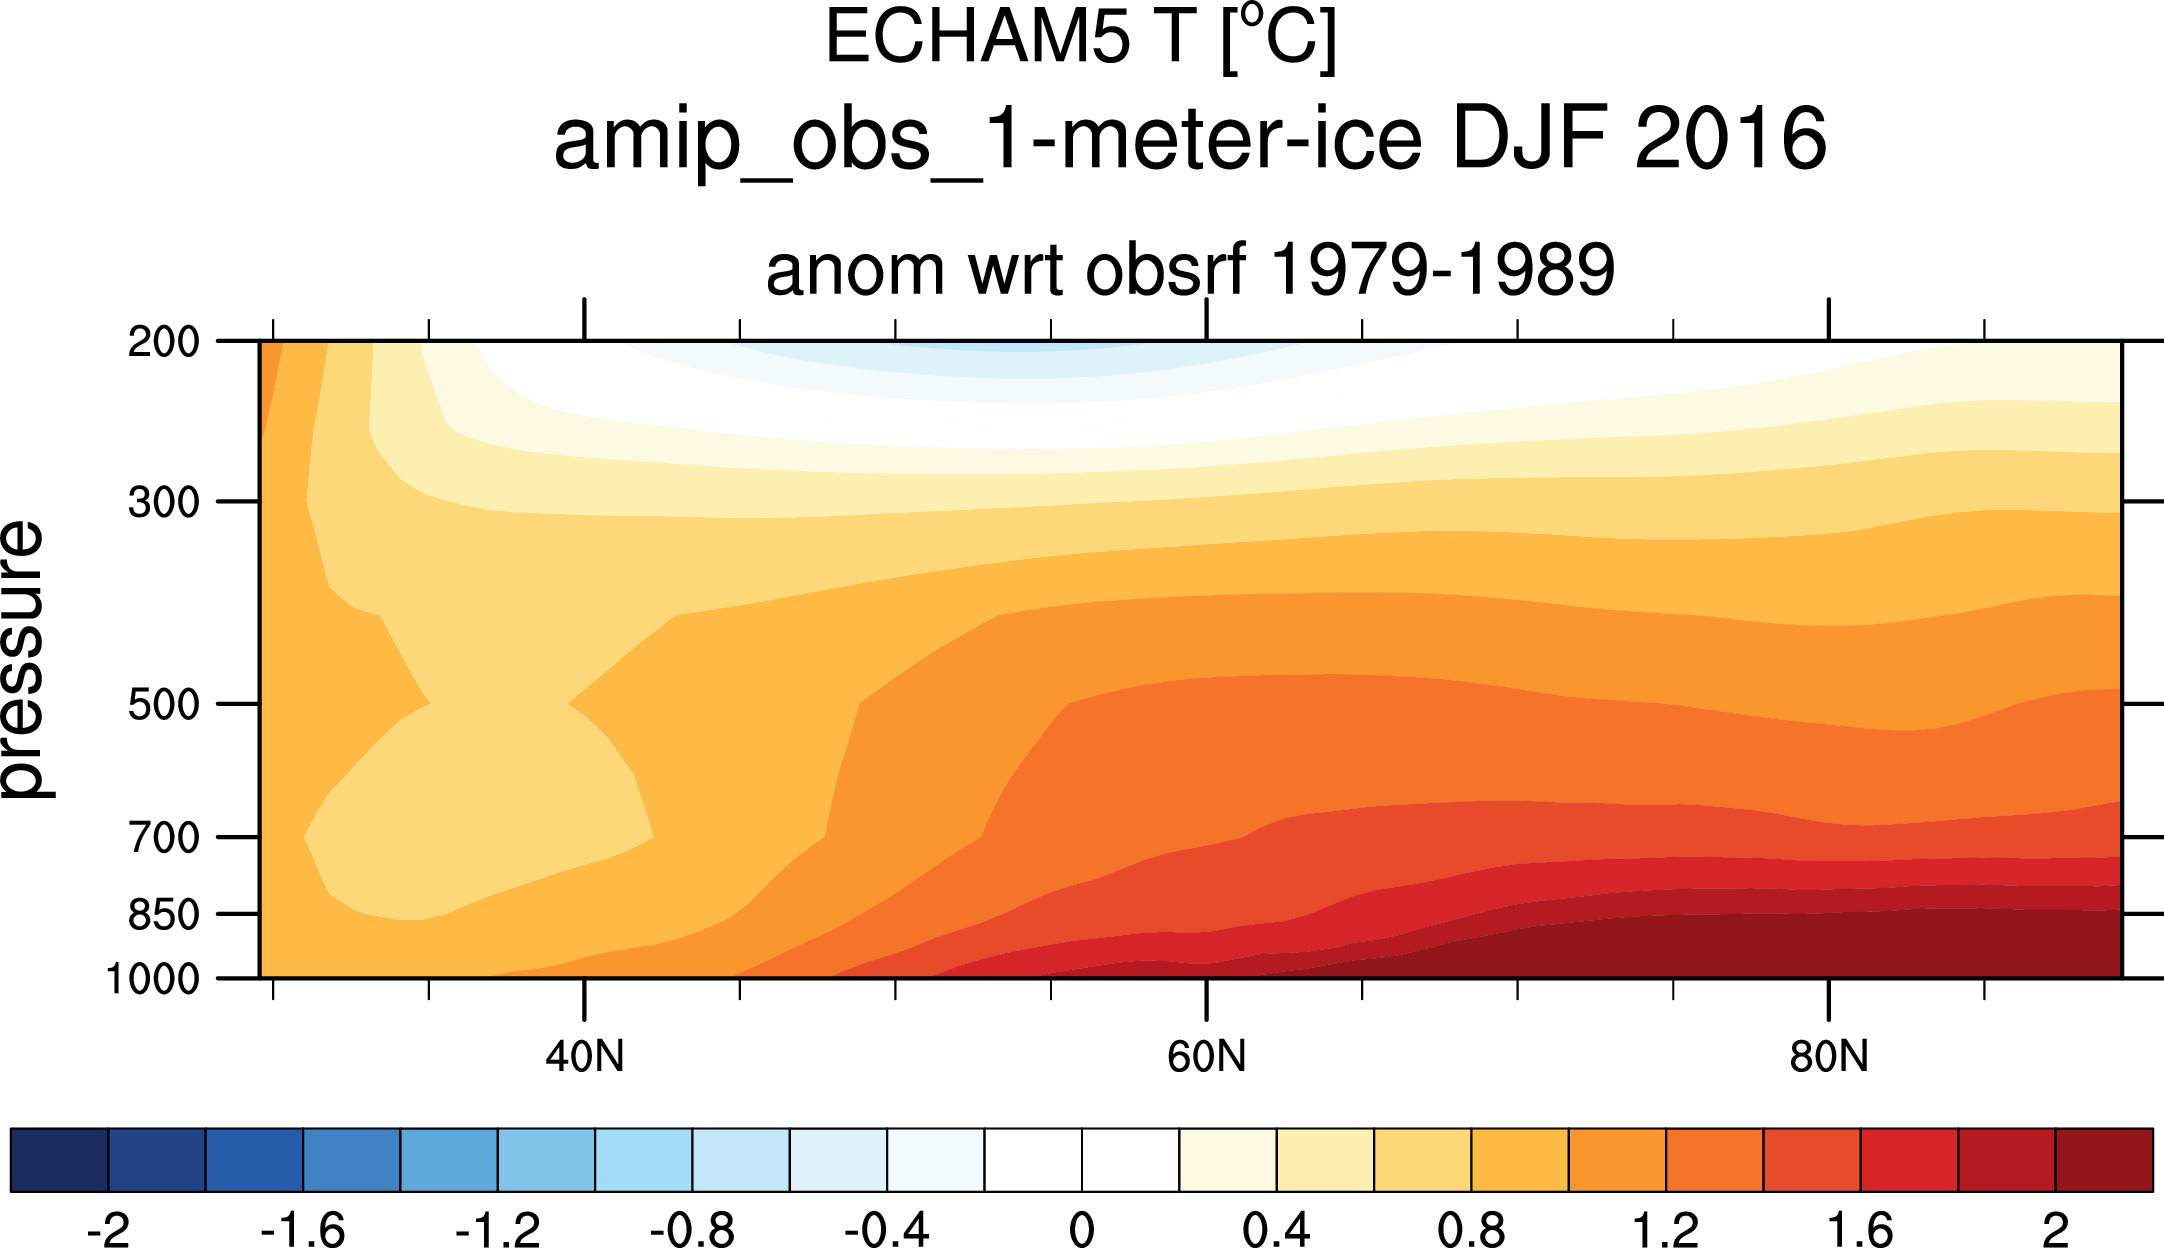
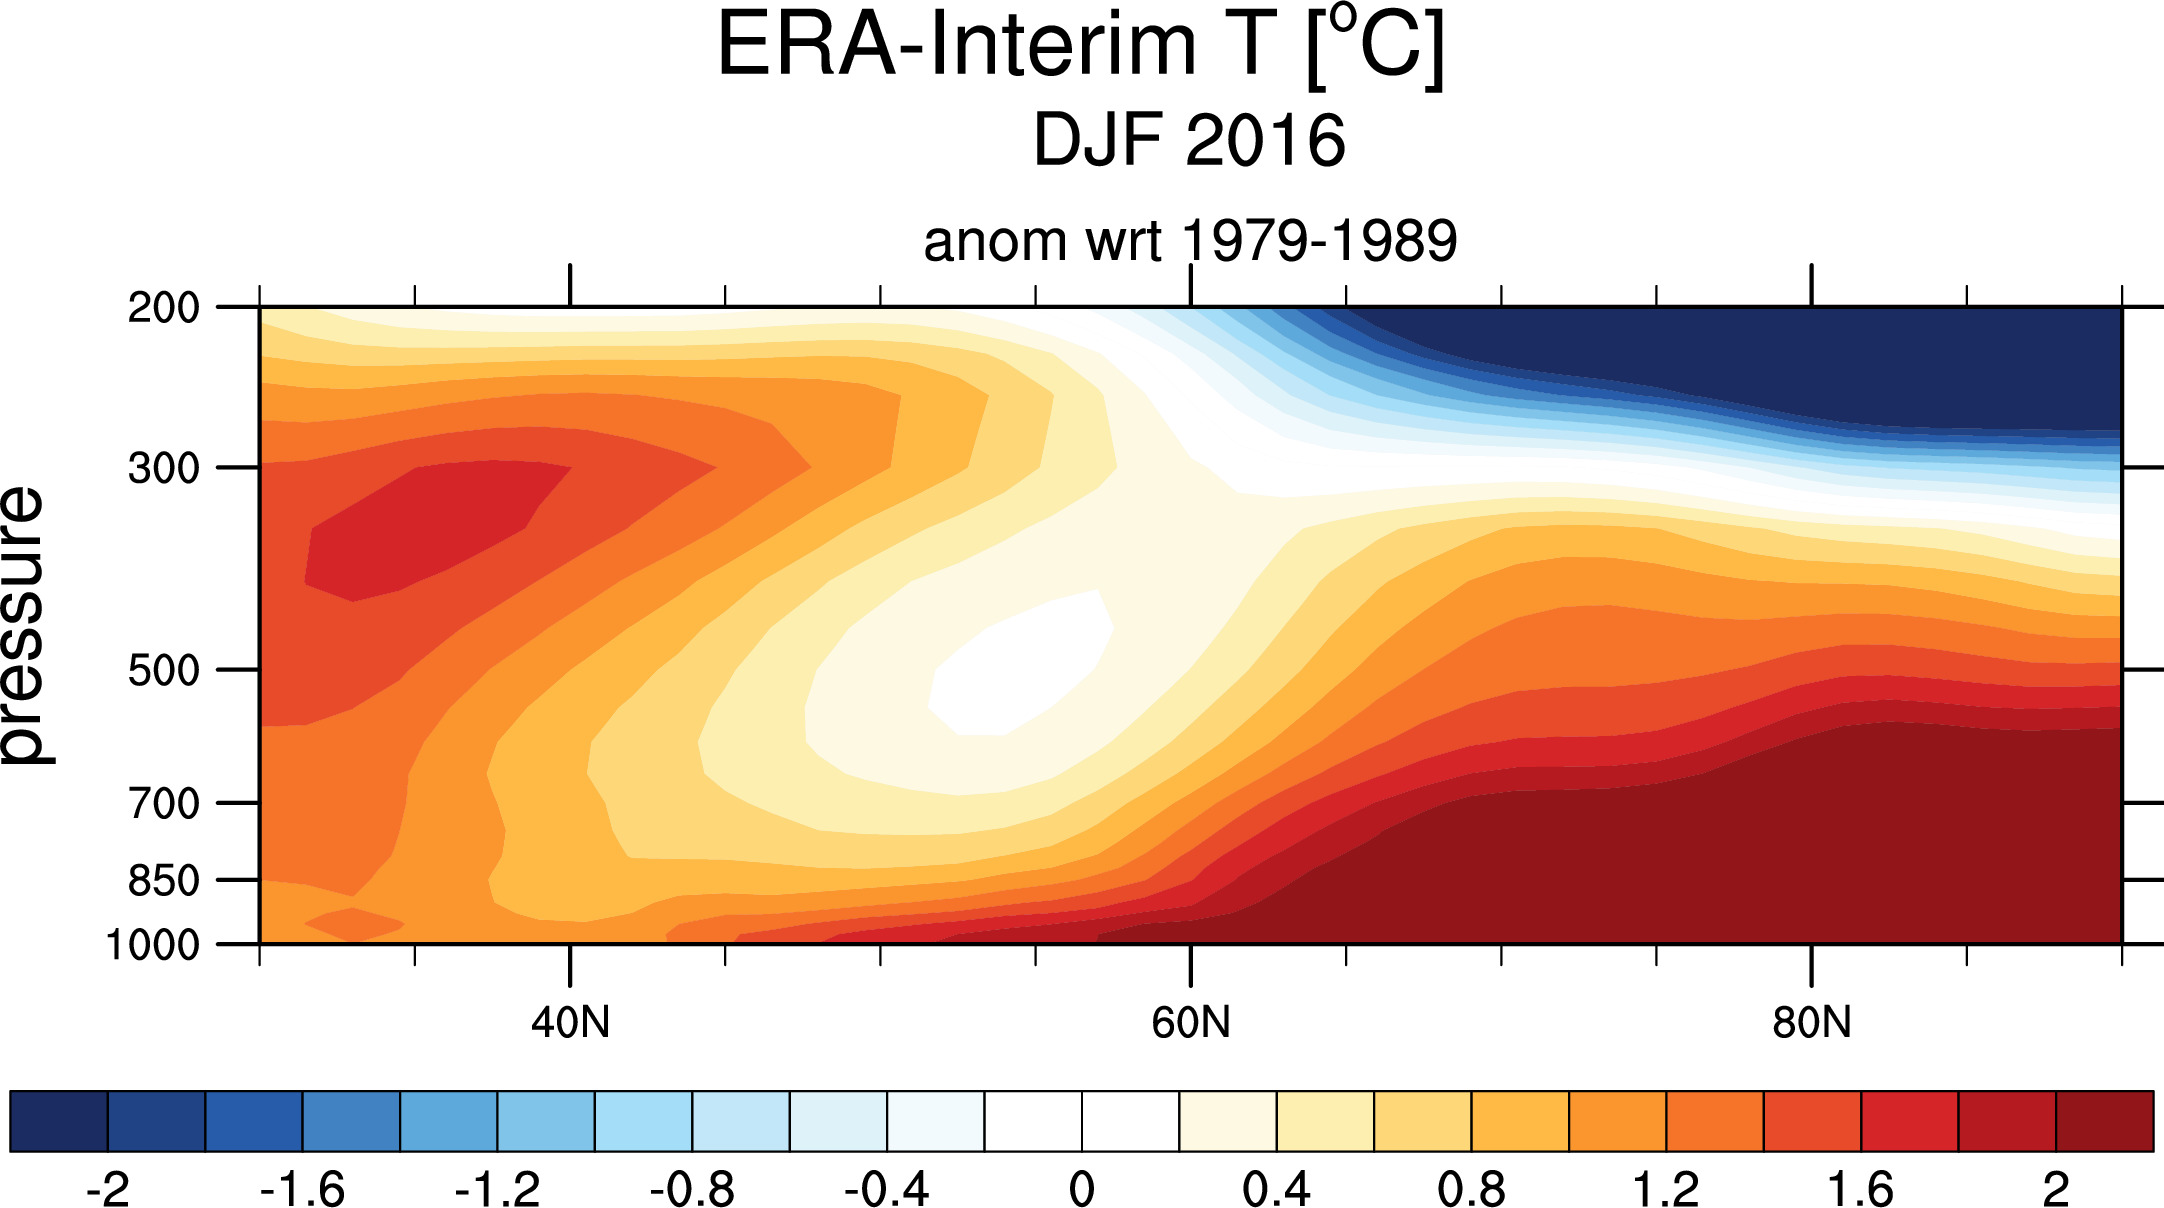
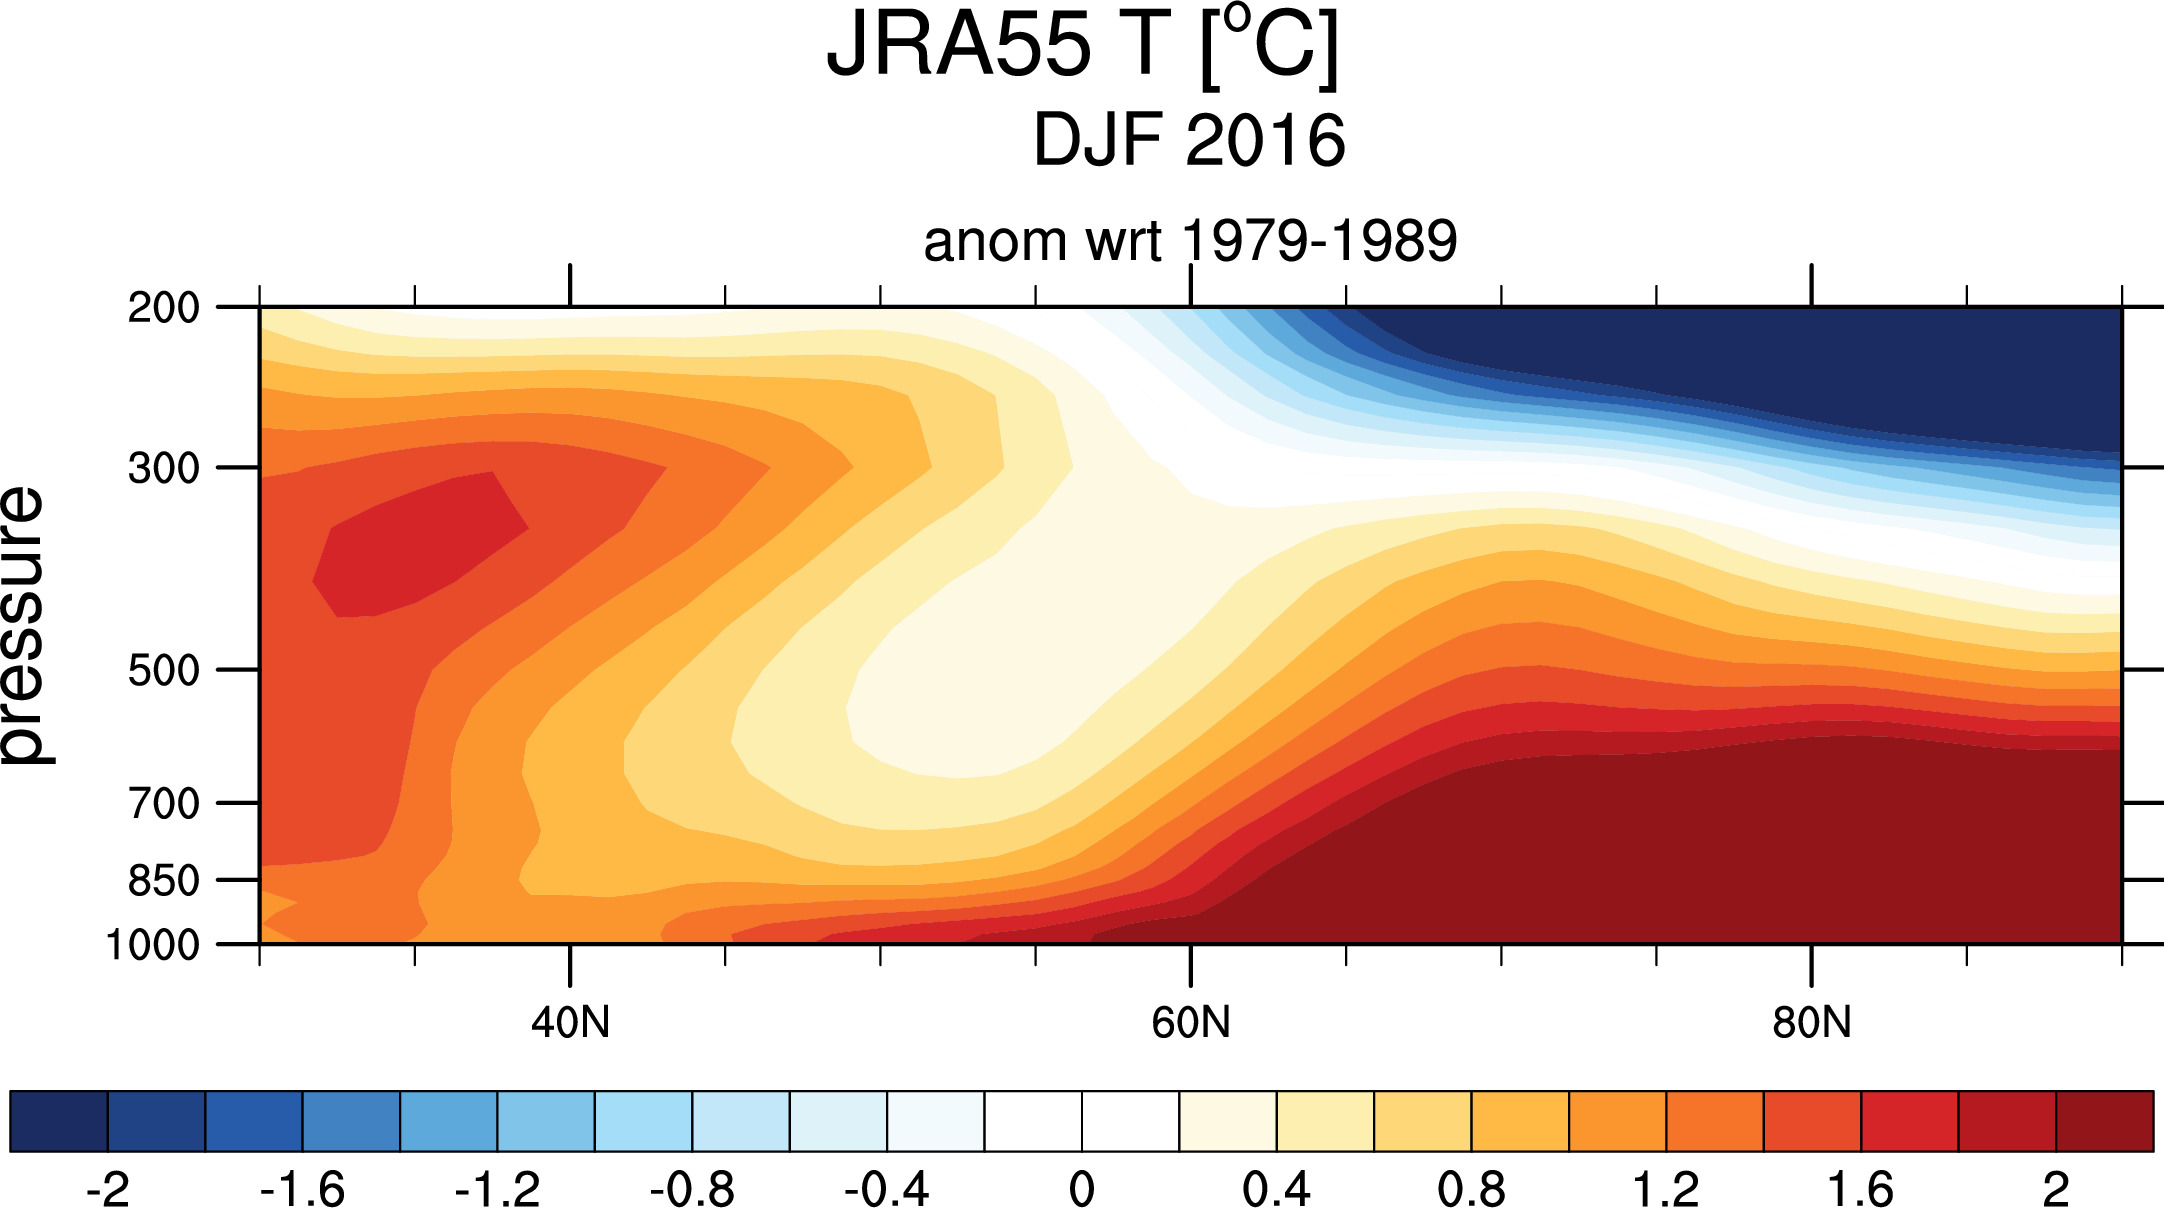
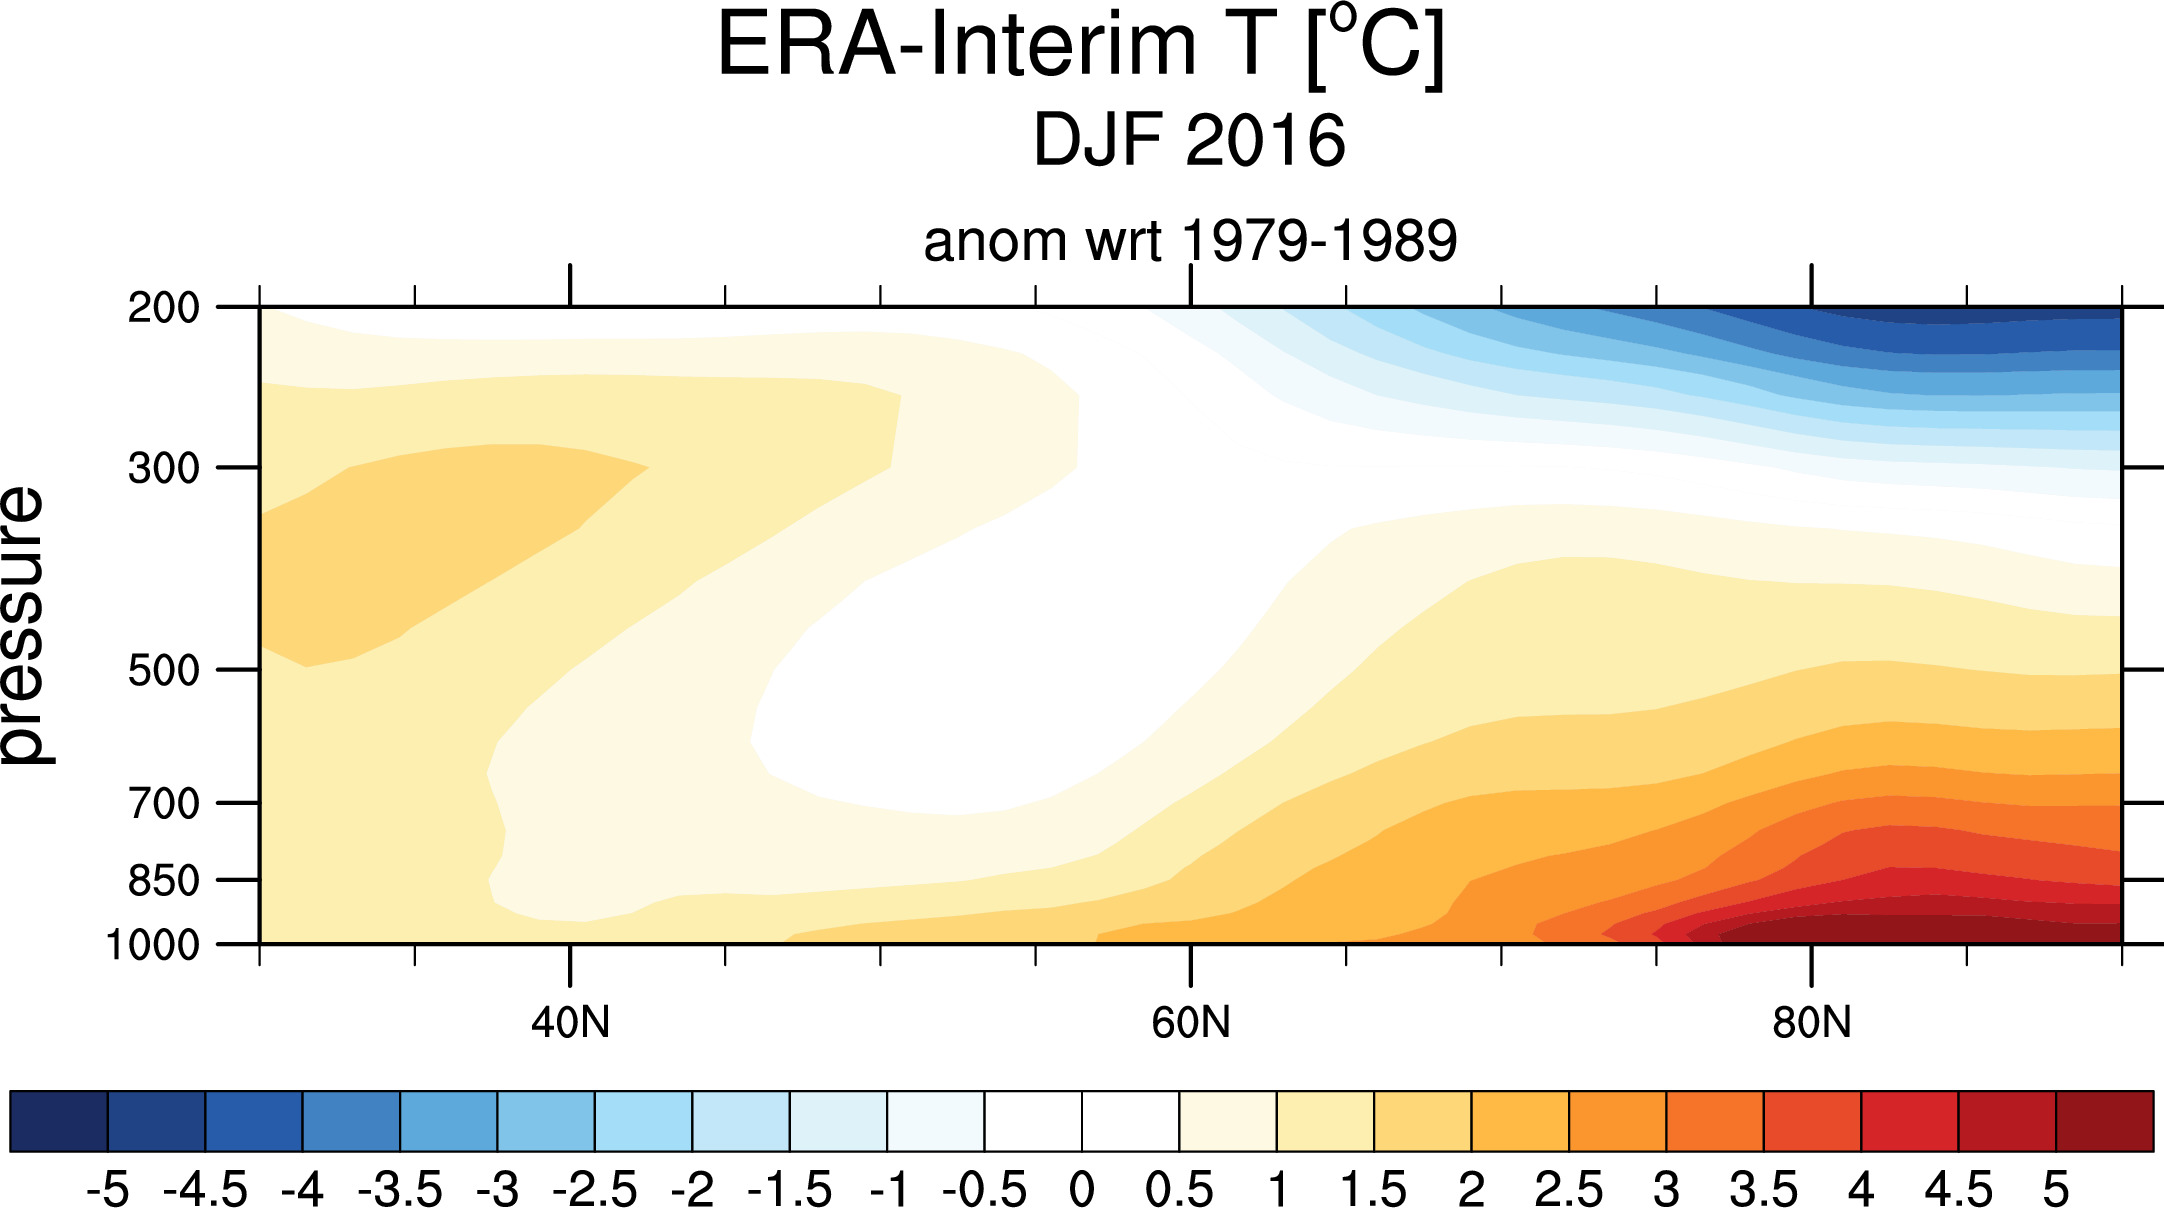
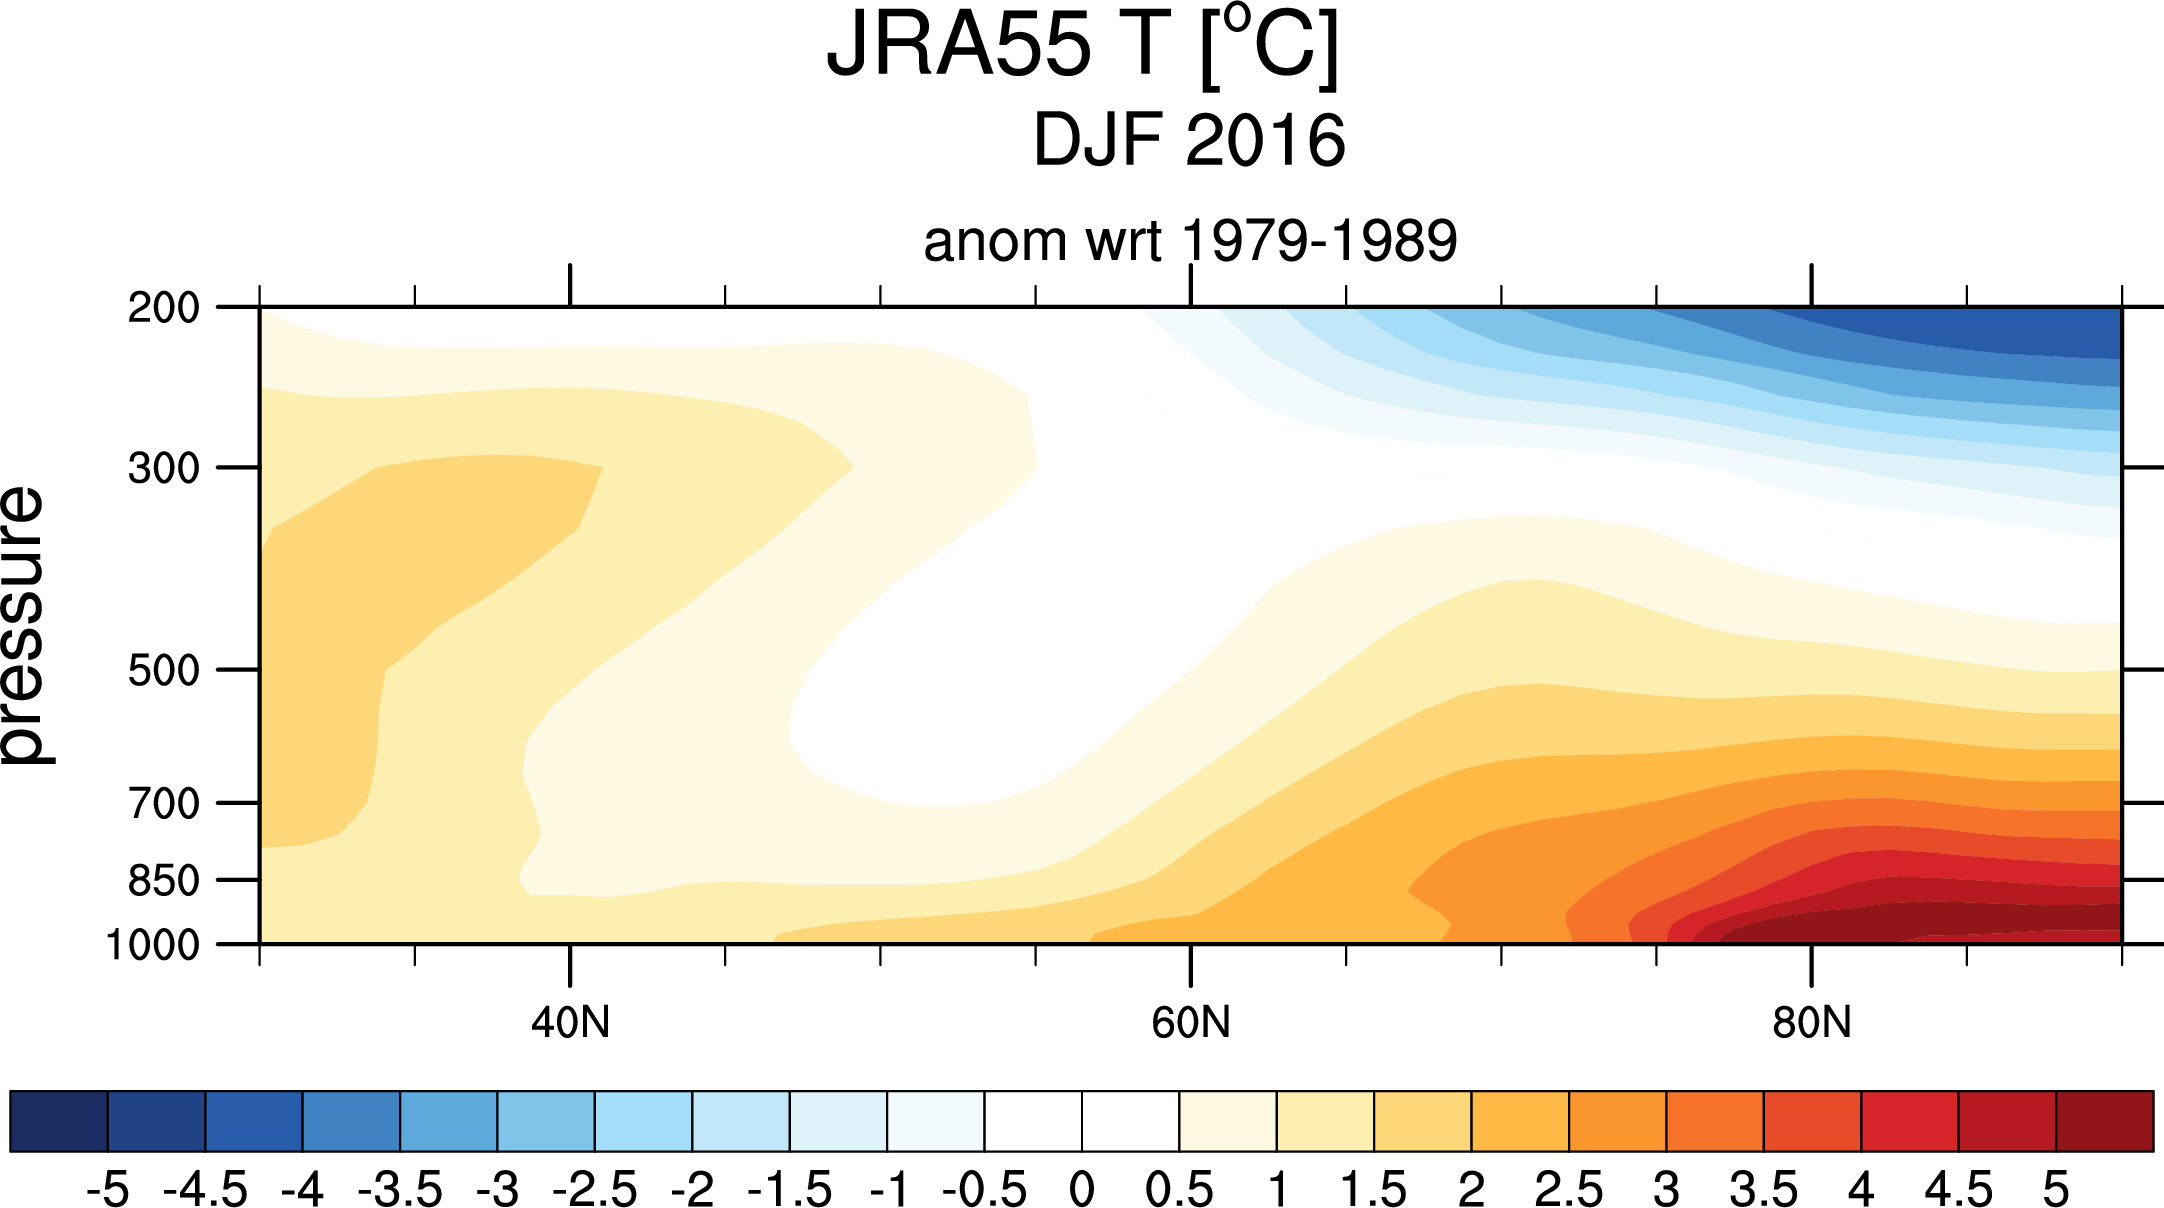
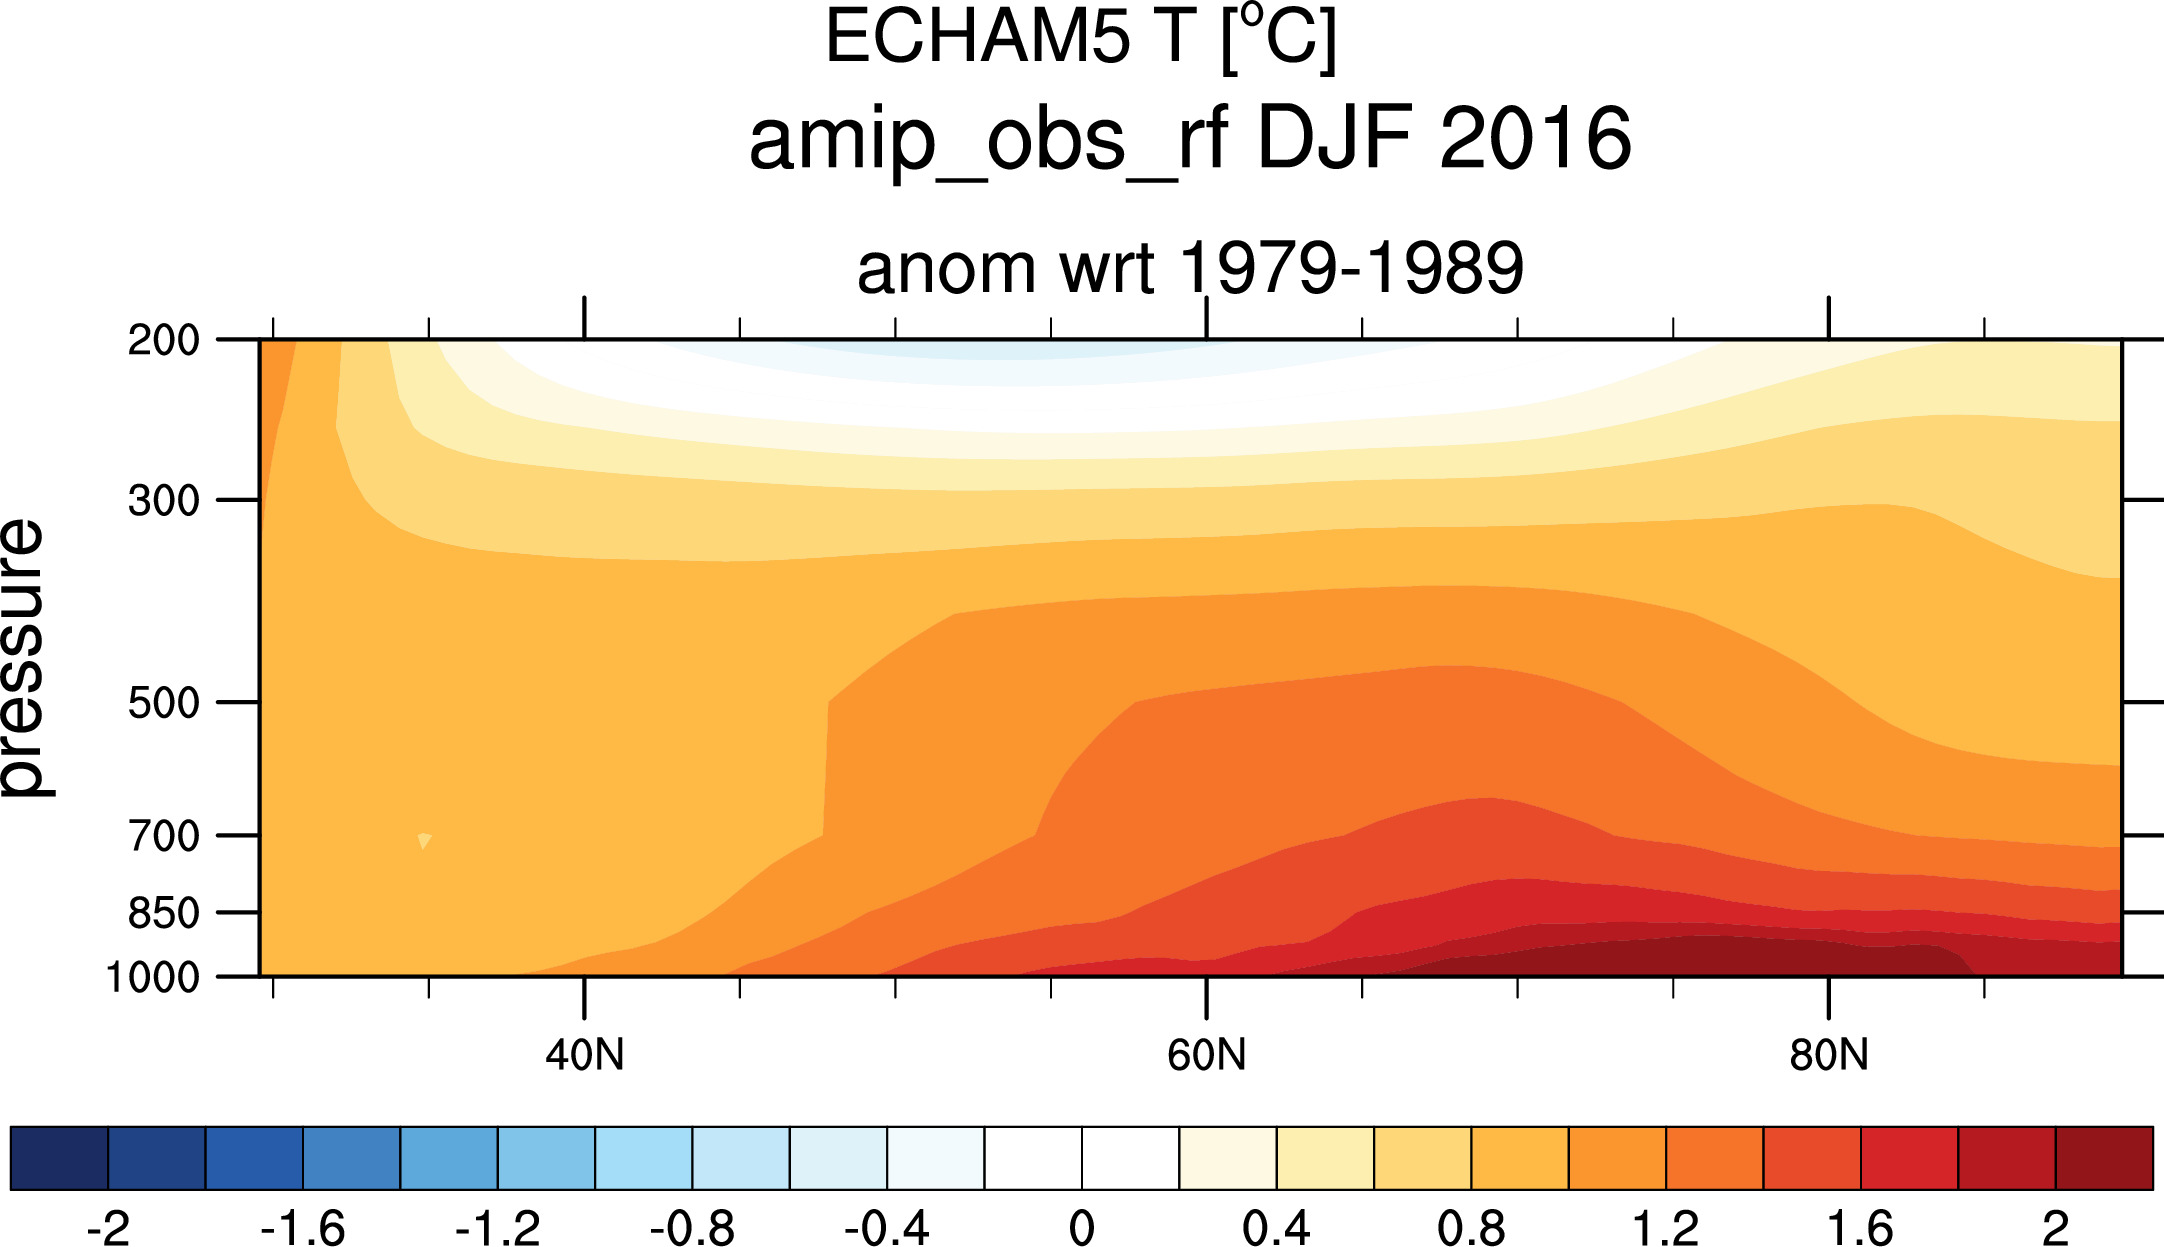
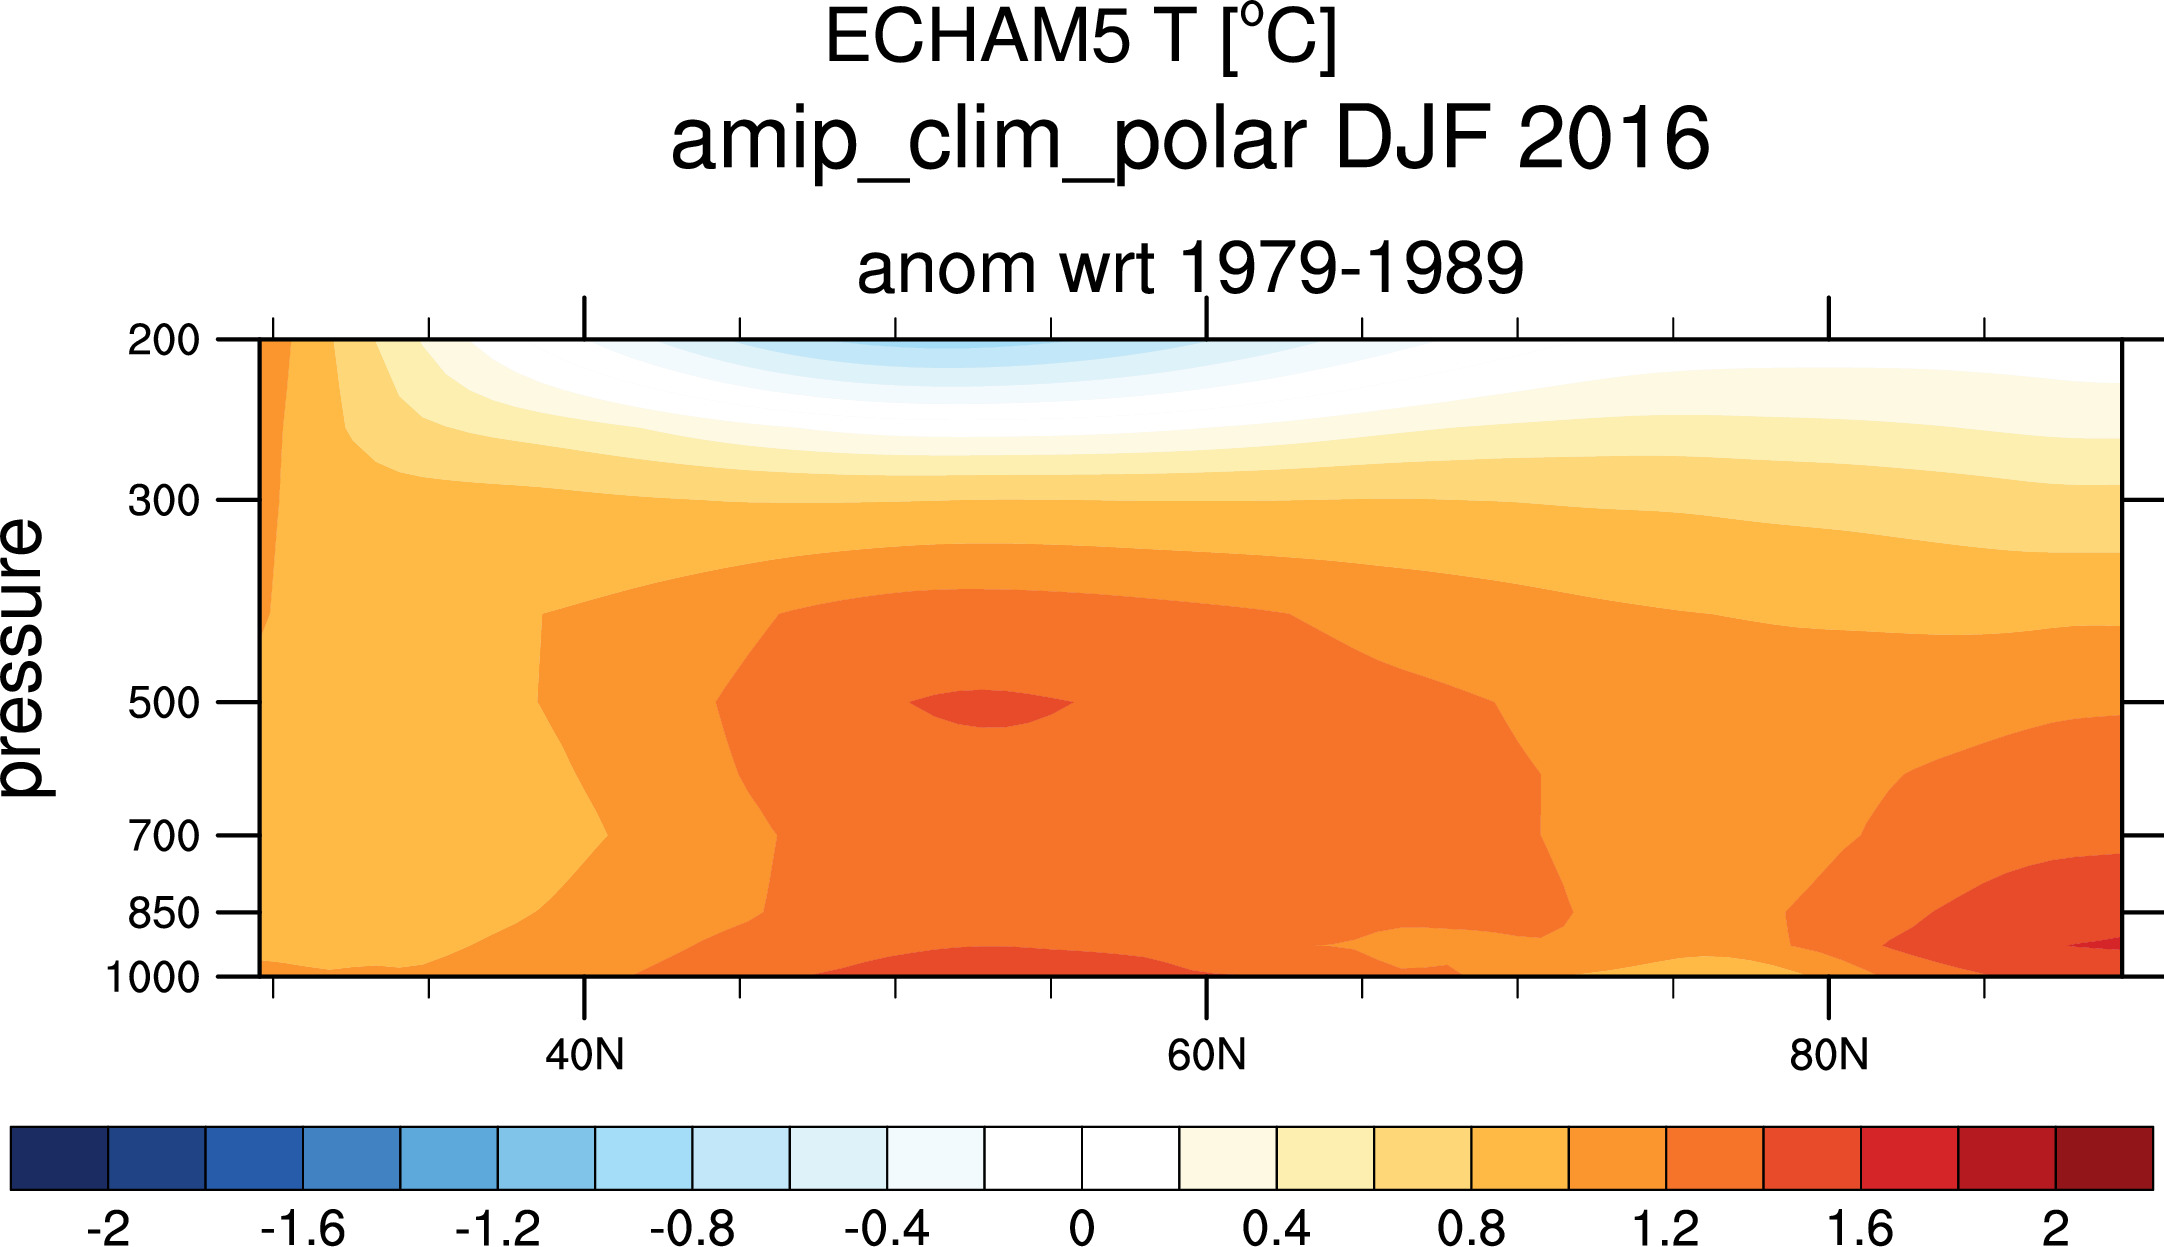
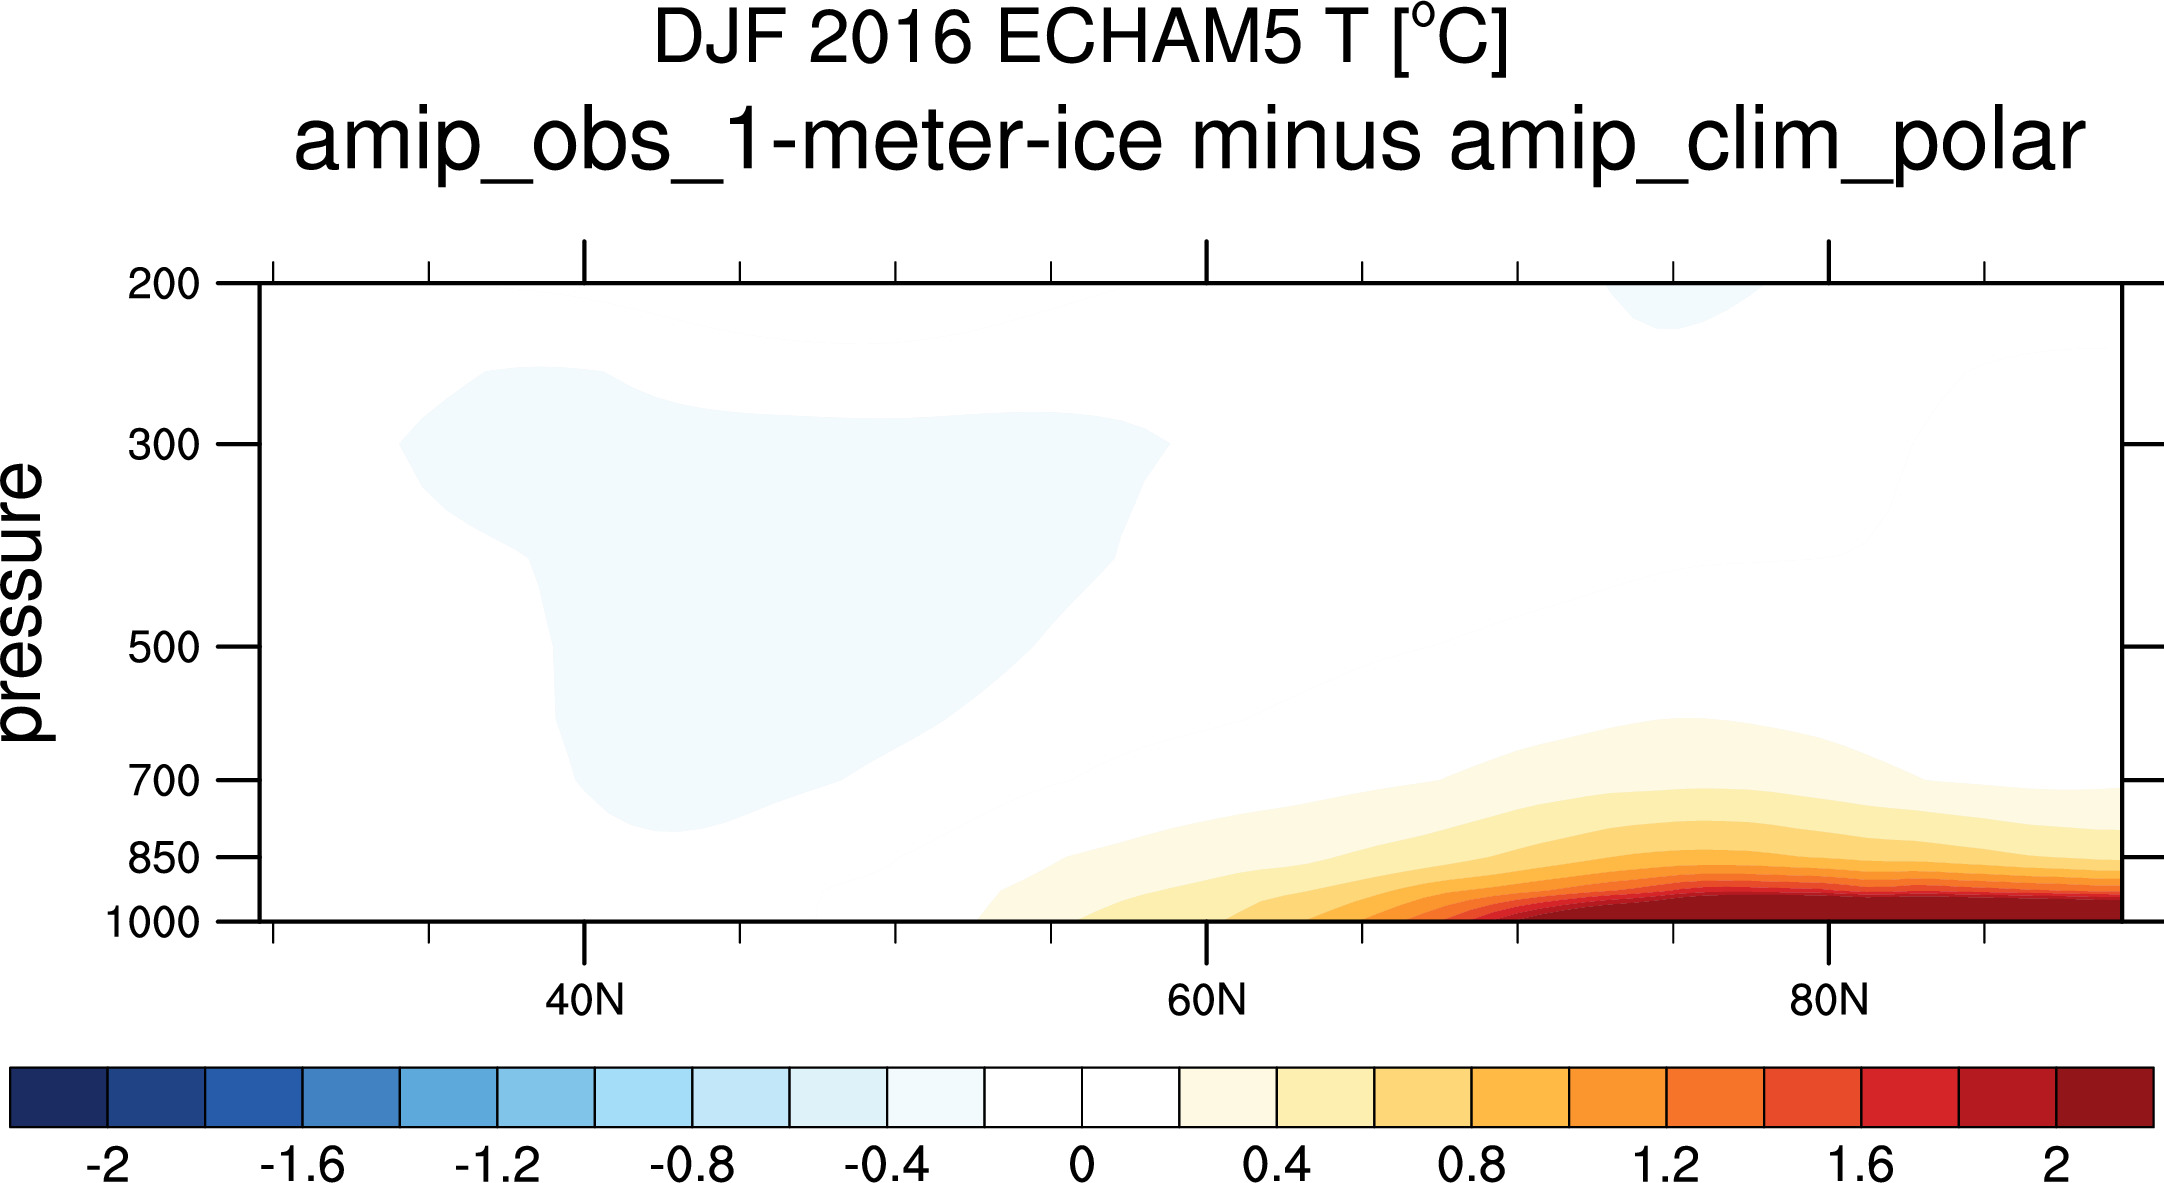
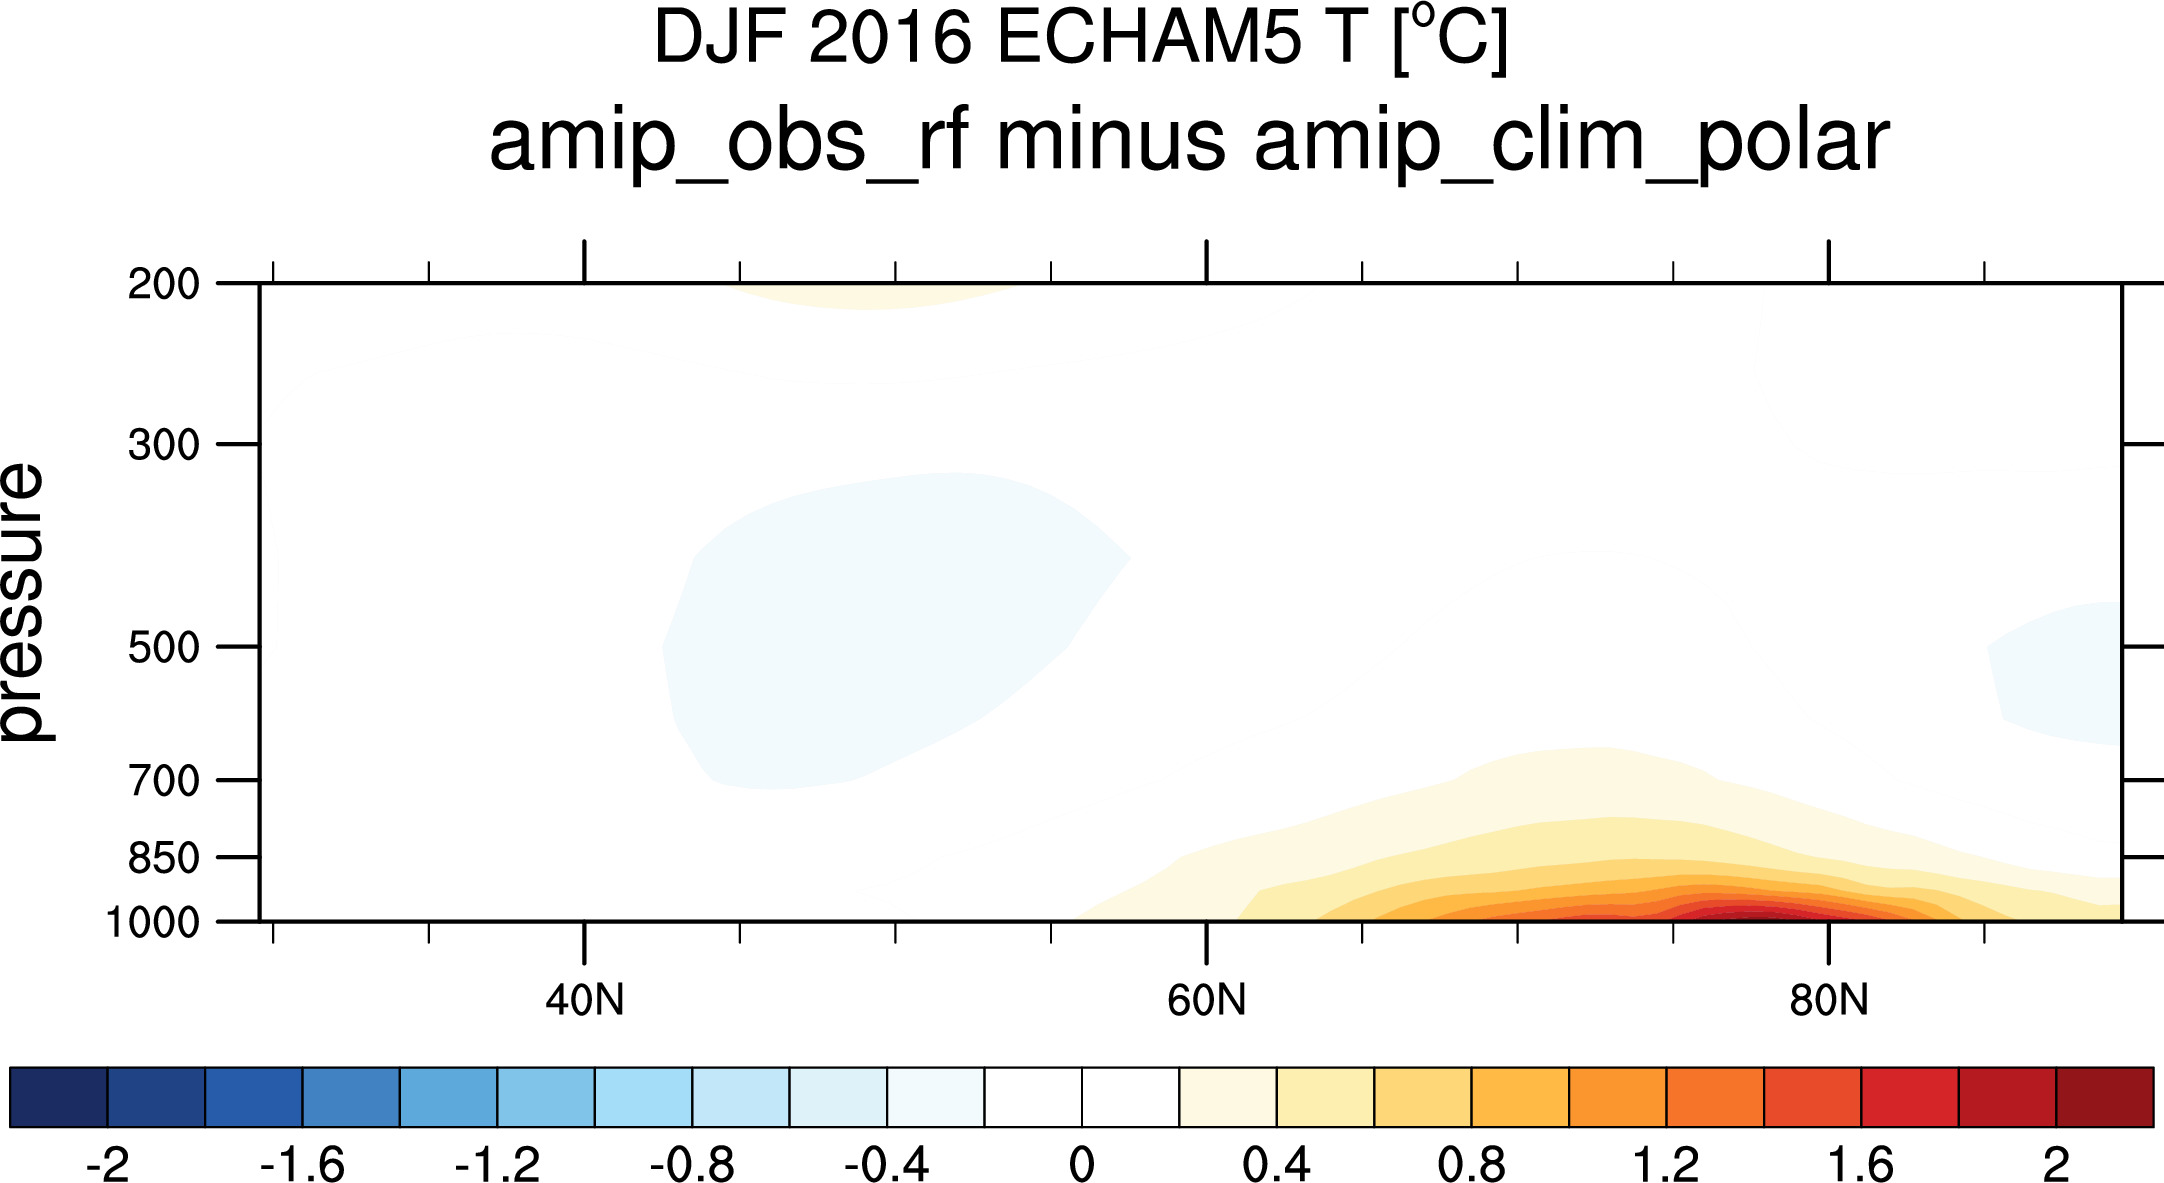
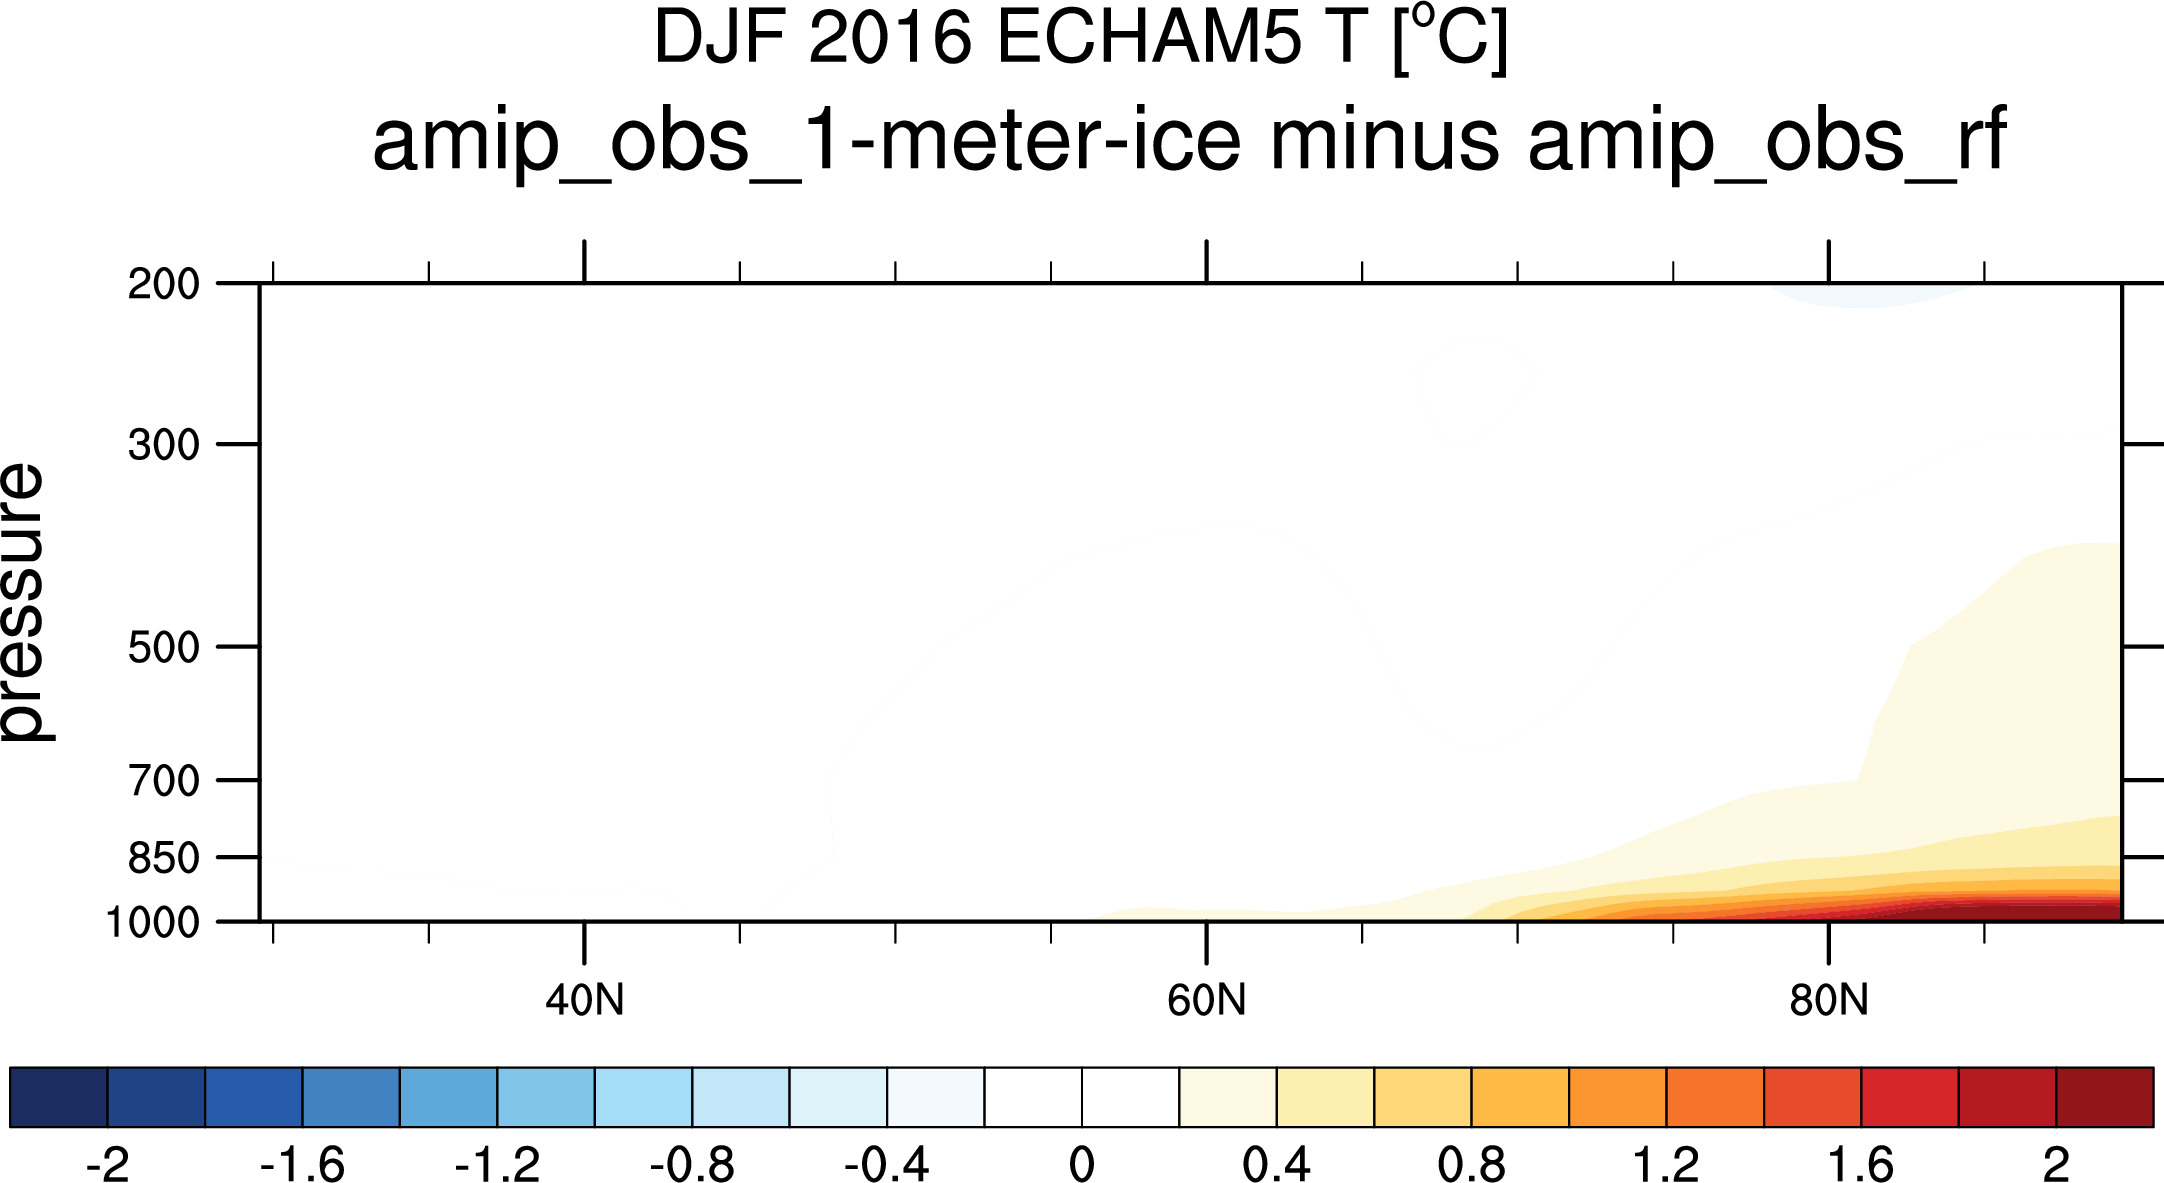
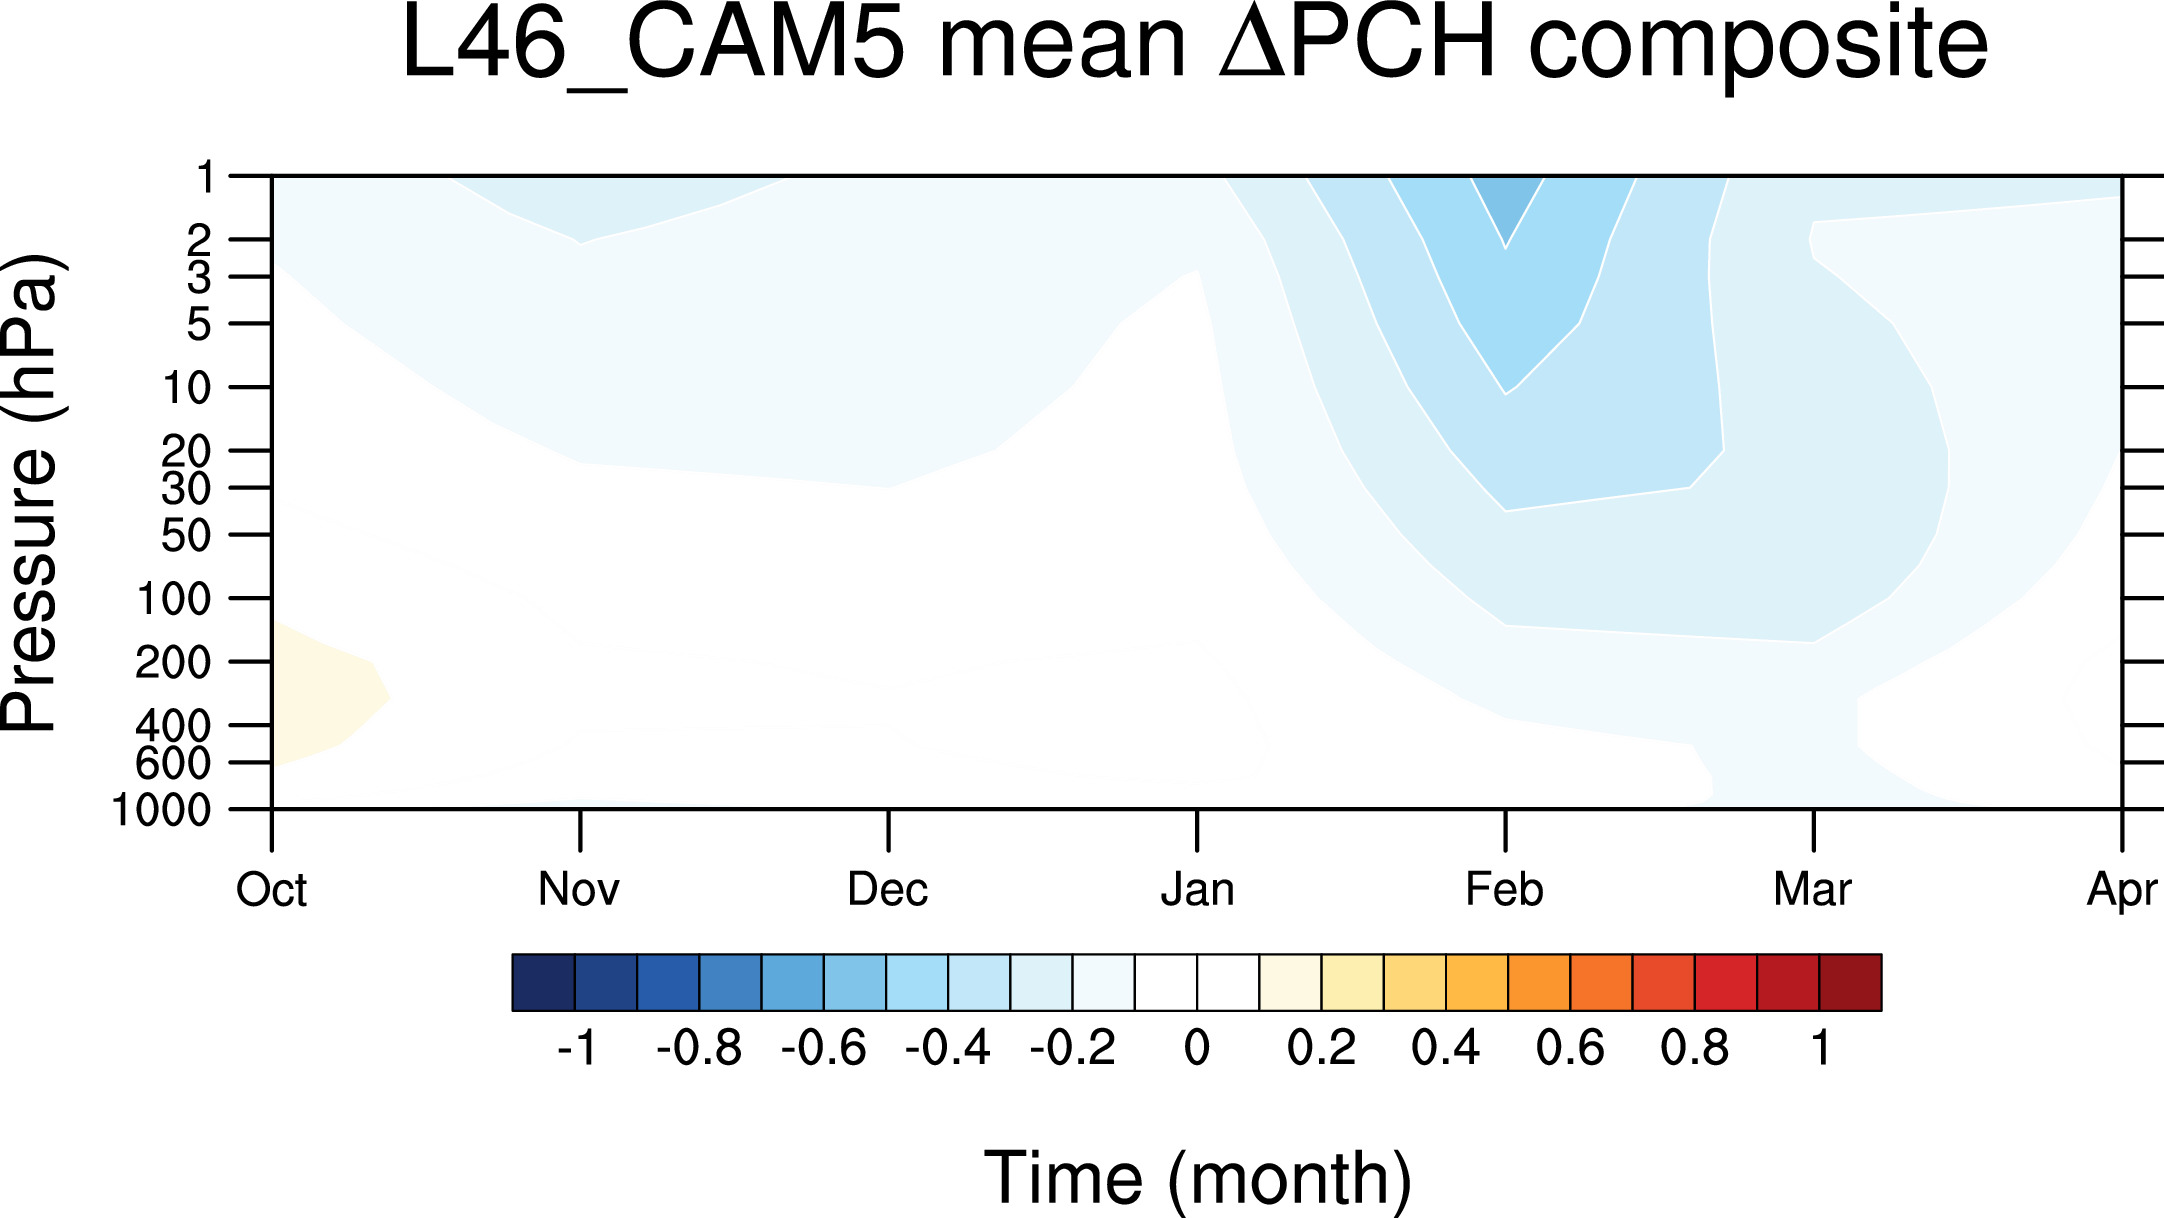
re. vertical structure height versus NH latitude:
anomalies:
differences (no anomalies):
-----------------------------------------


---------------------------------------------------------------------------------------------------------------------------------------------------------------
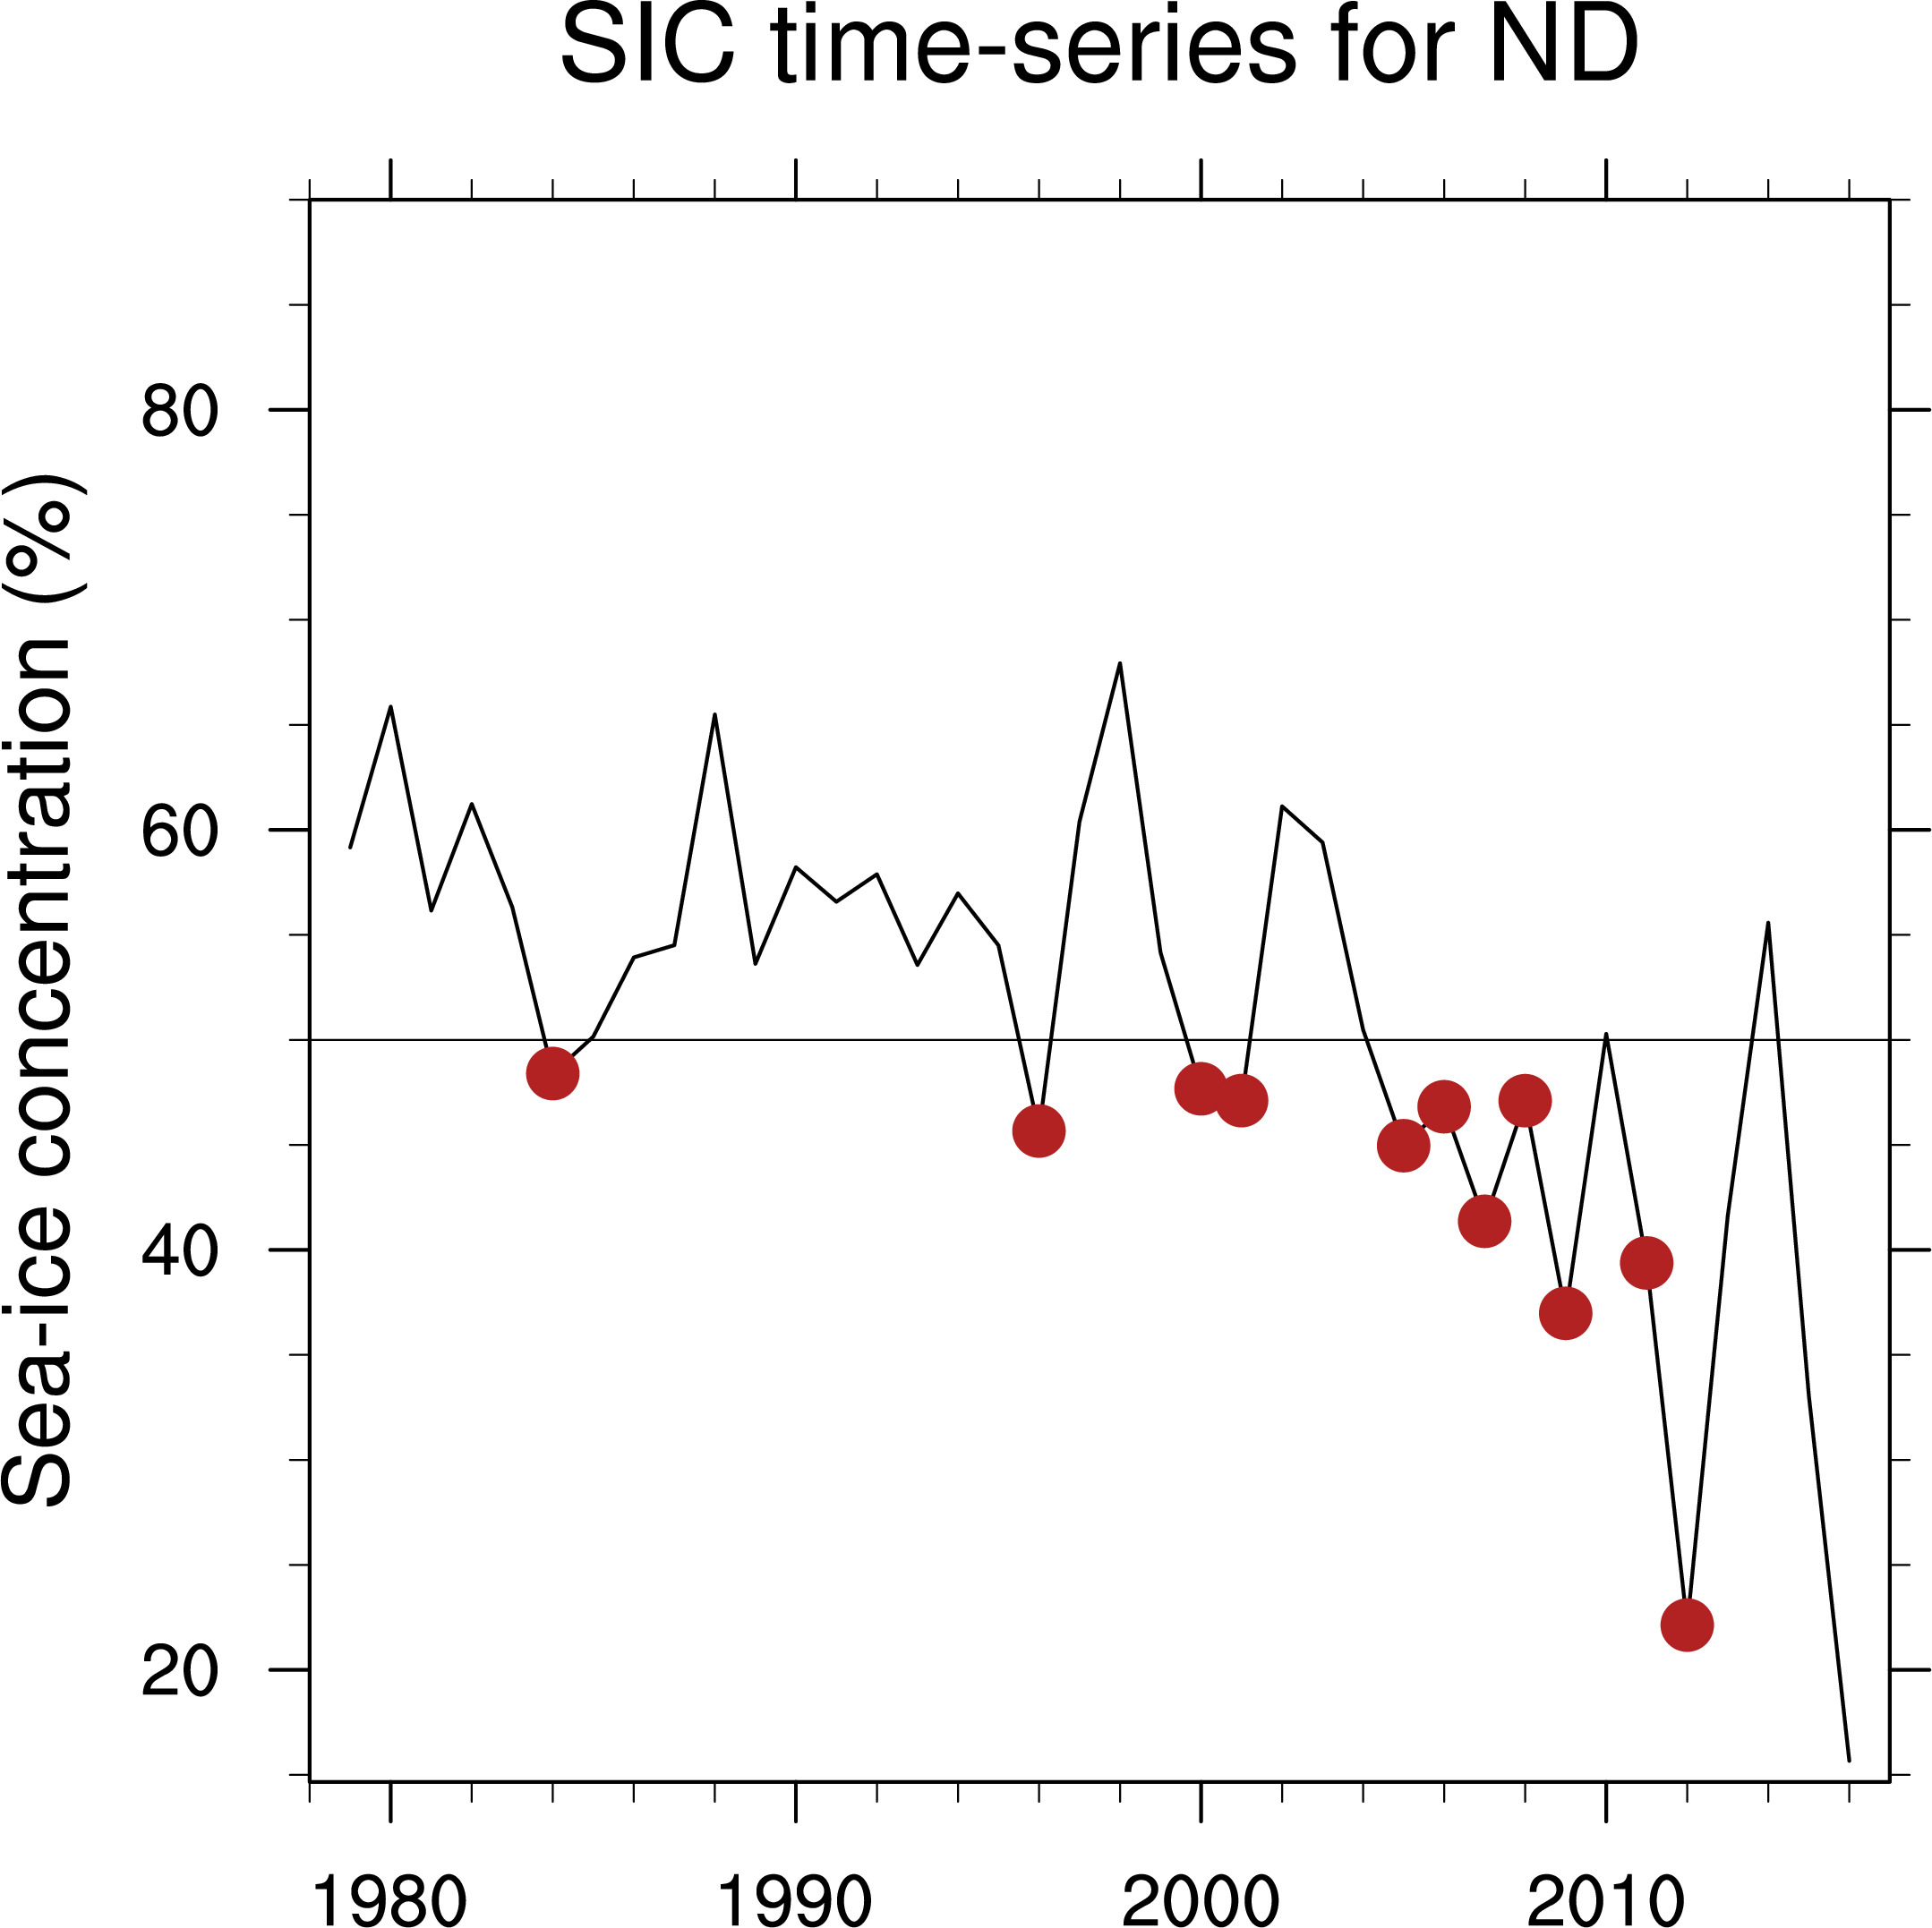
All above plots for years 1984,1996,2000,2001,2005,2006,2007,2008,2009,2011,2012
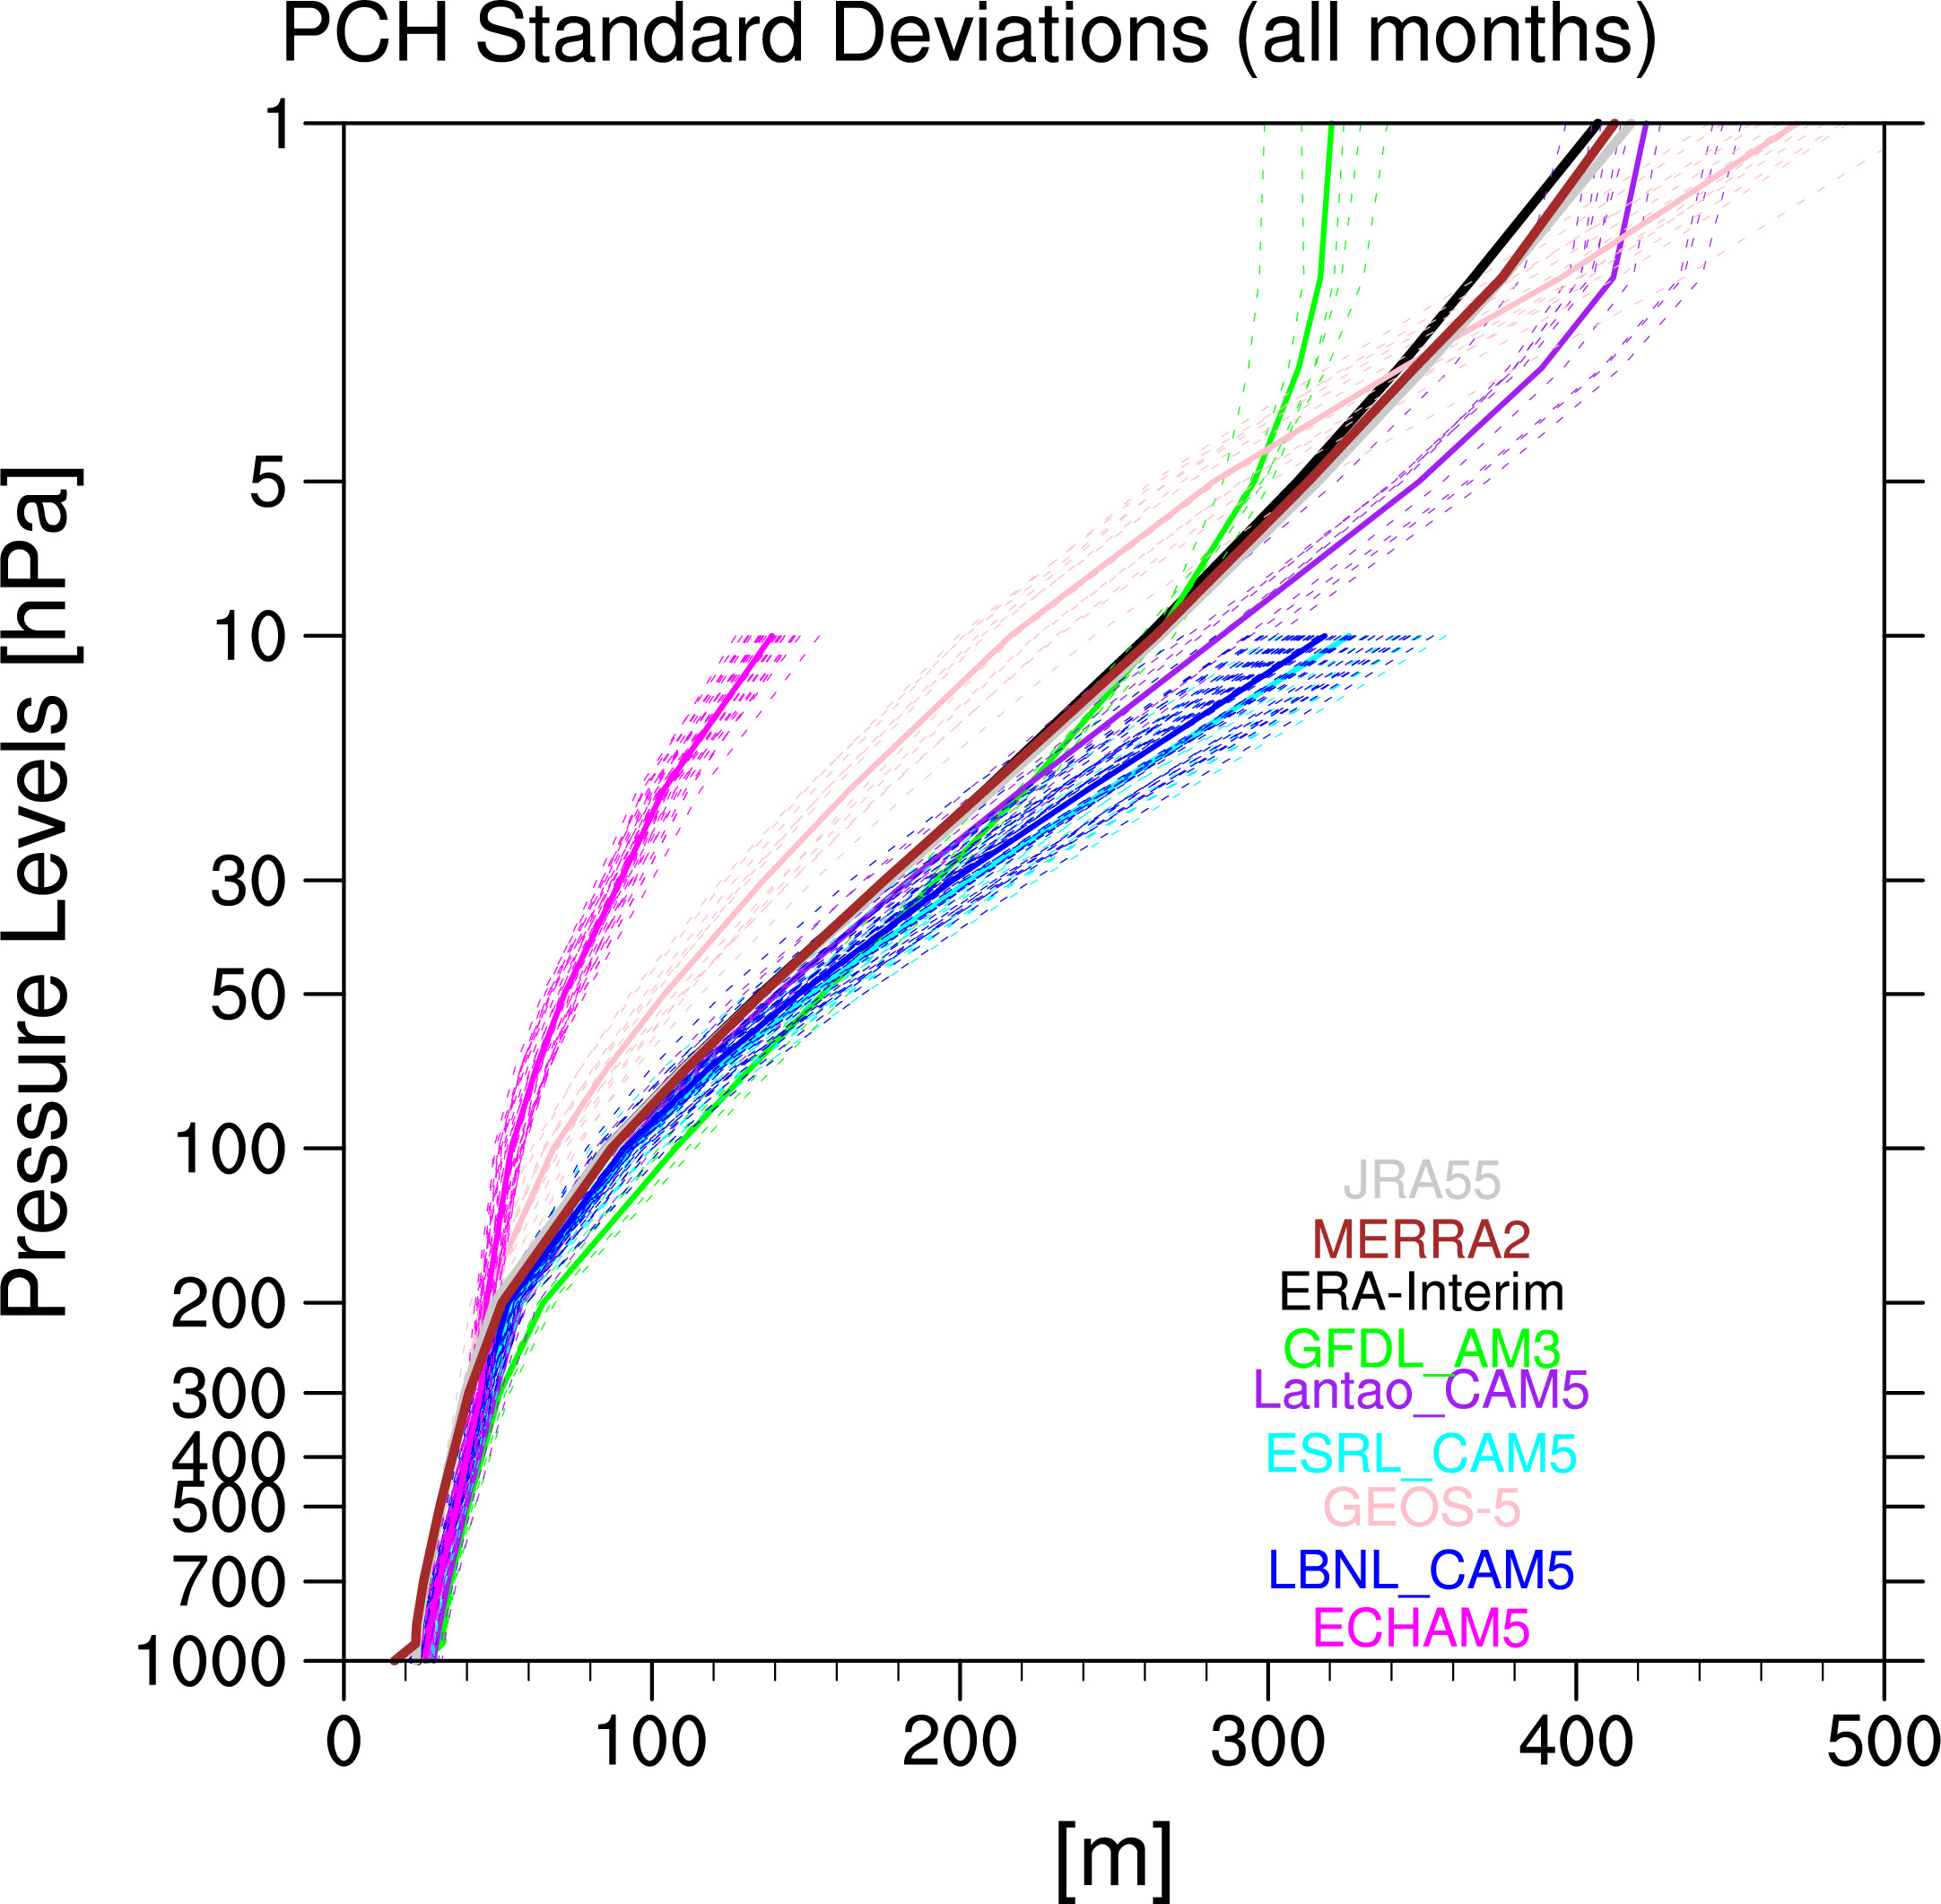
Unless stated otherwise, this page all calculations done with standardizations over all months
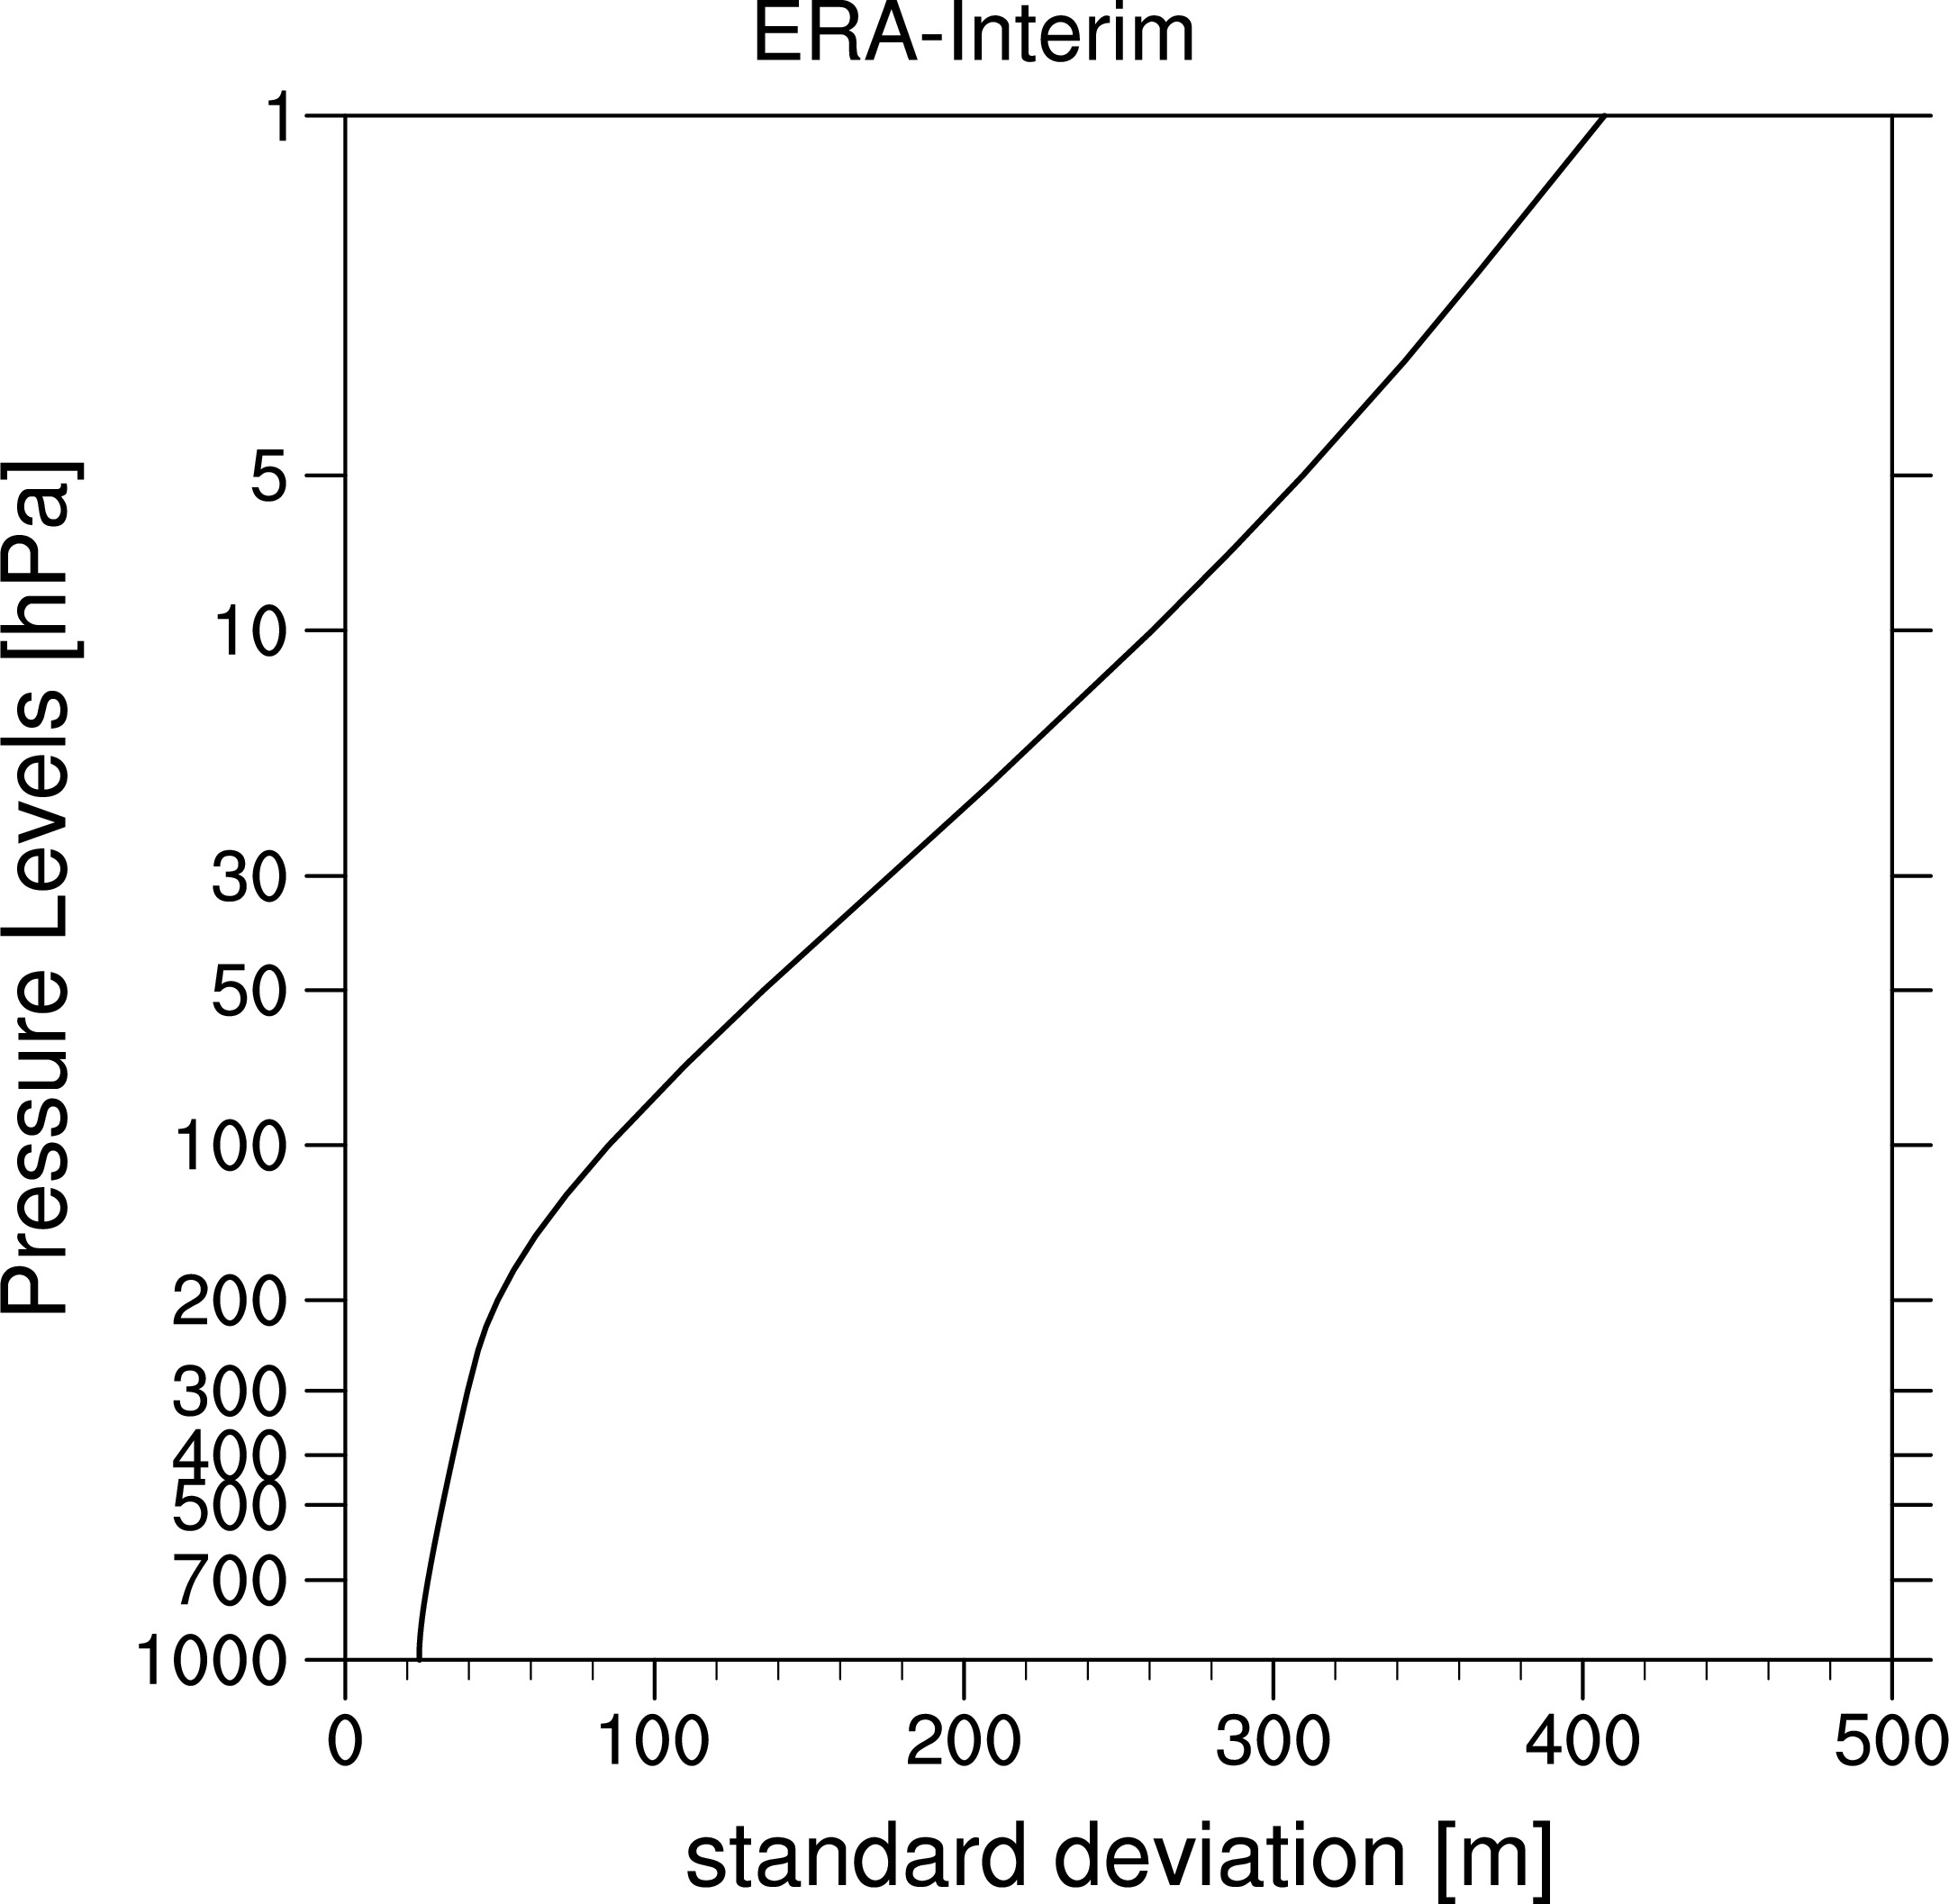
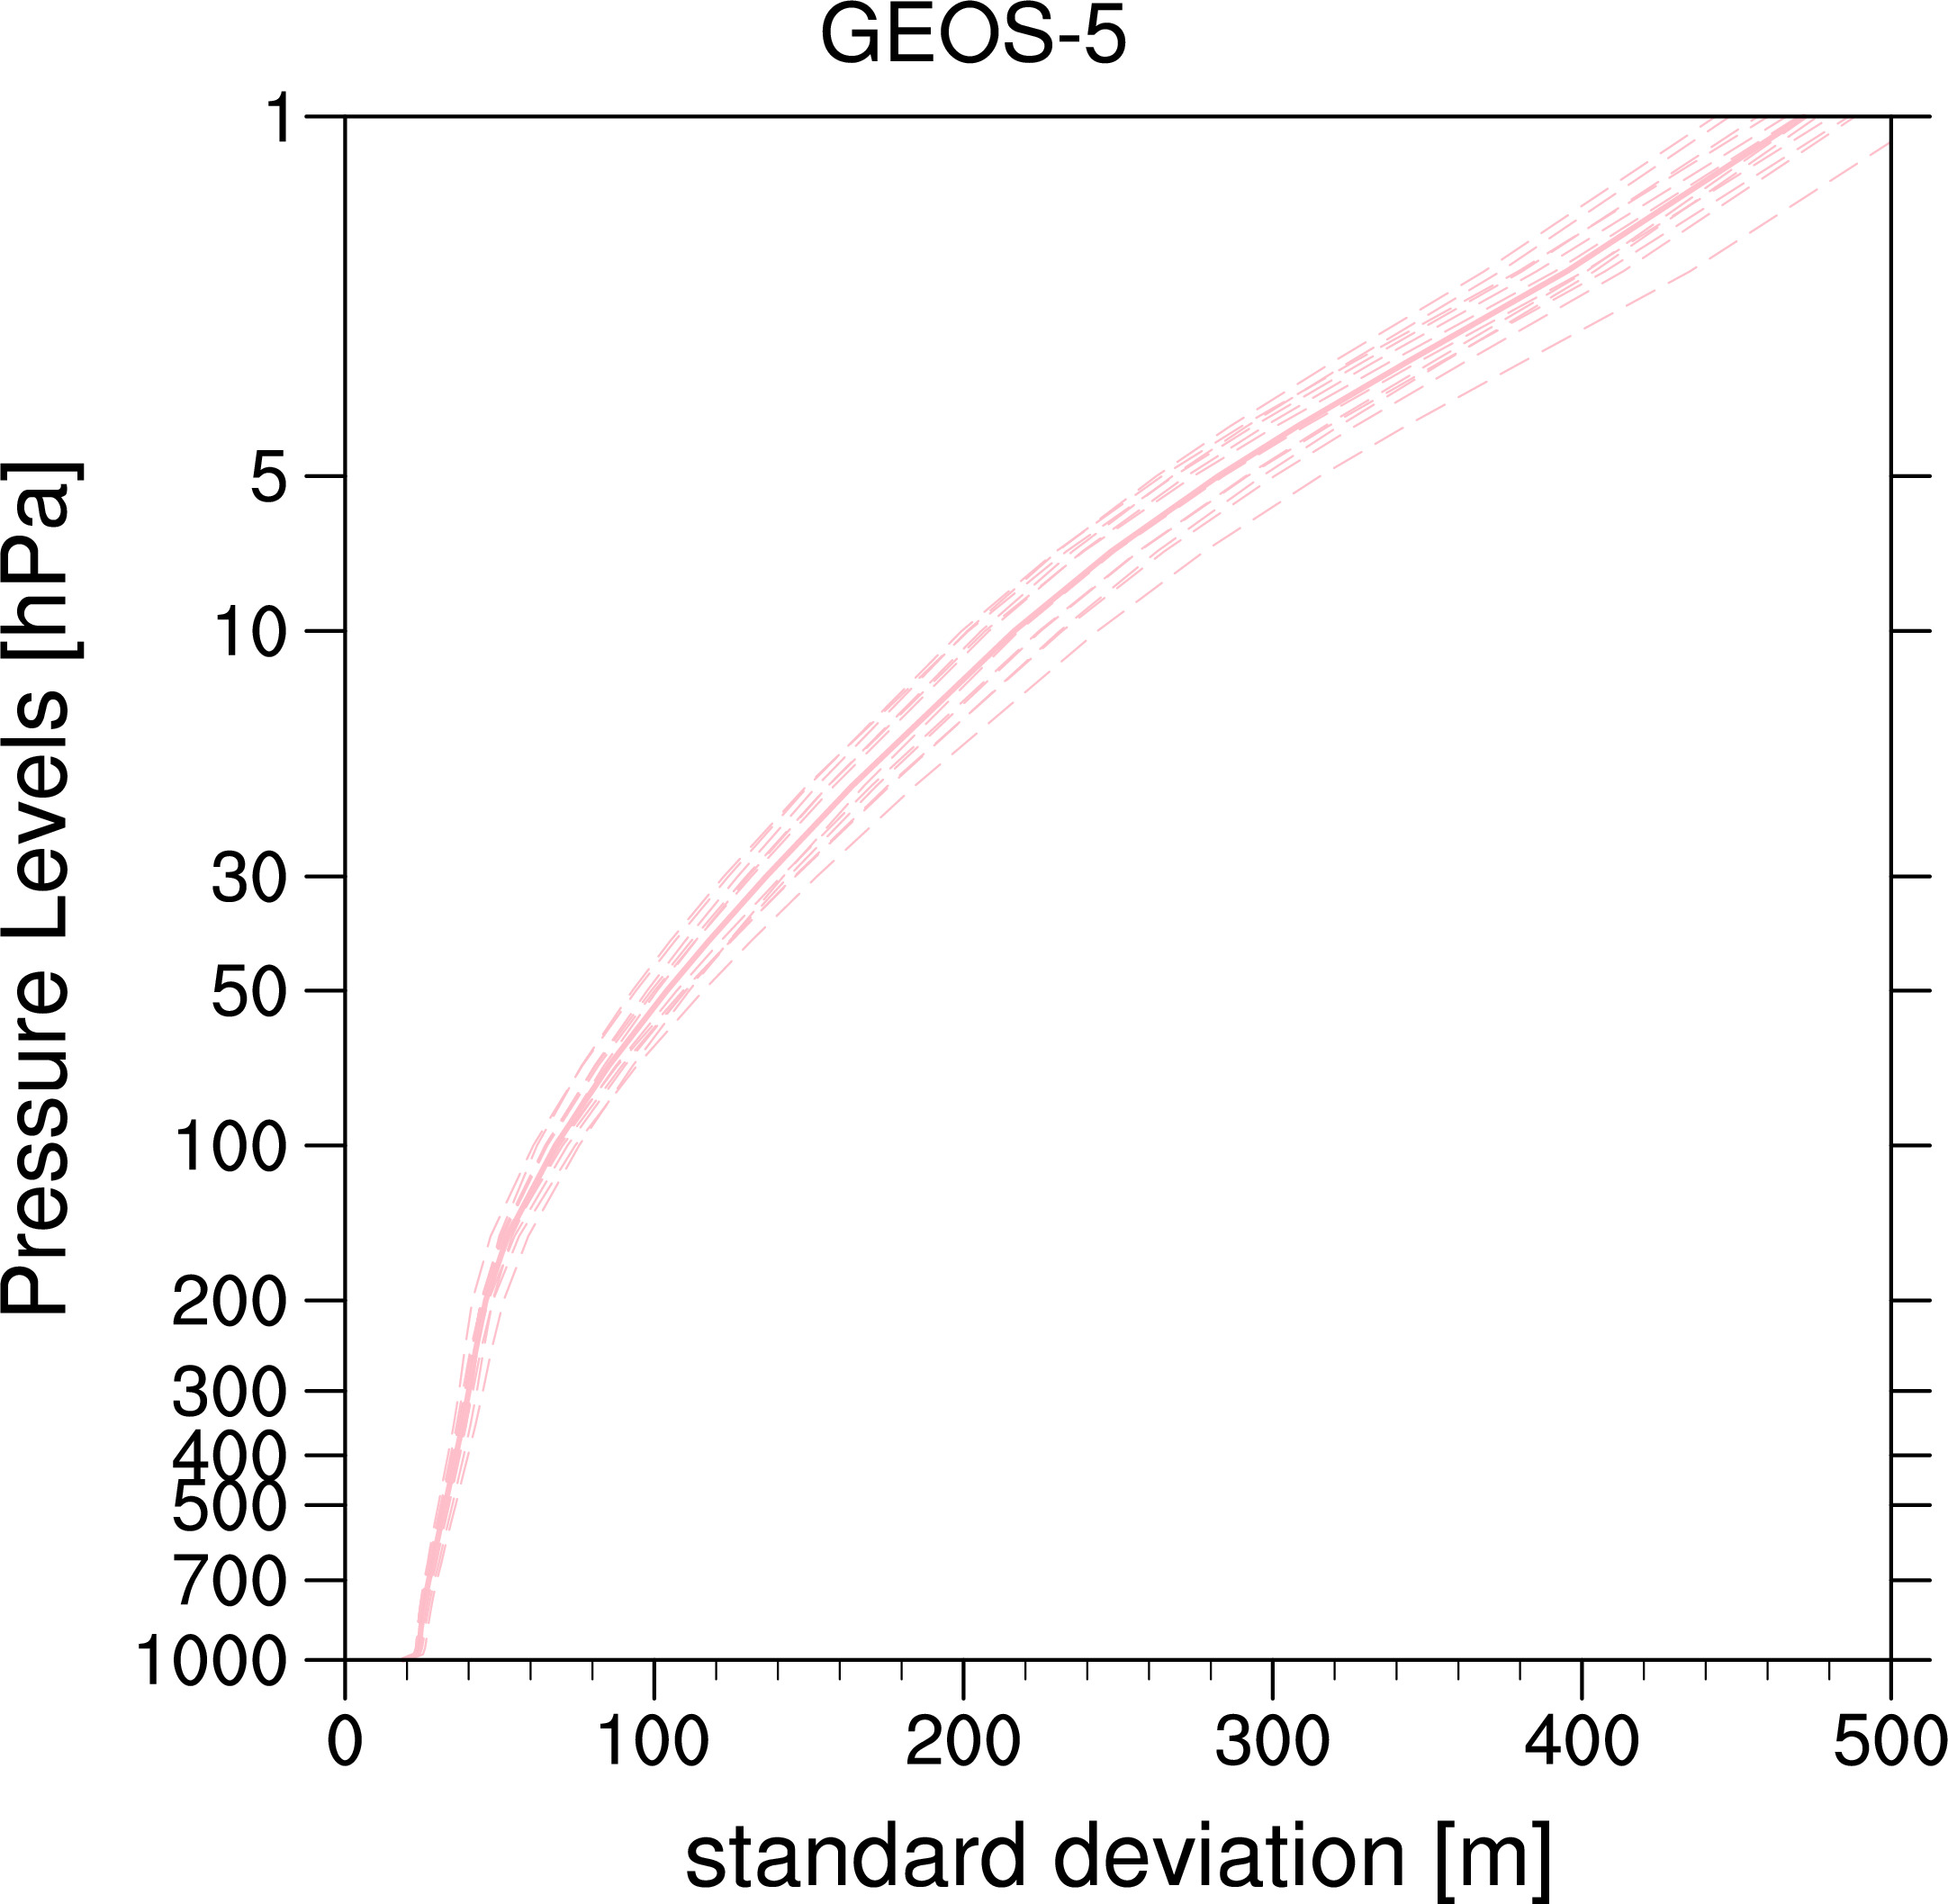
PCH standard deviations, using all months
Unless stated otherwise, all analyses done for years 1984,1996,2000,2001,2005,2006,2007,2008,2009,2011,2012
Individual Years here
-----
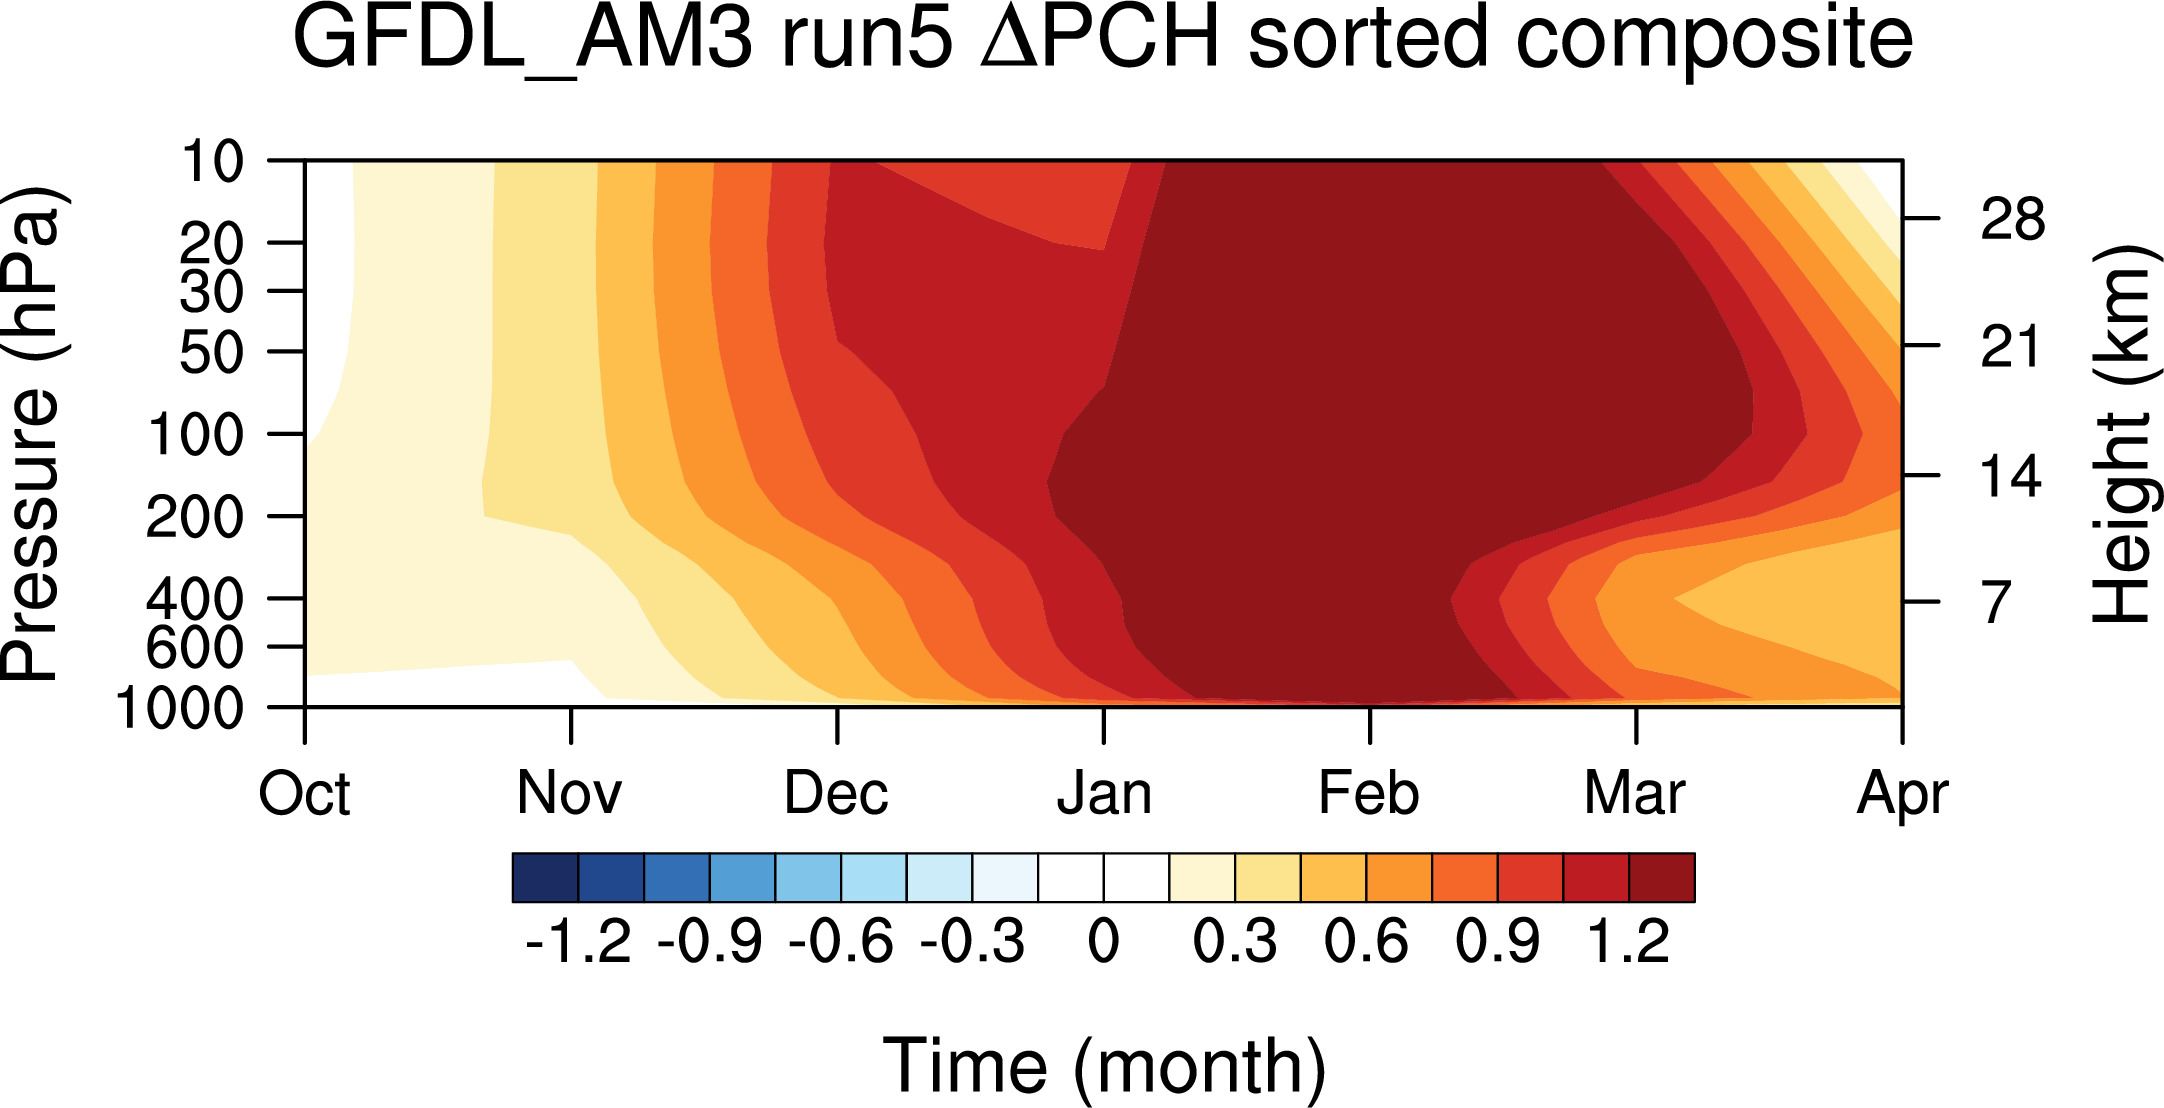
Special case Sorted on largest values of Jan Feb mean at 50hPa
------------------------------------------------------------------------------------------------------------
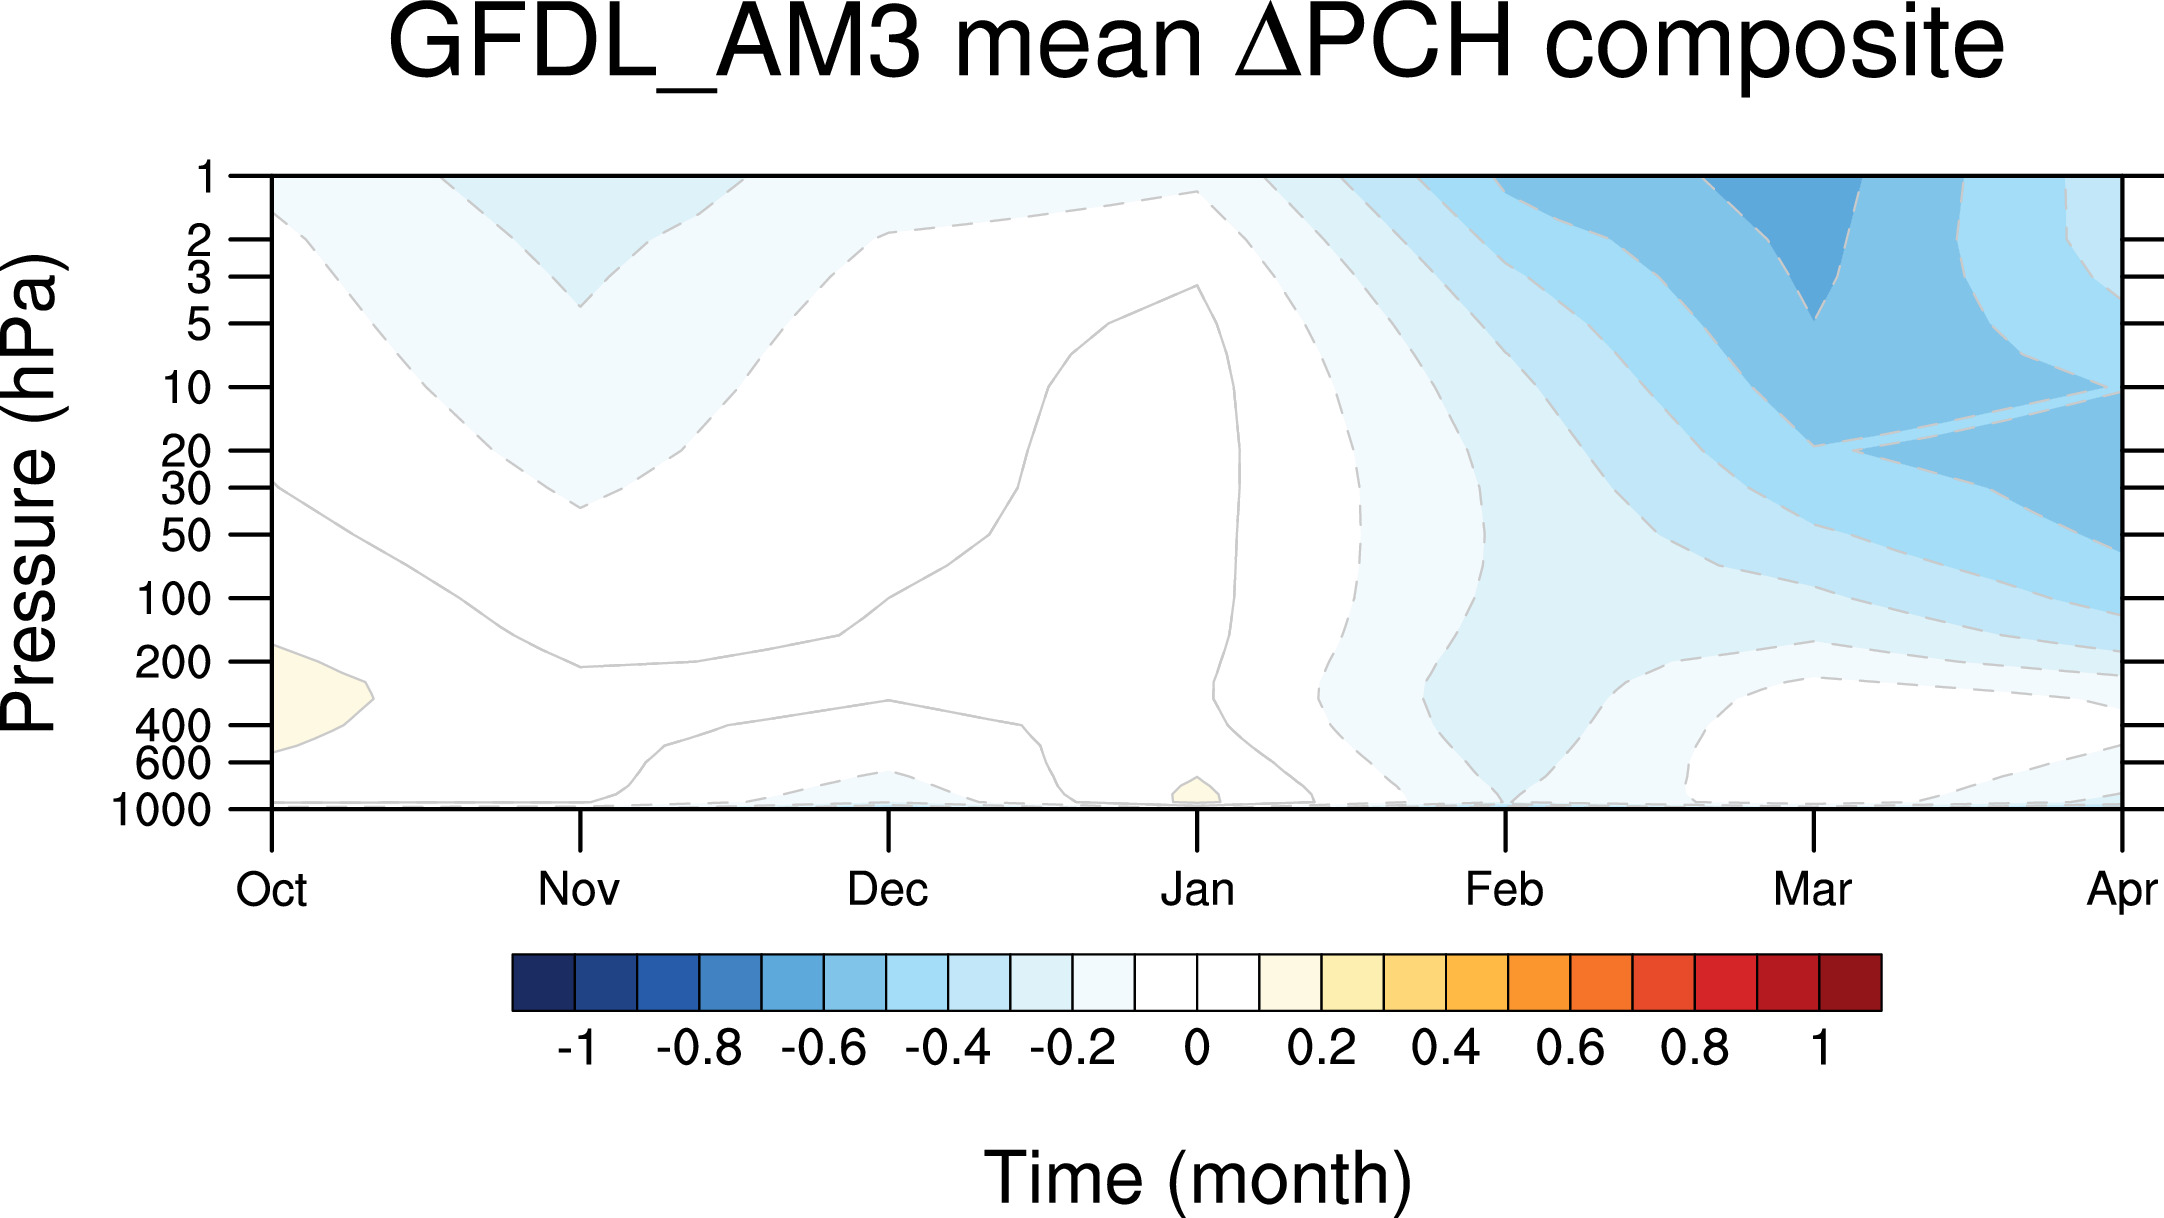
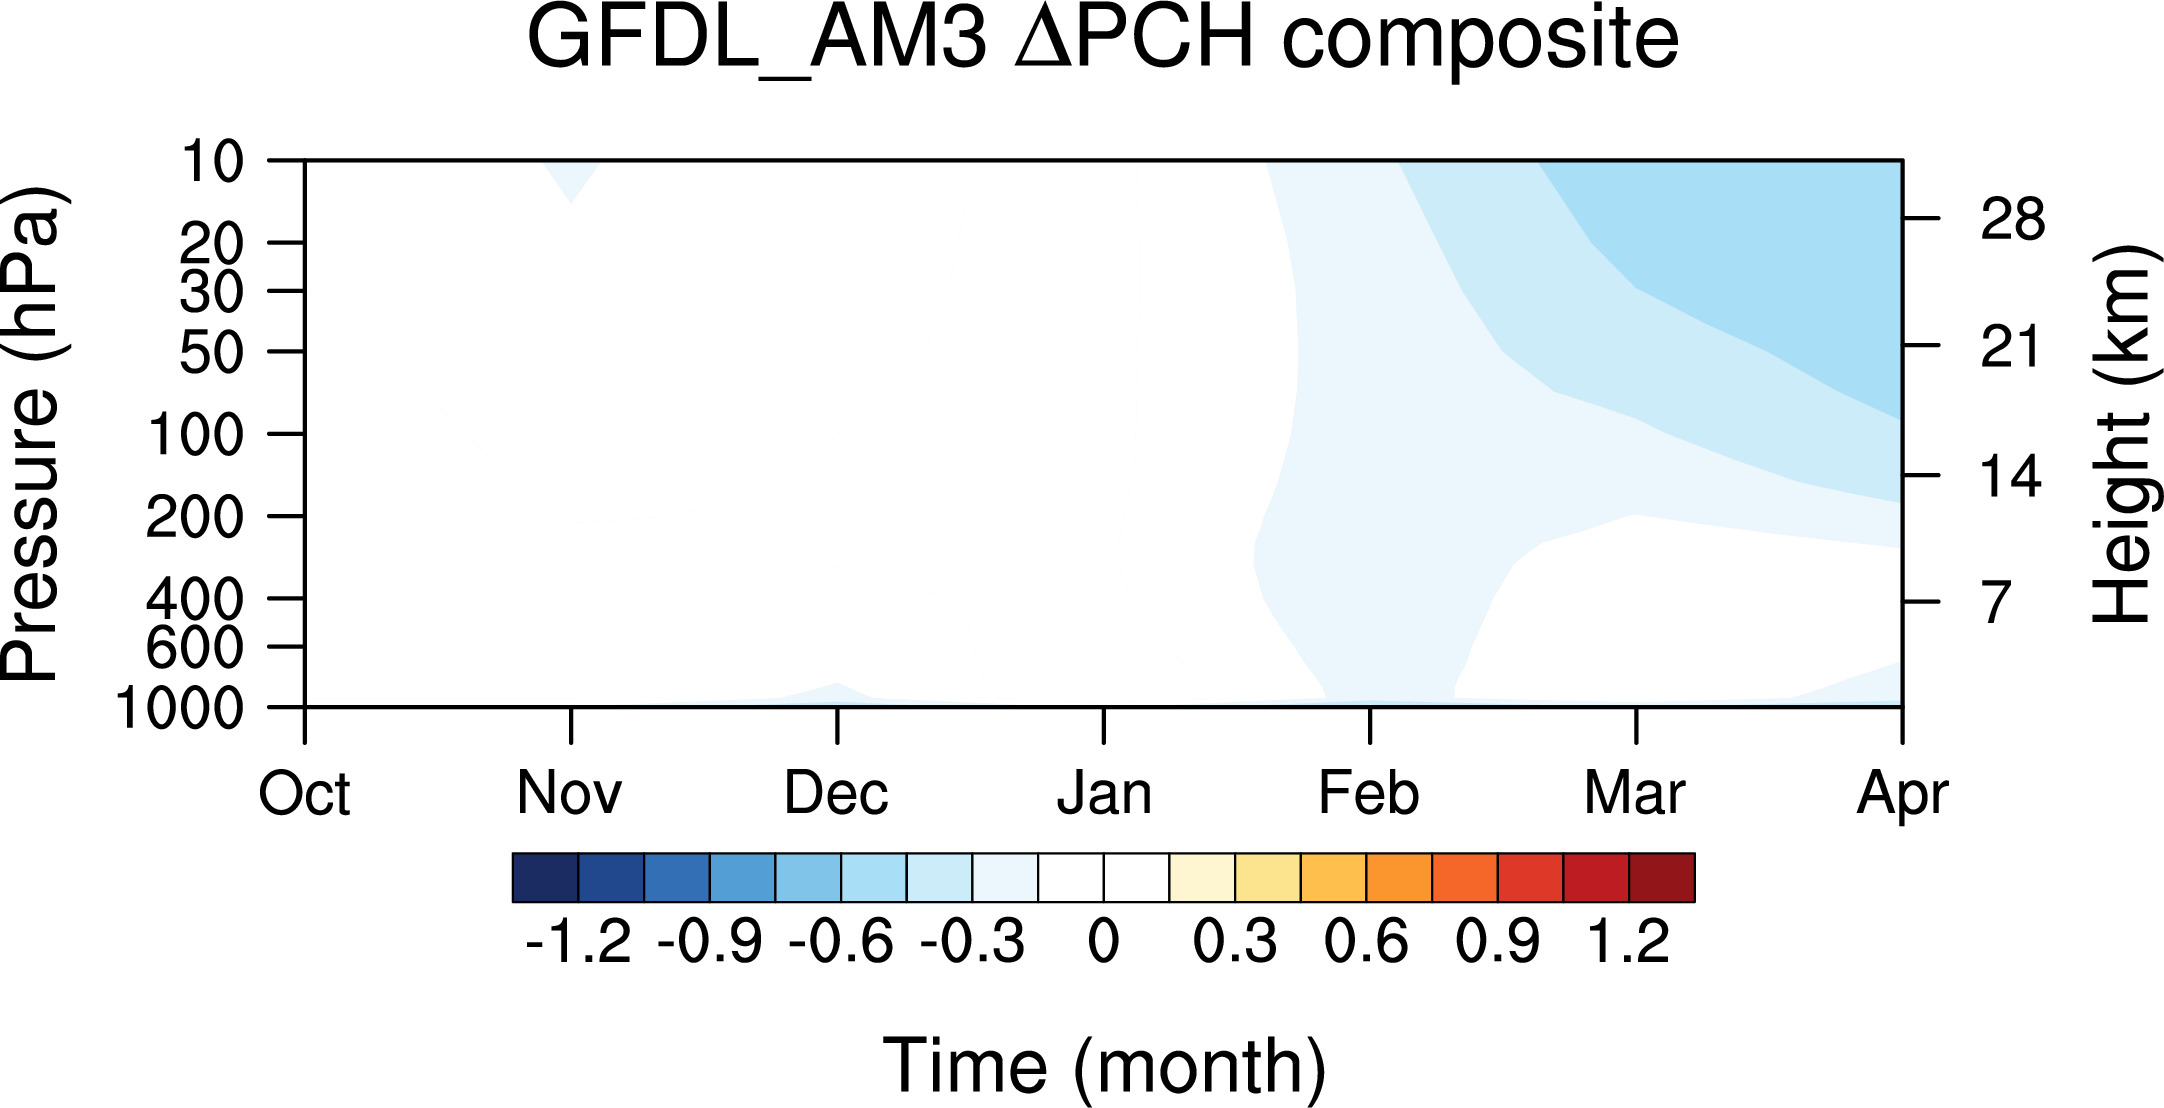
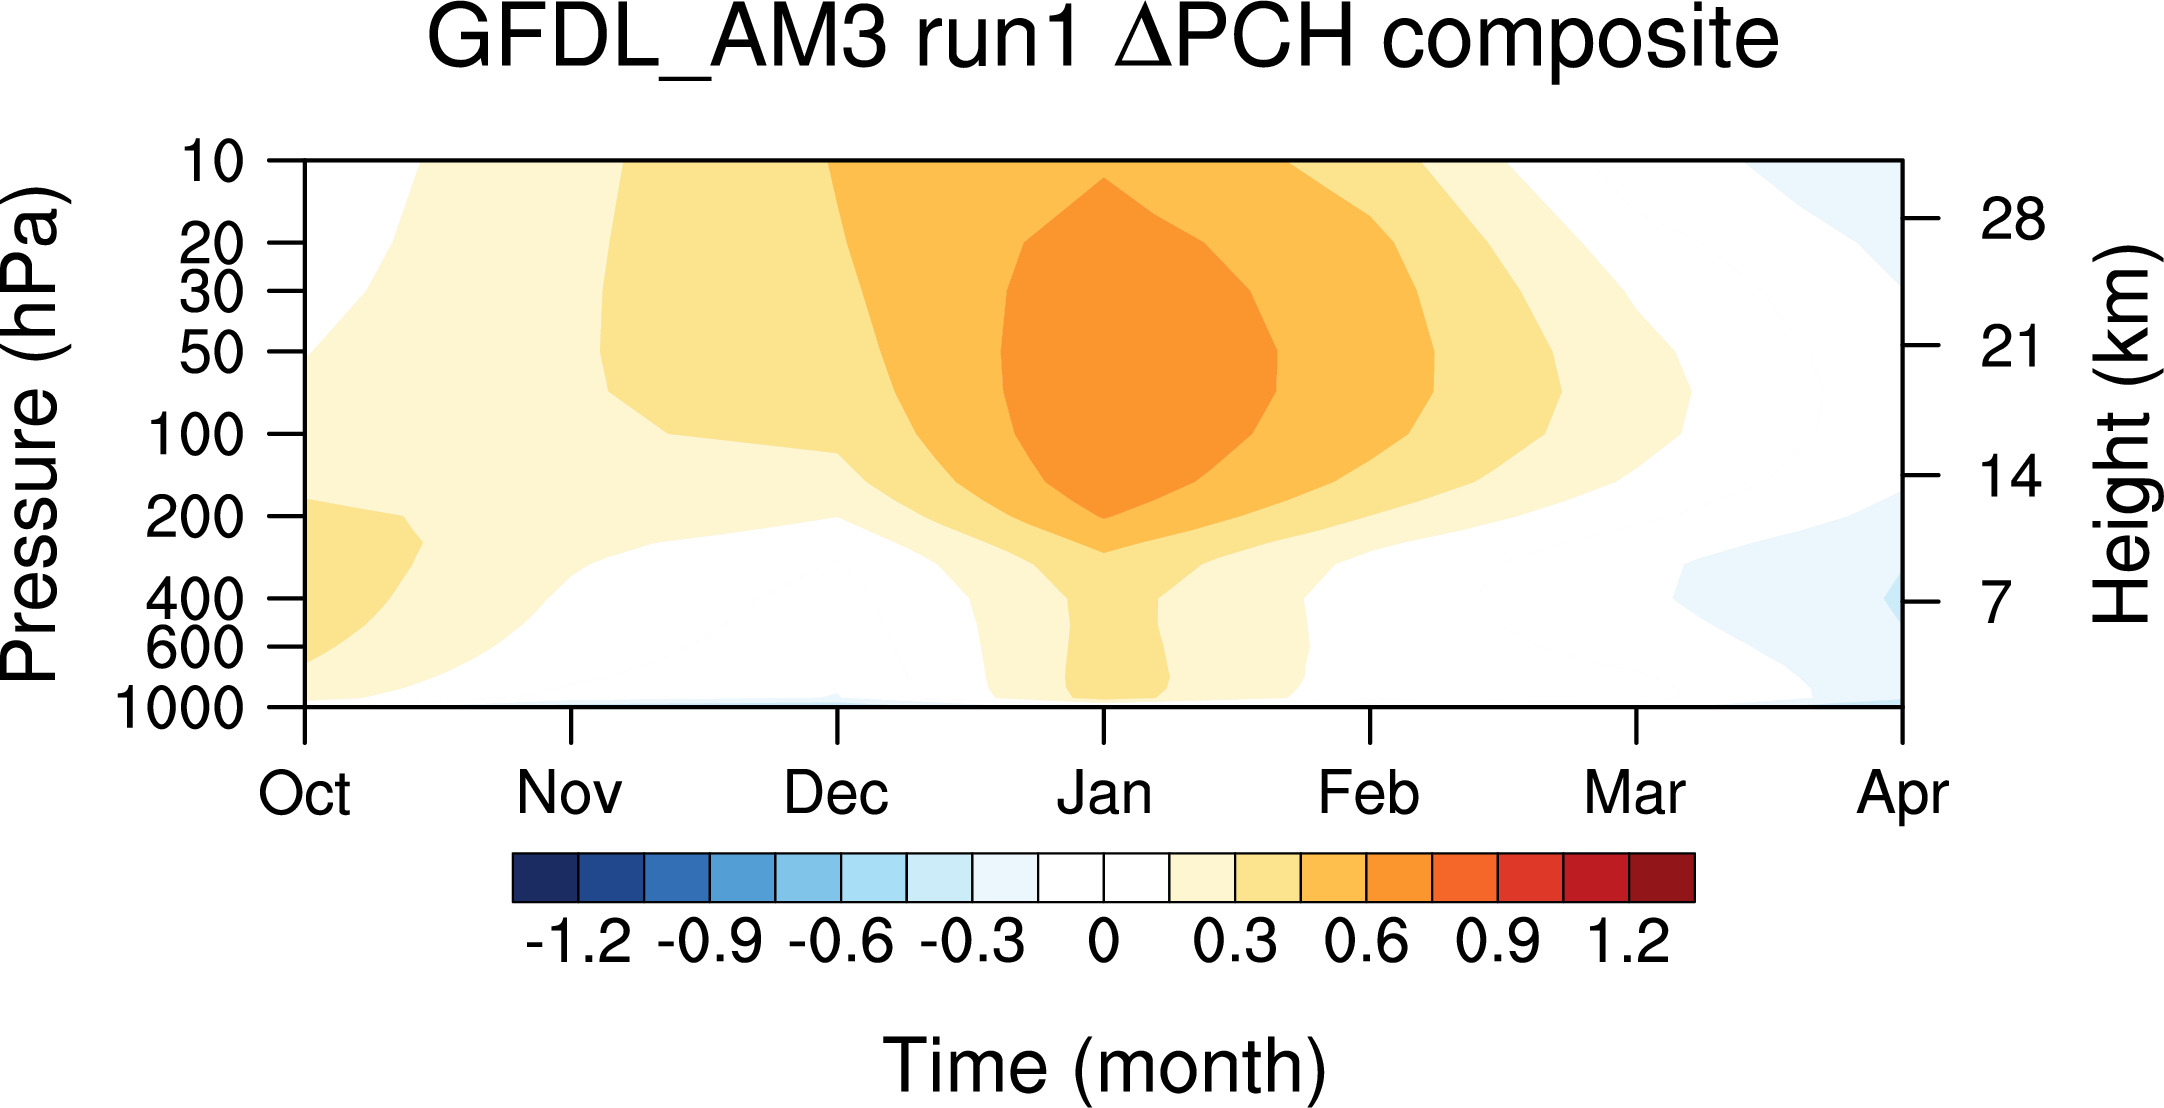
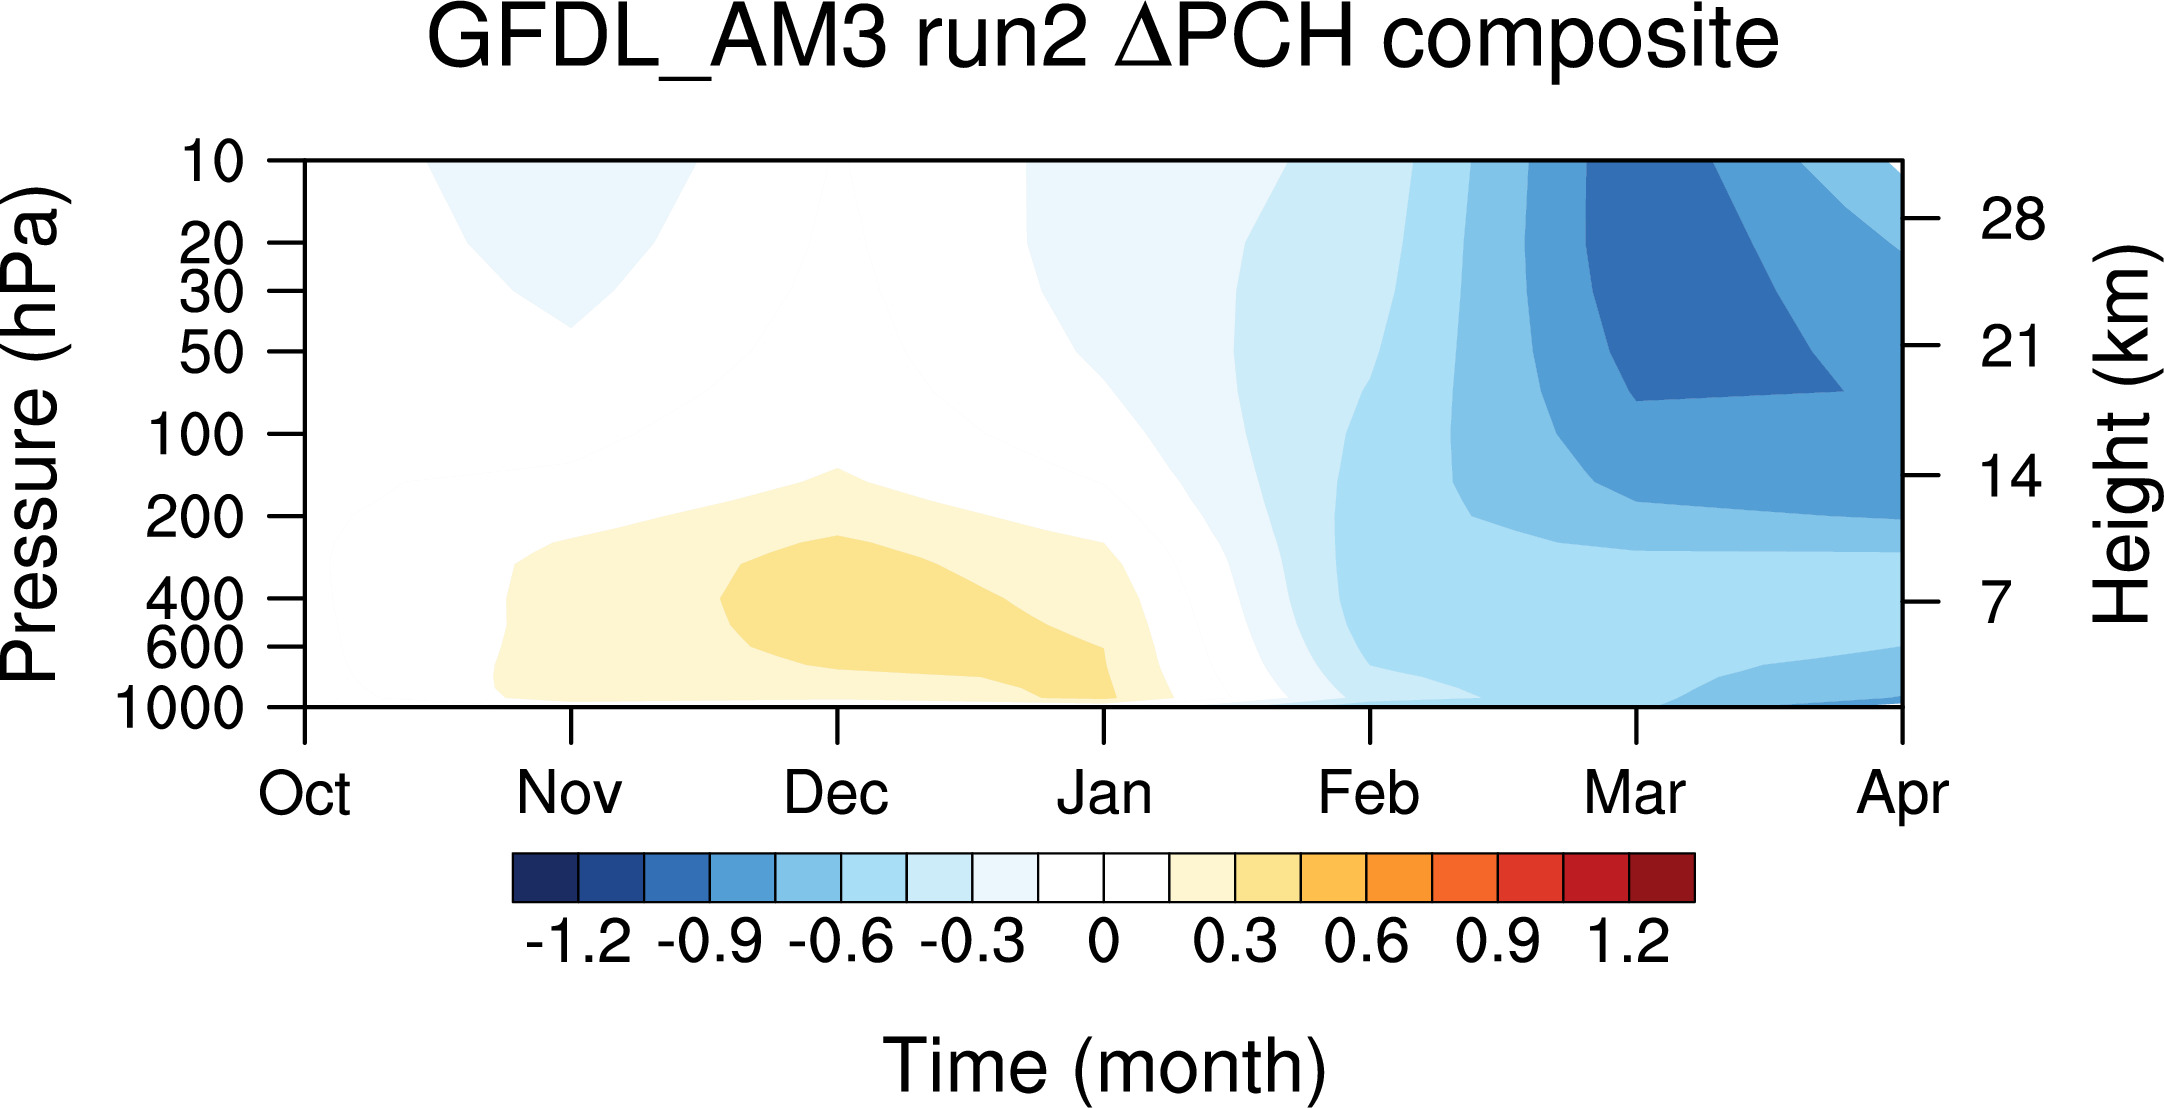
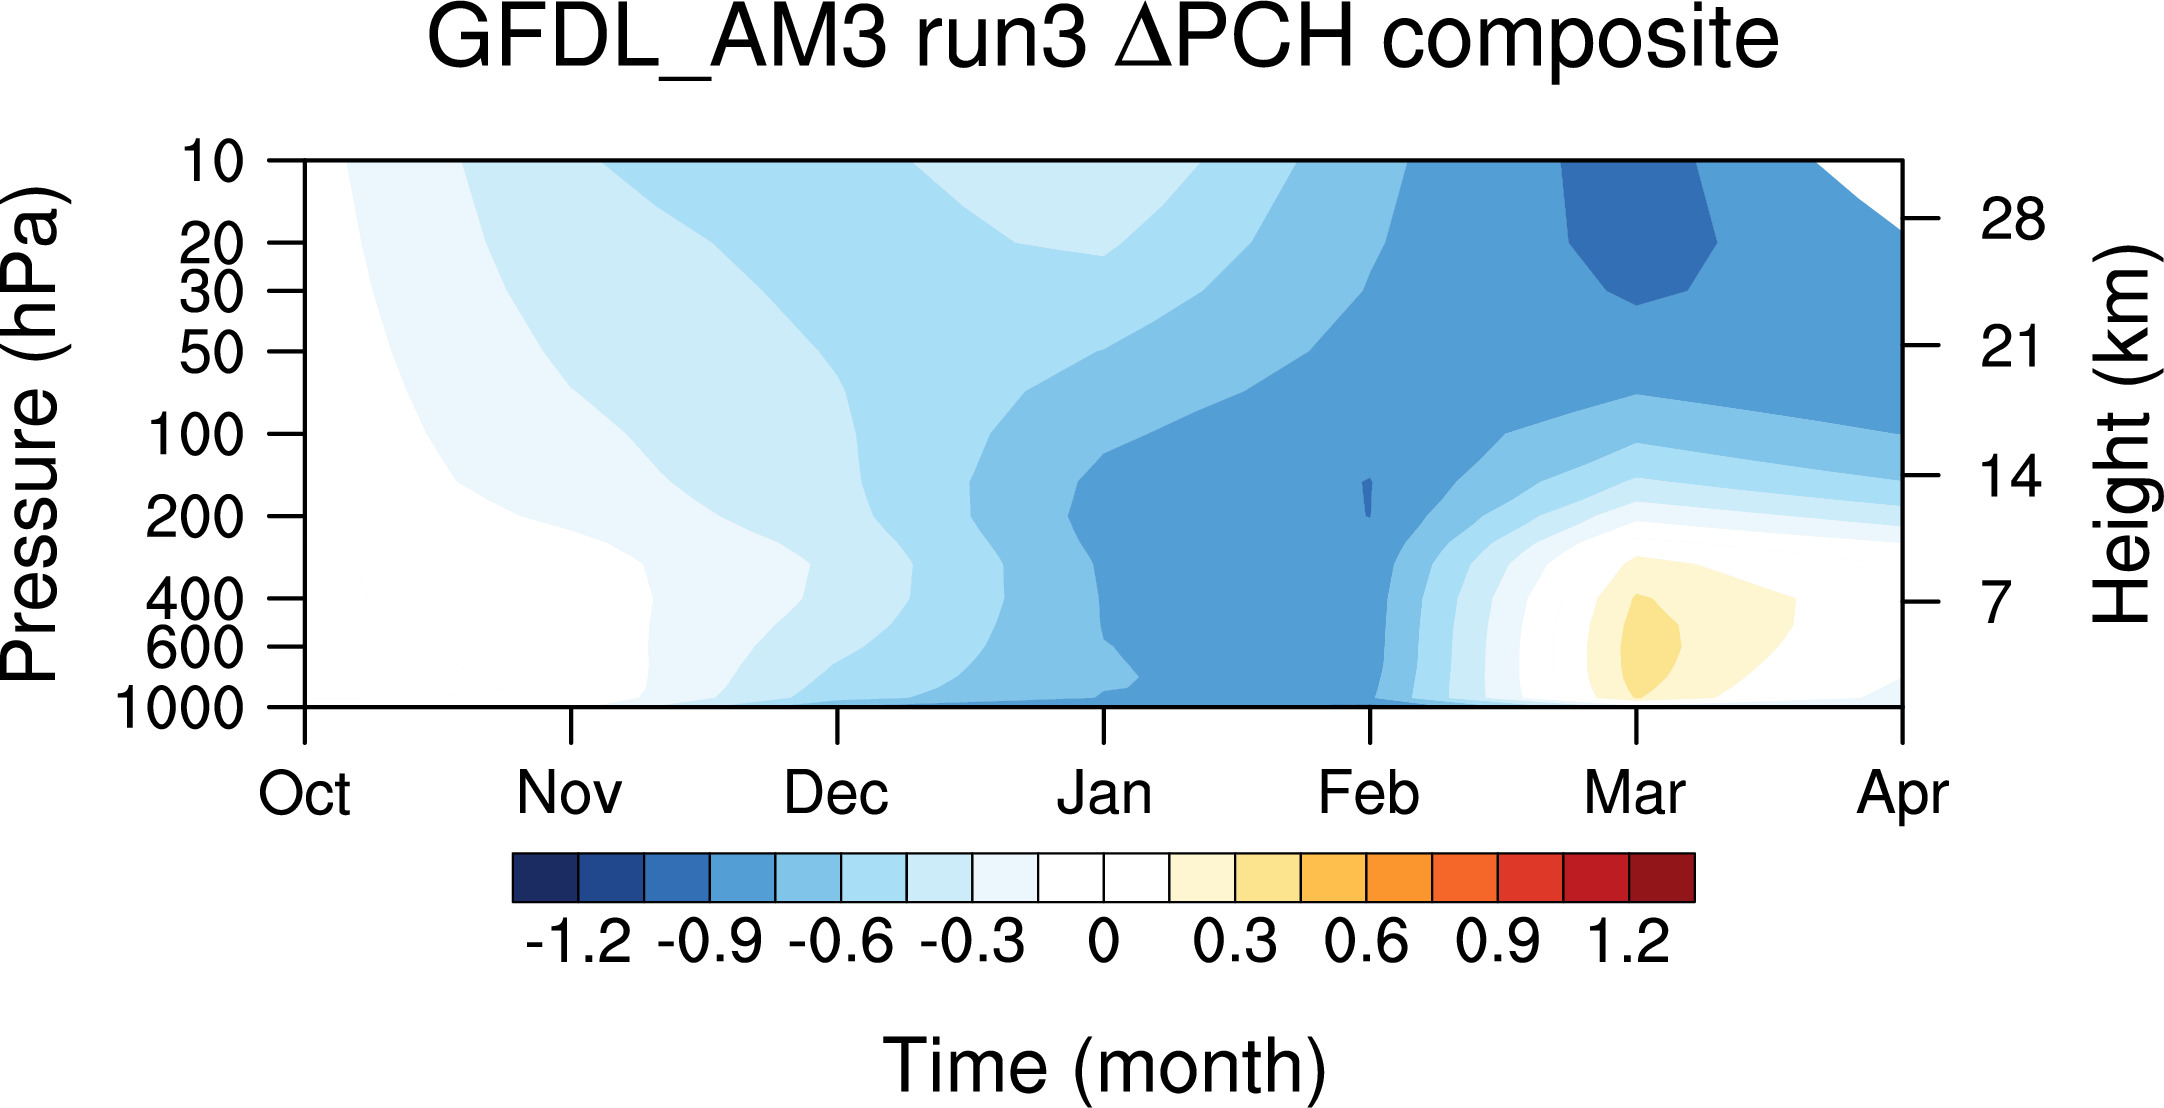
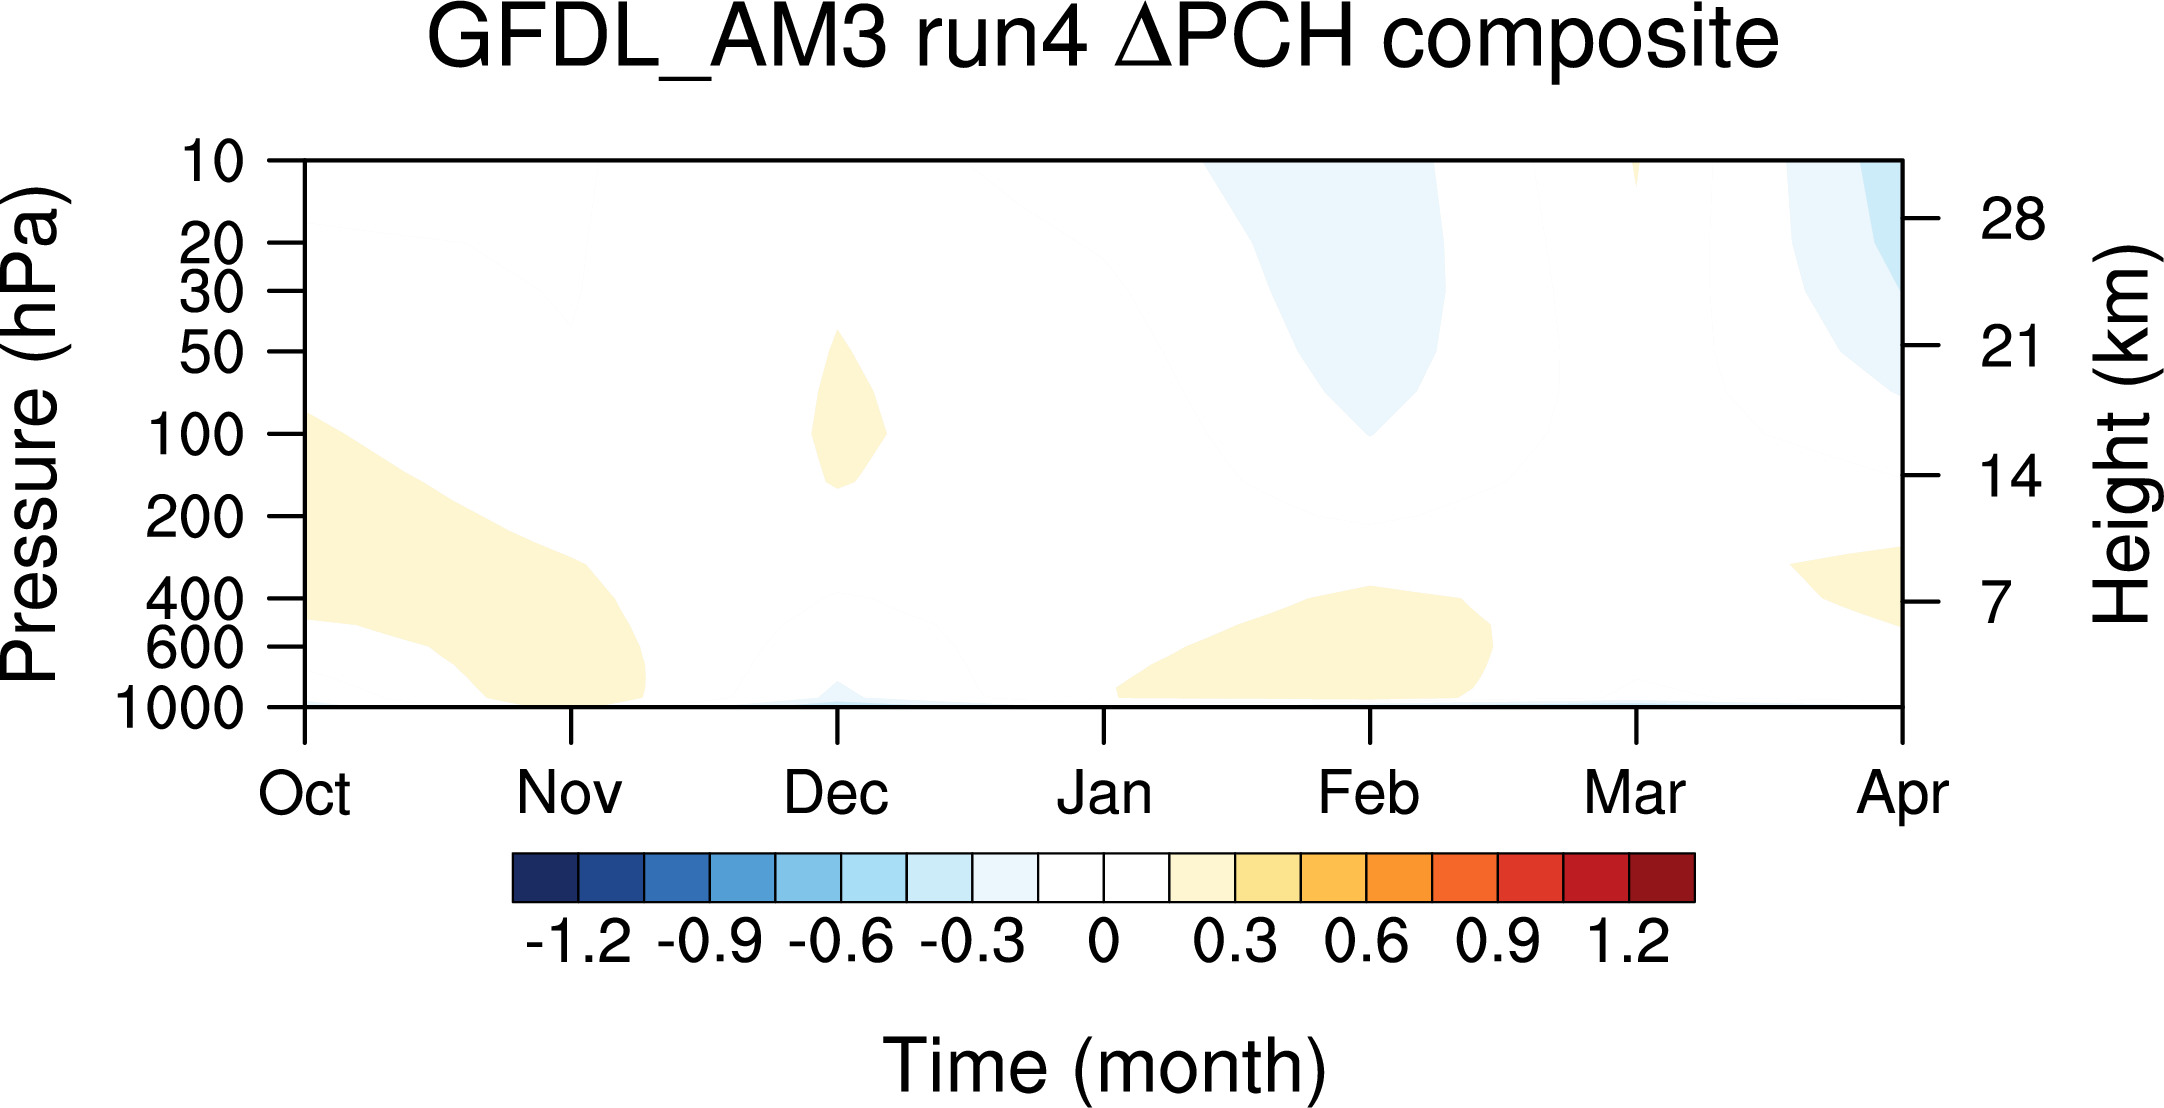
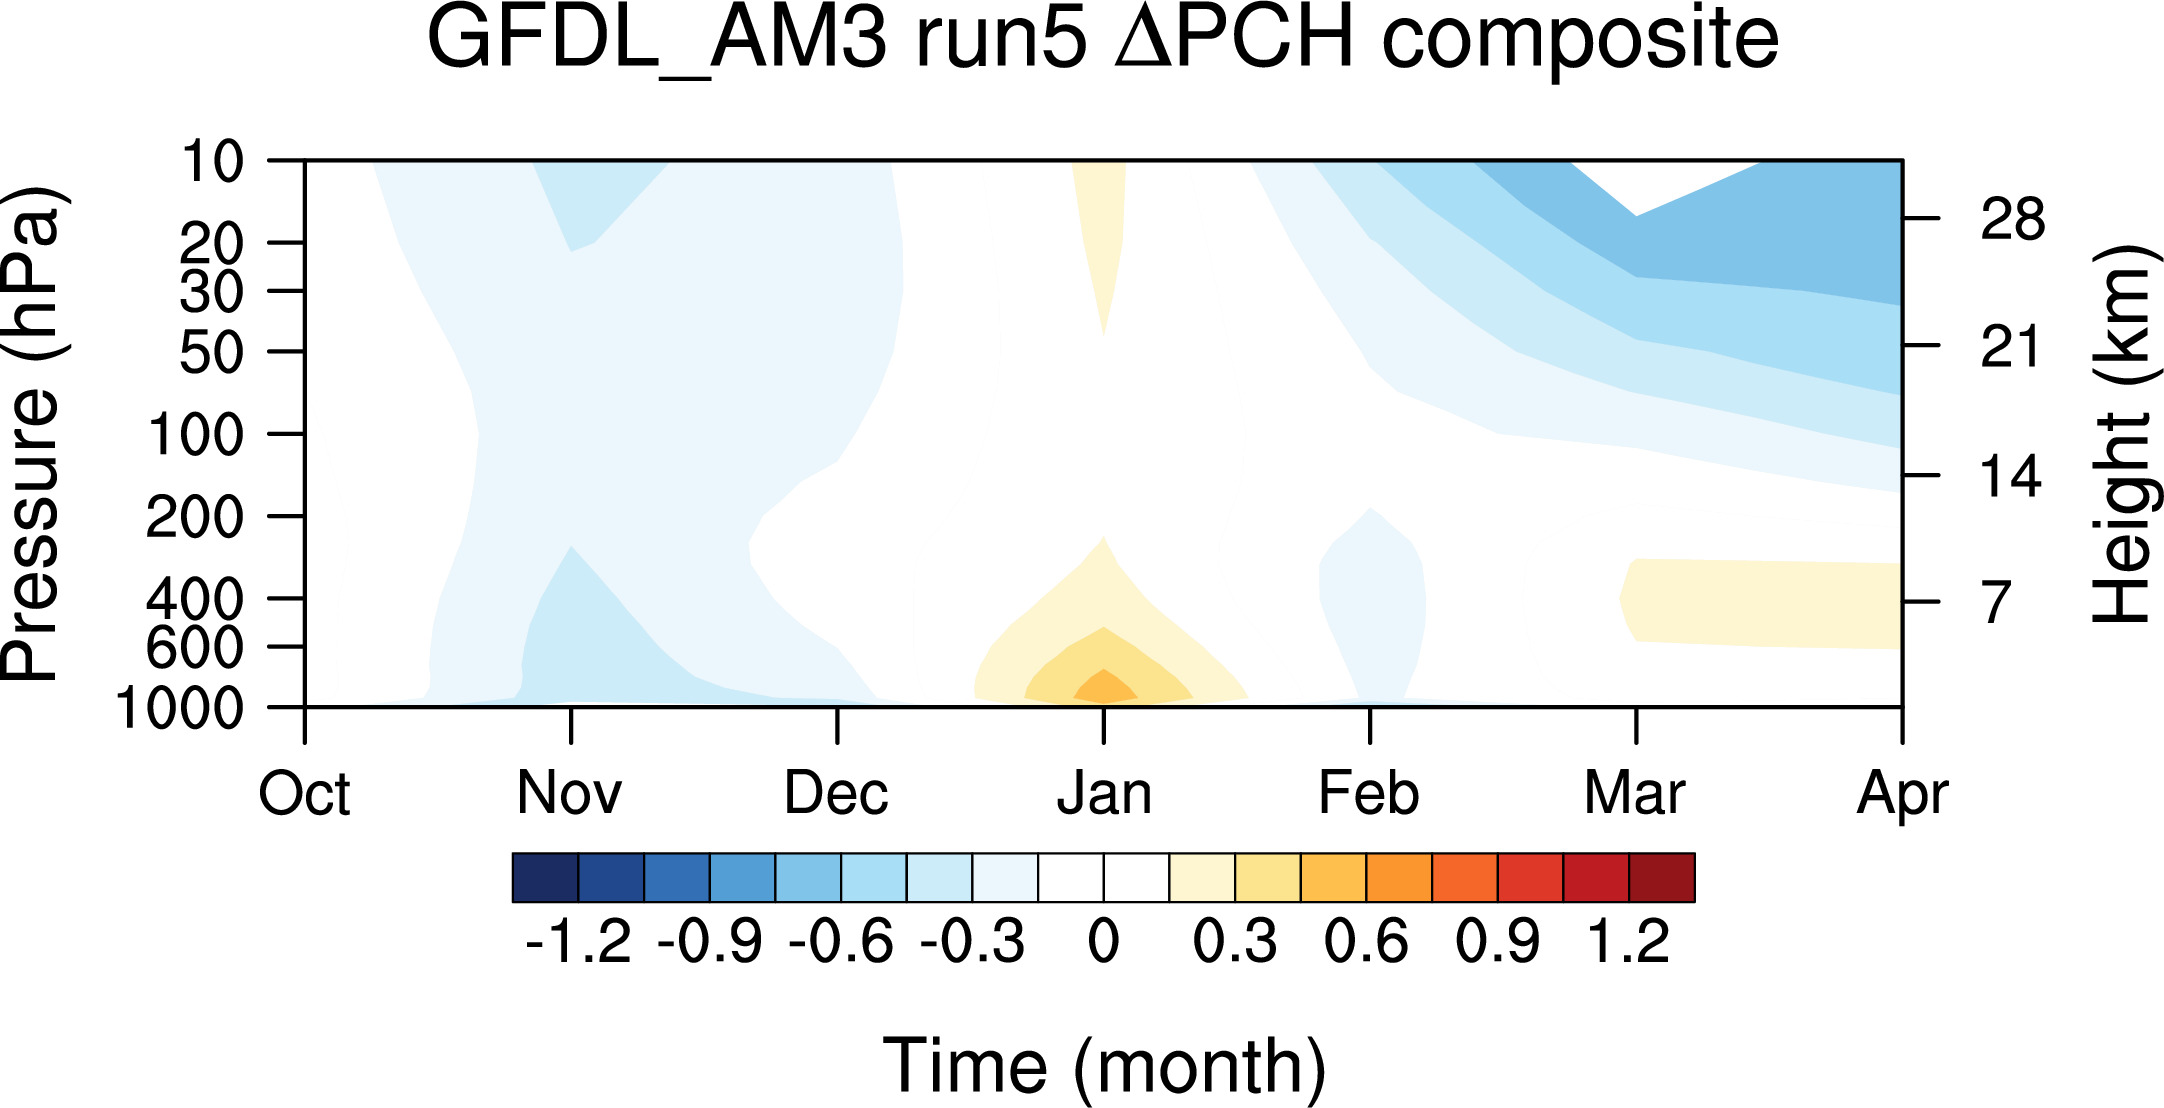
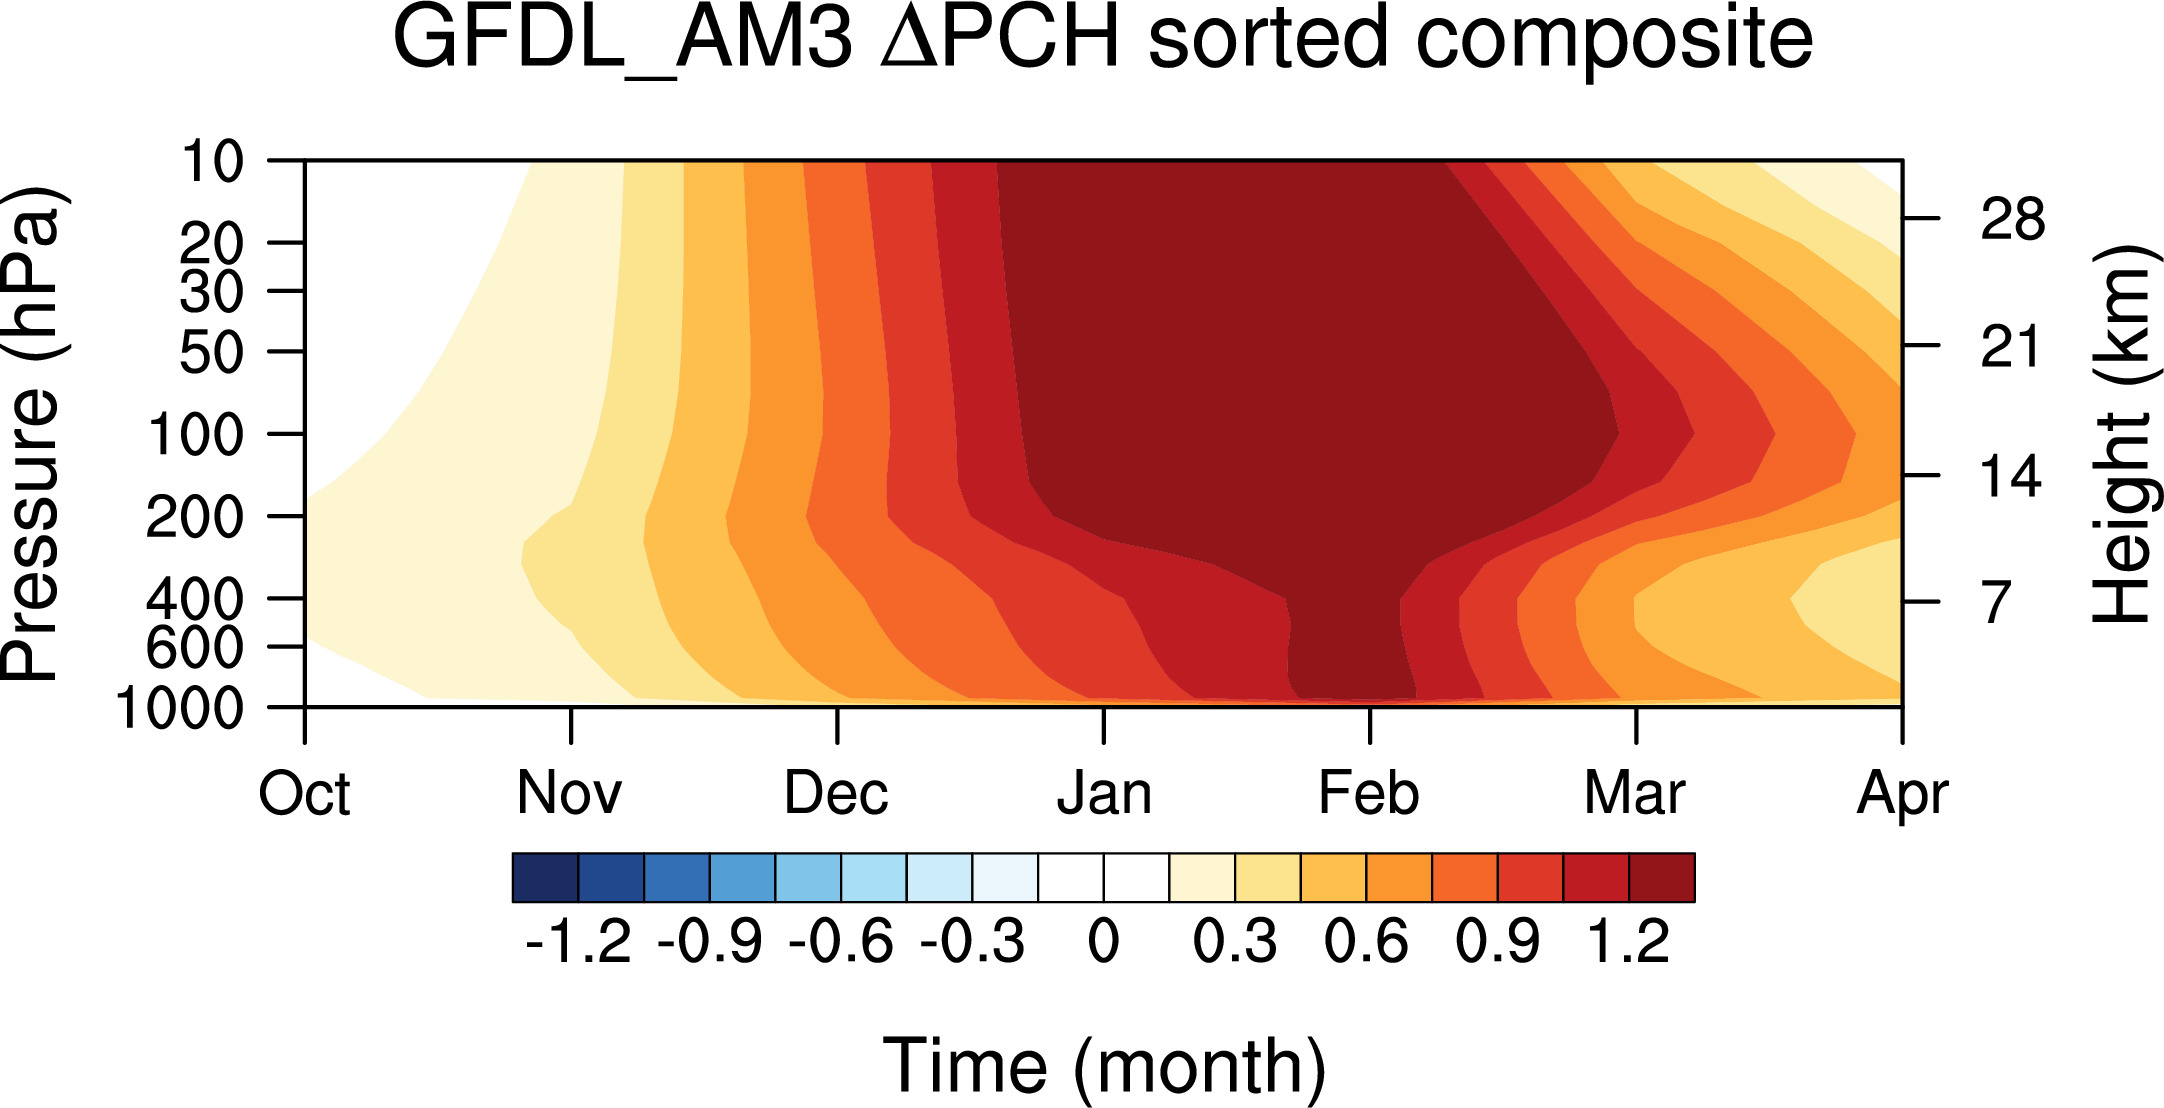
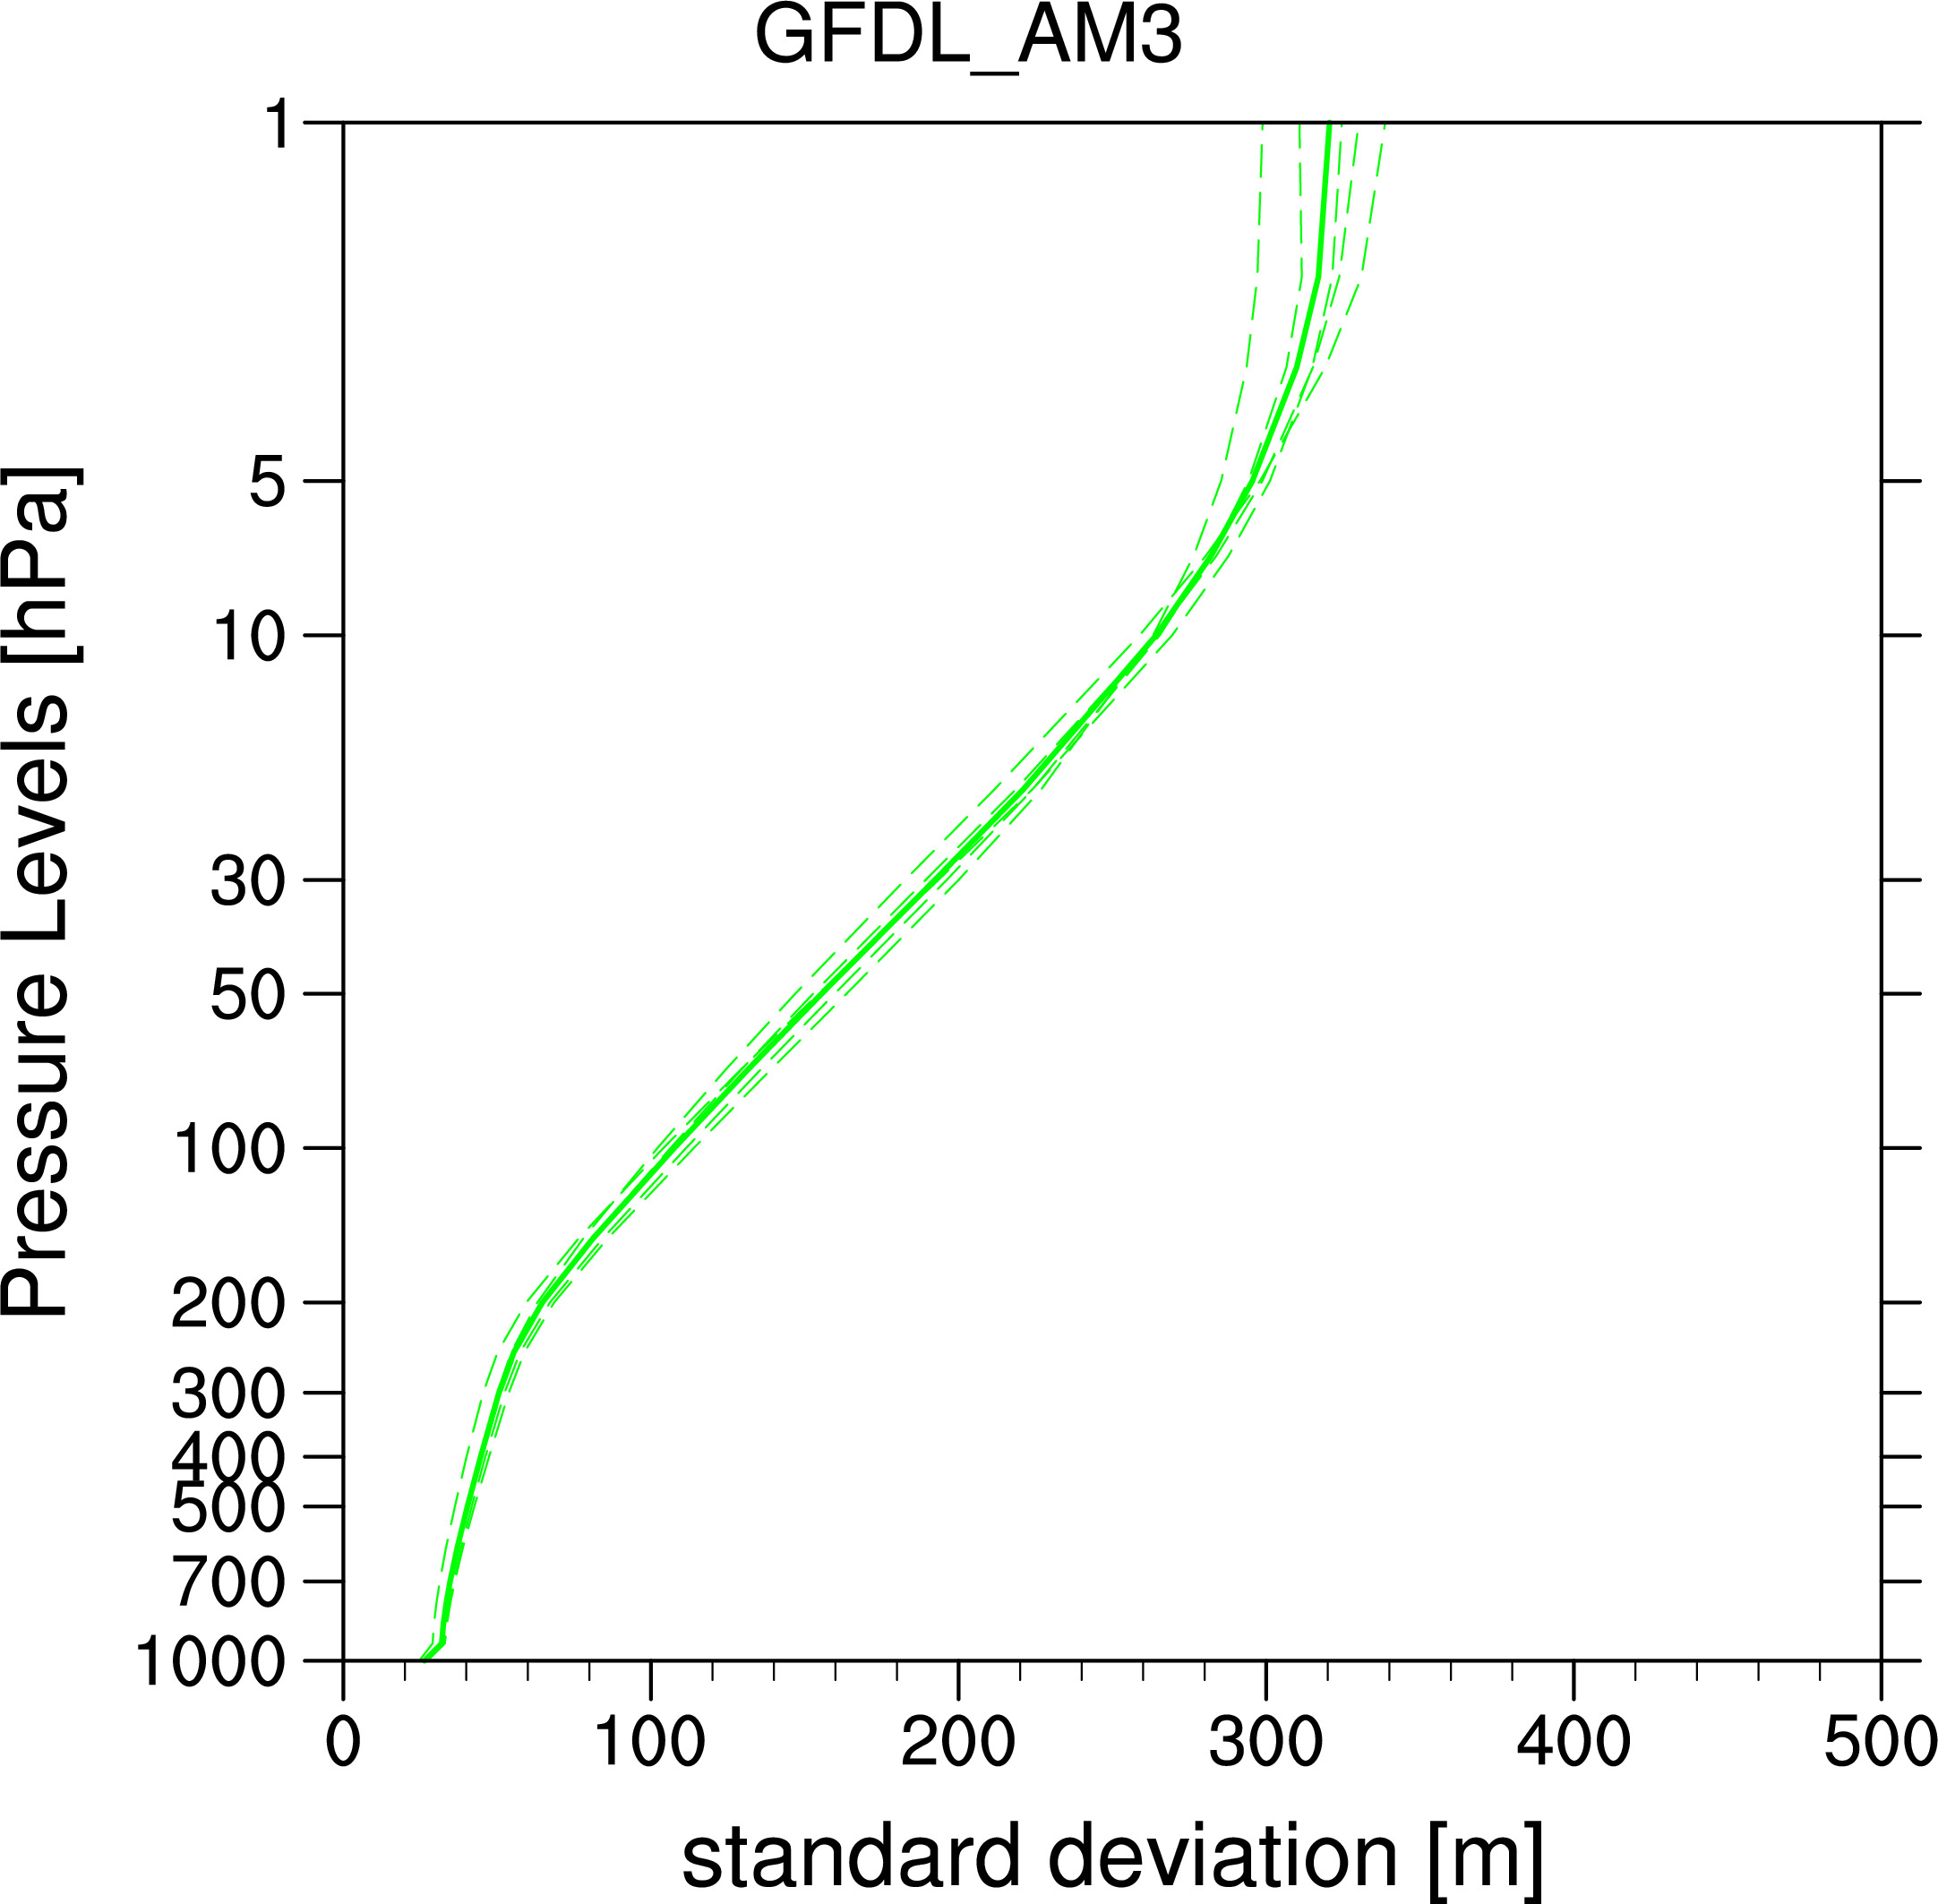 GFDL_AM3
Ensemble mean:
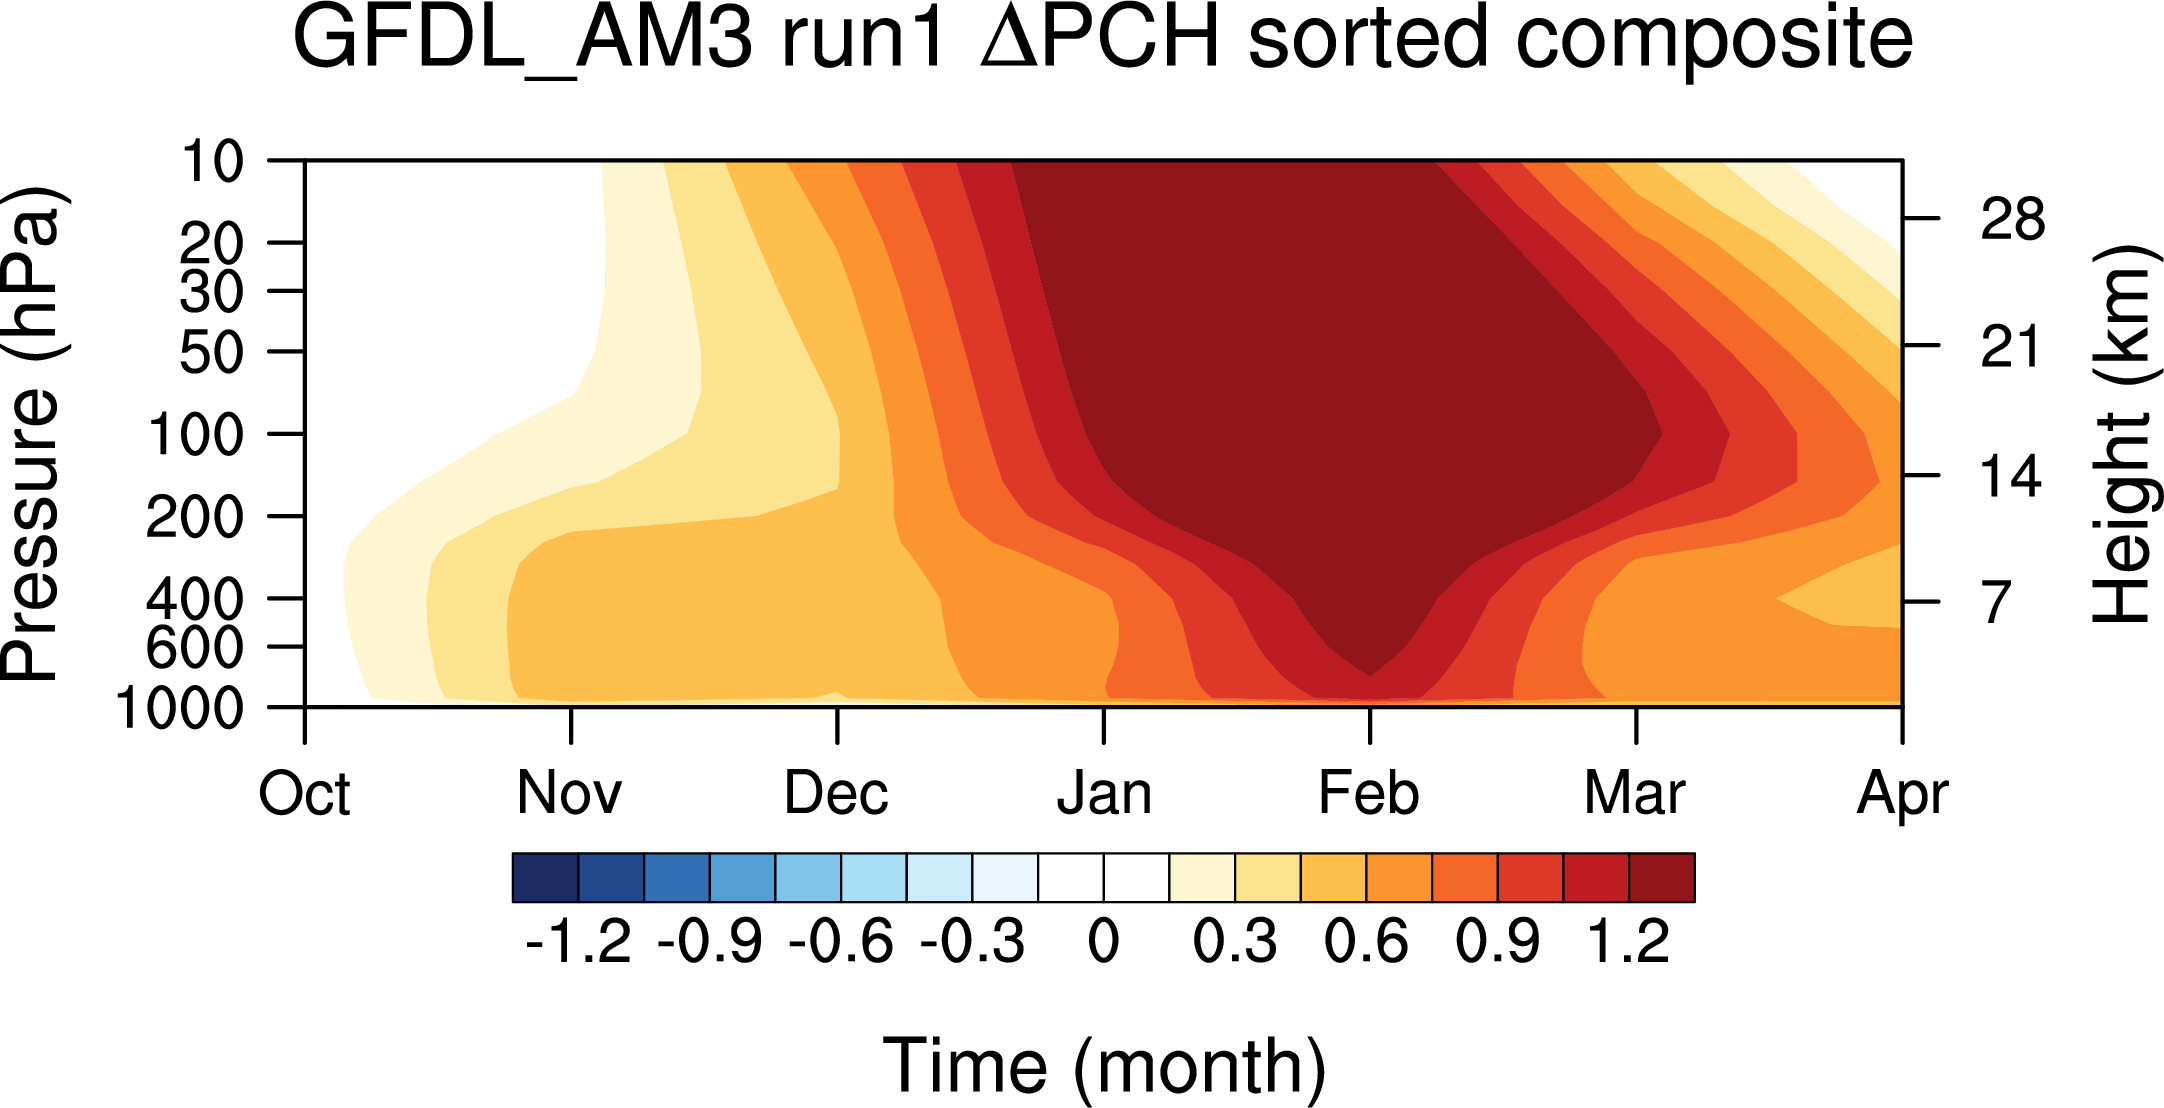
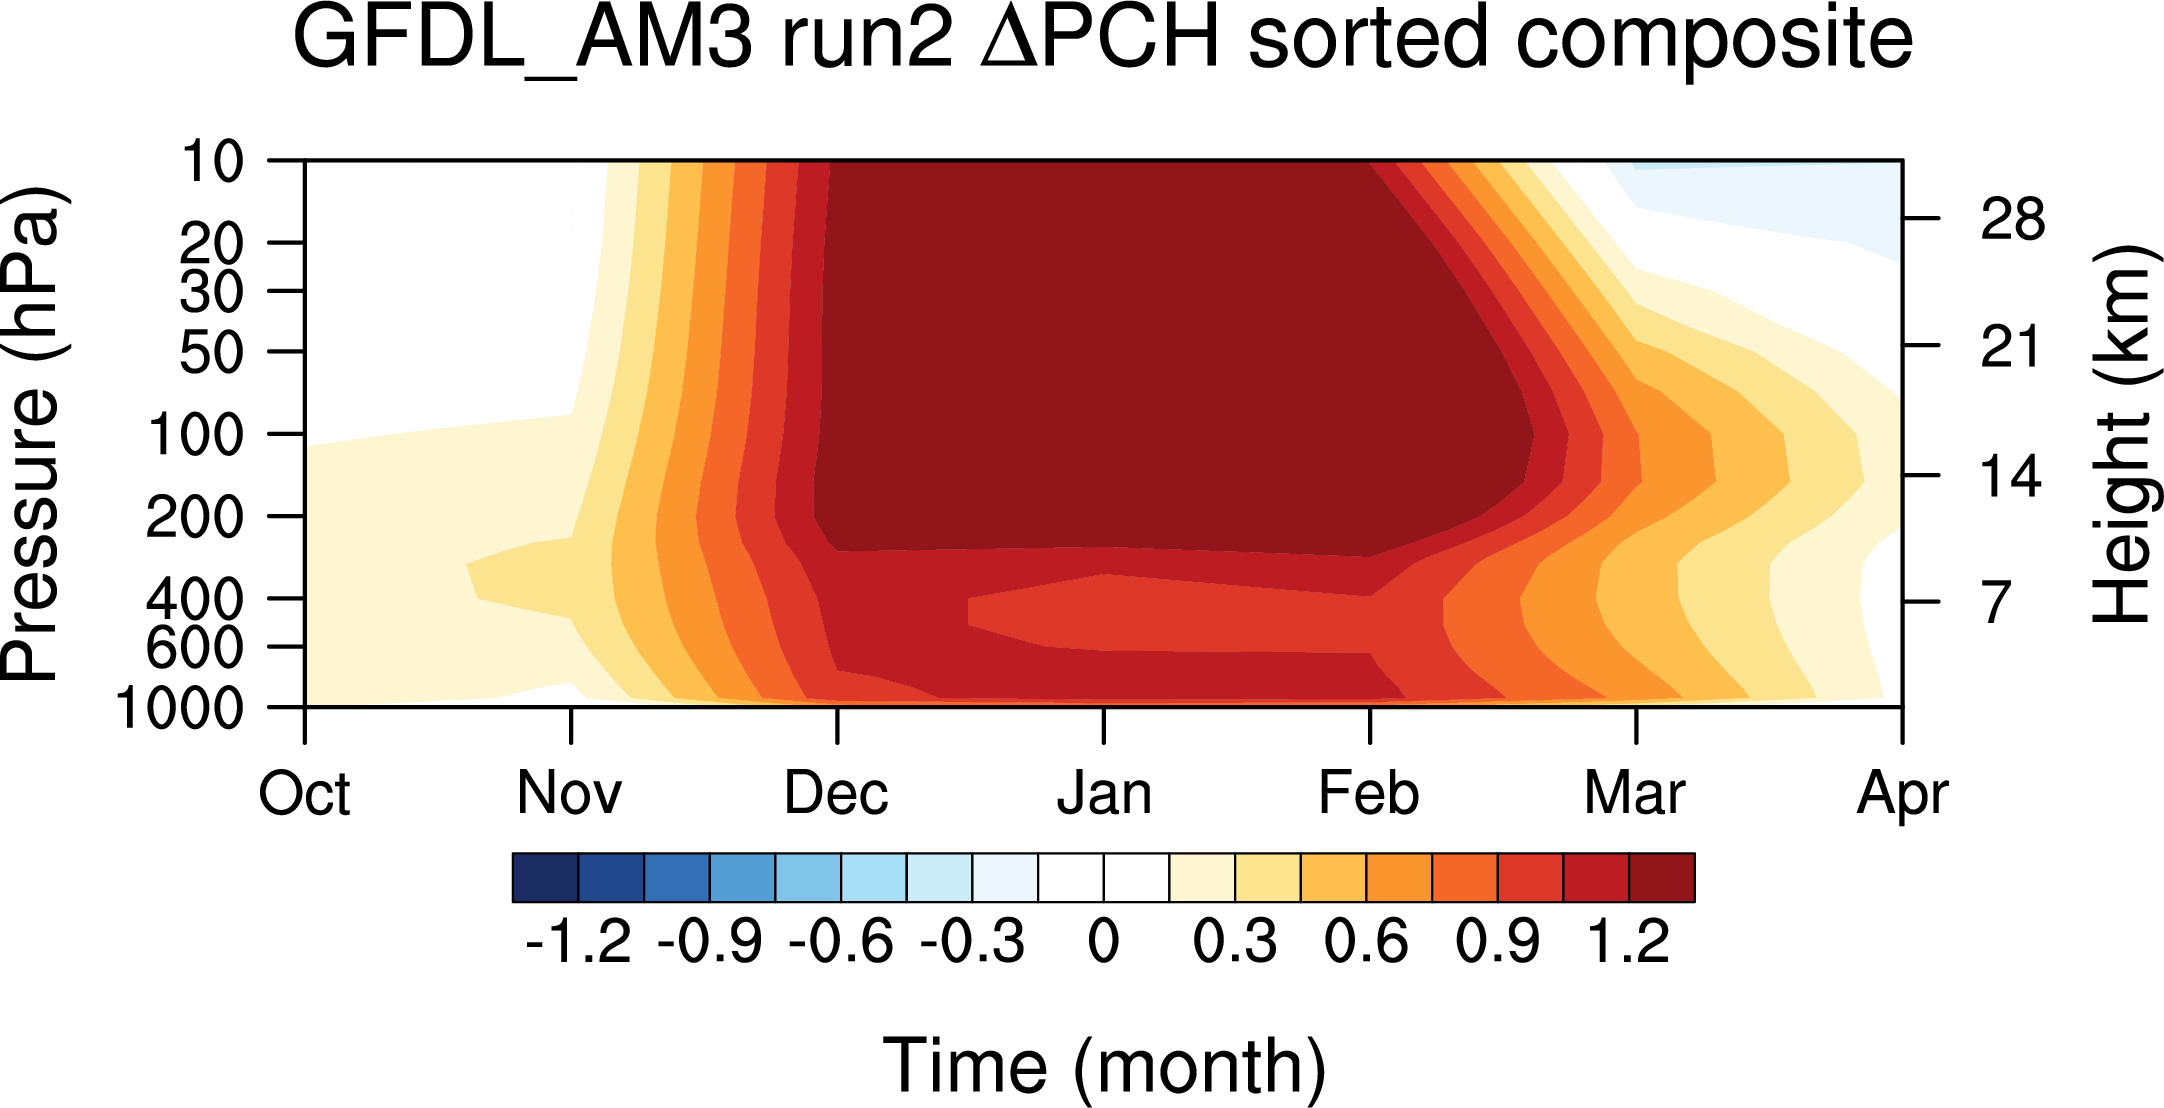
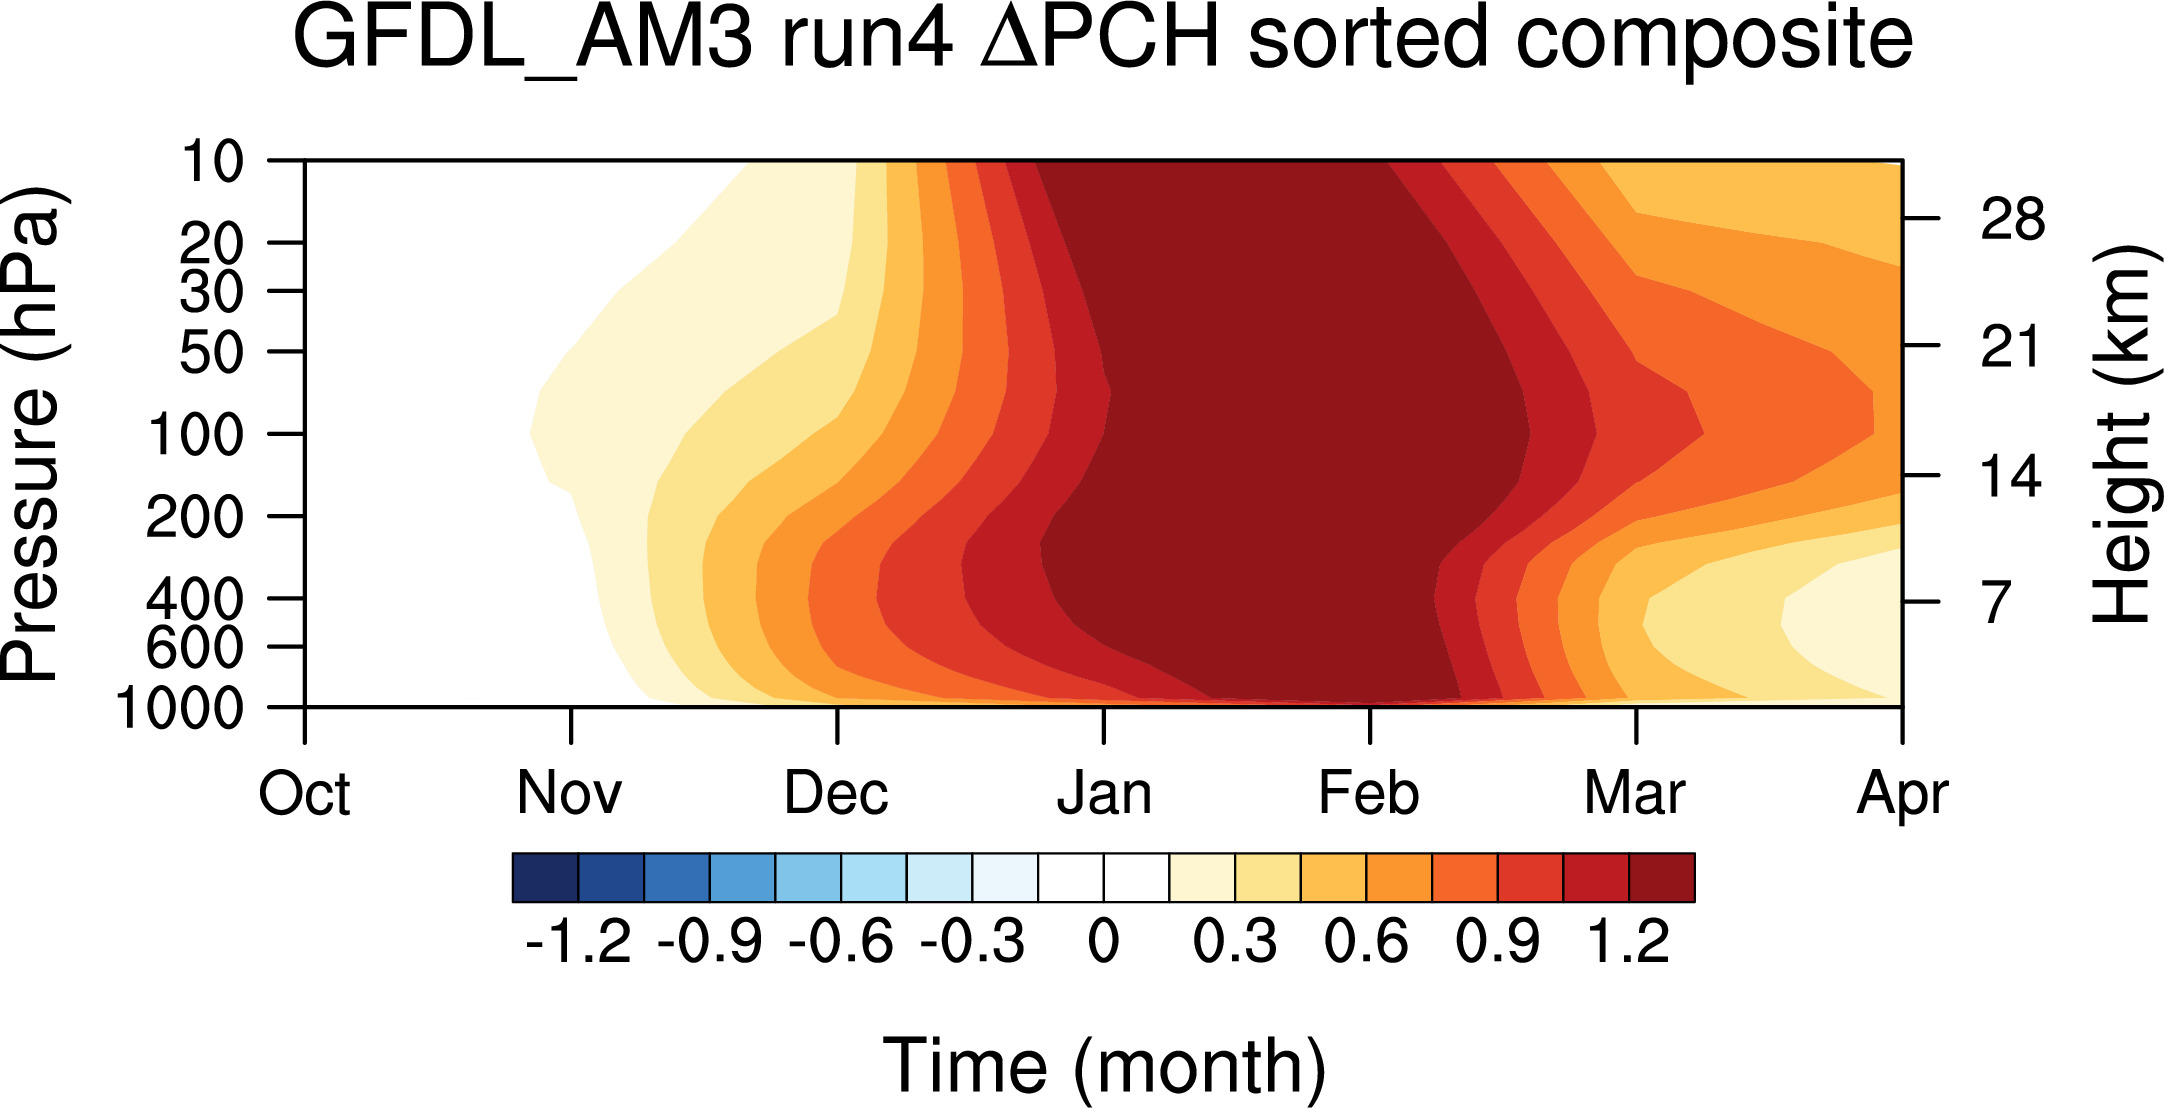
Individual Runs:
-----
Special case Sorted on largest values of Jan Feb mean at 50hPa
Ensemble mean:
Individual Runs:

------------------------------------------------------------------------------------------------------------
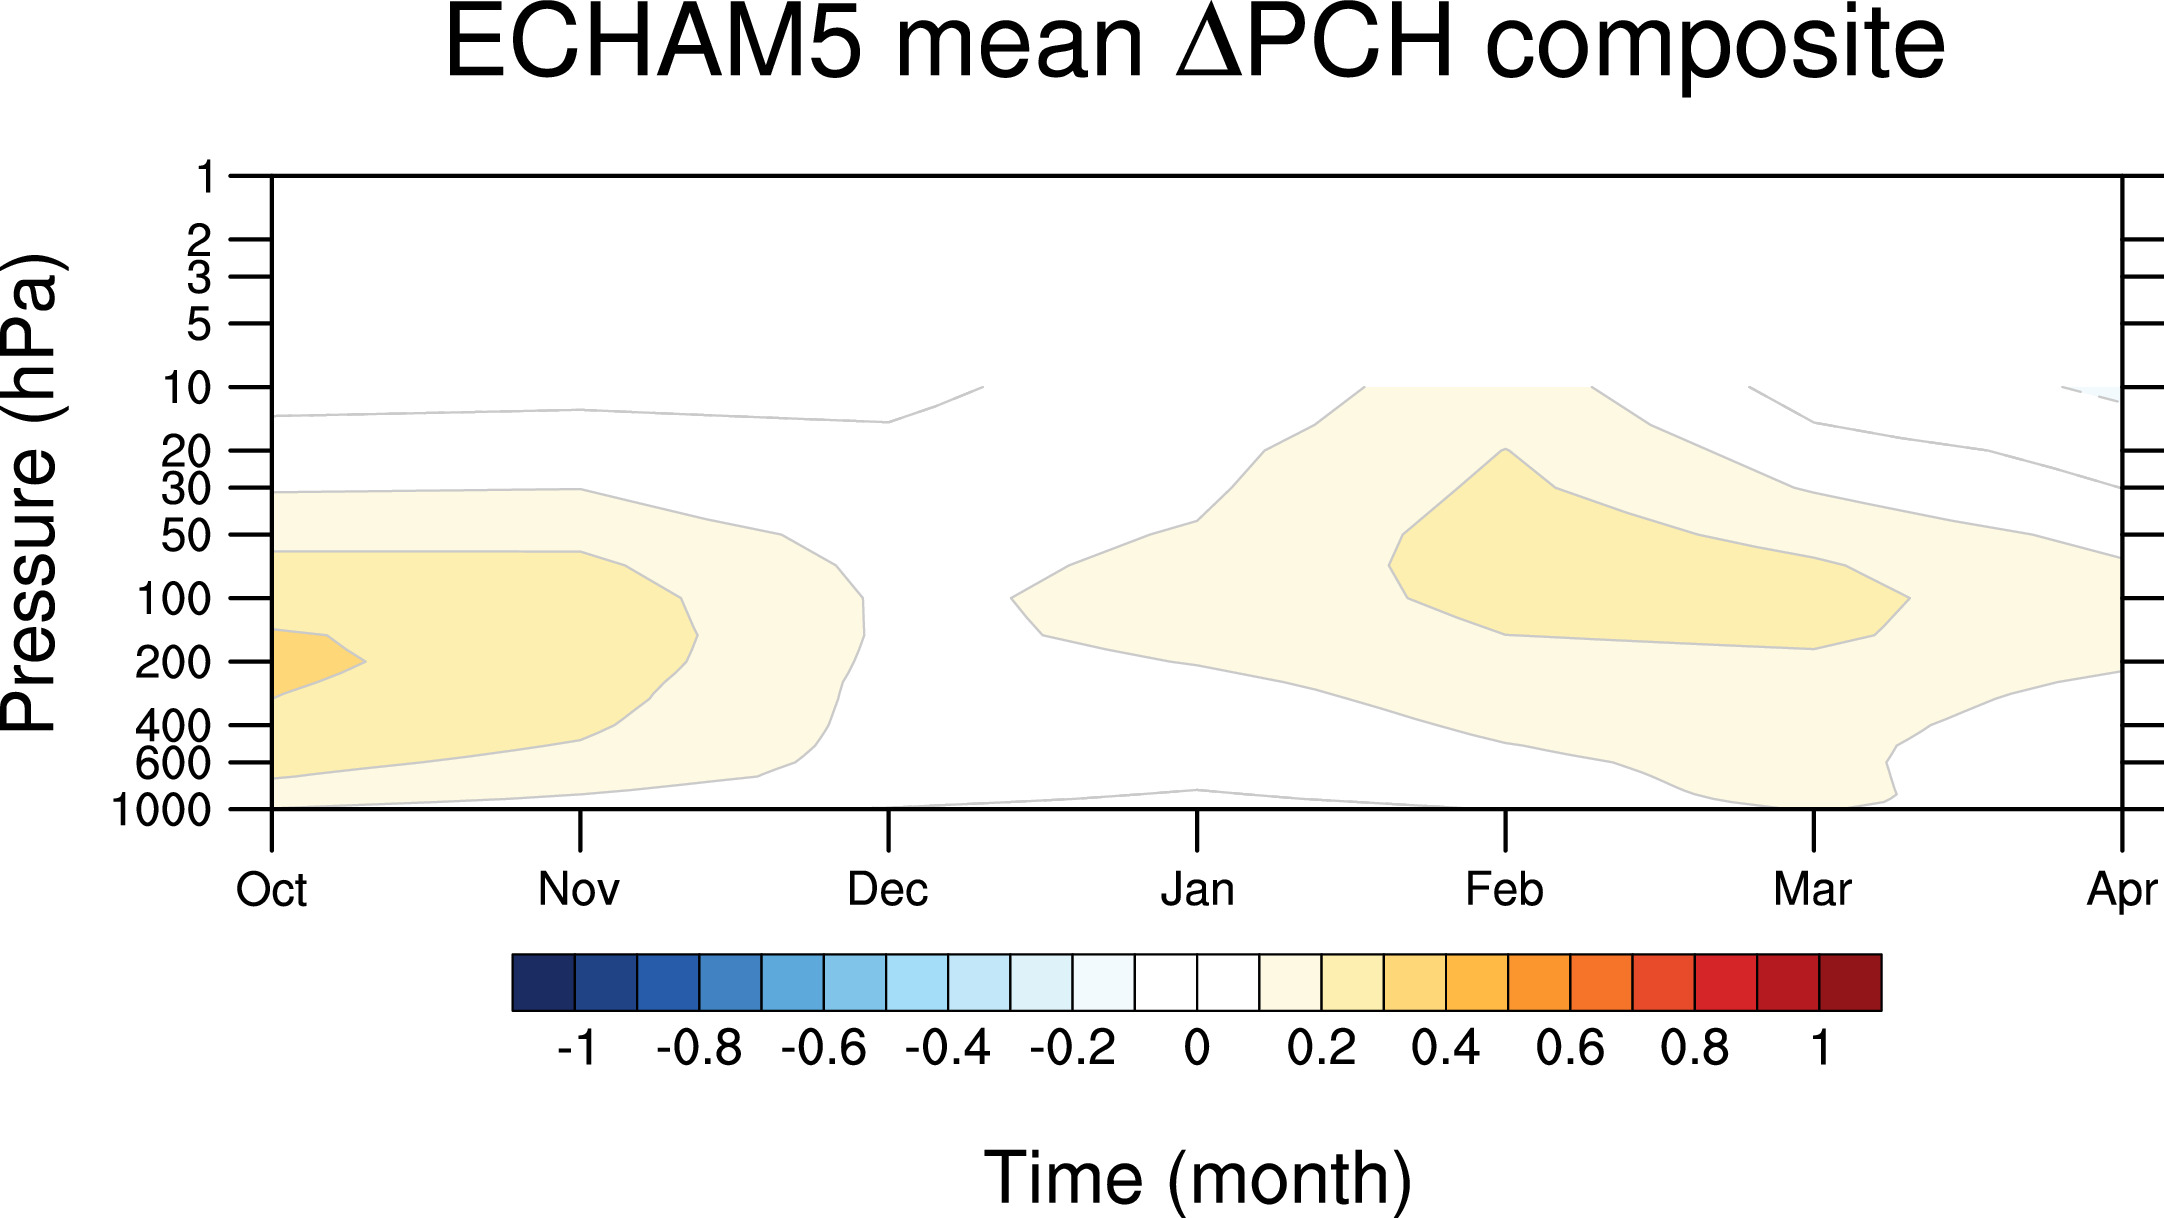
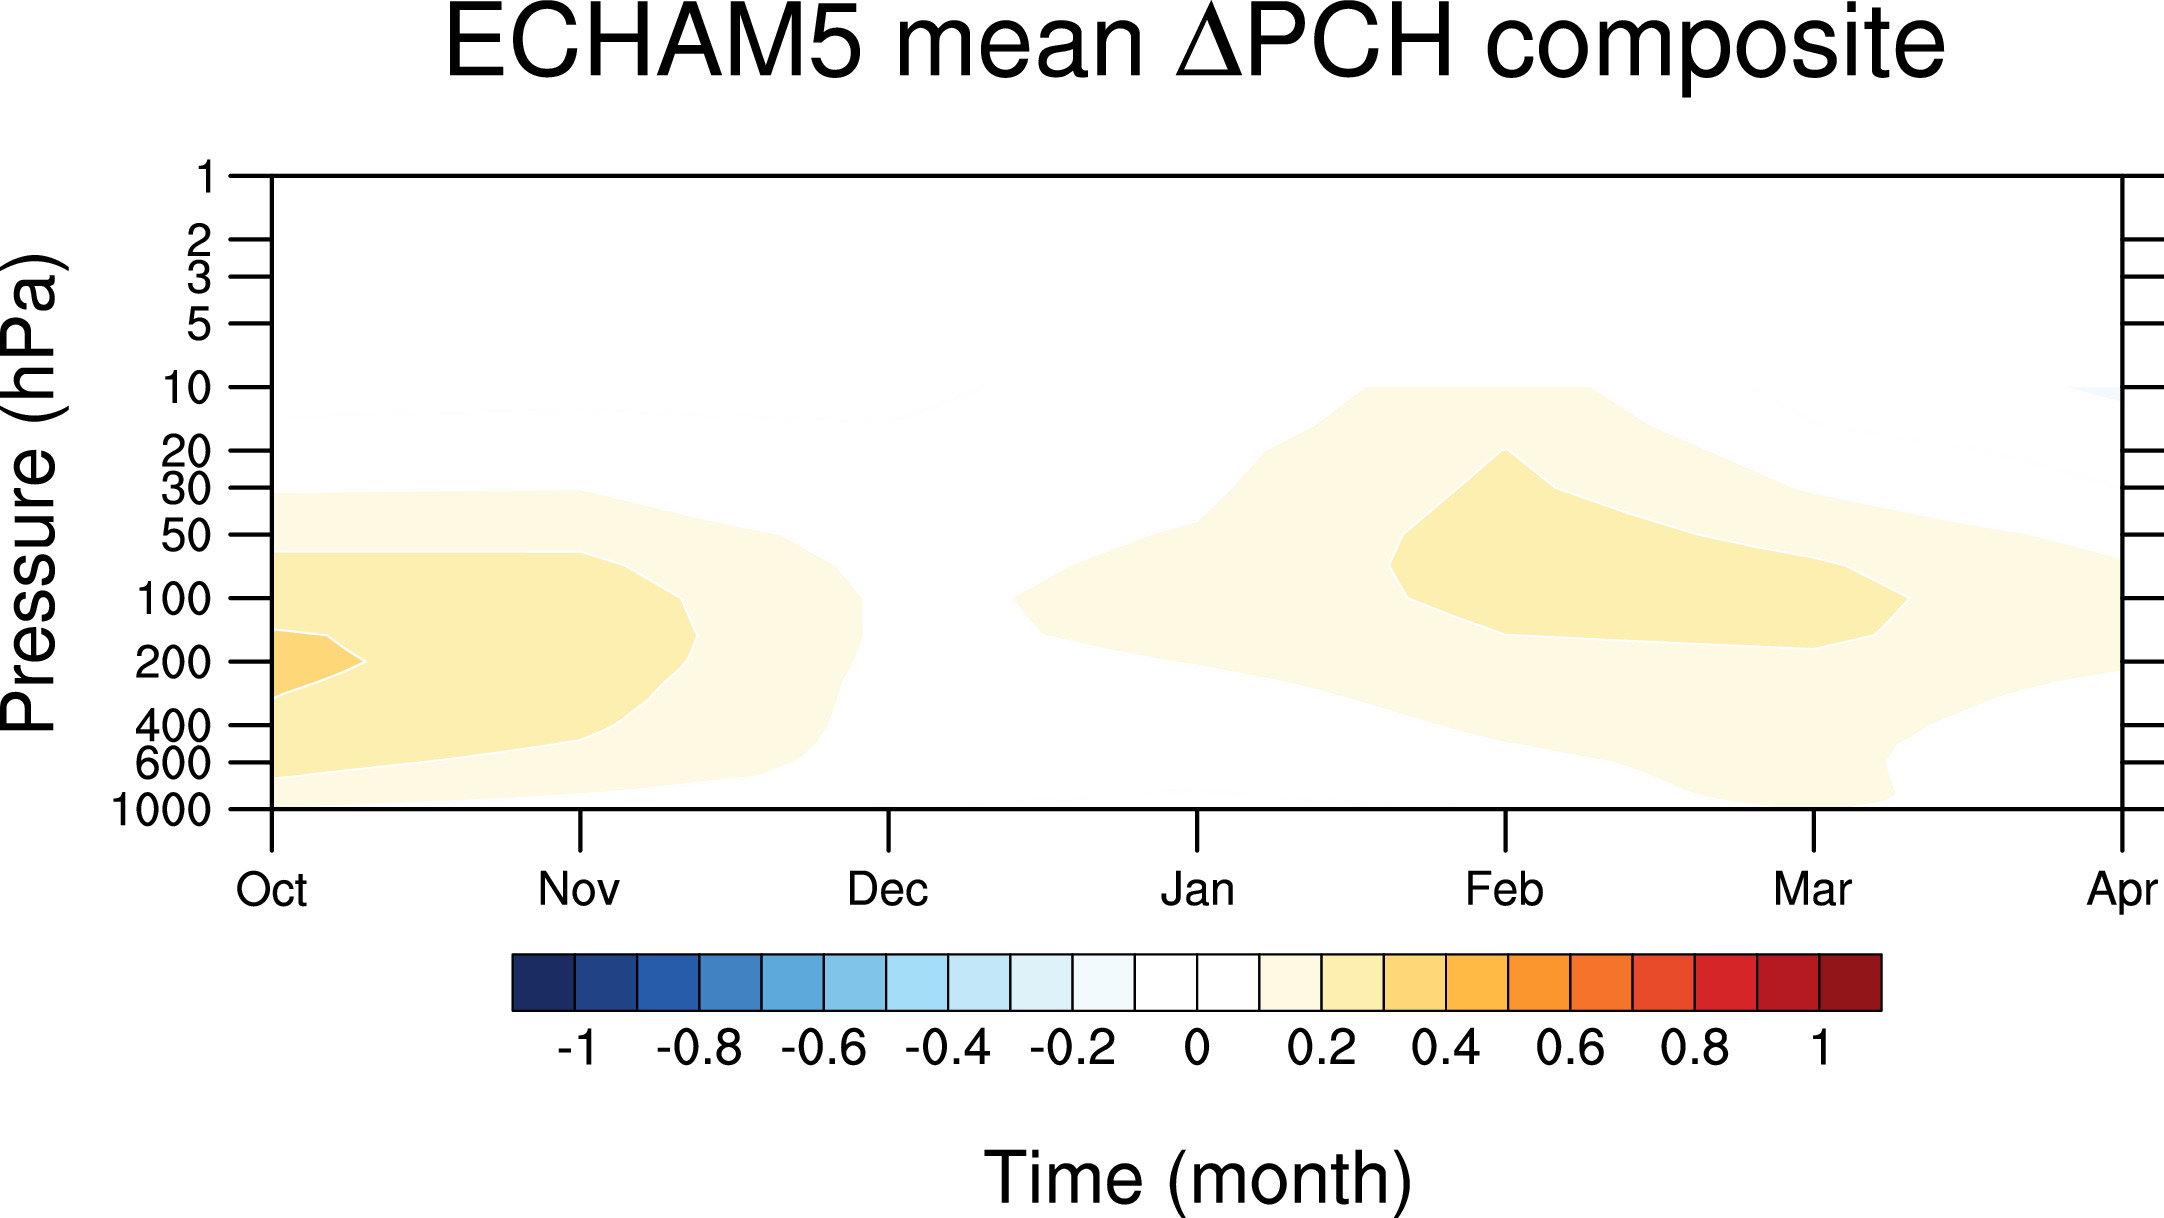
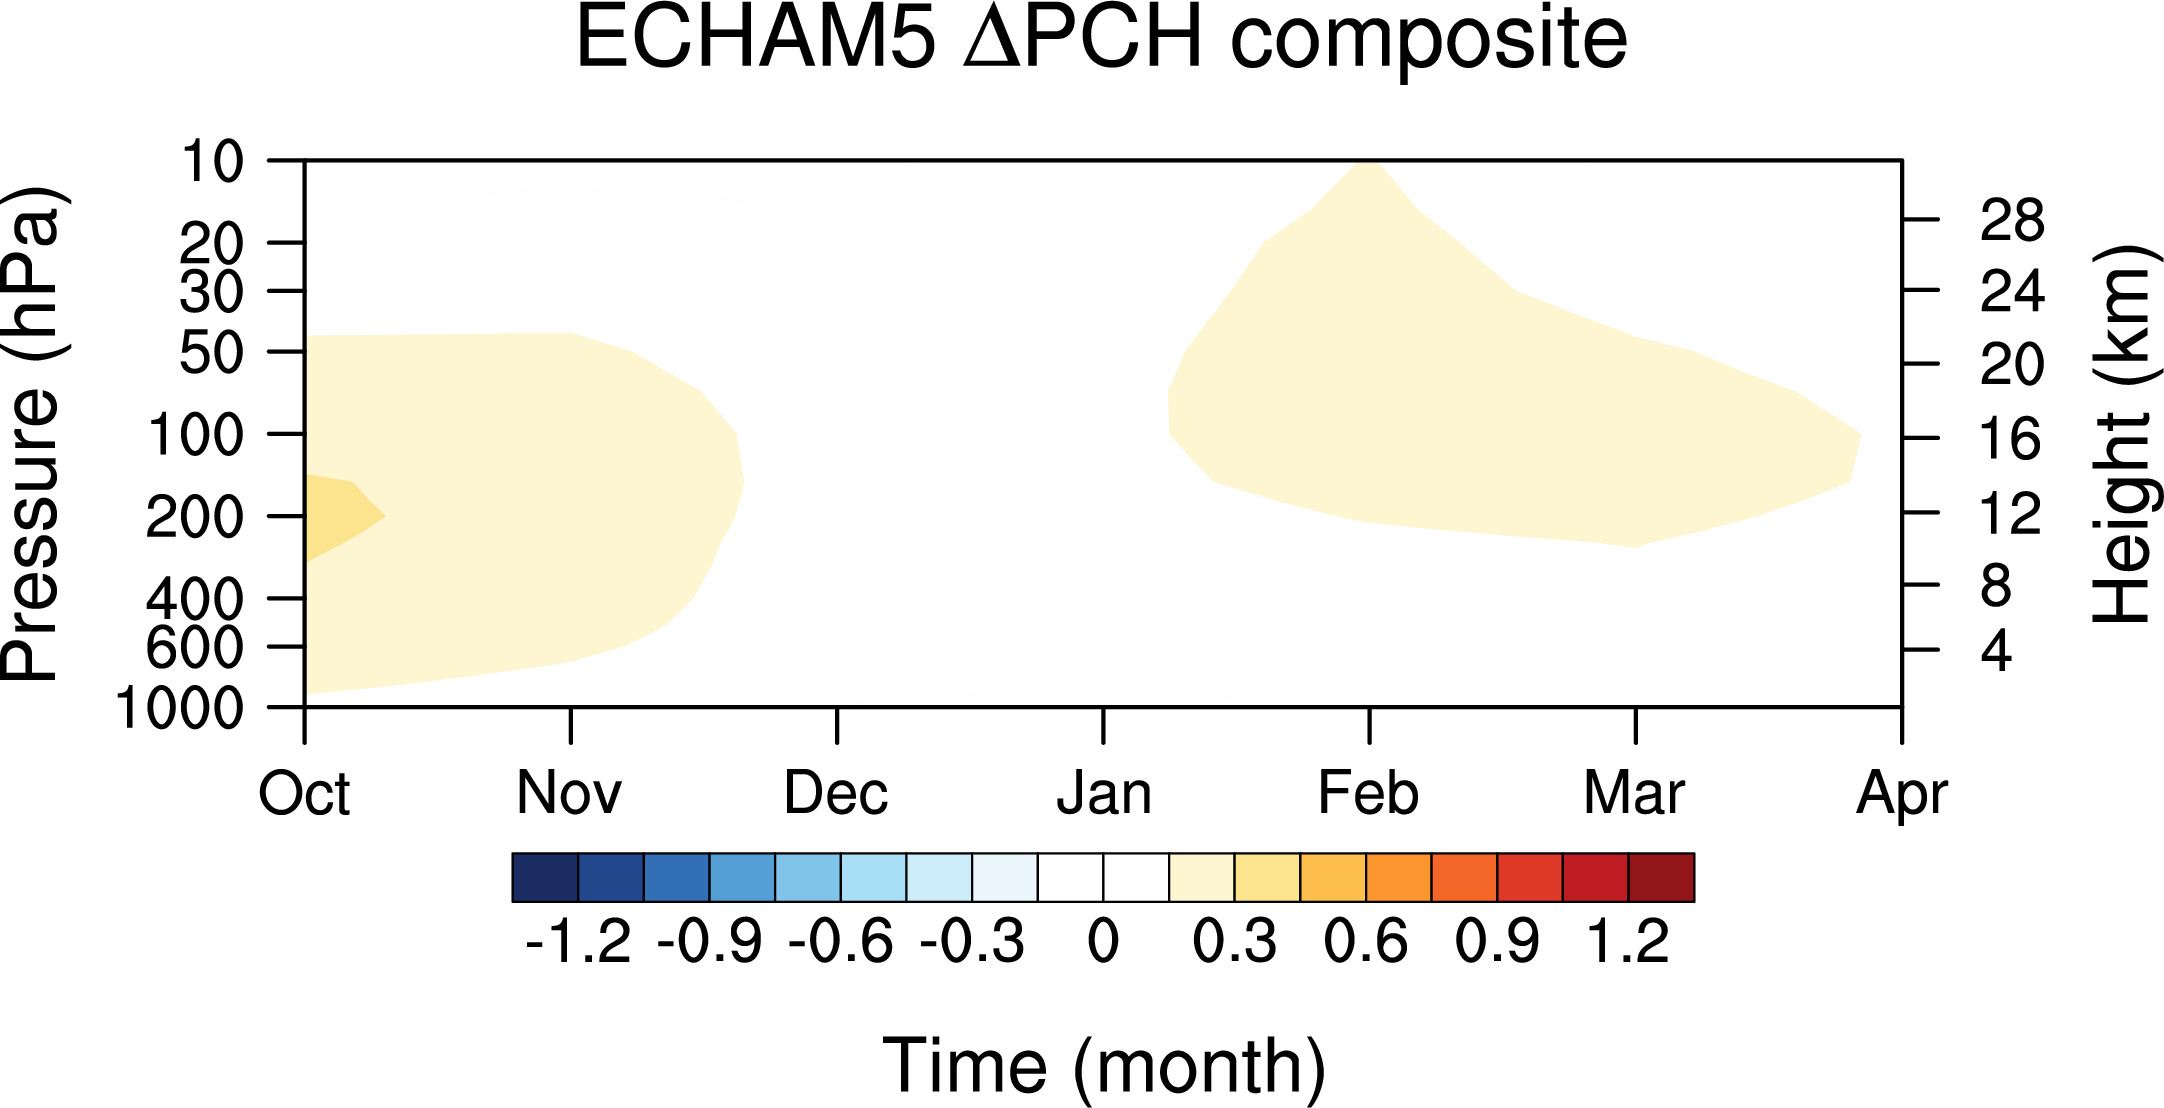
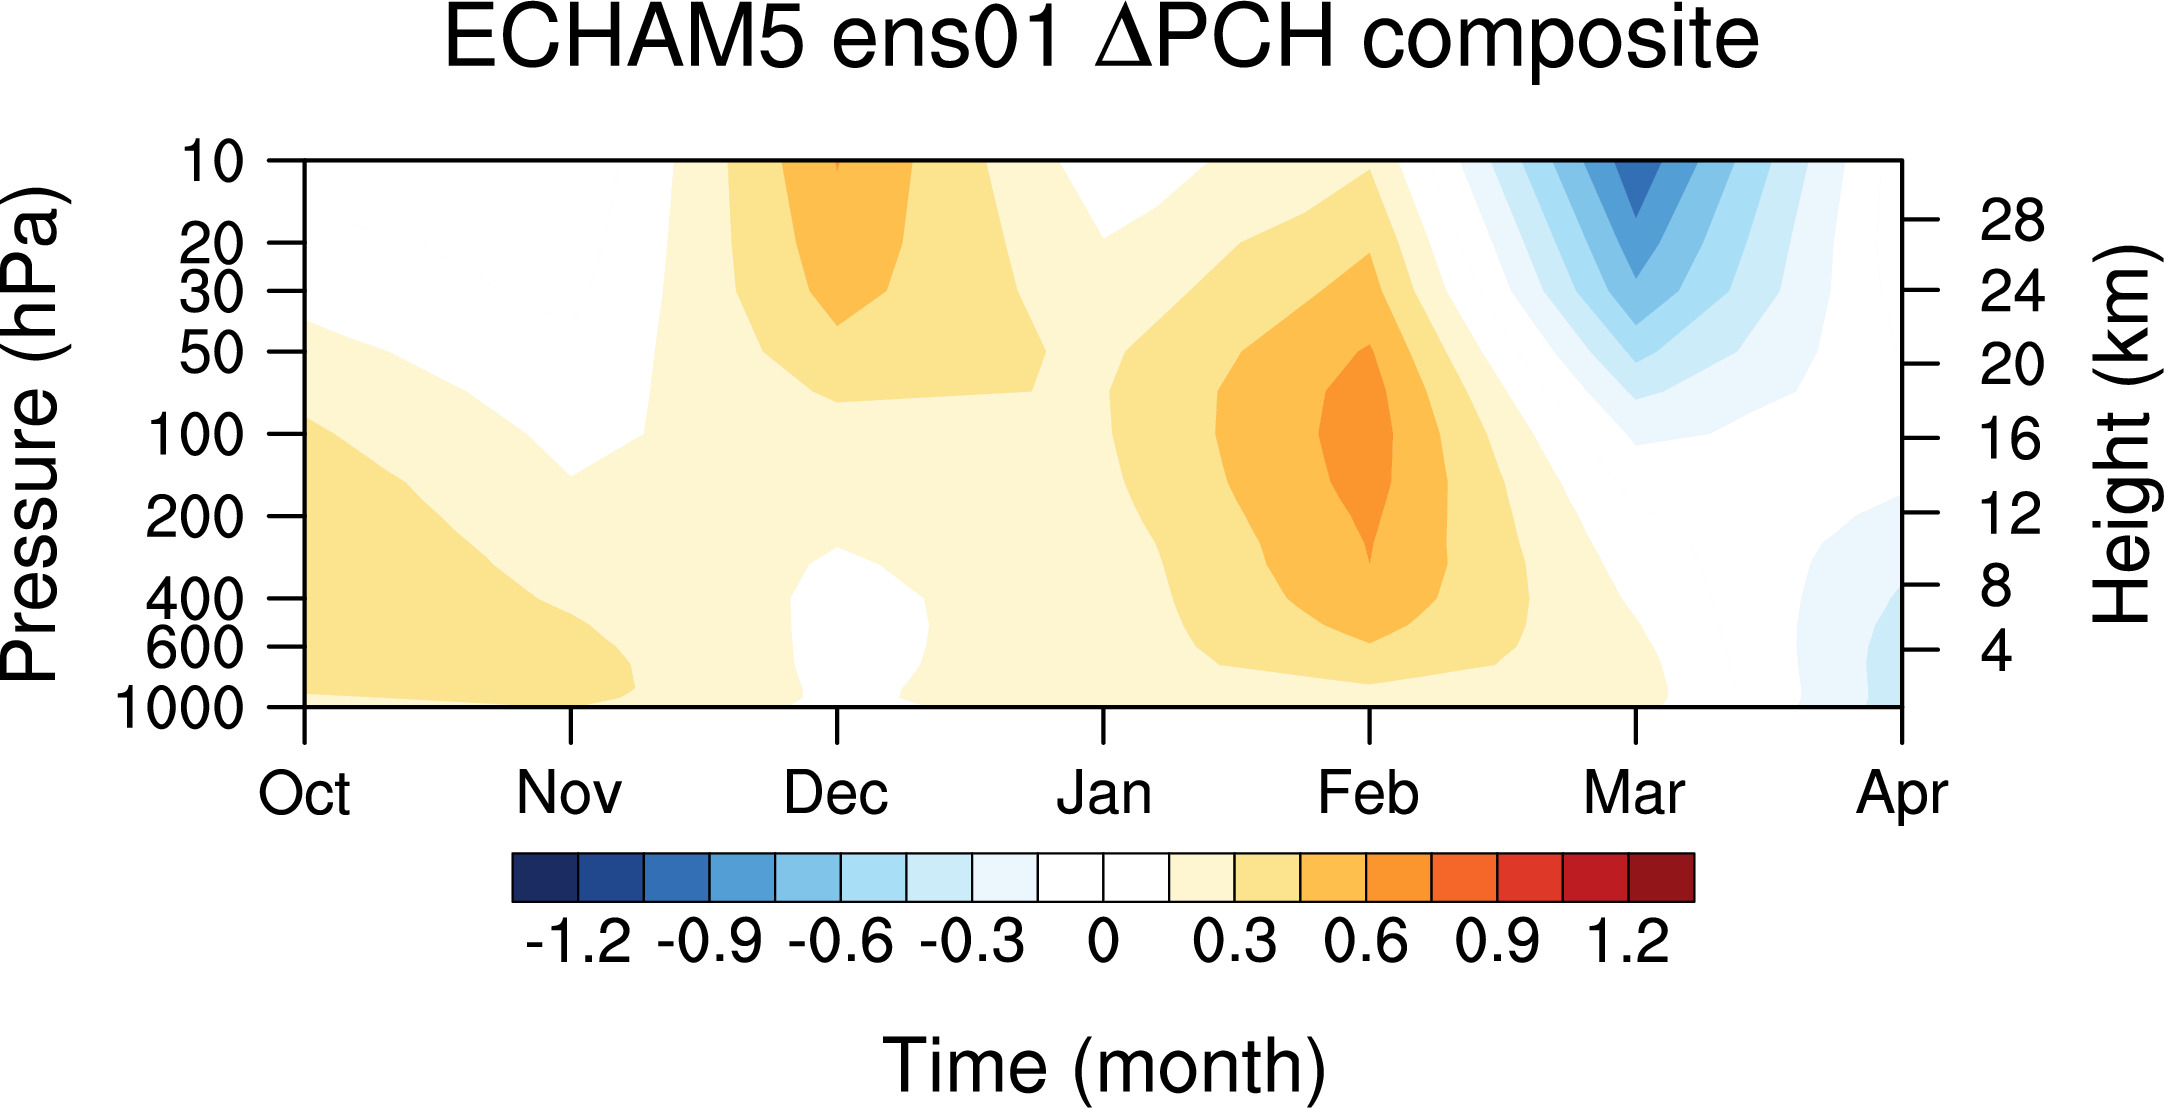
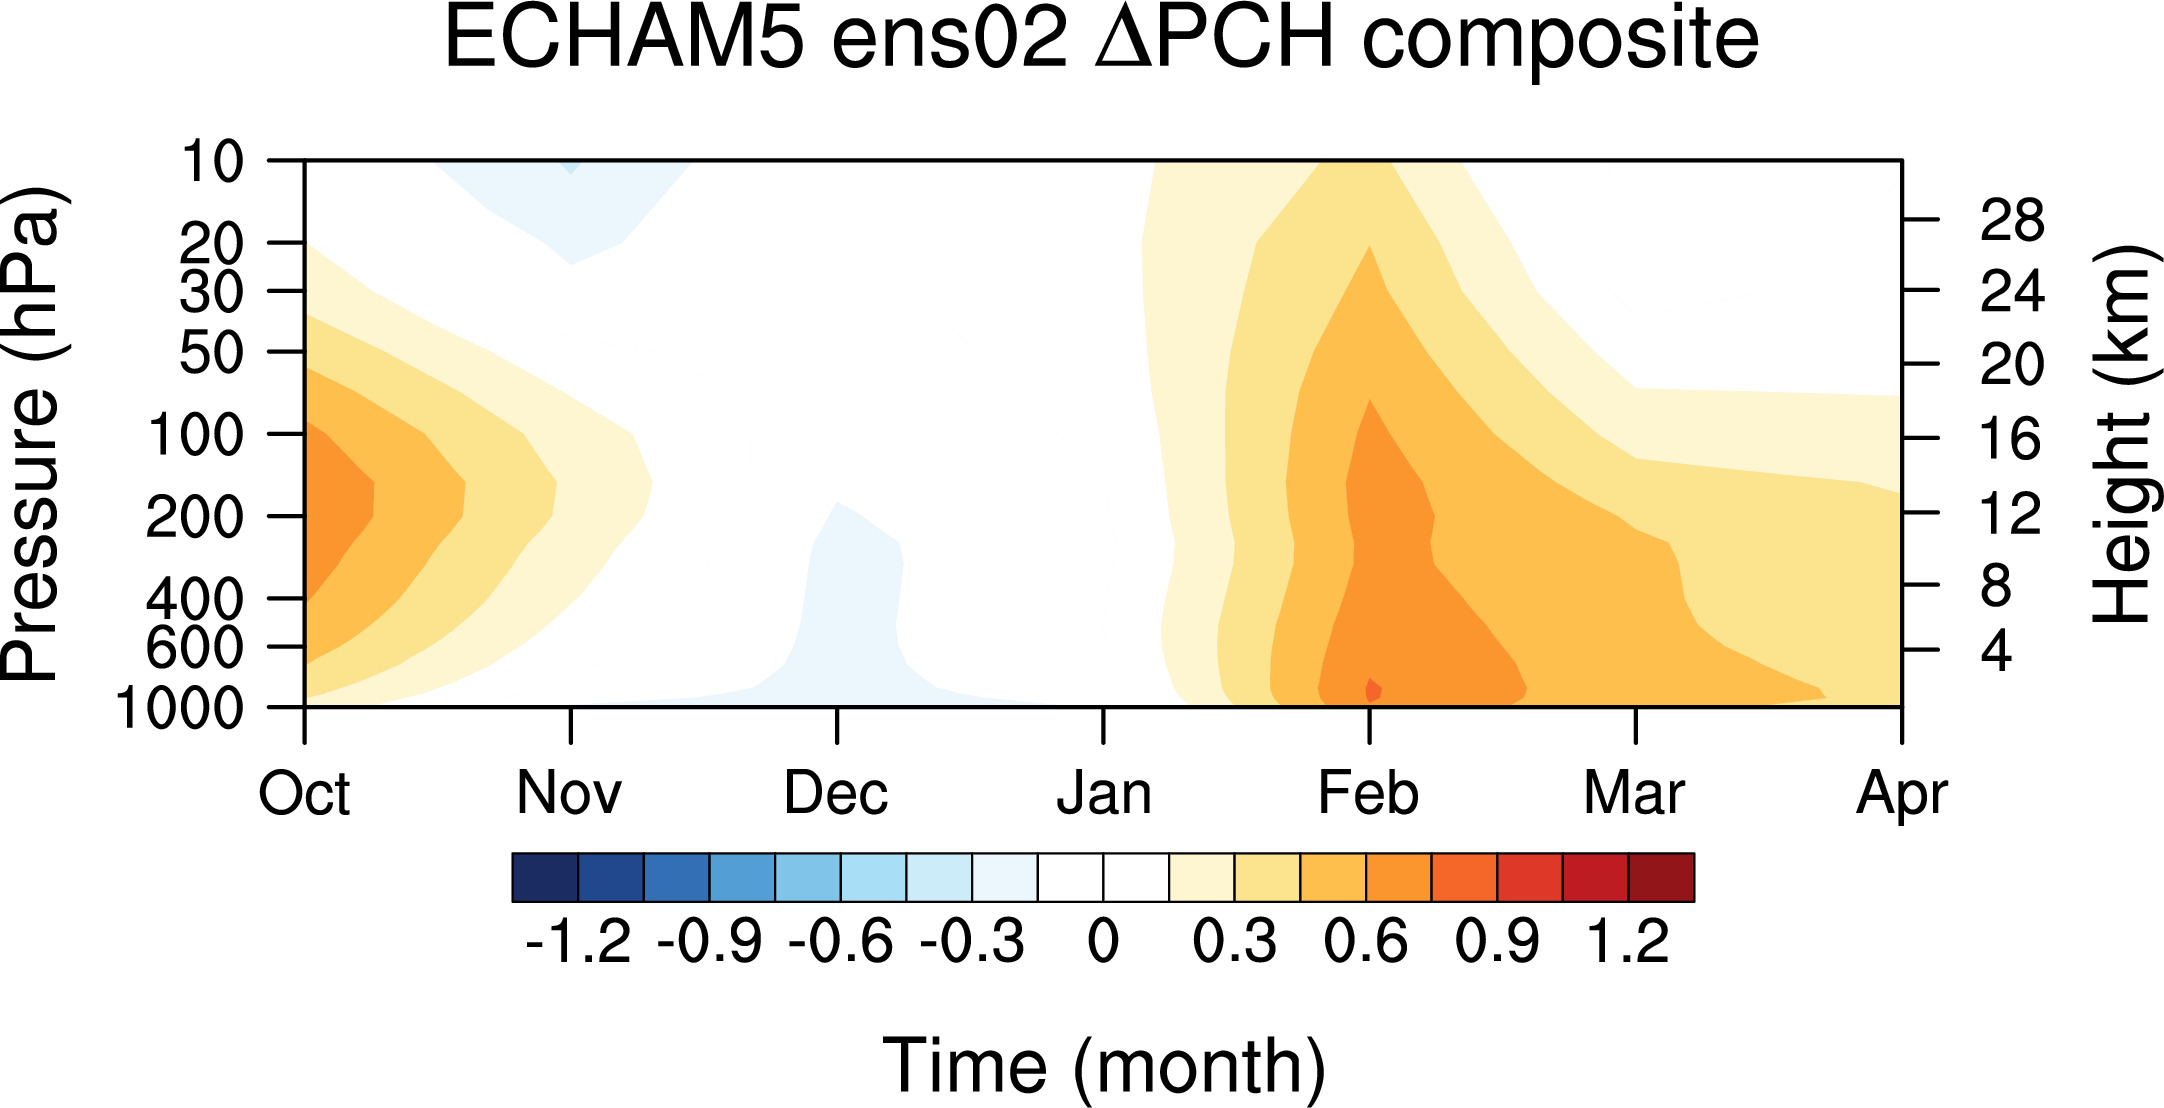
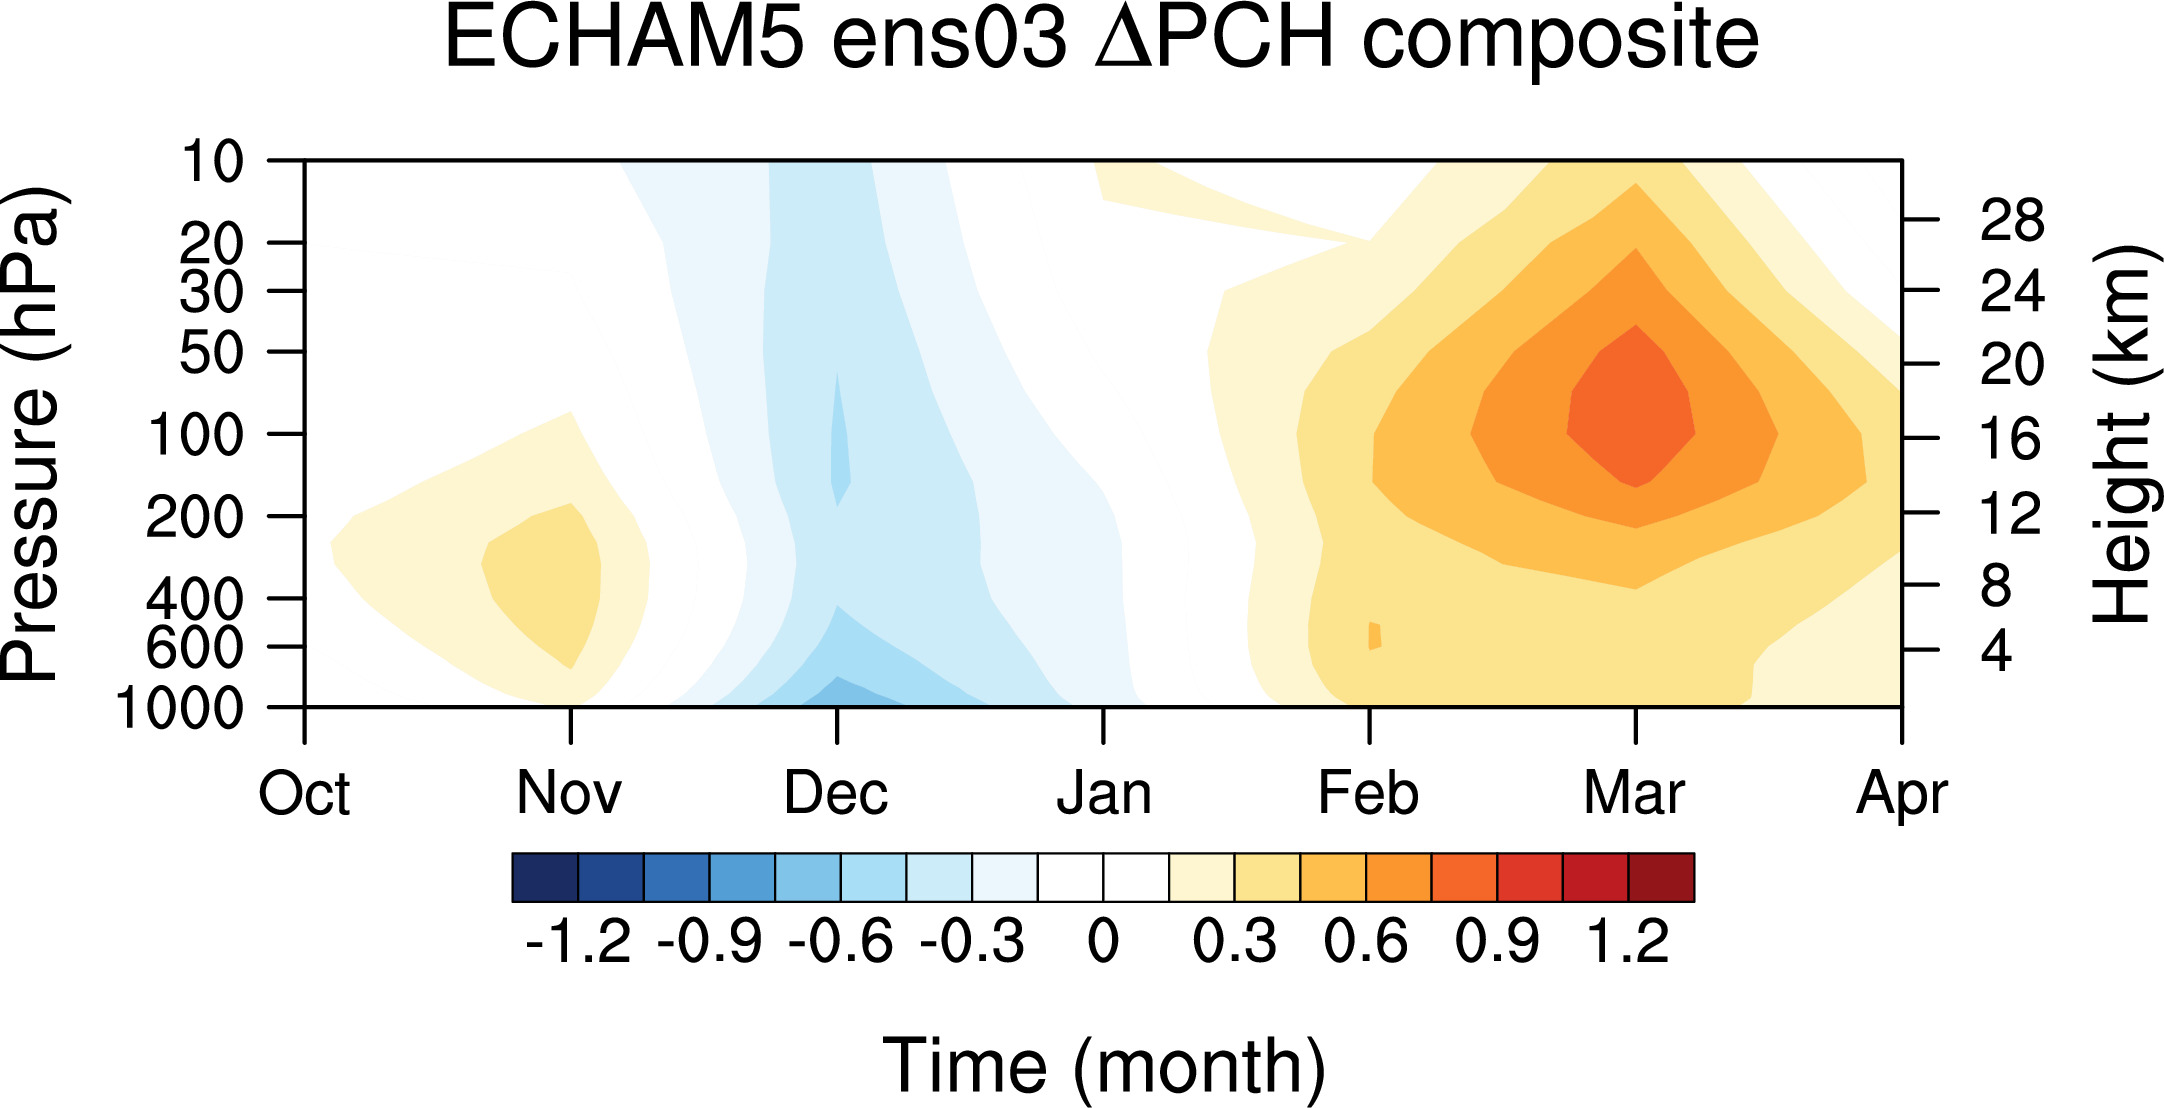
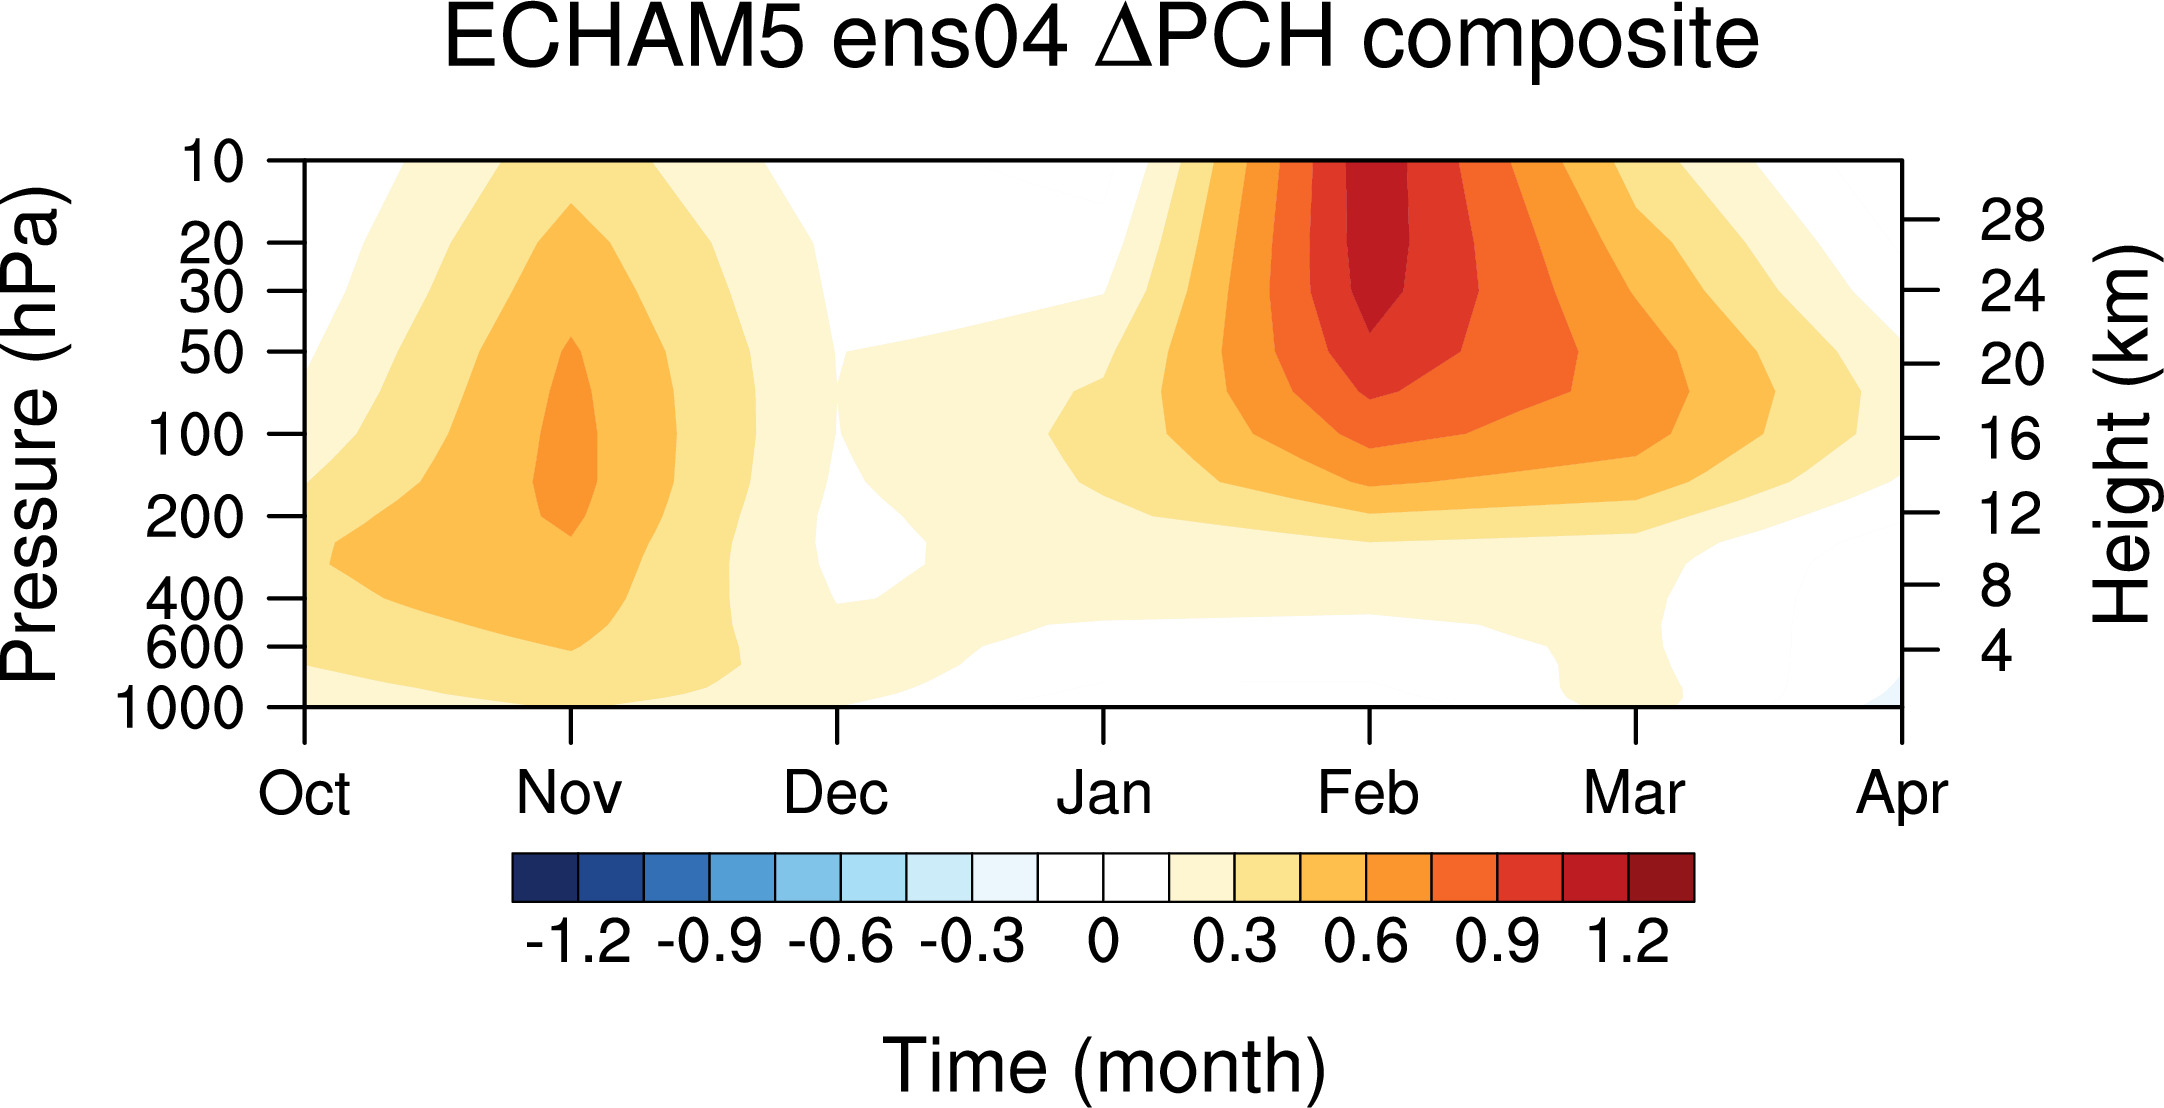
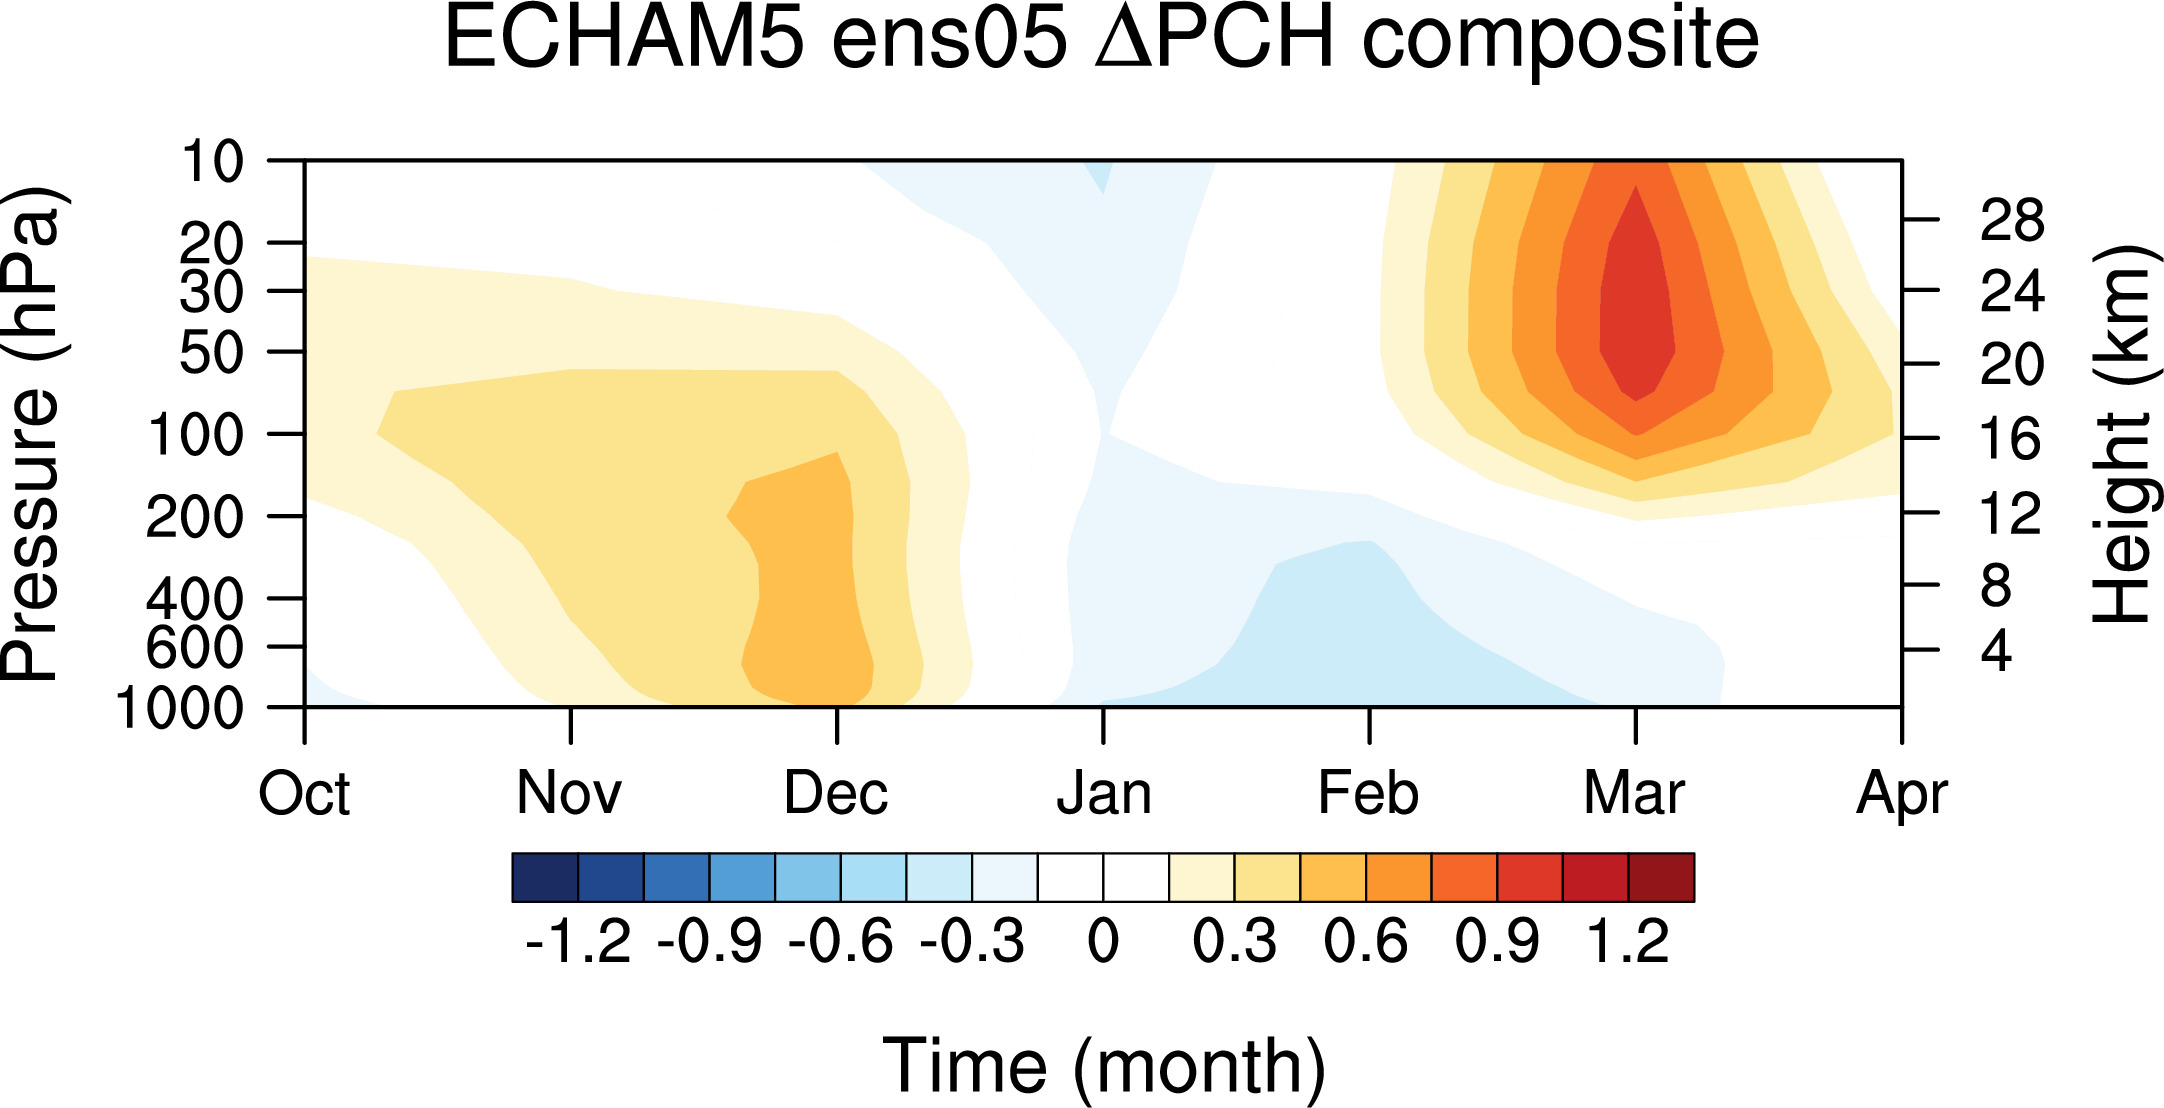
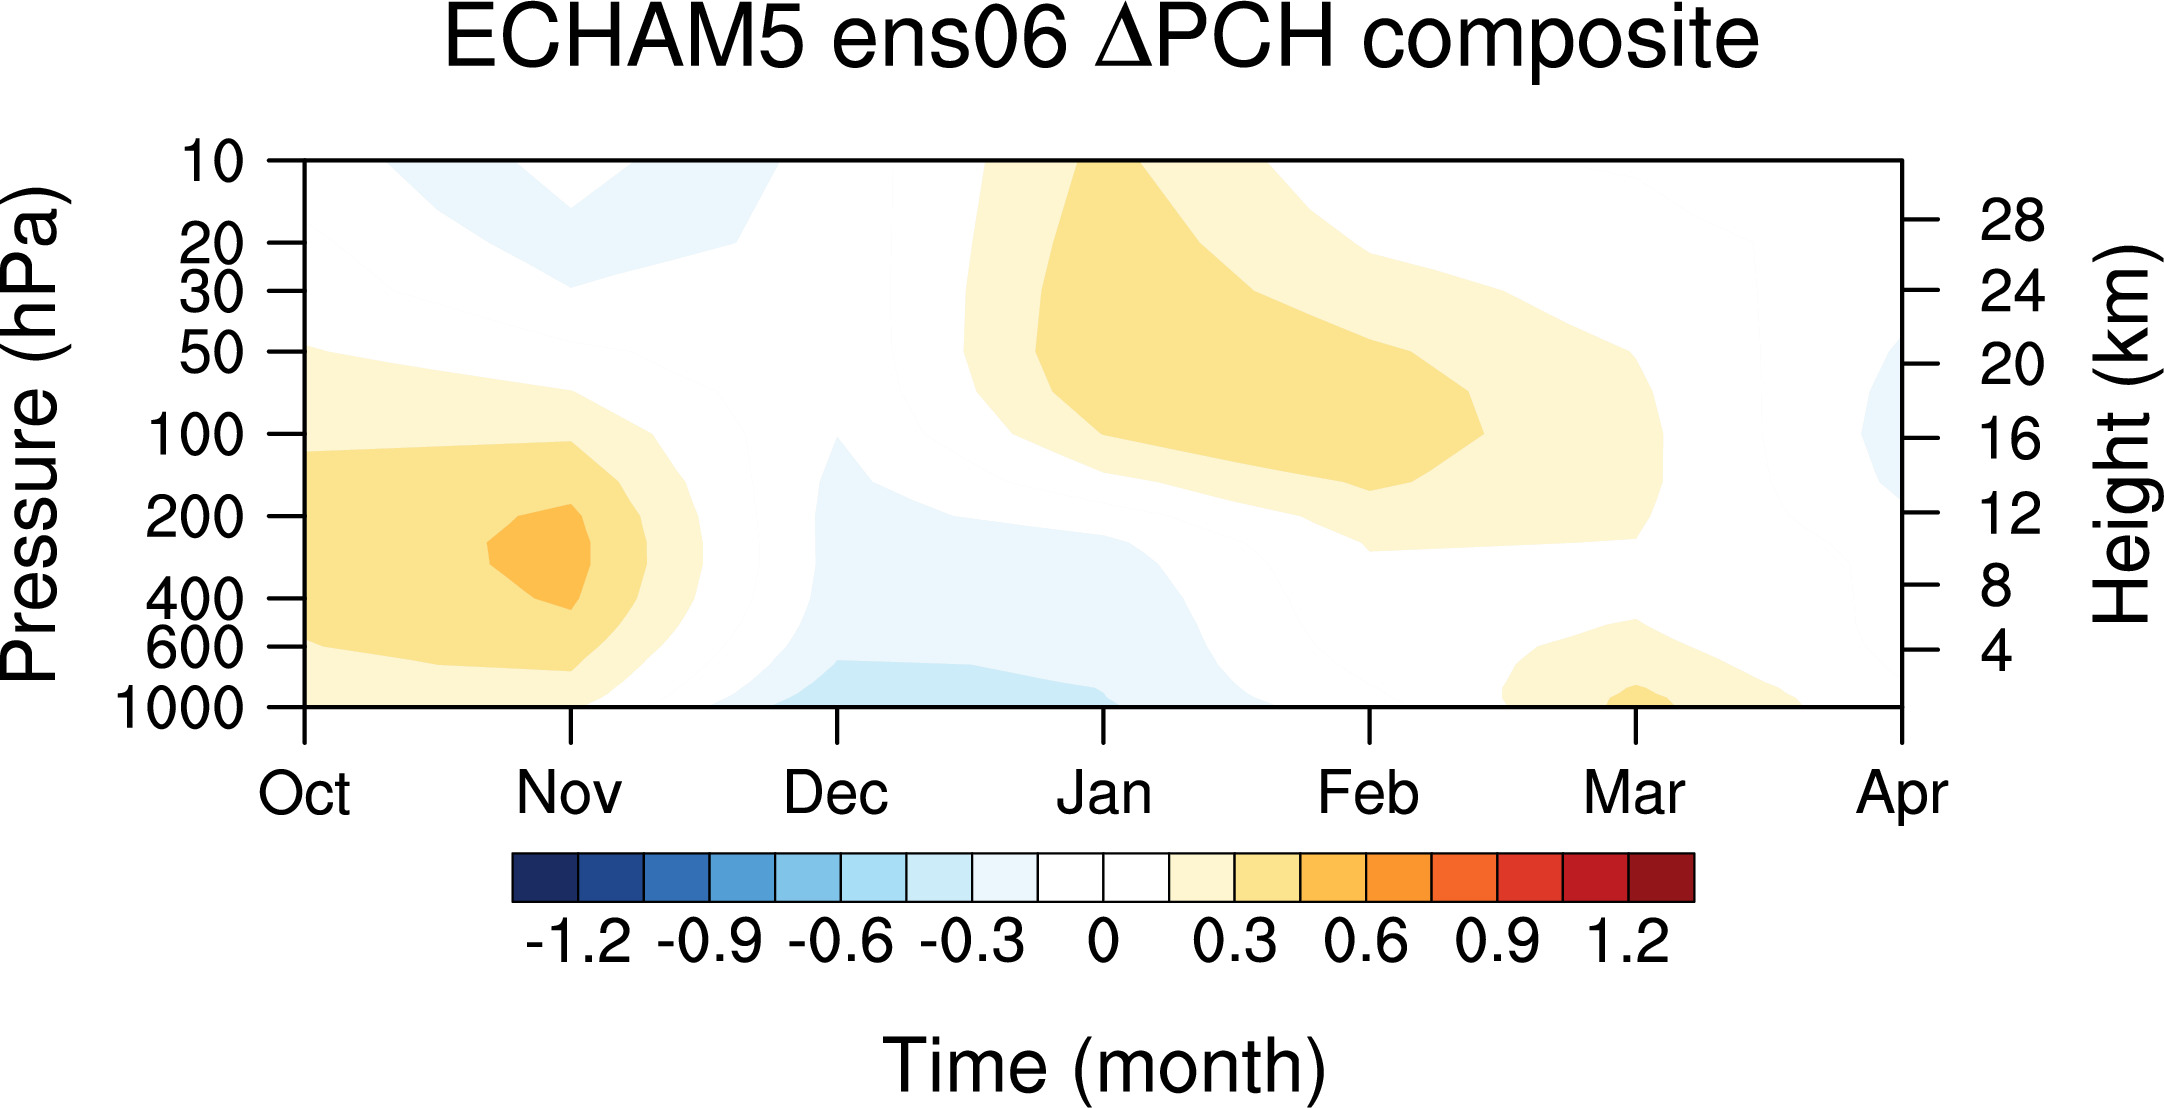
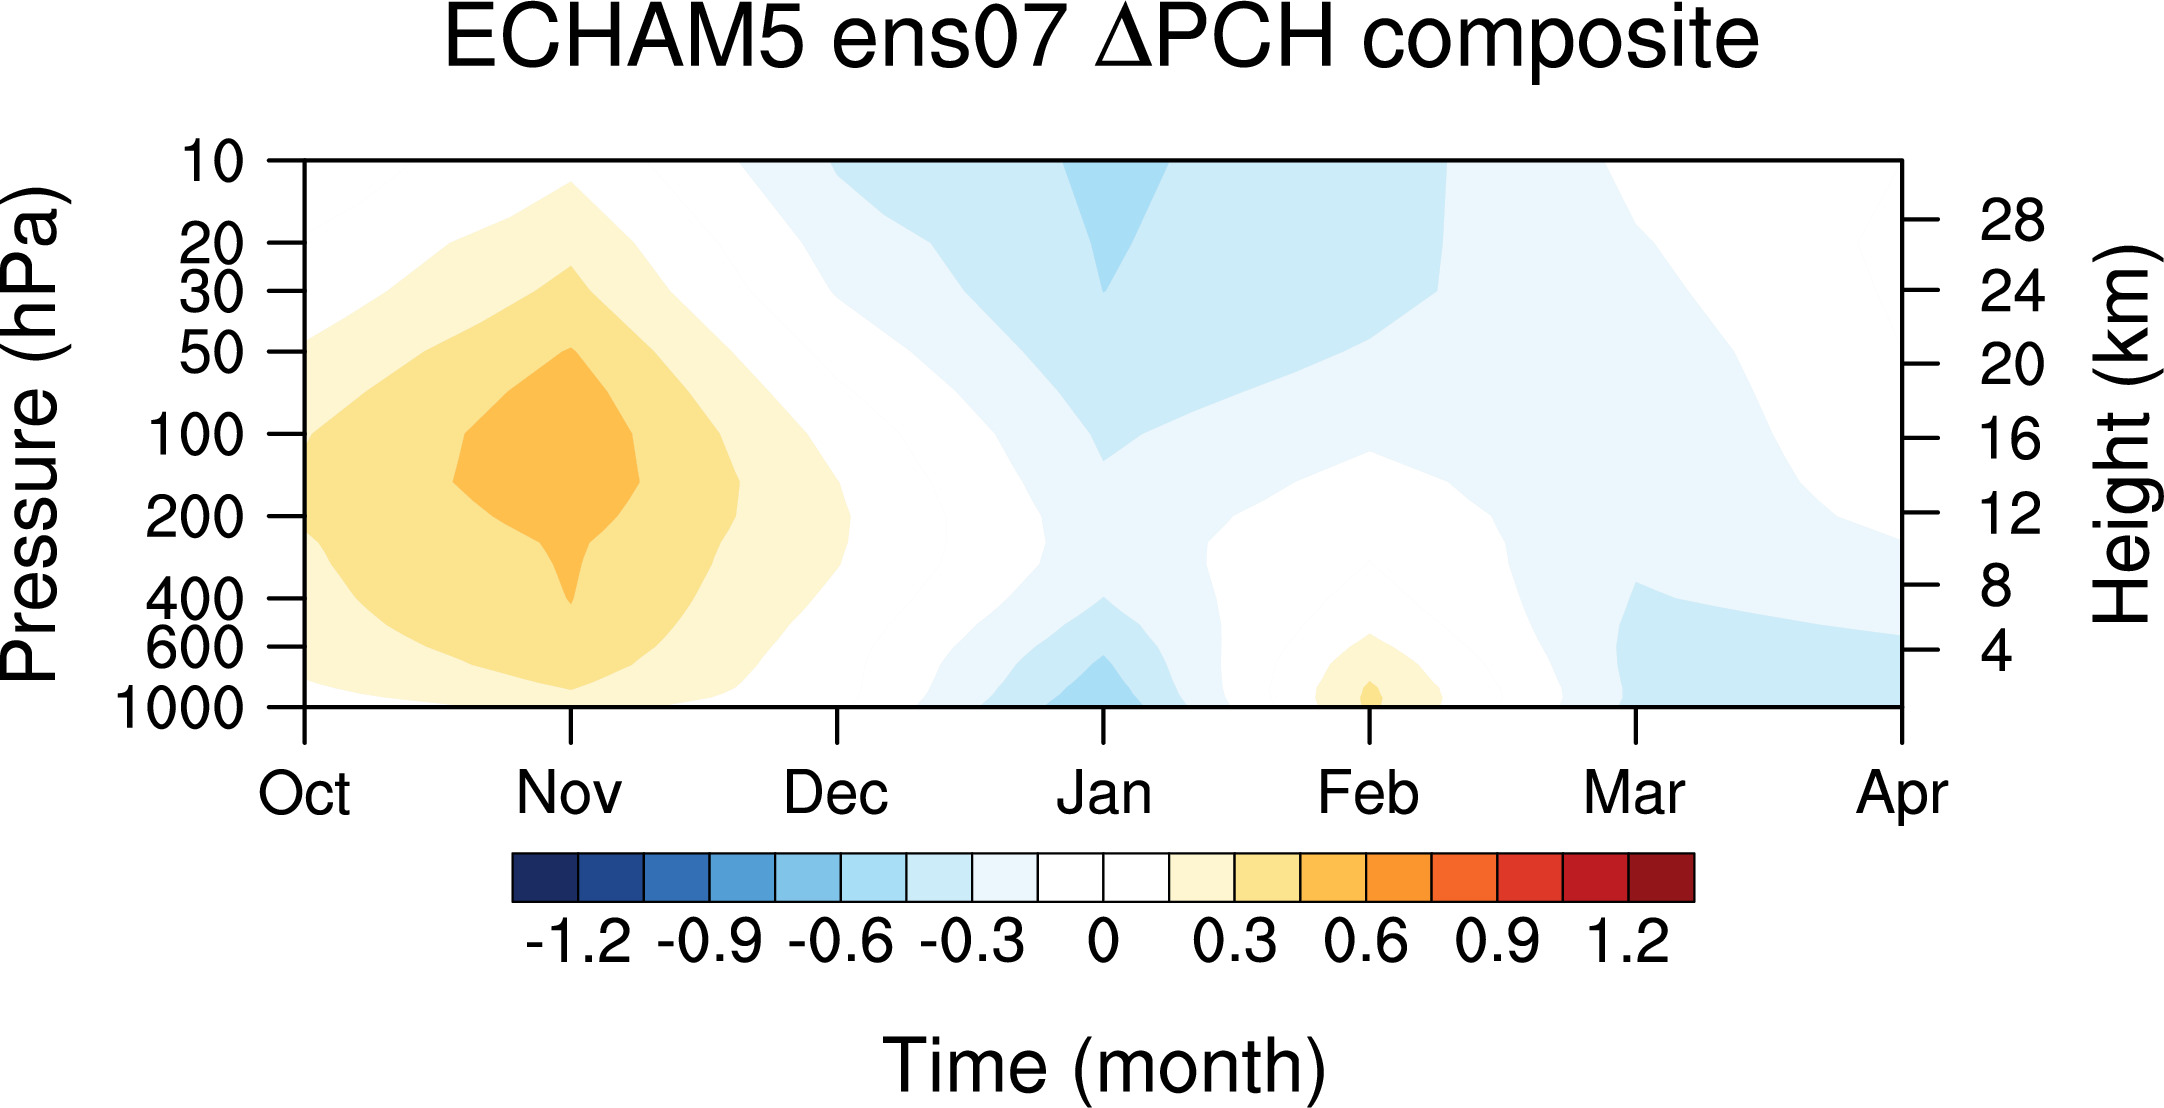
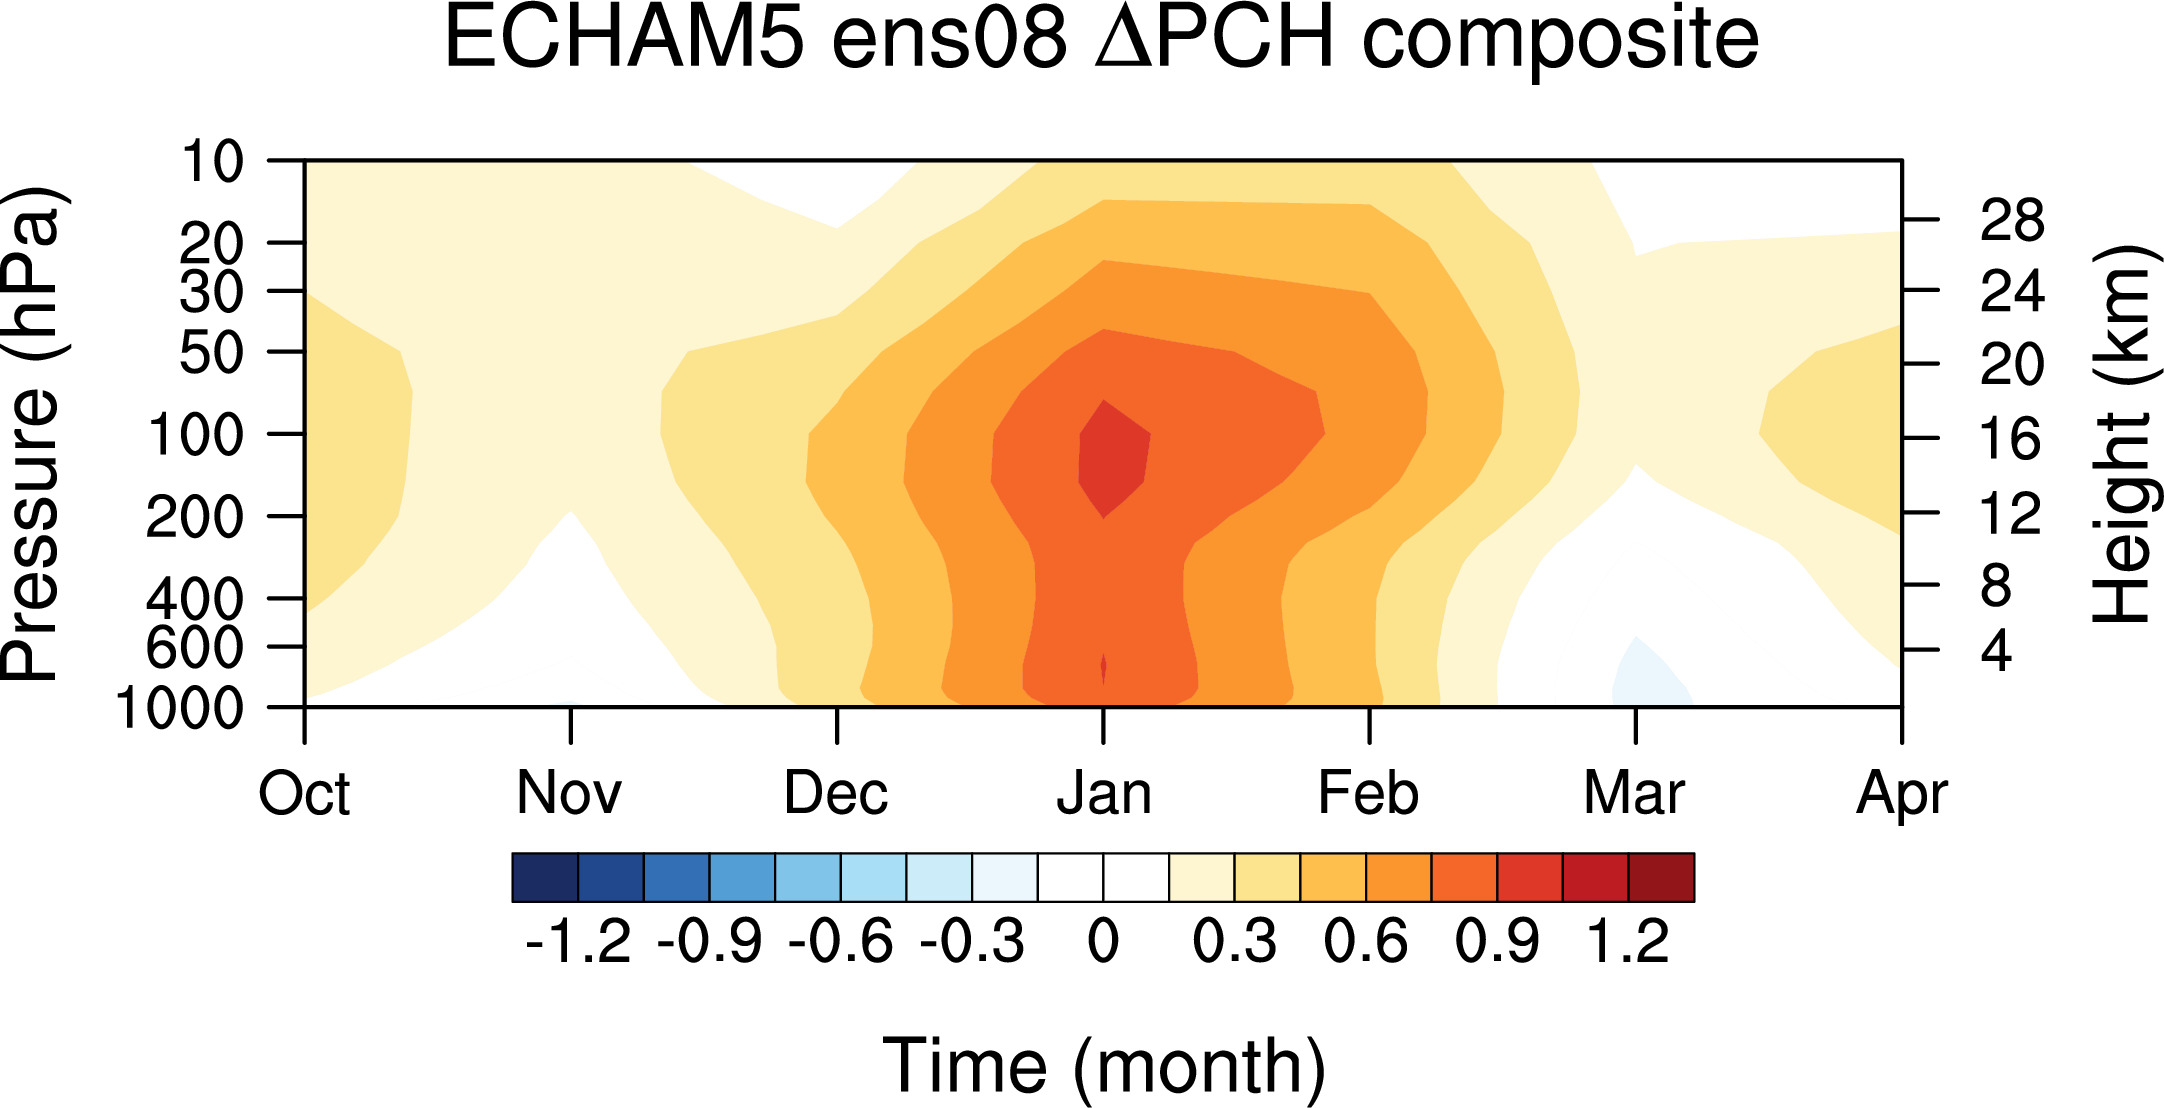
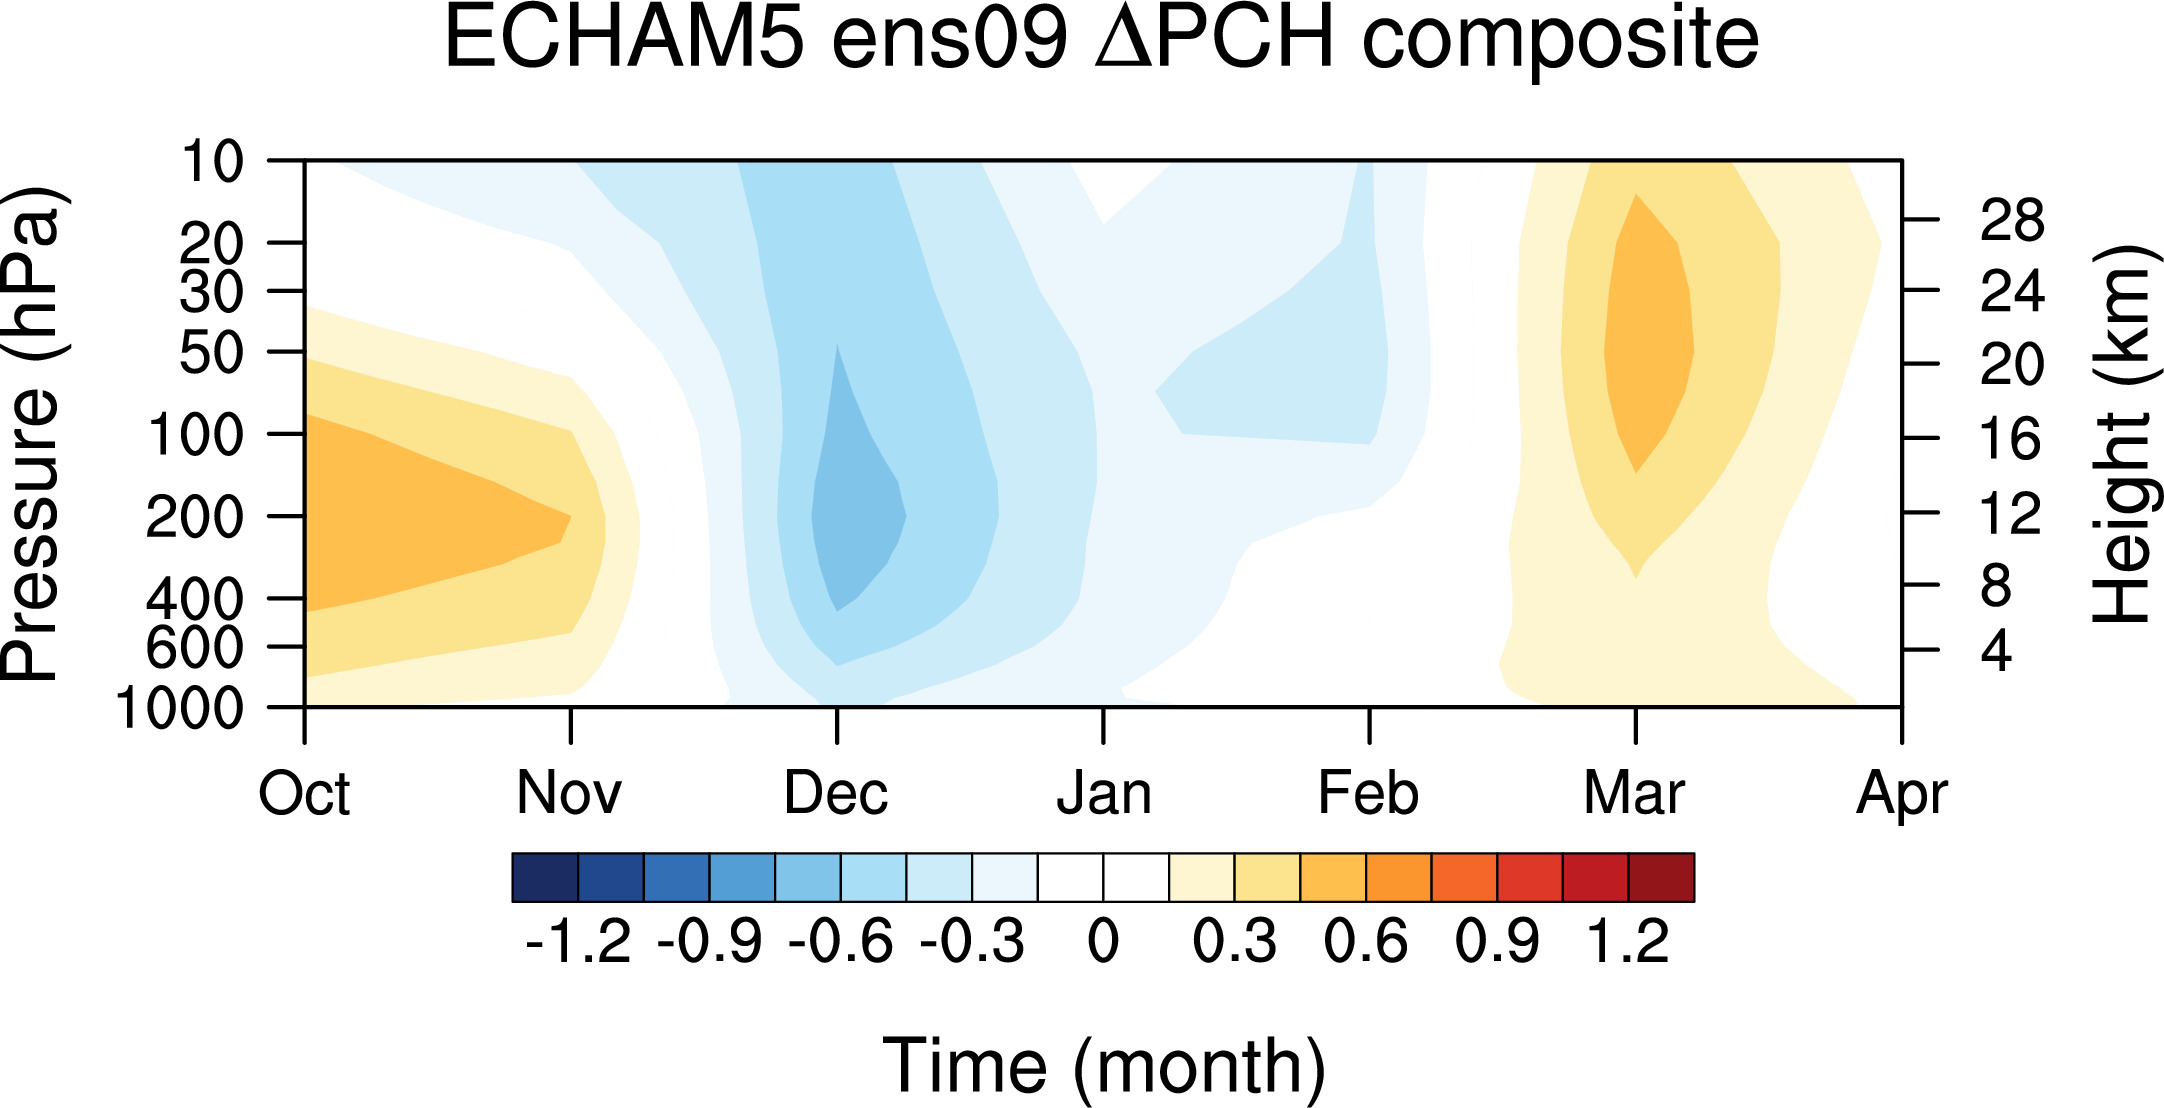
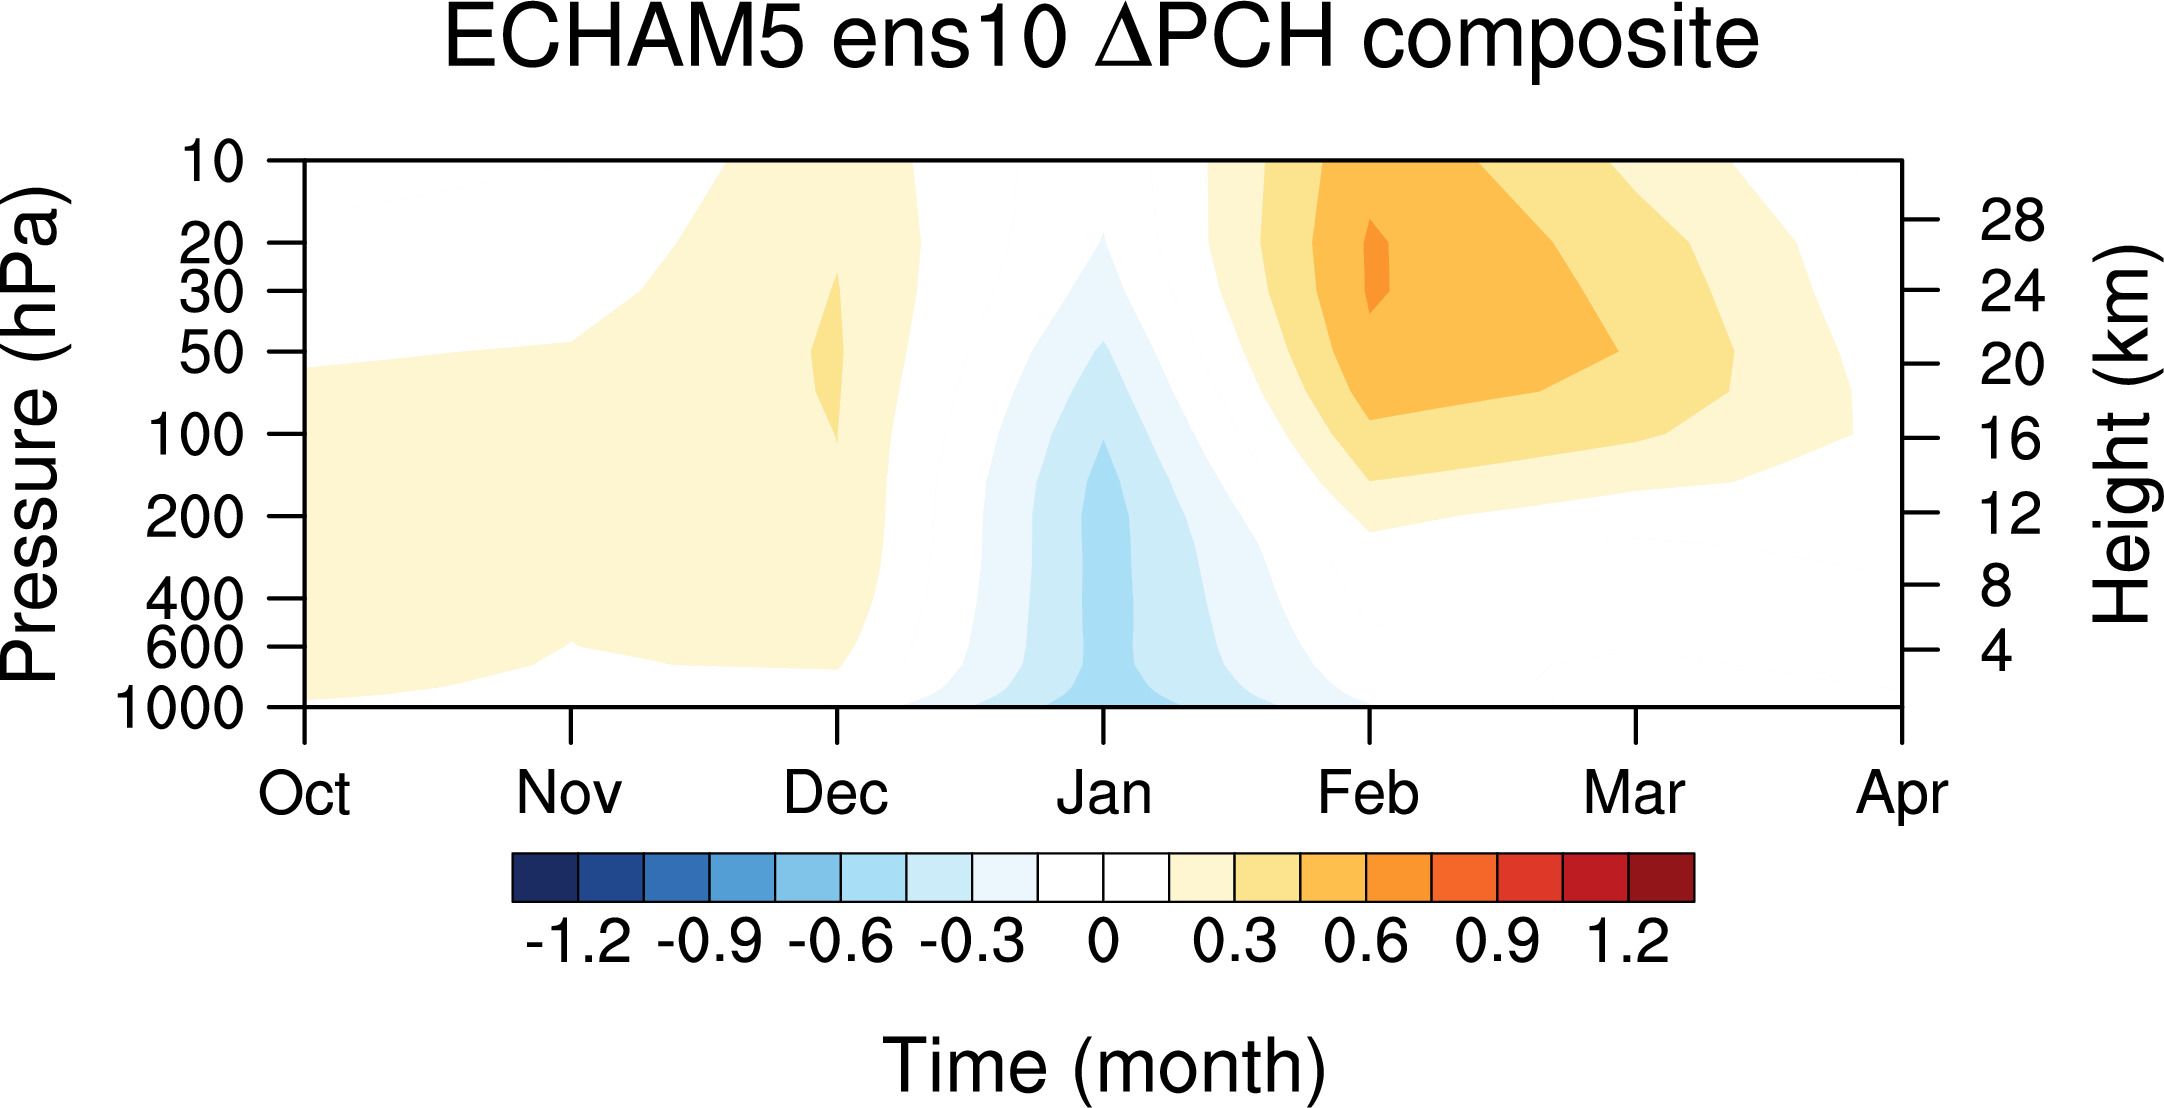
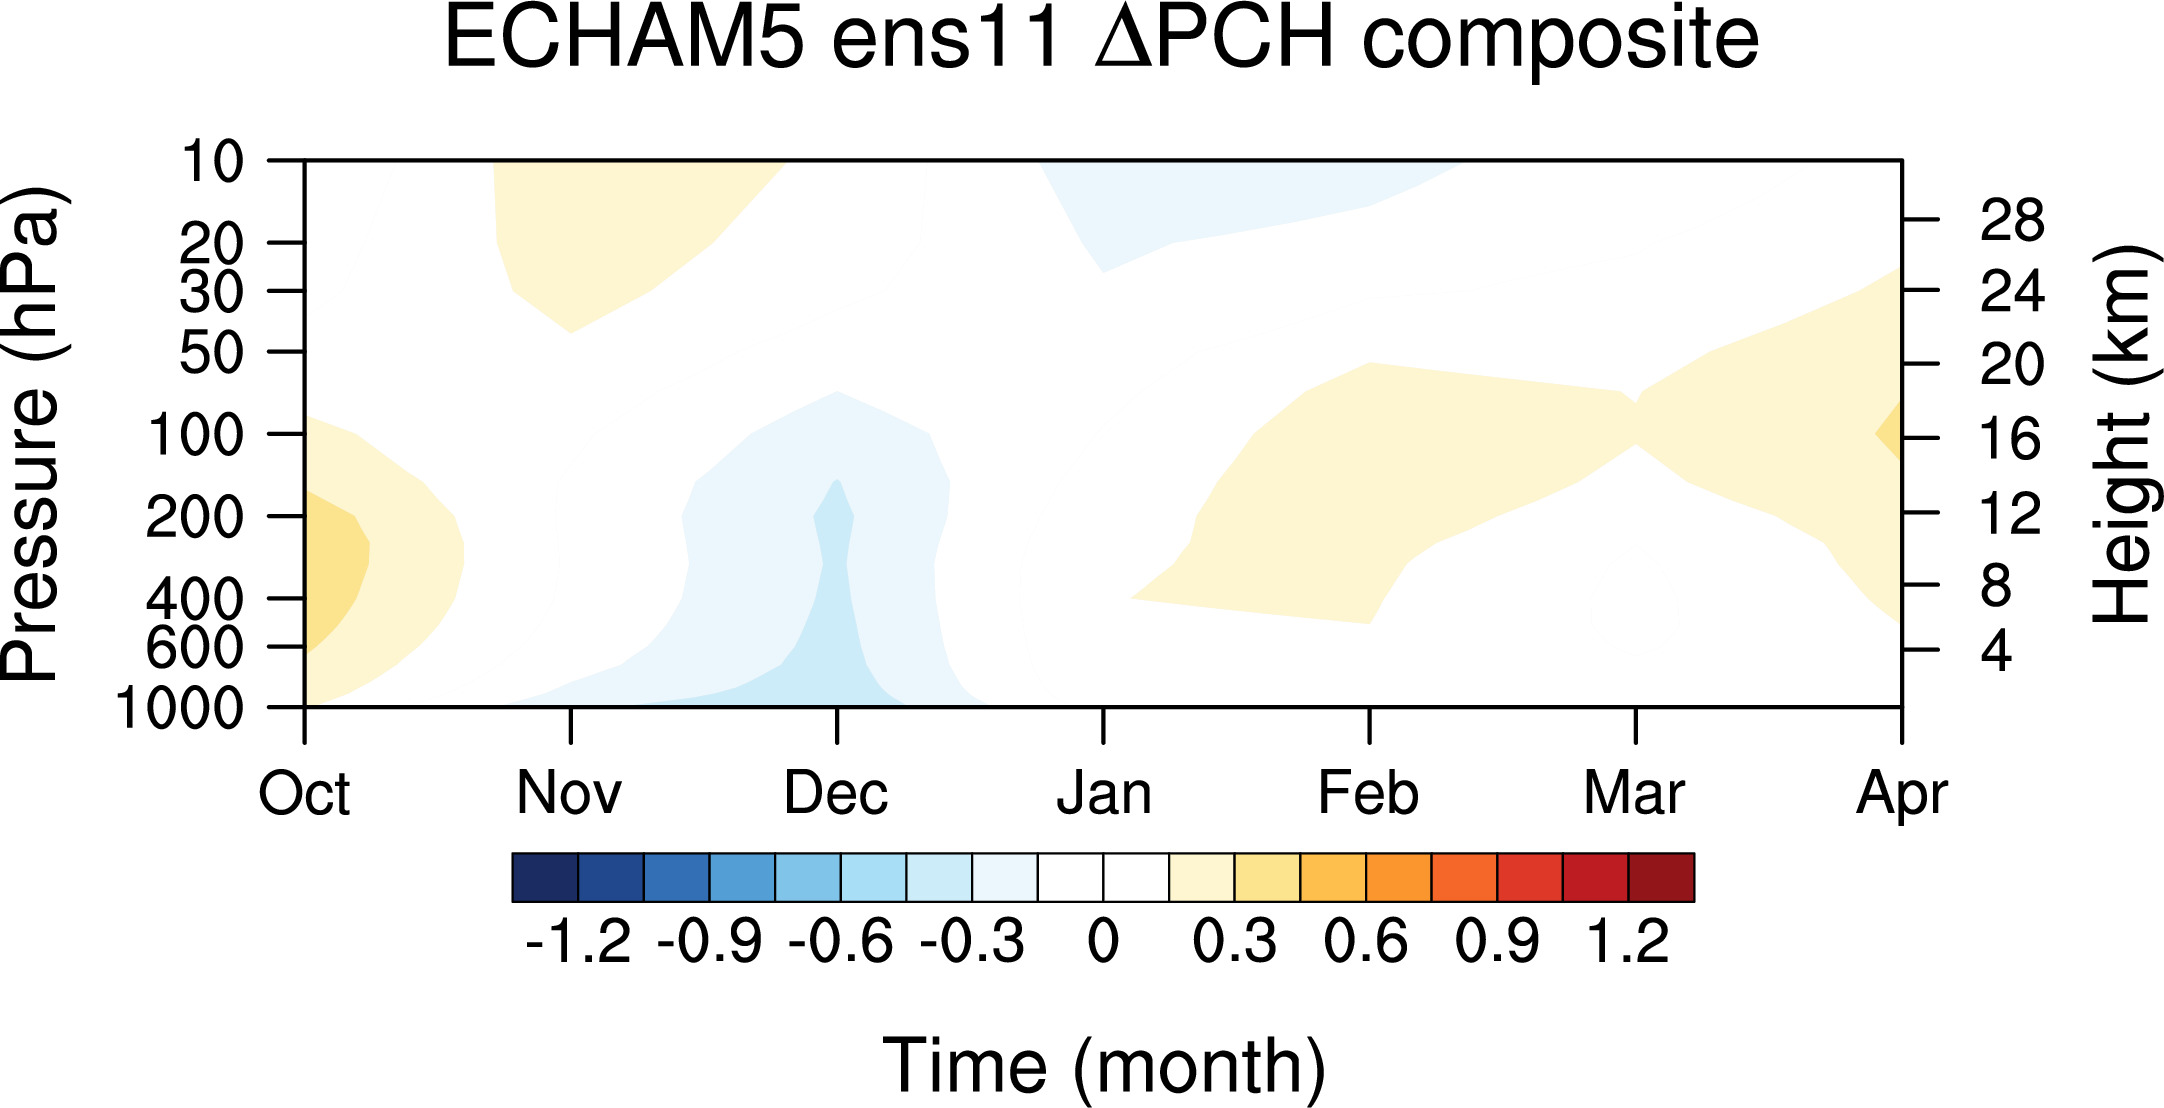
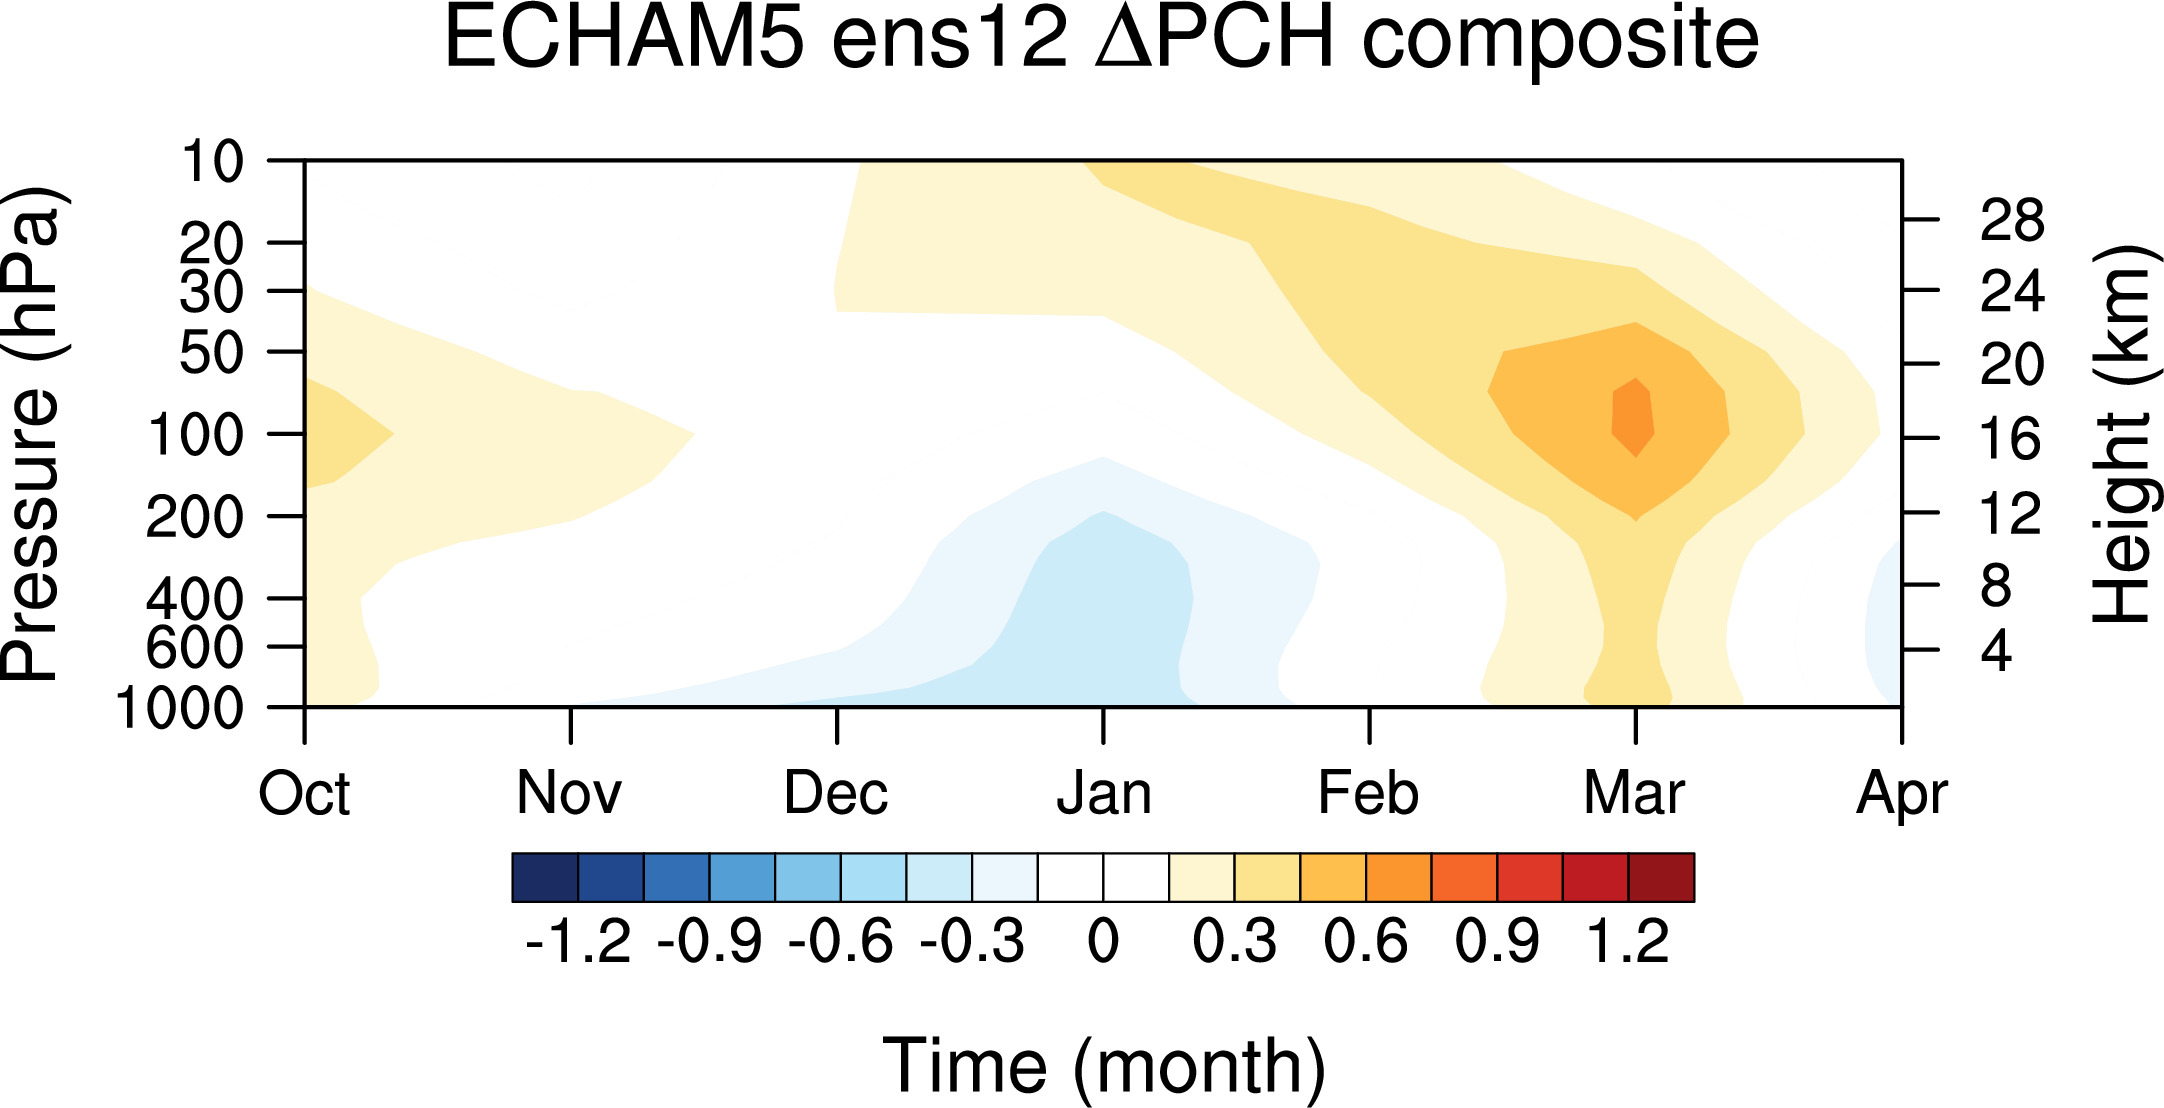
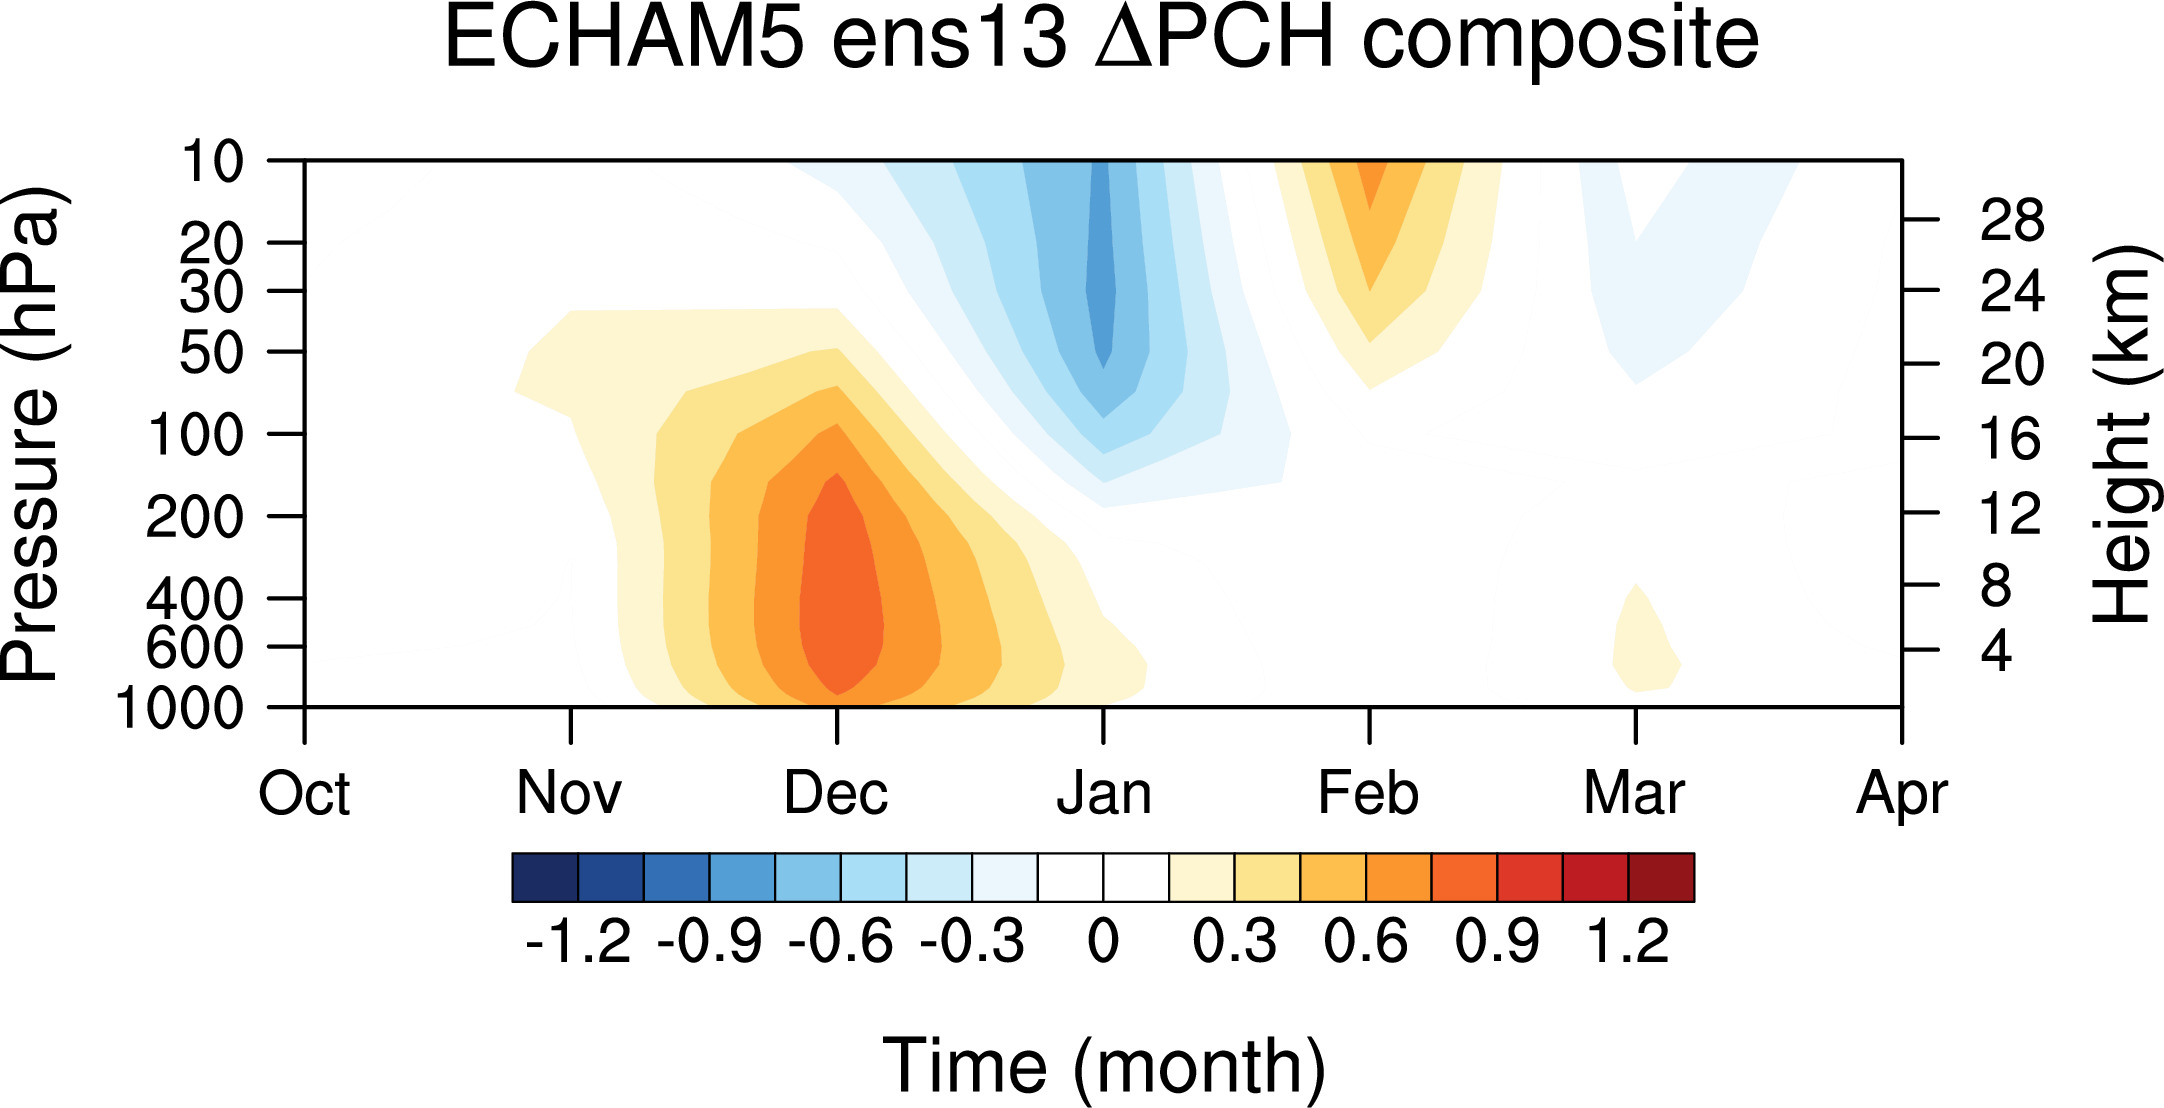
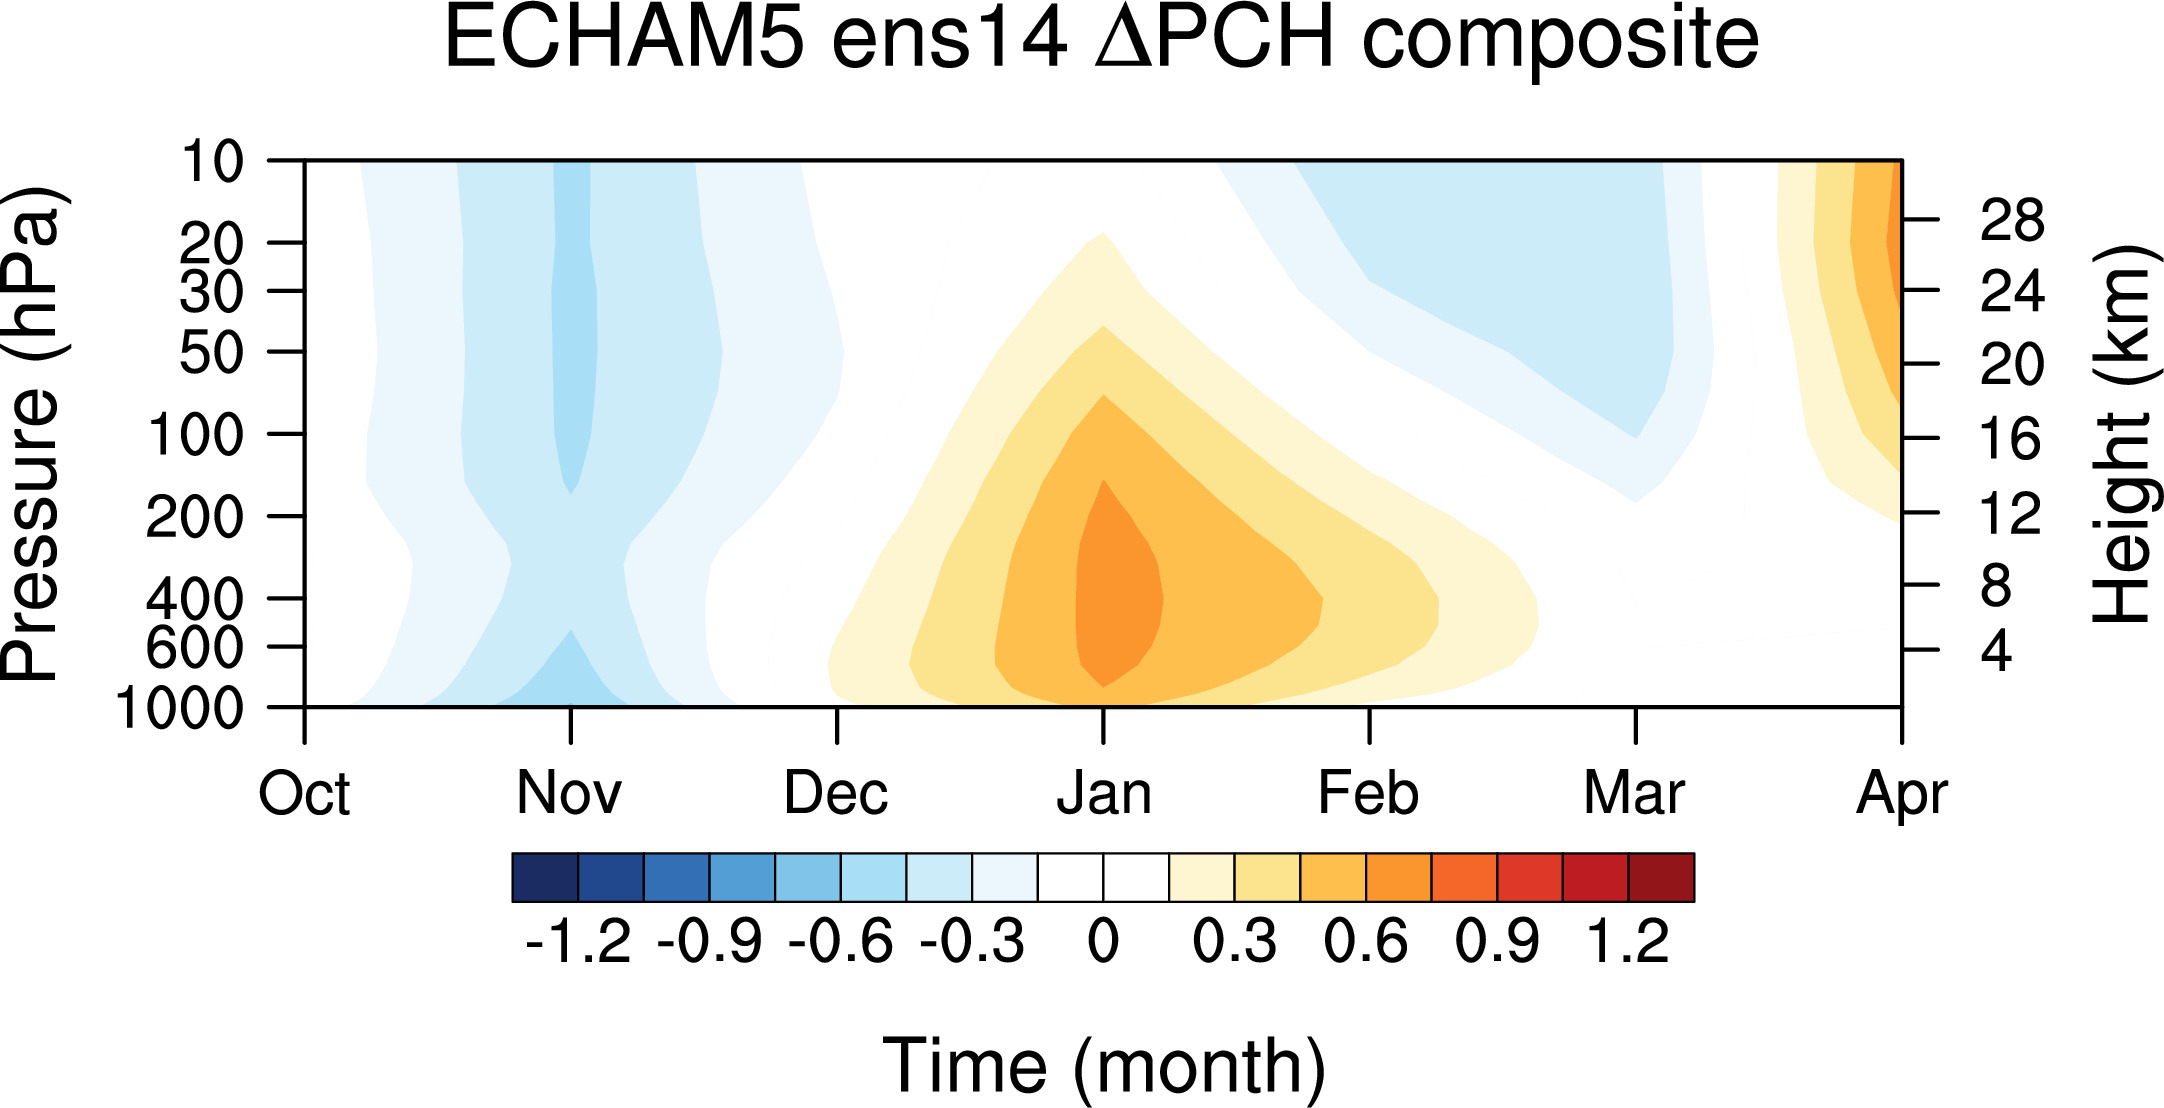
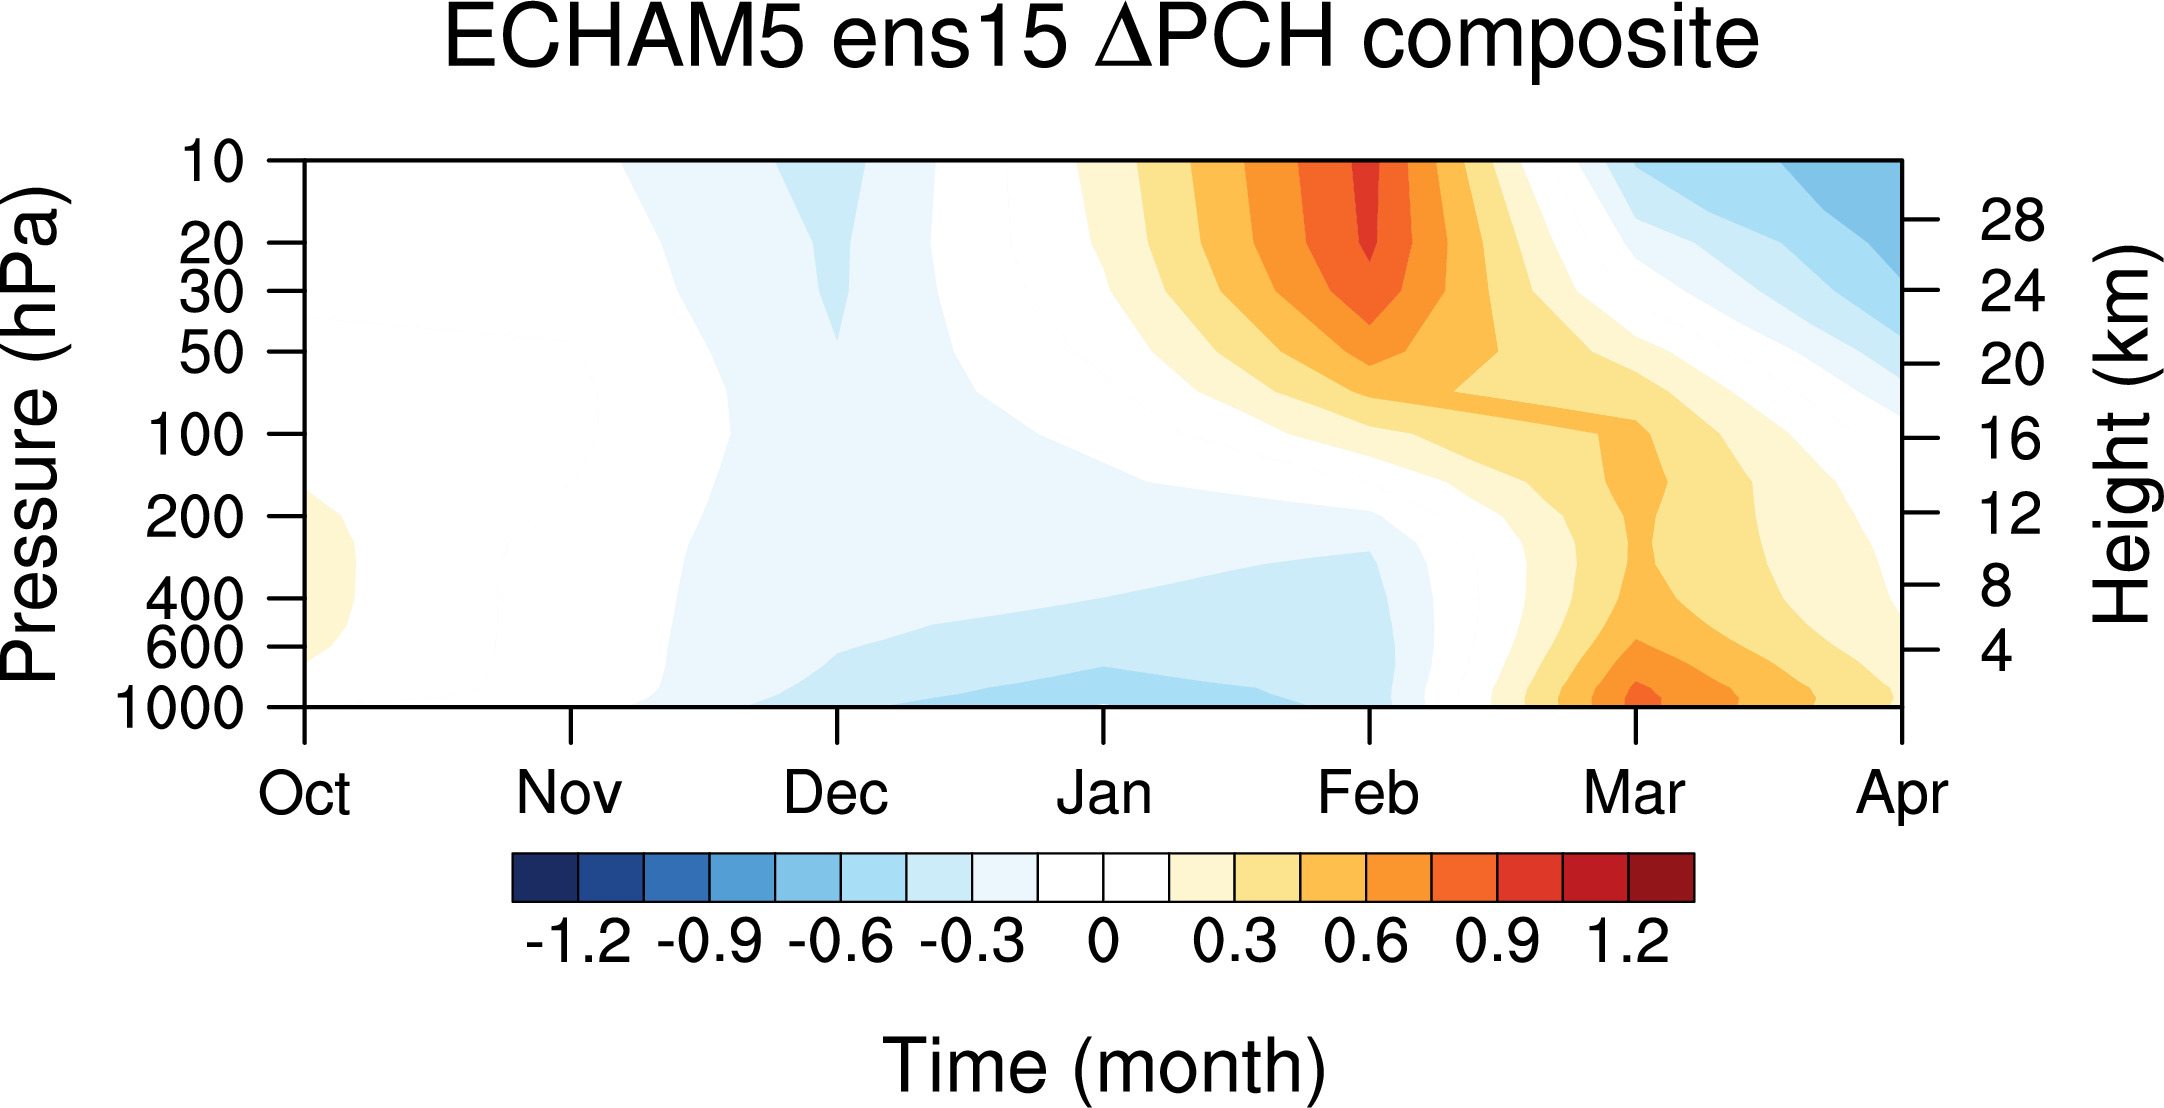
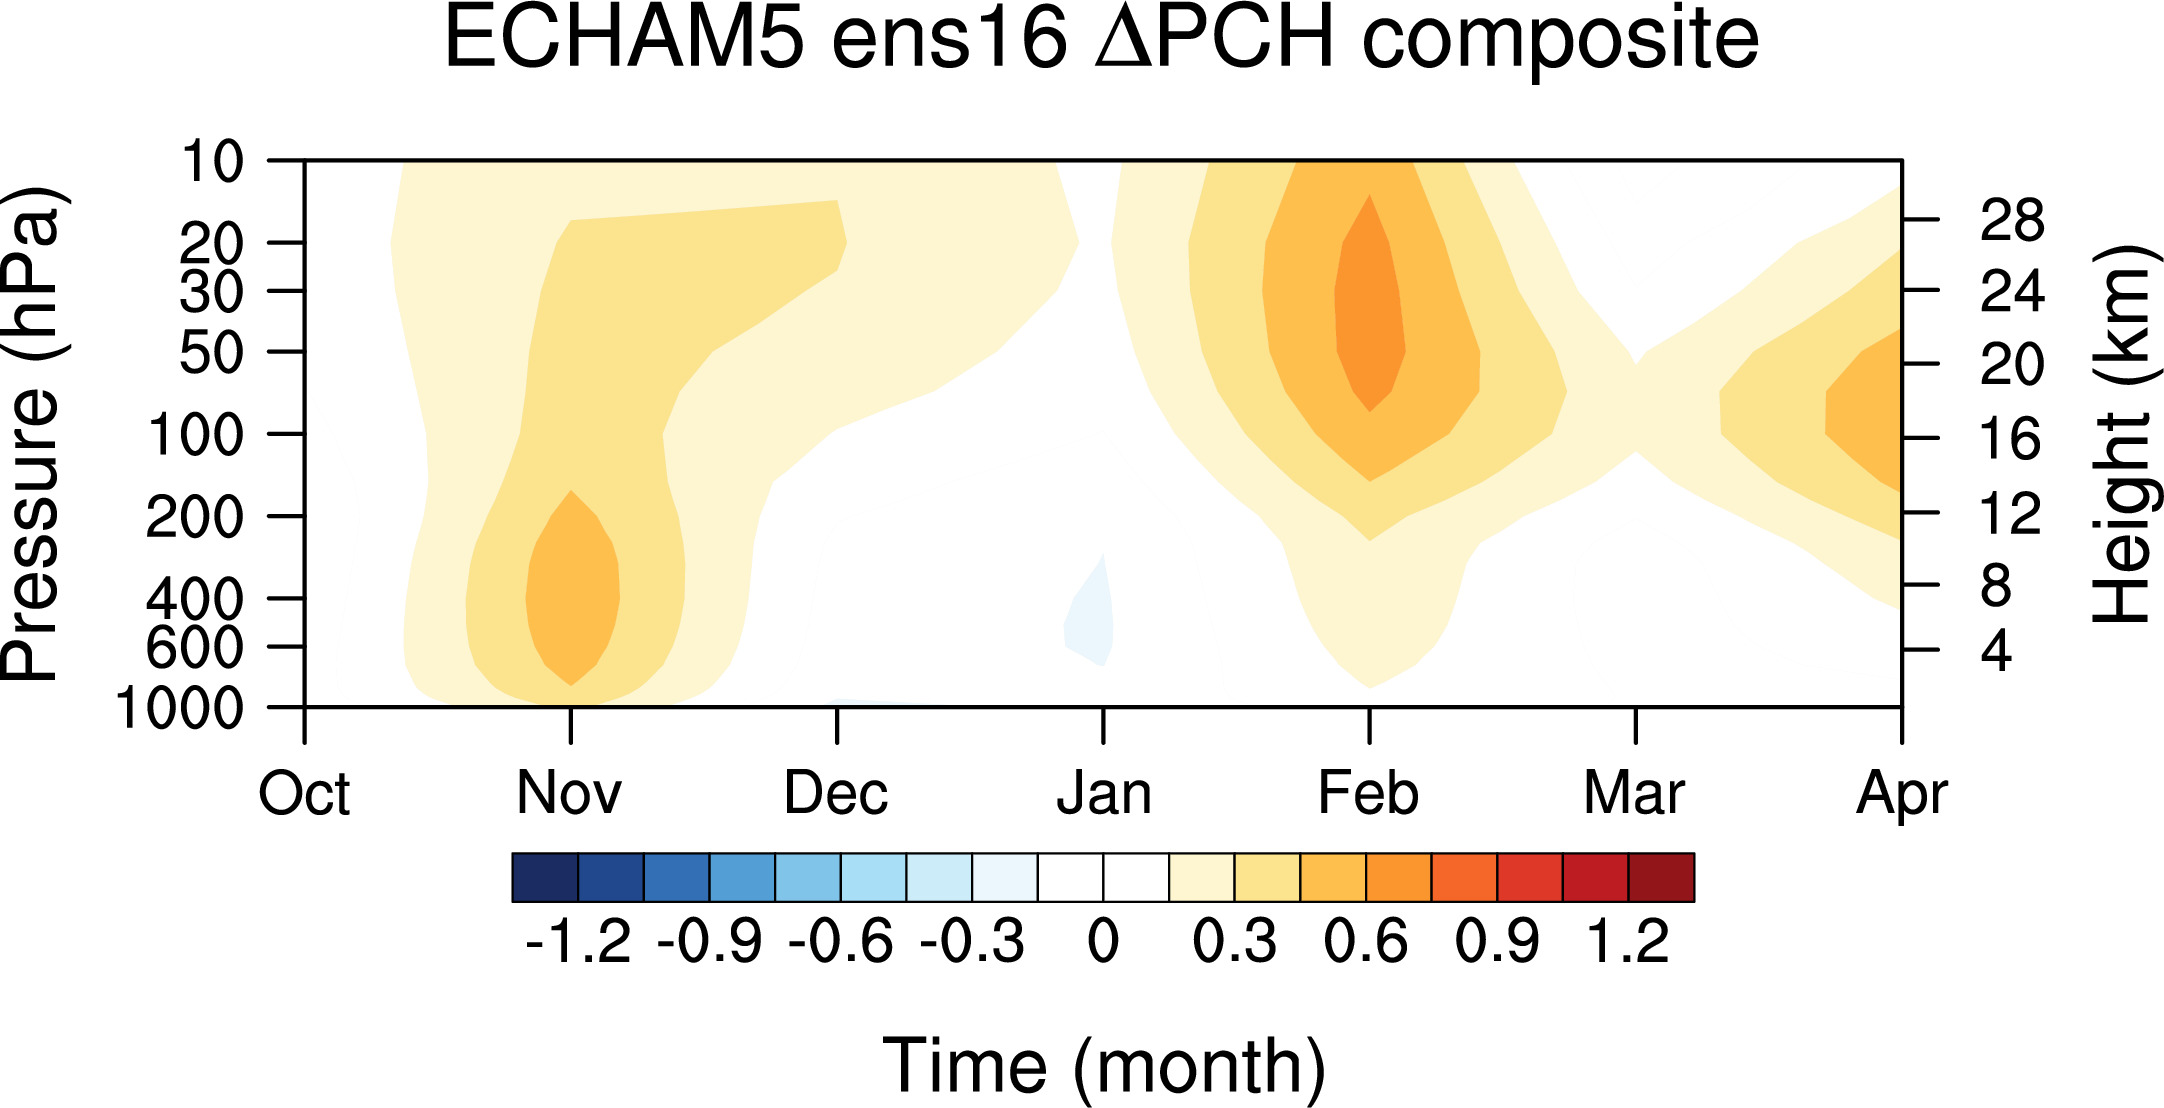
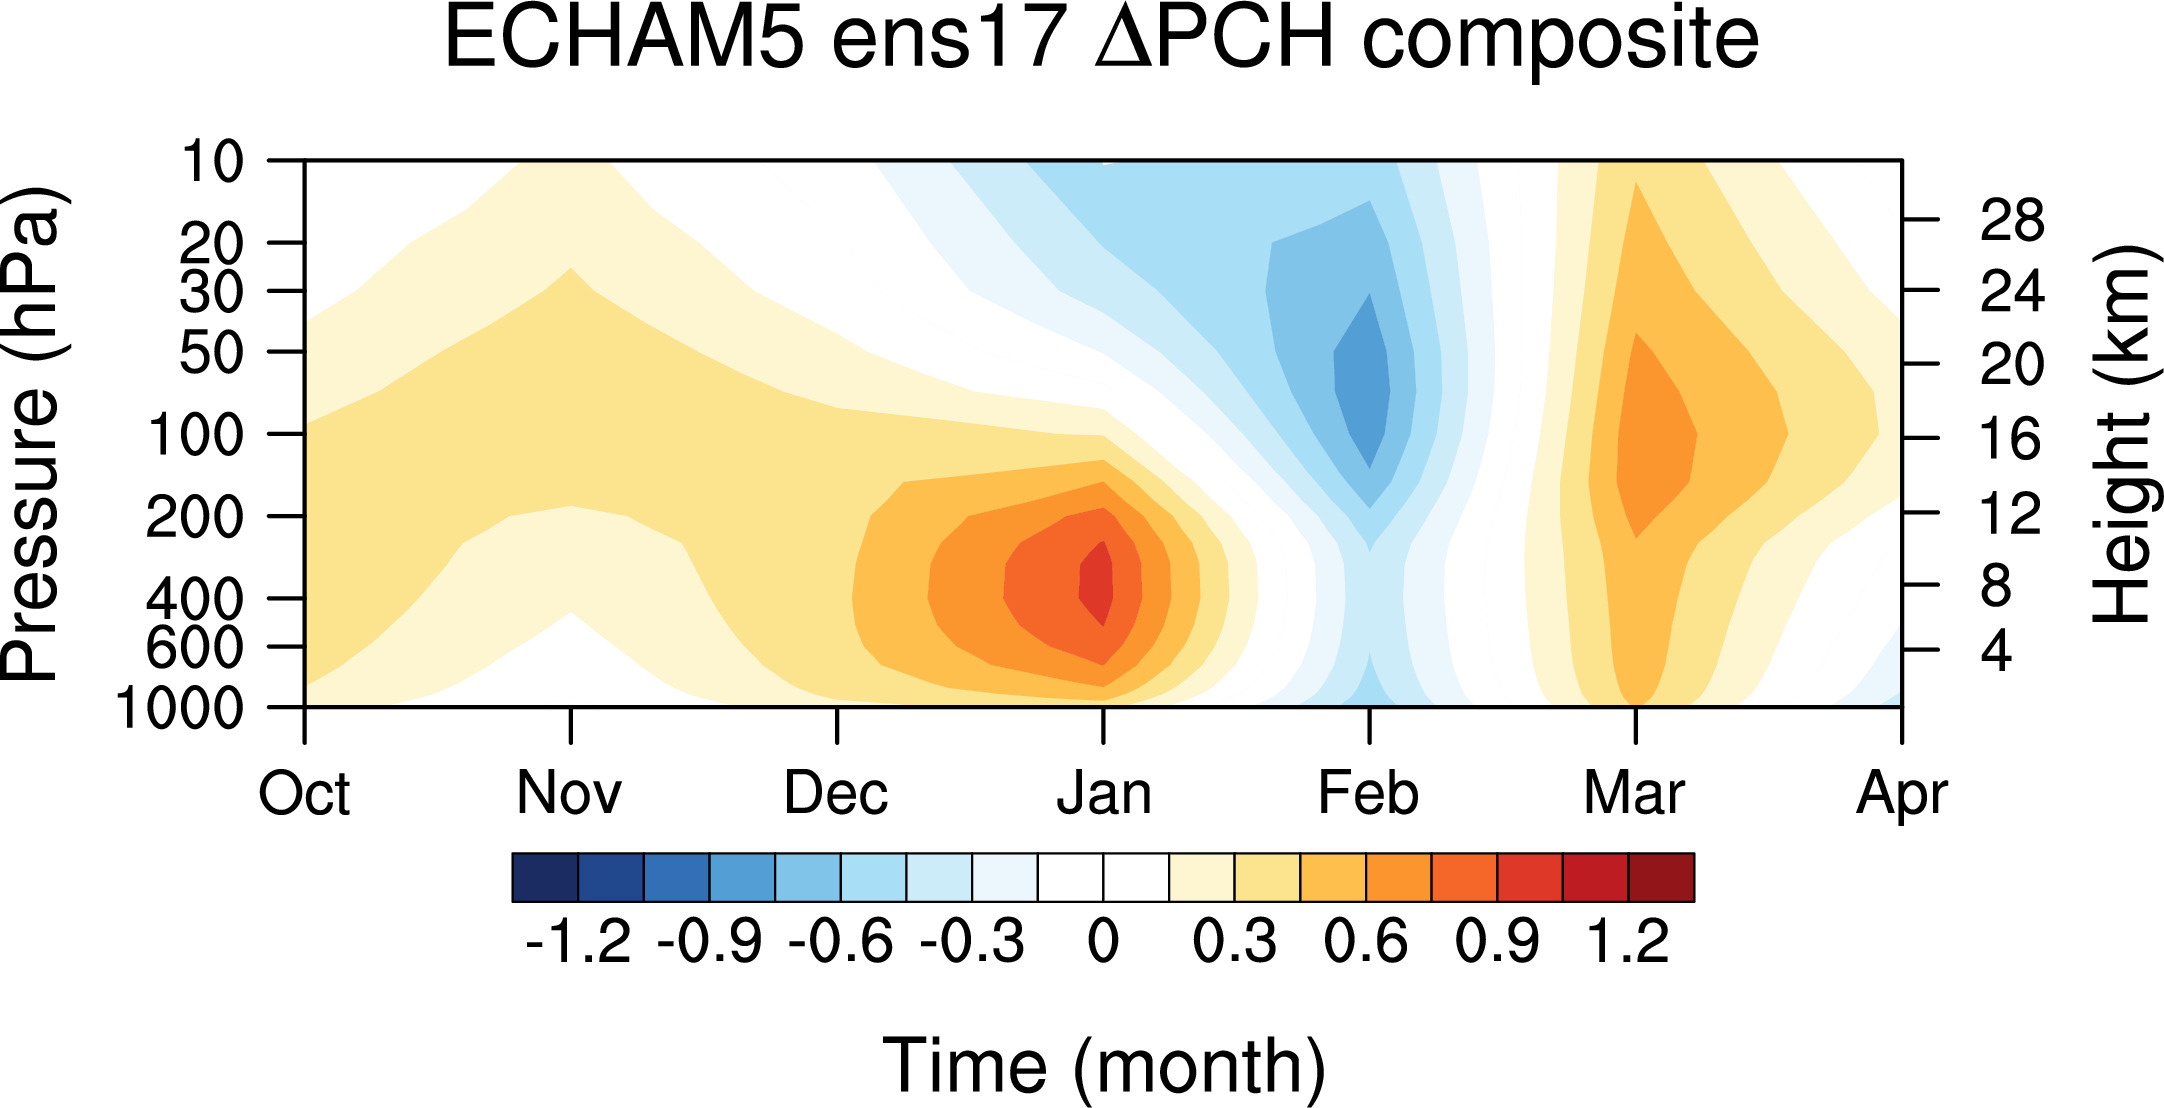
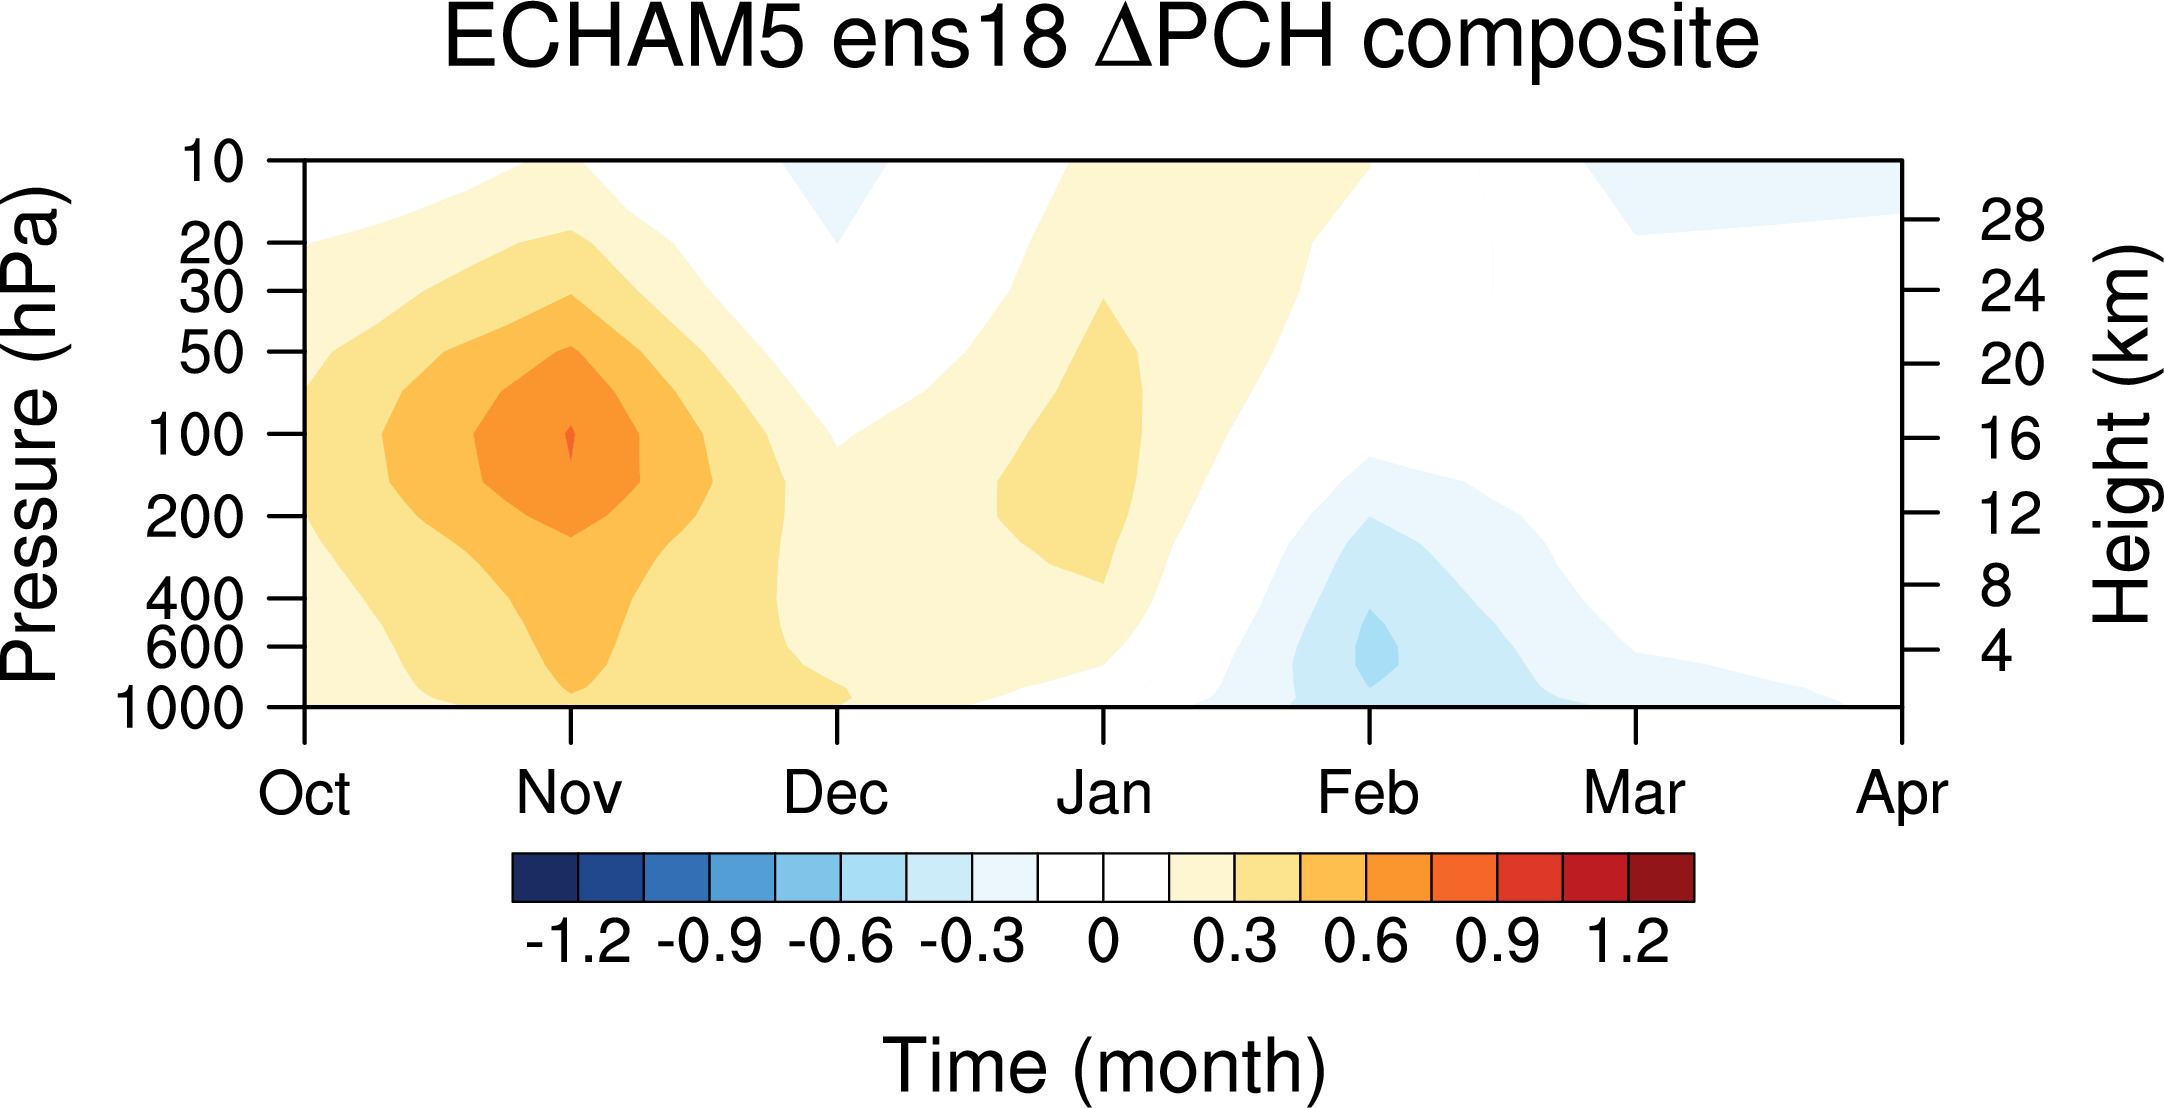
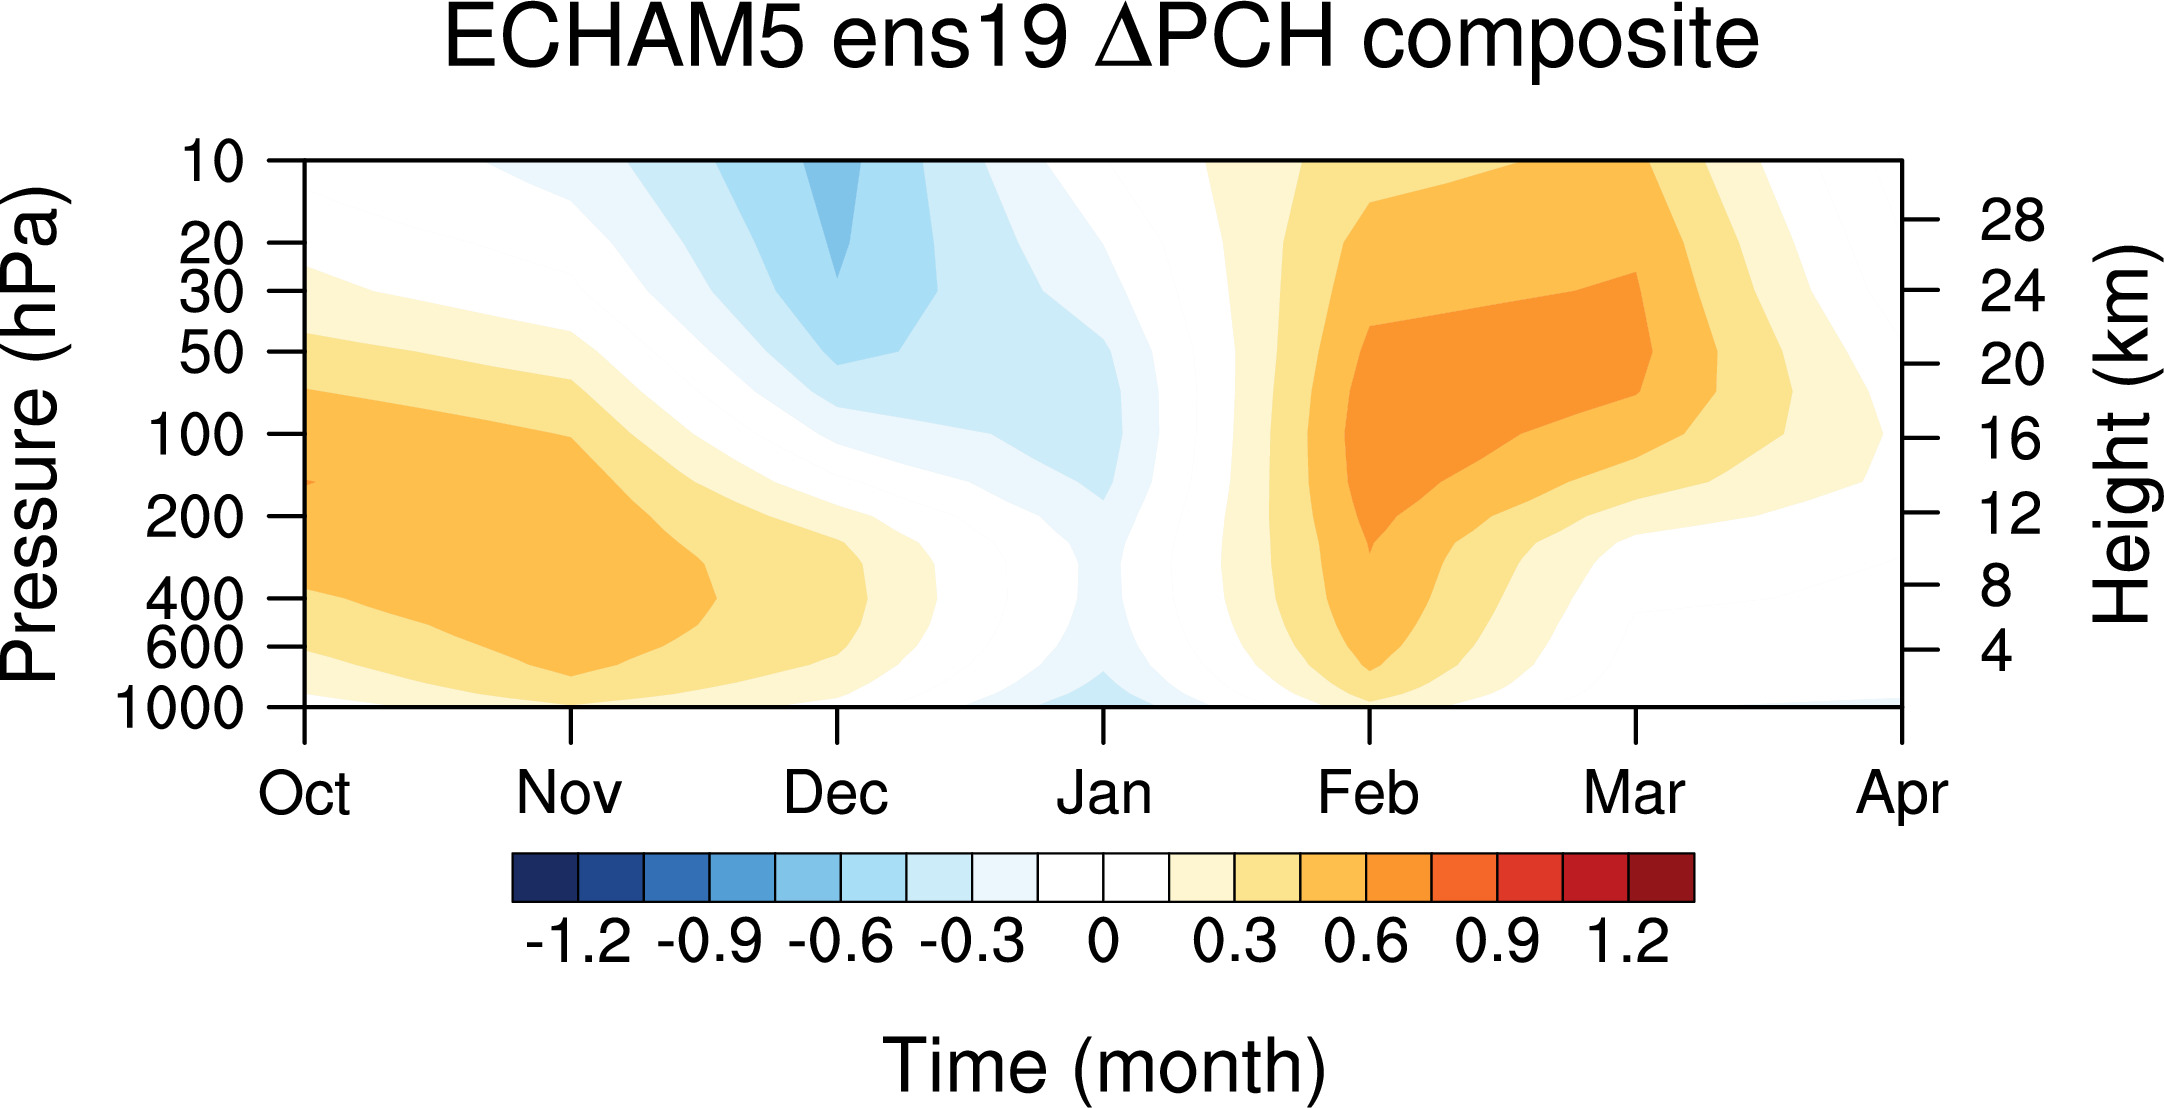
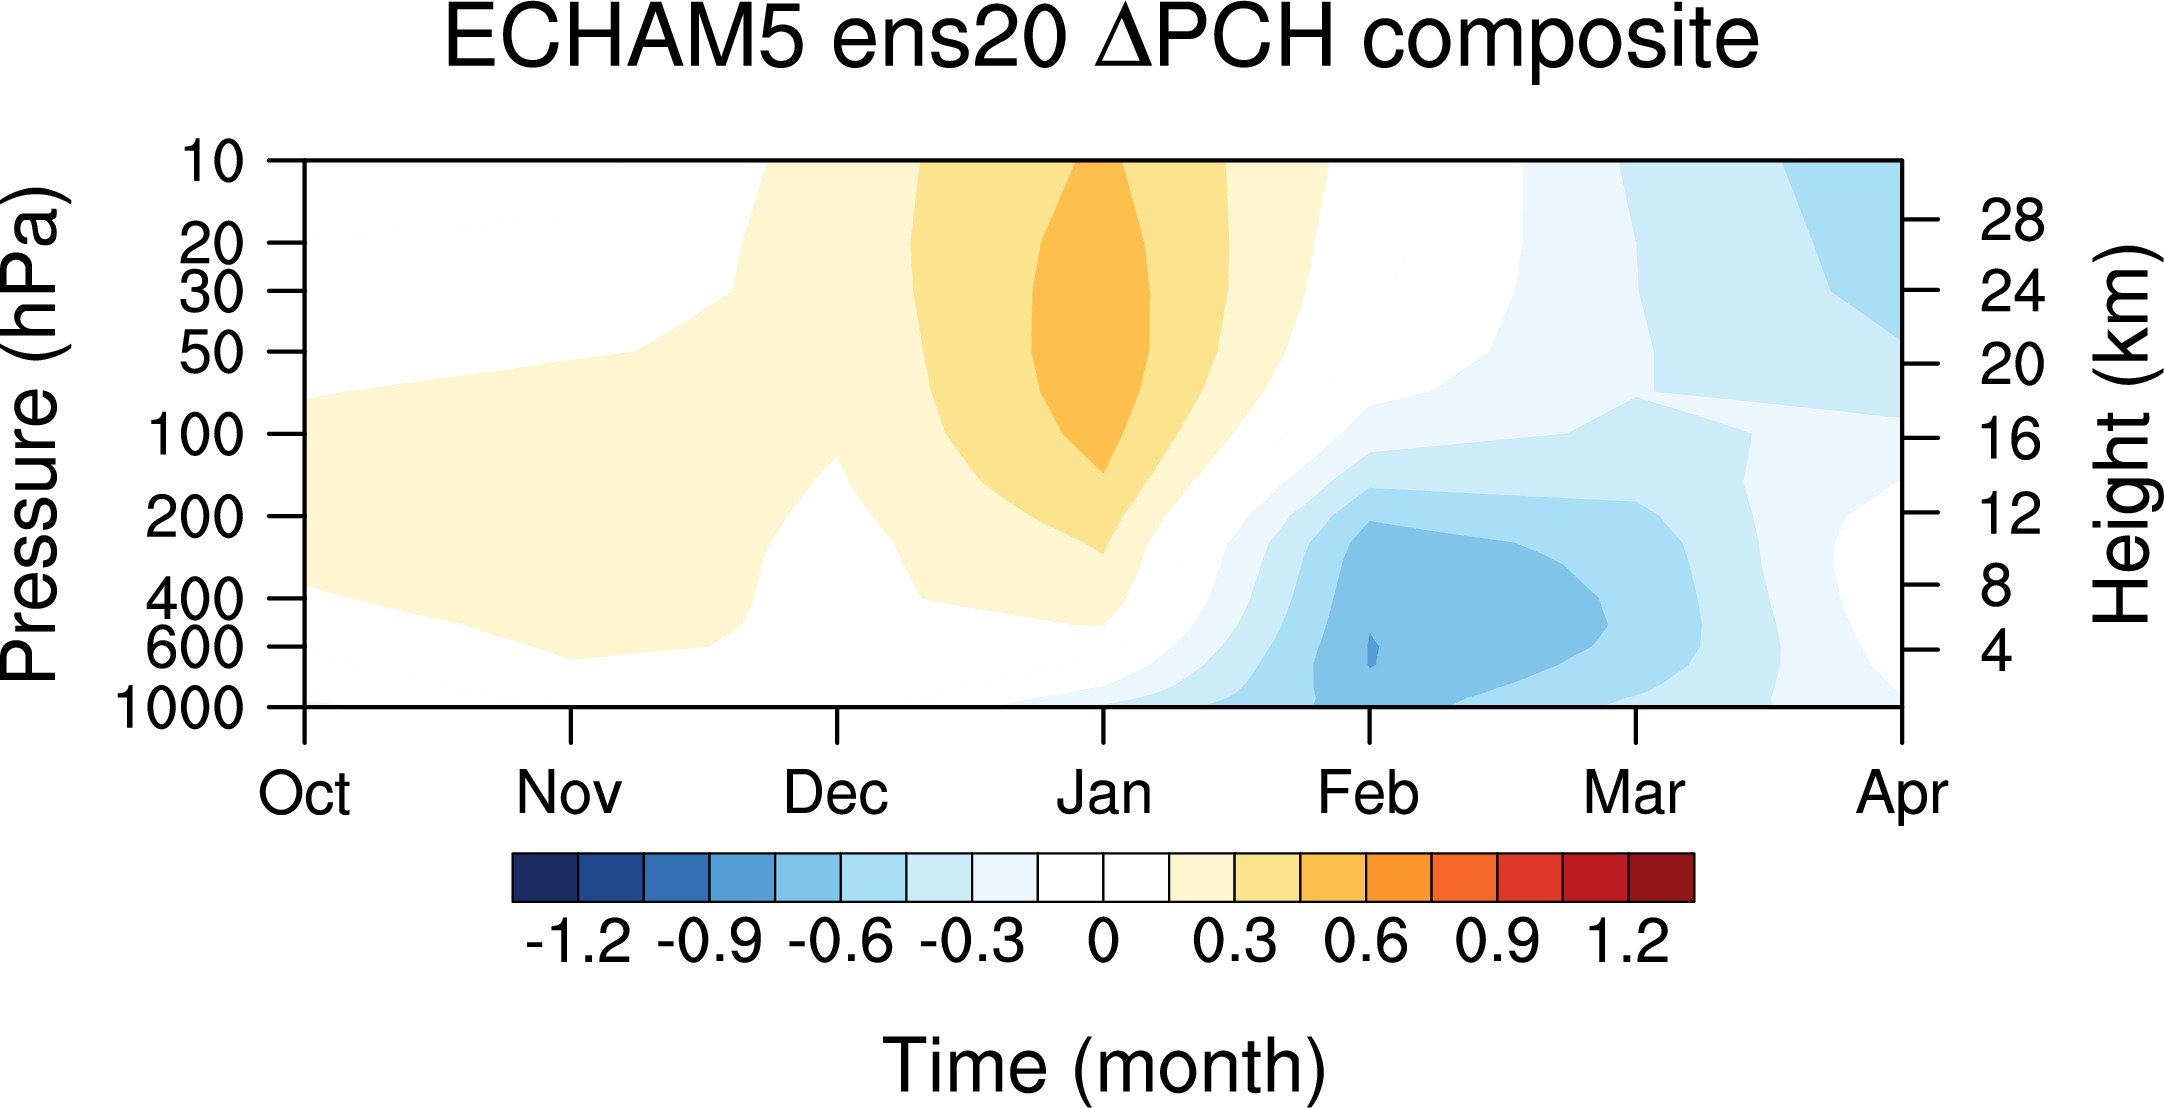
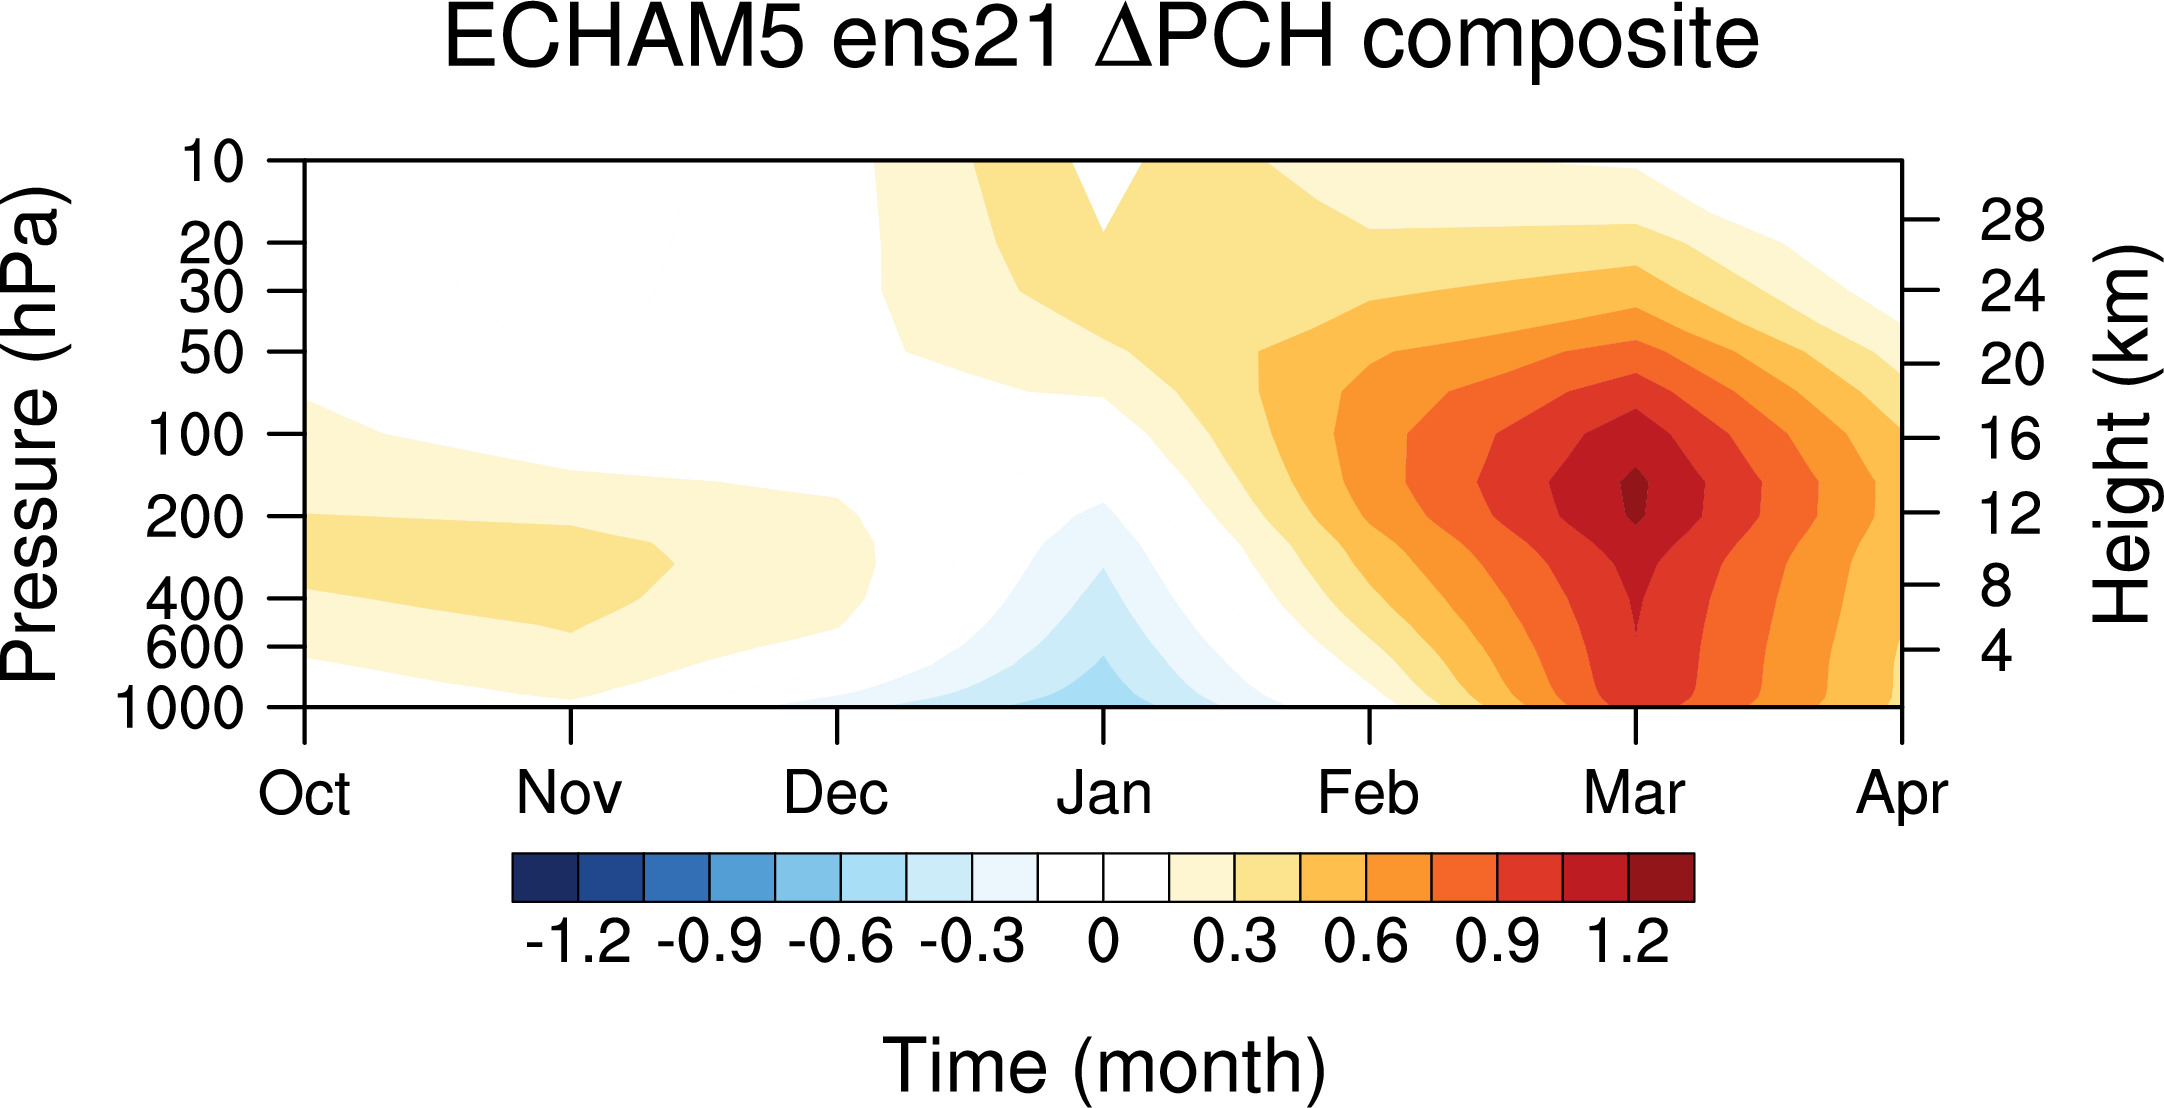
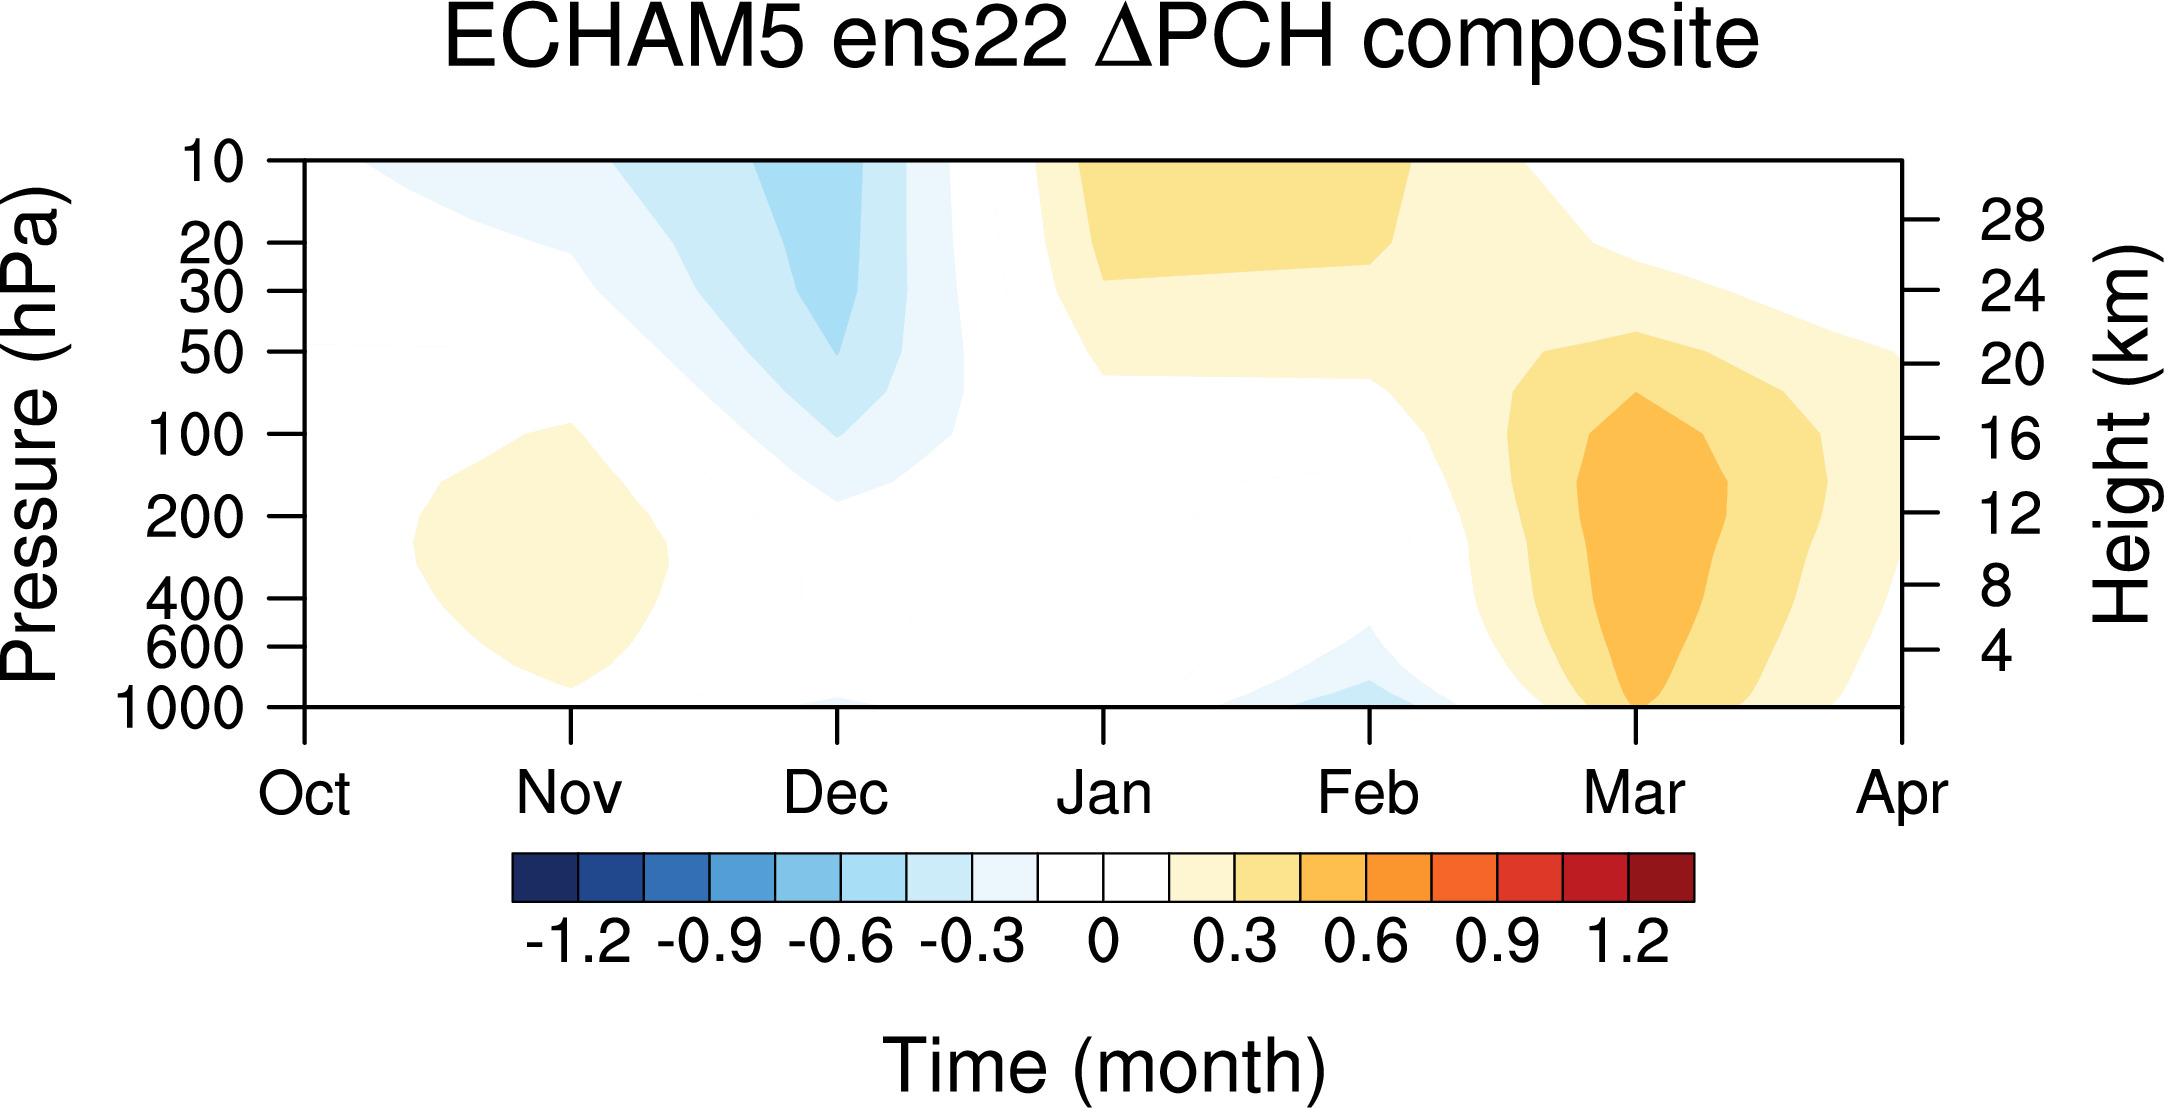
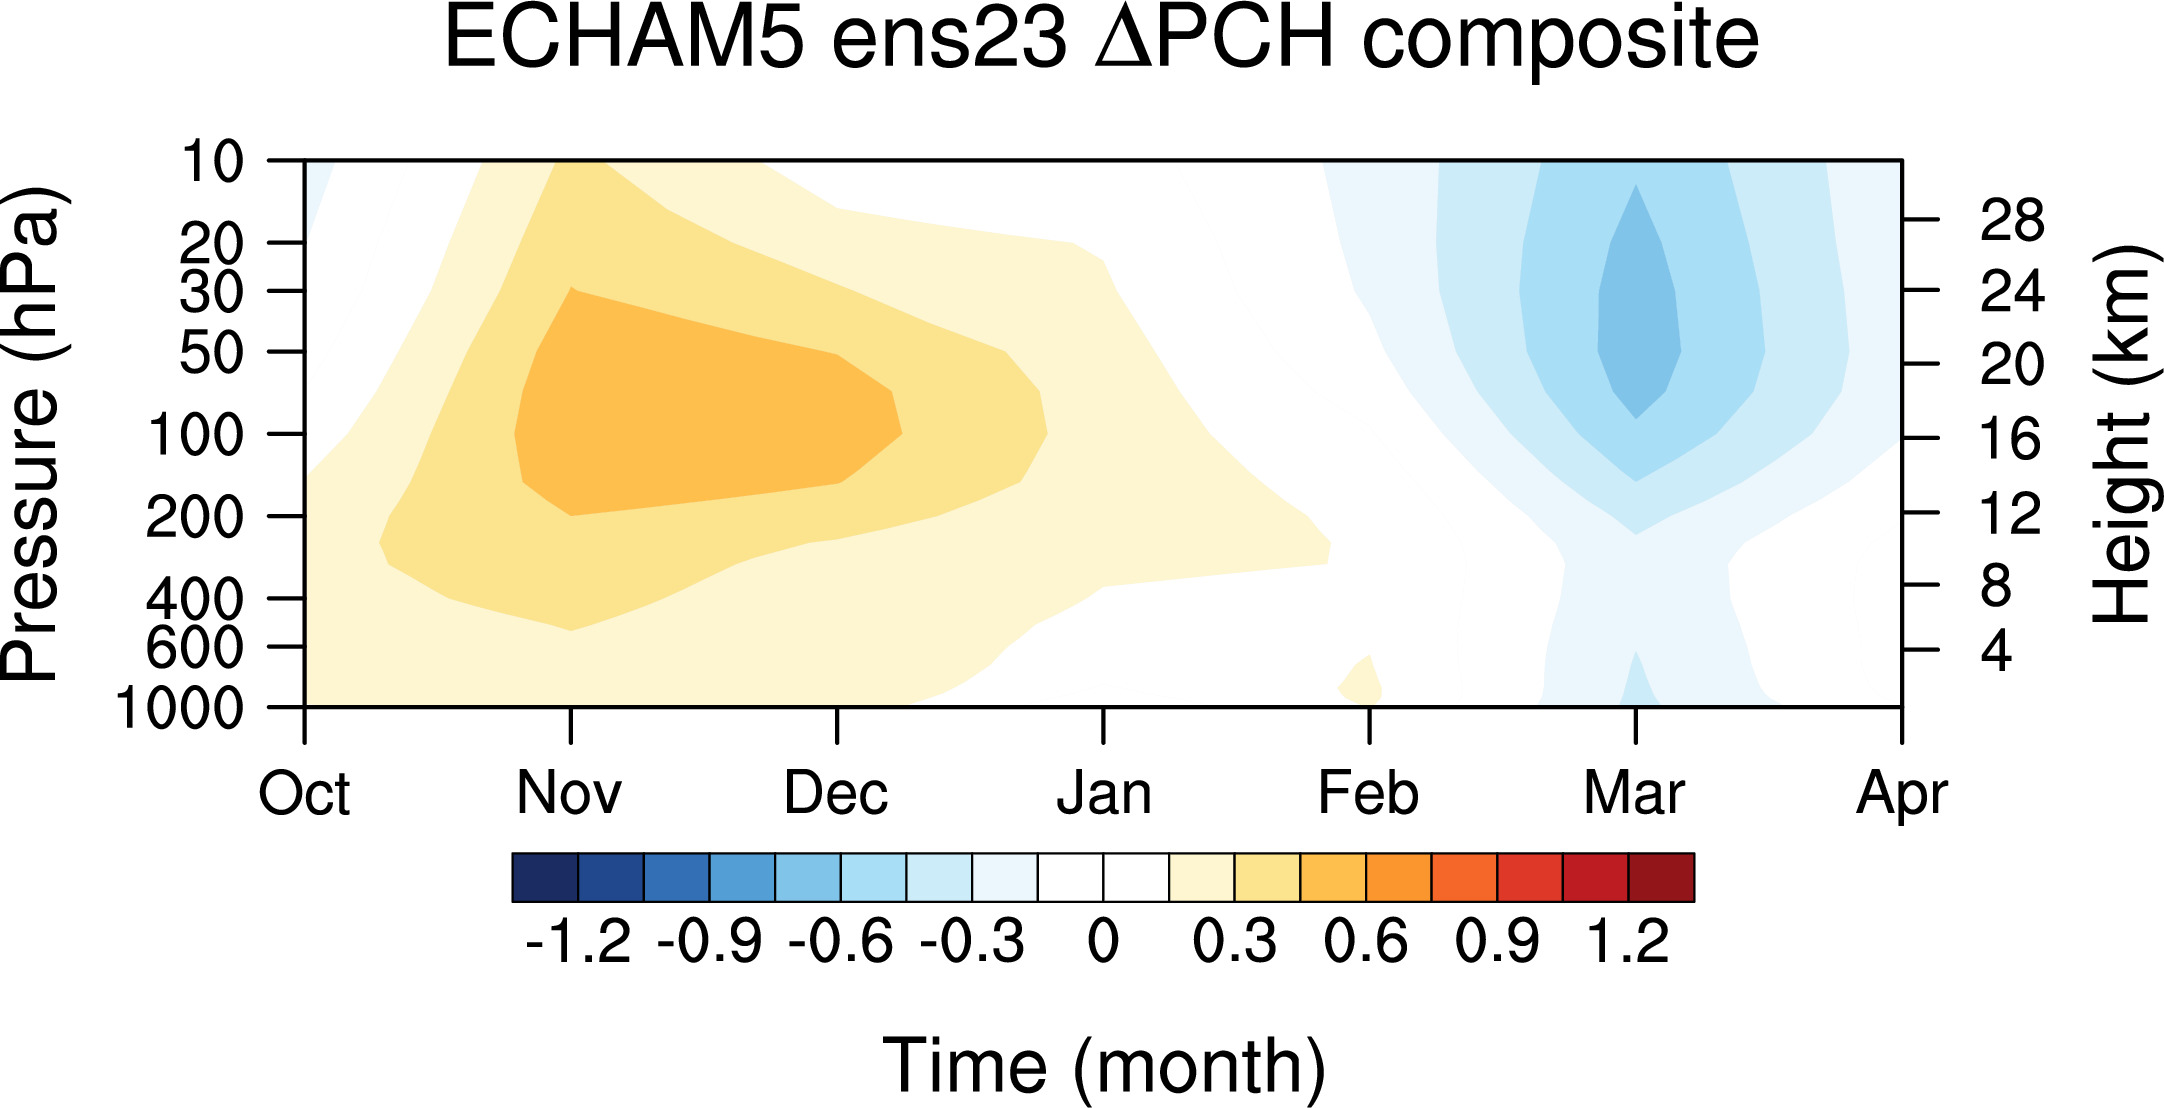
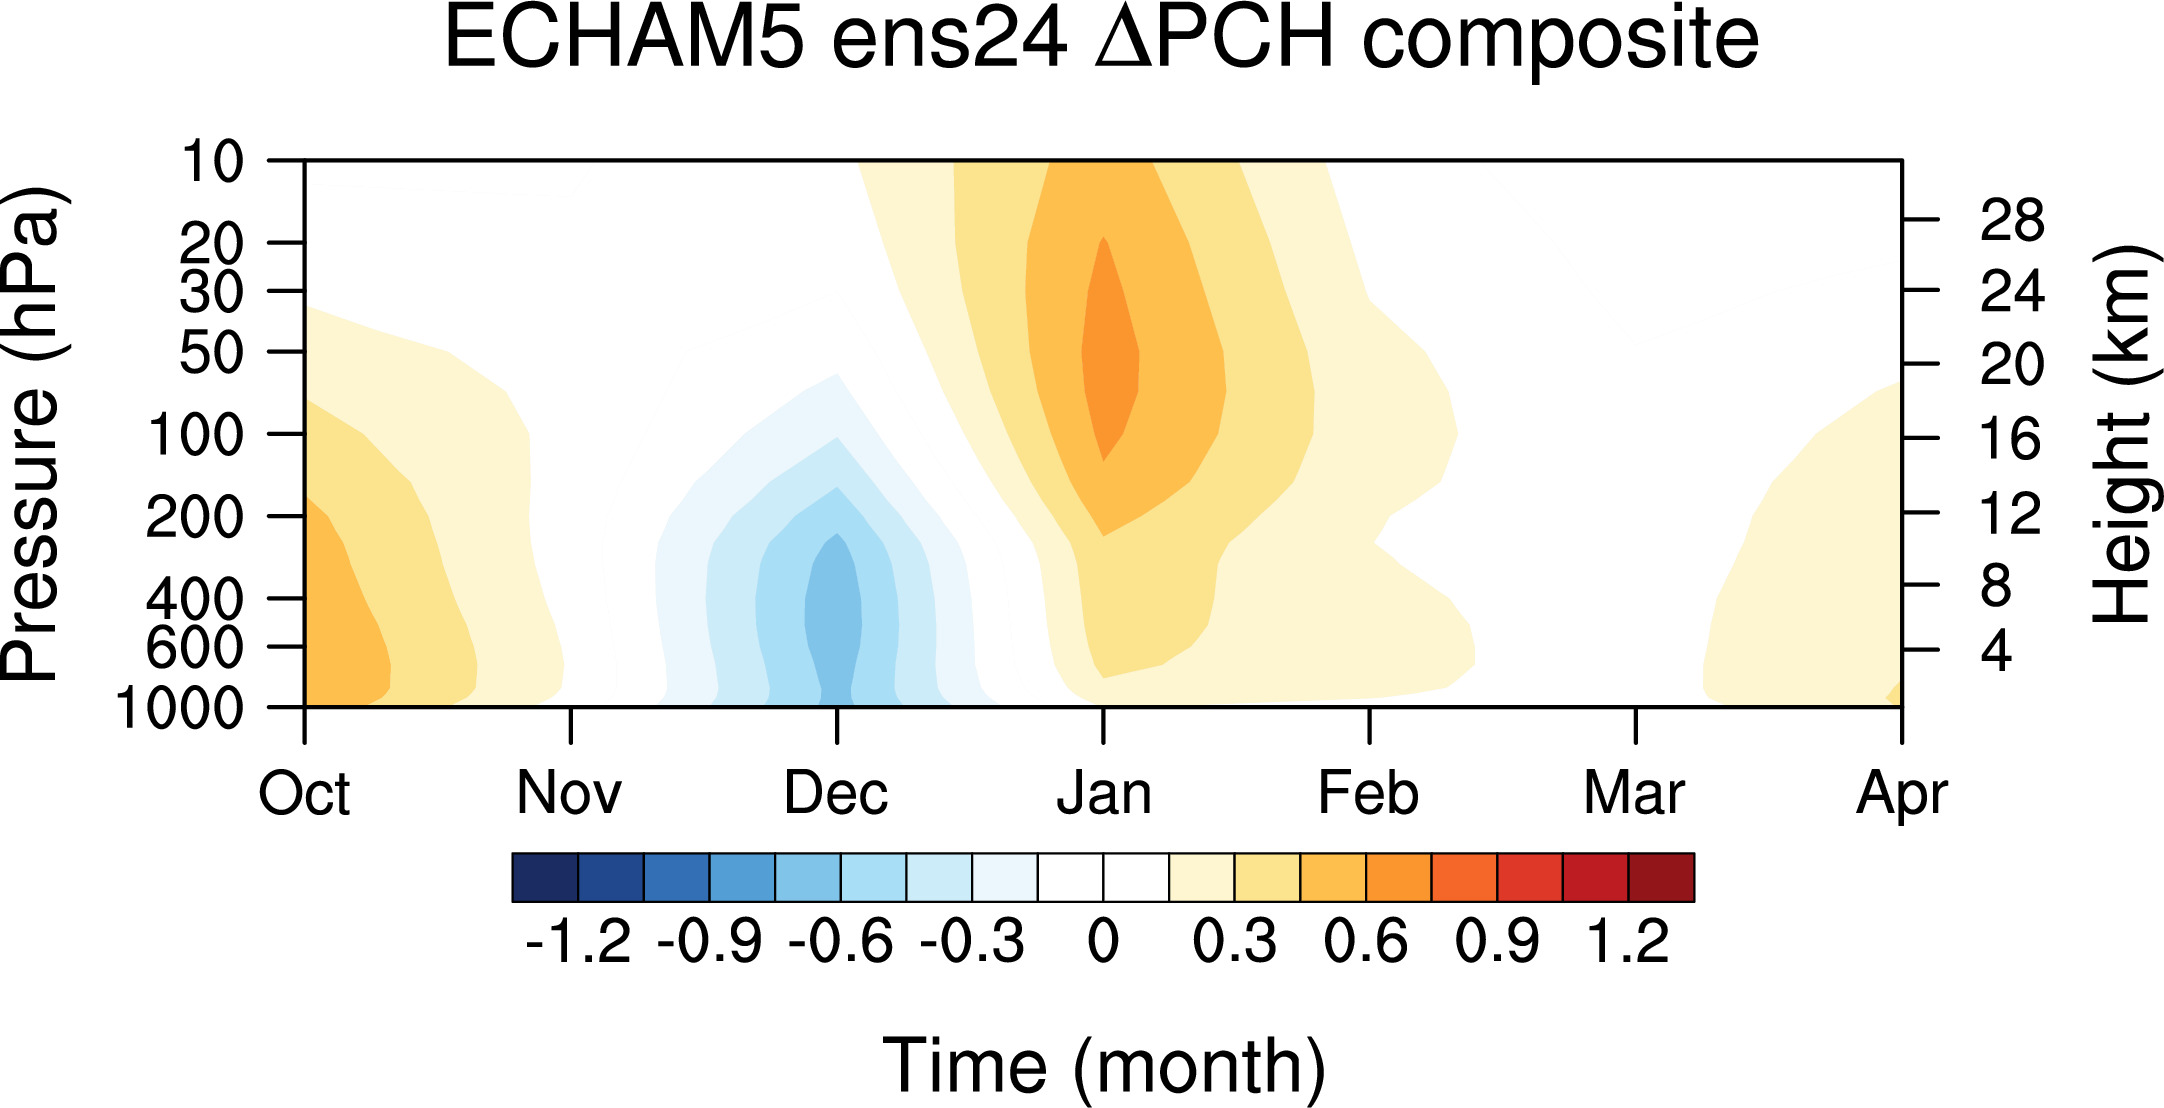
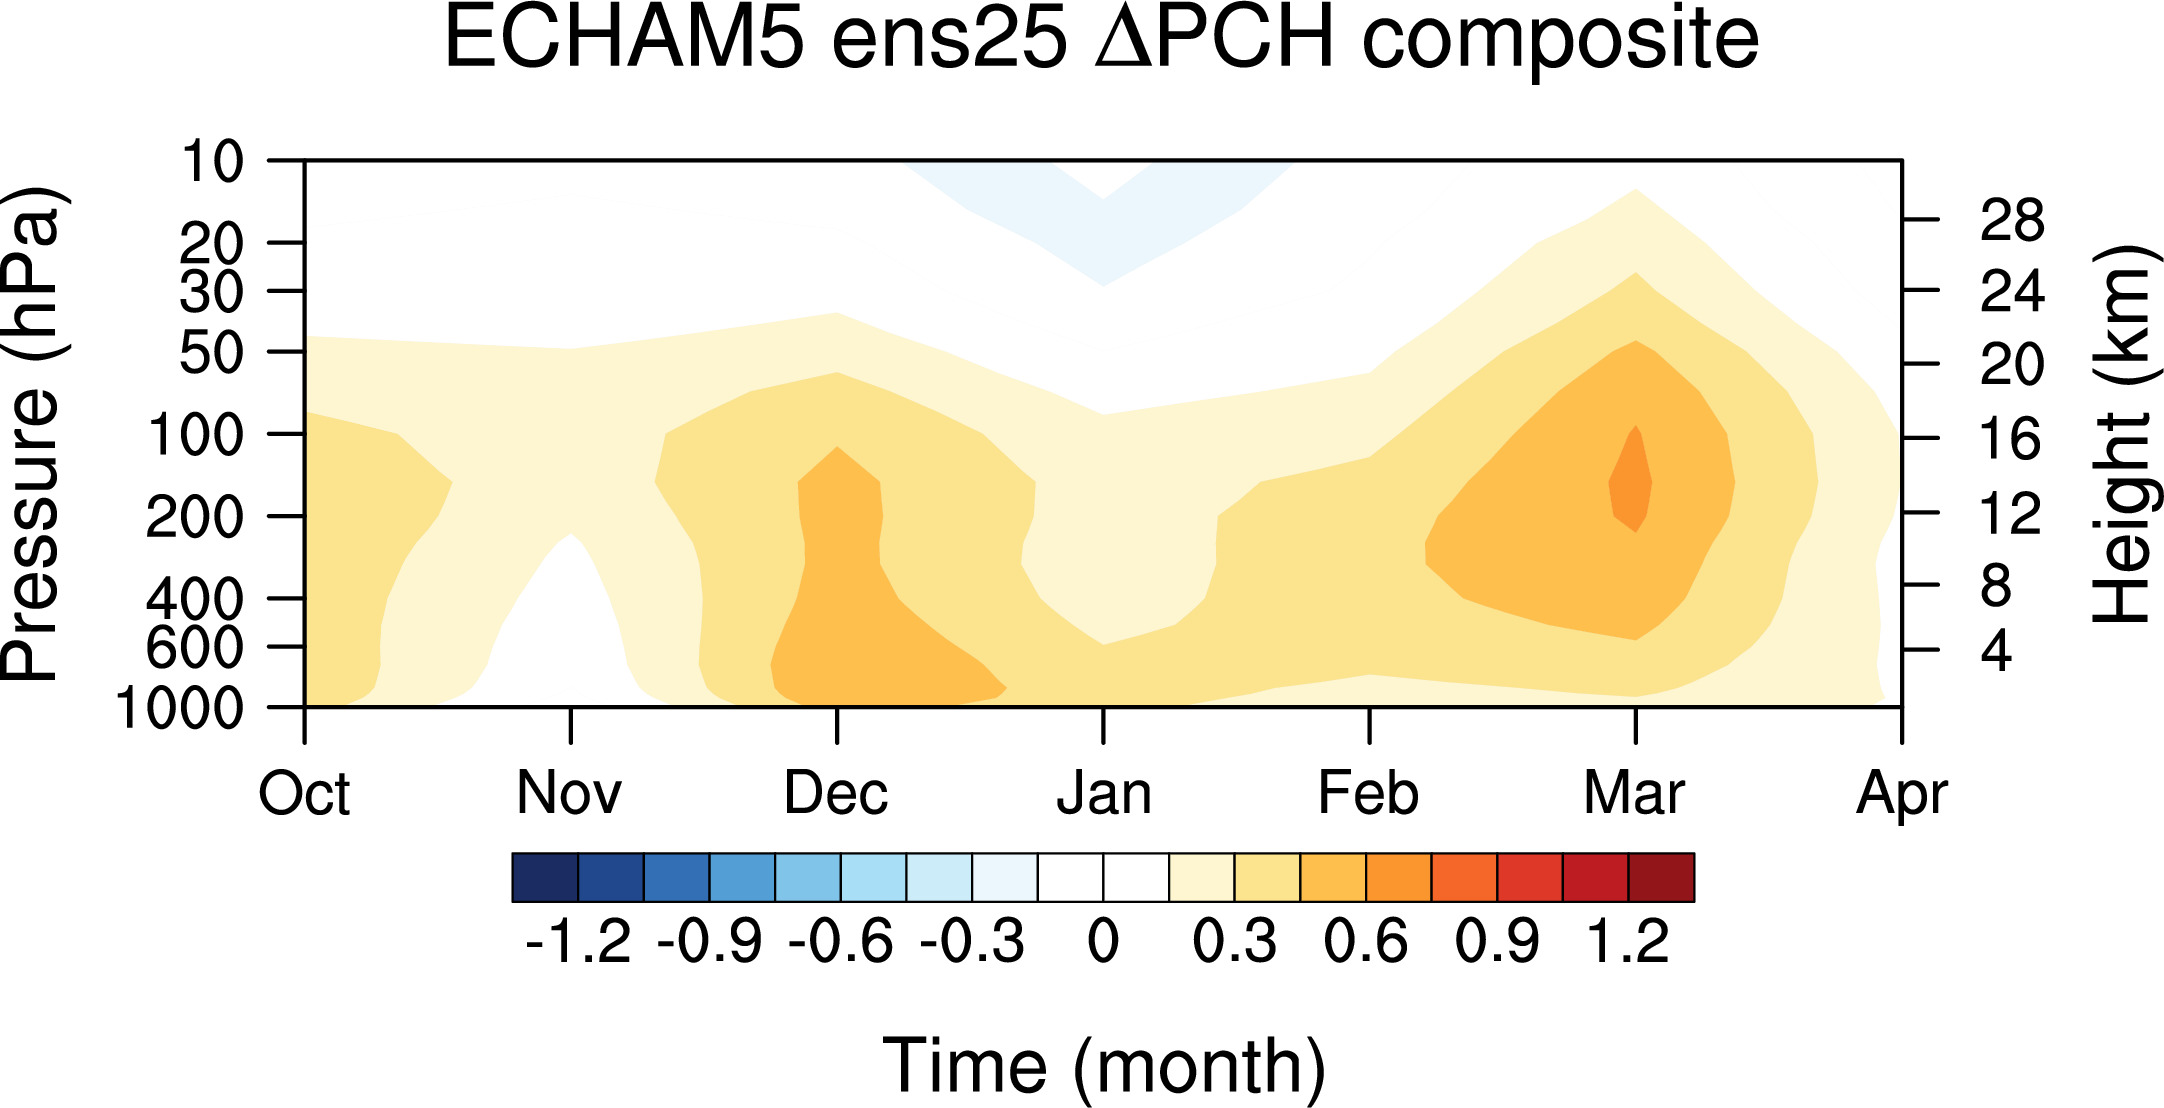
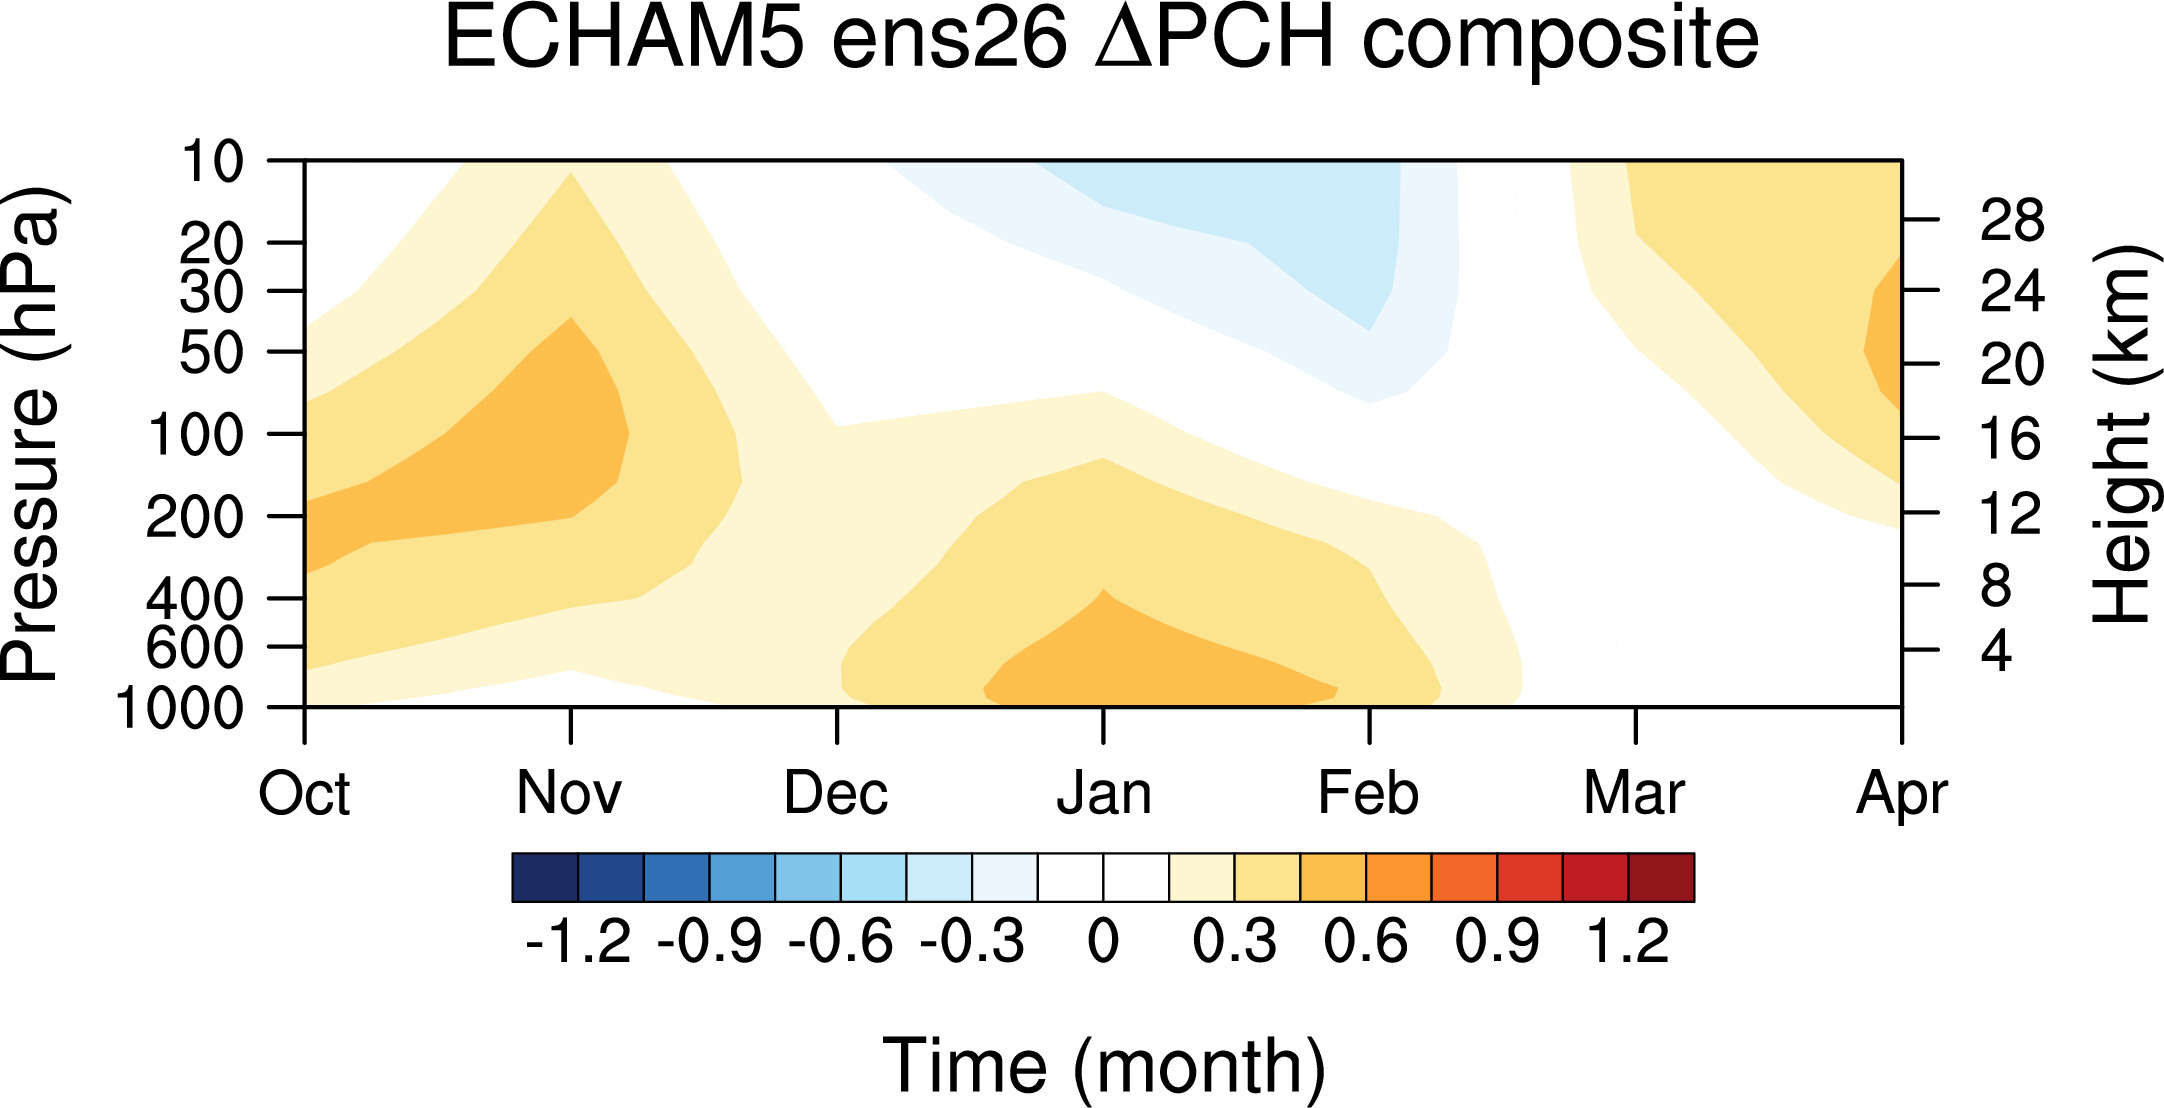
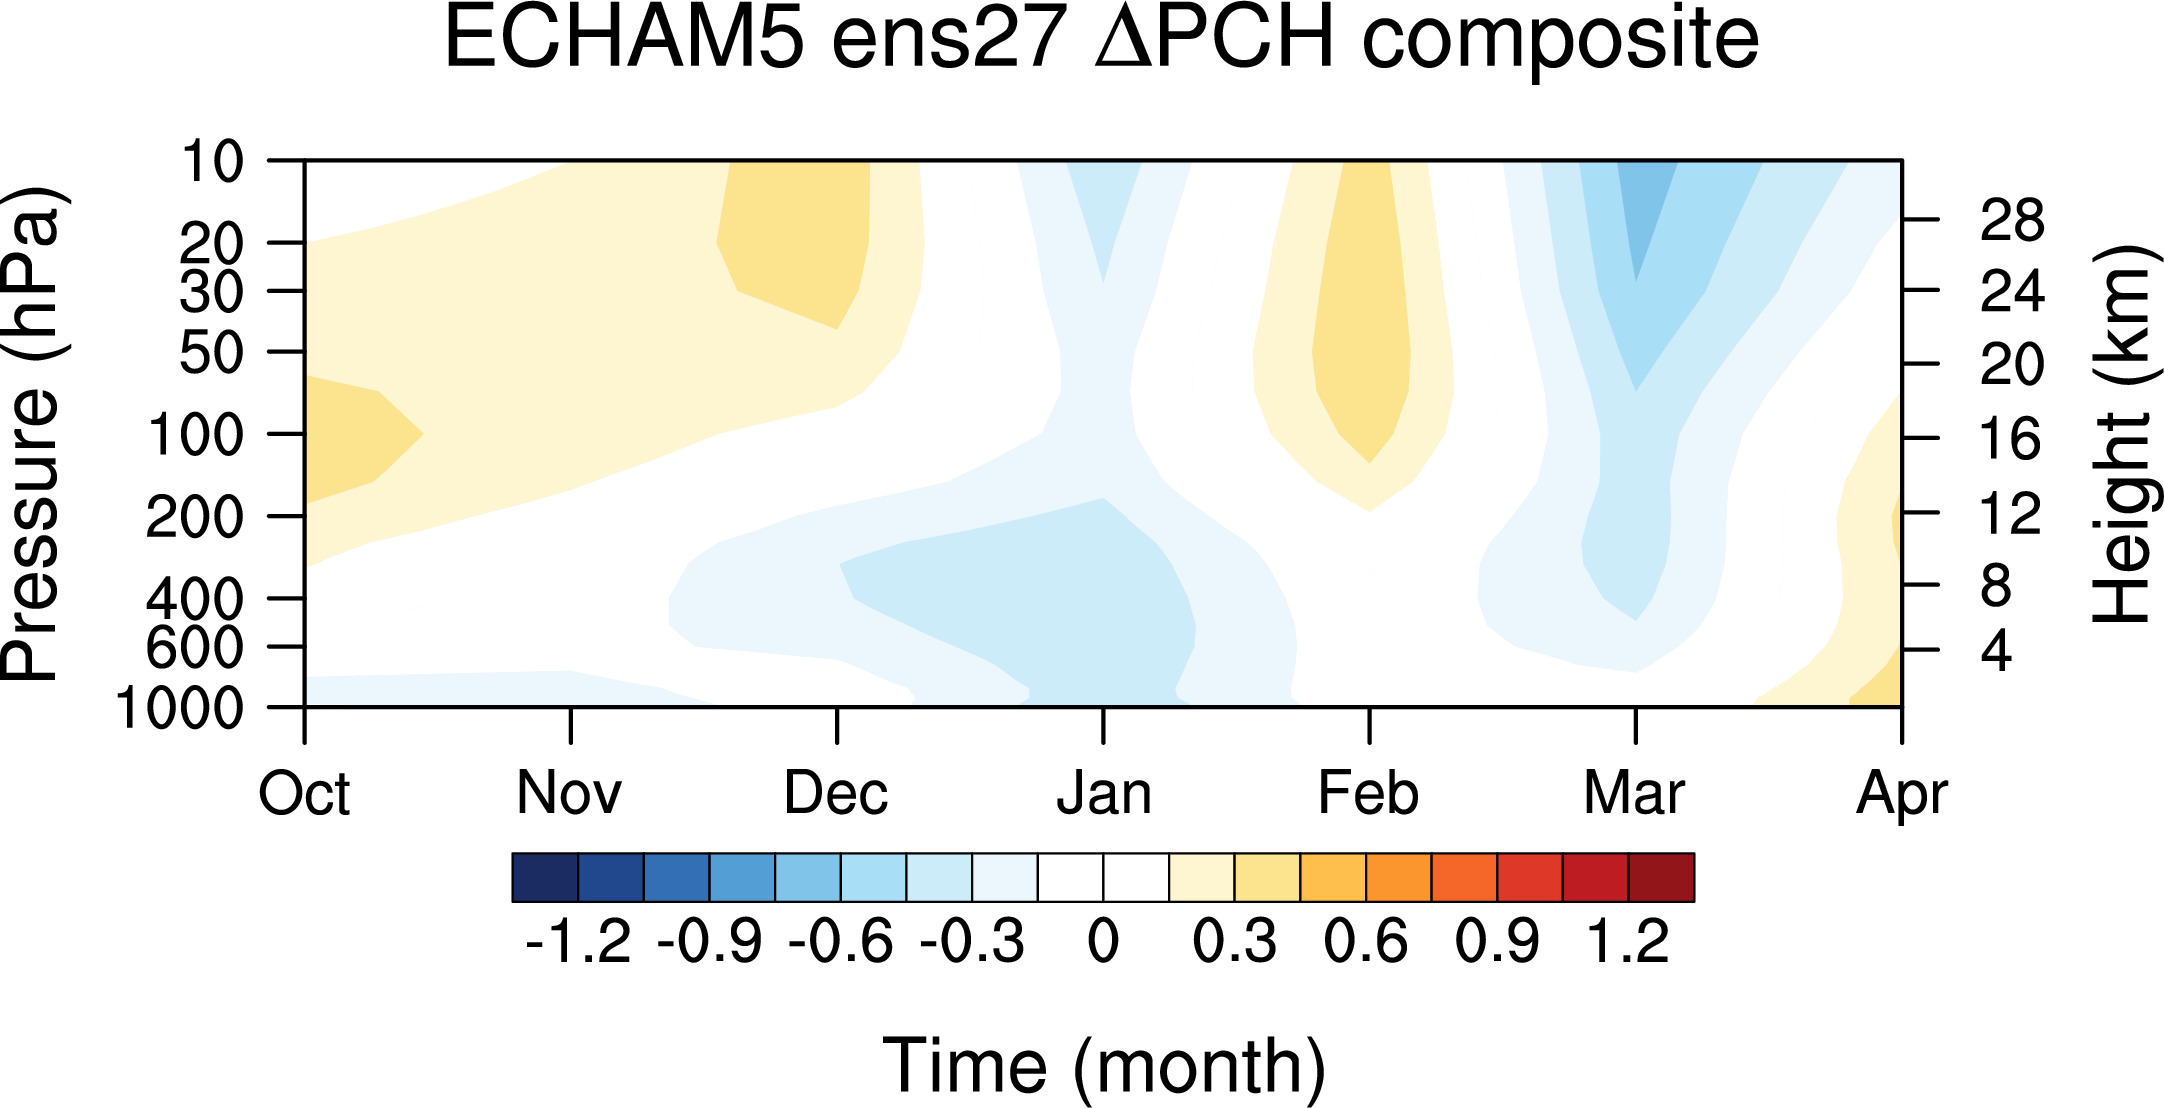
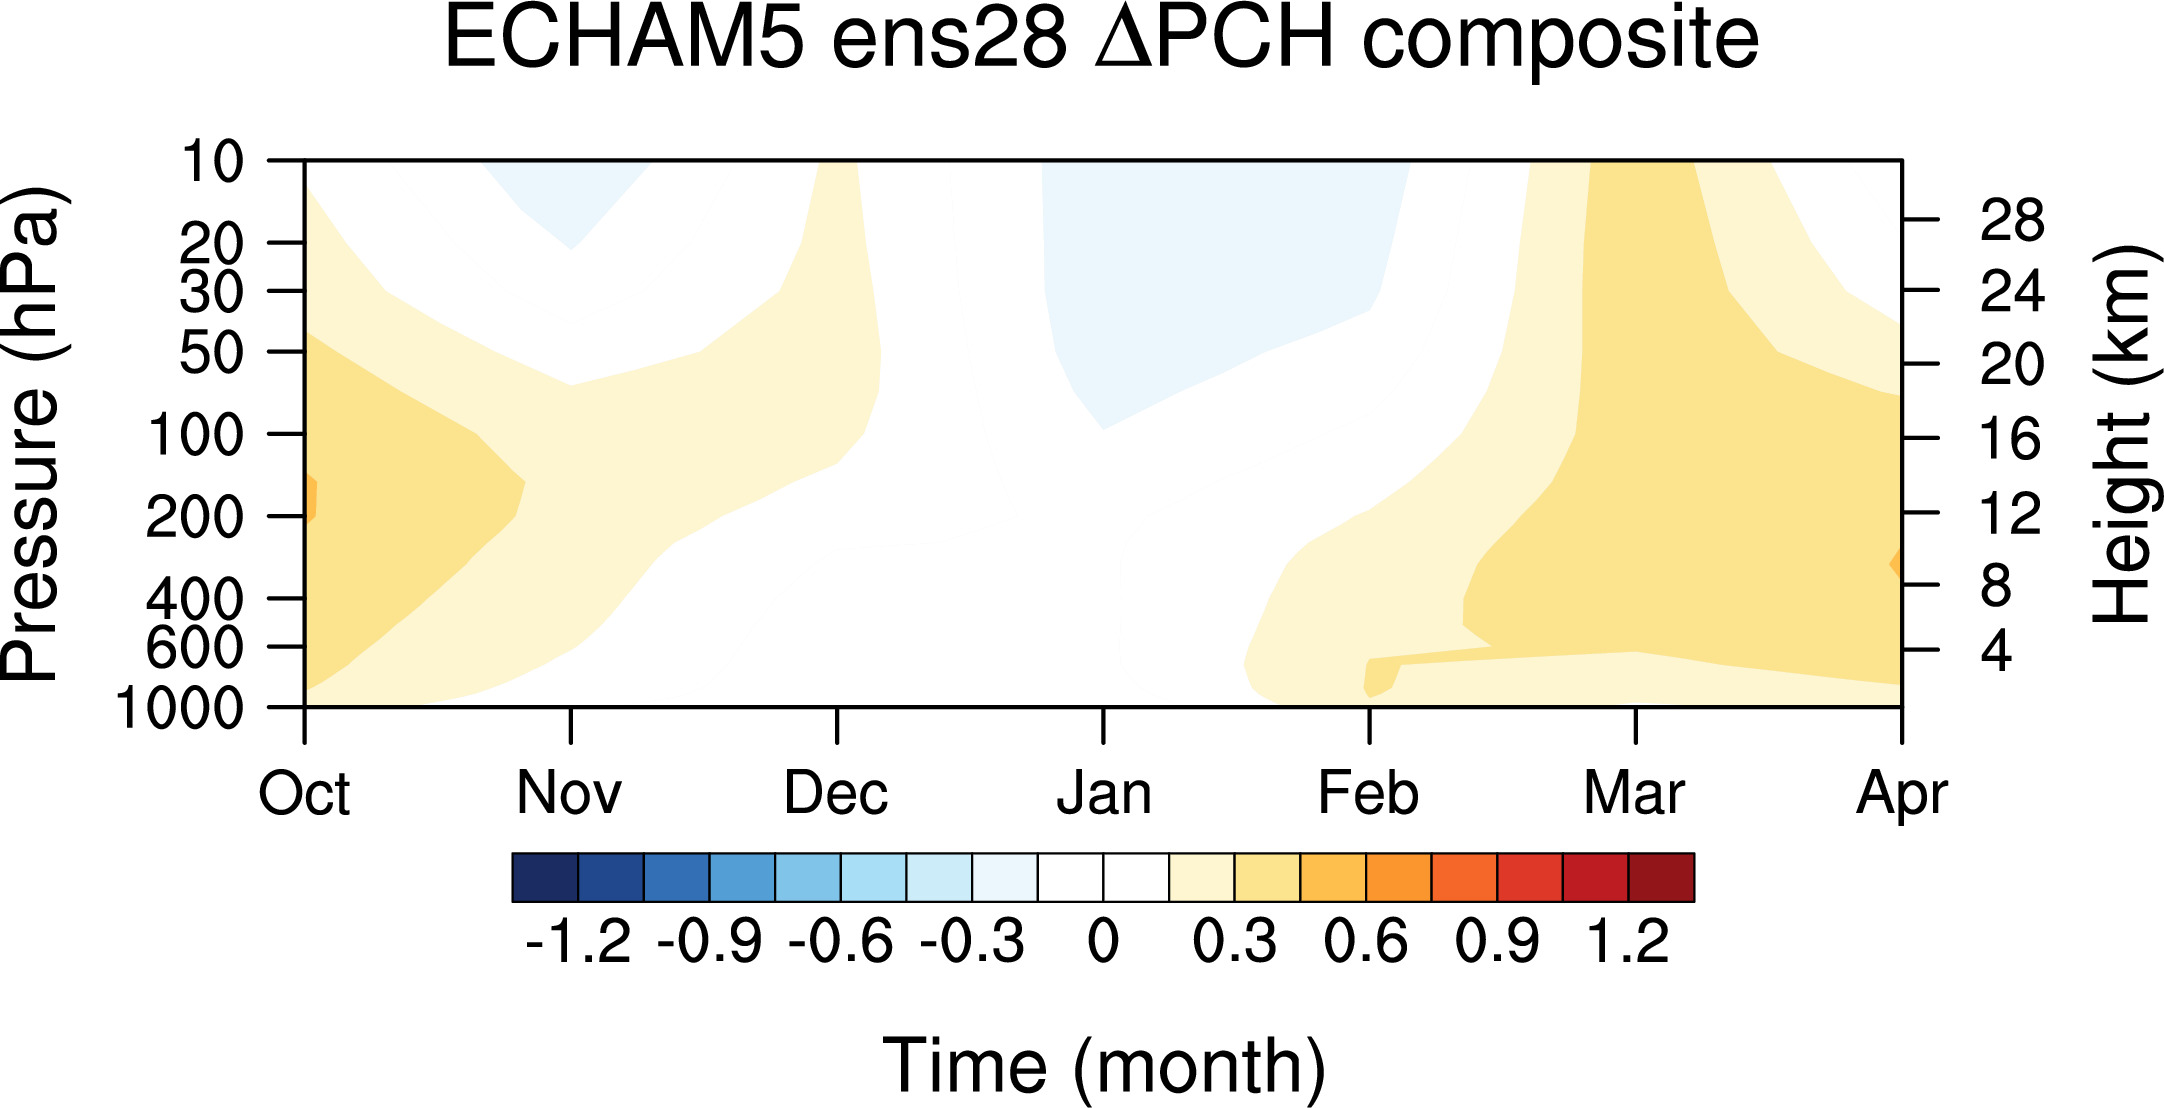
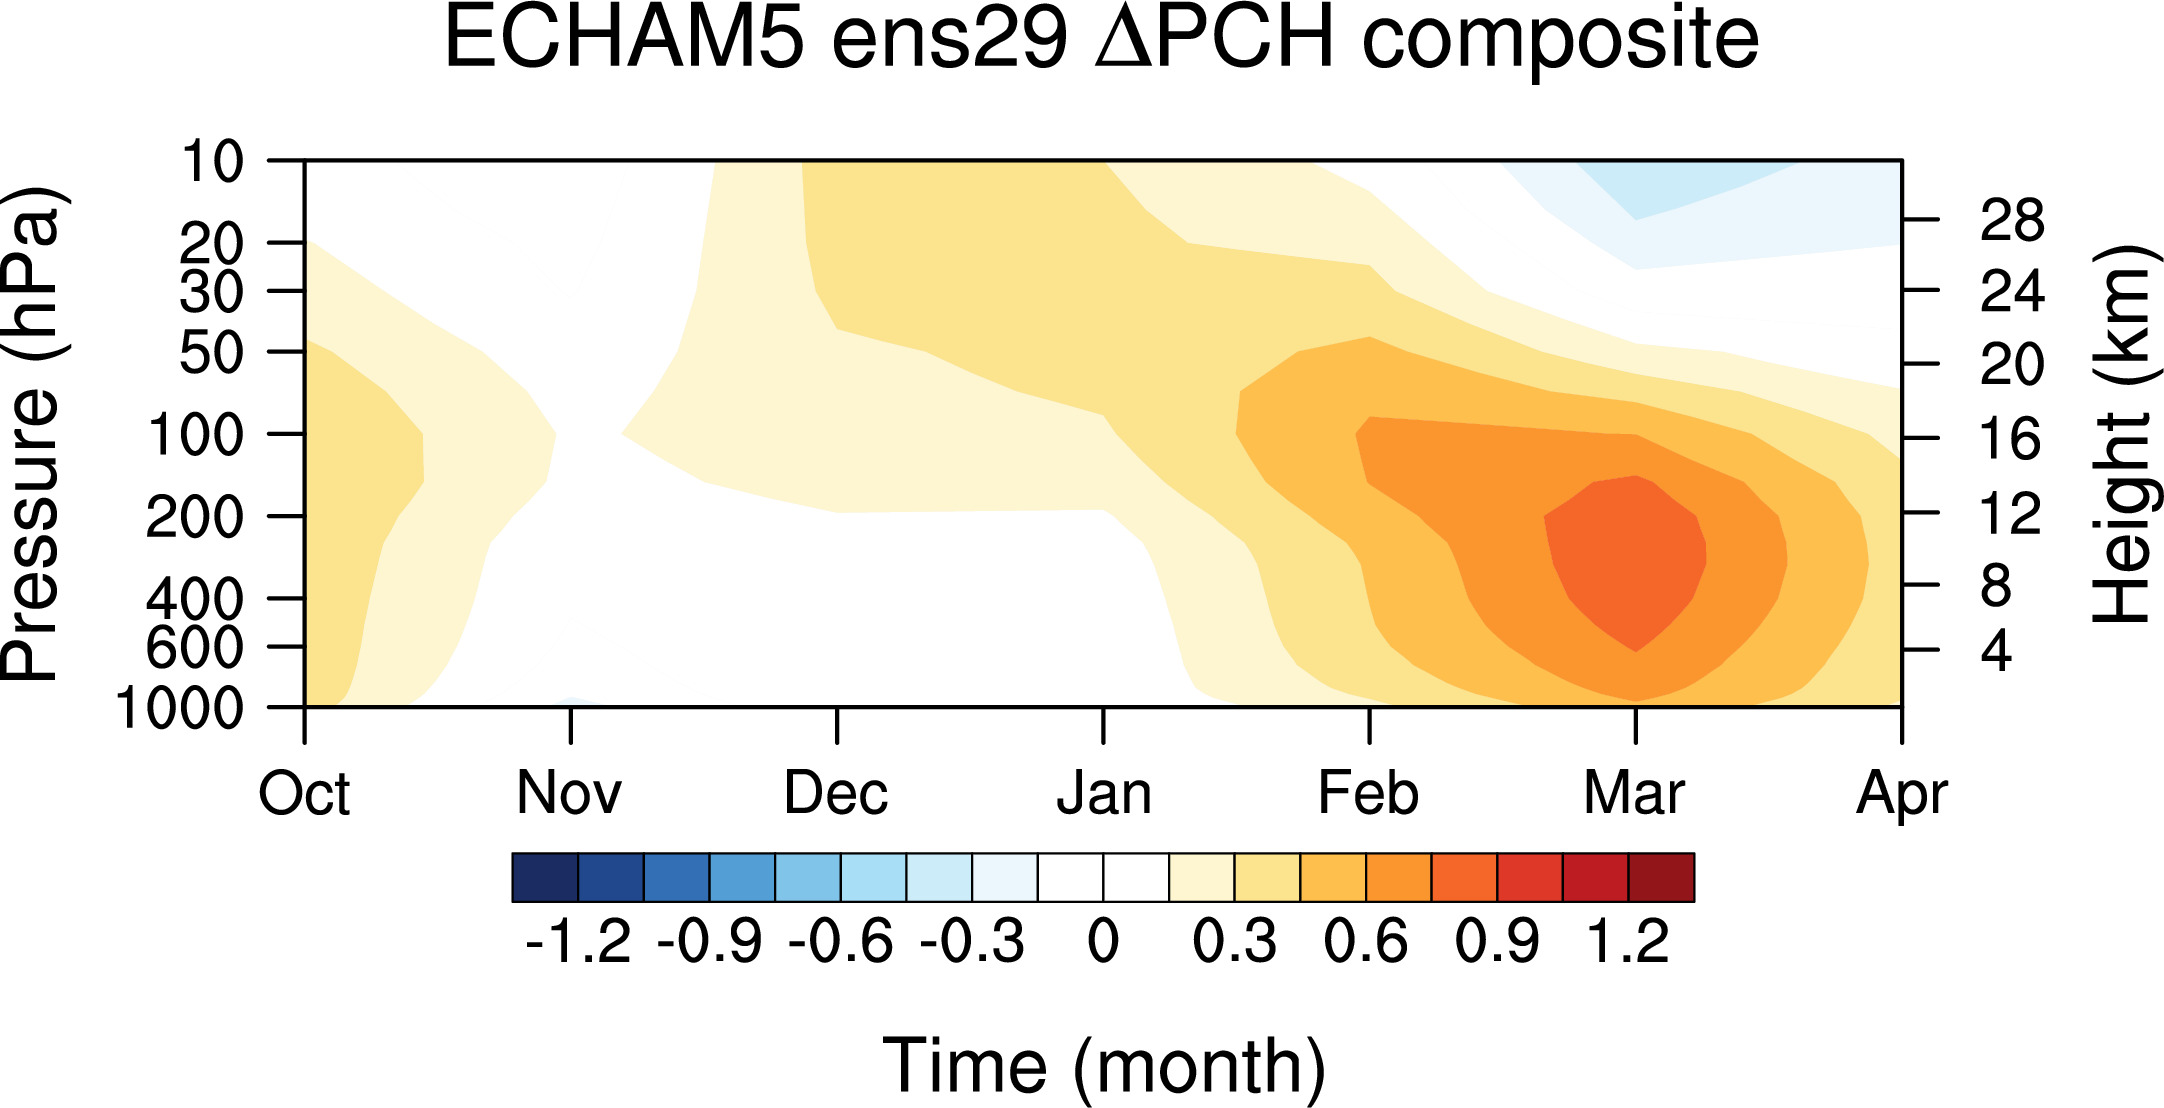
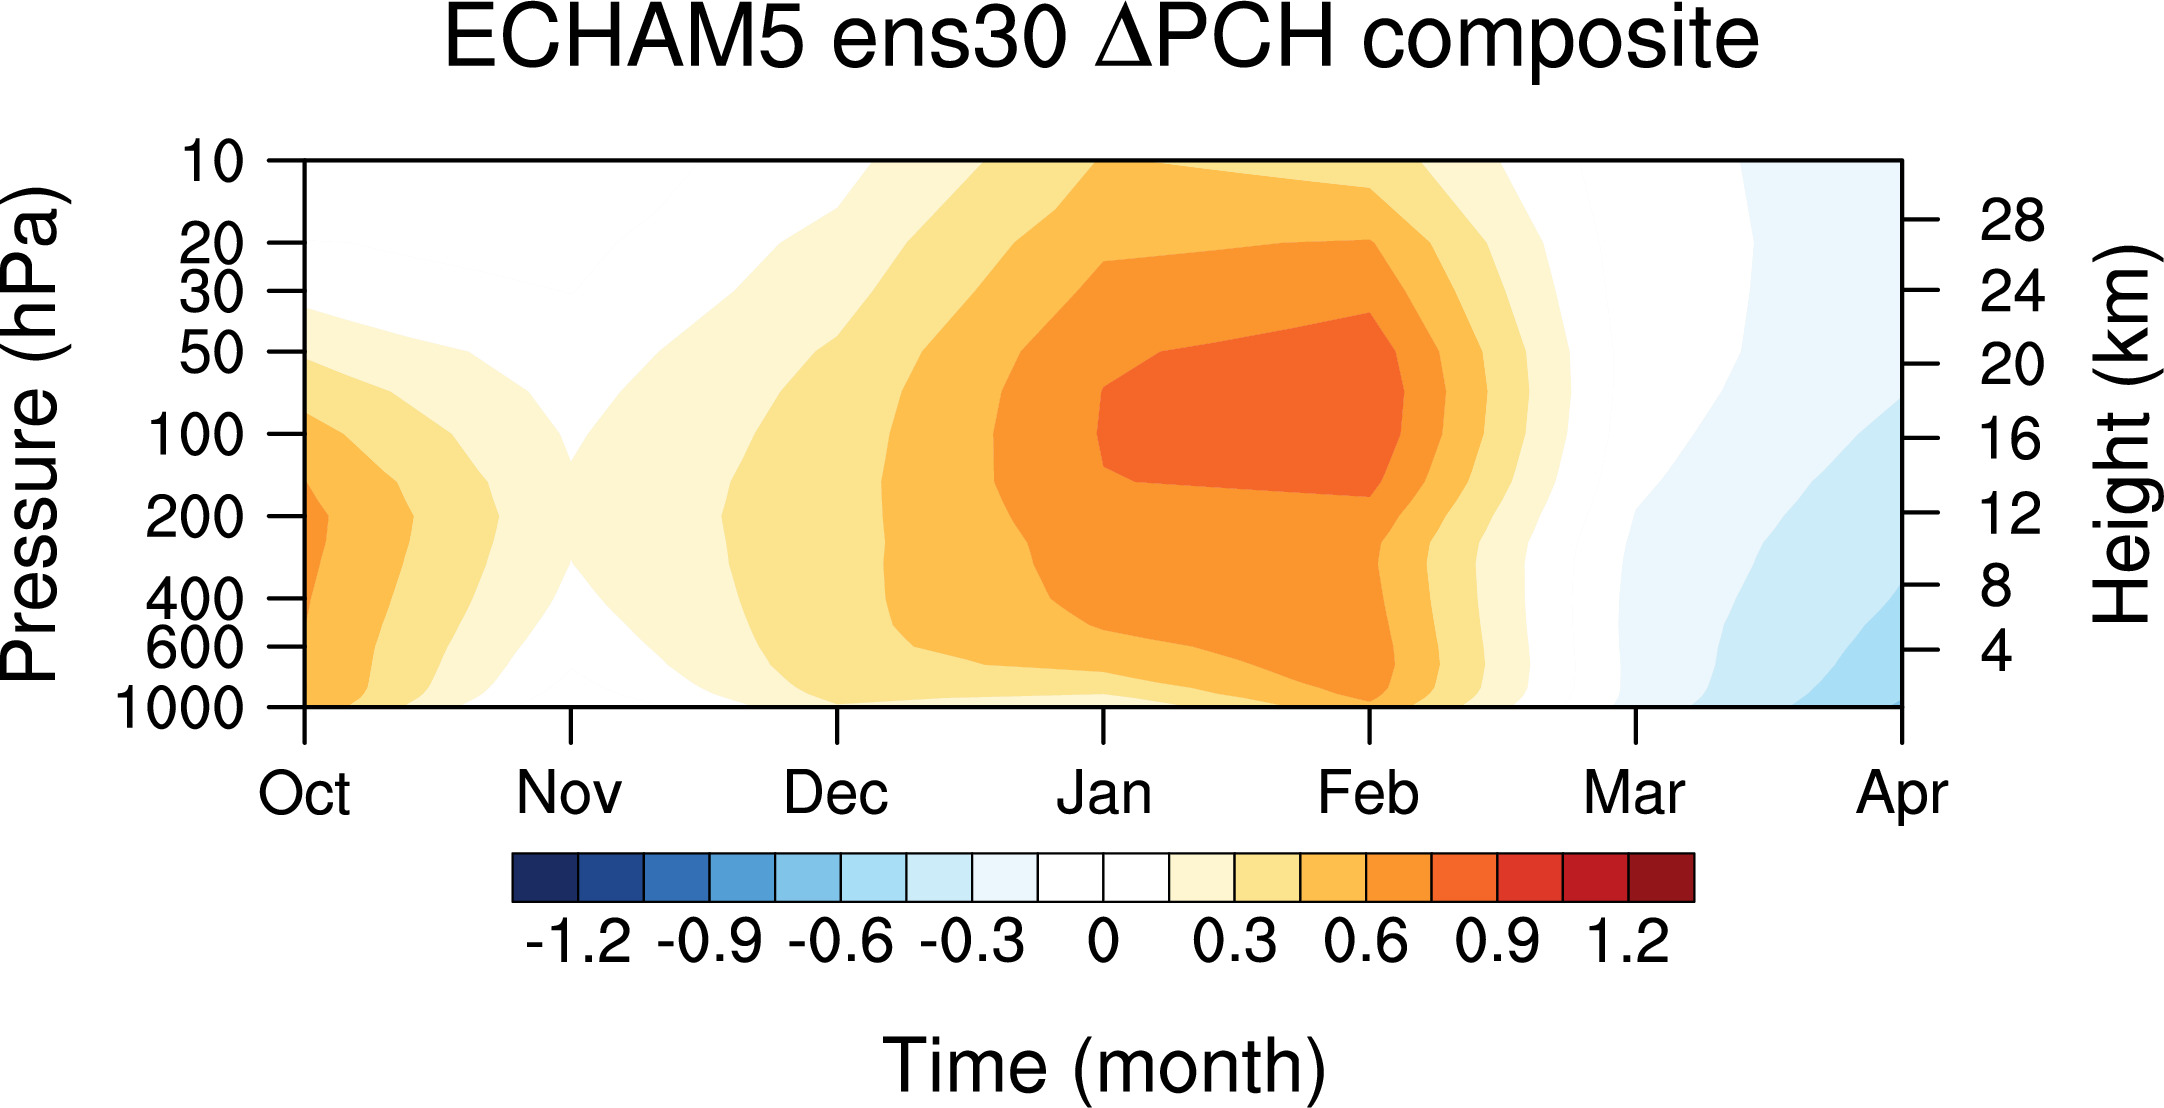
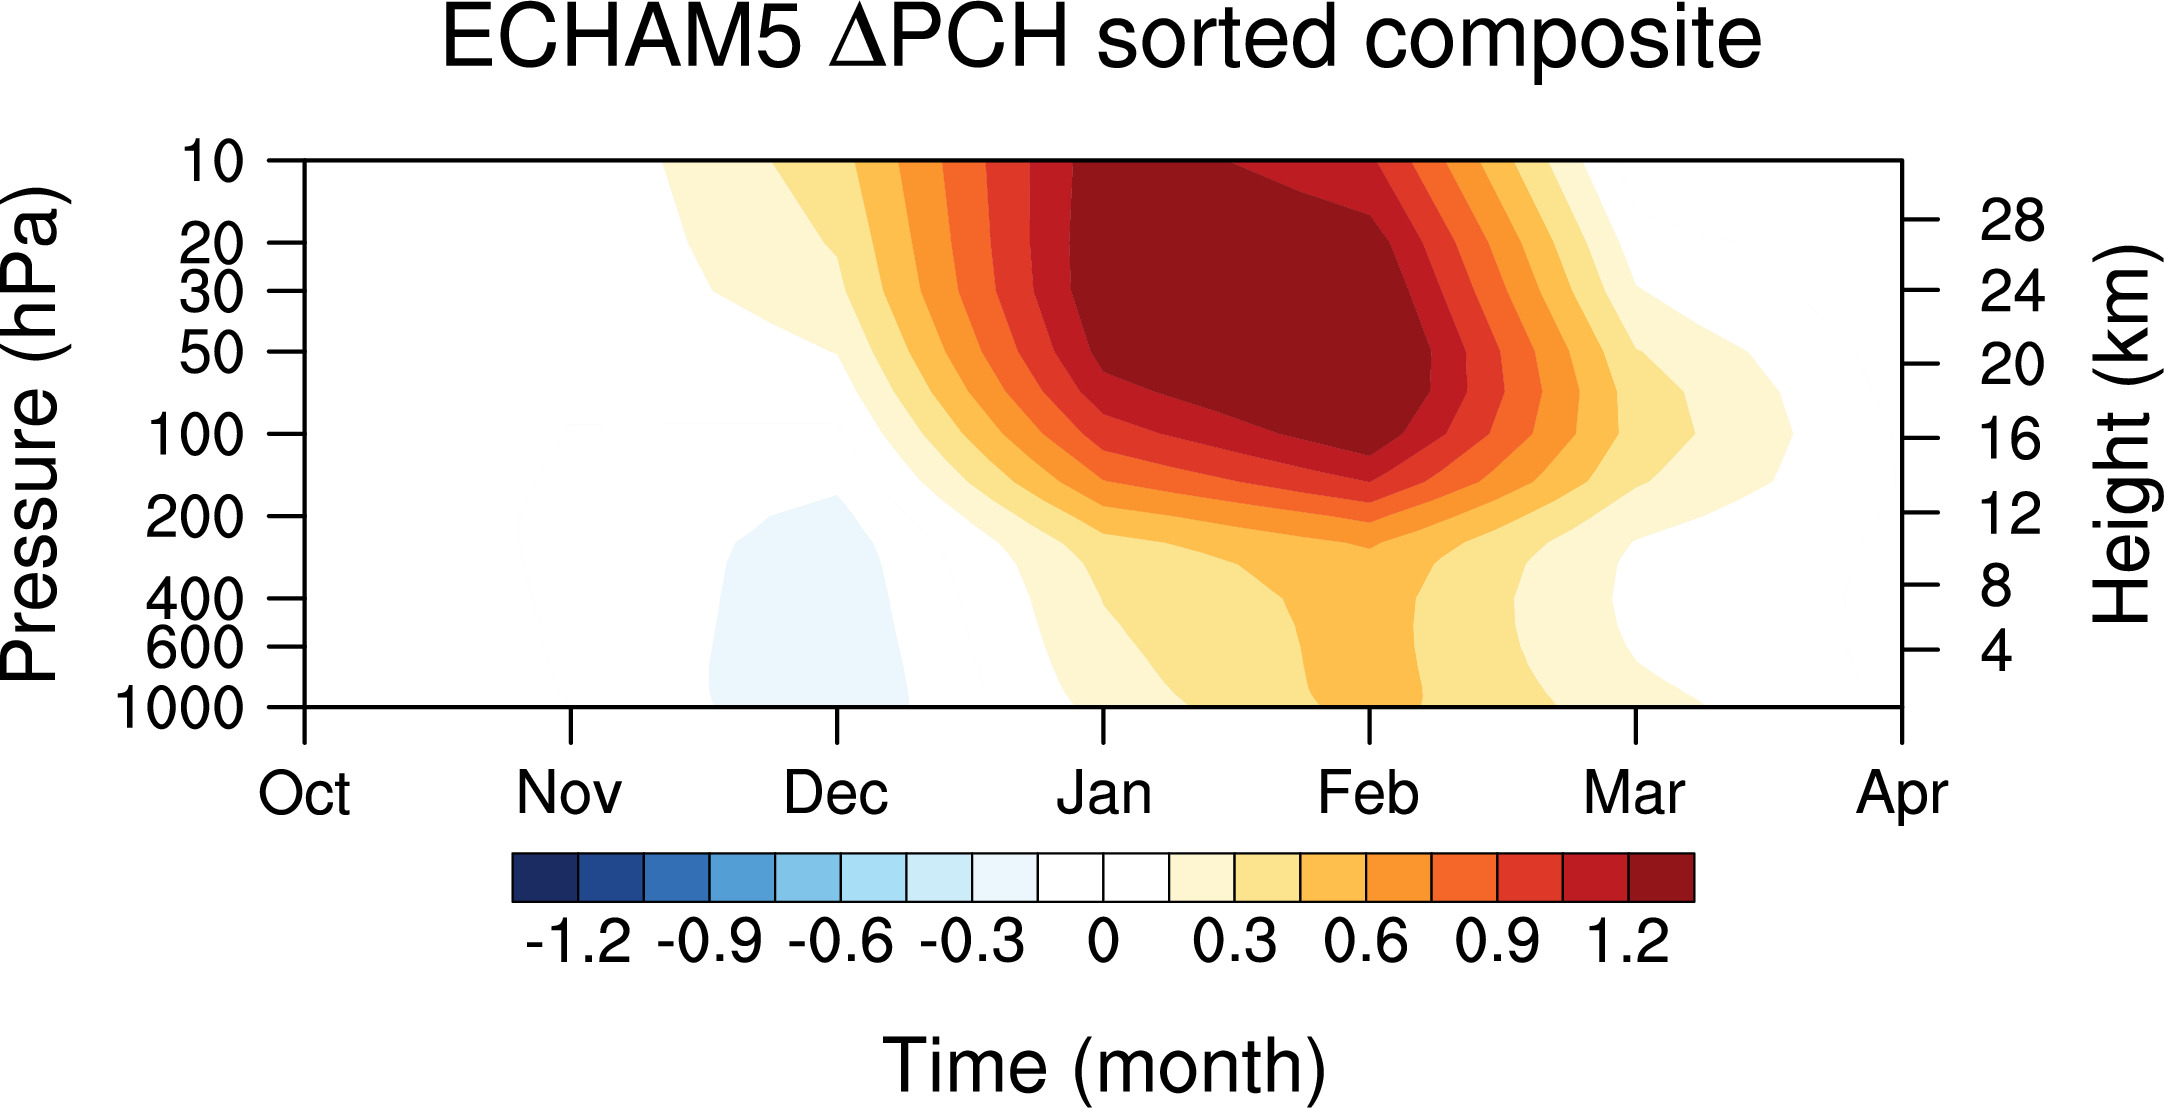
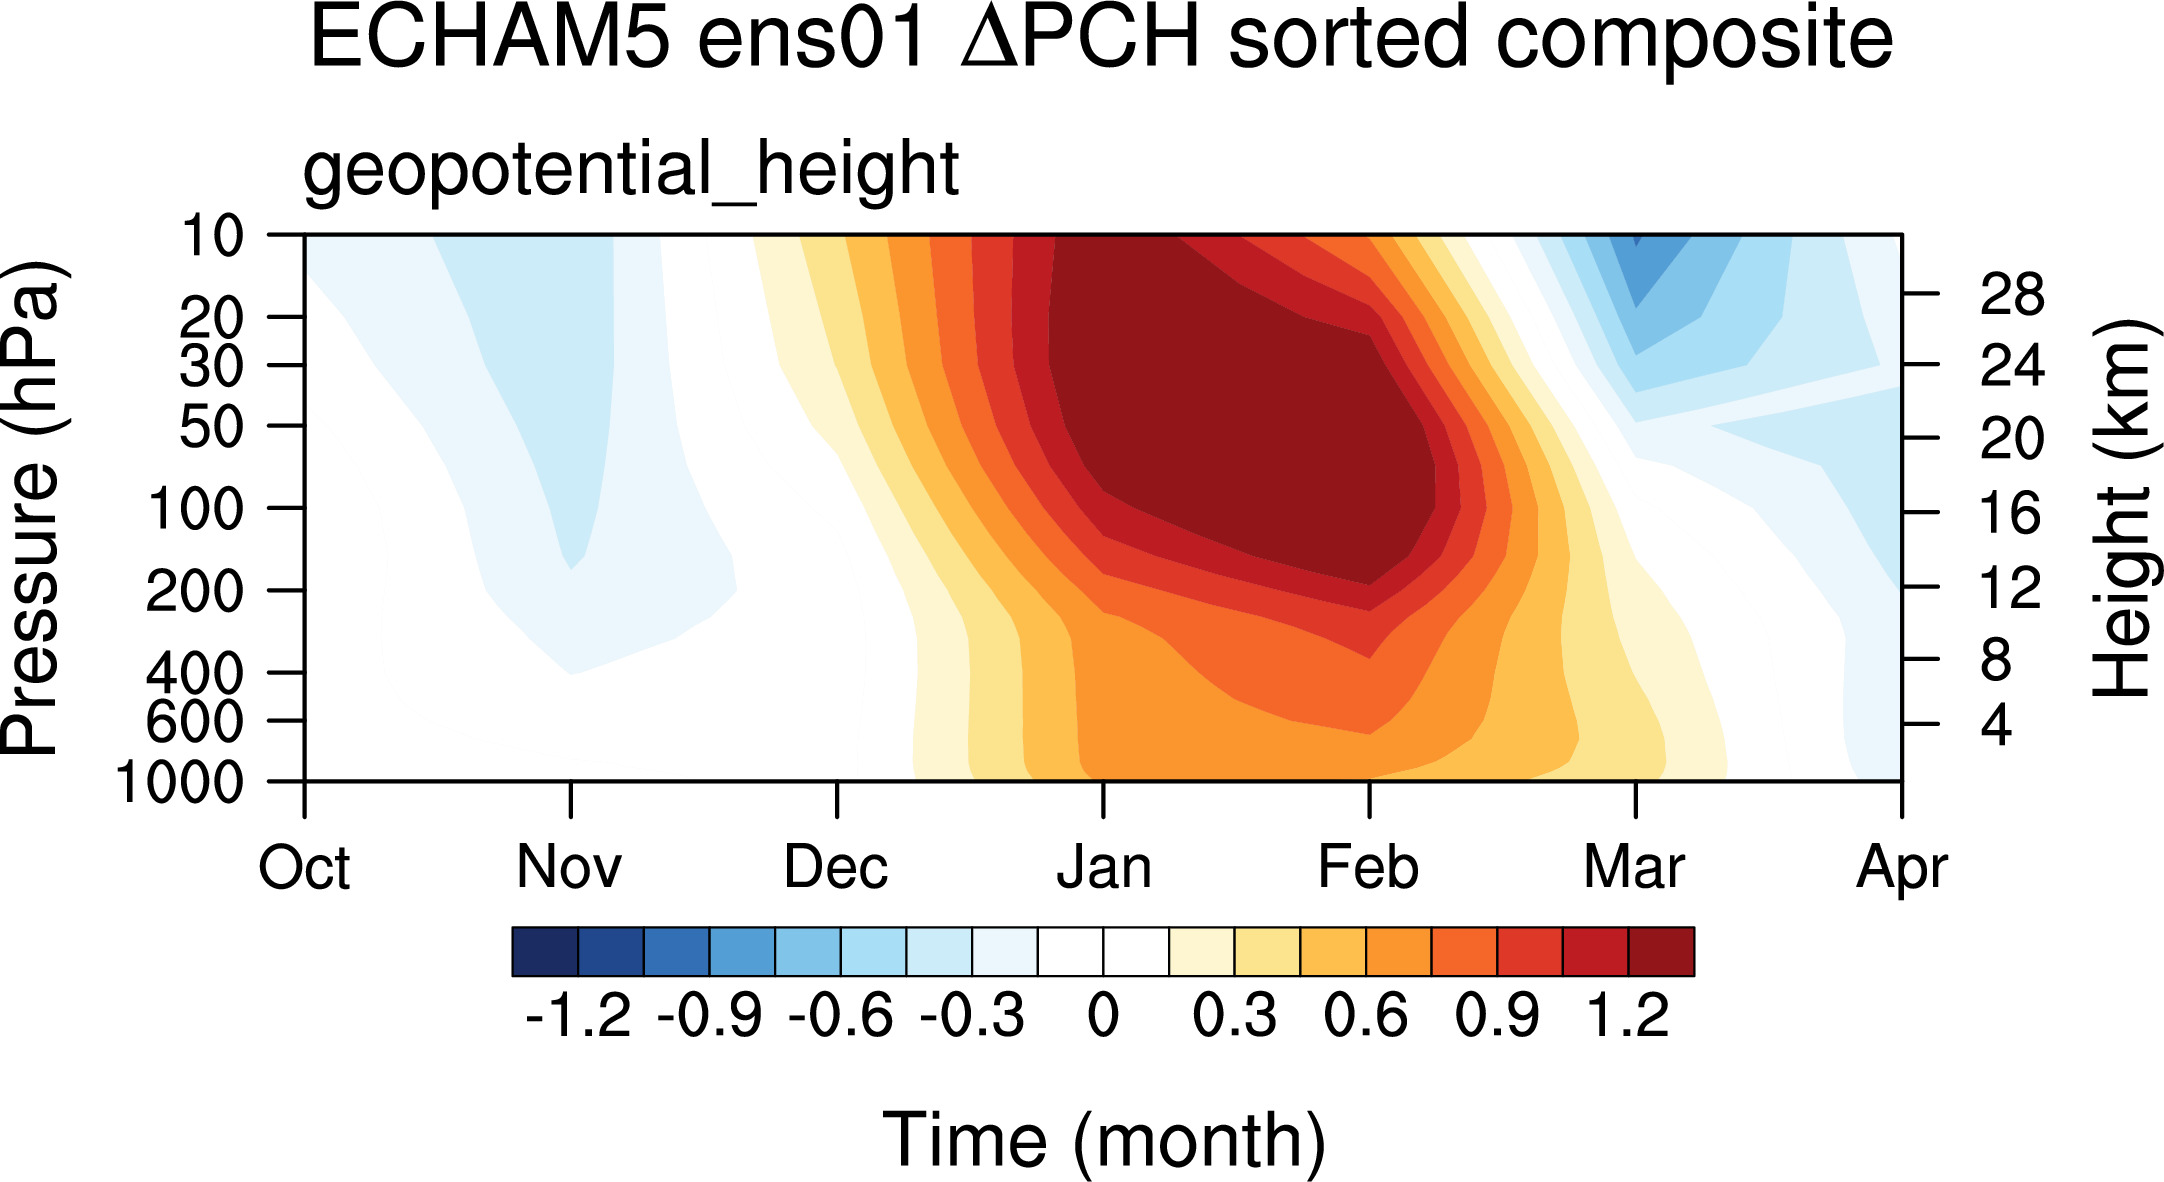
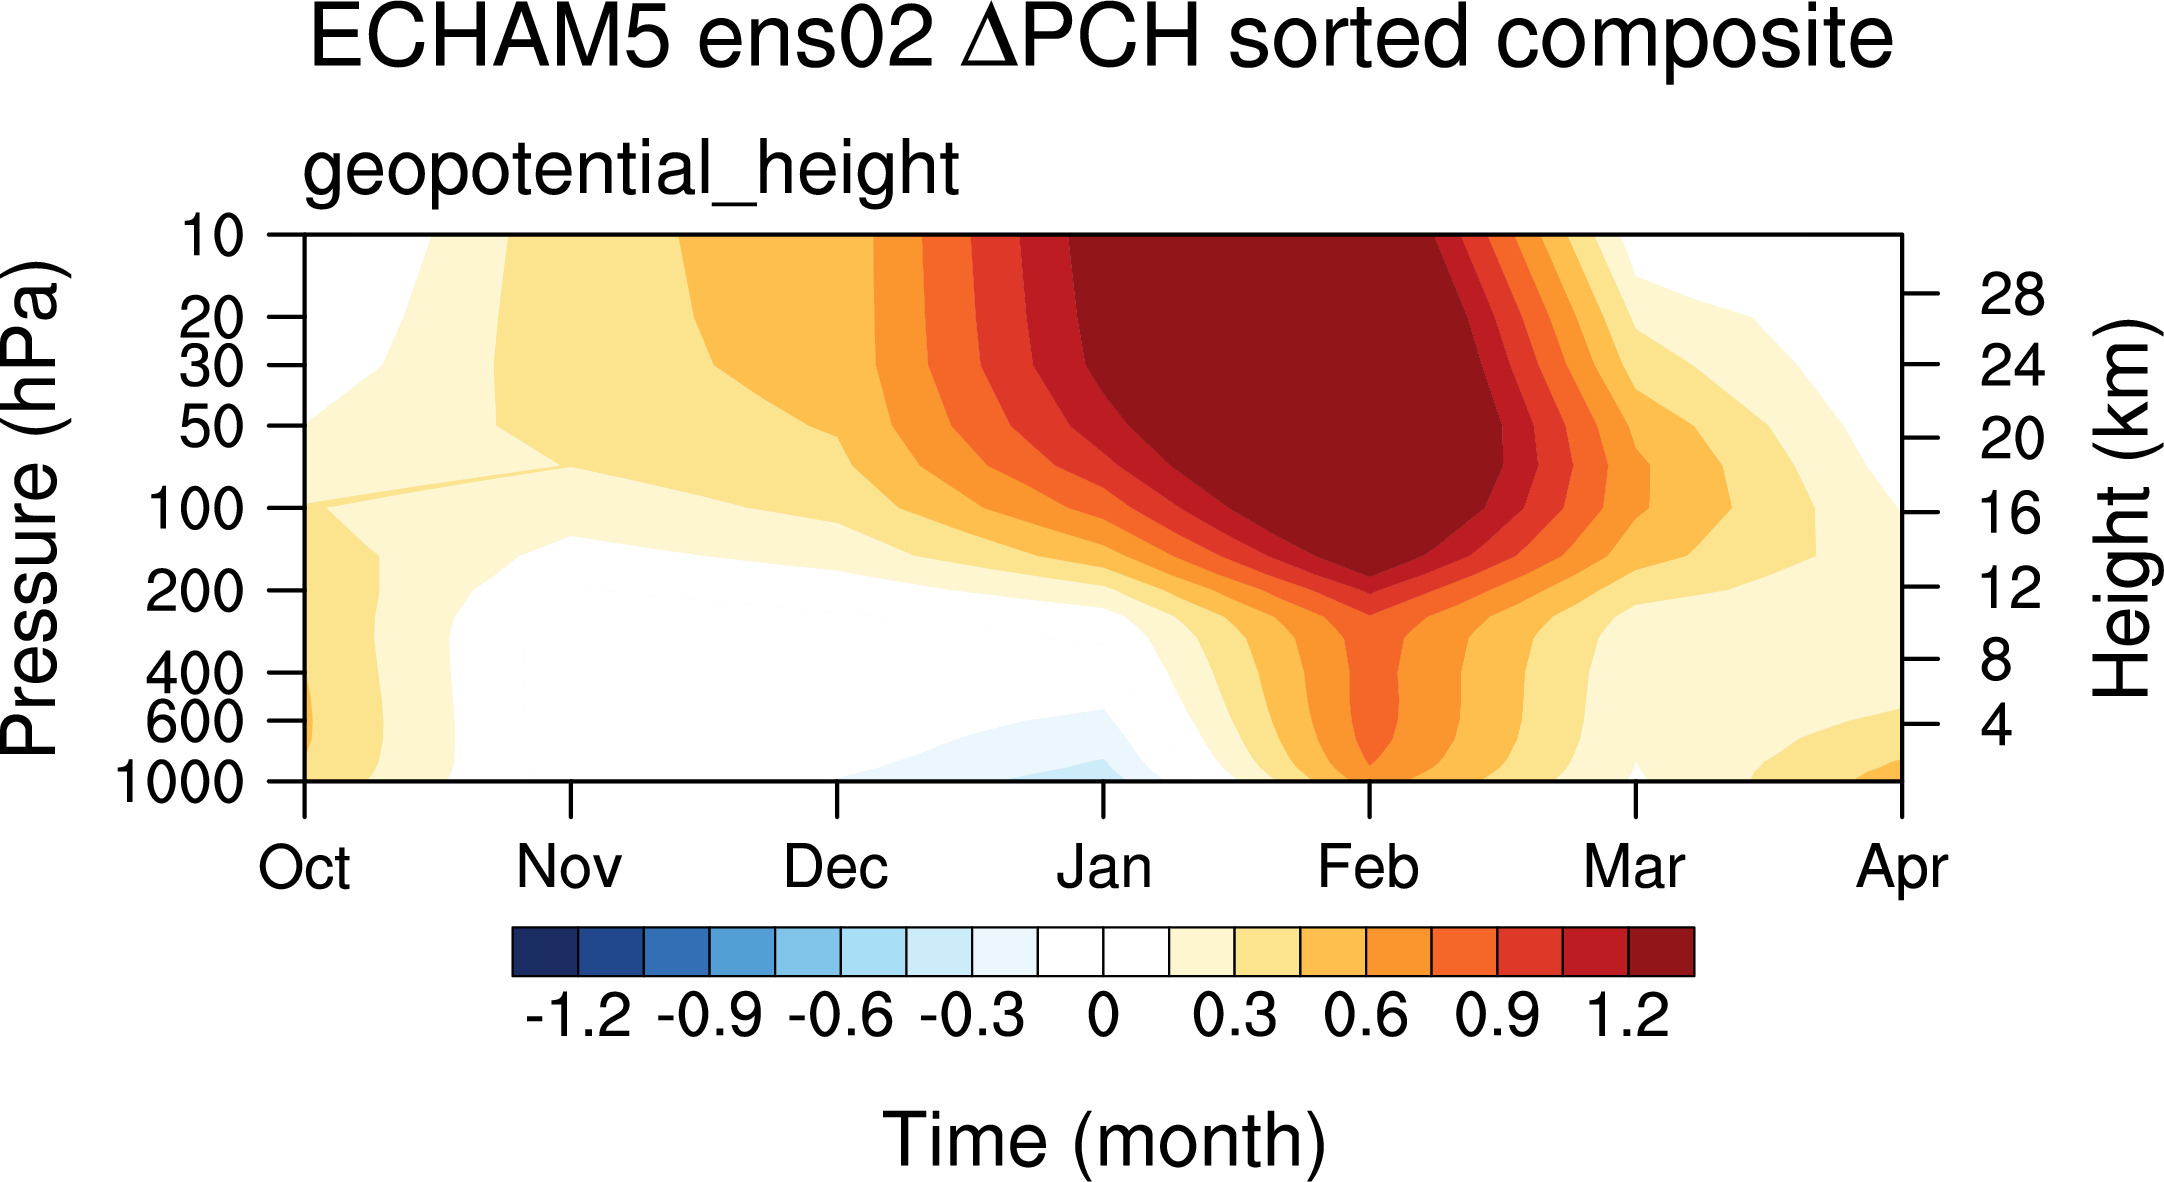
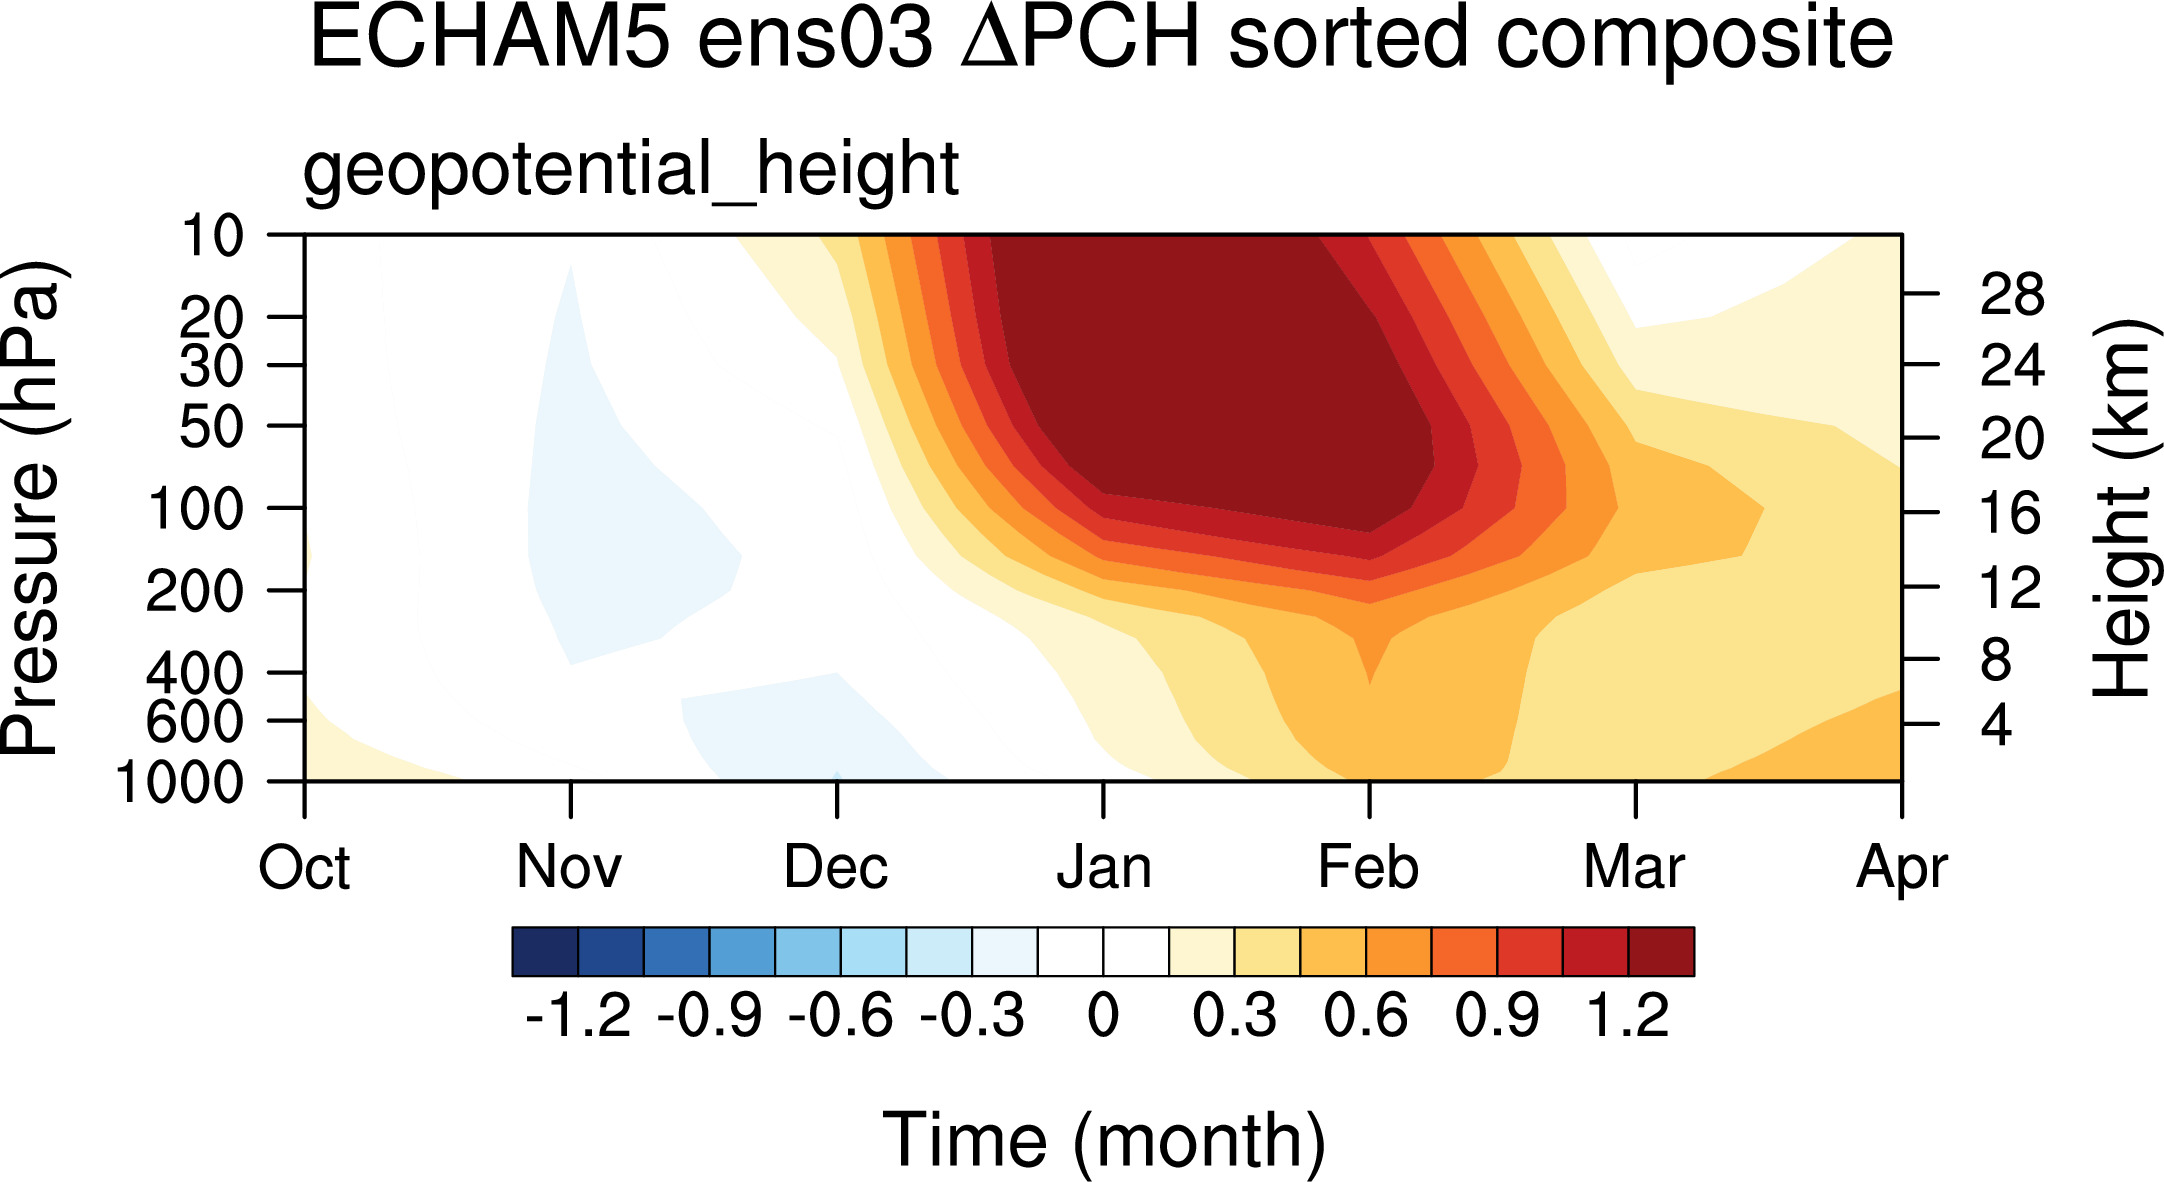
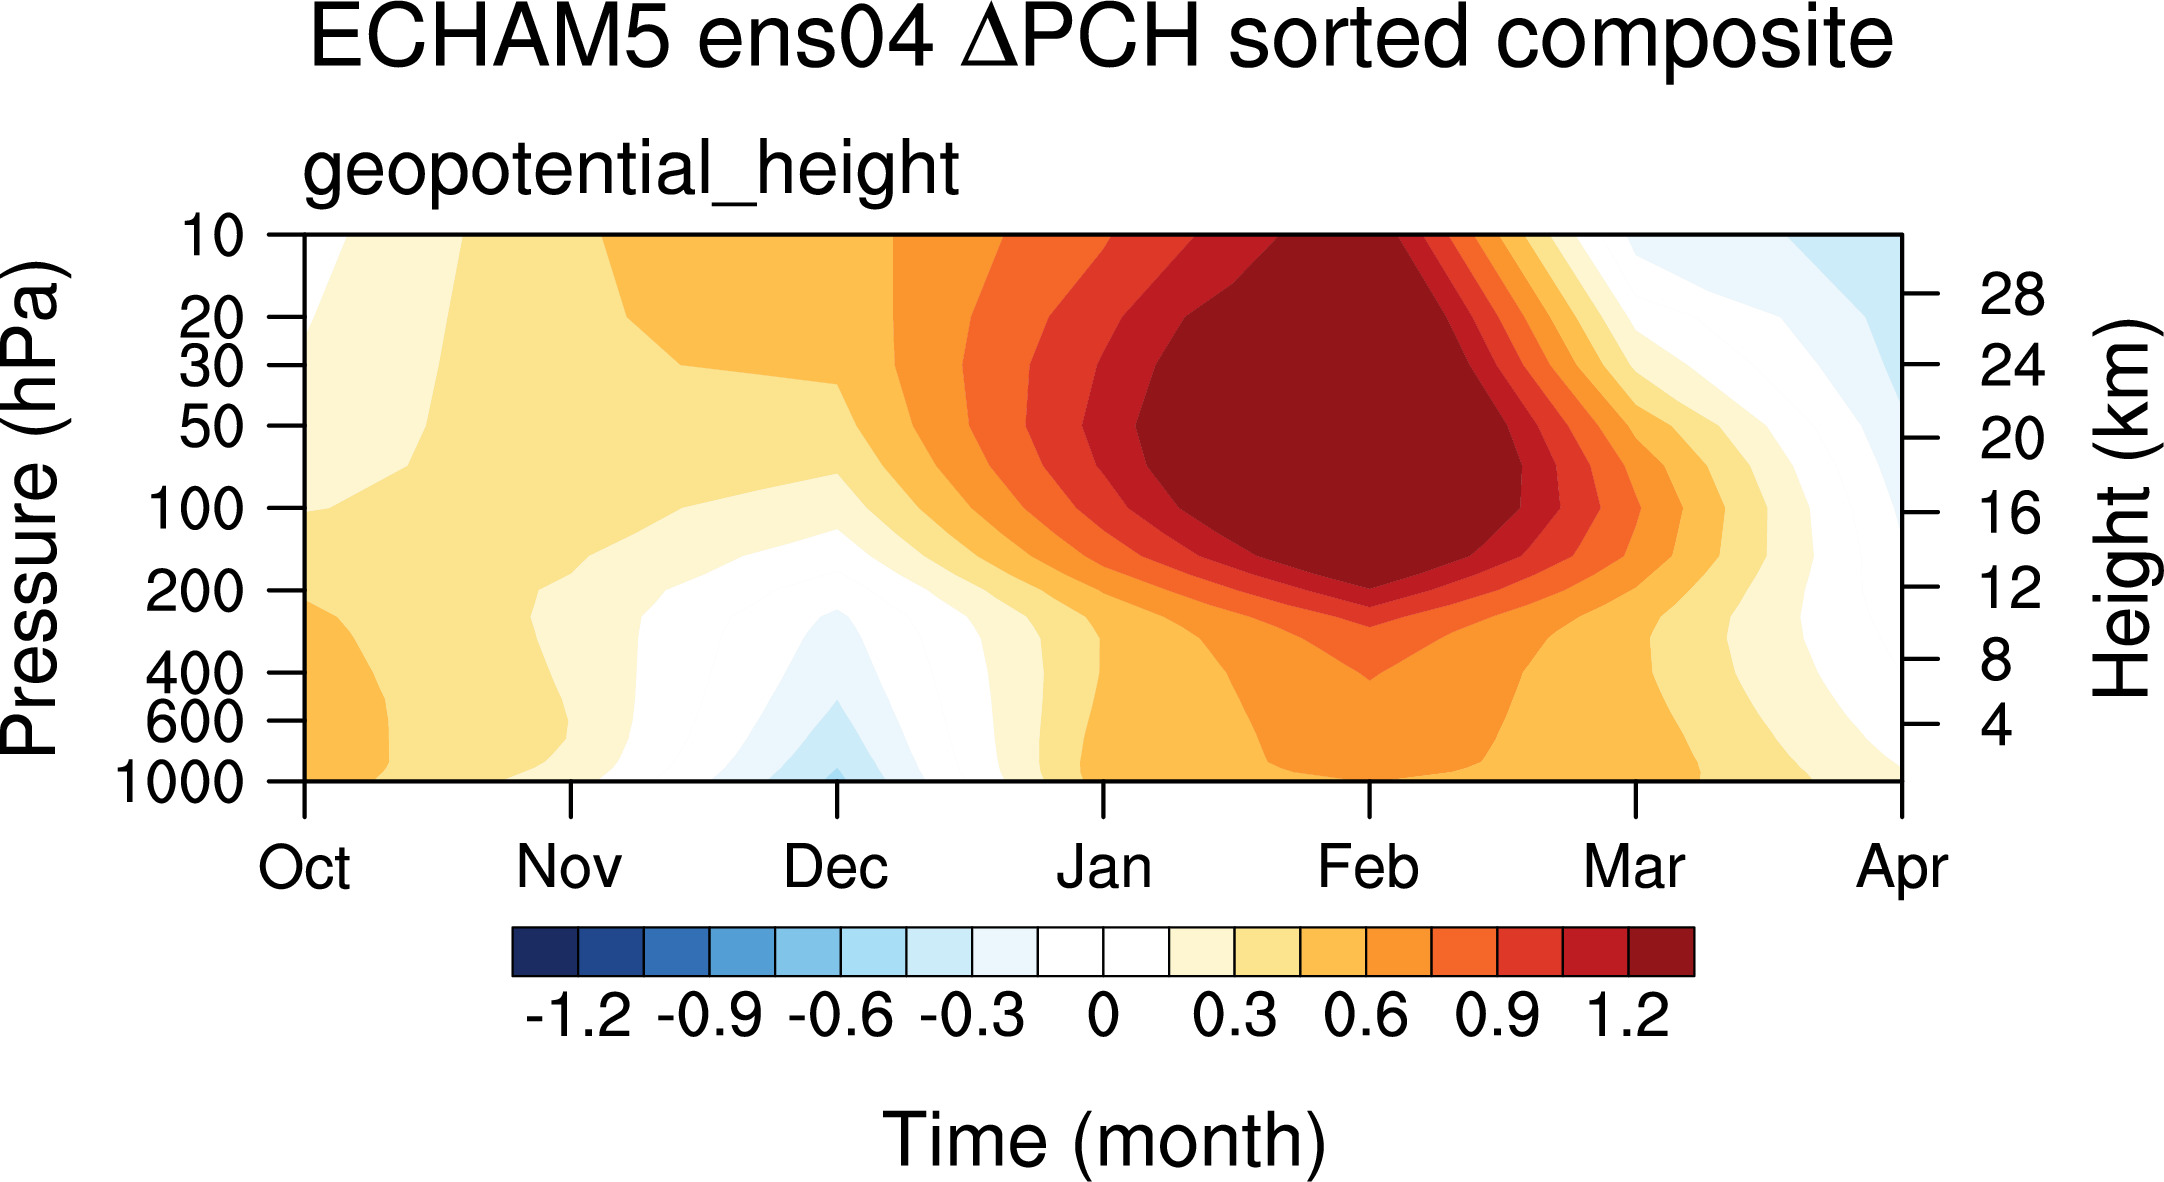
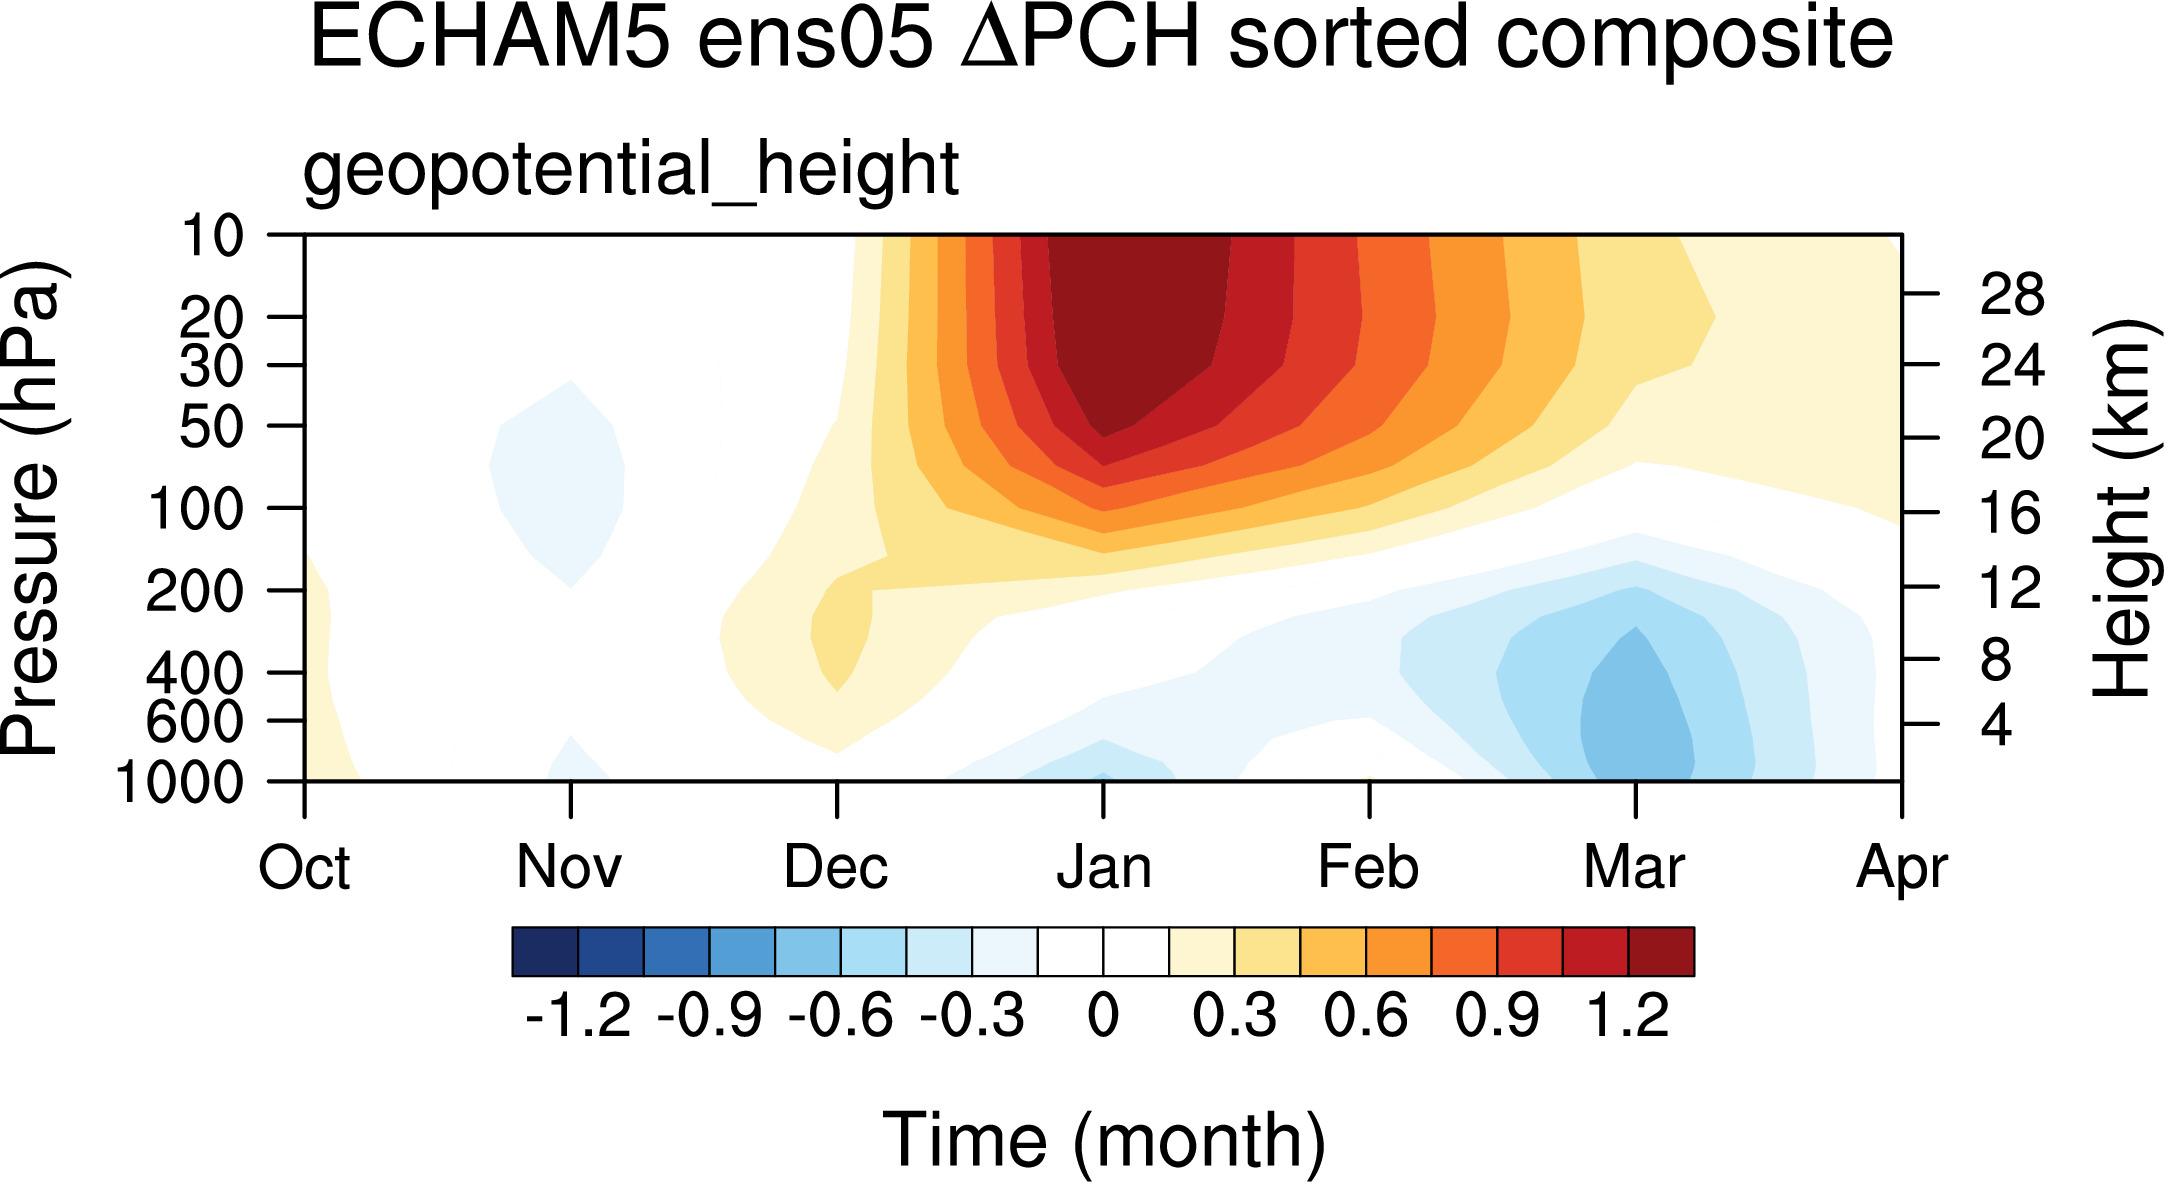
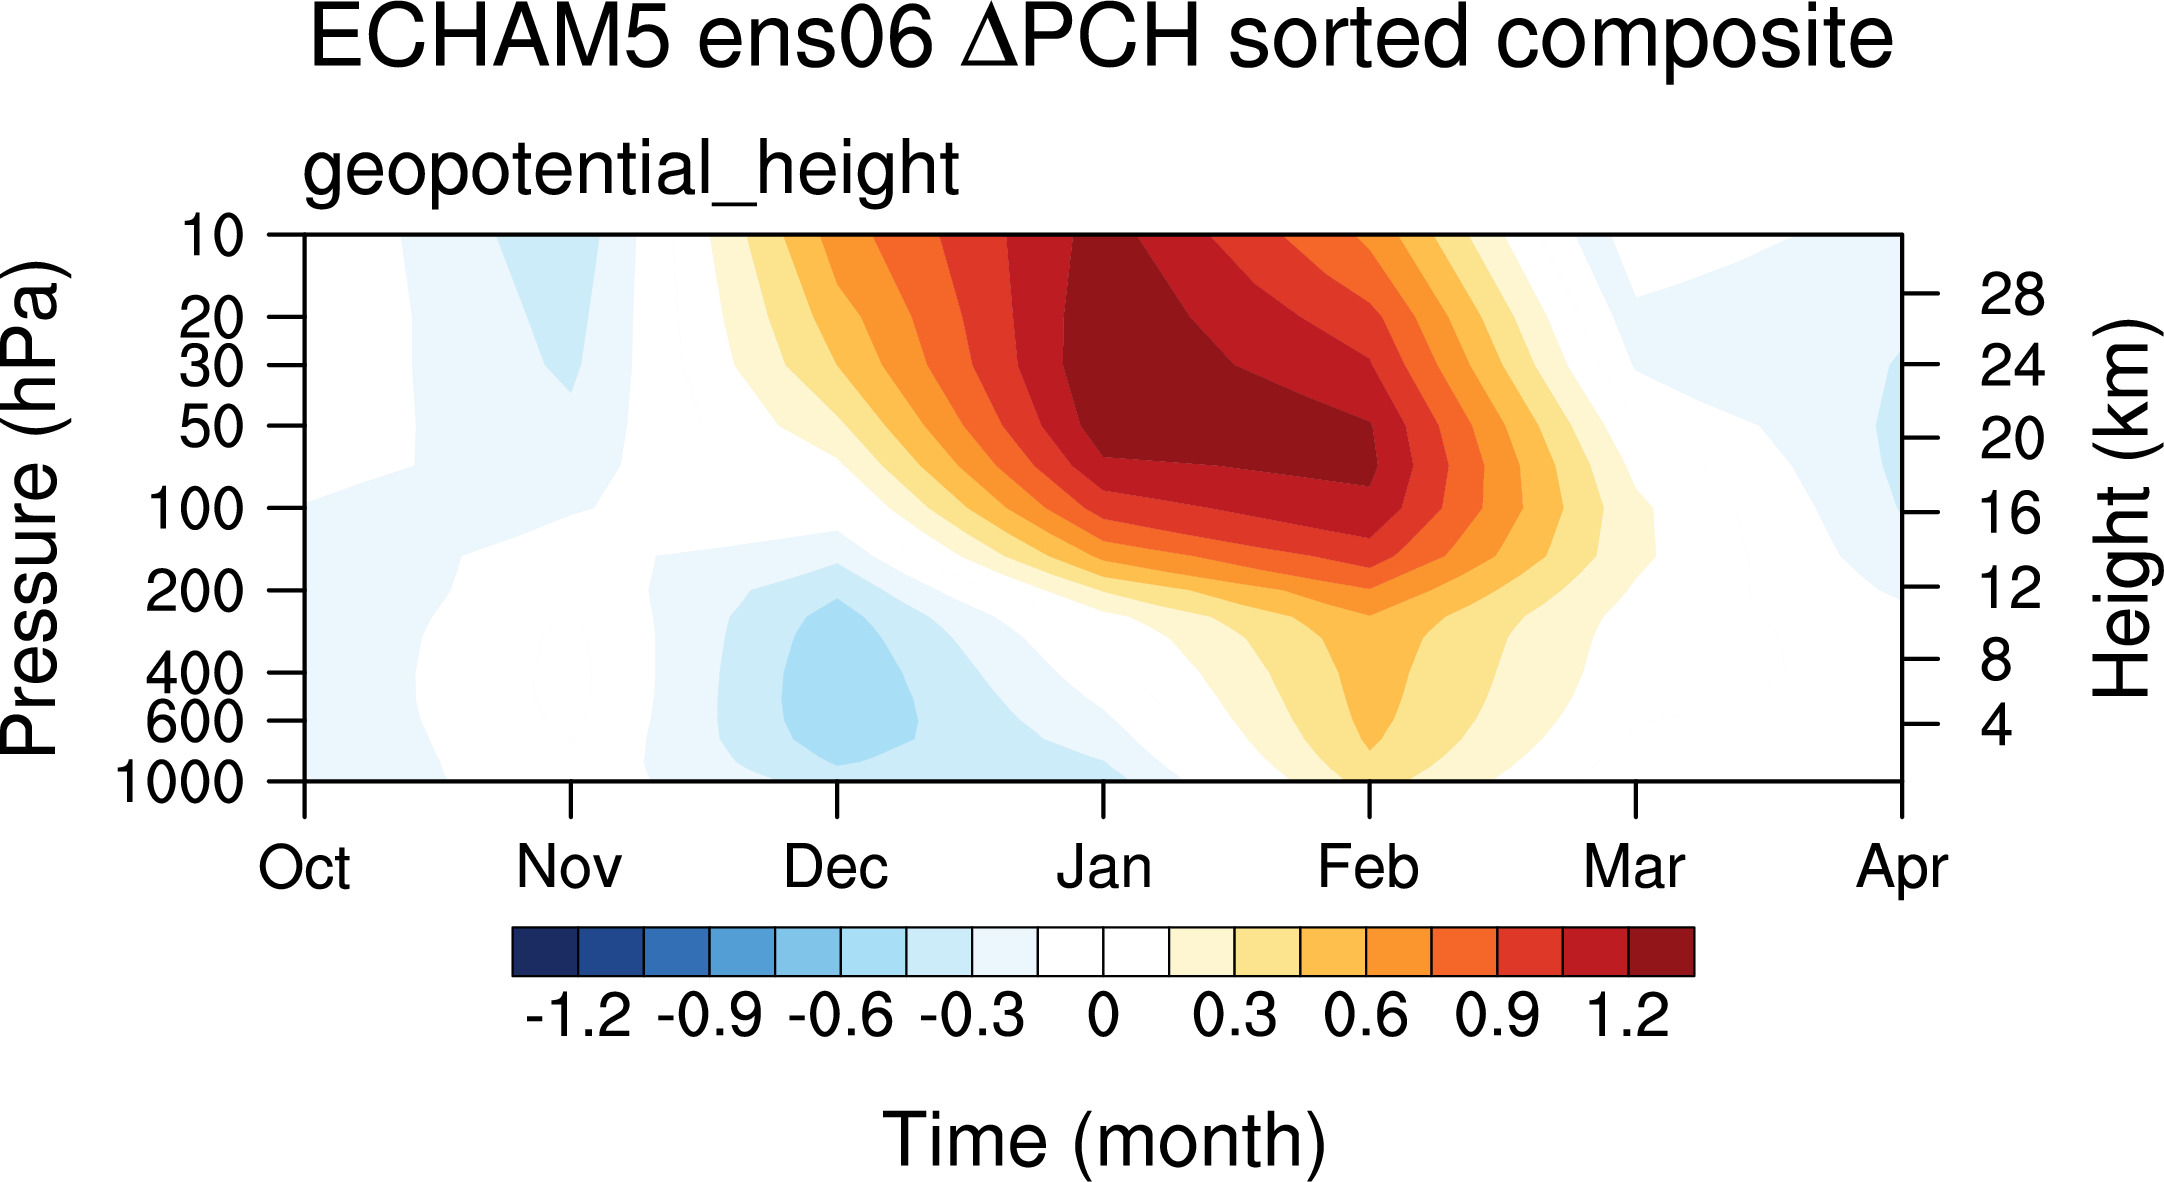
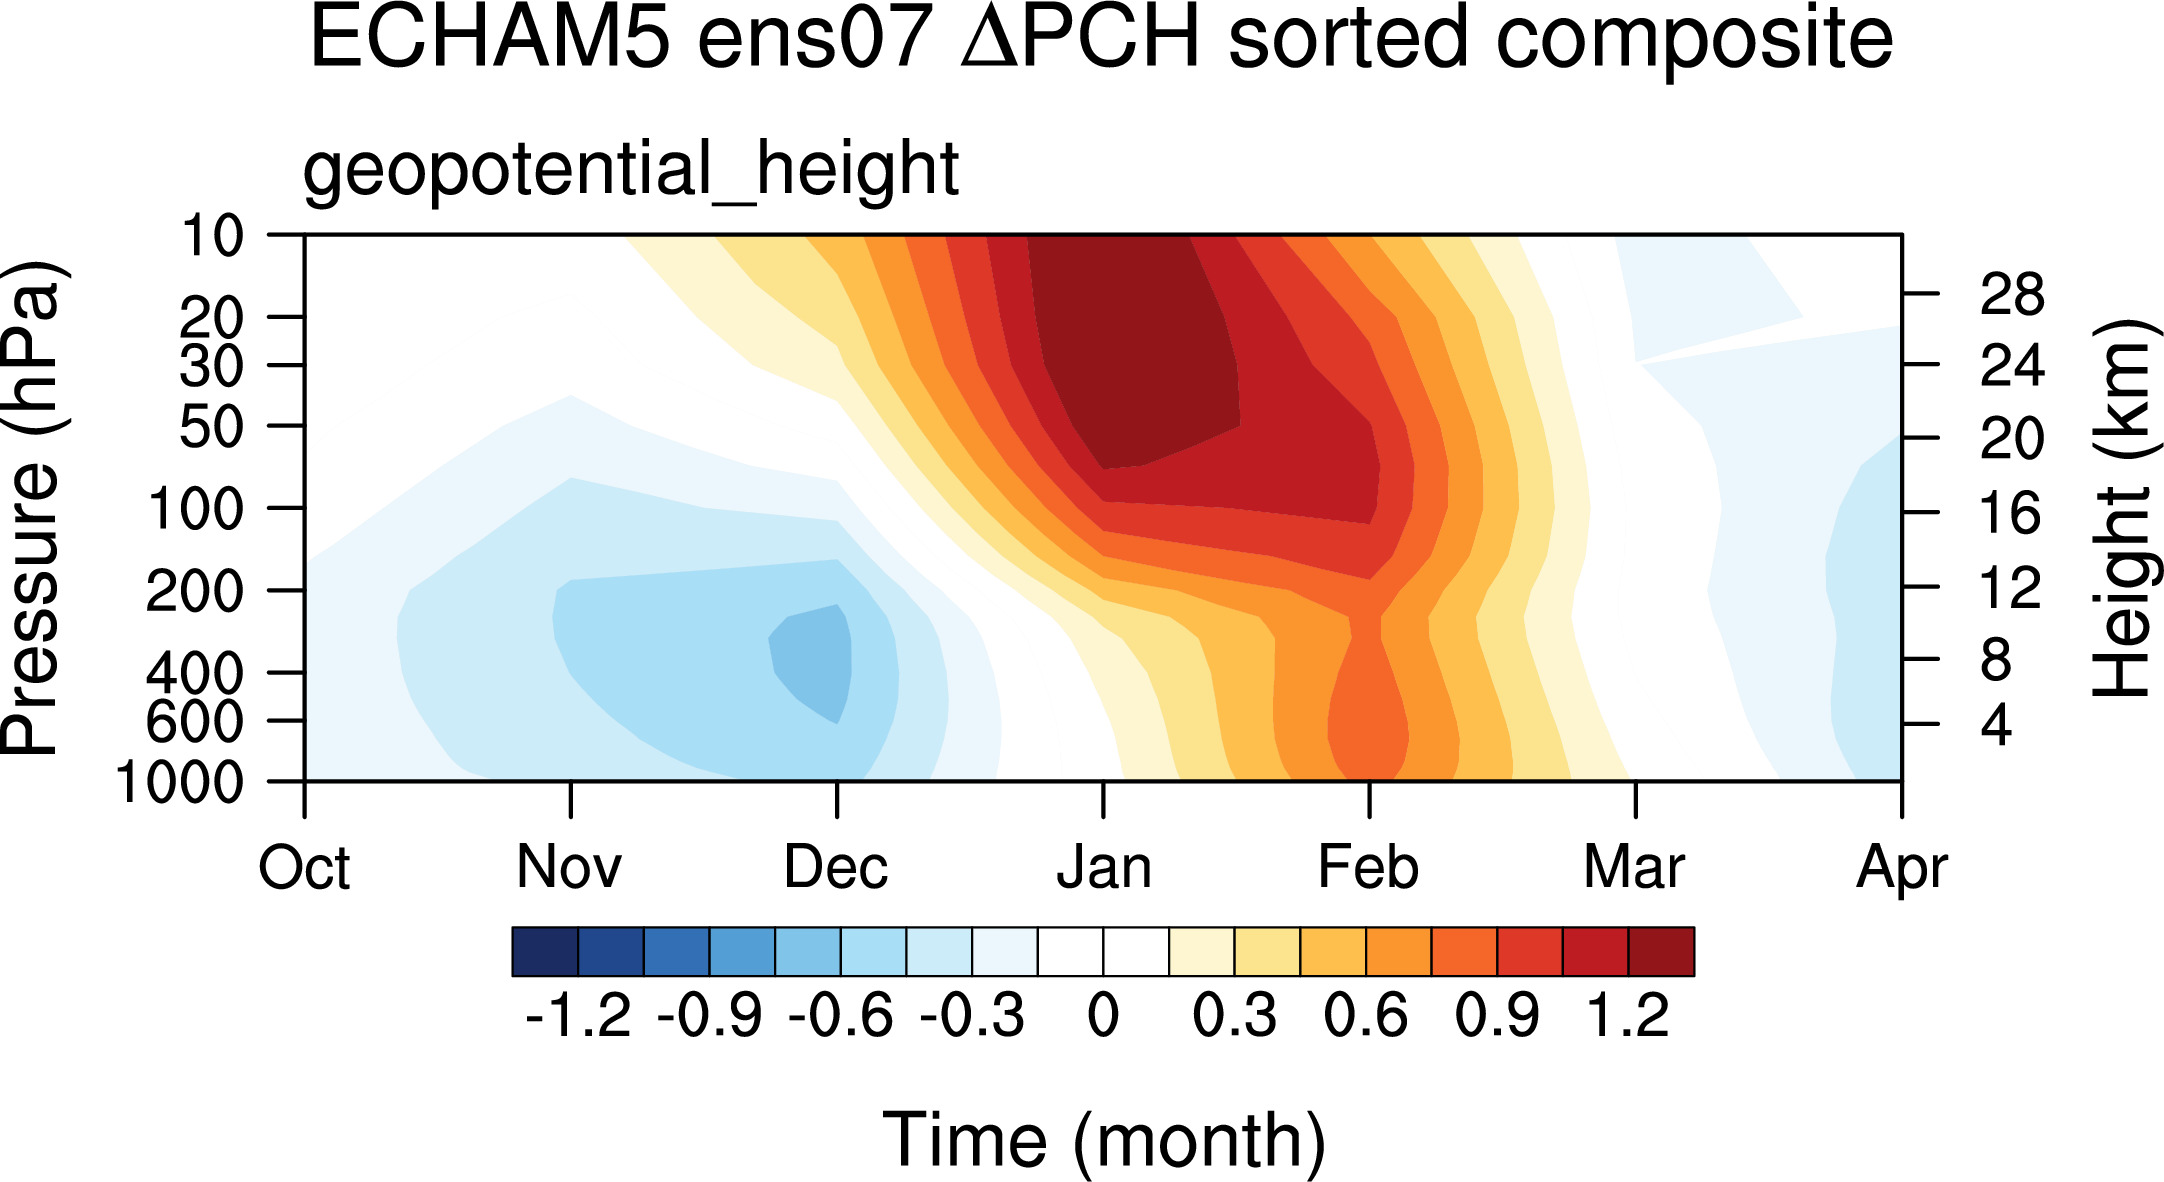
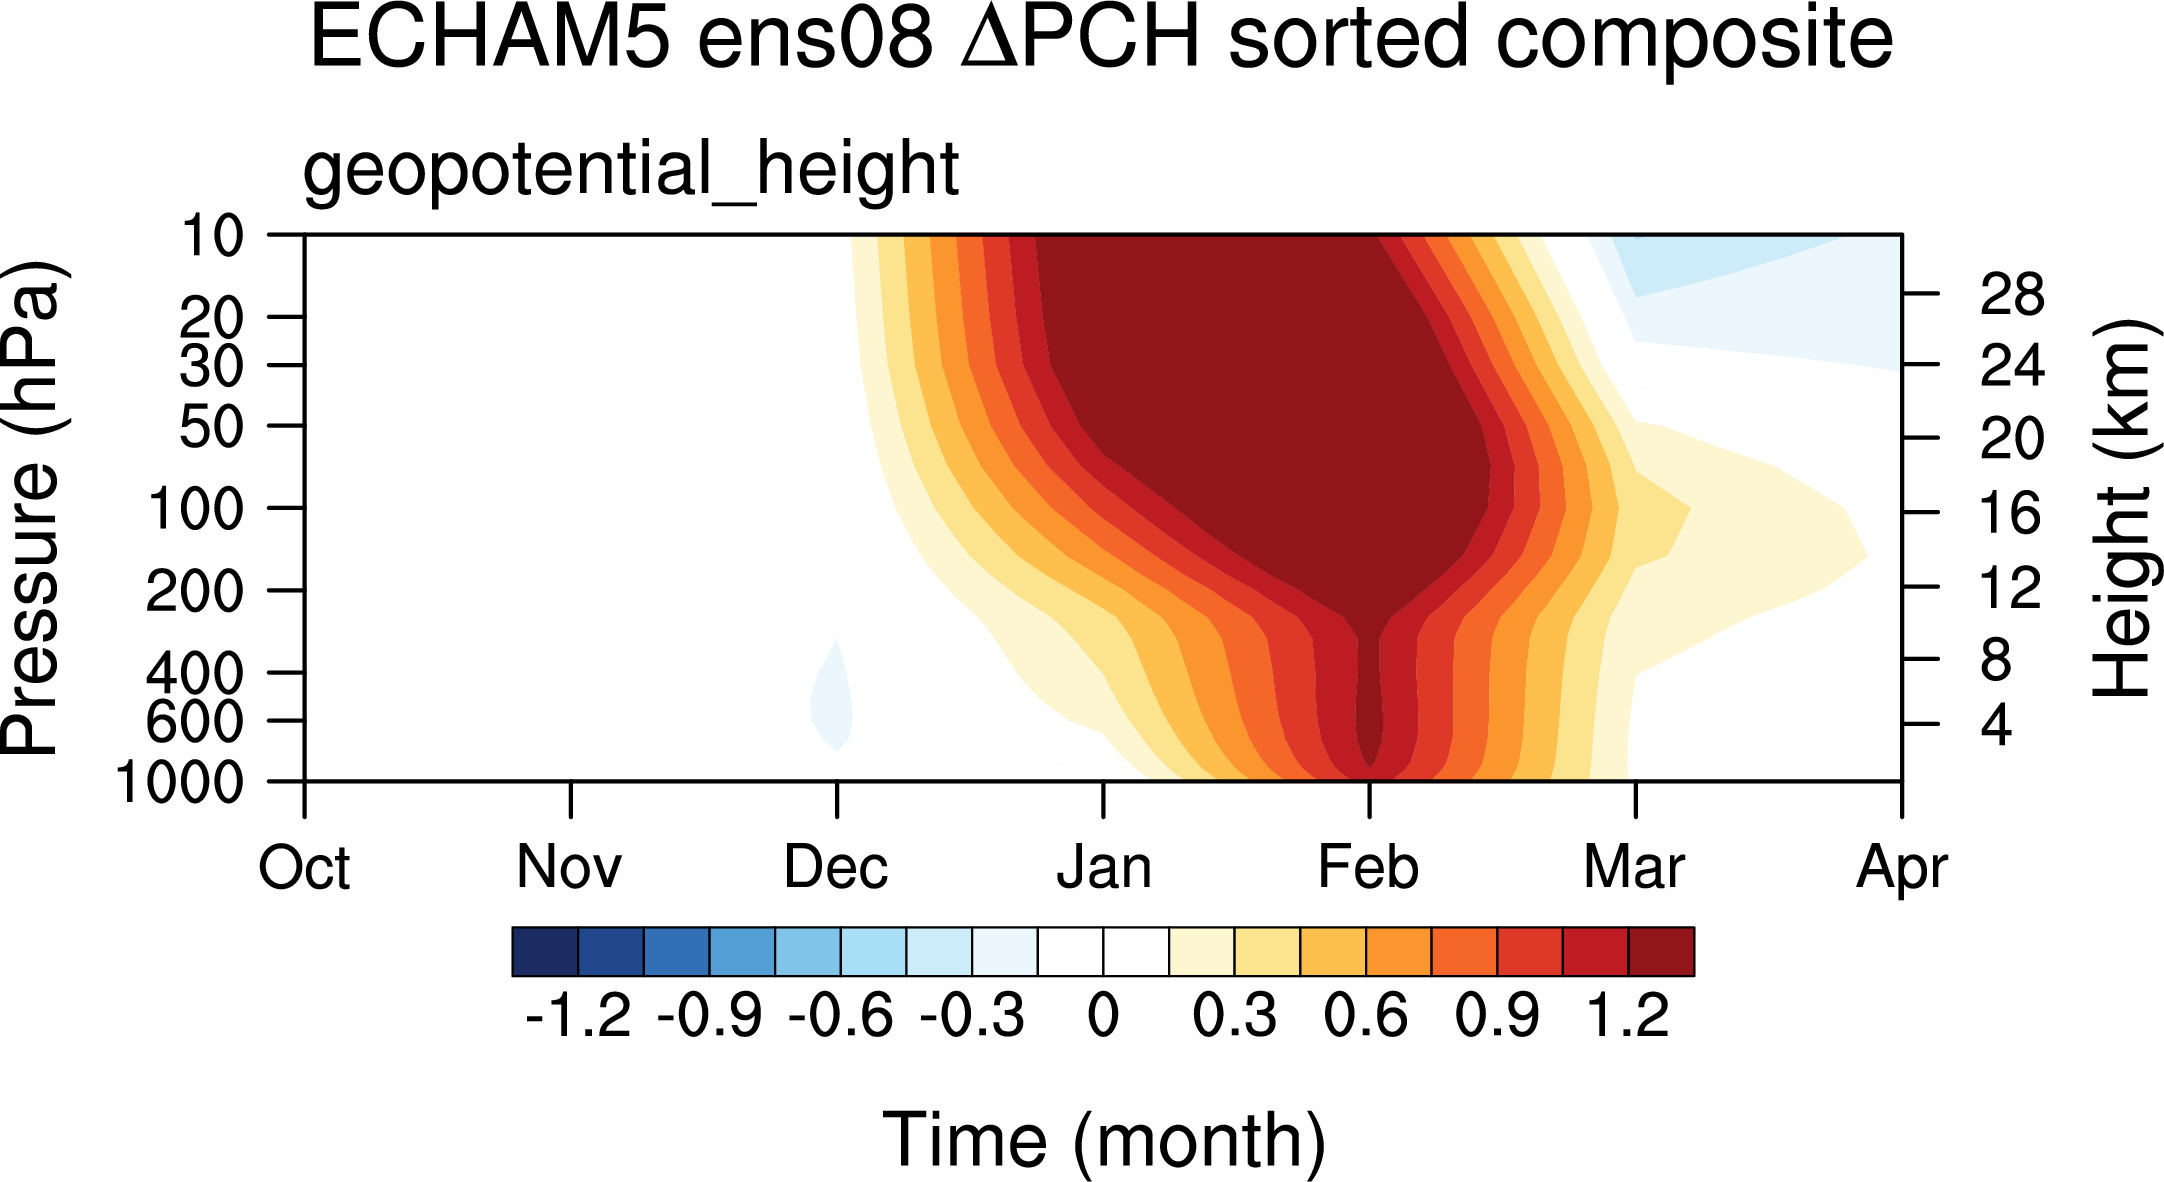
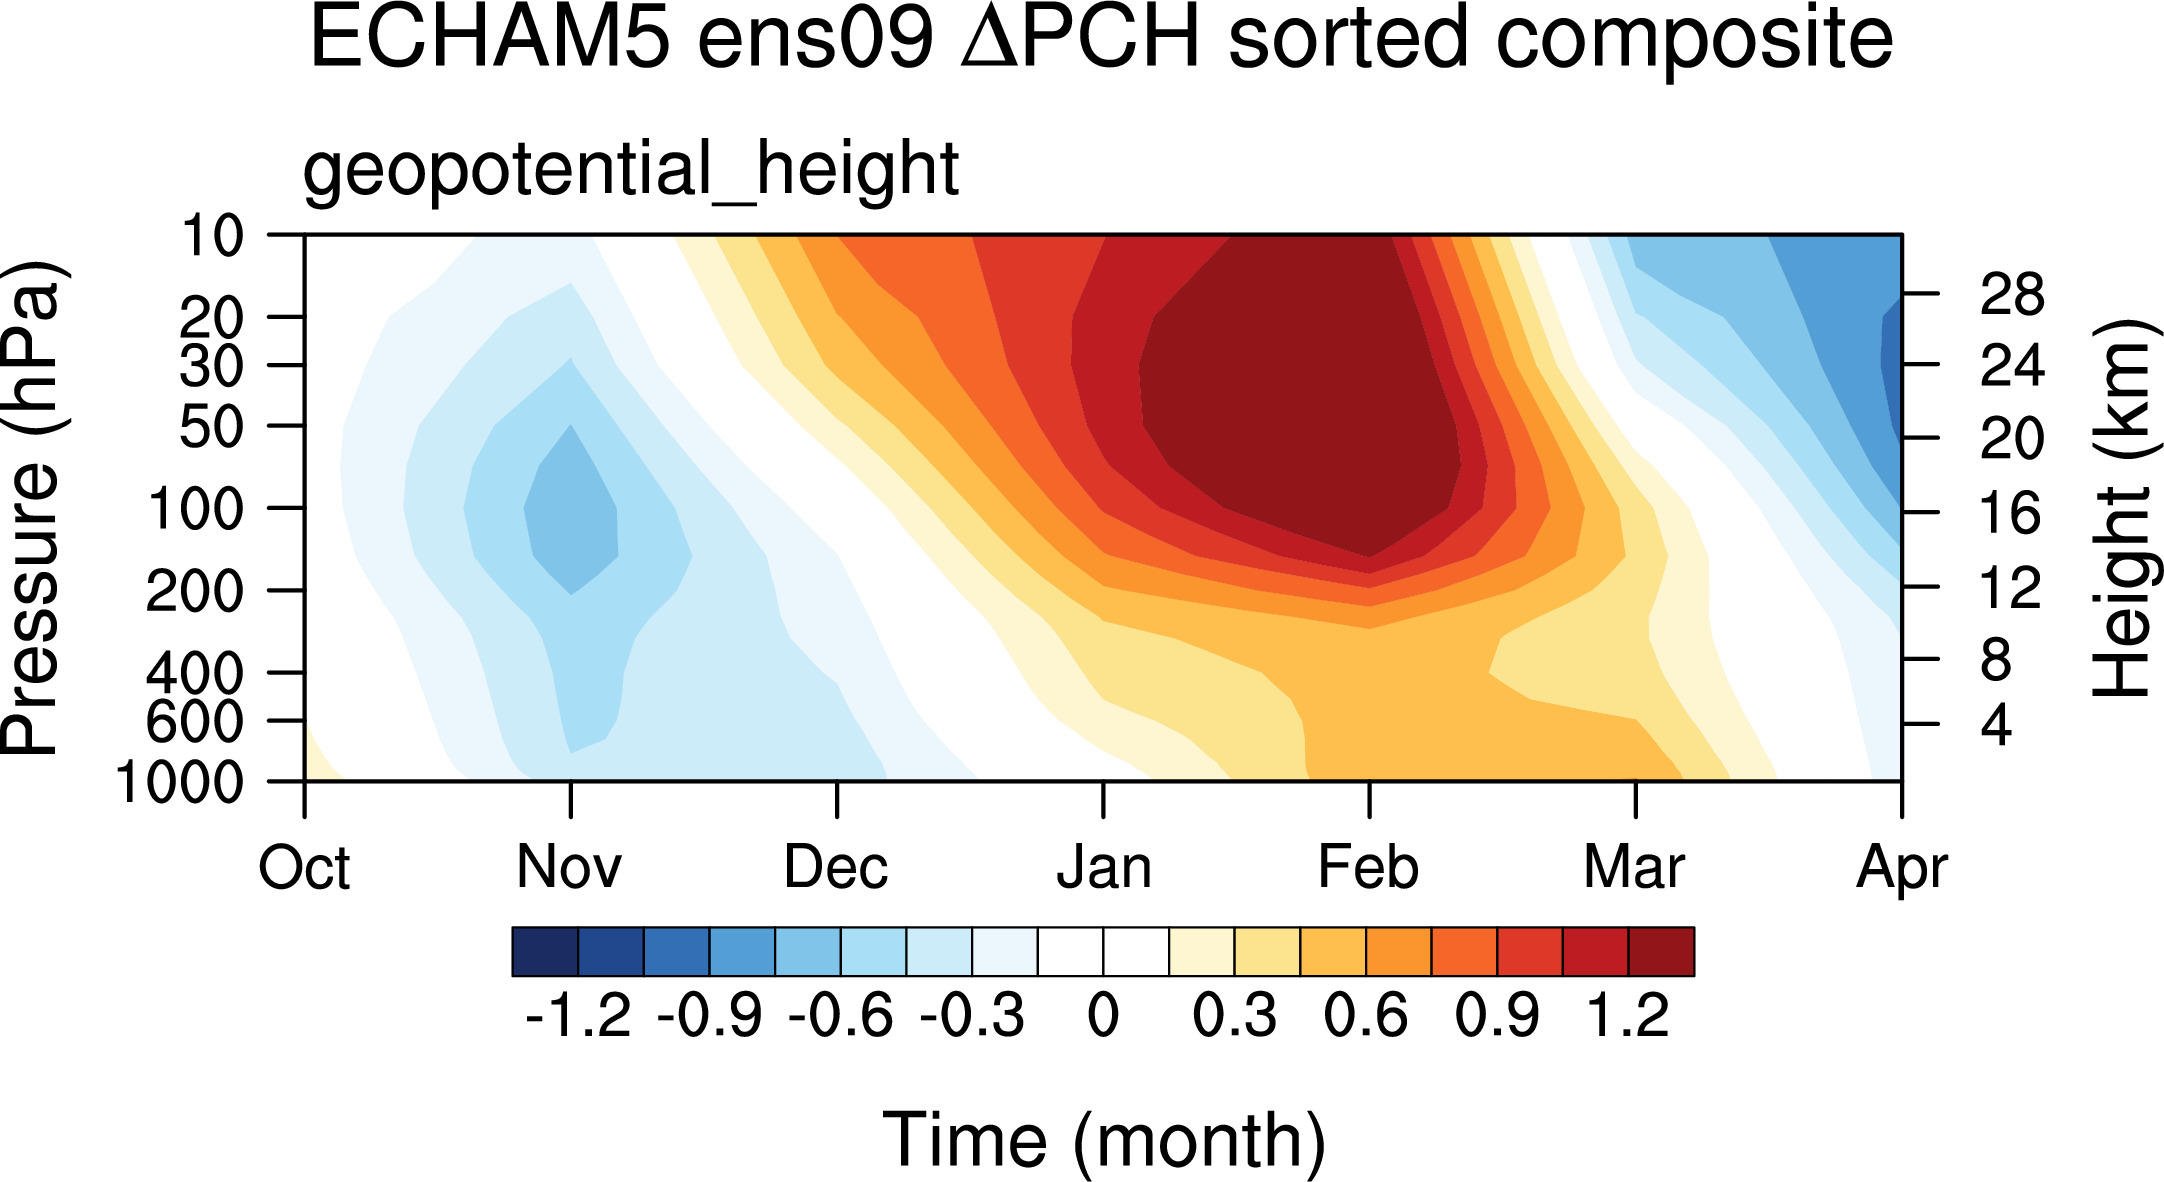
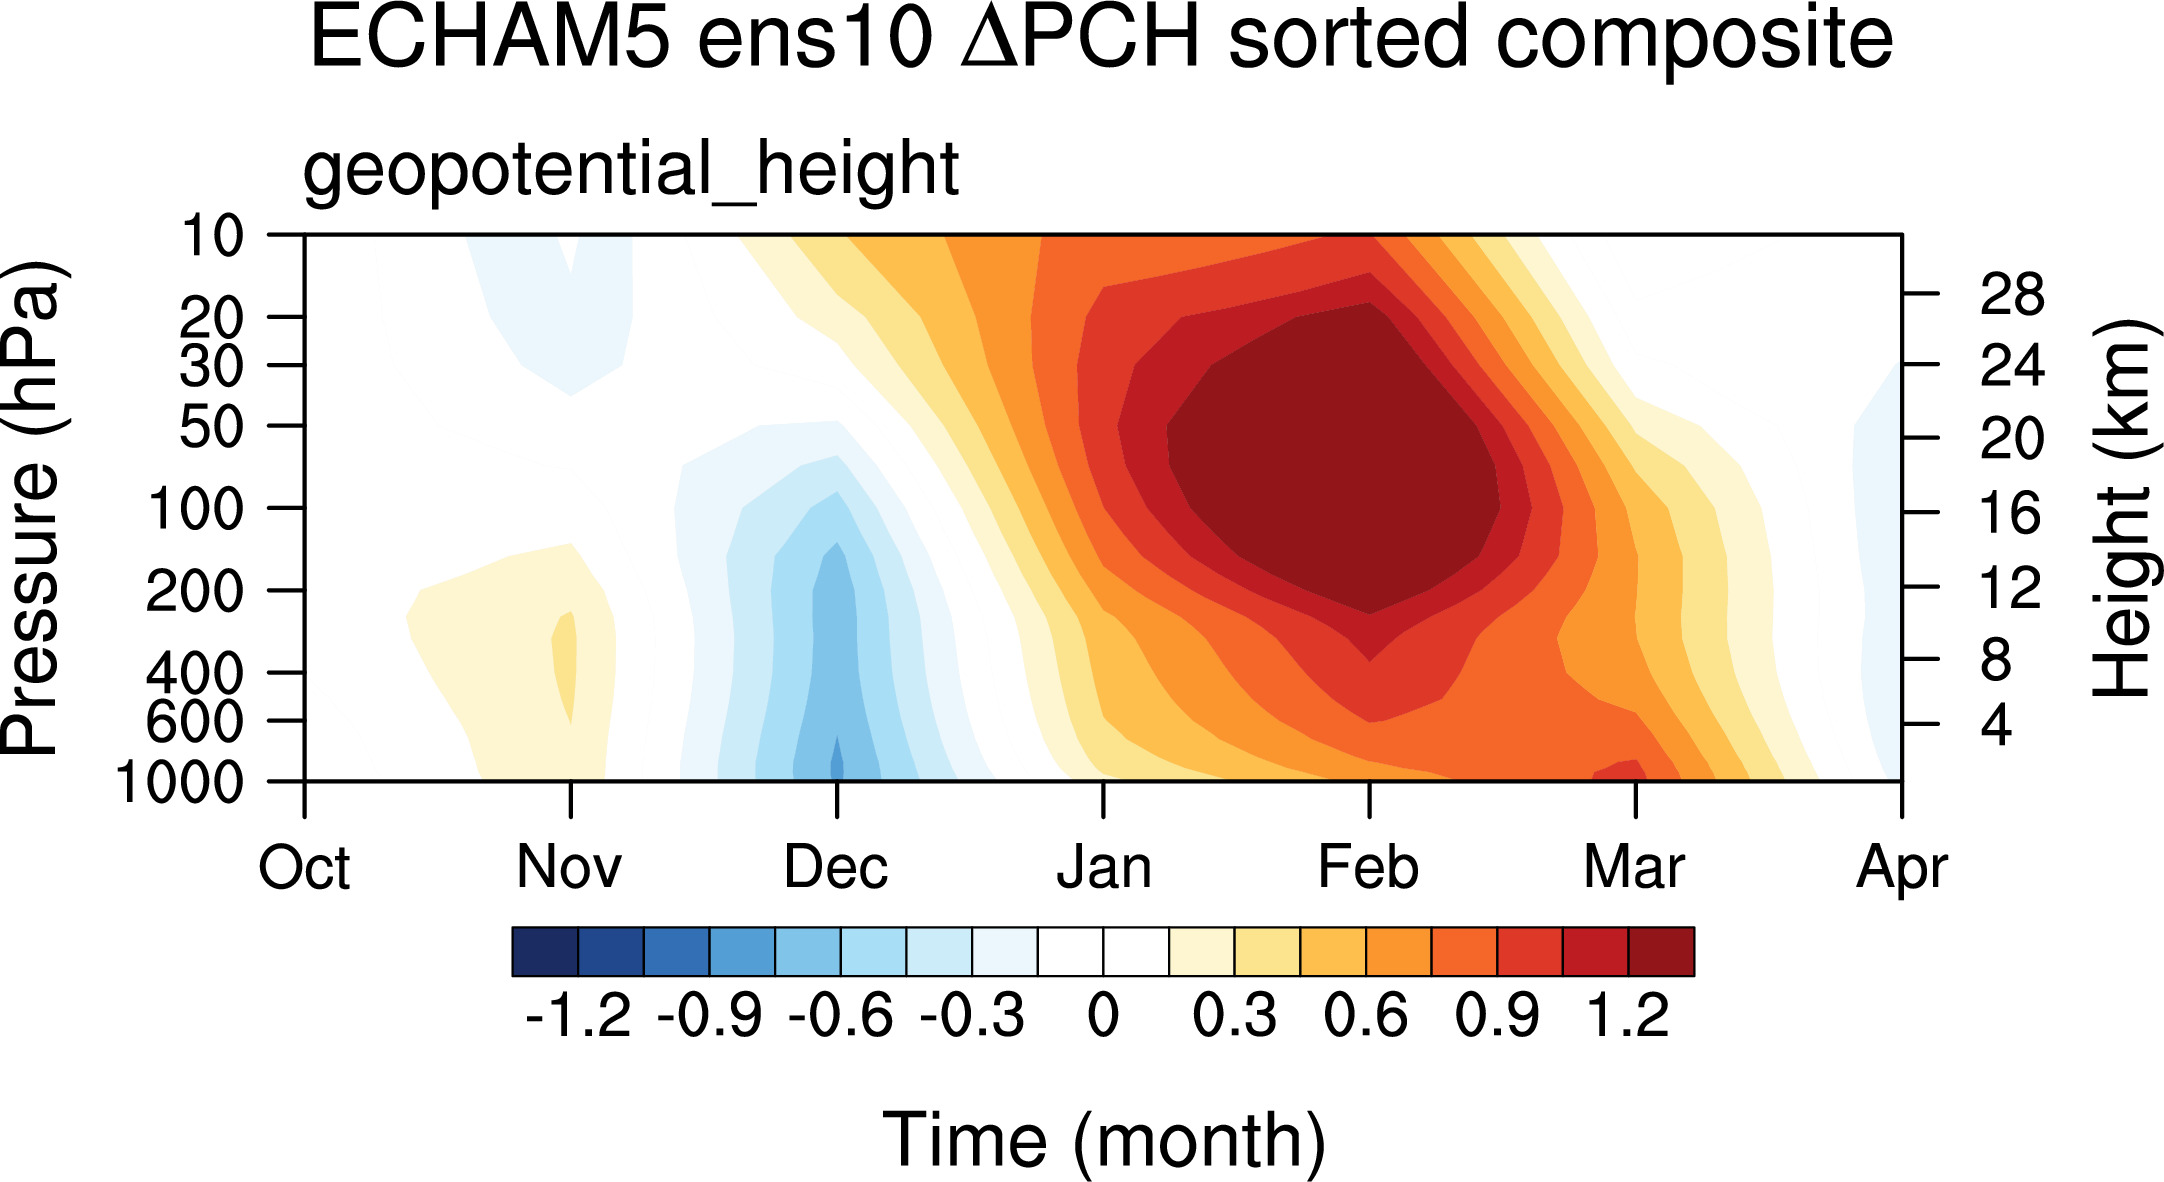
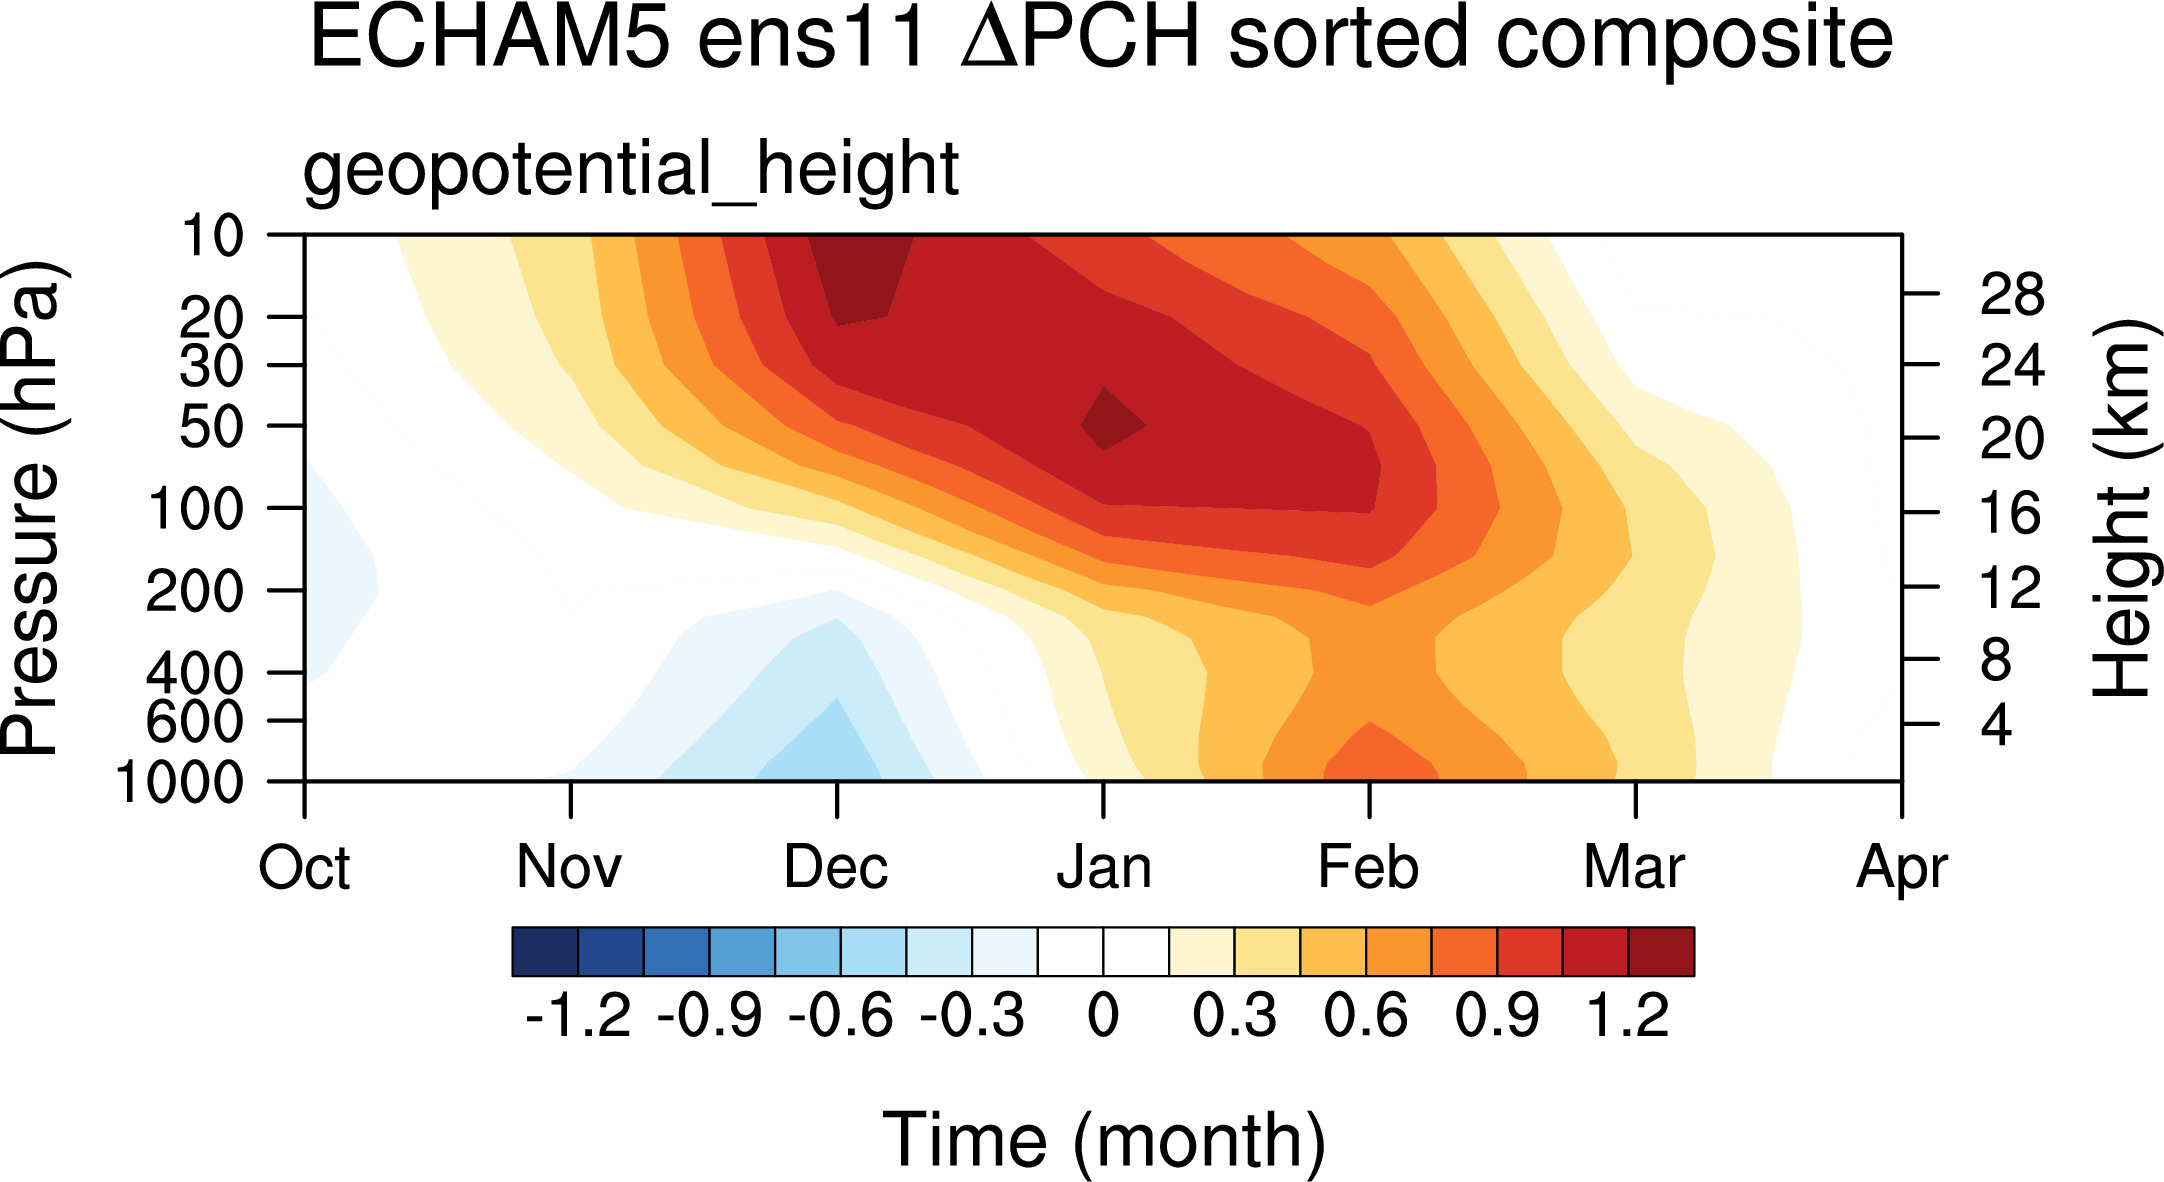
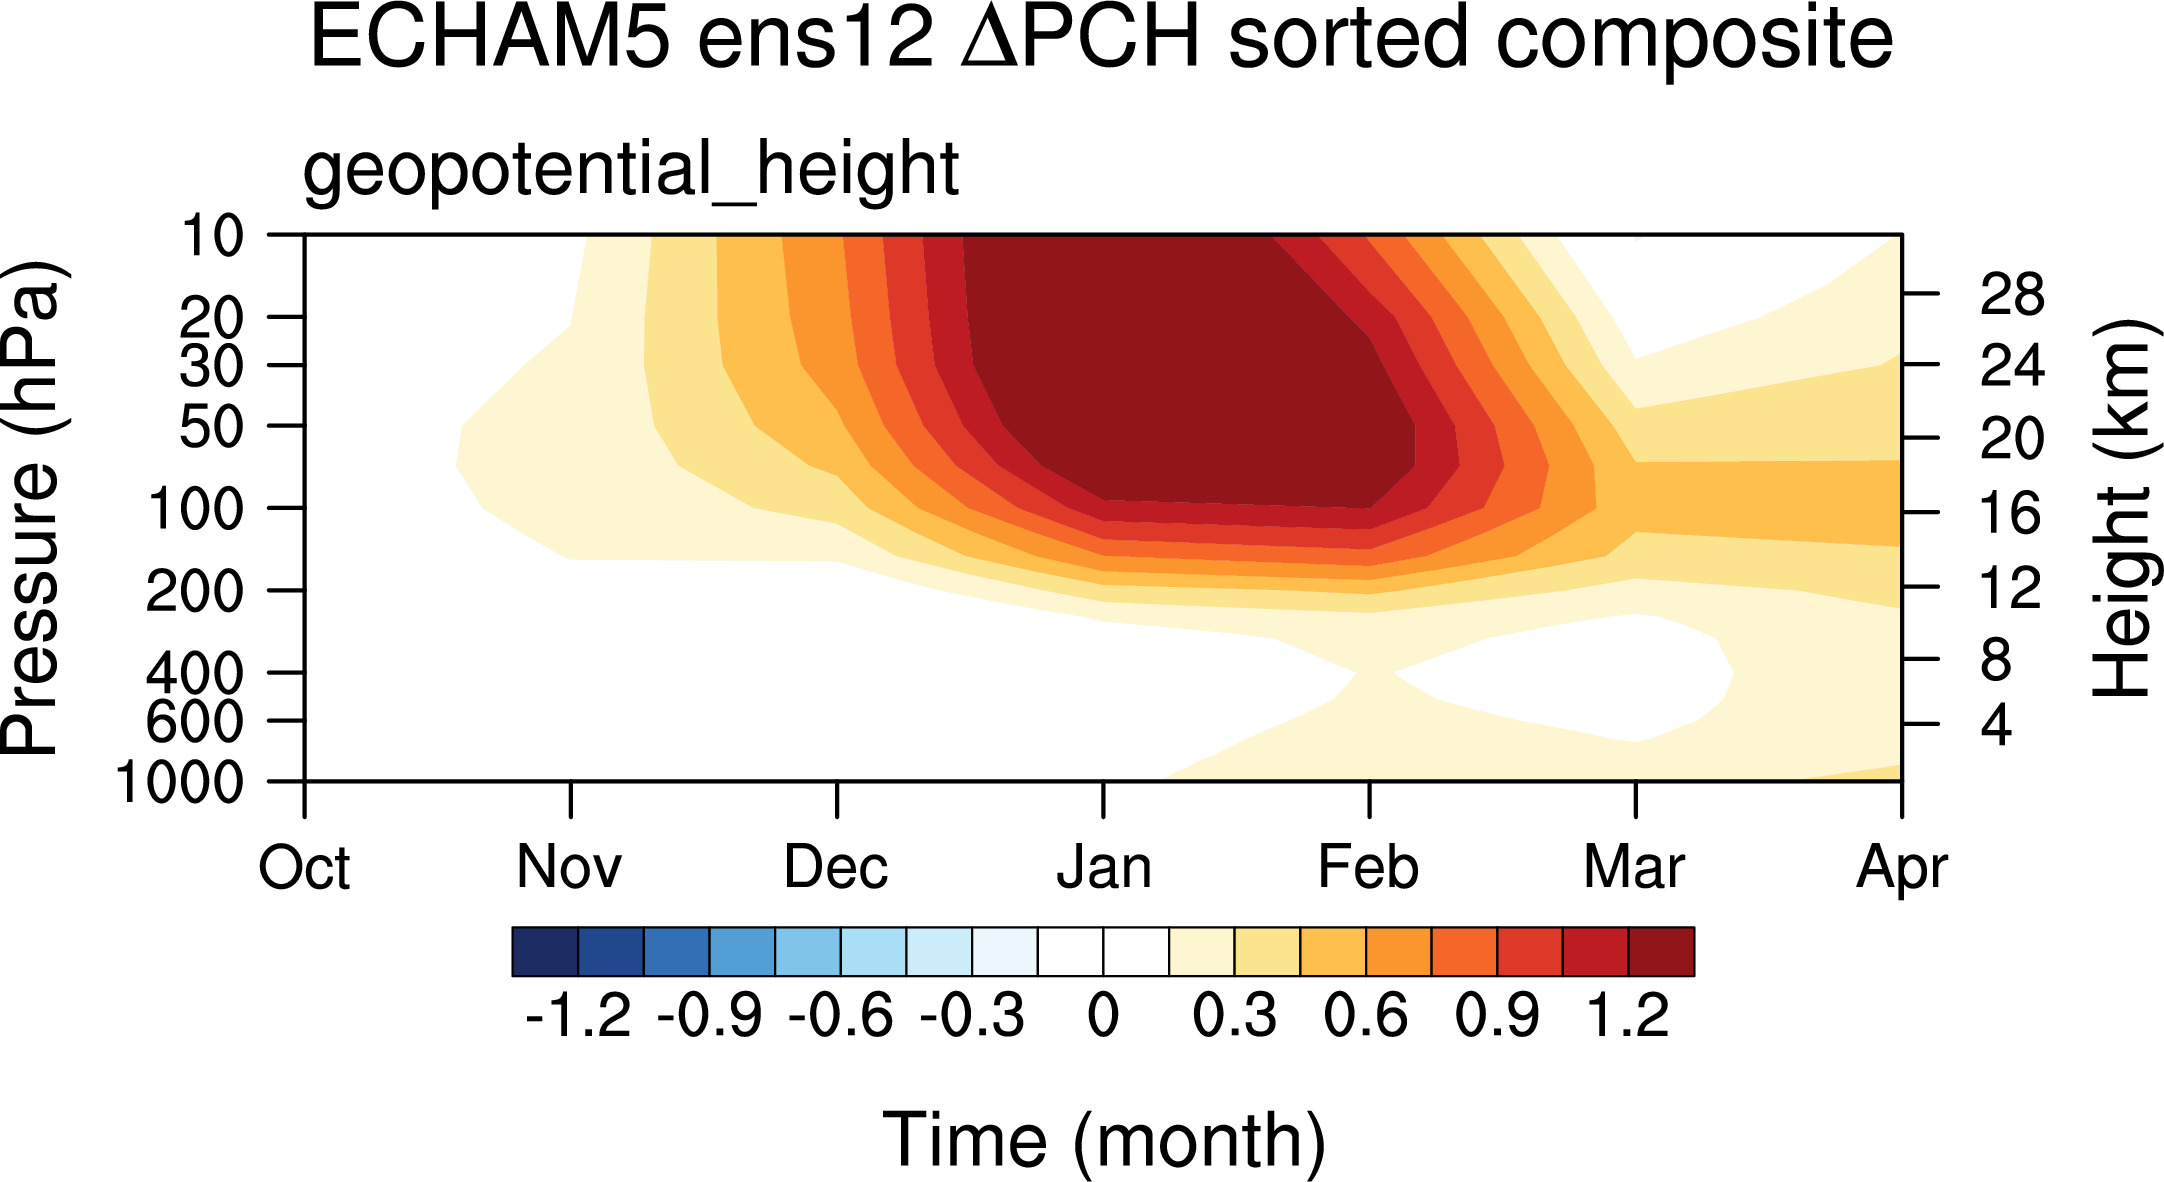
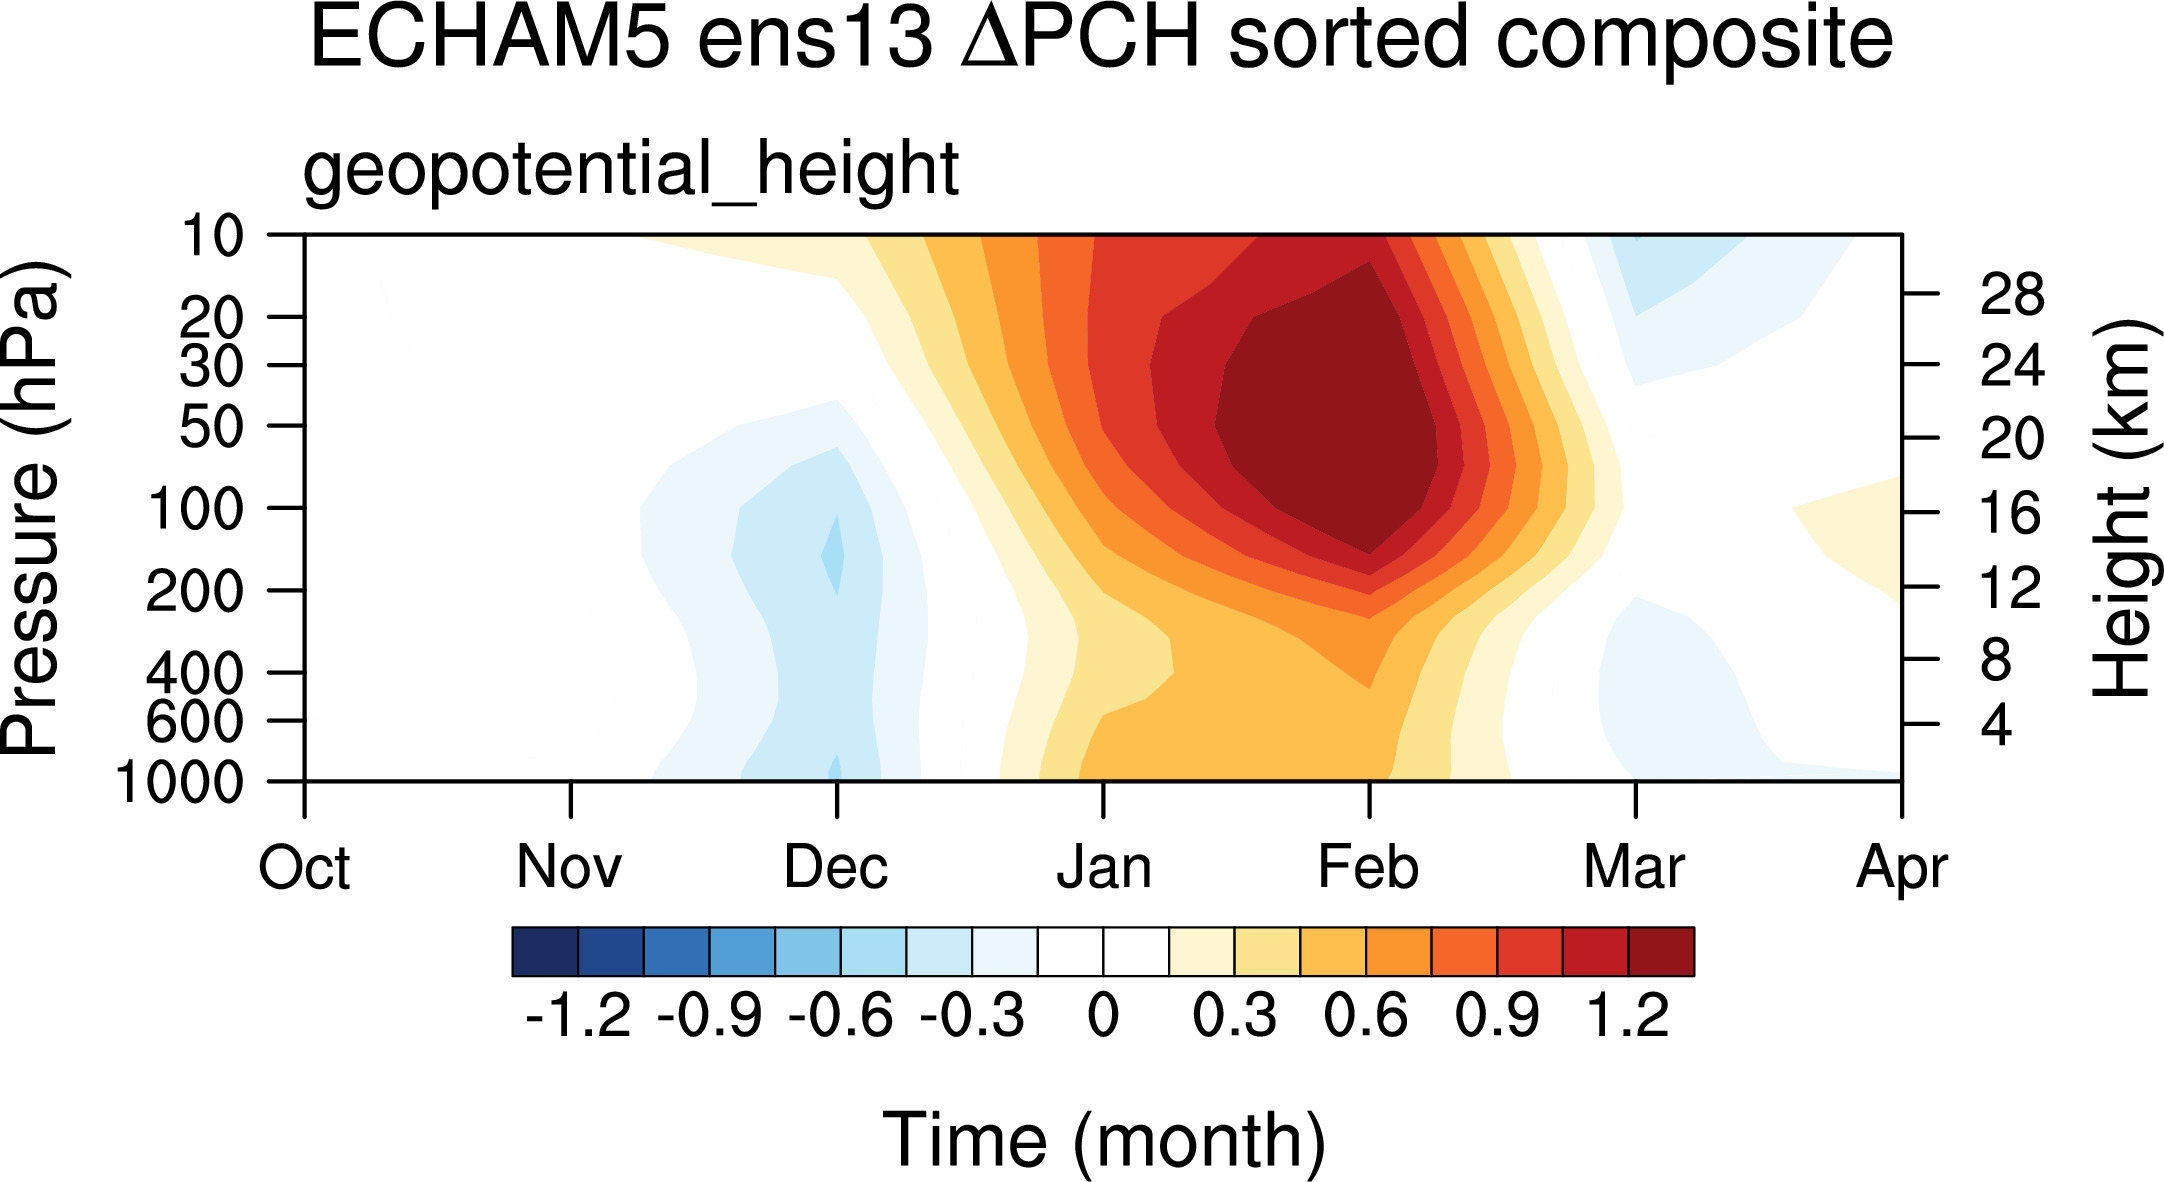
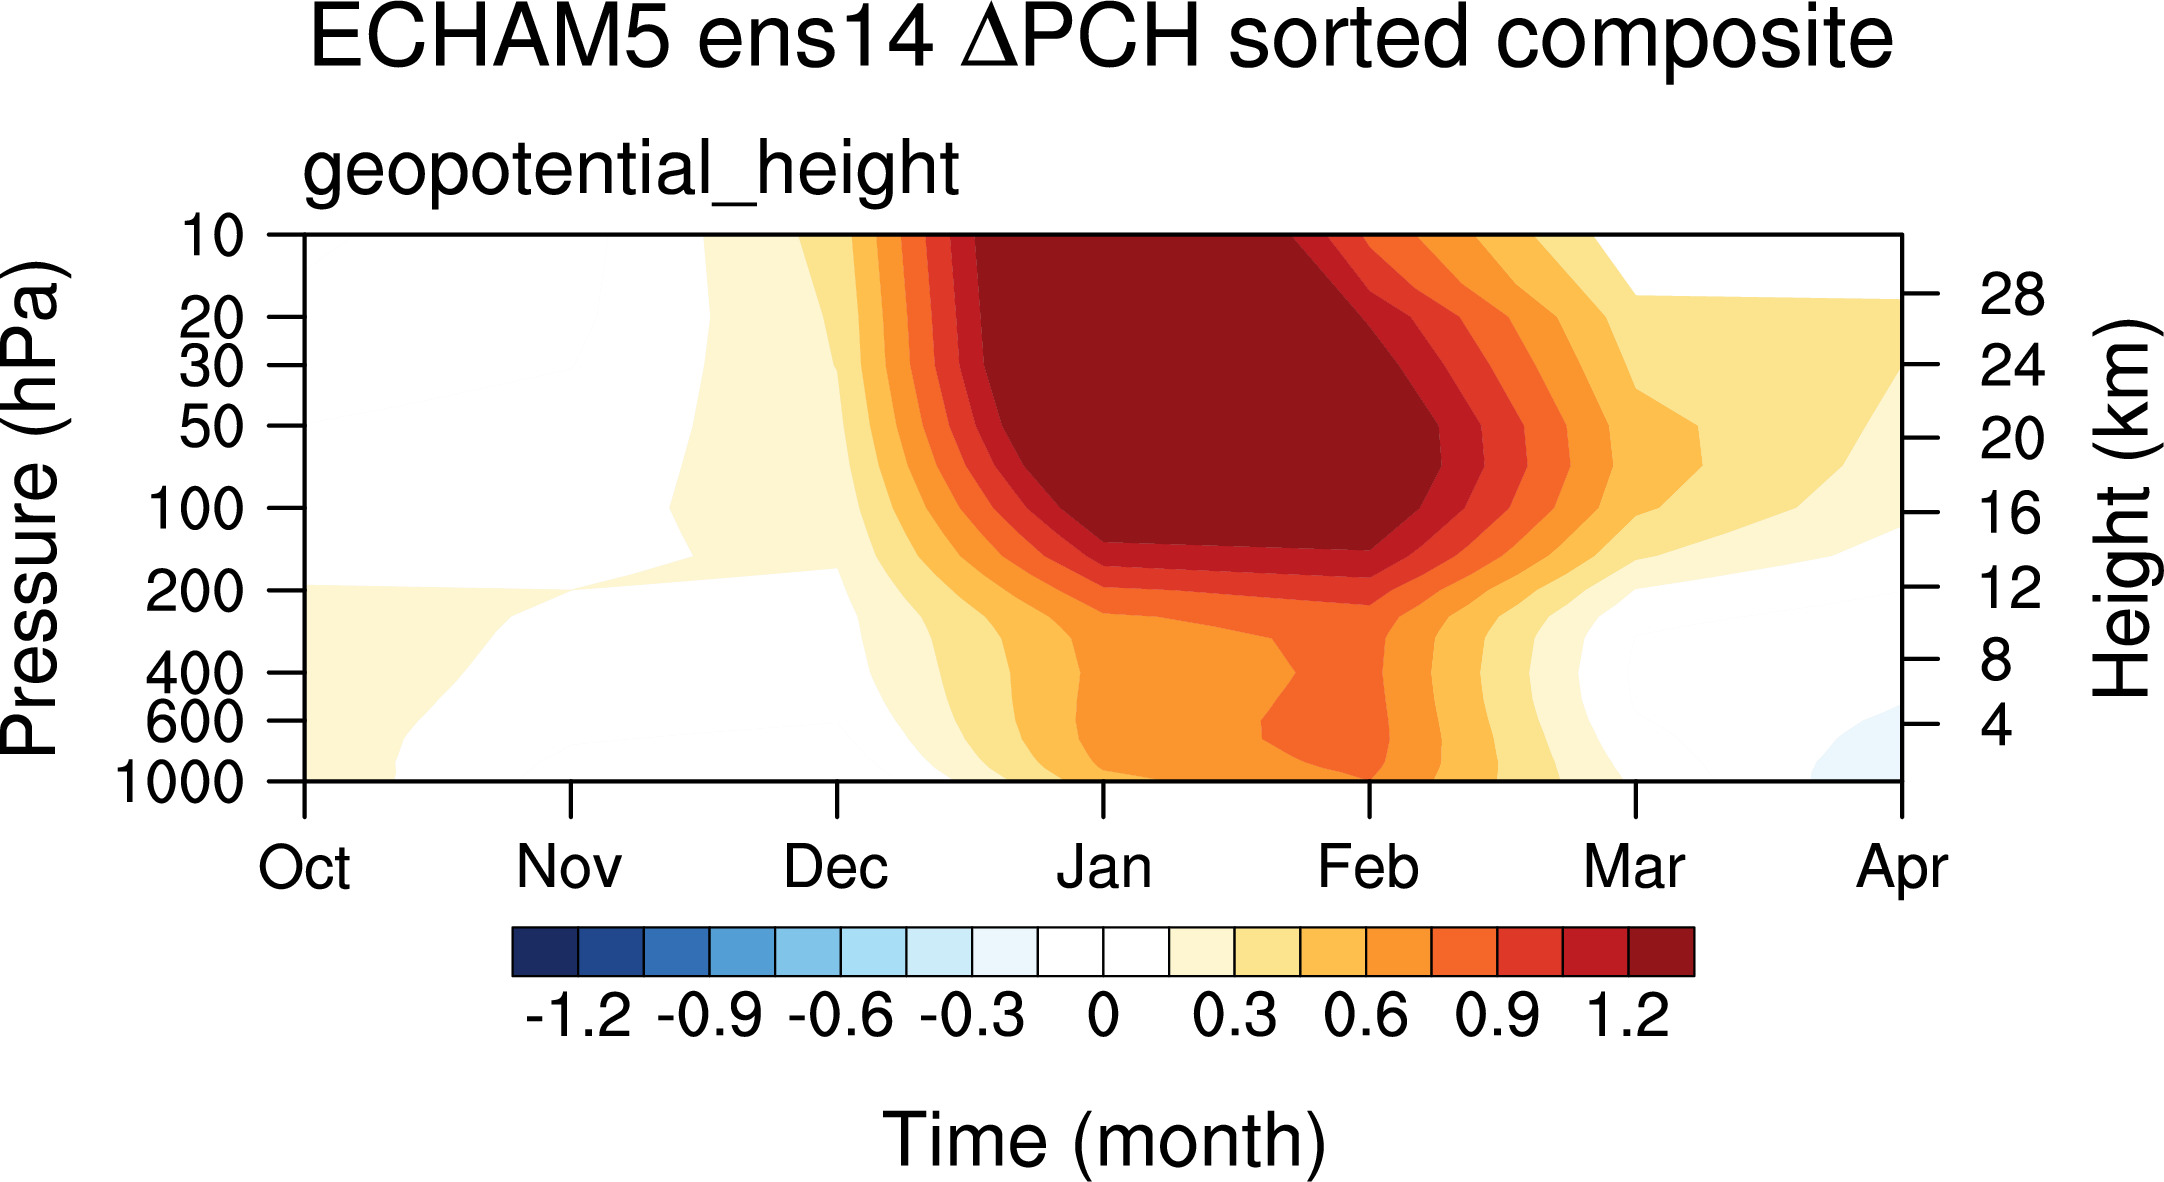
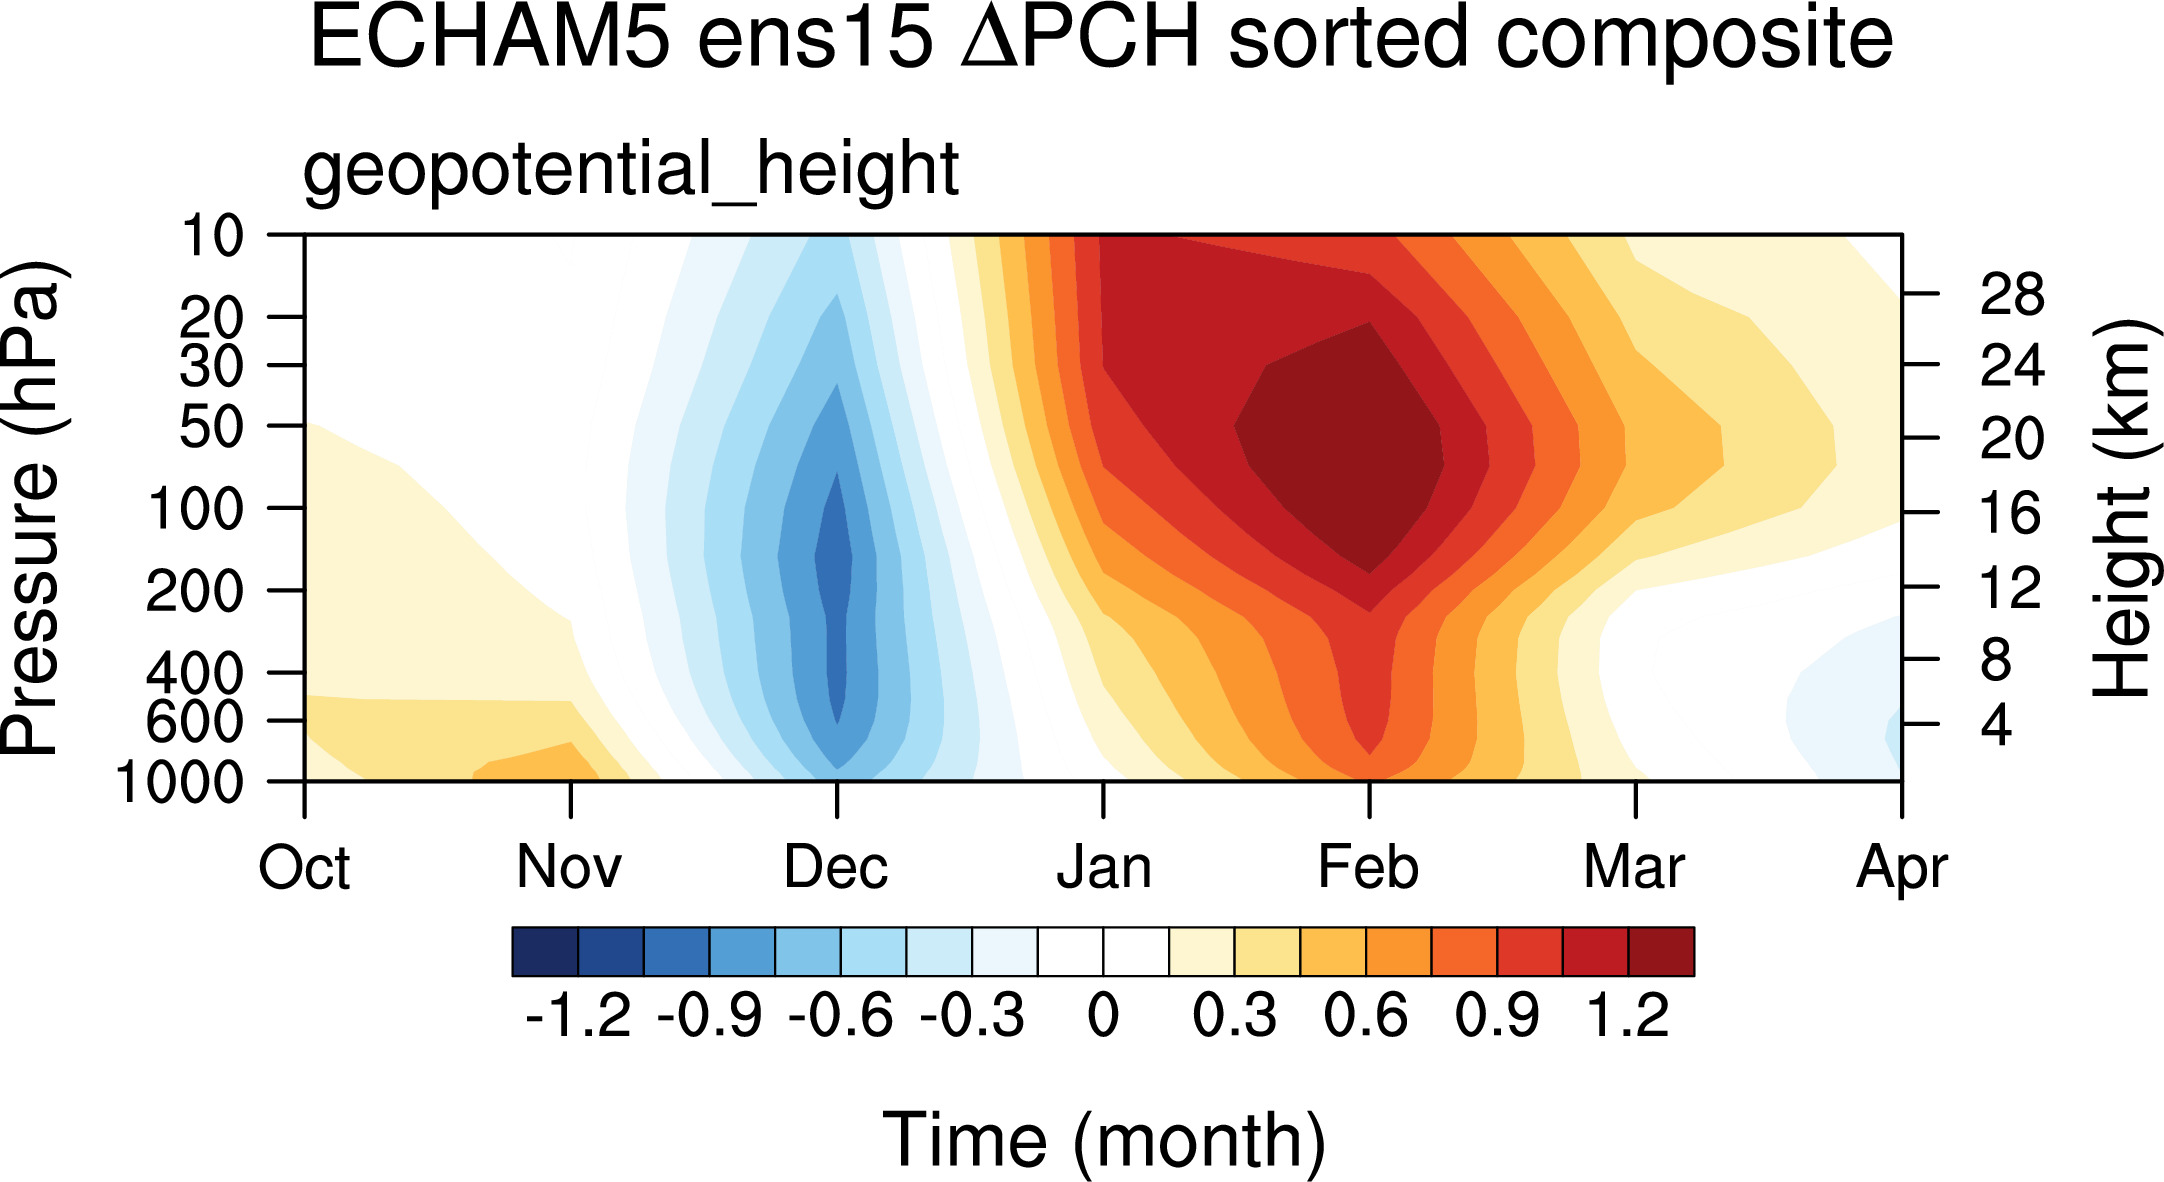
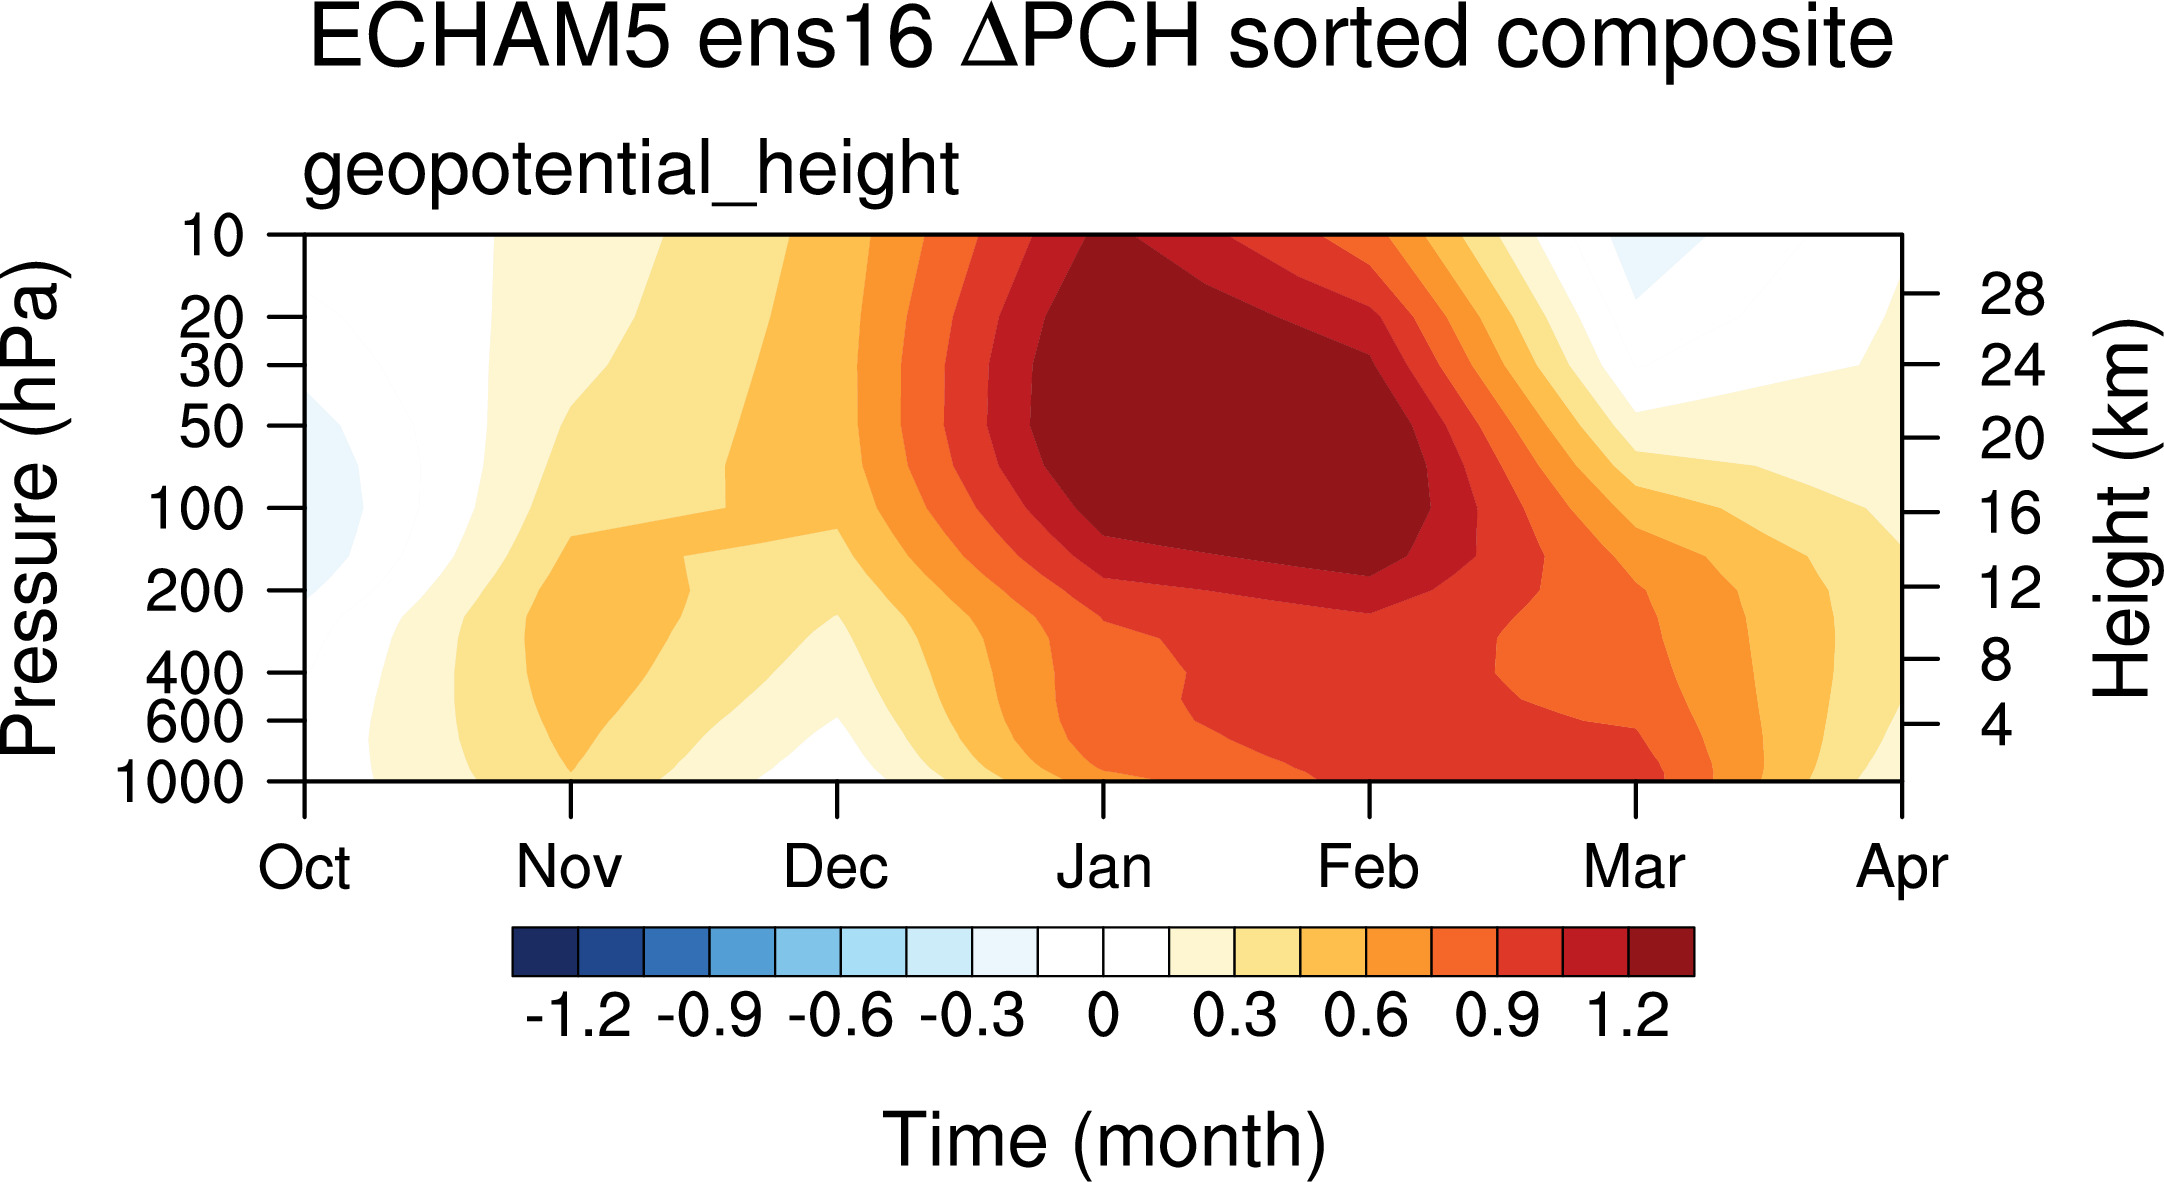
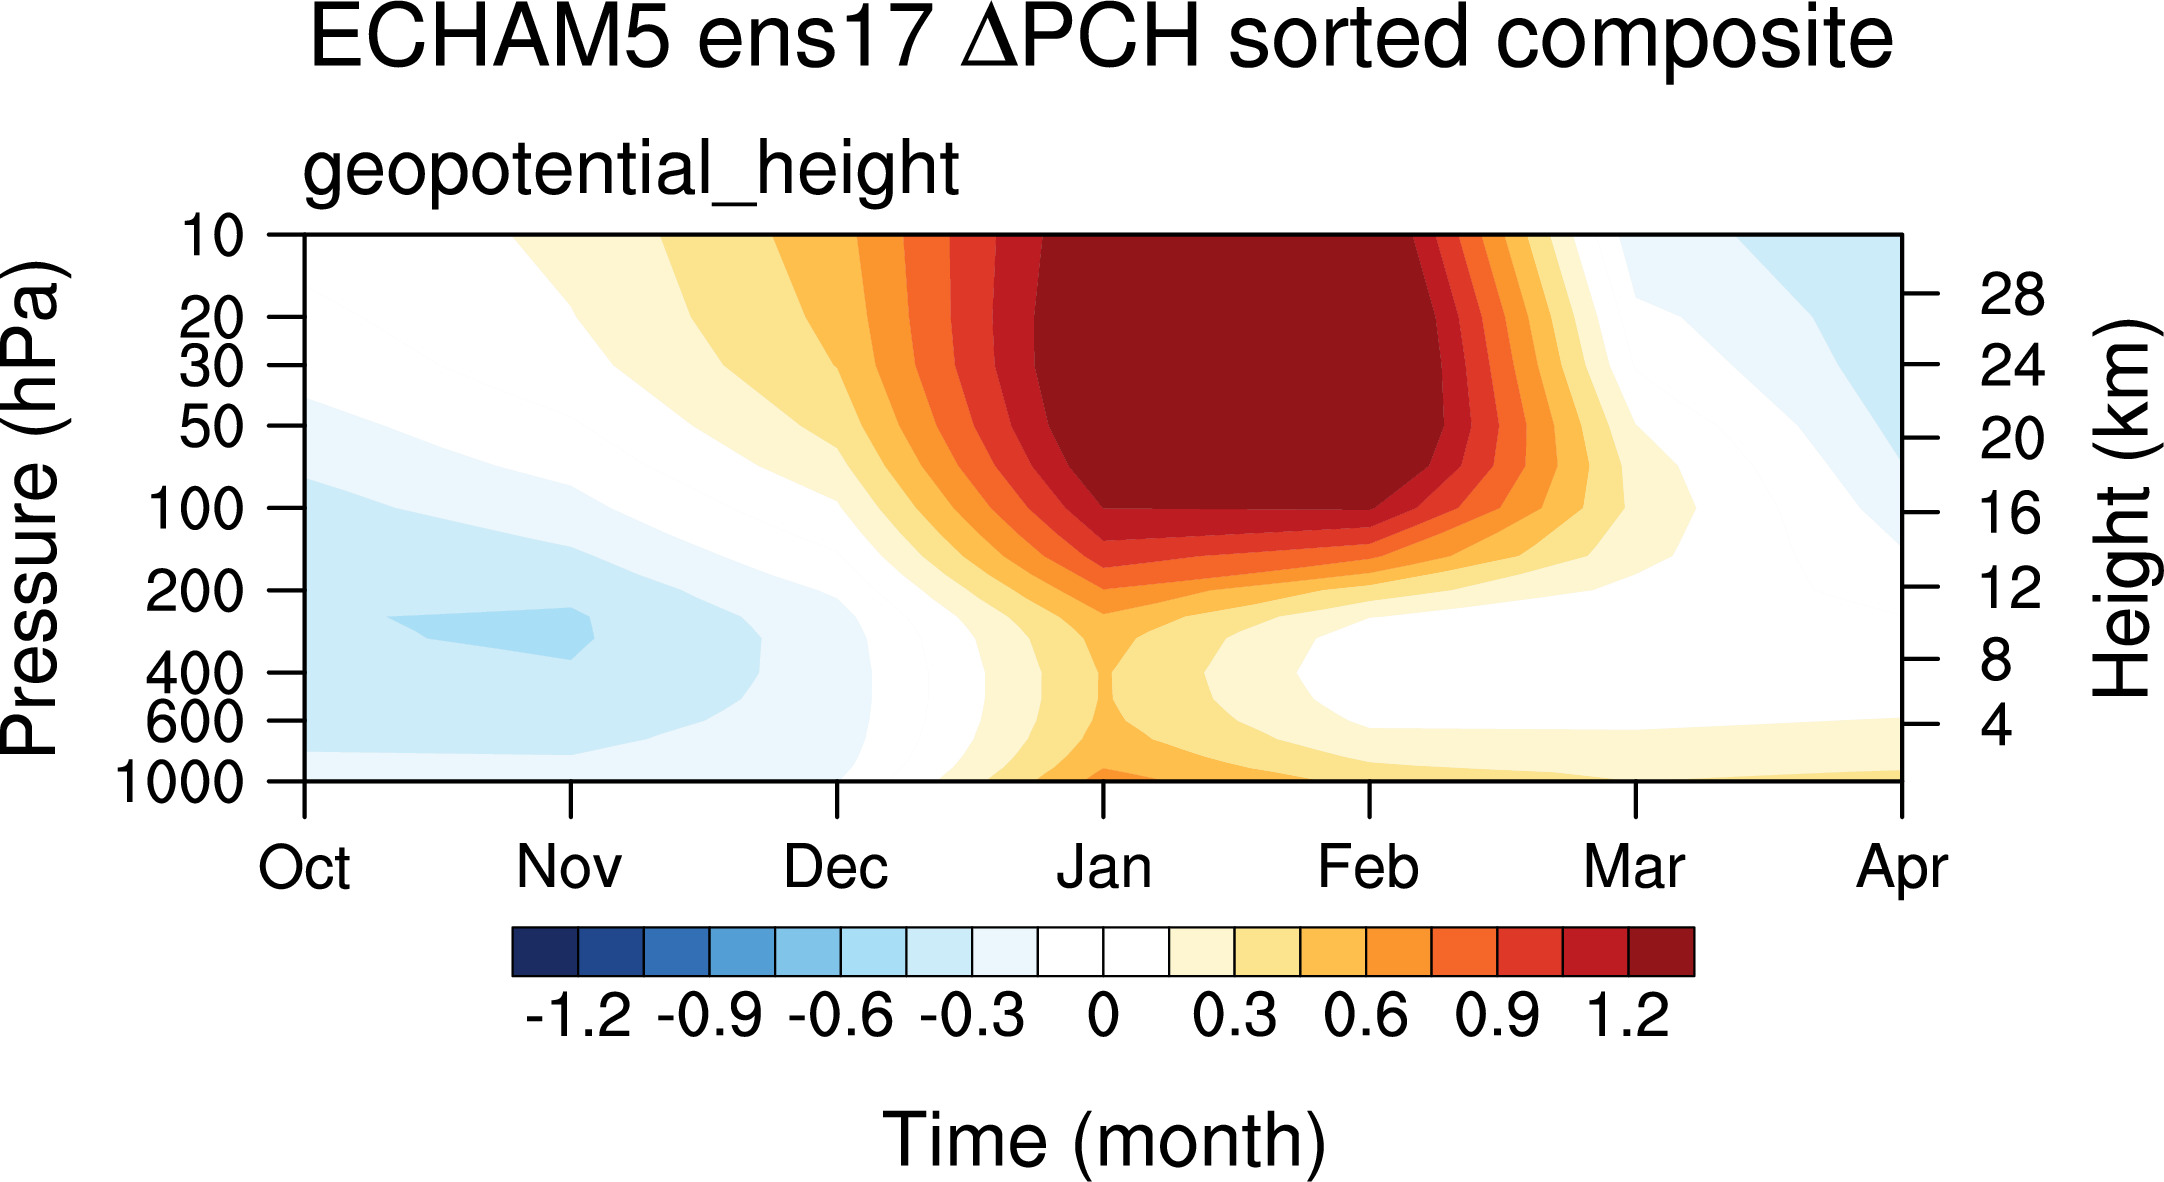
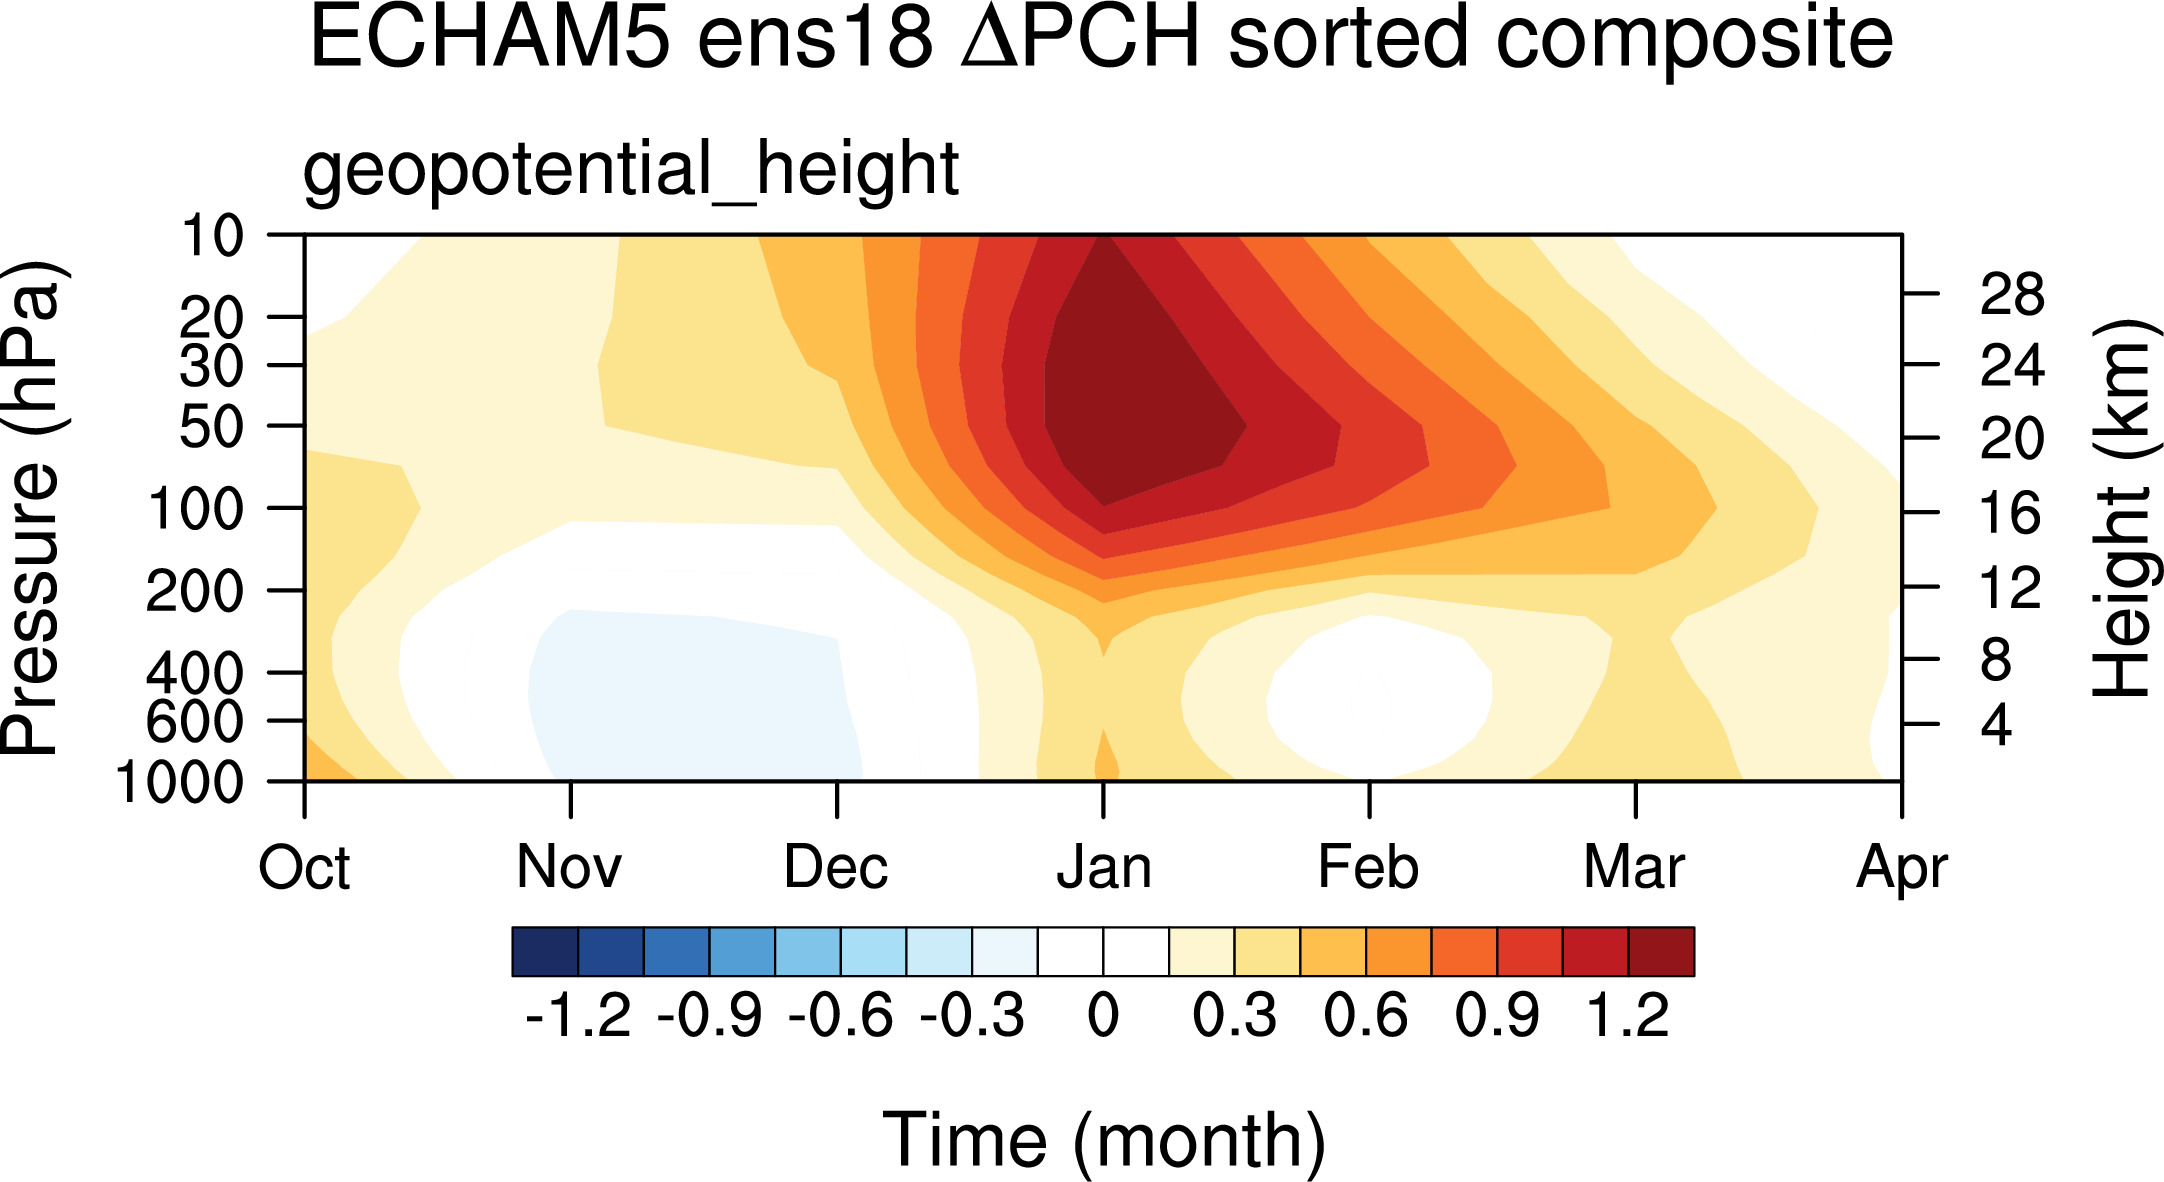
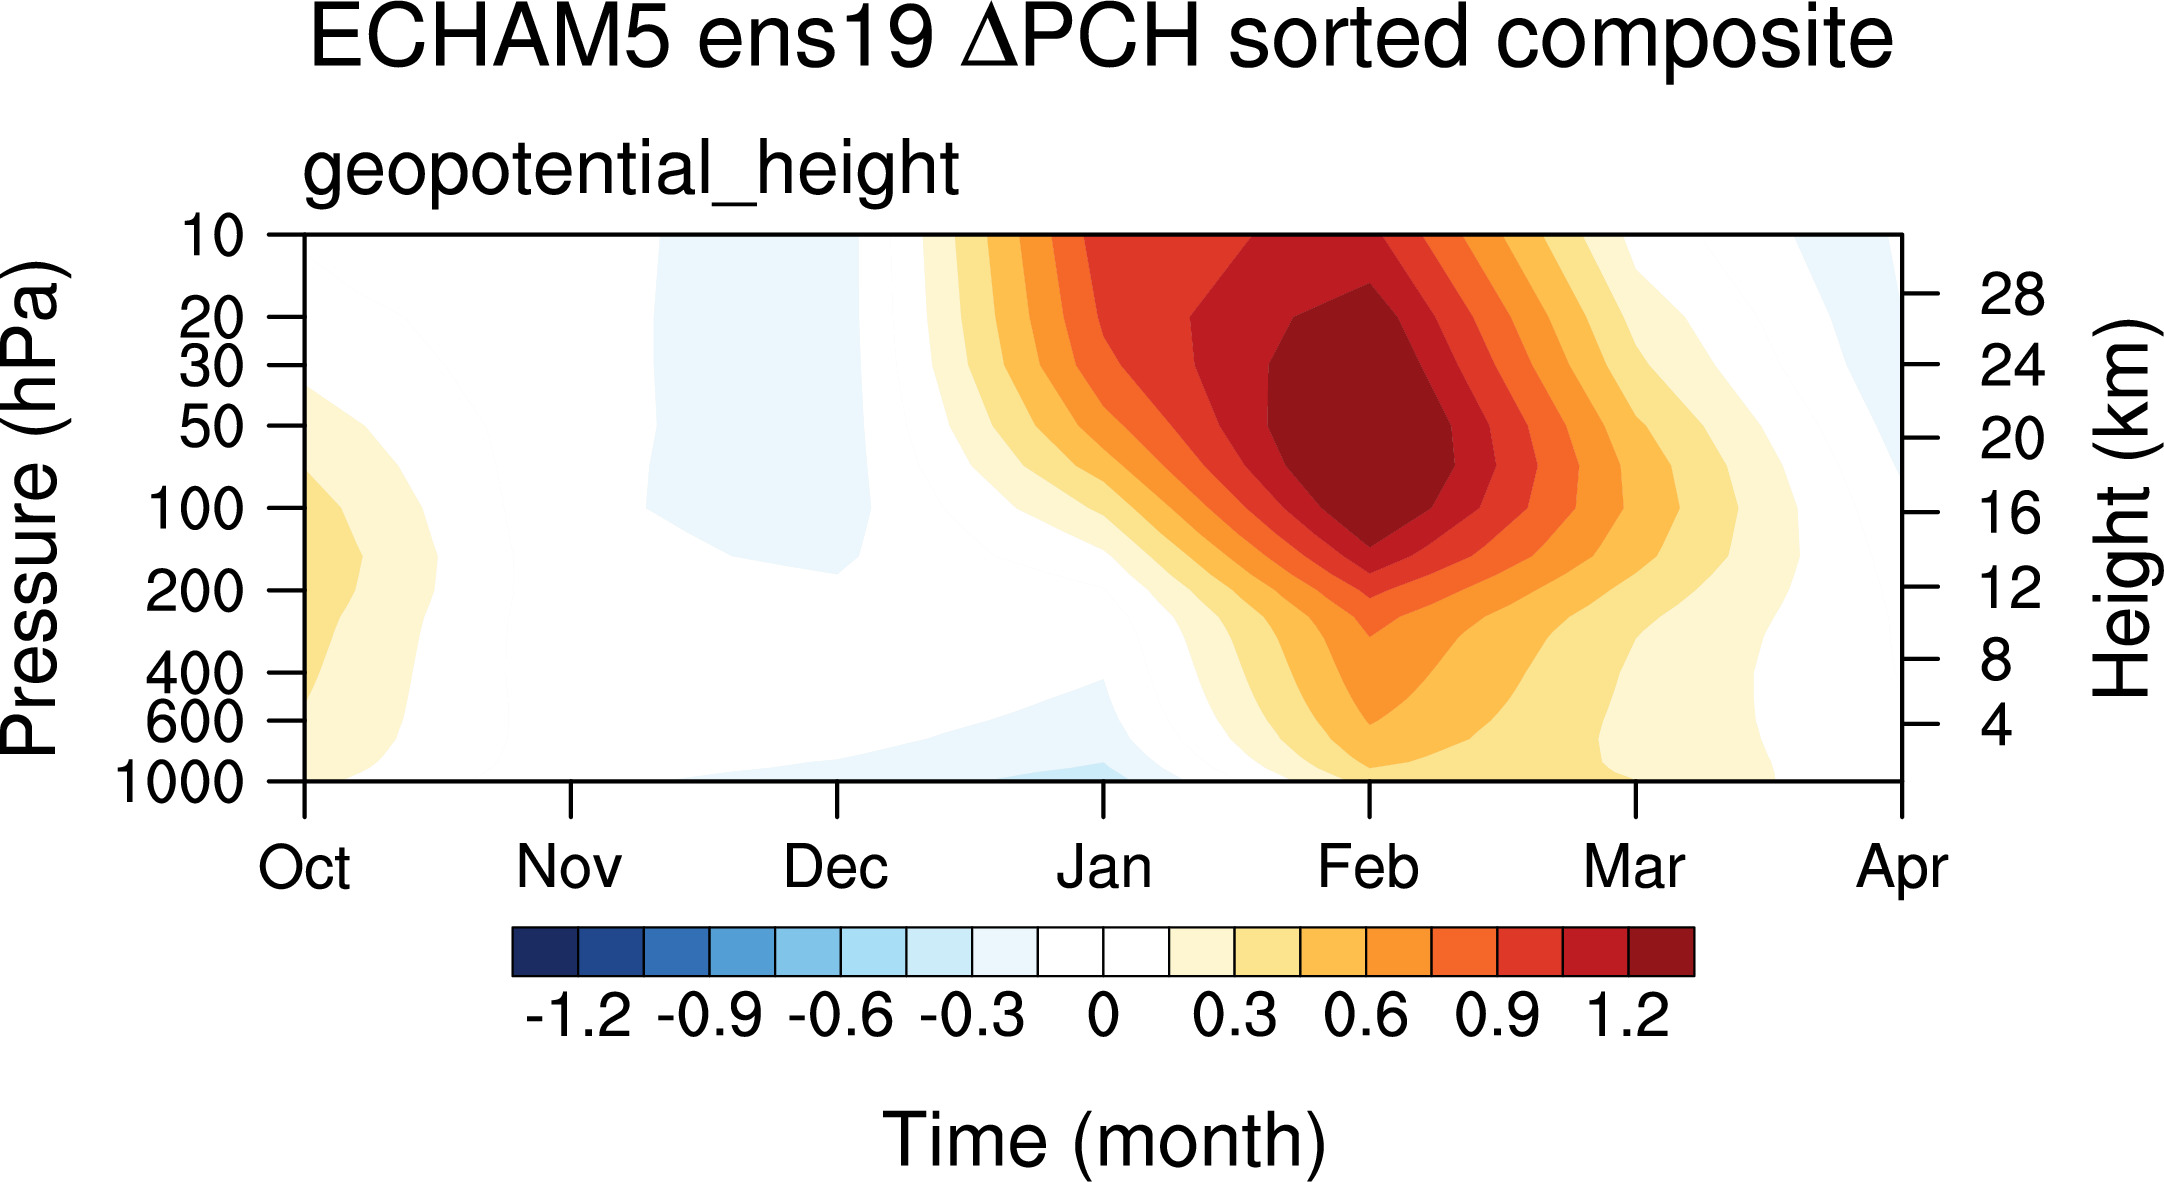
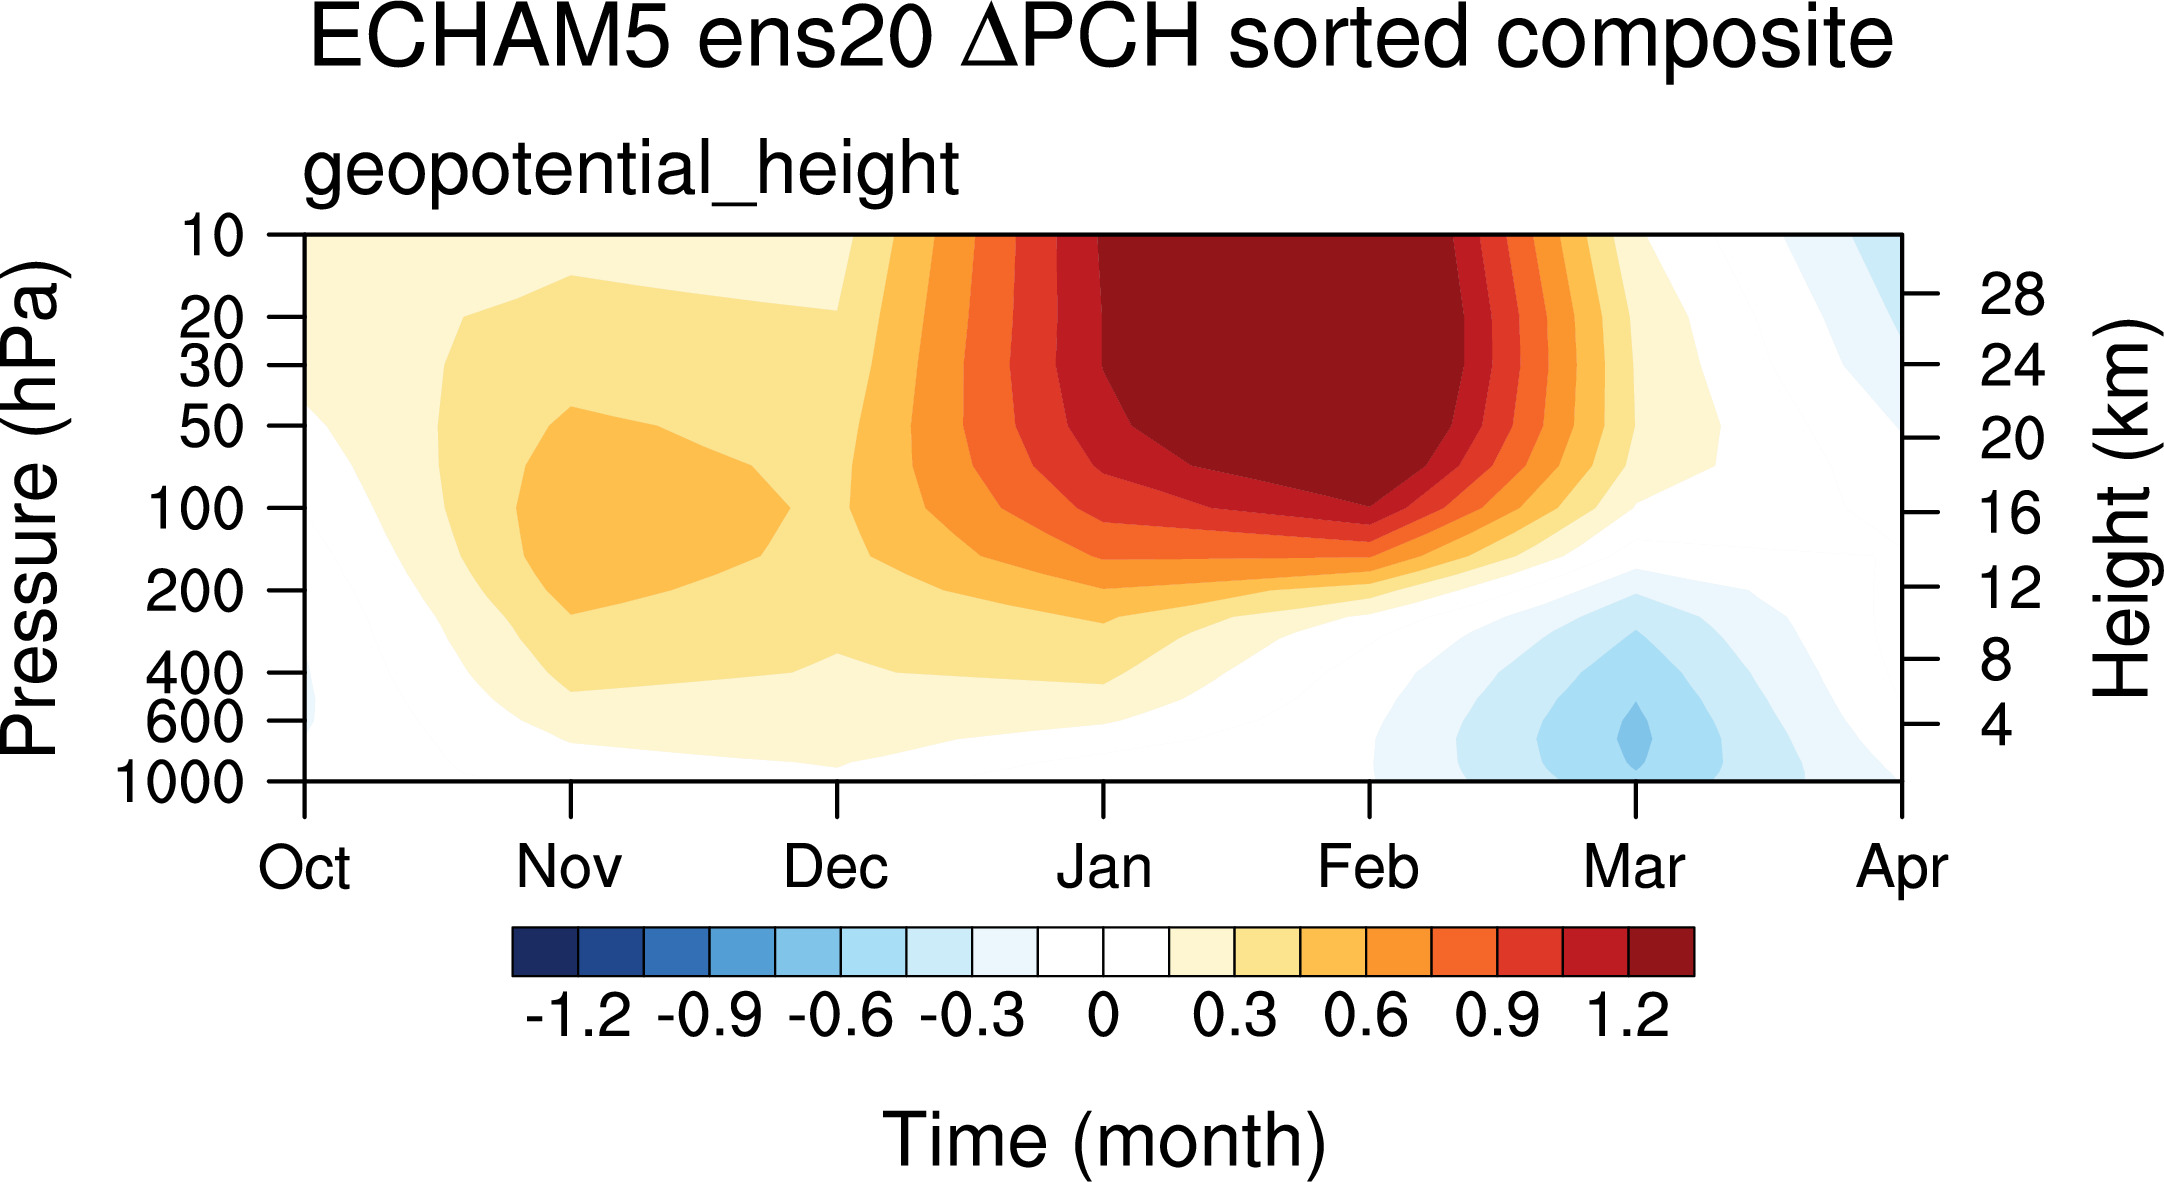
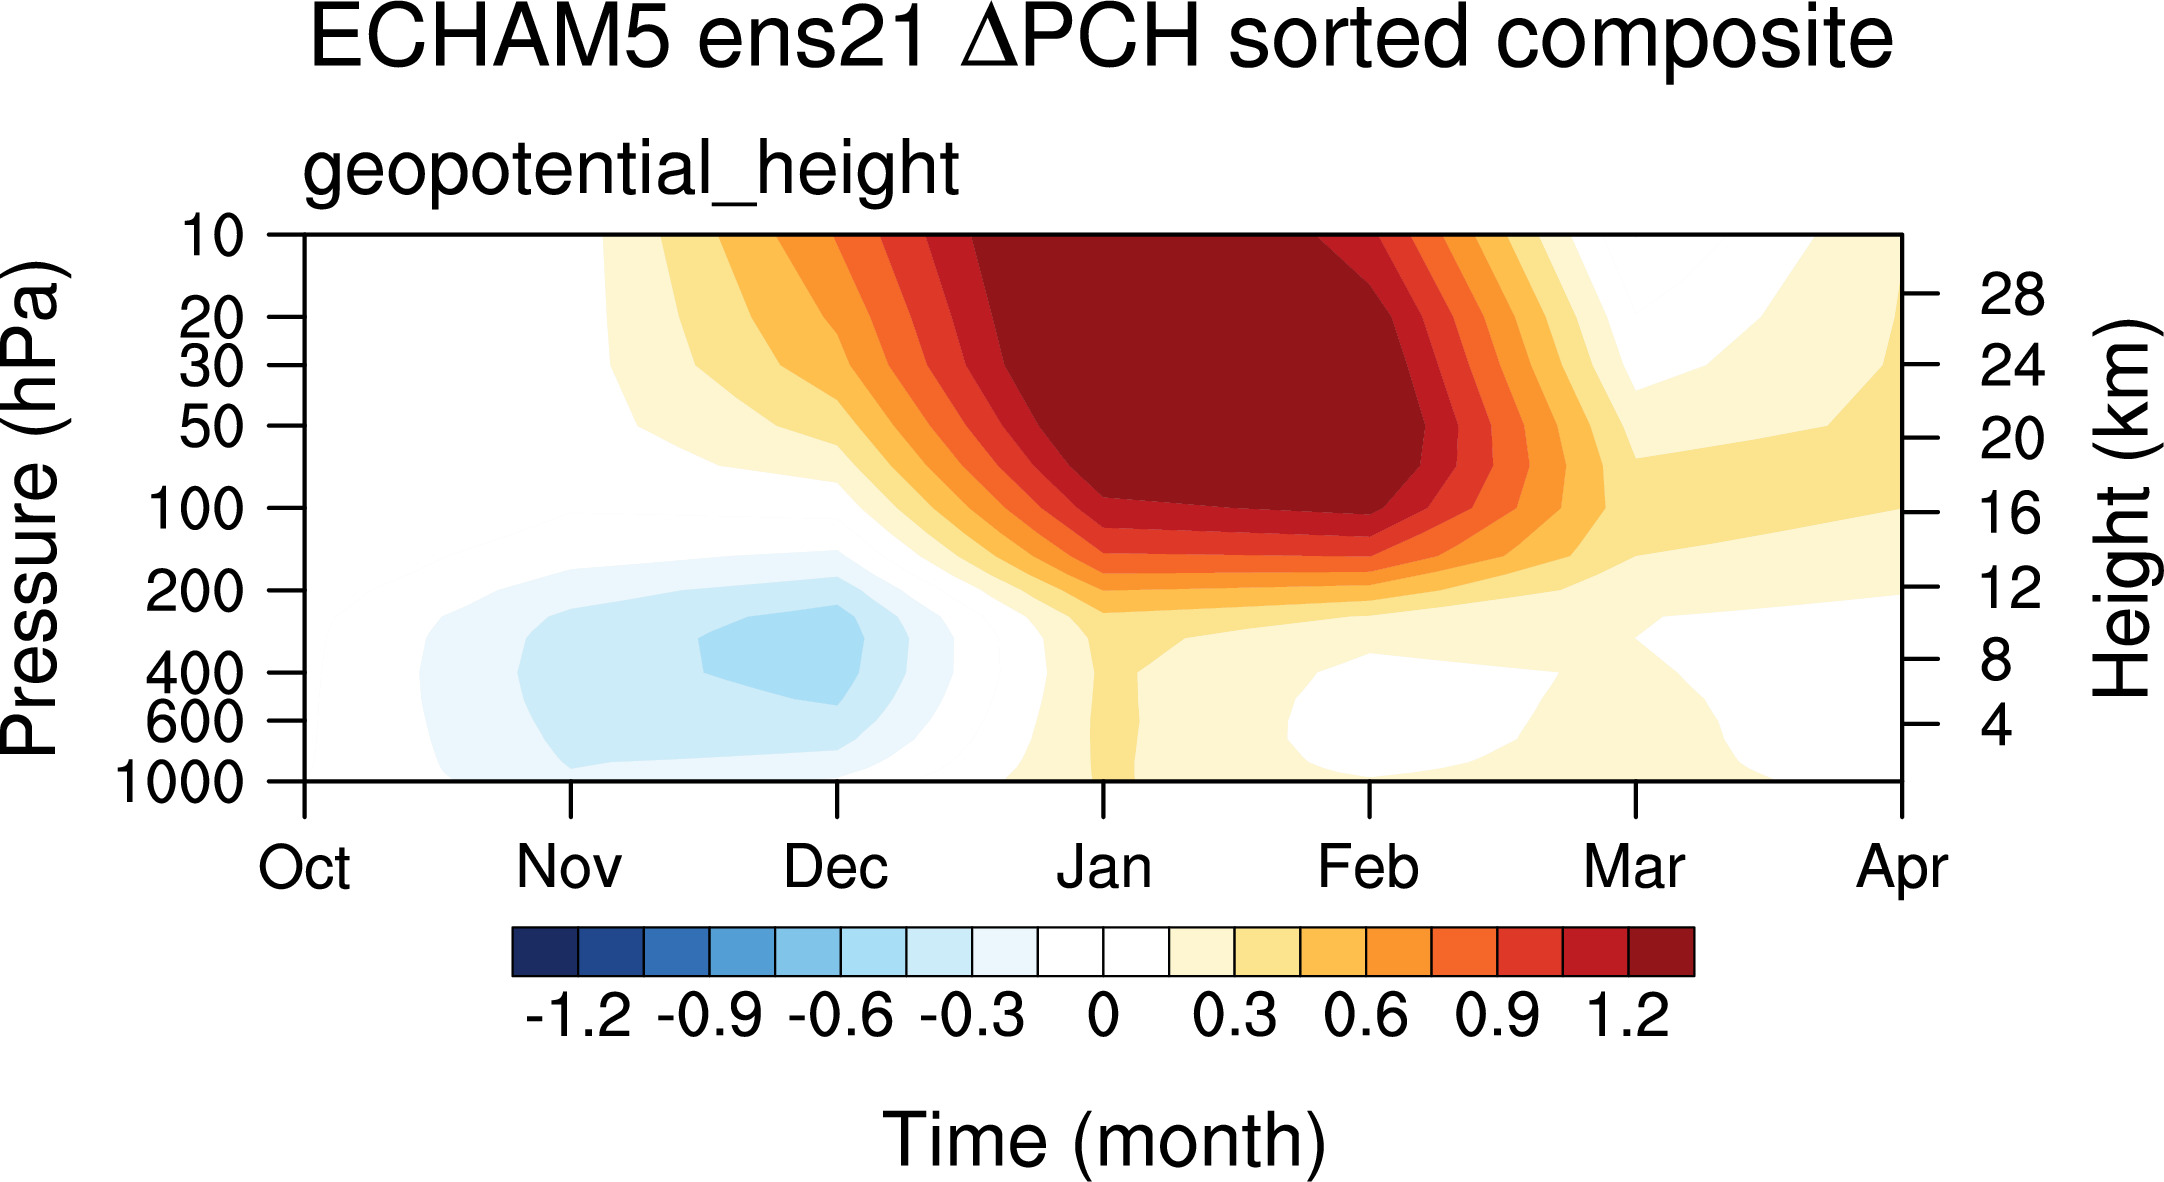
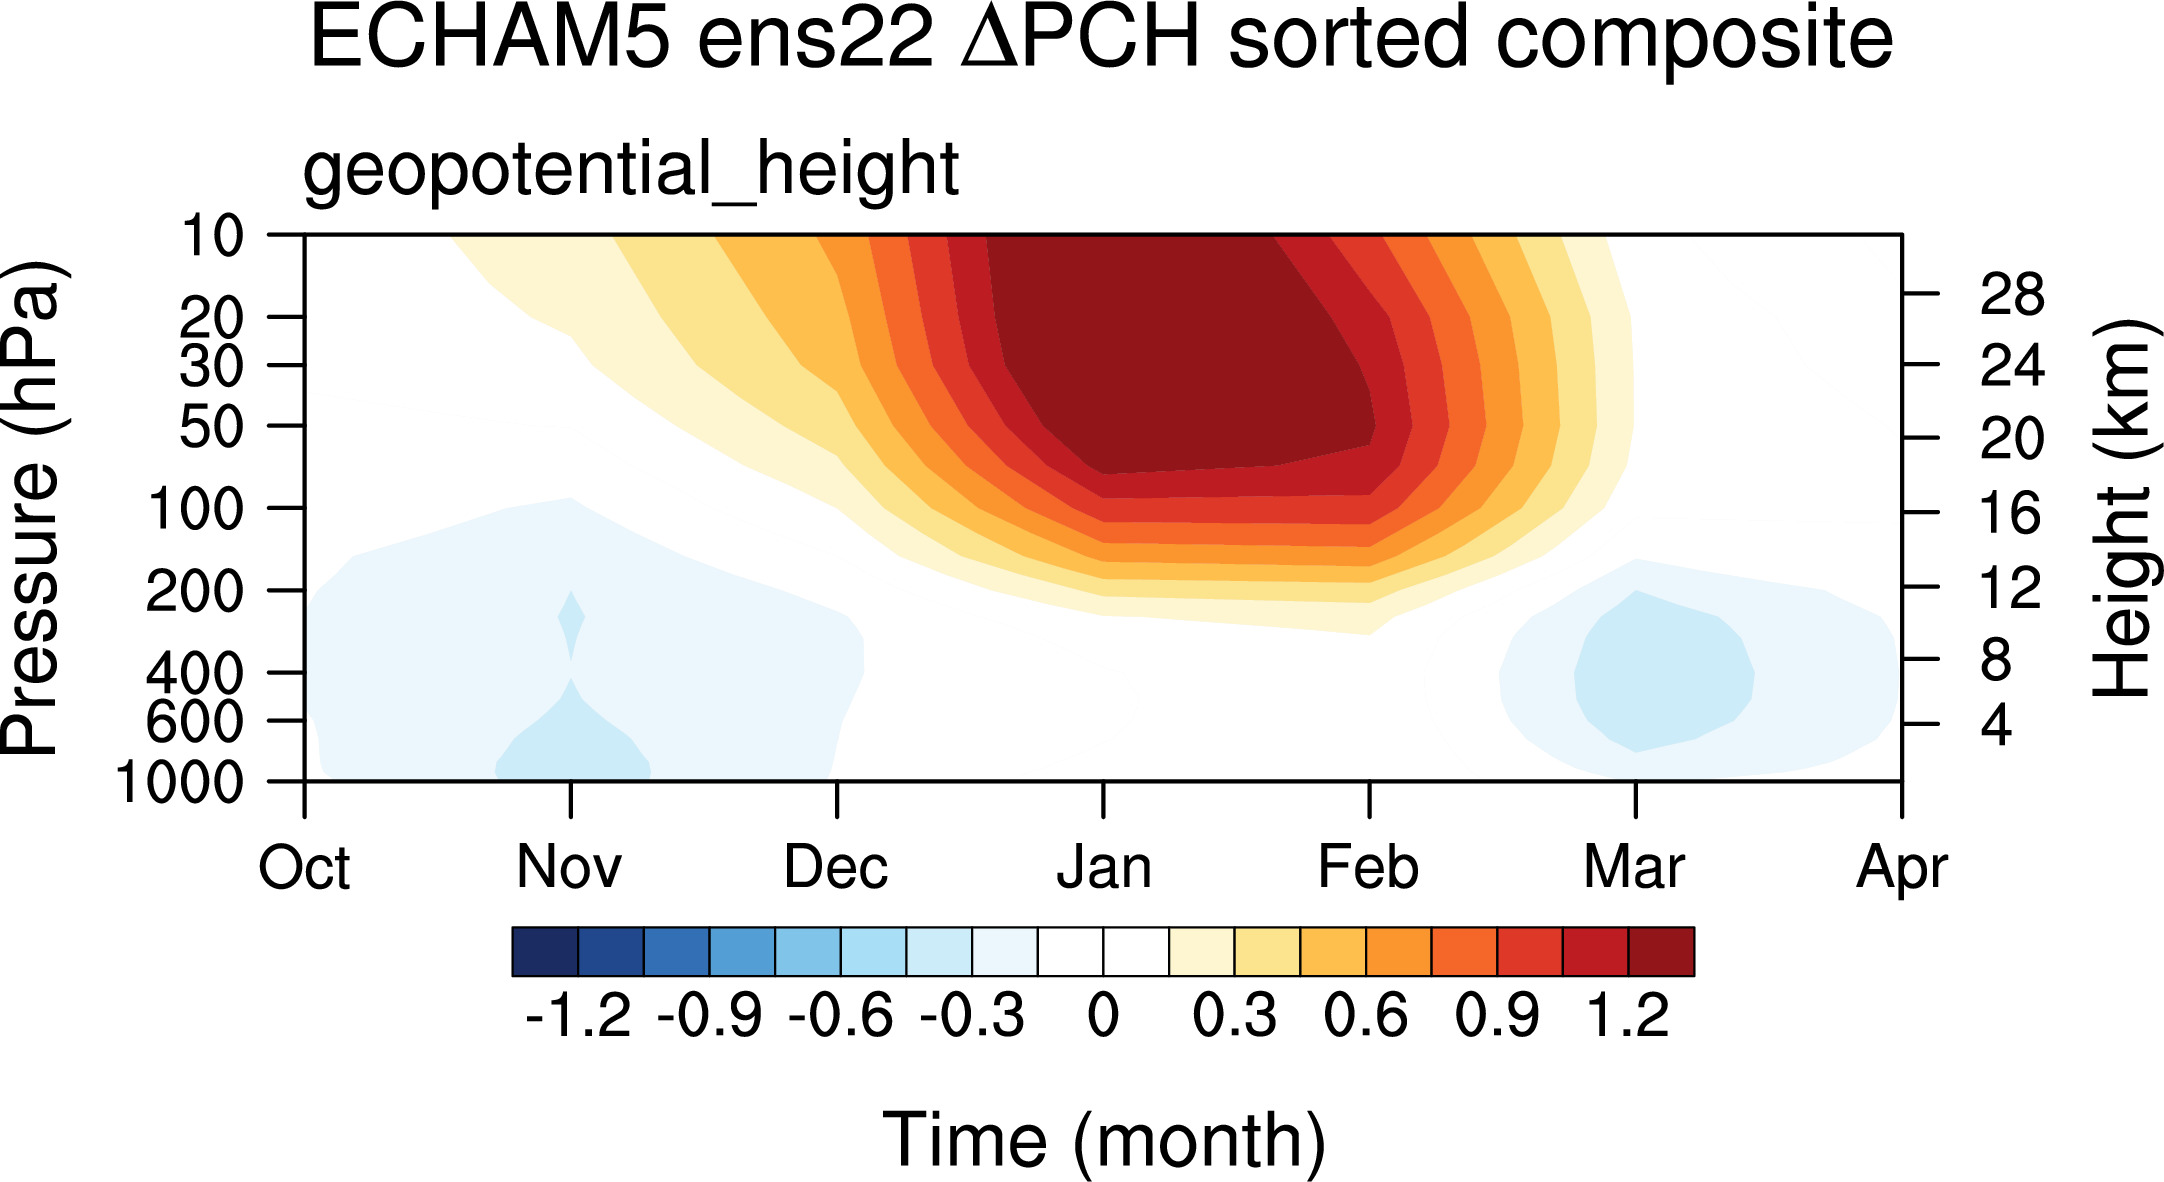
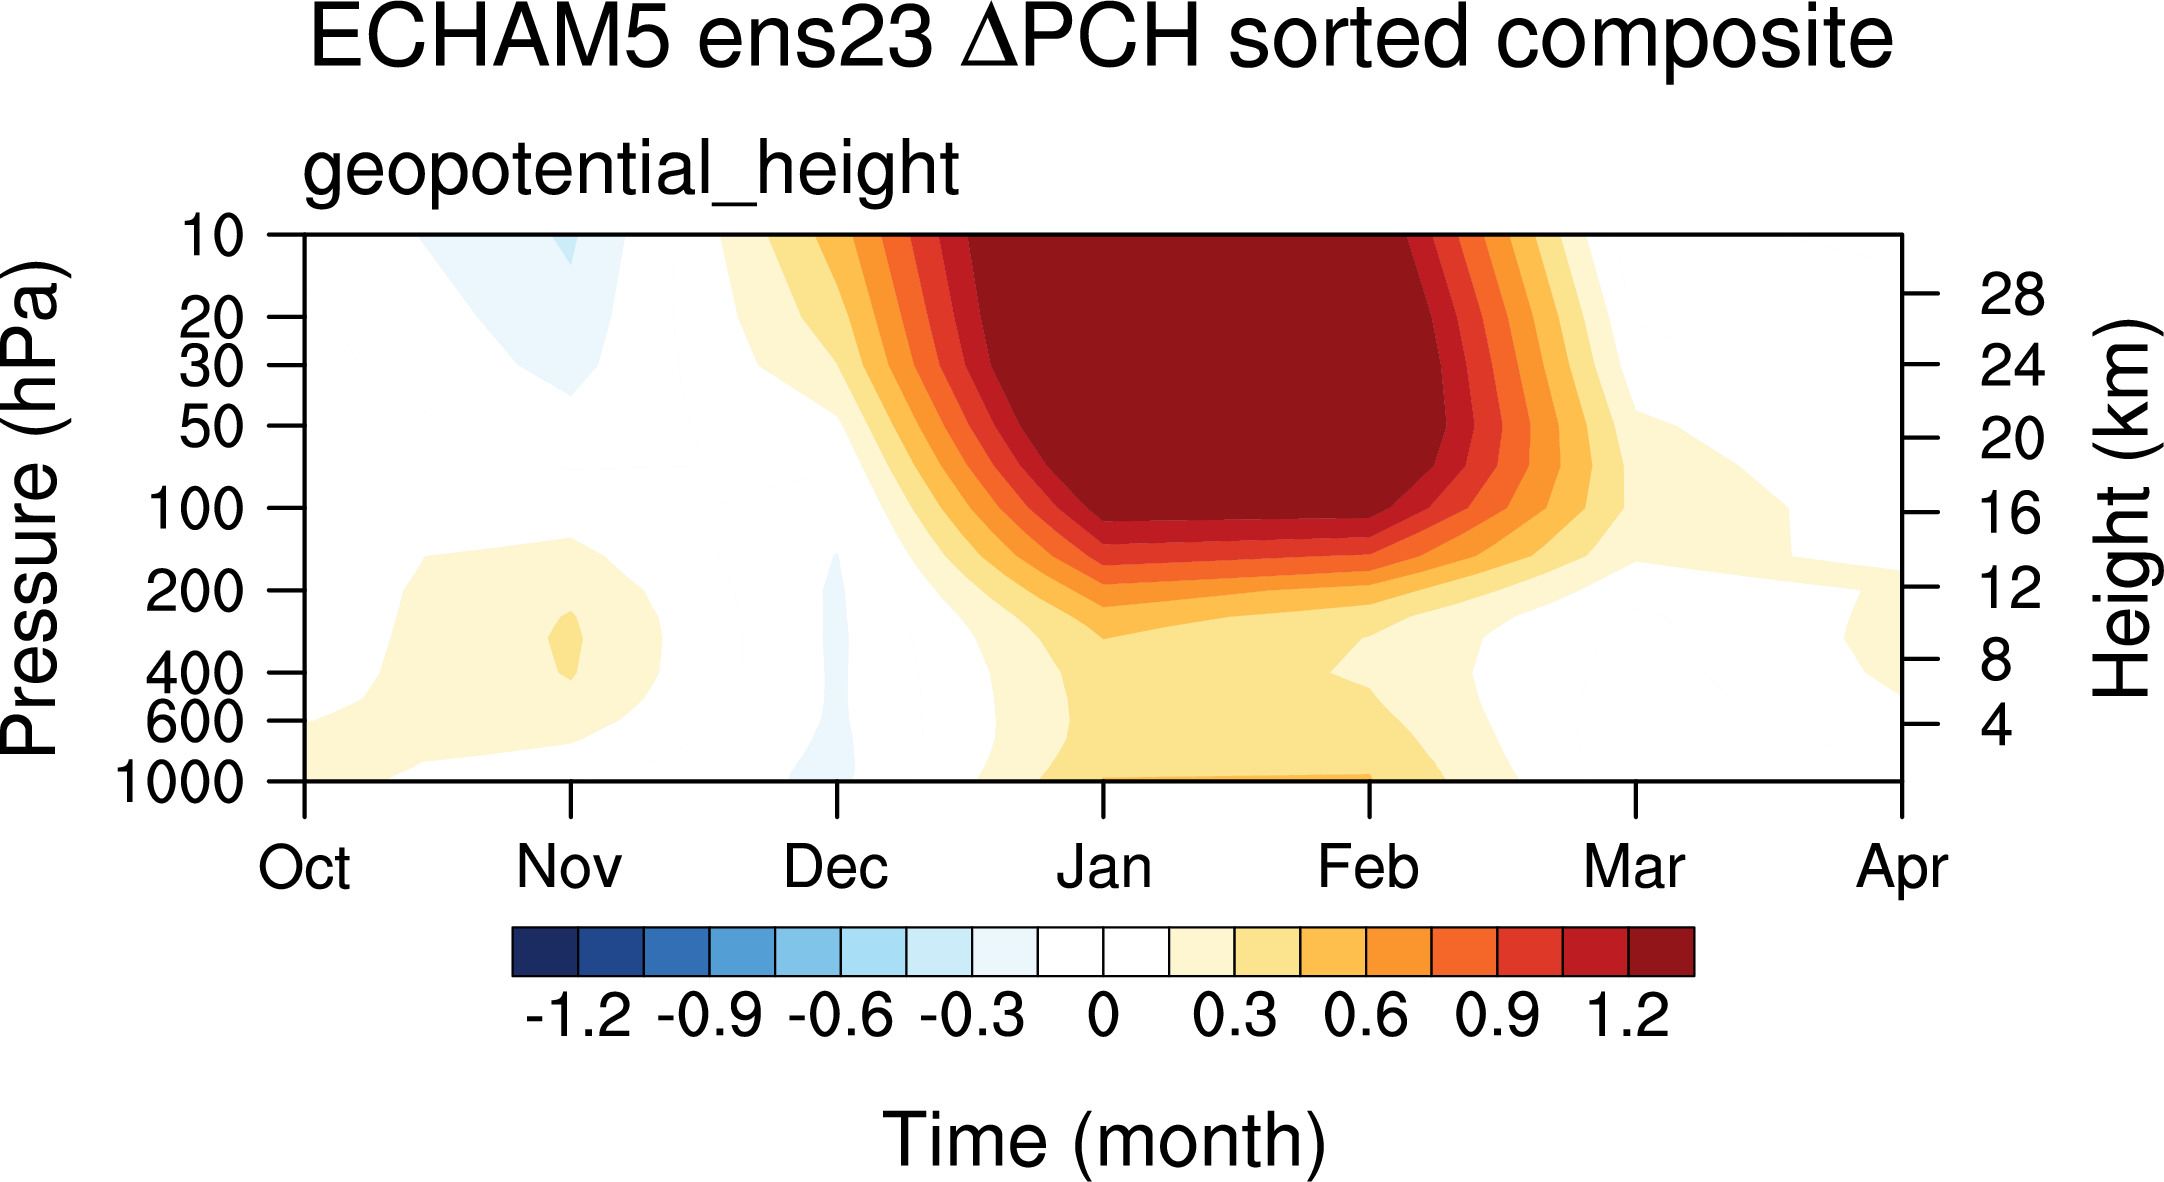
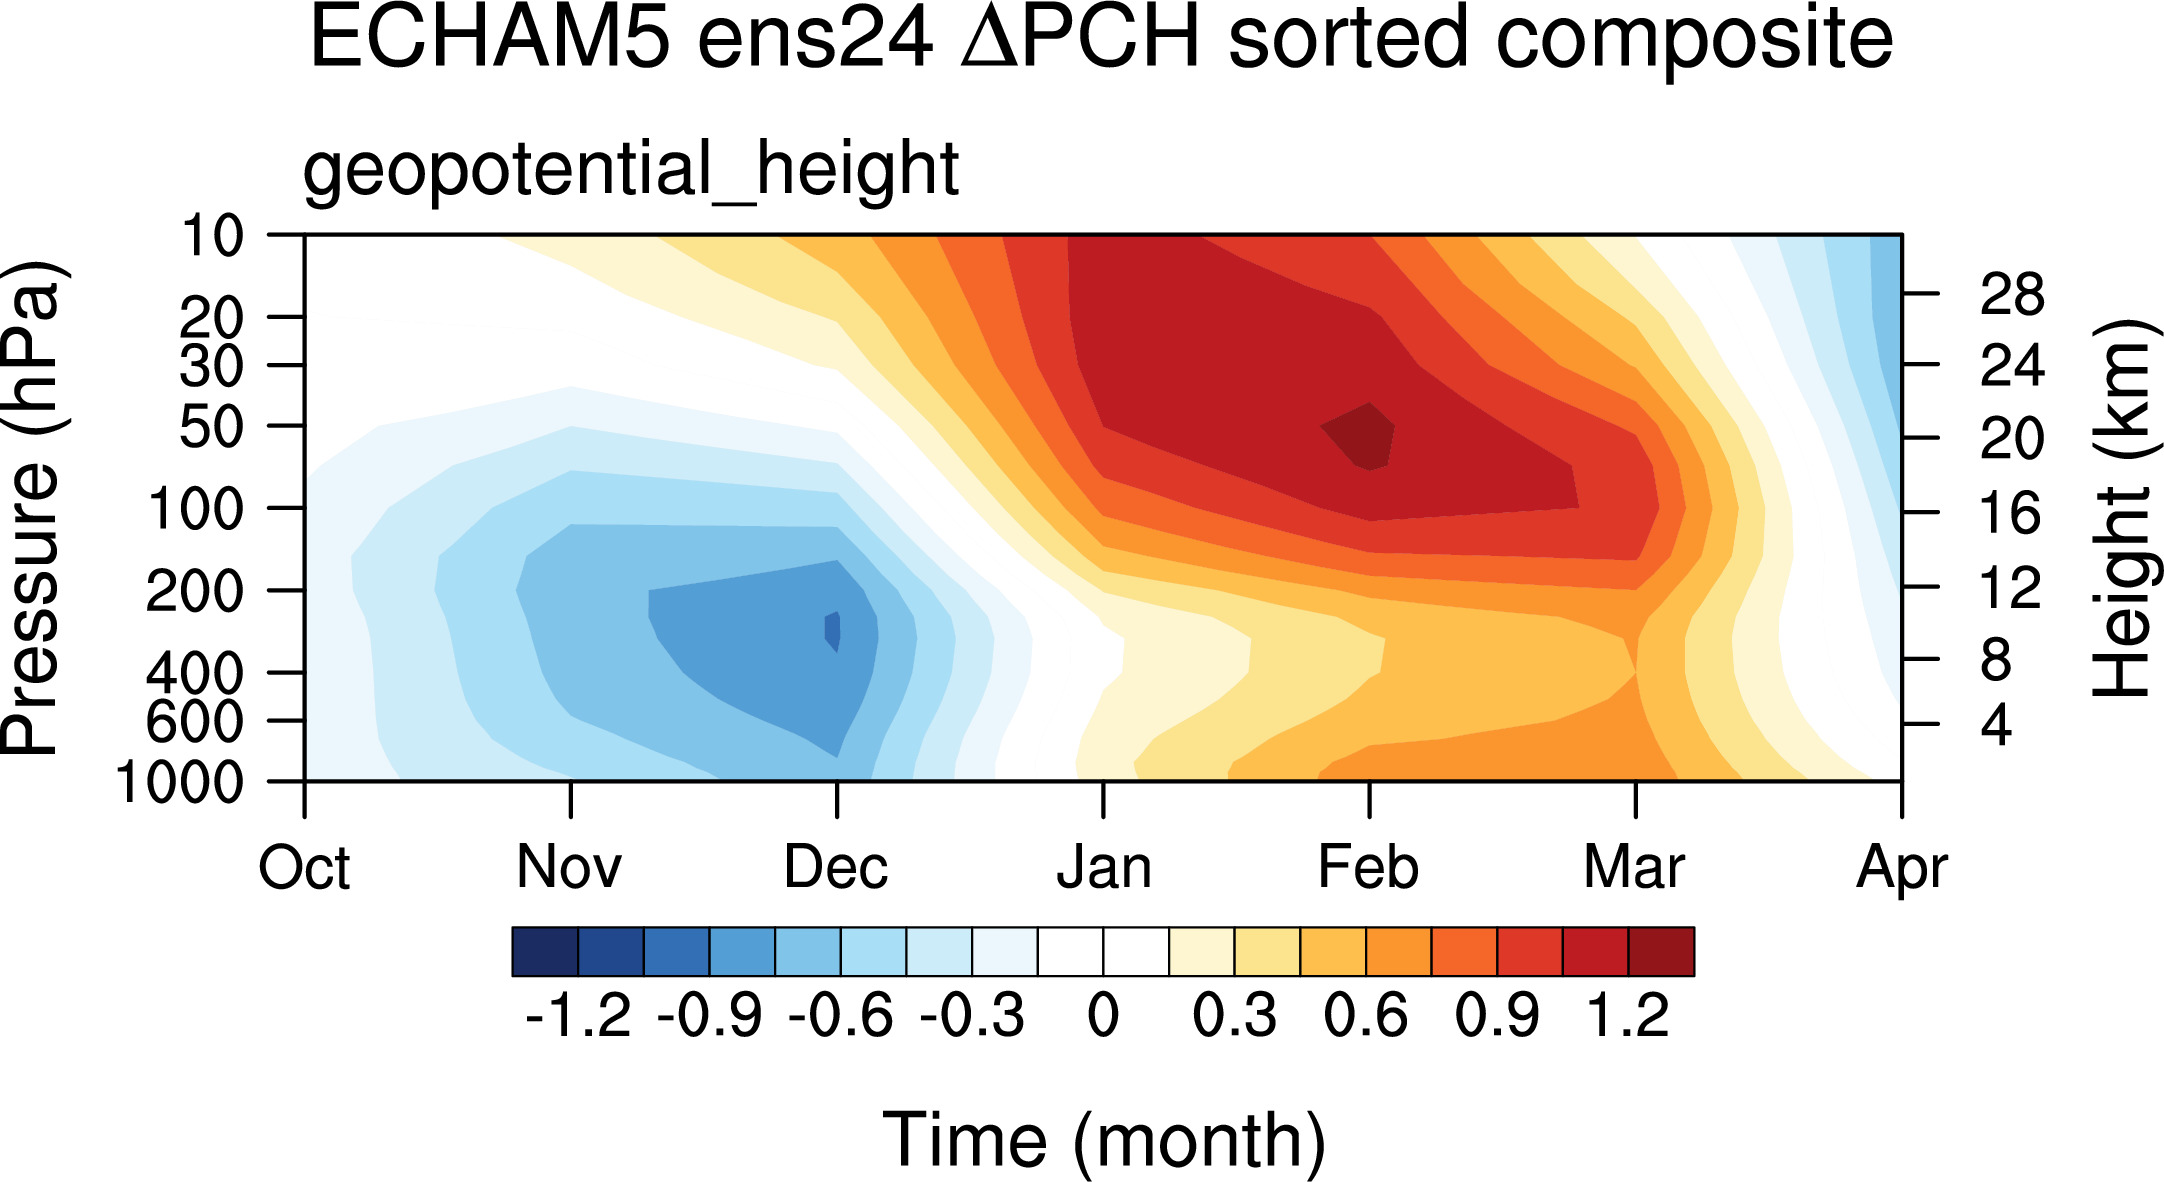
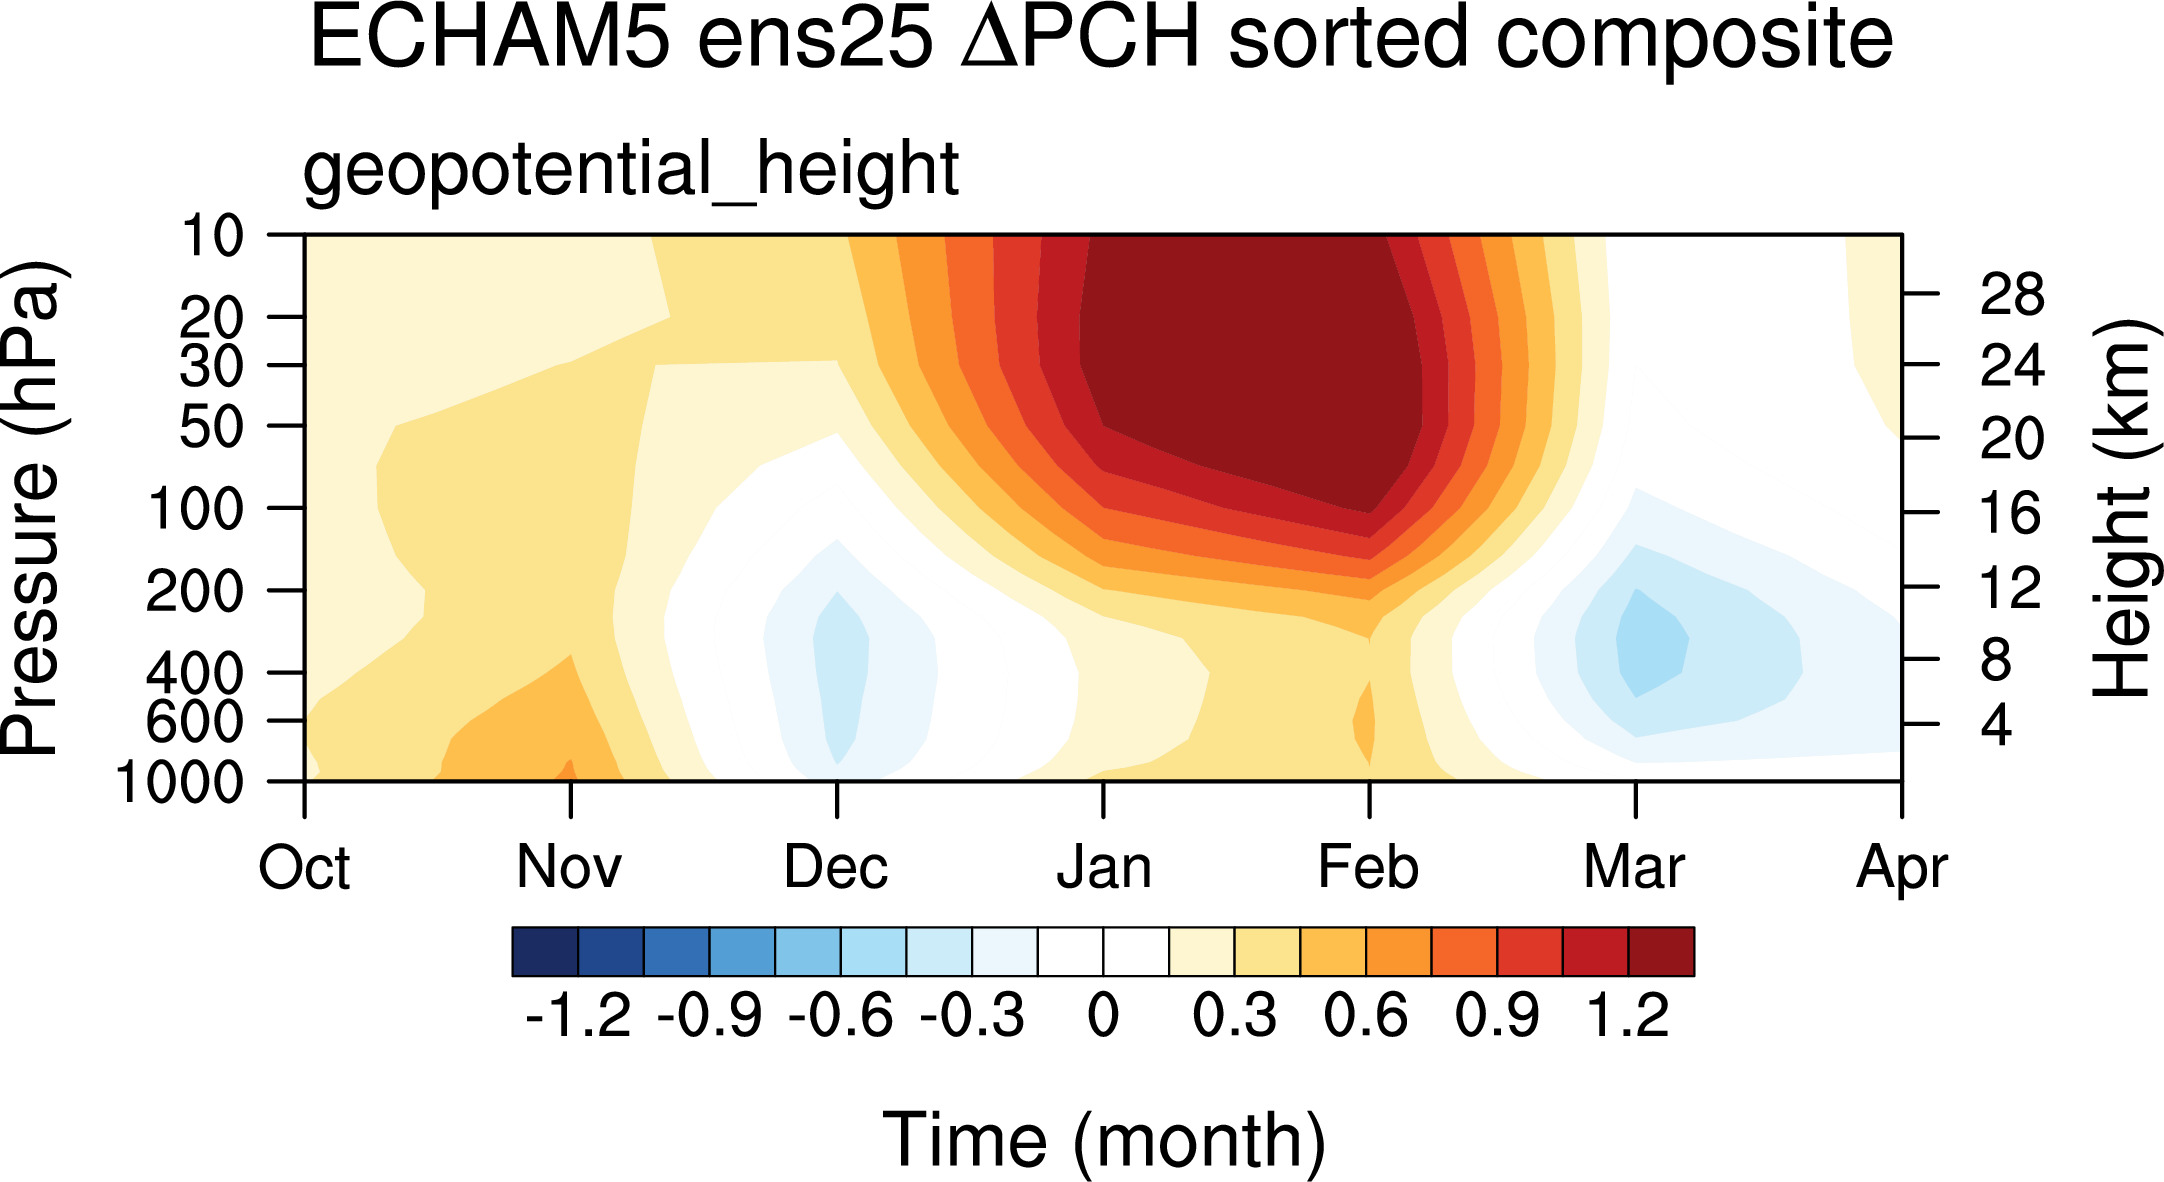
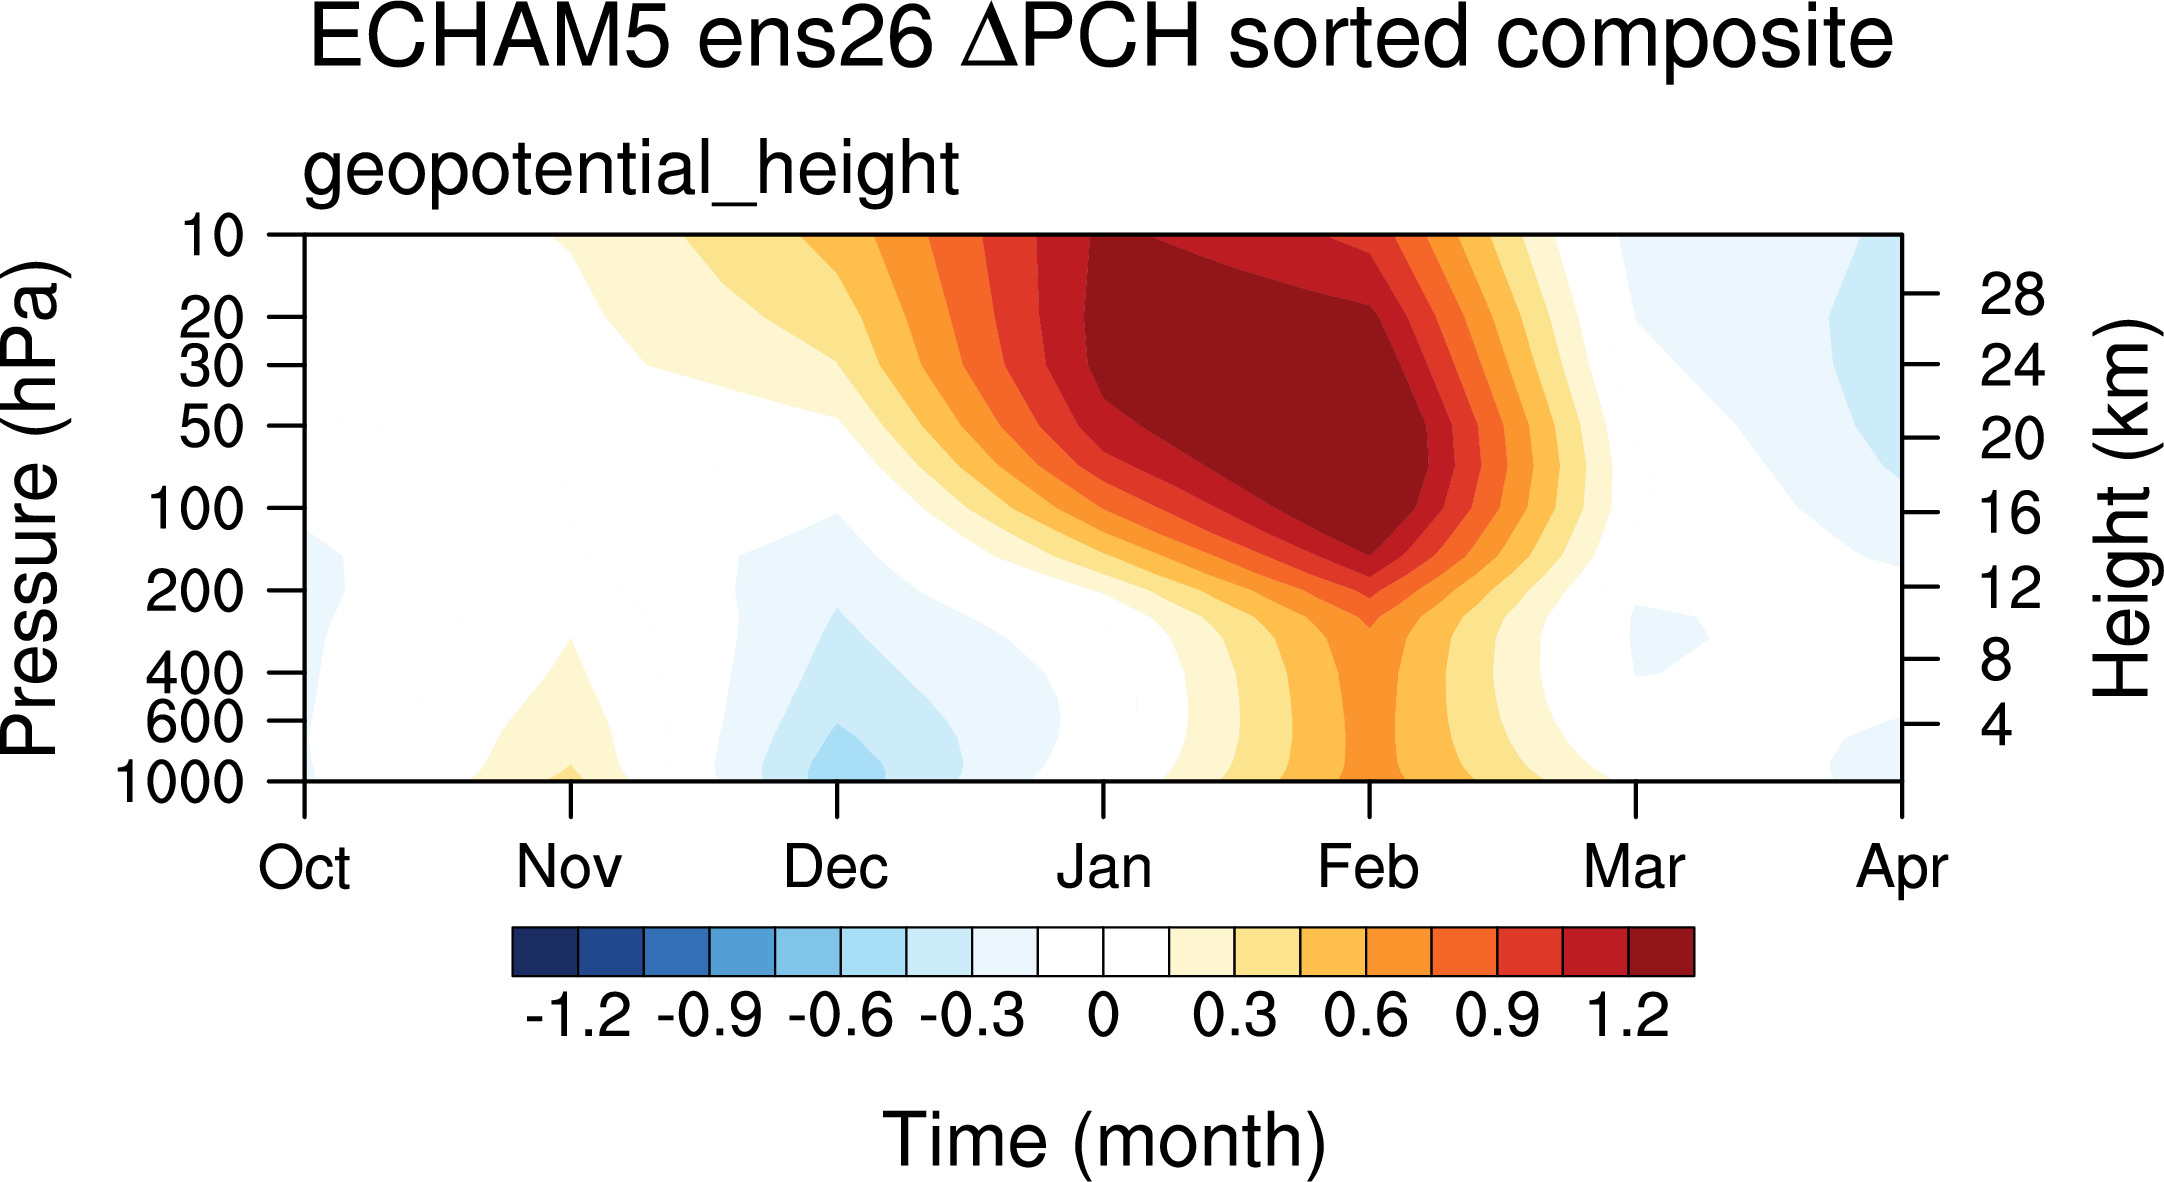
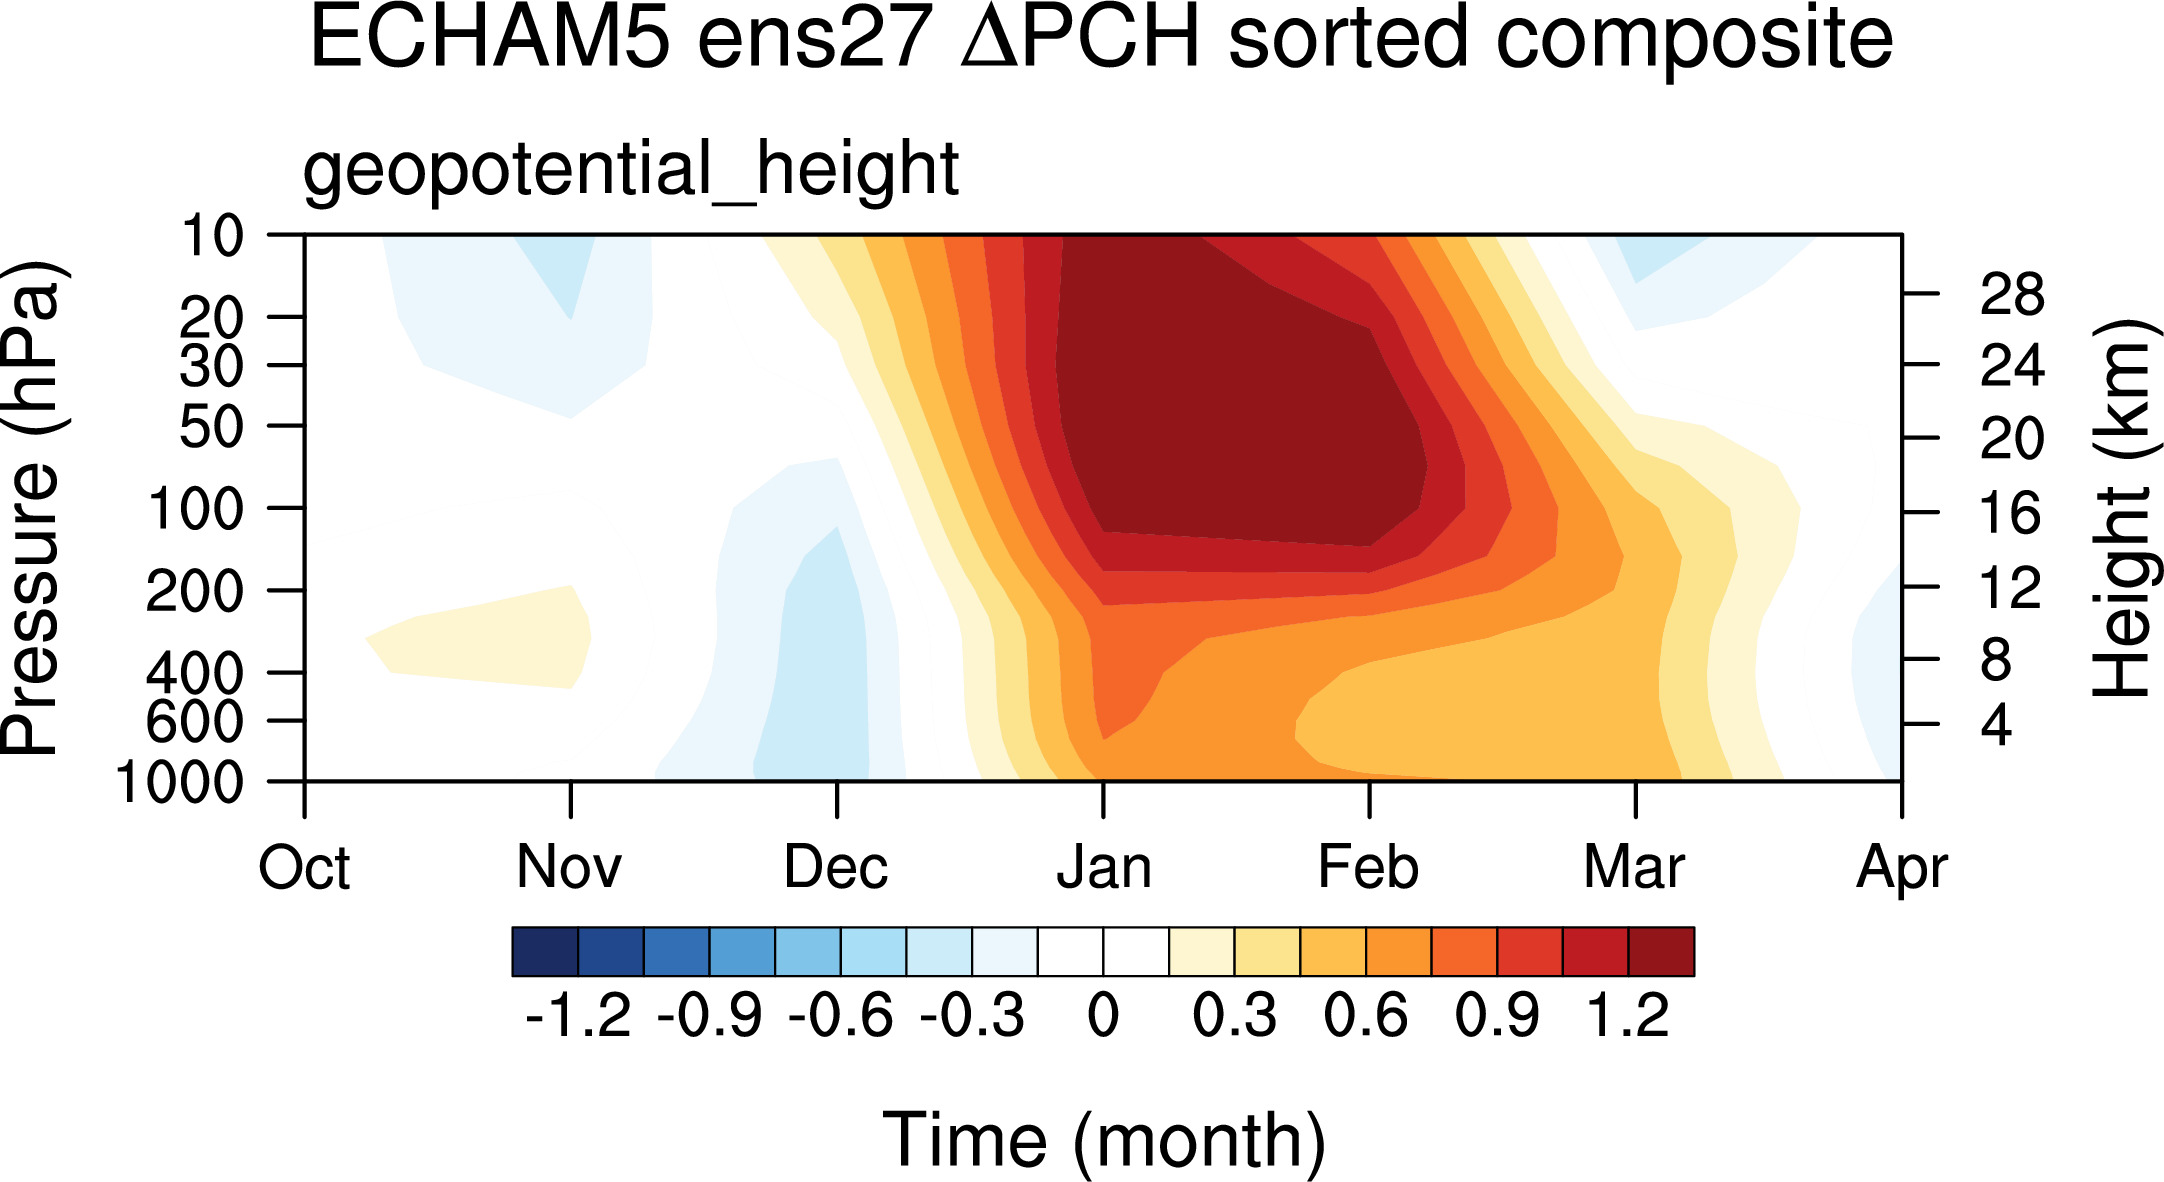
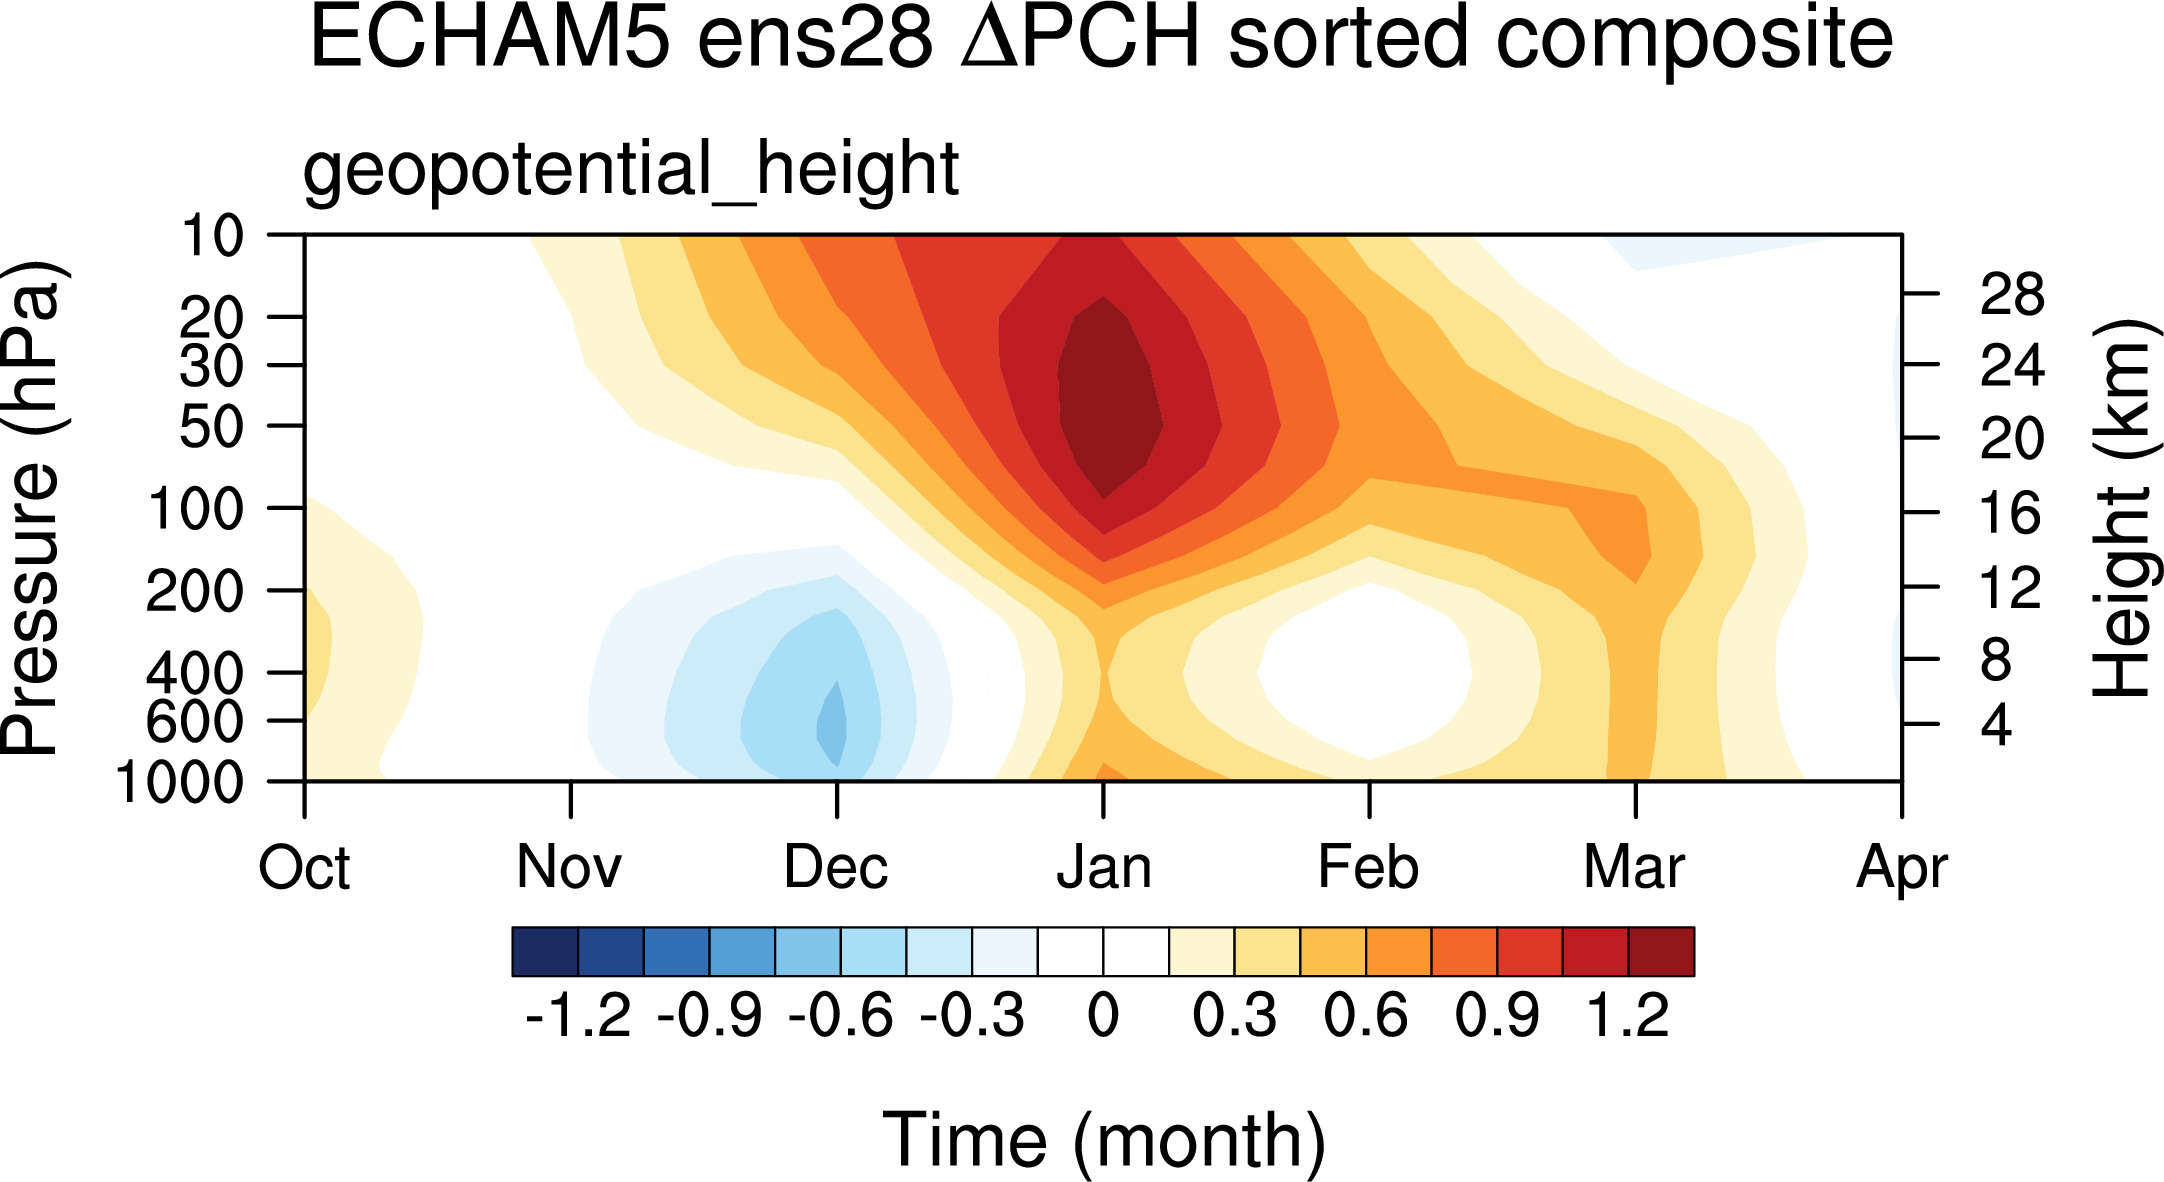
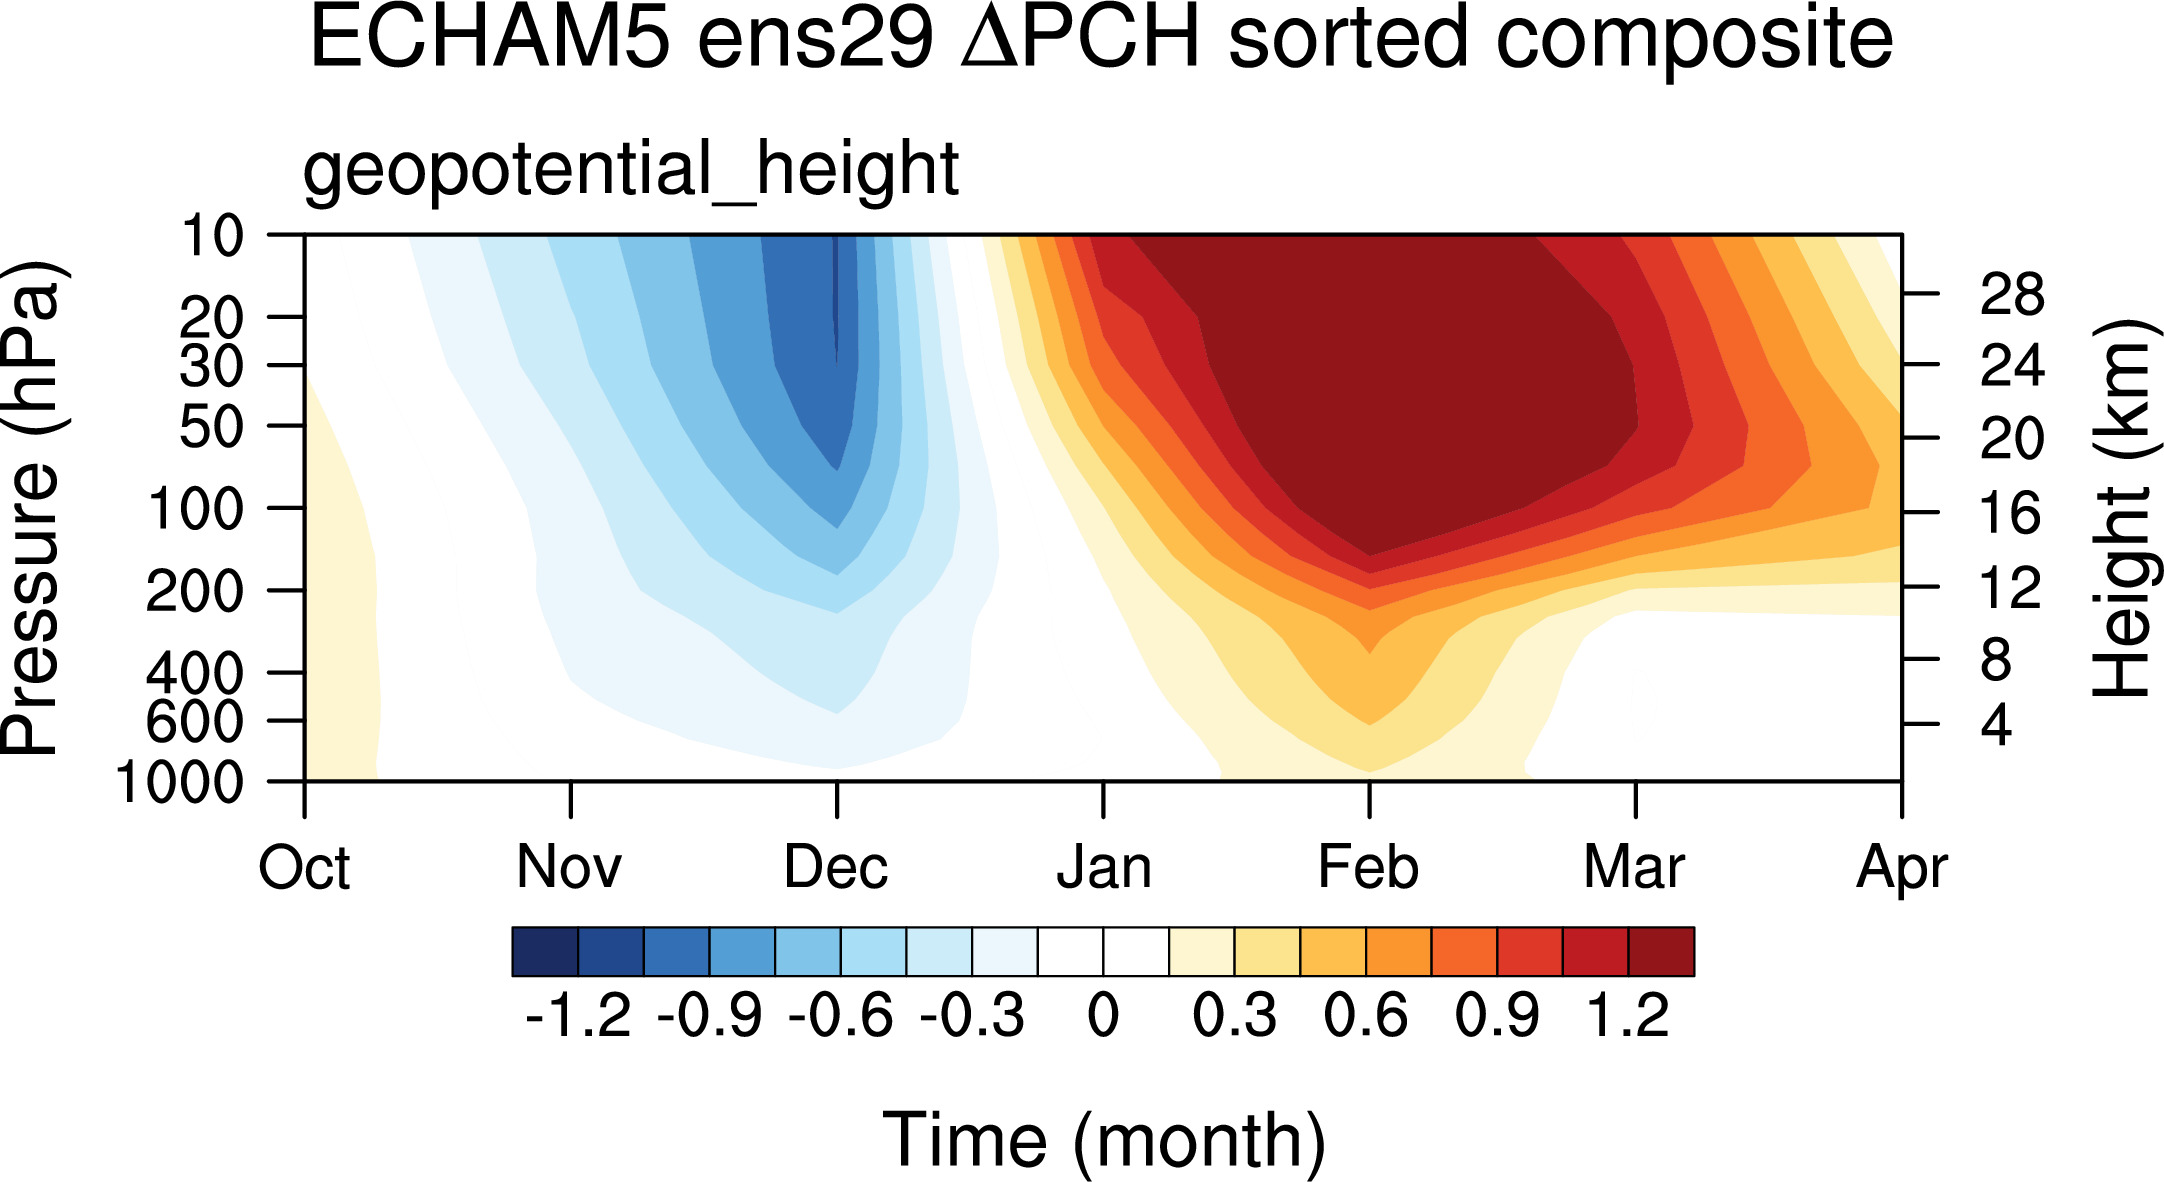
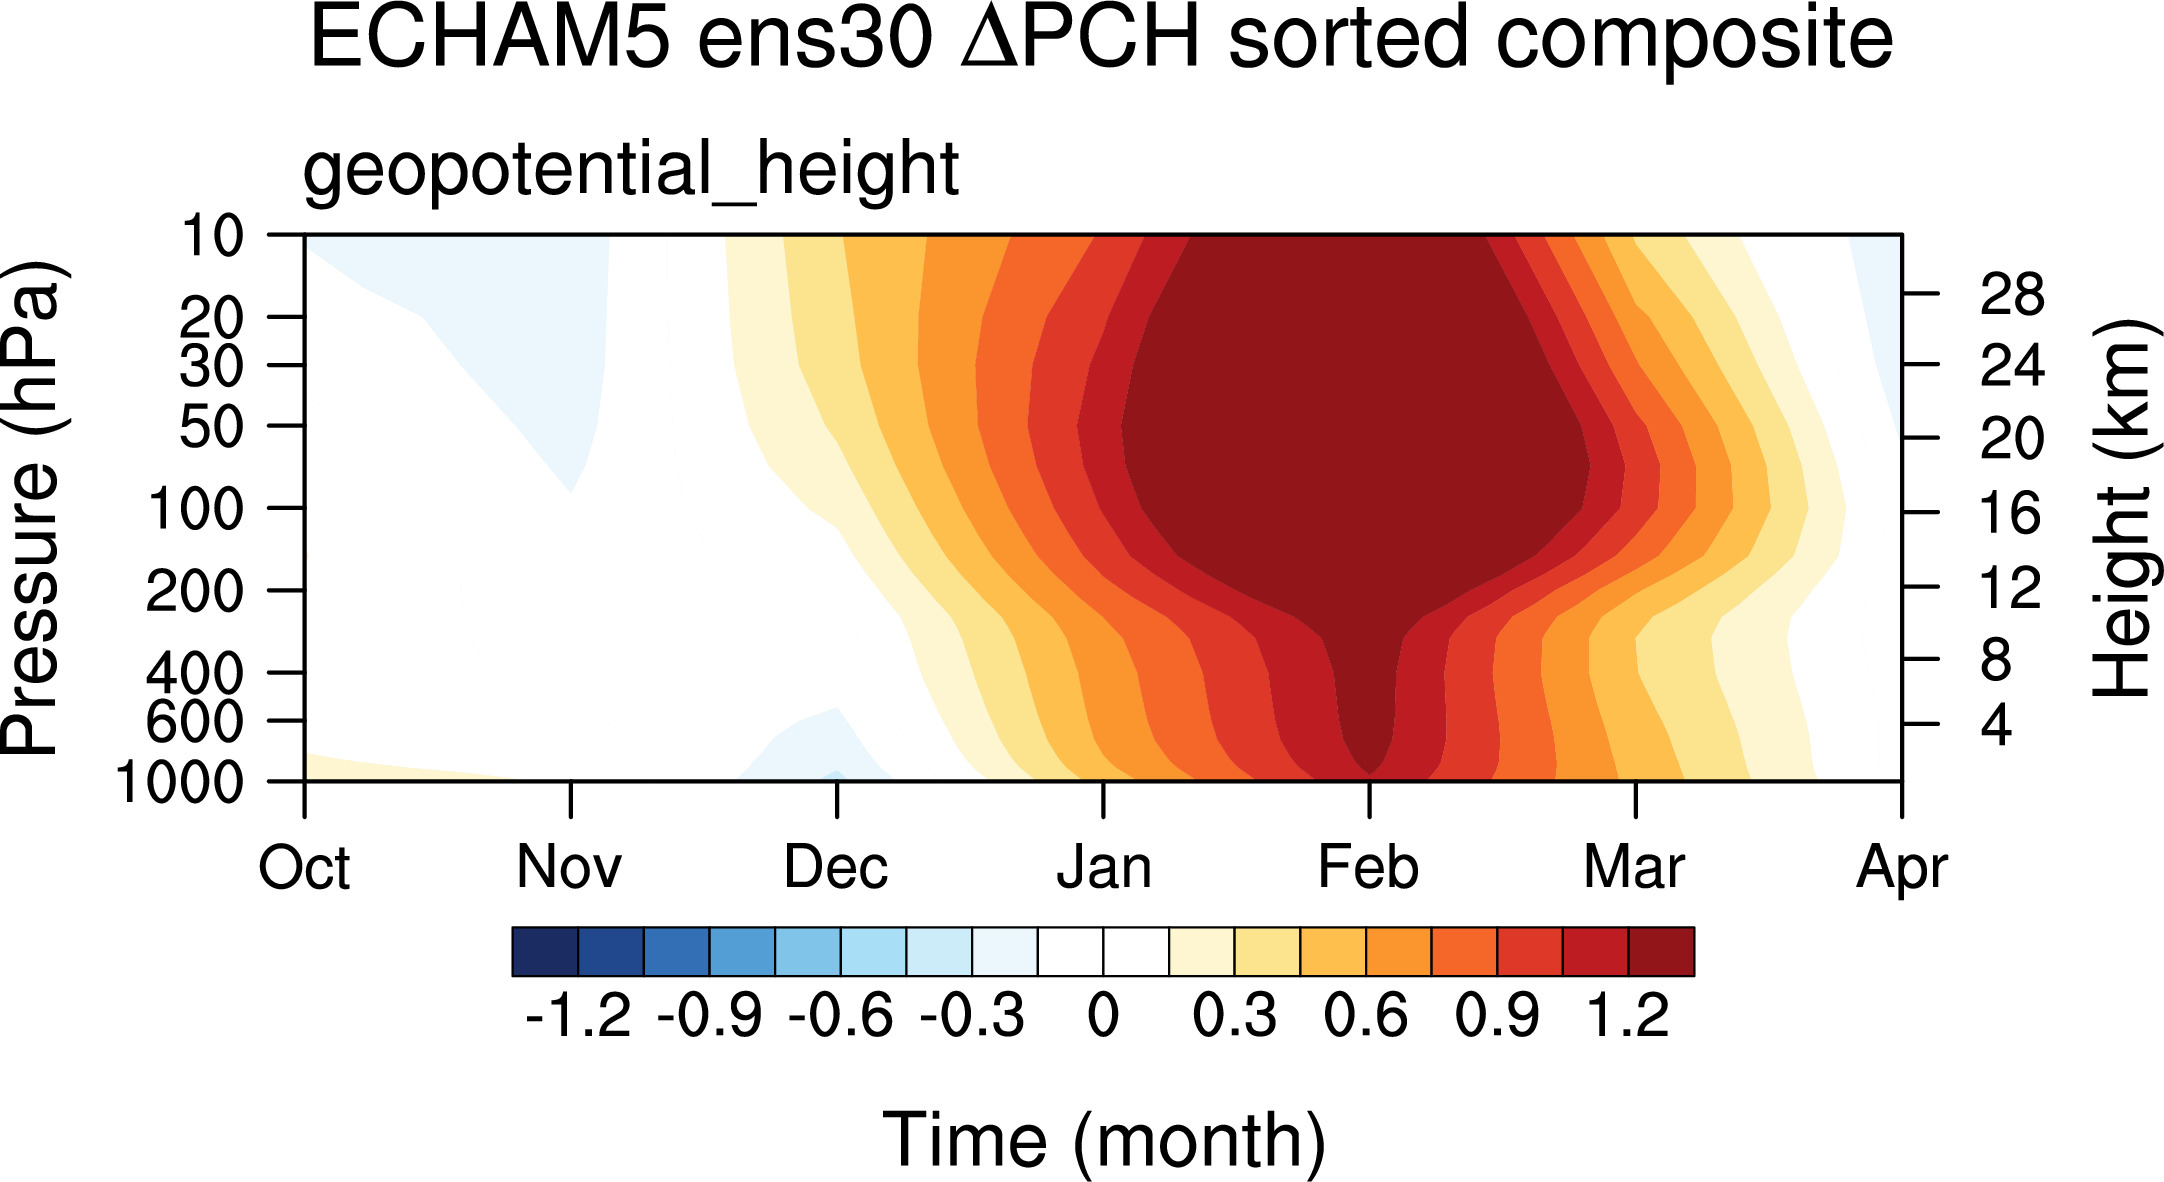
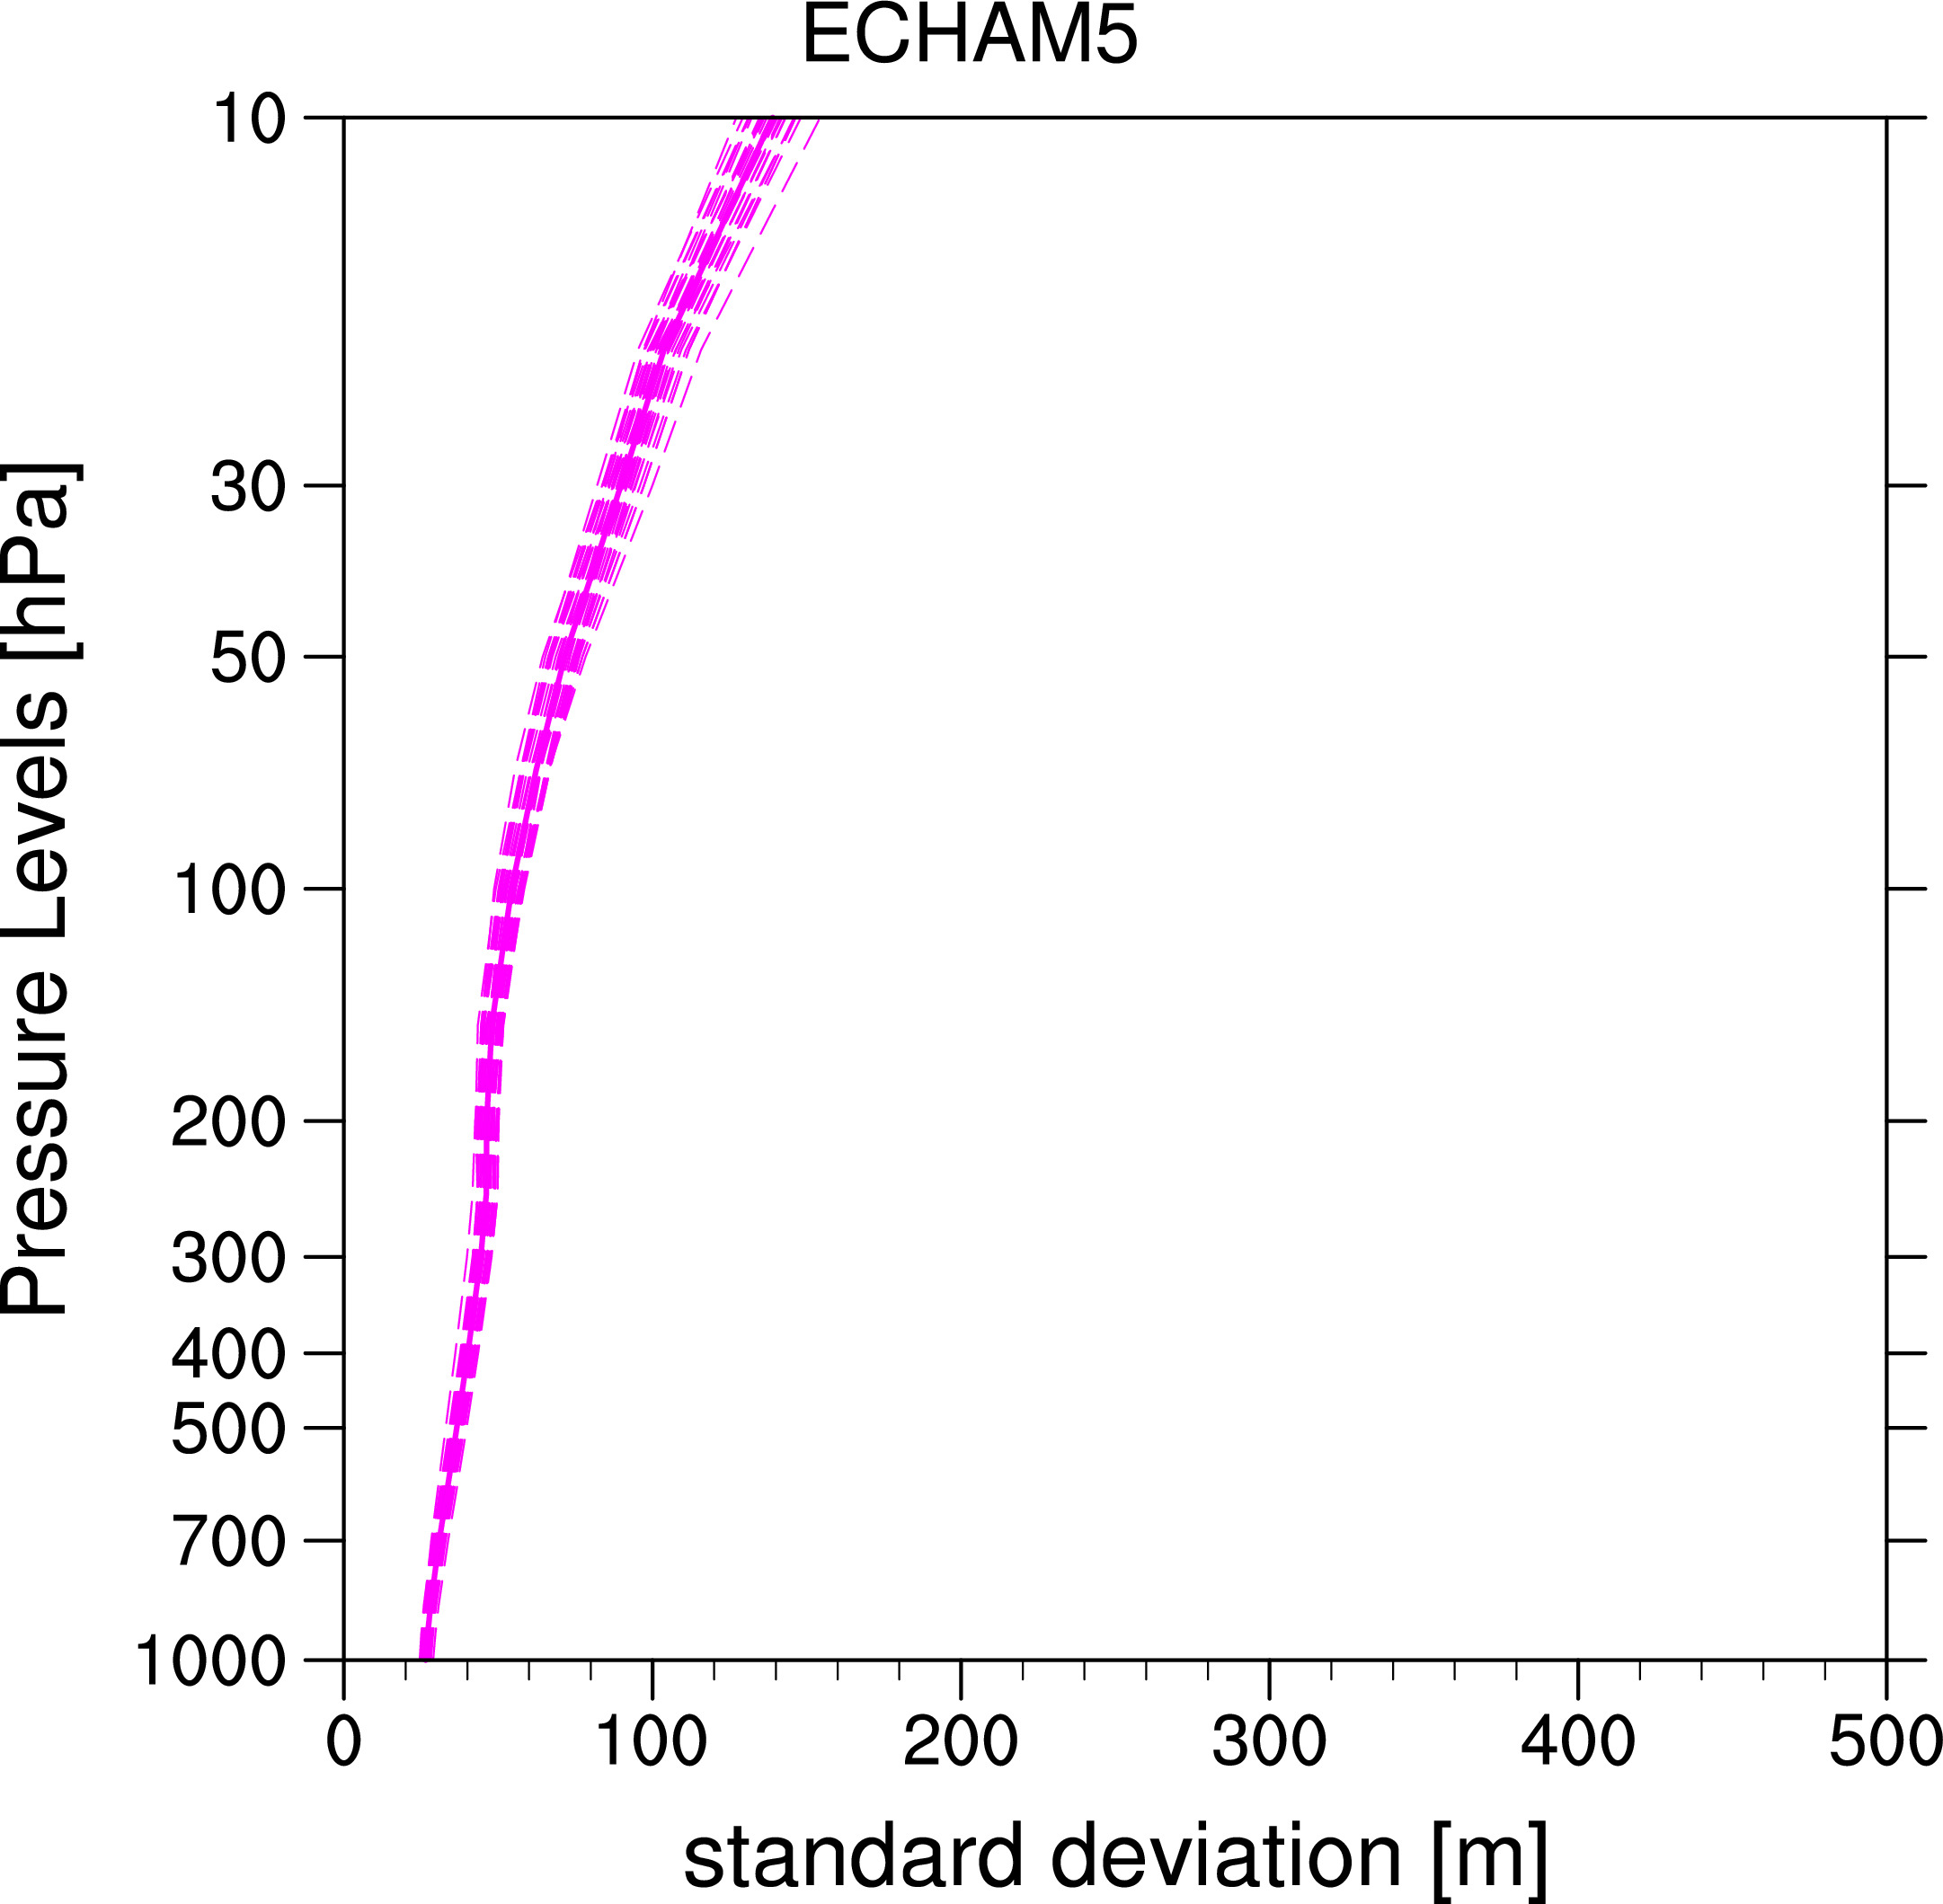 ECHAM5
Ensemble mean:
Individual Runs:
Individual Years here
-----
Special case Sorted on largest values of Jan Feb mean at 50hPa
Ensemble mean:
Individual Runs:
-------------------------------------------------------------------------------
-----------------------------
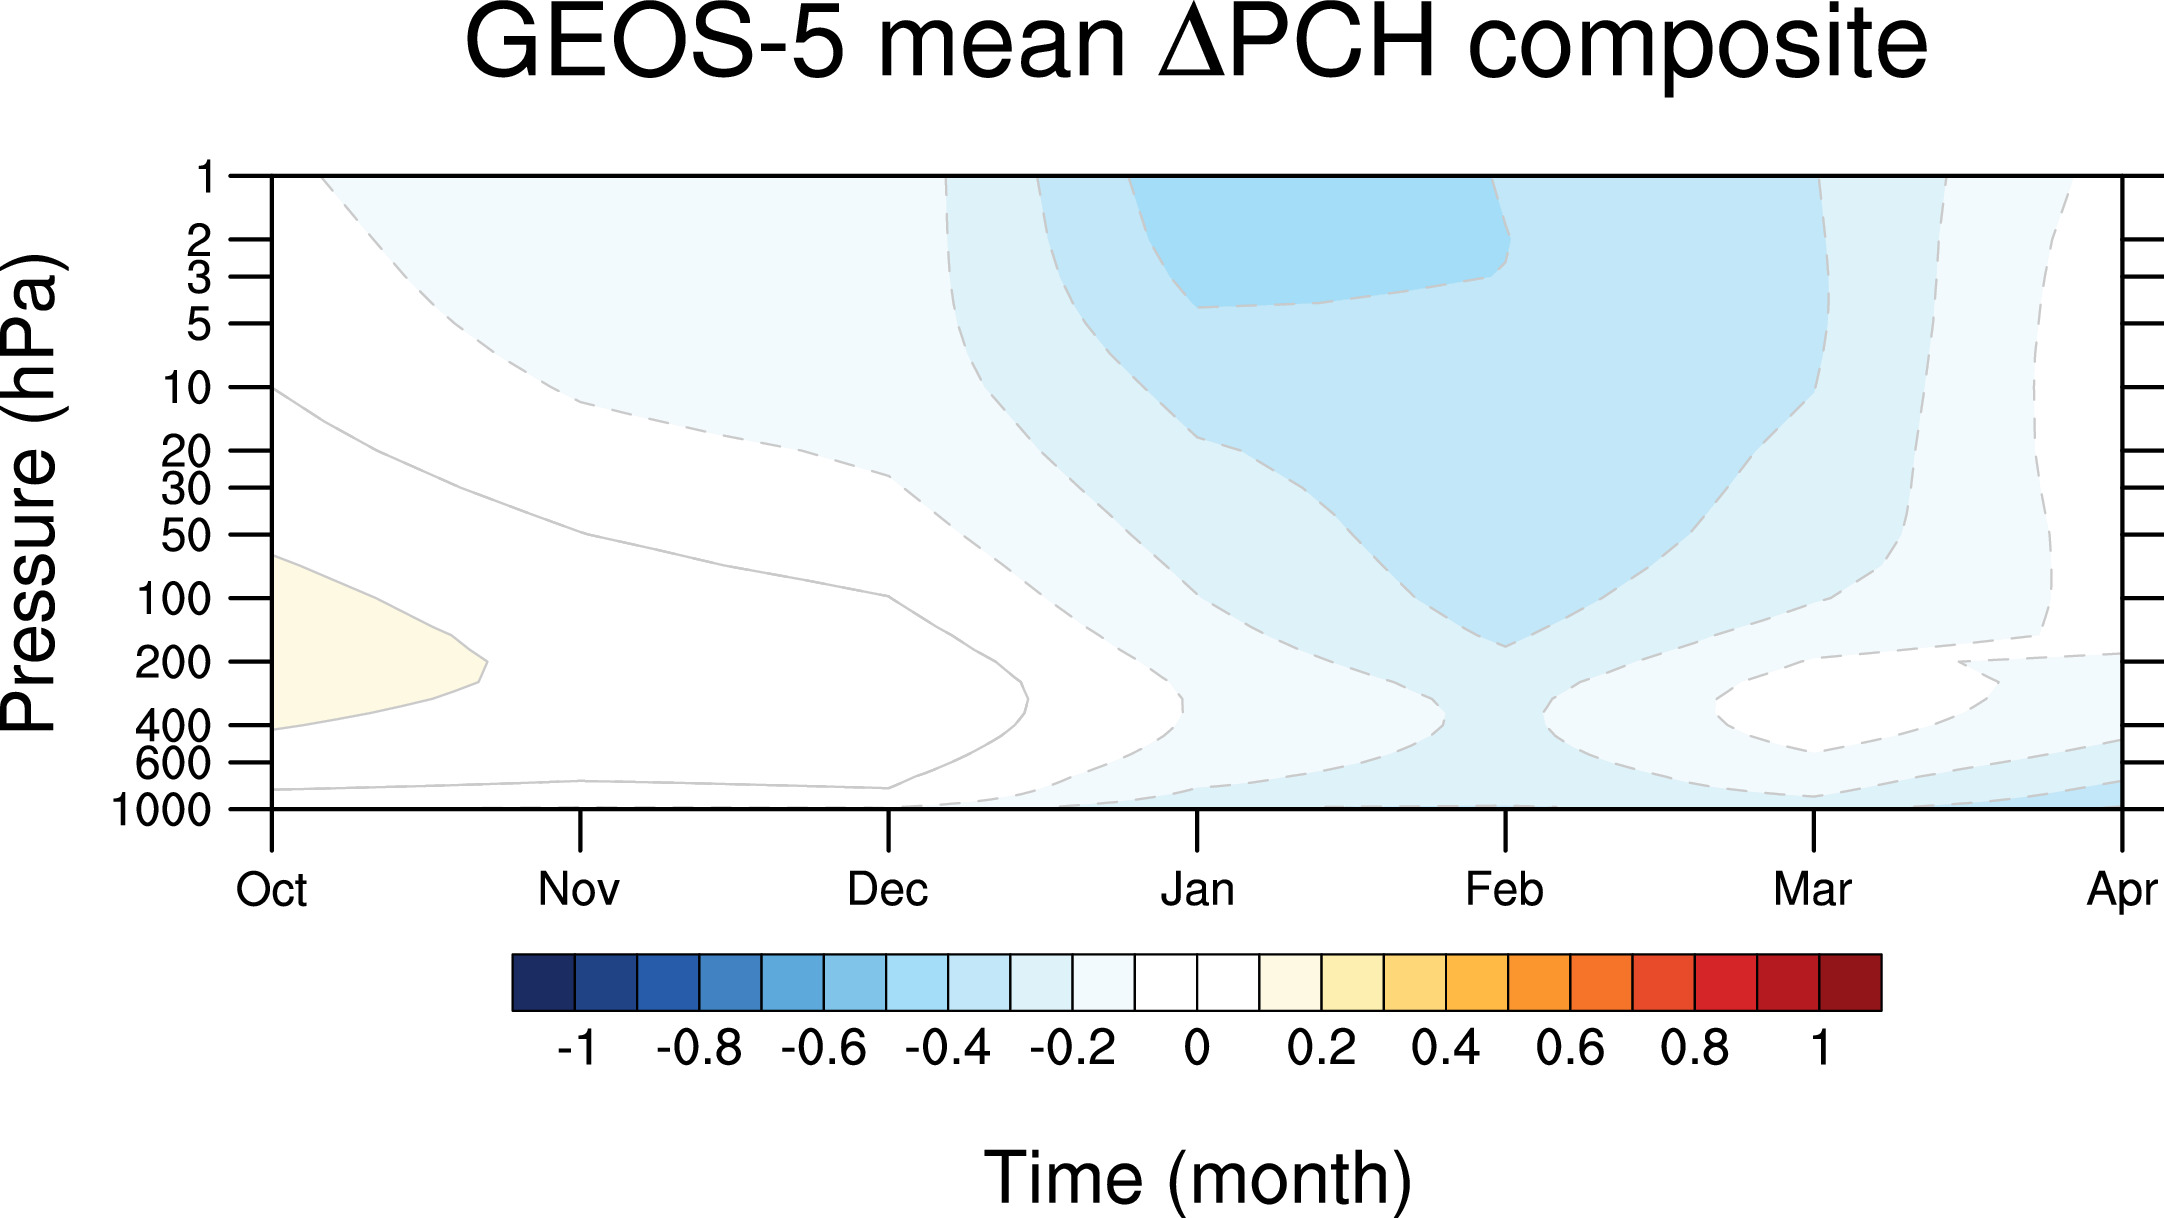
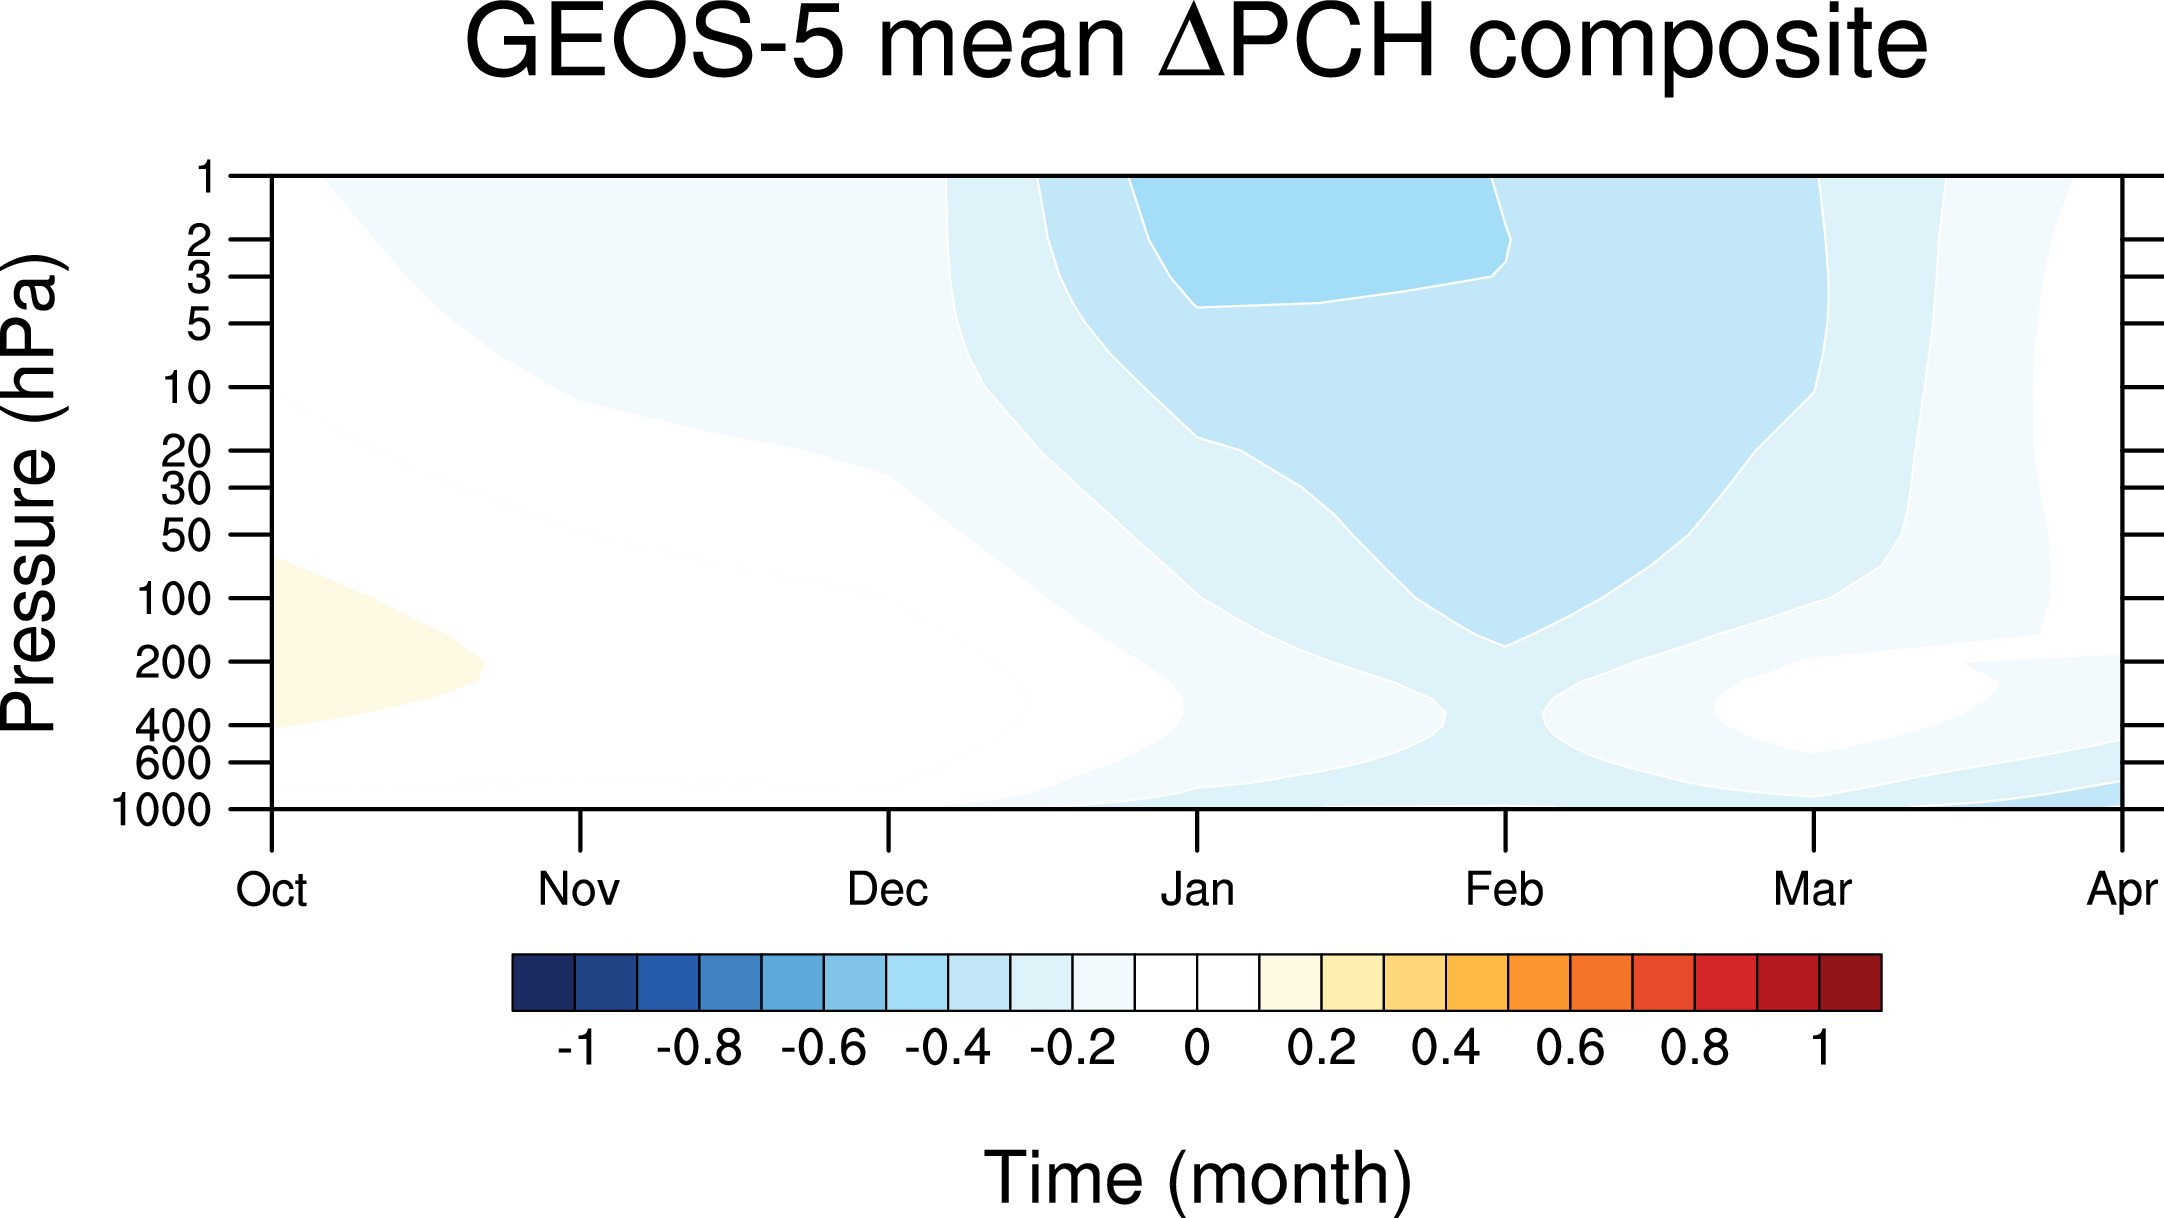
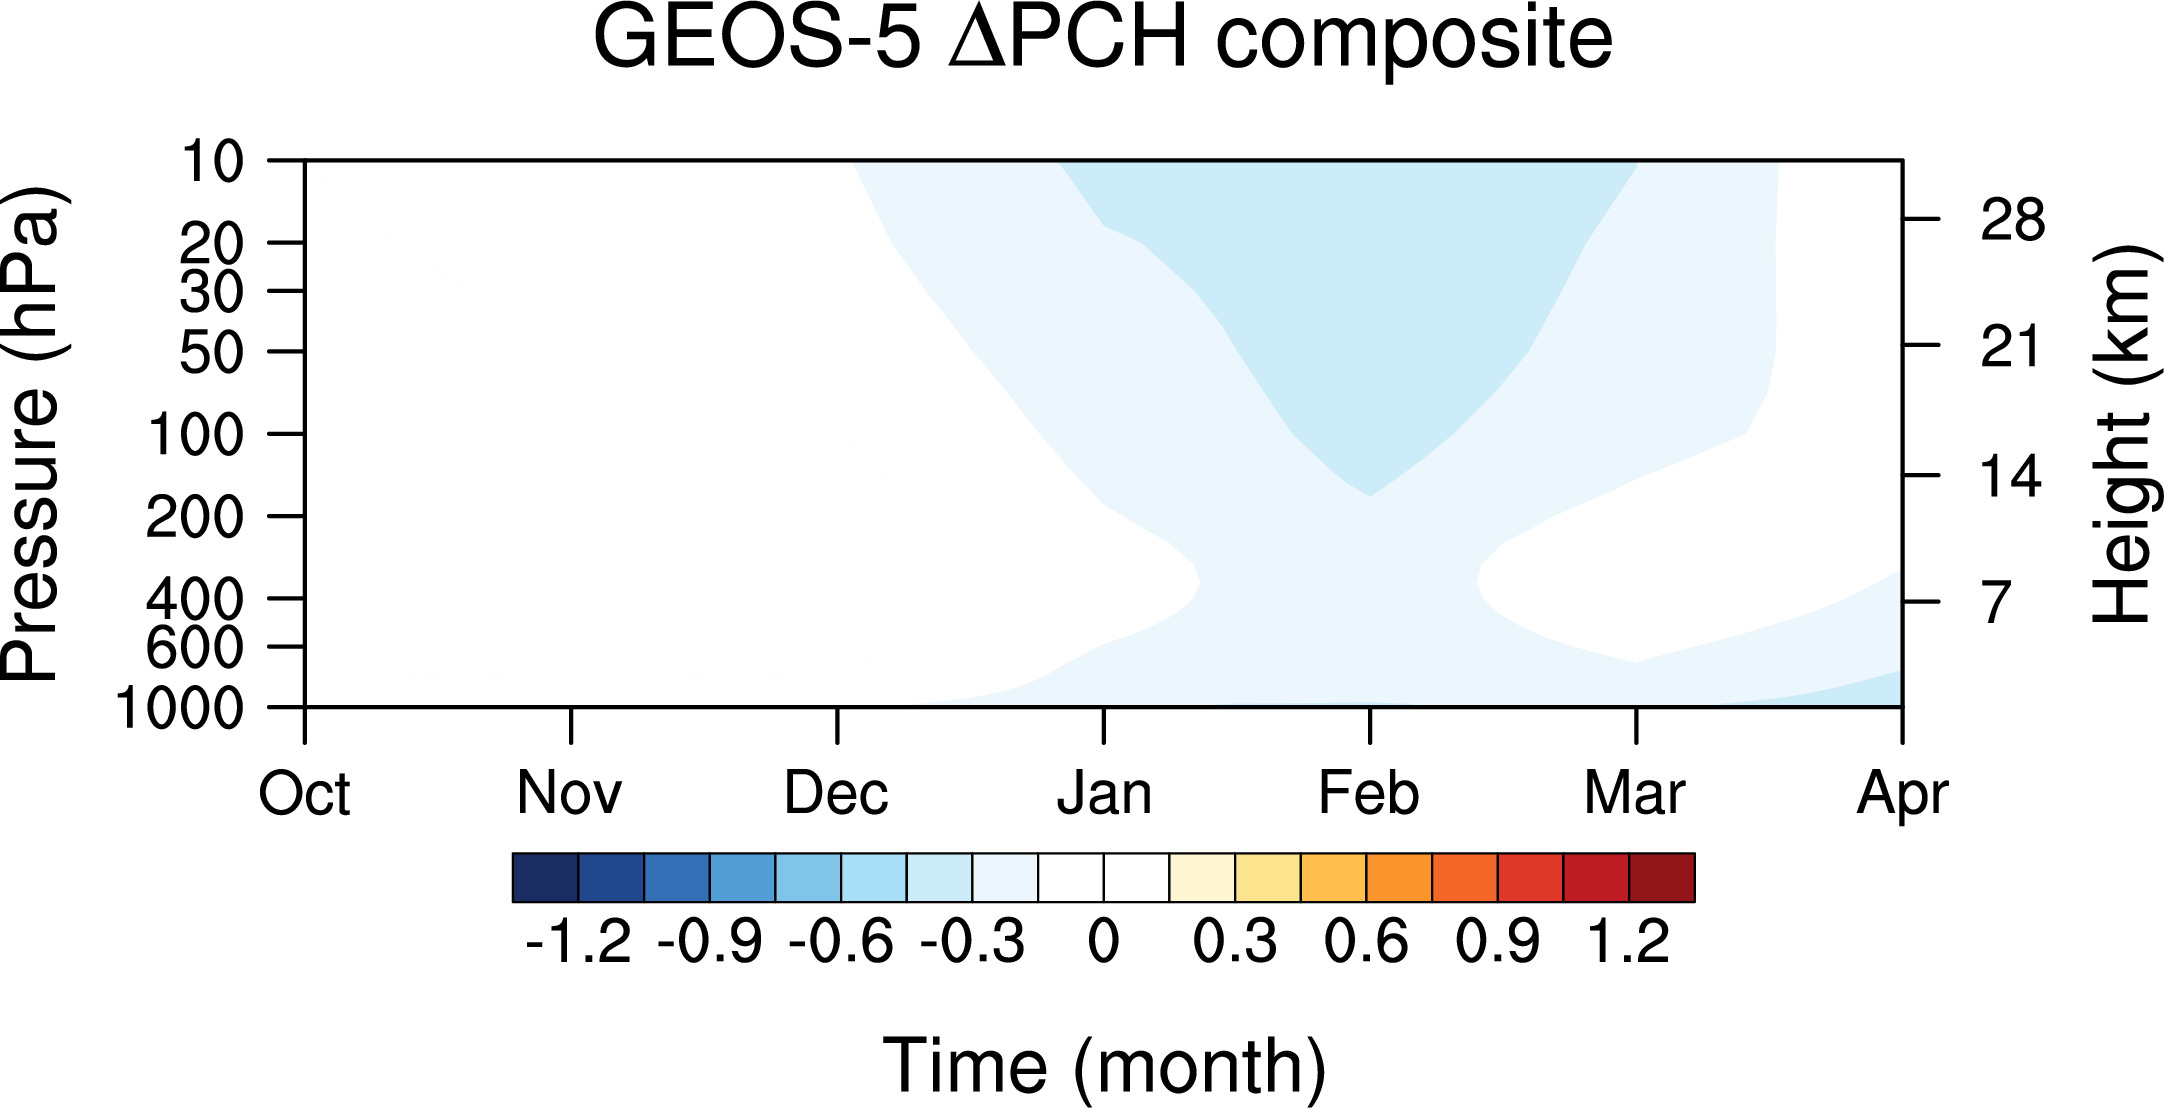
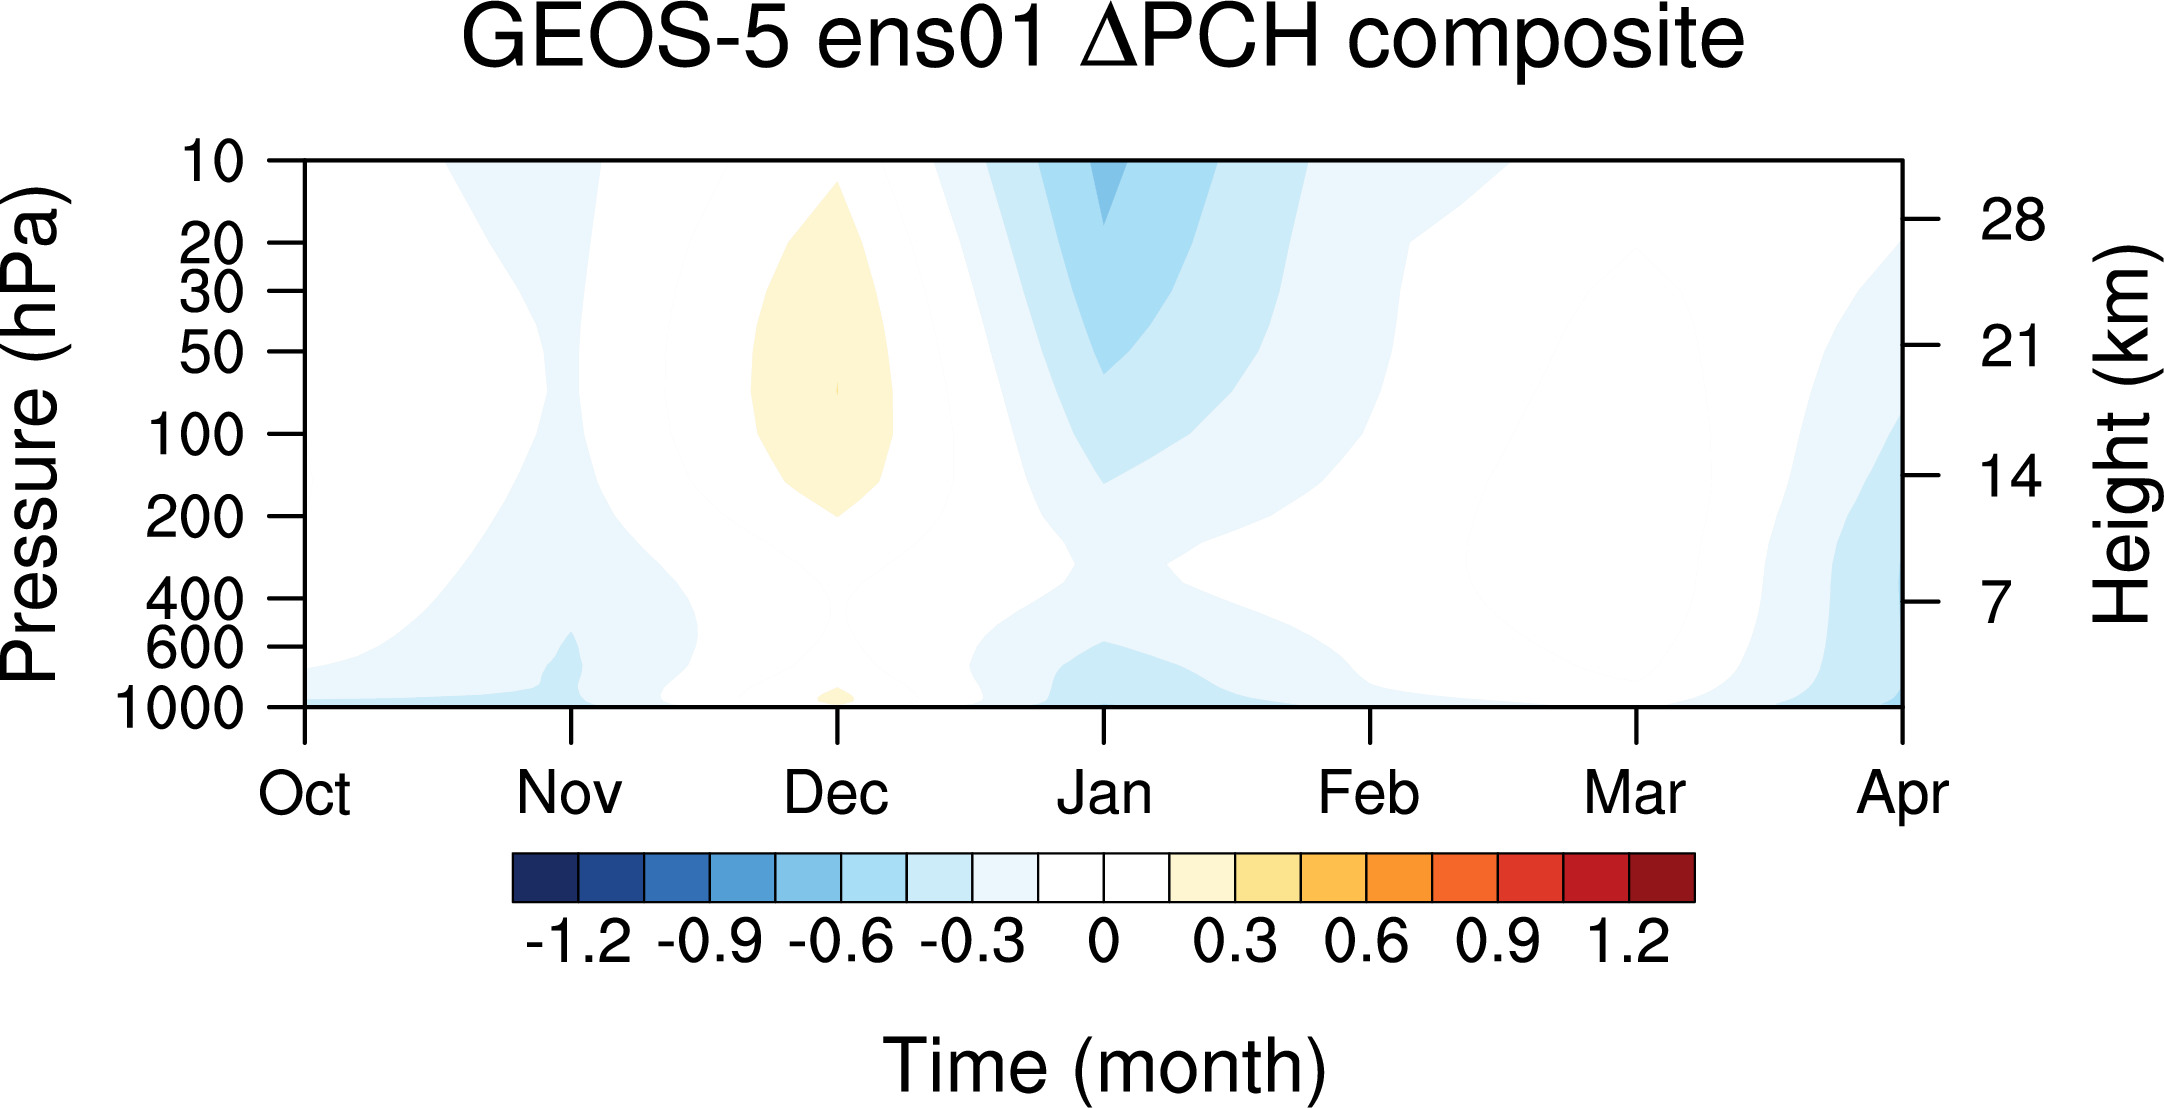
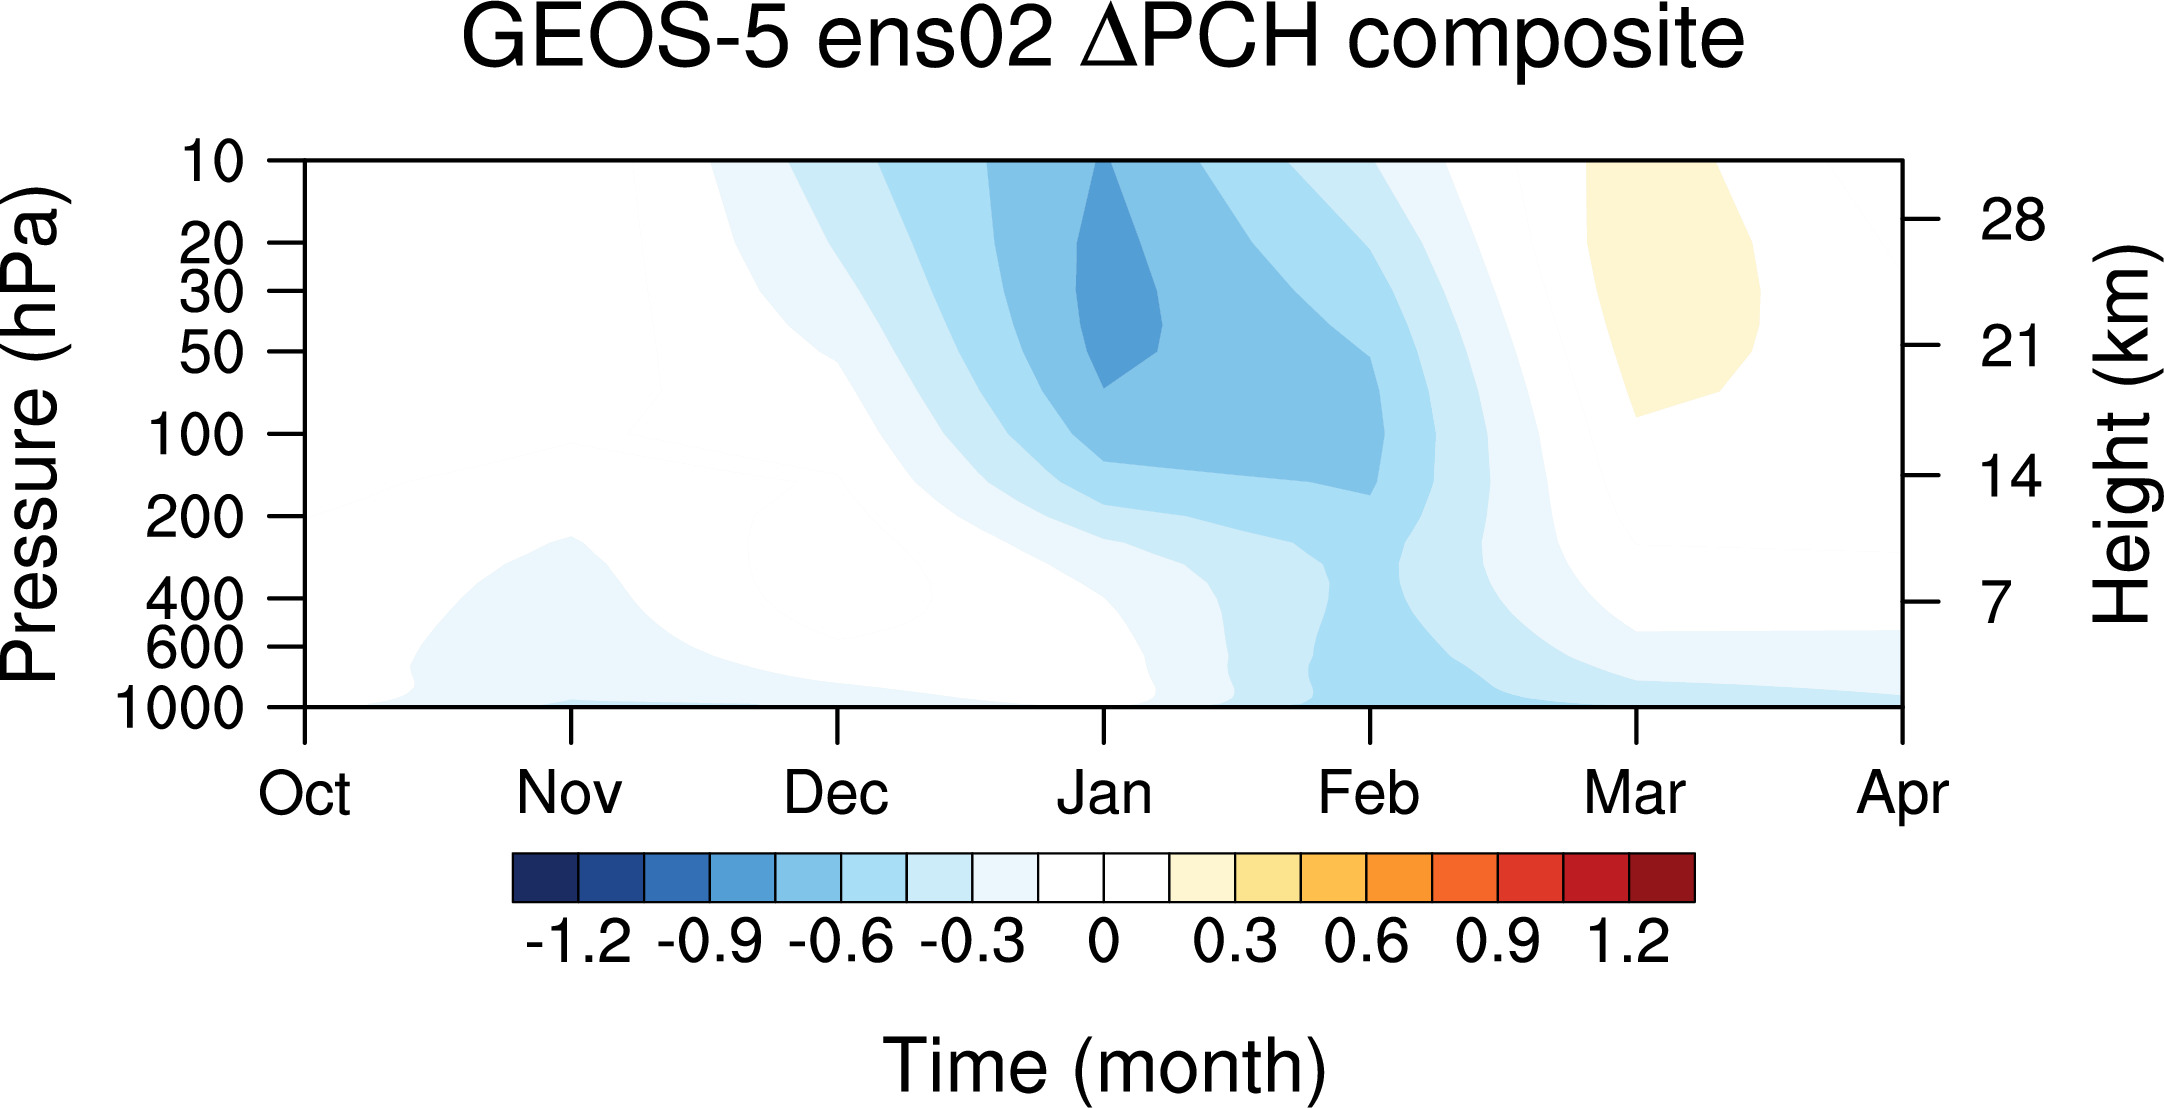
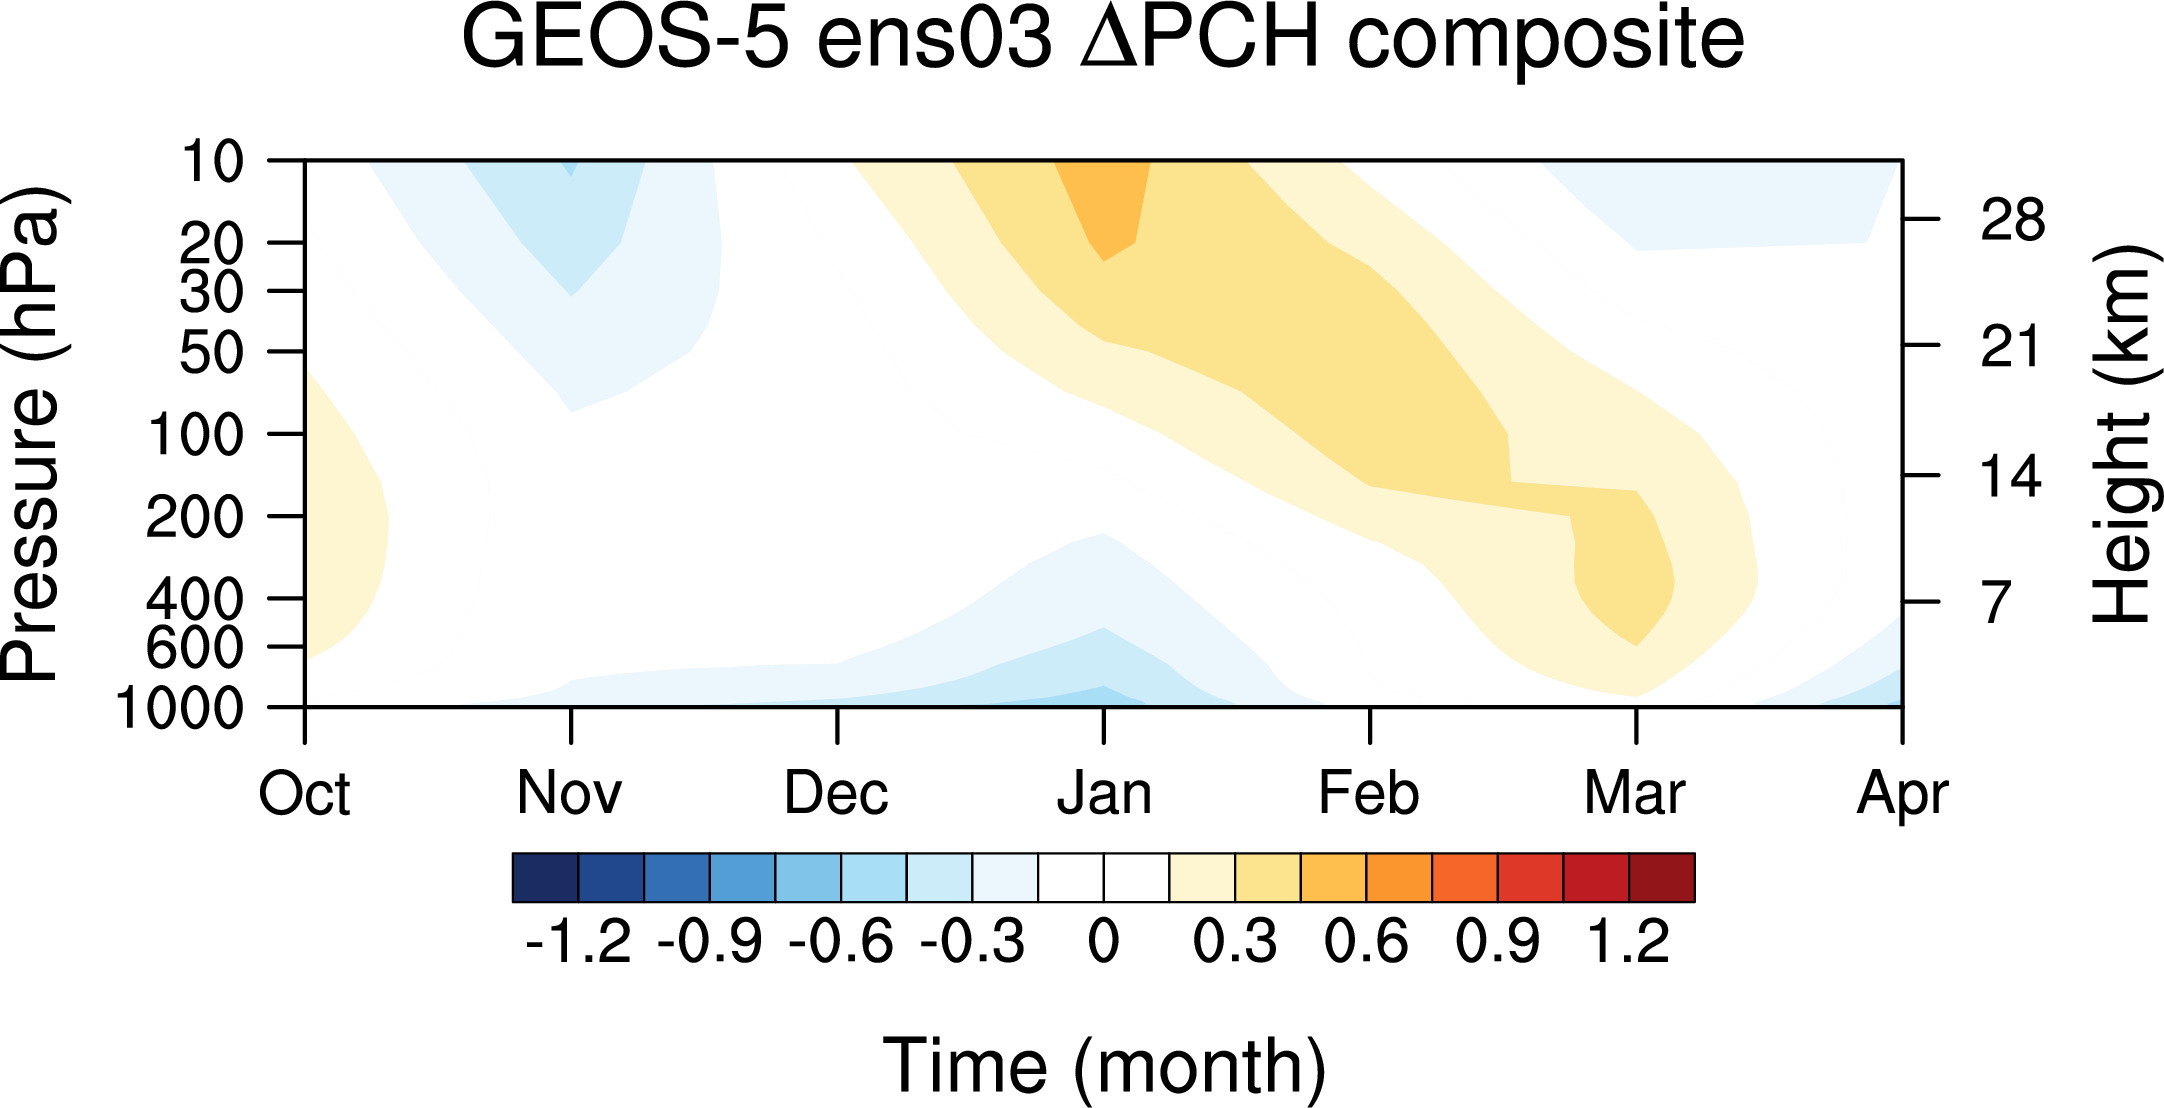
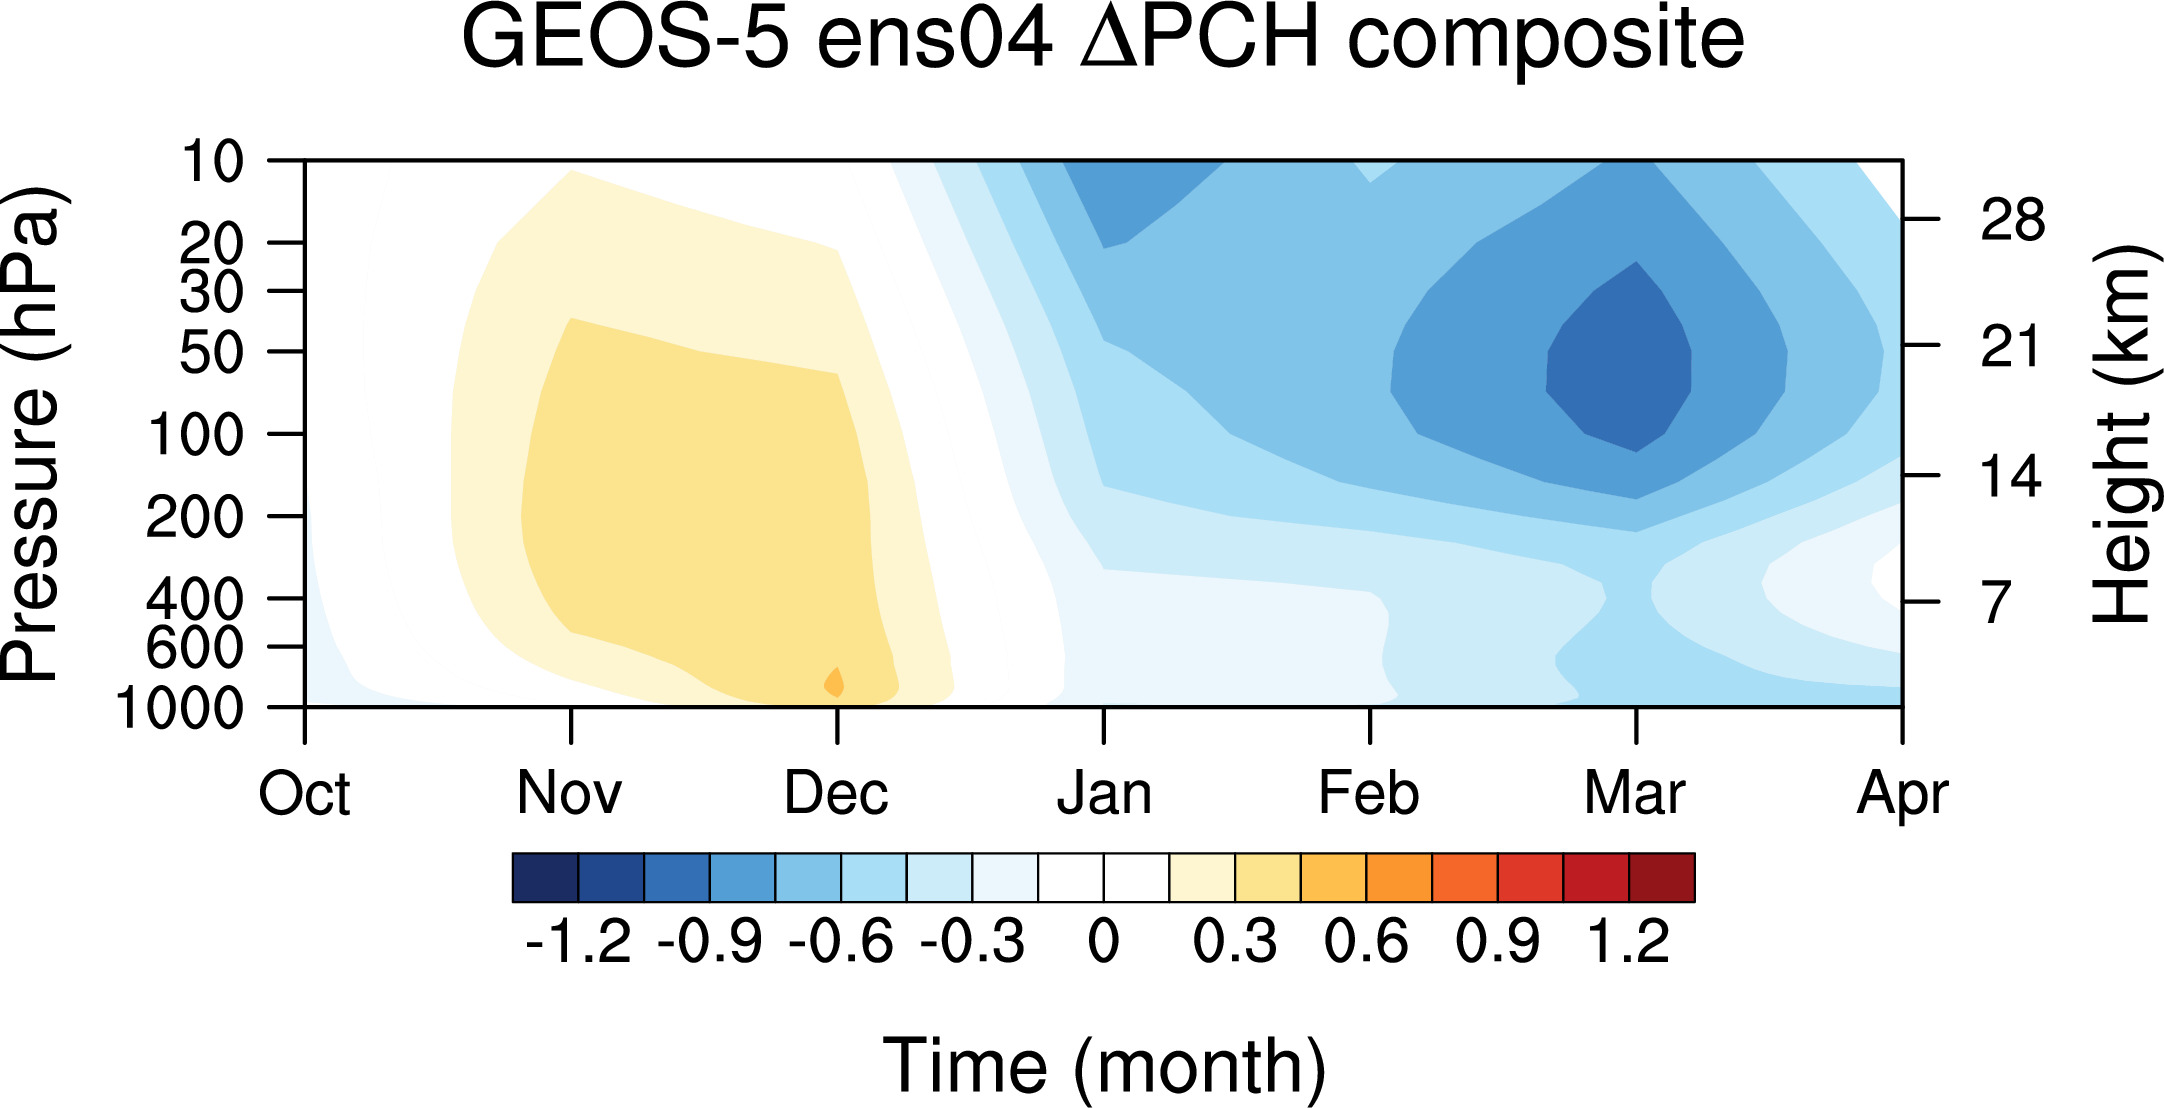
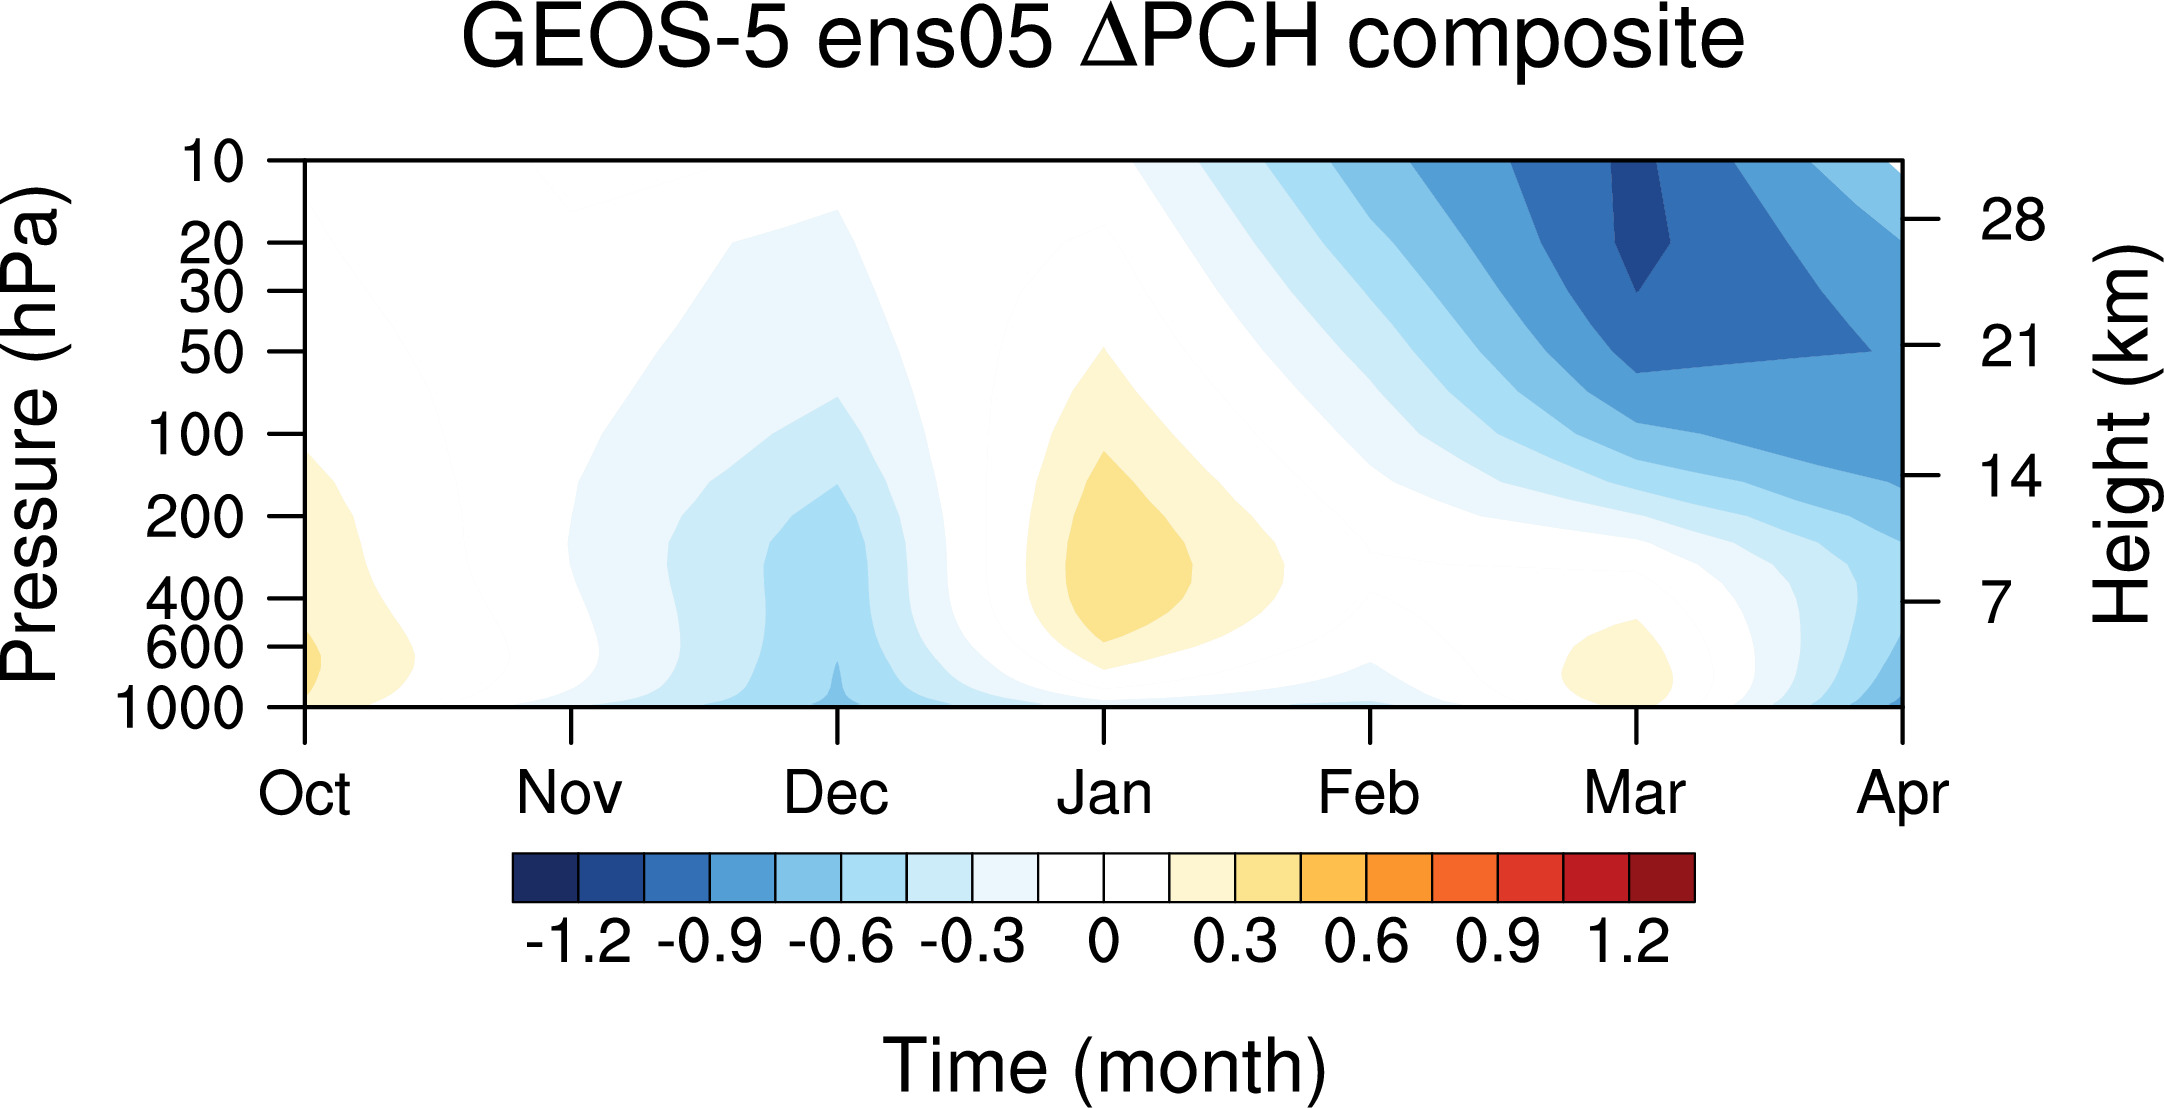
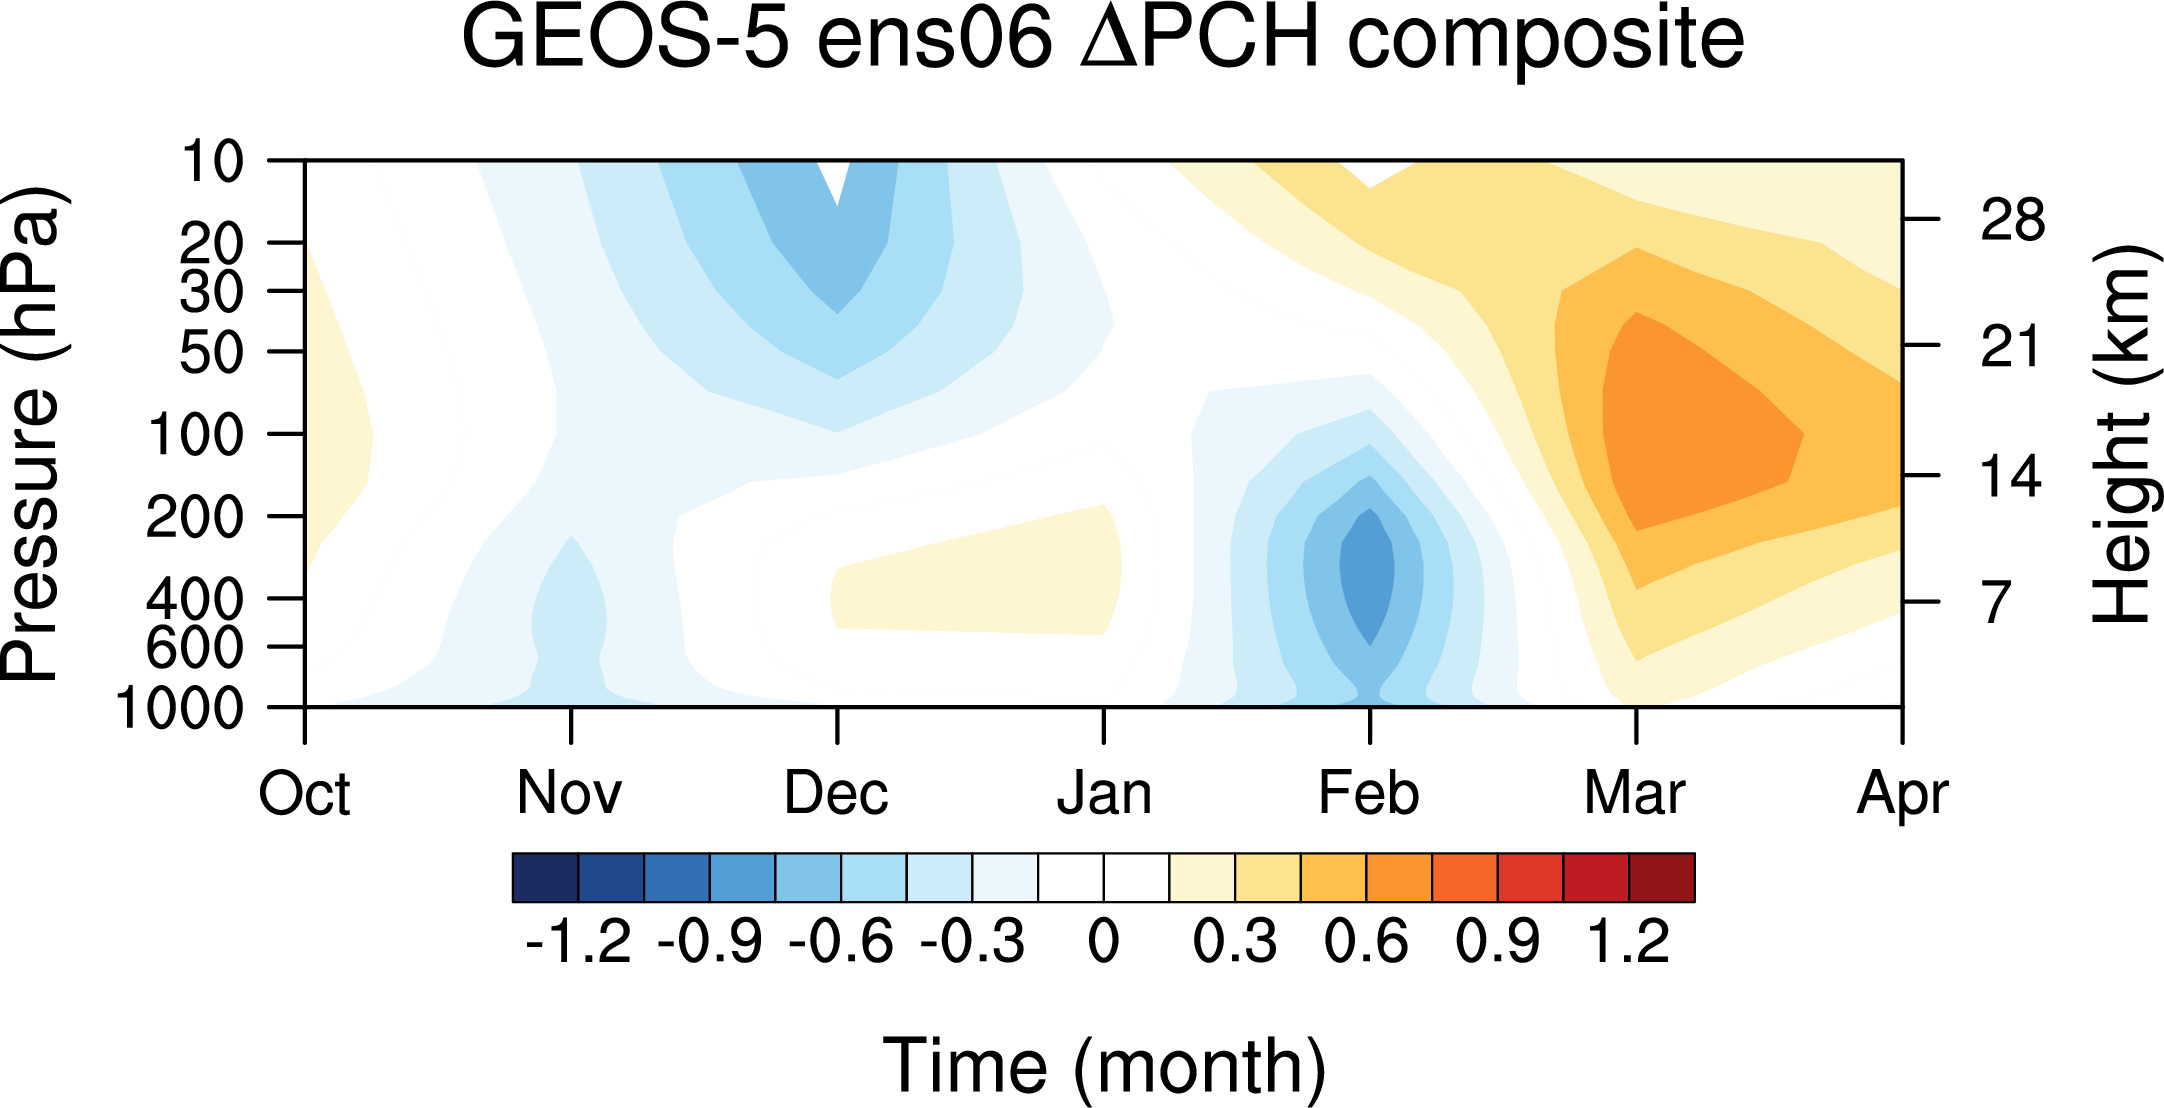
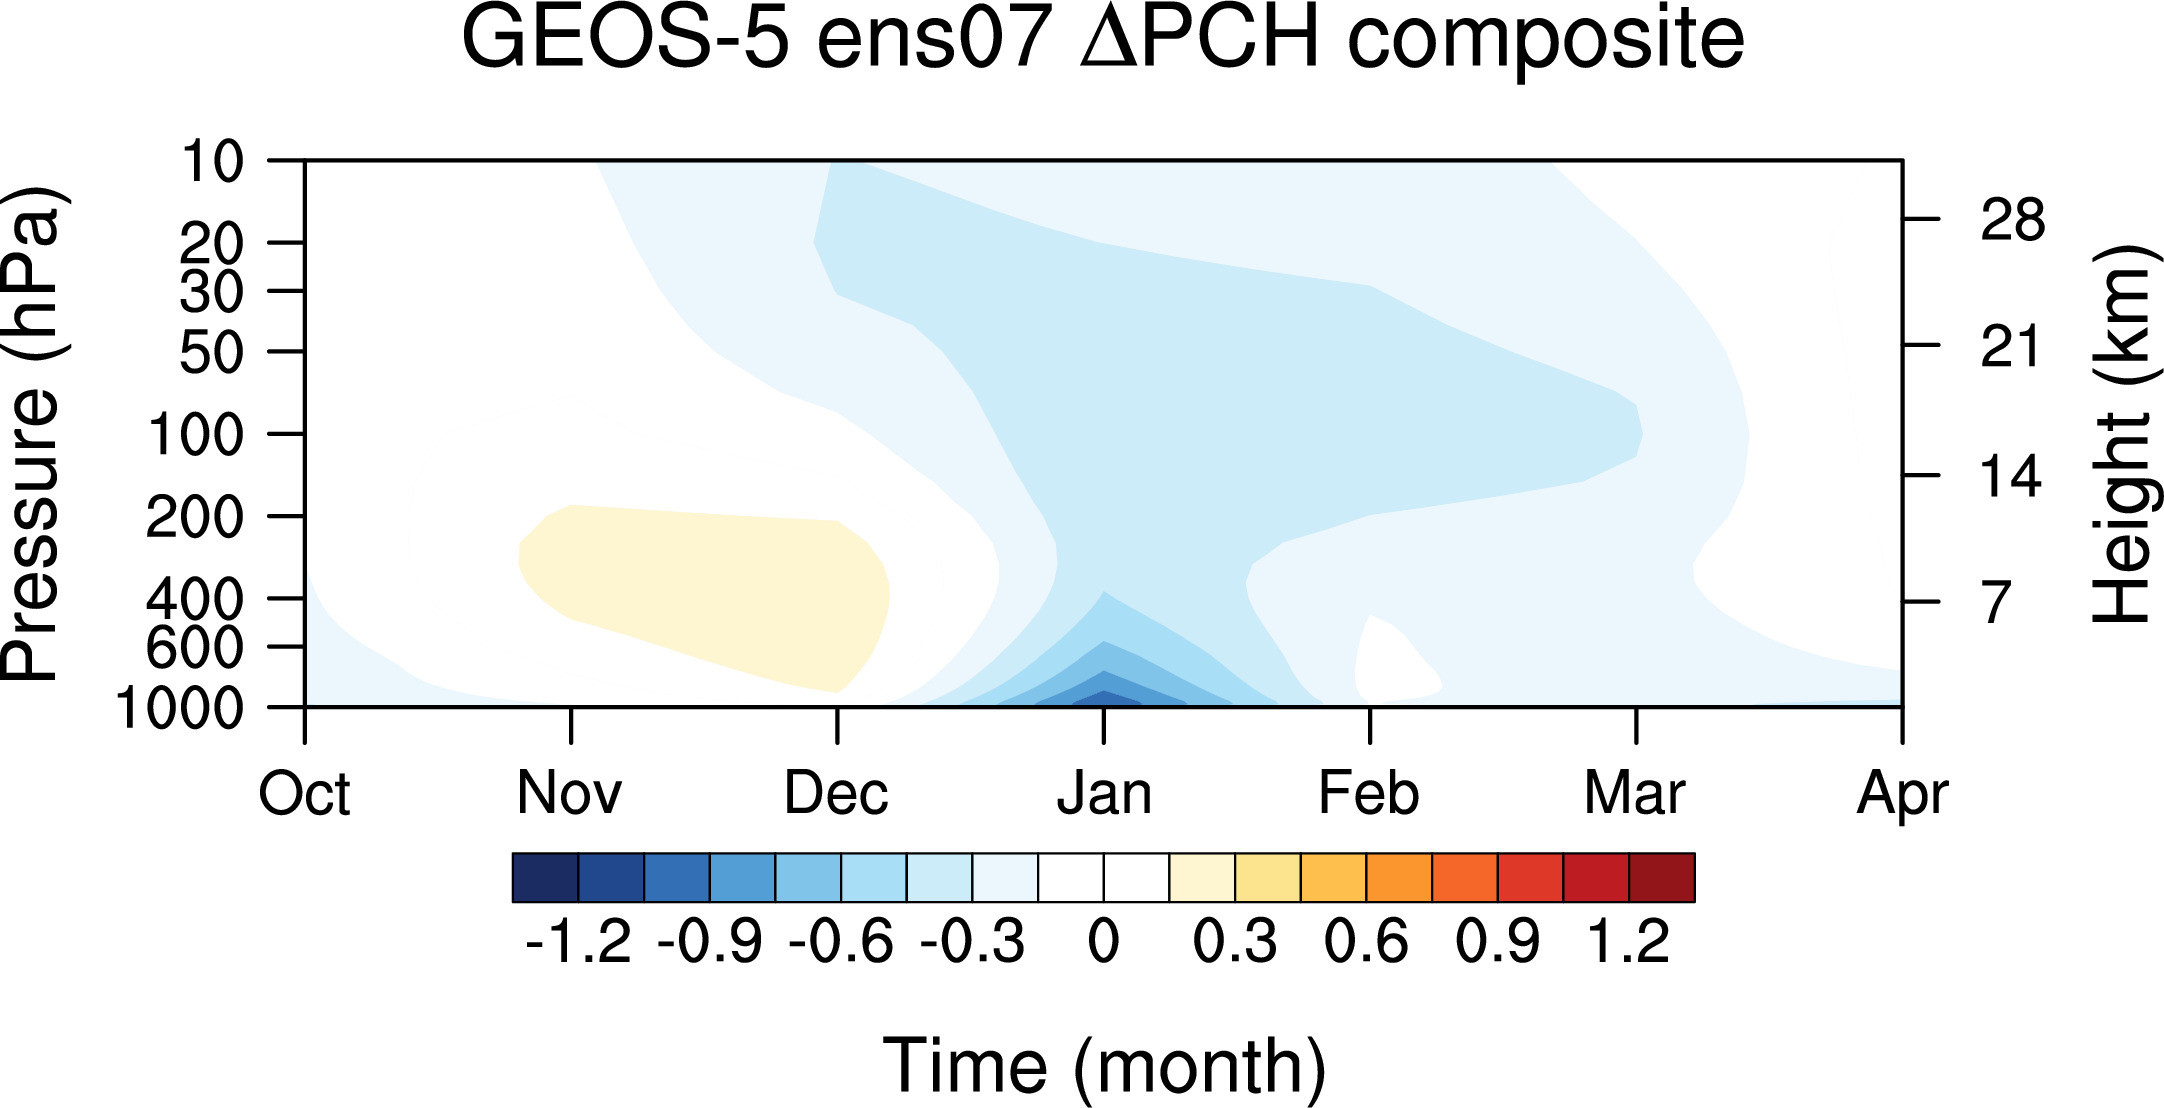
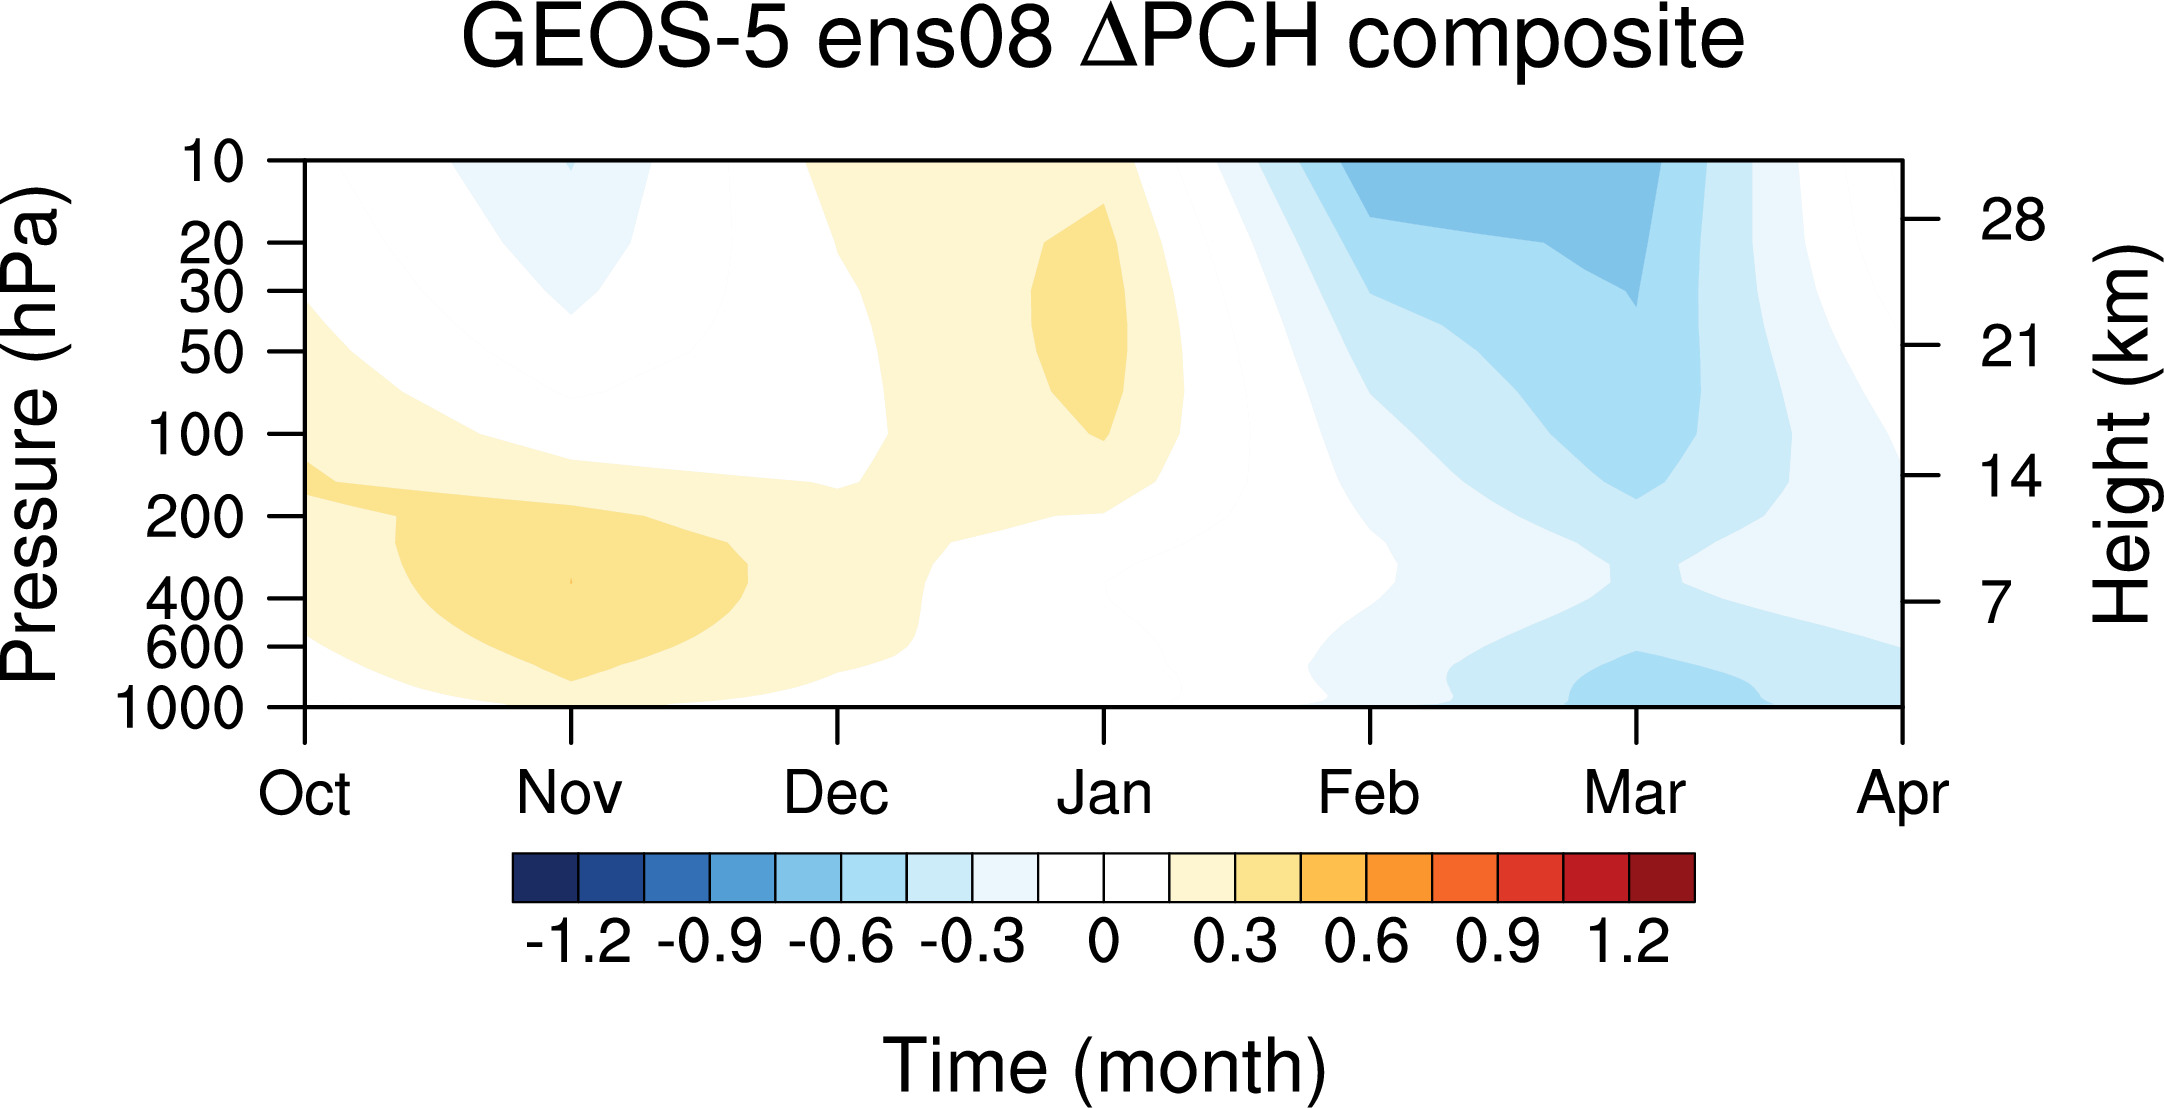
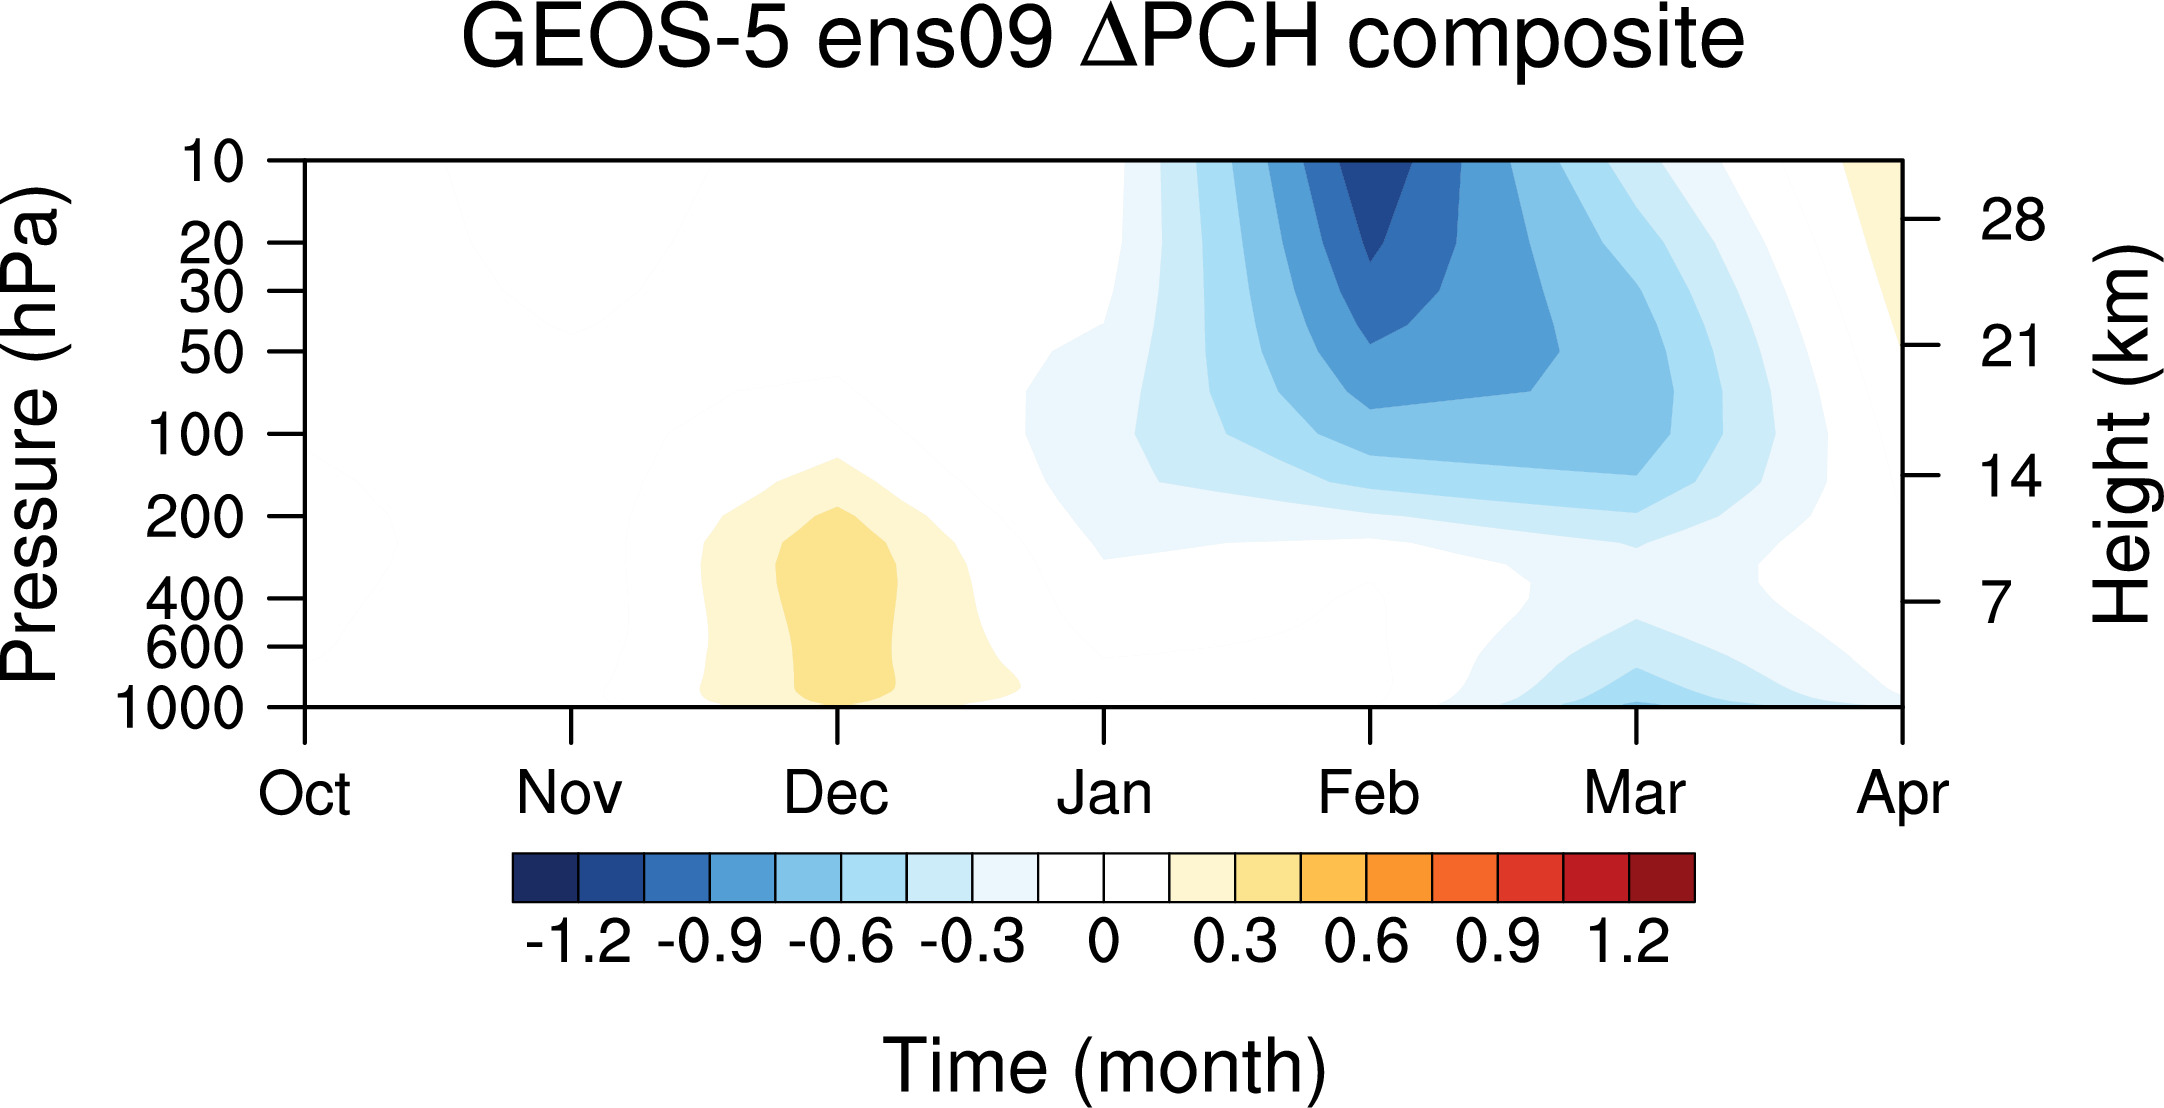
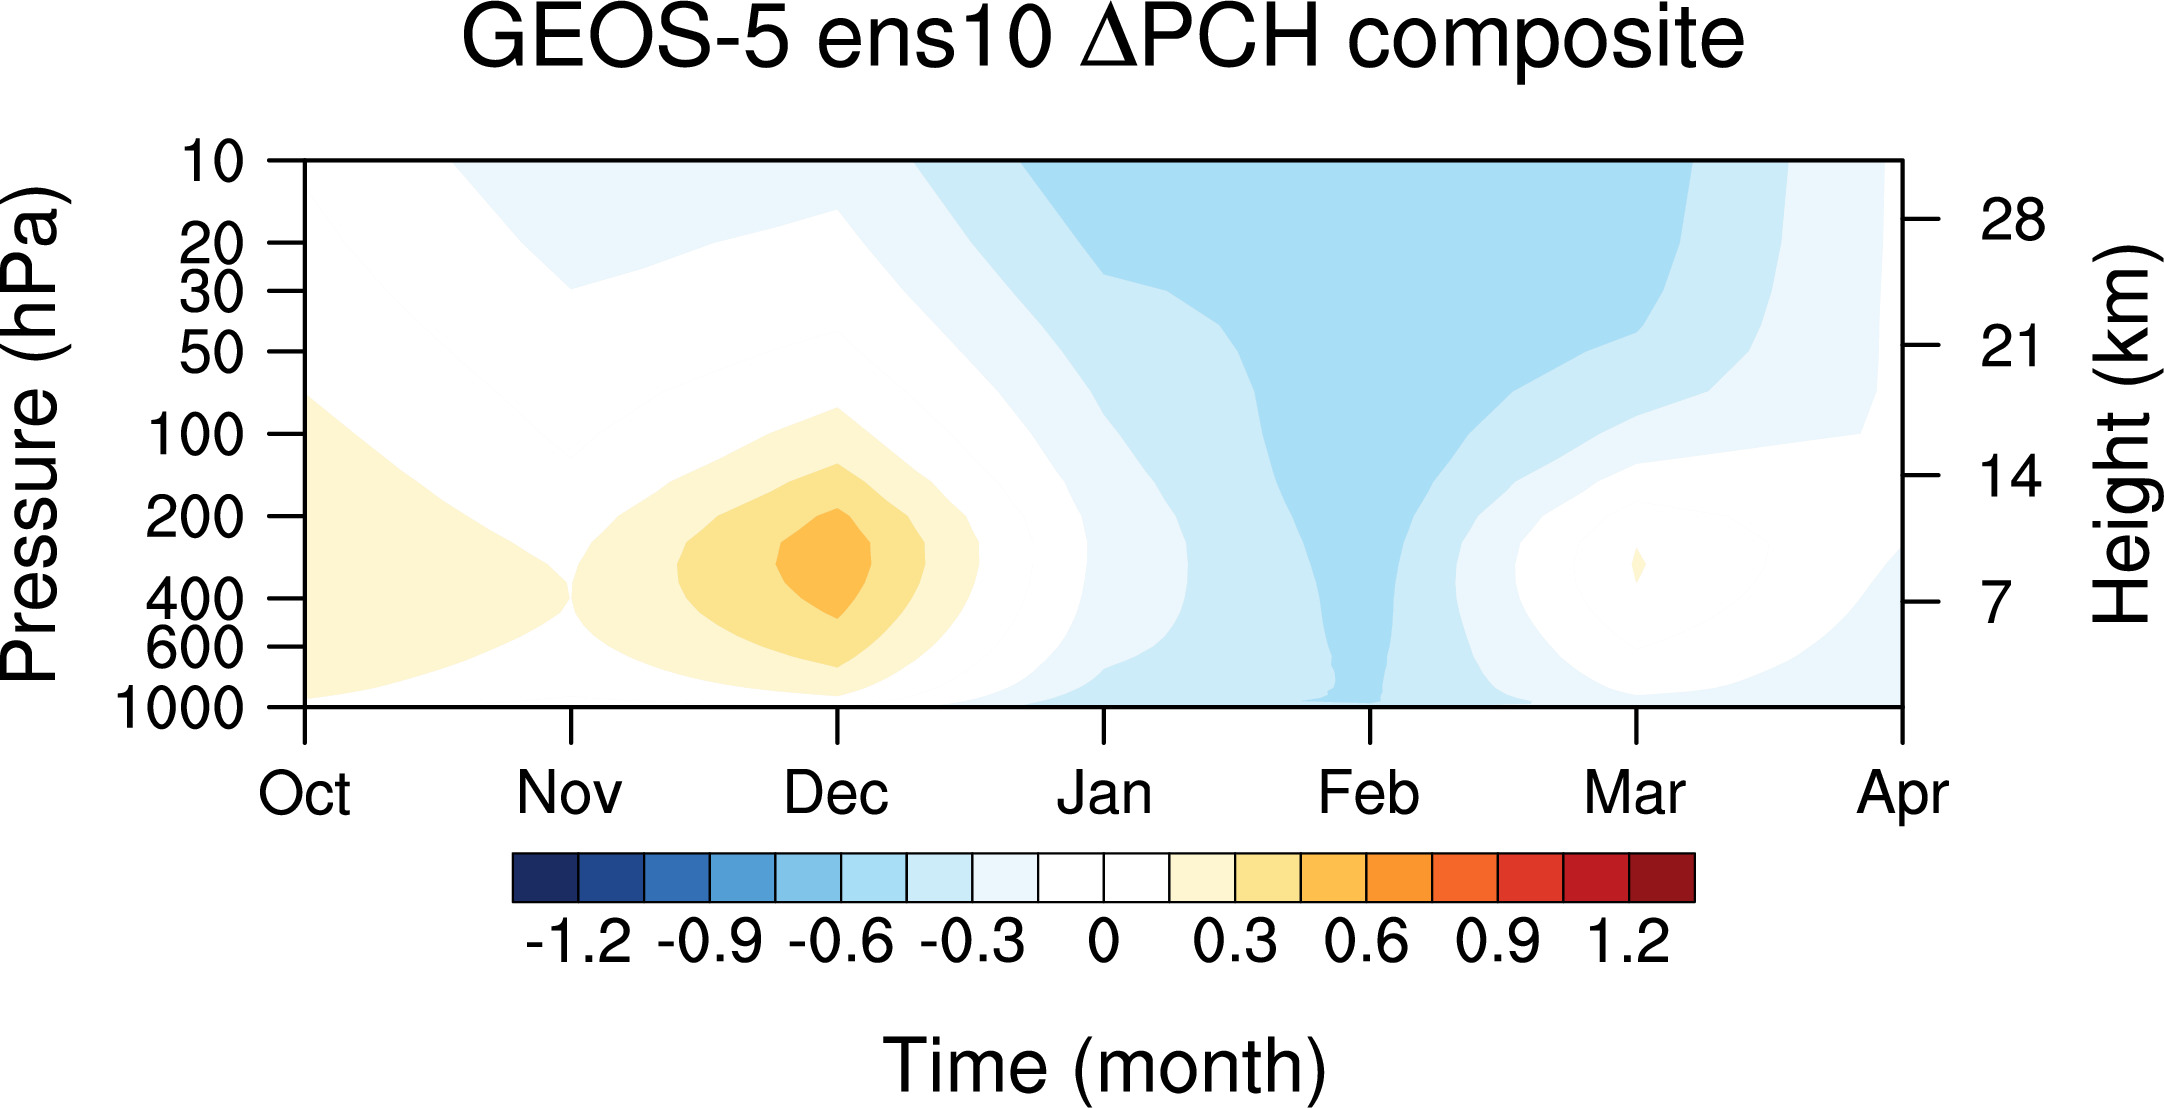
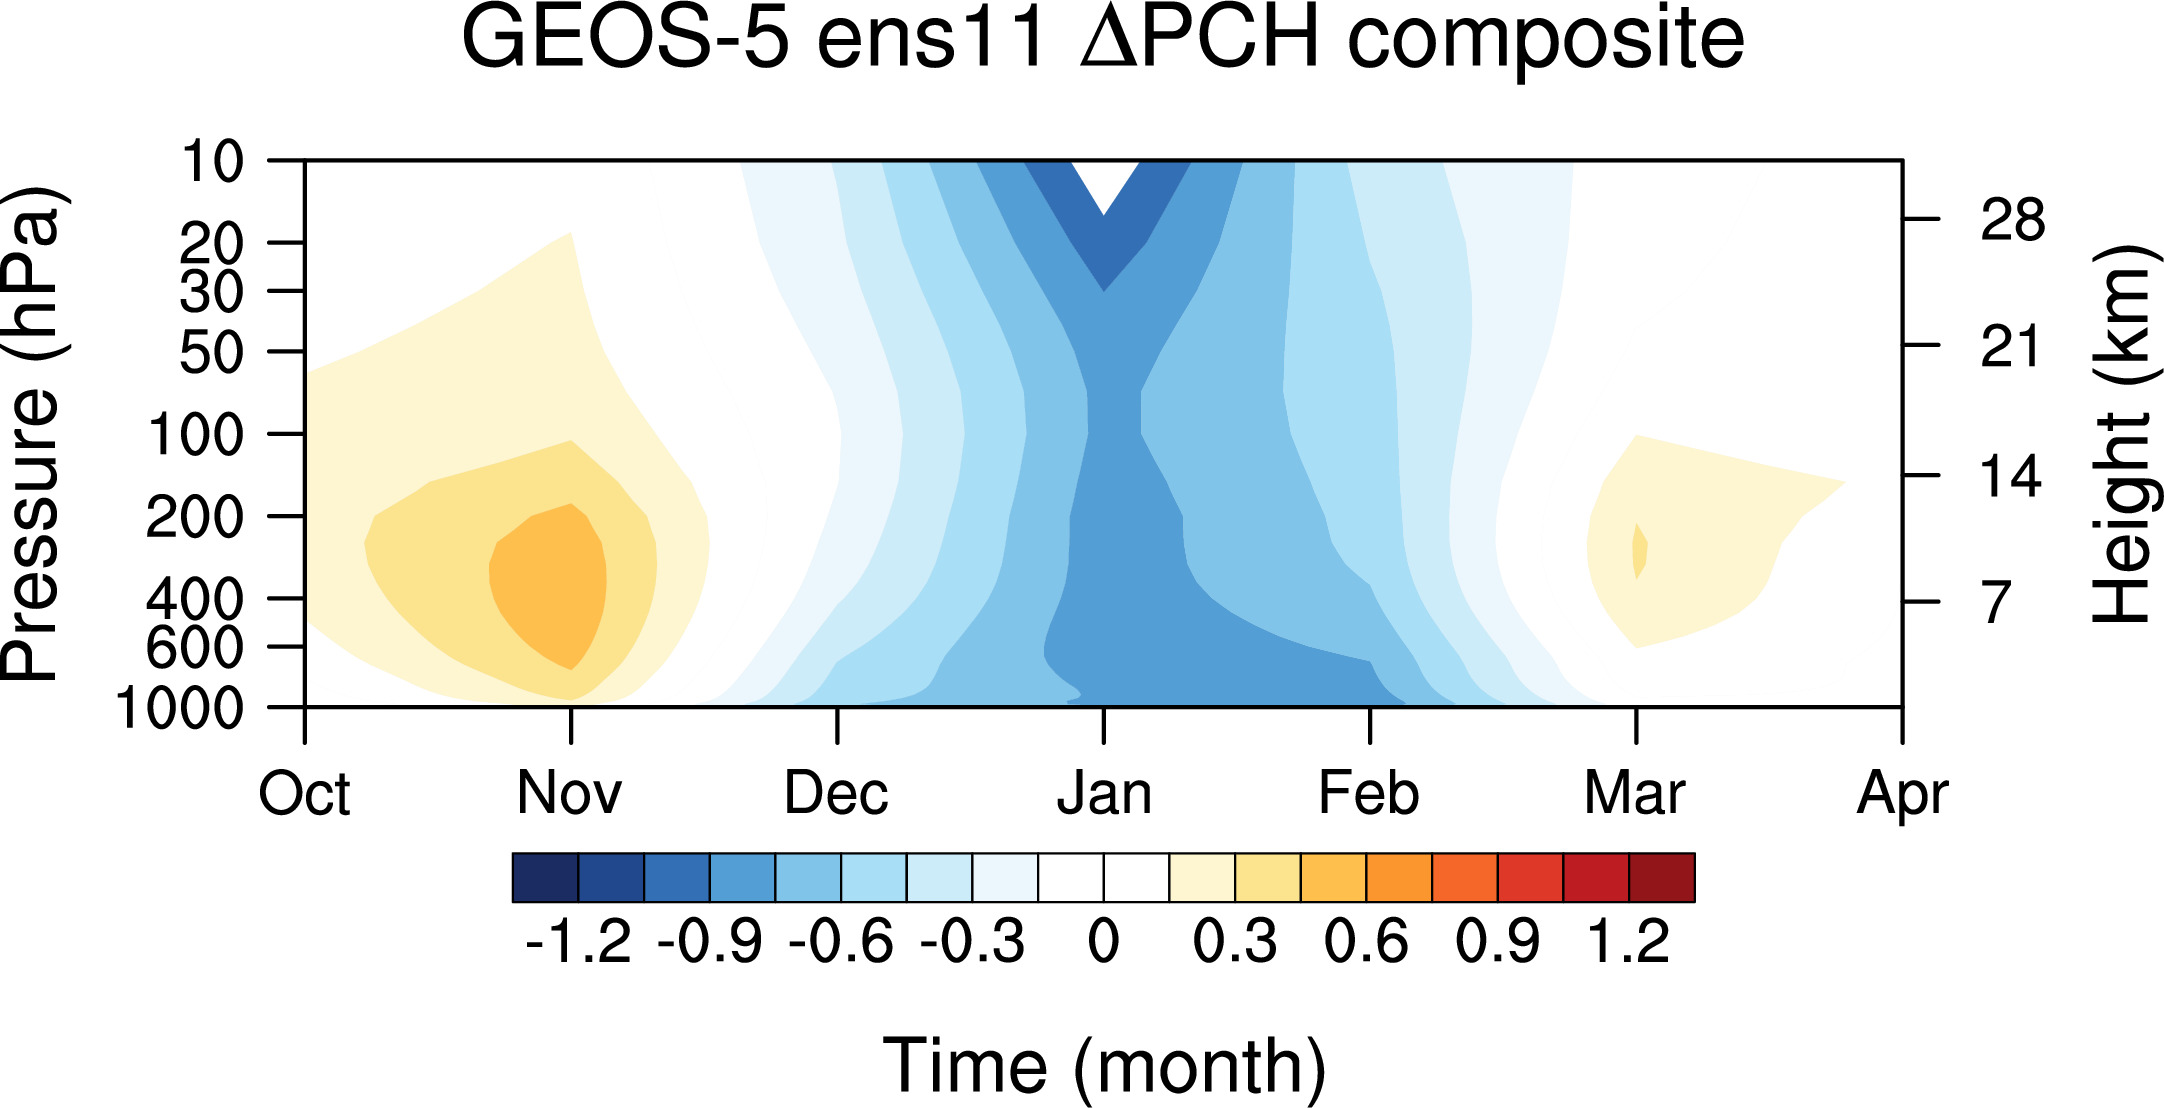
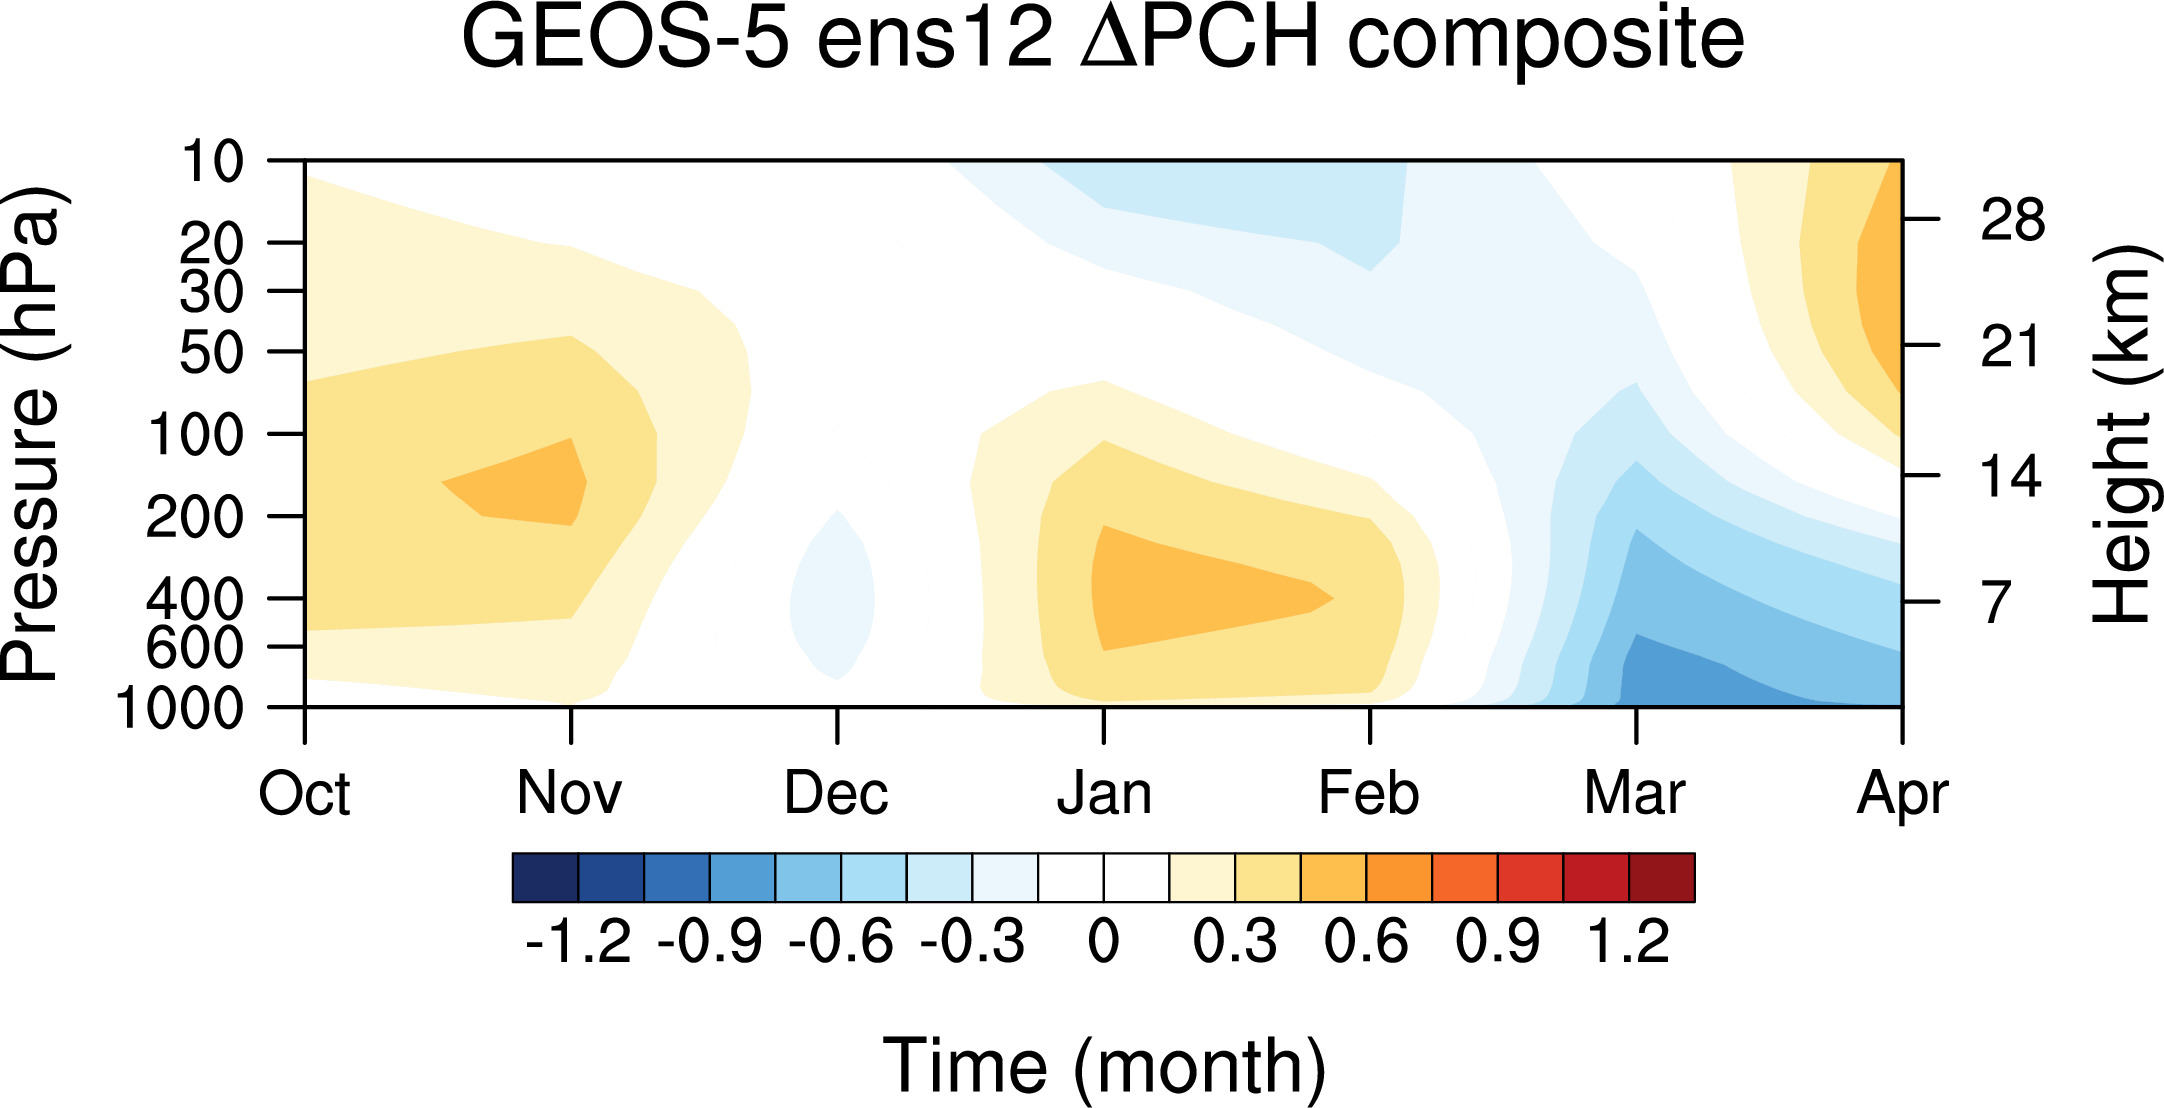
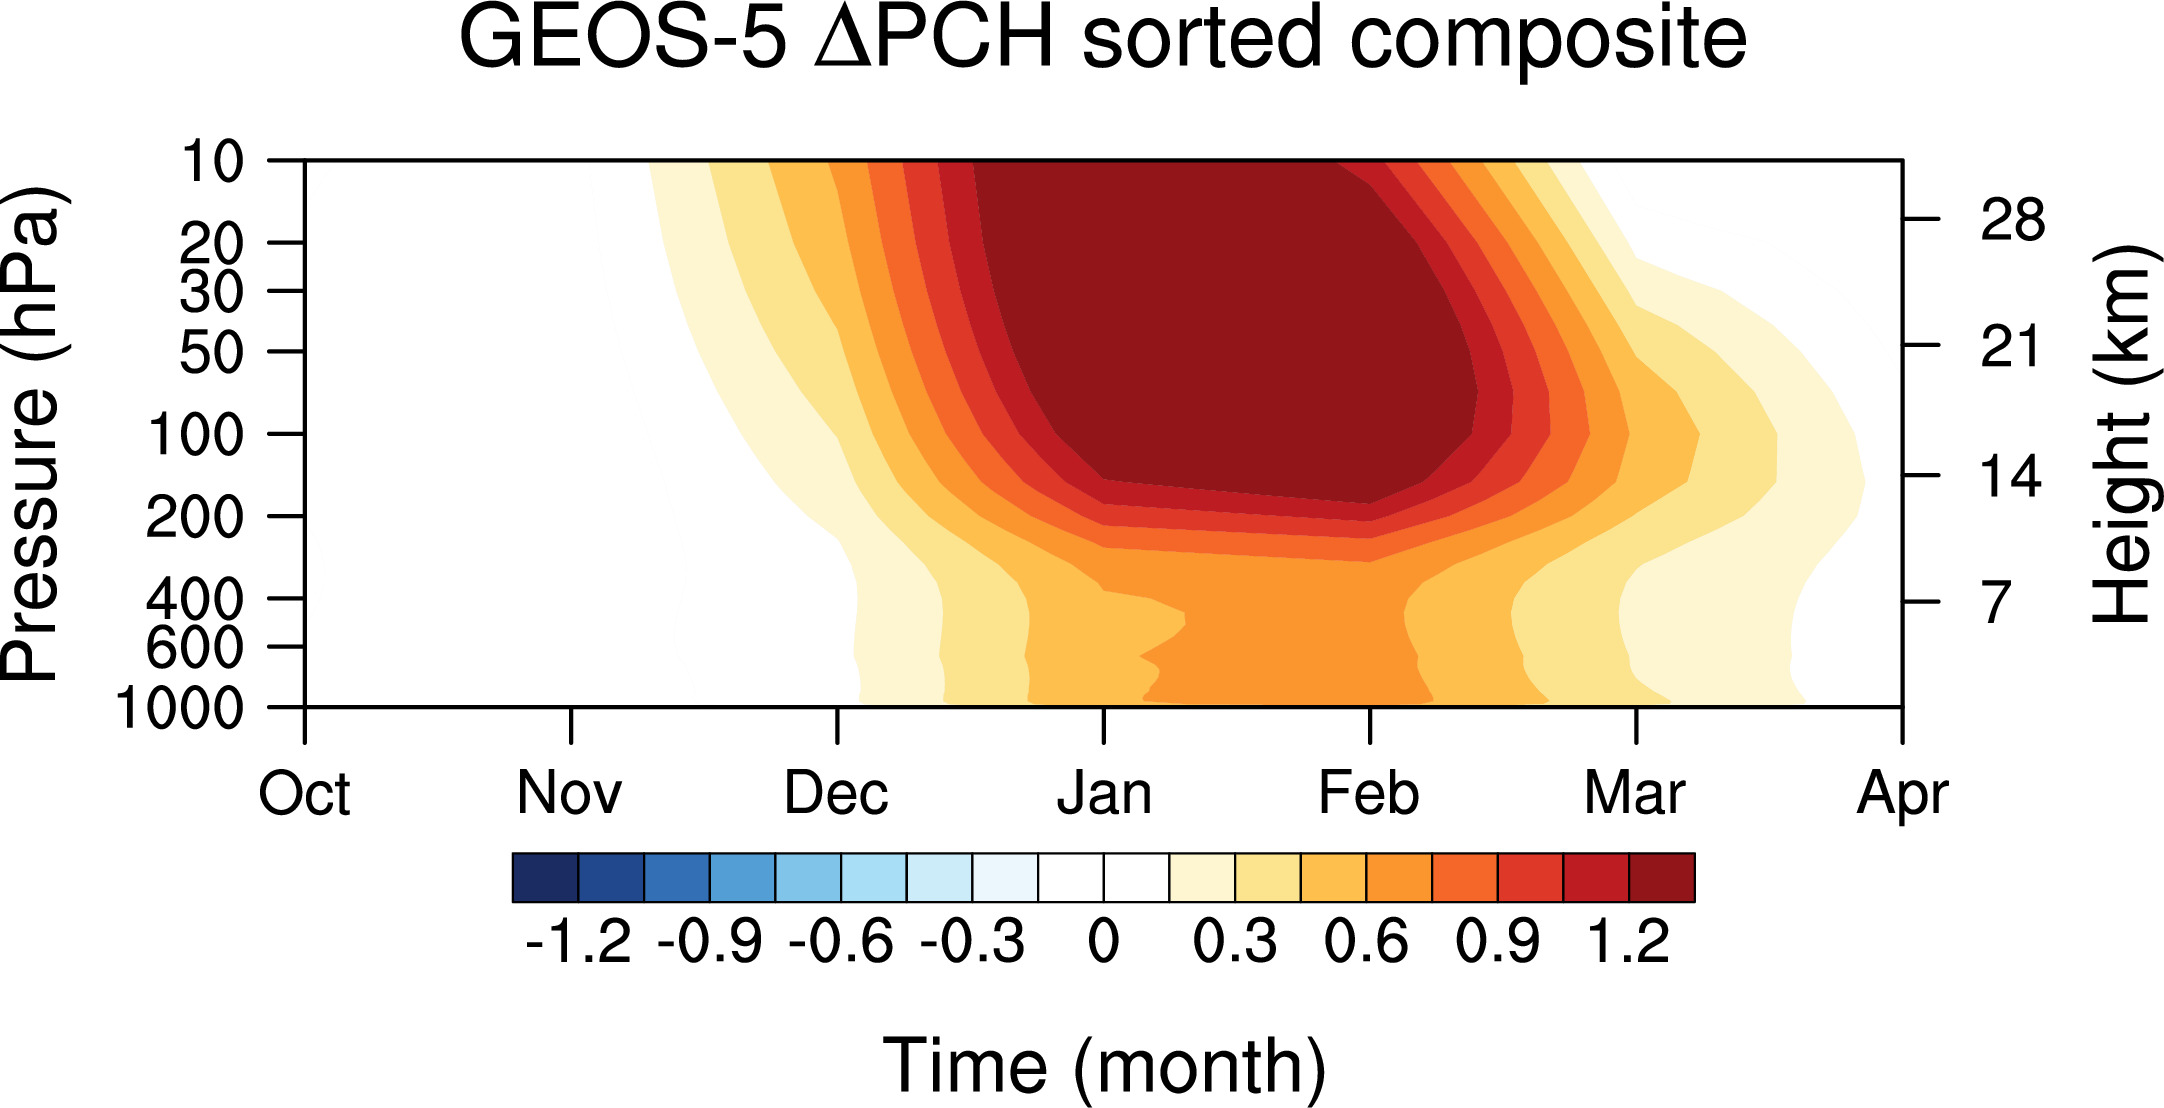
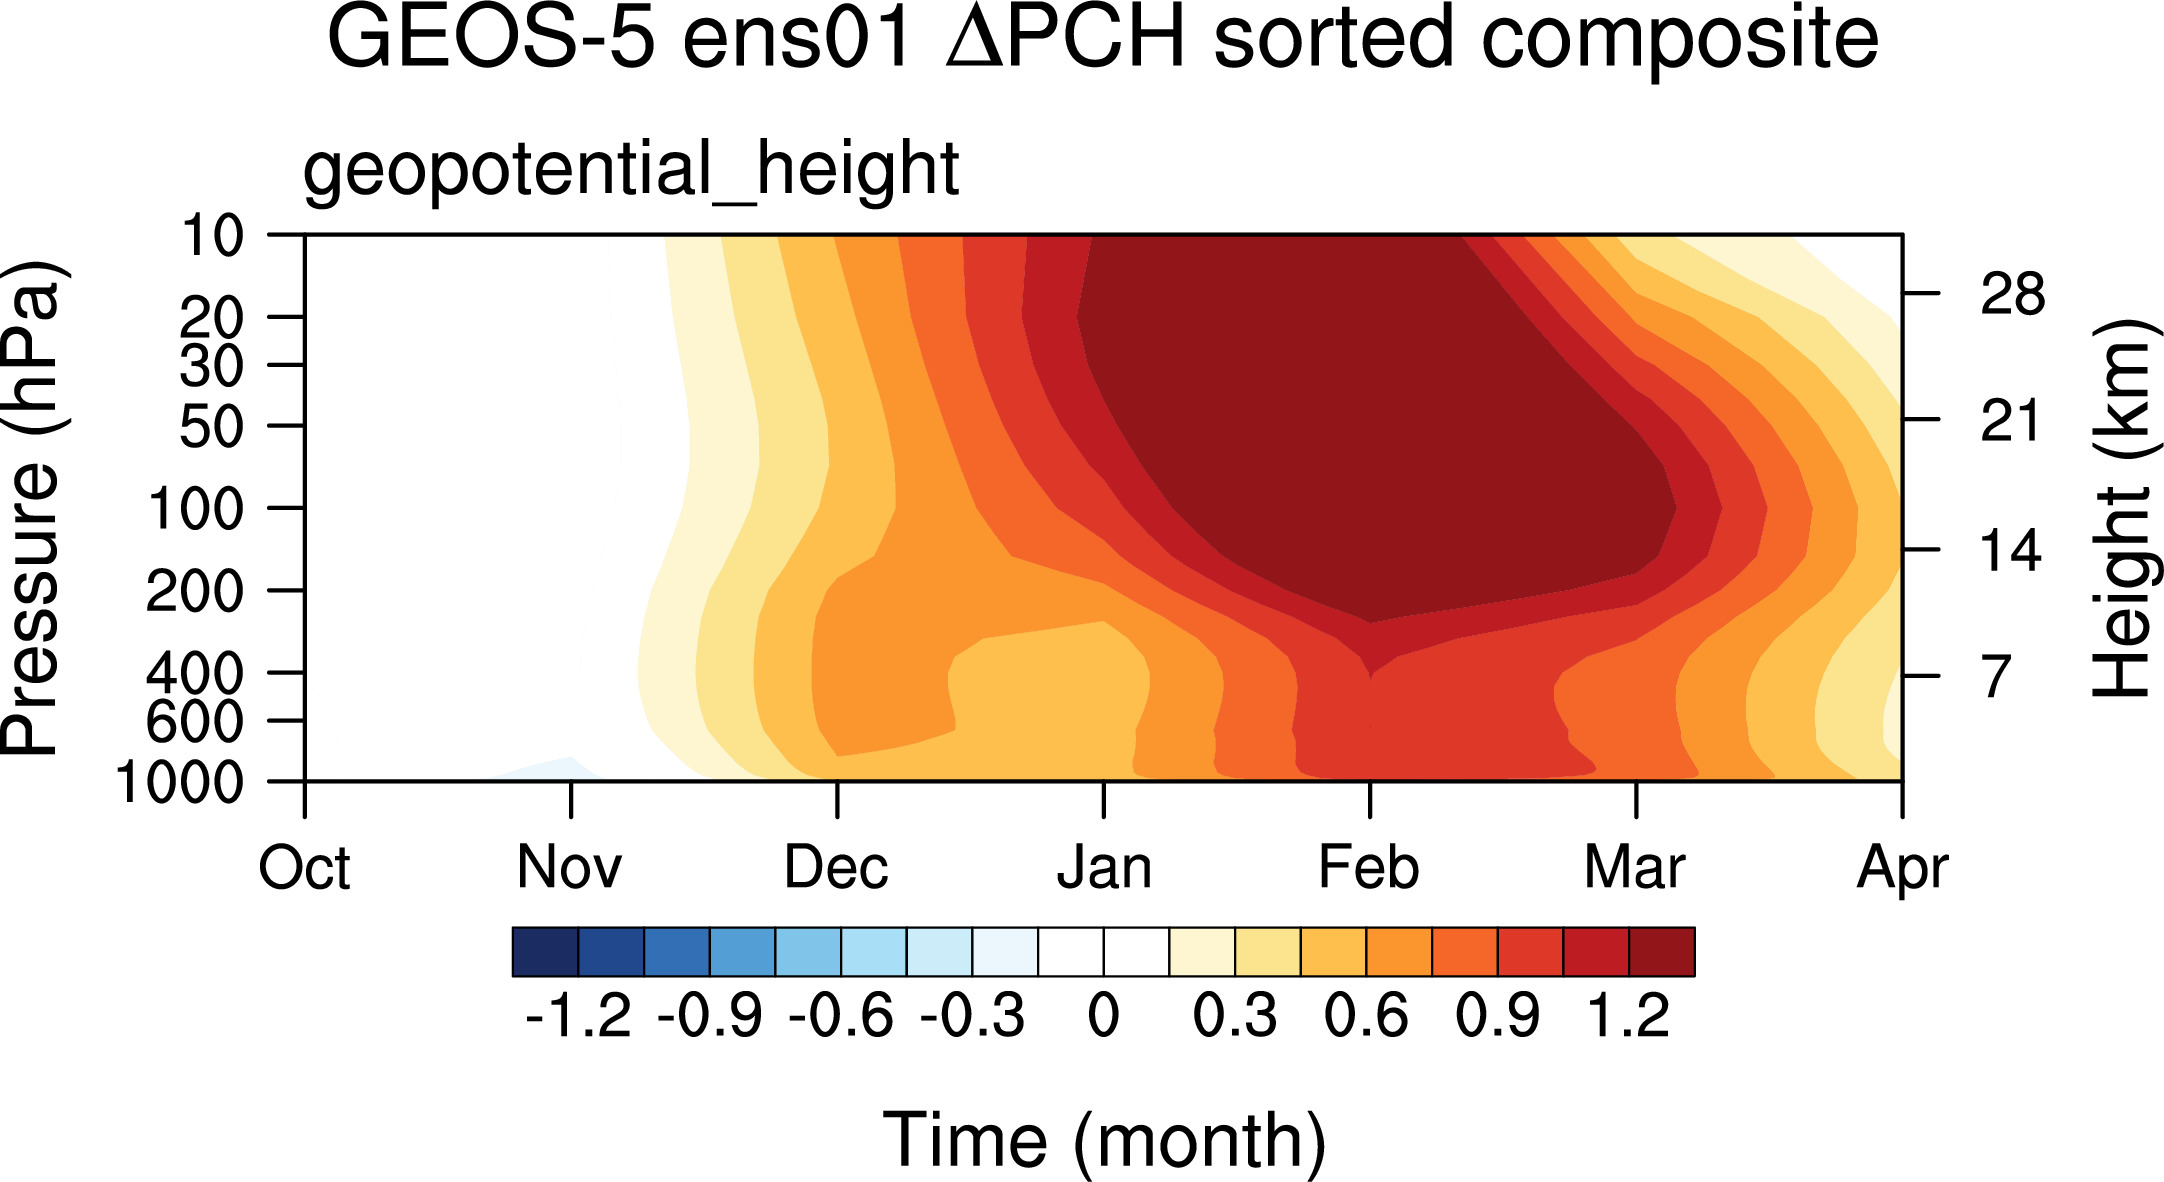
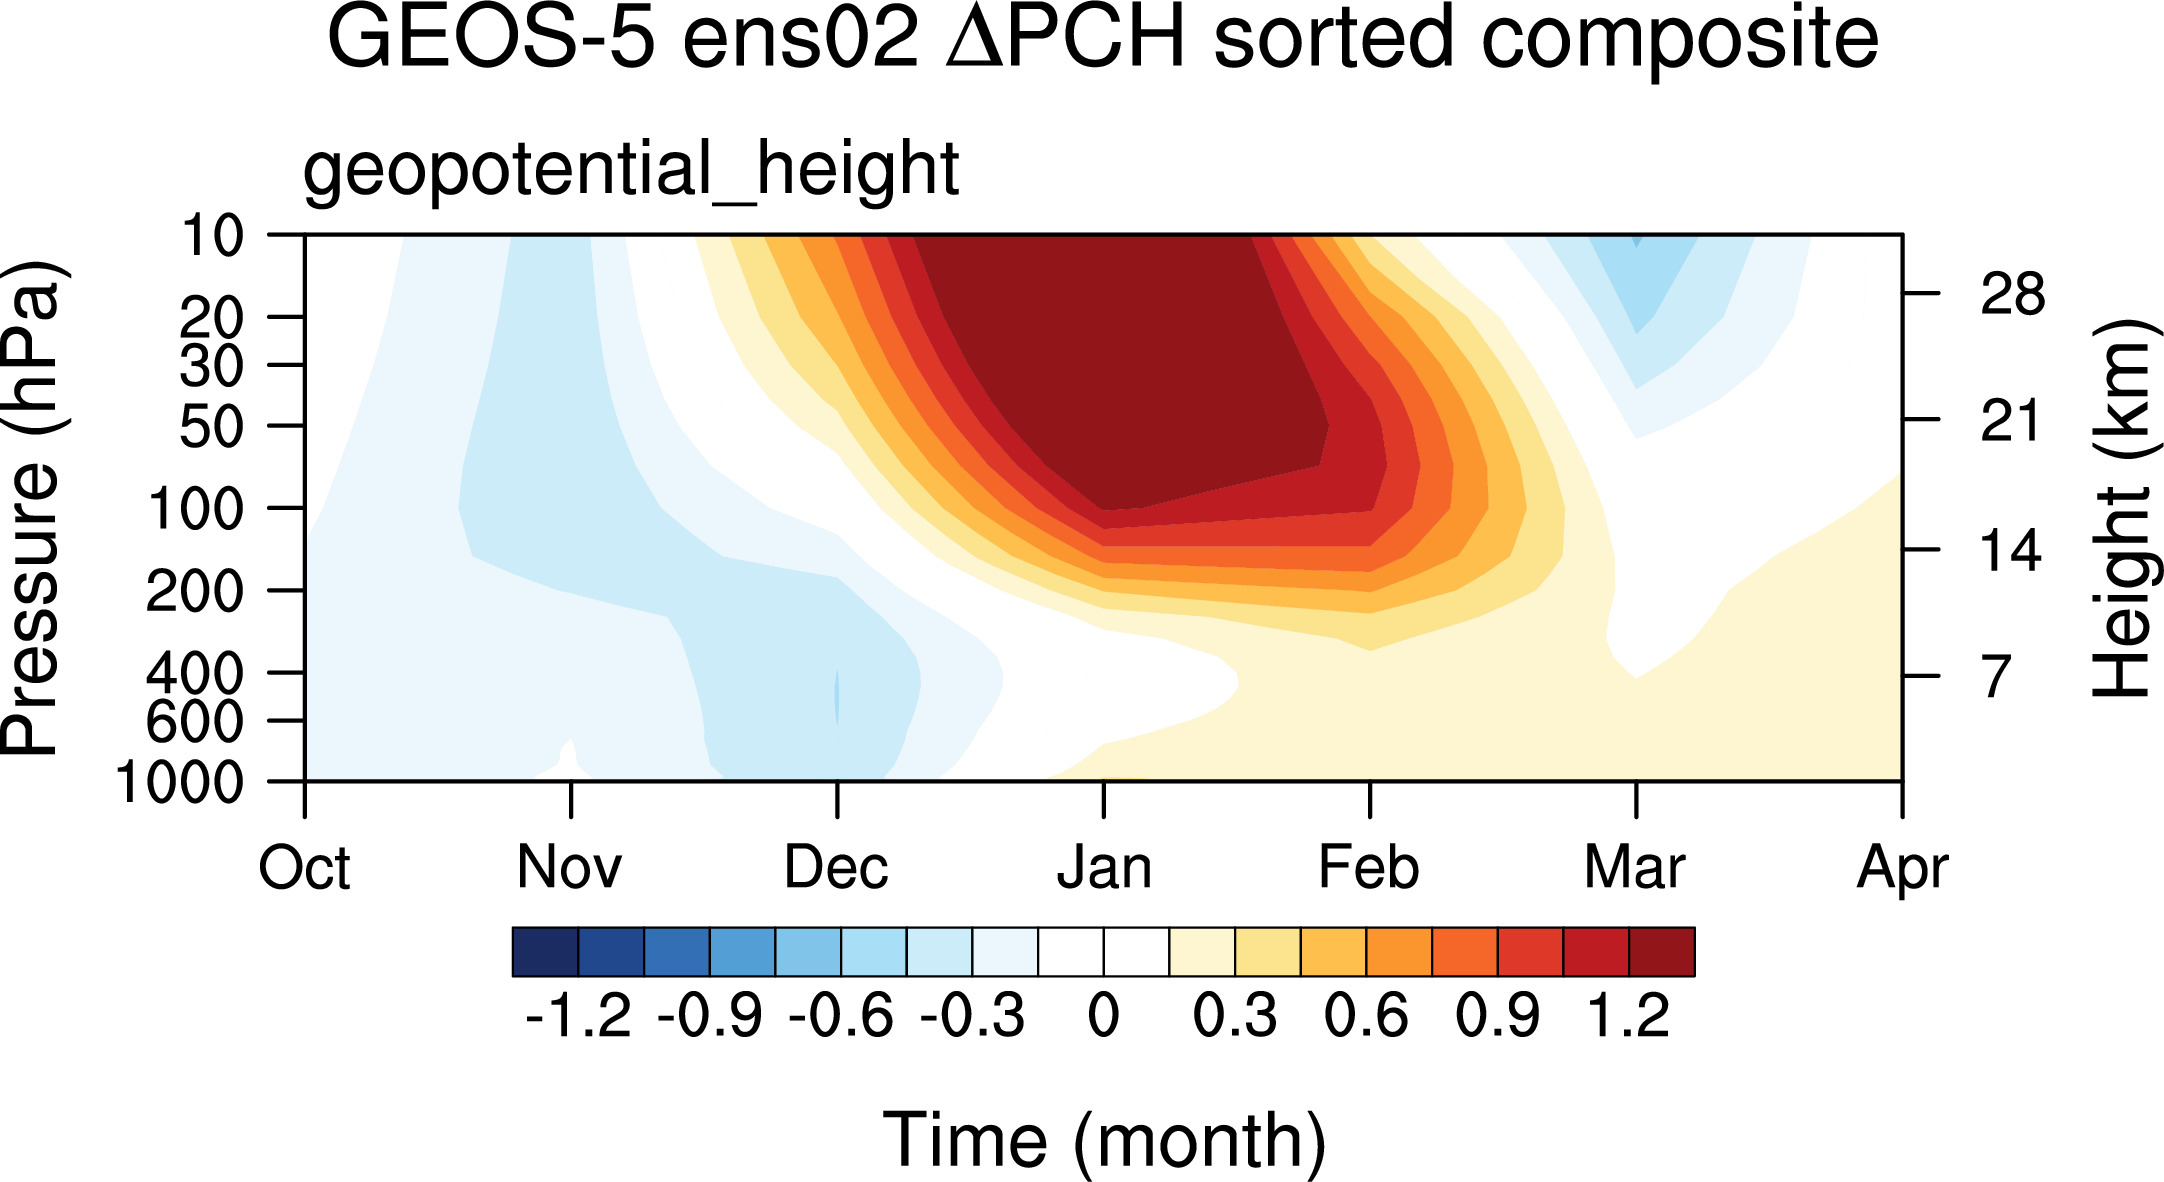
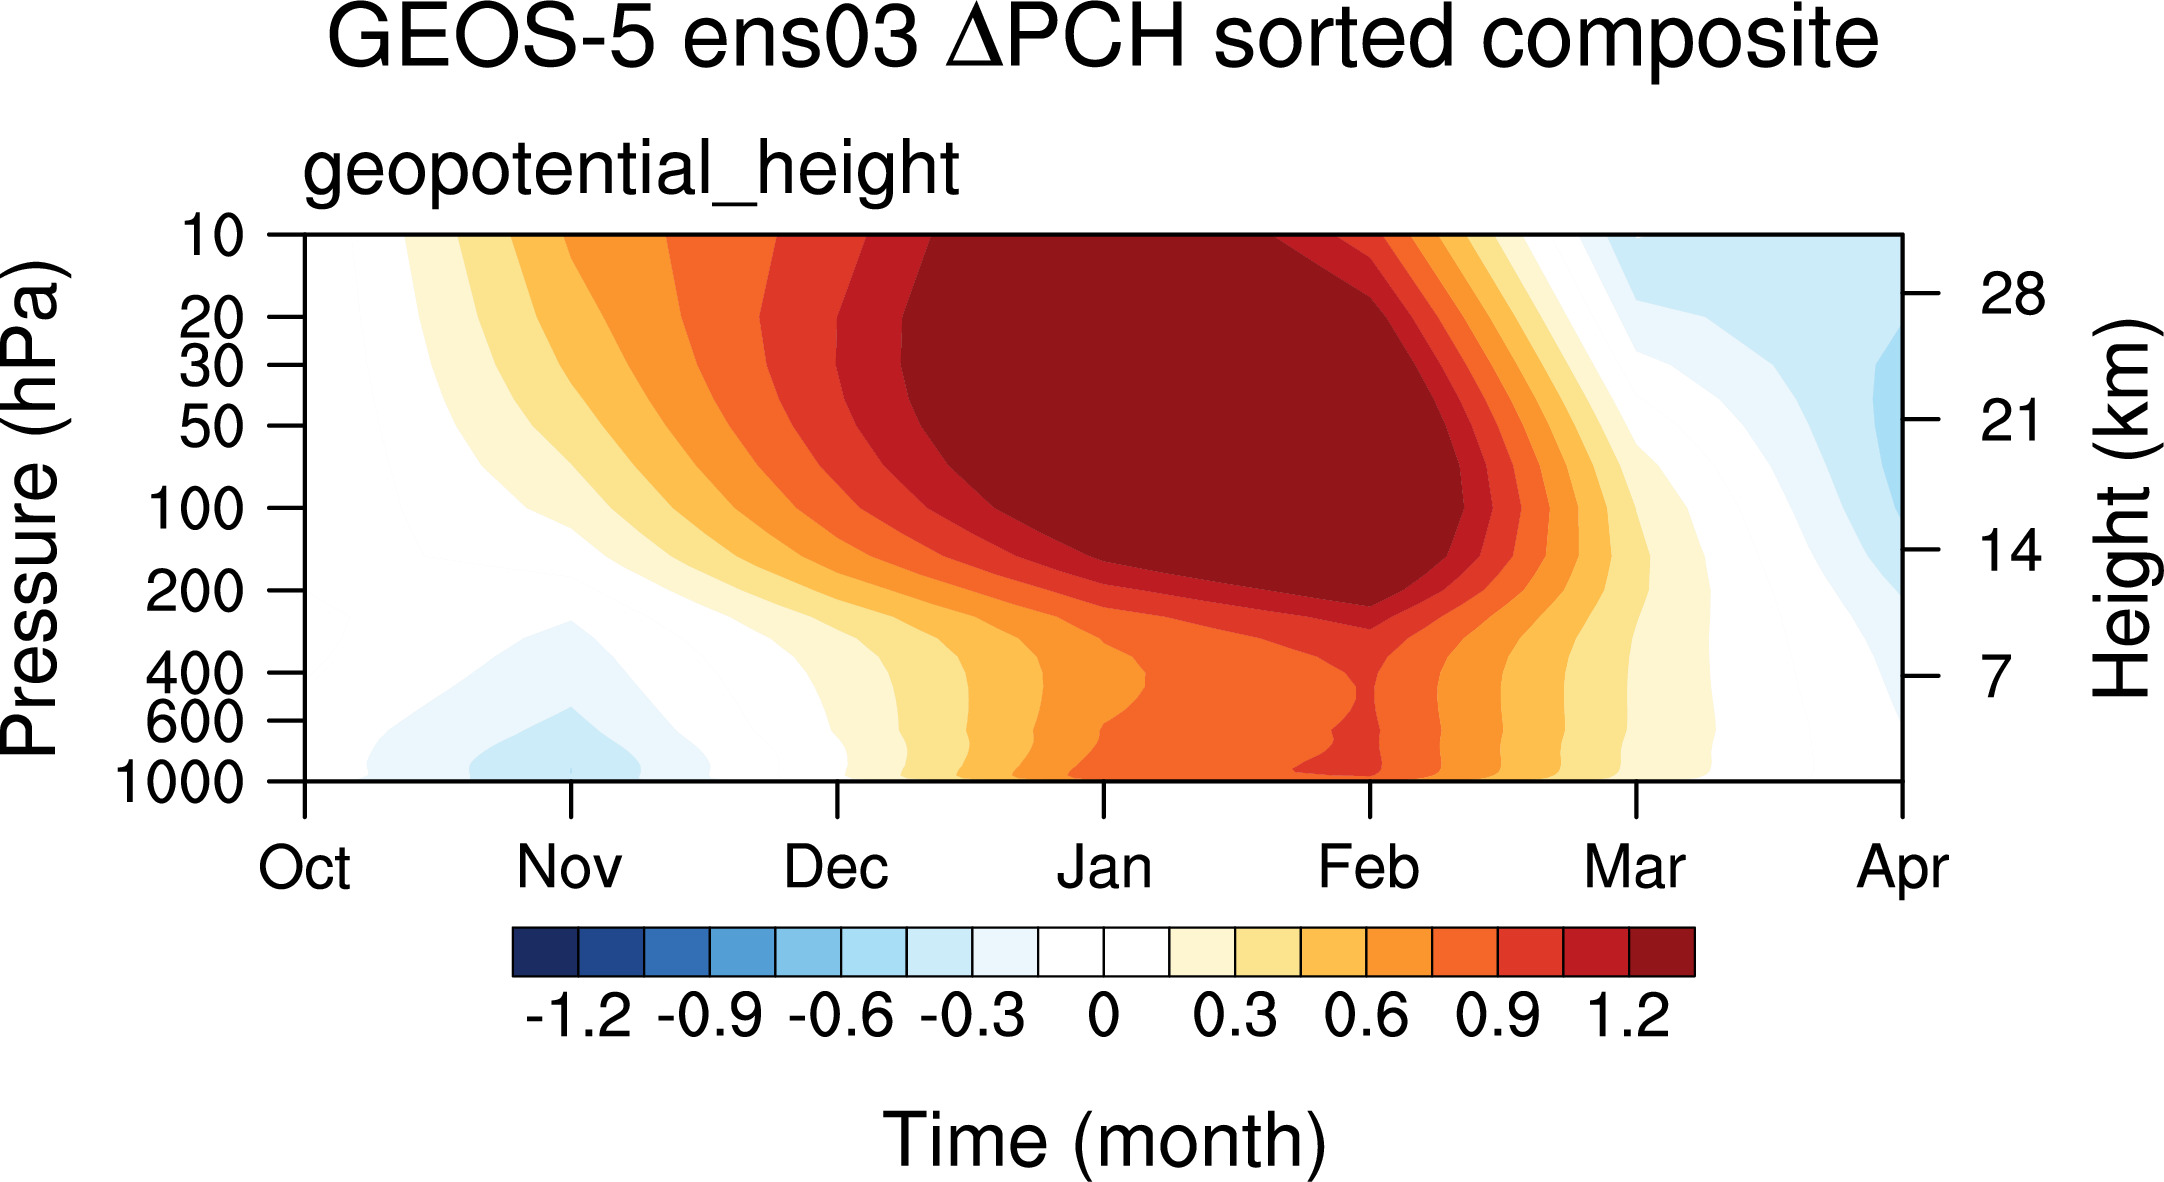
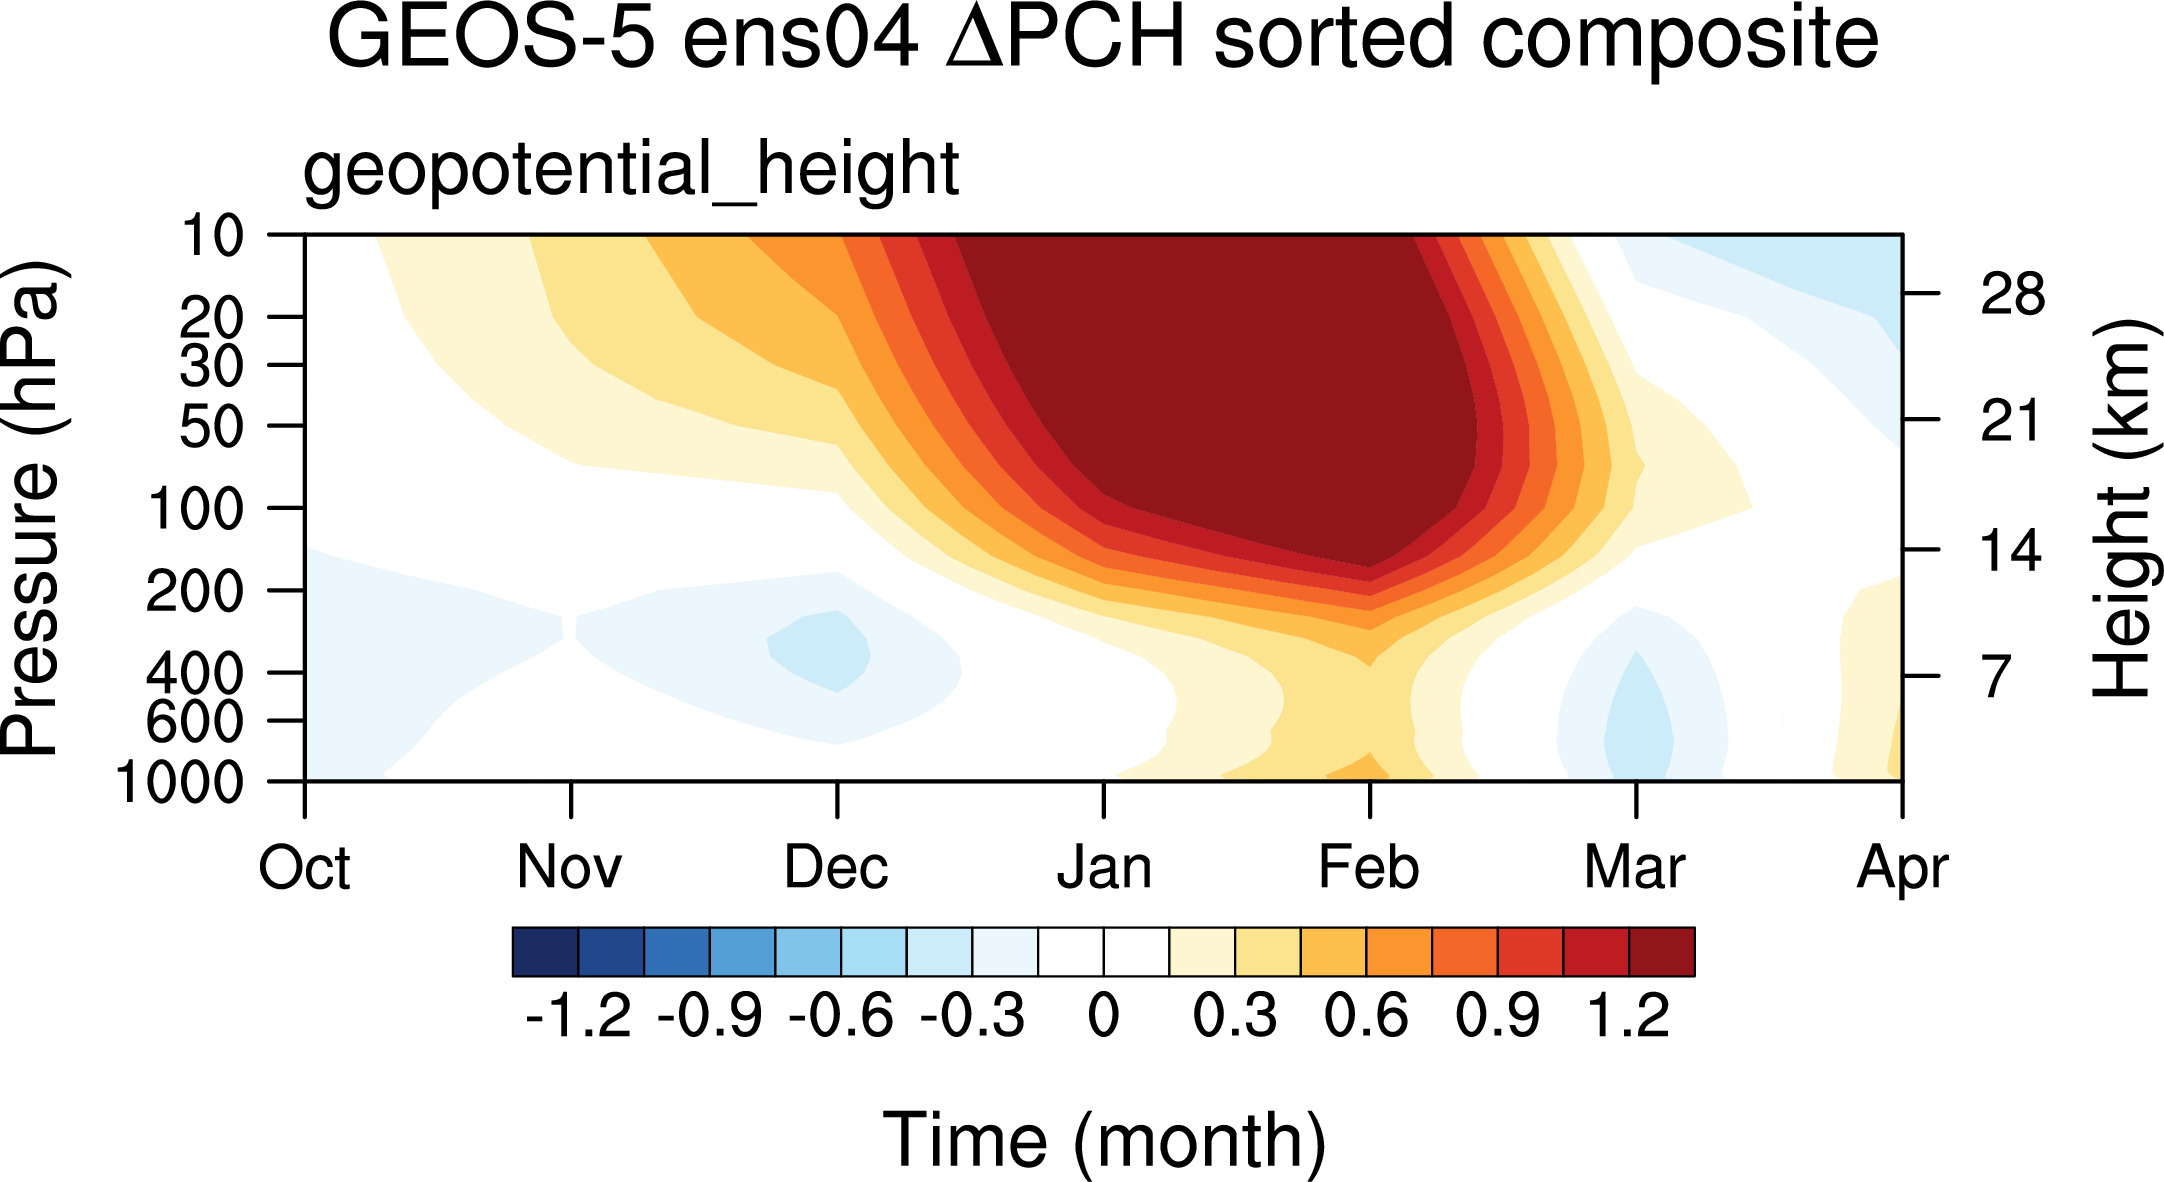
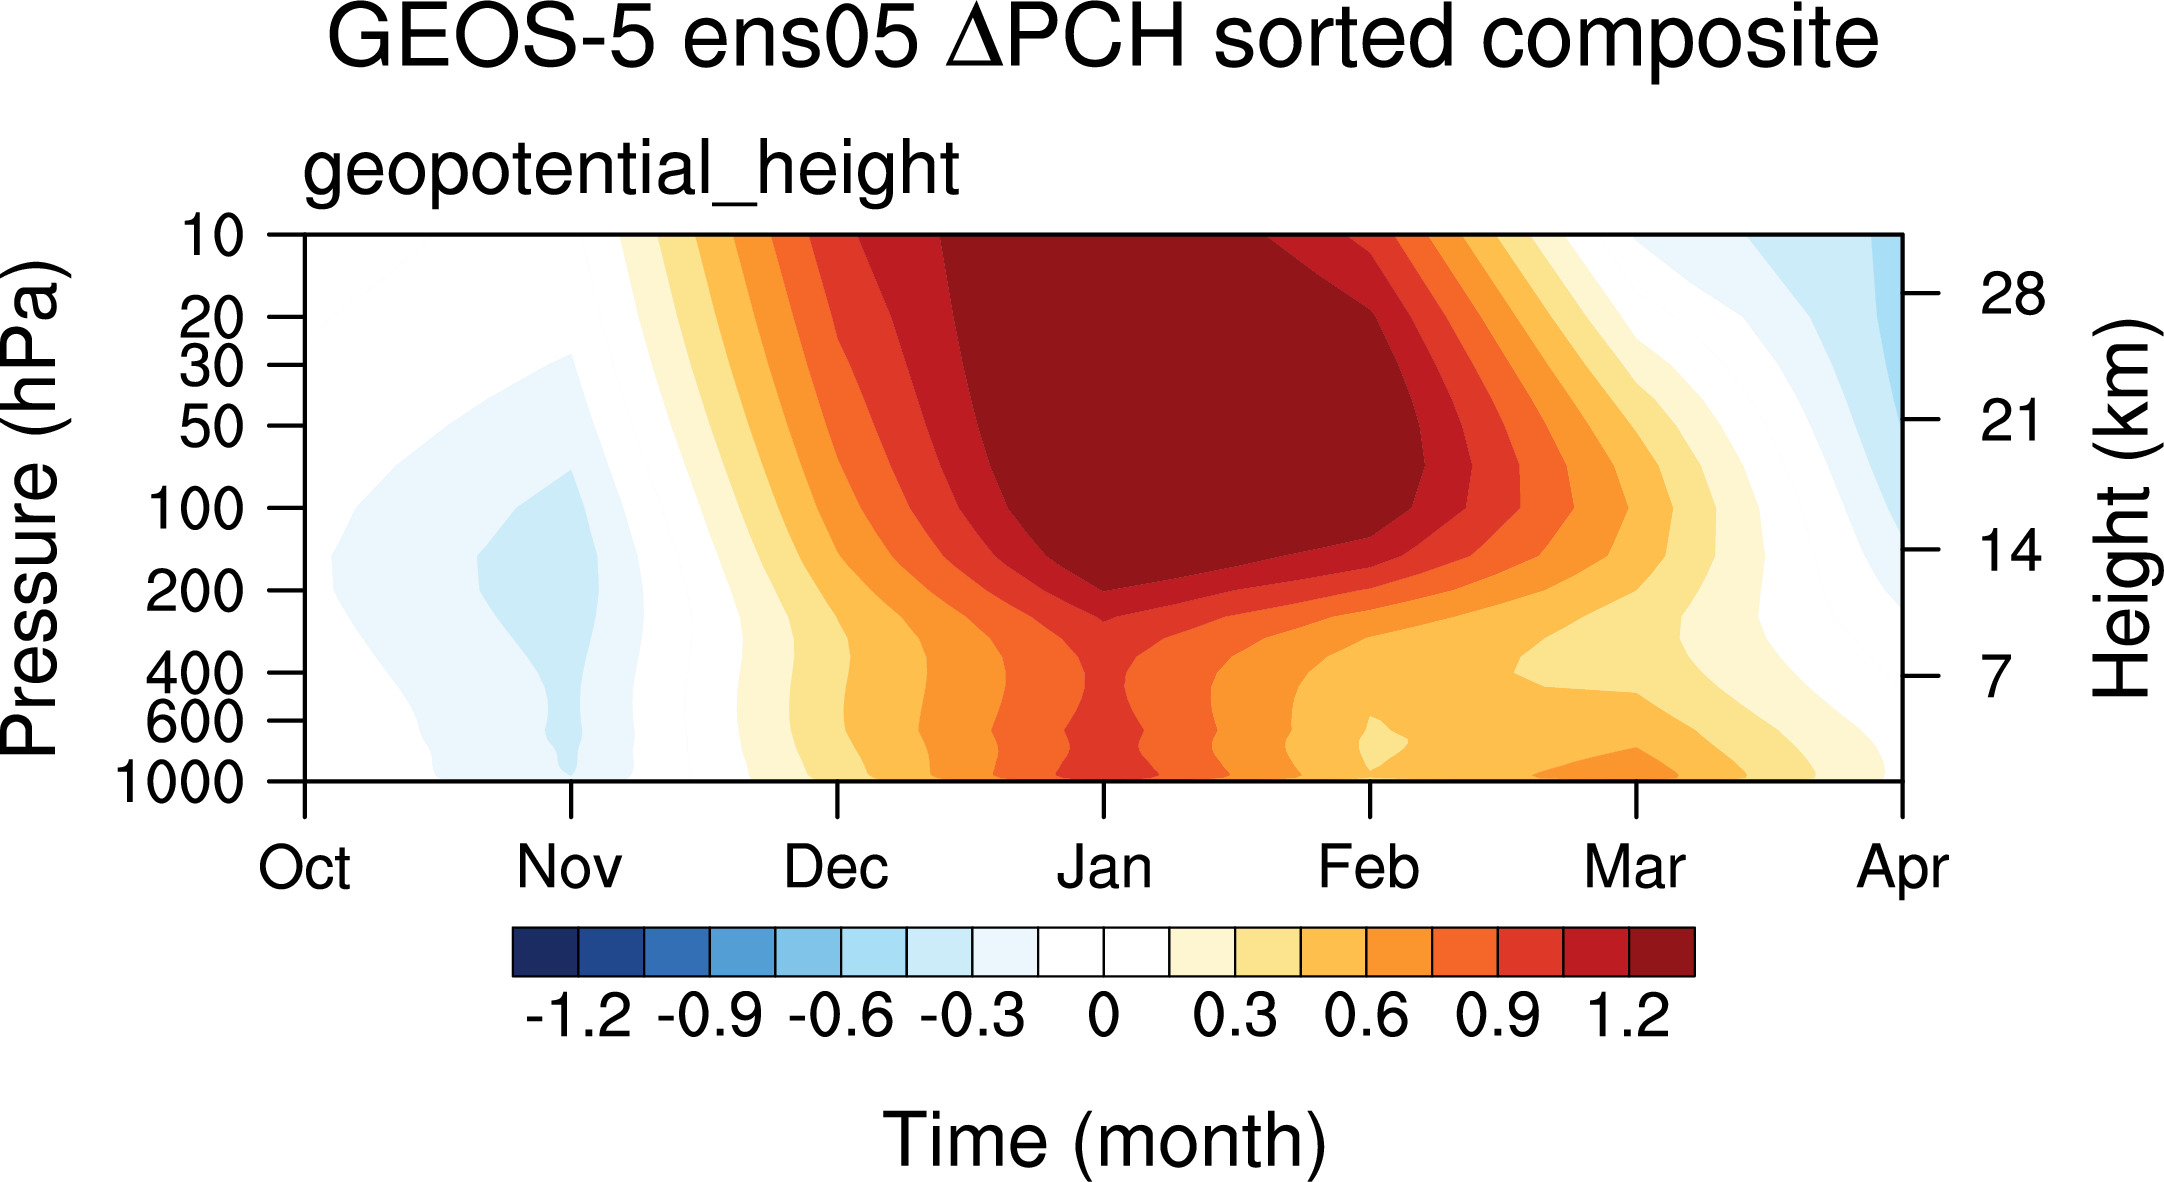
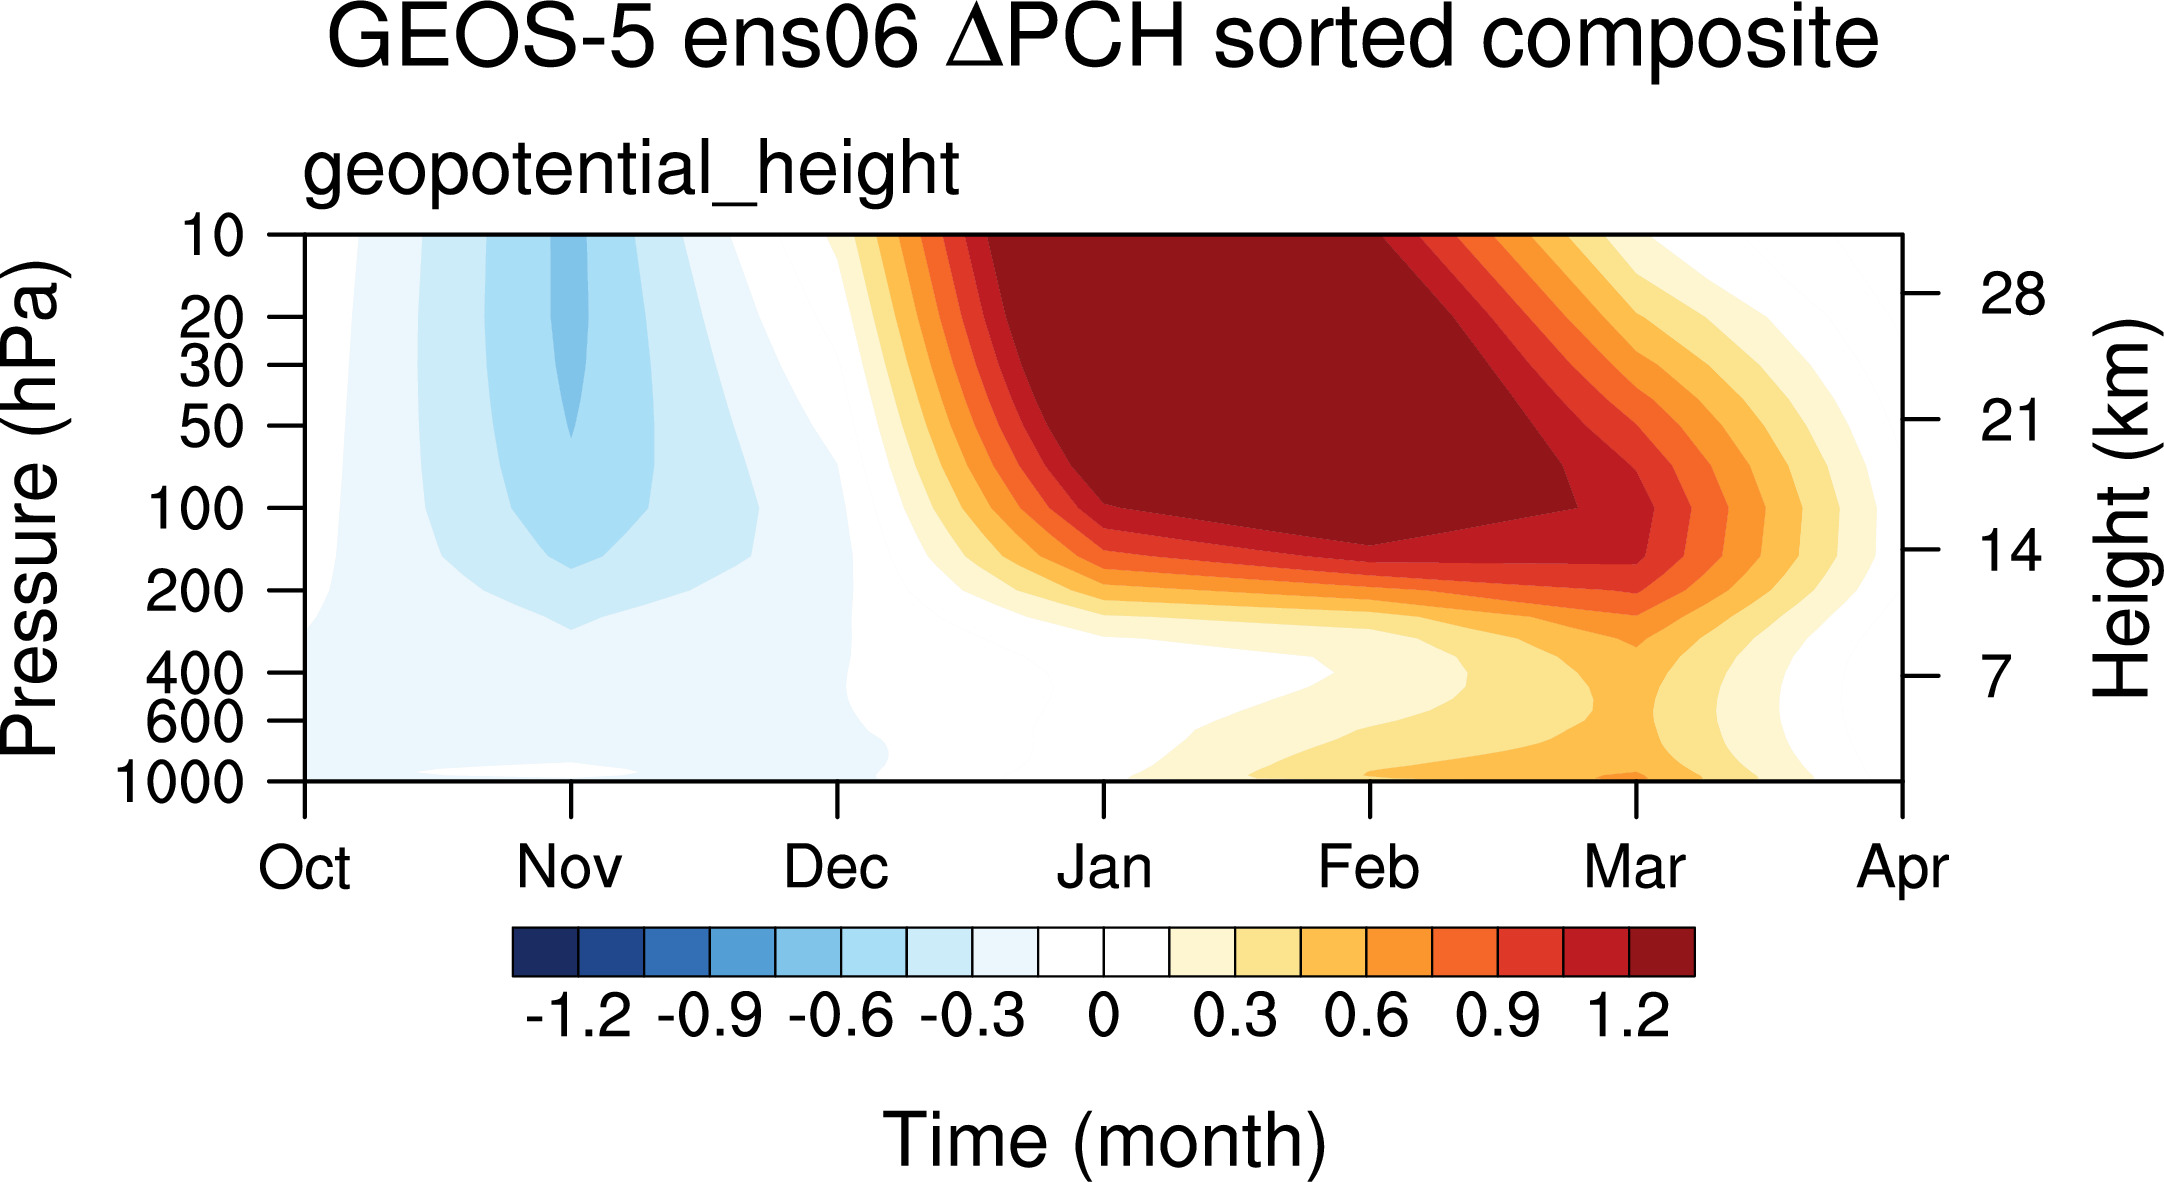
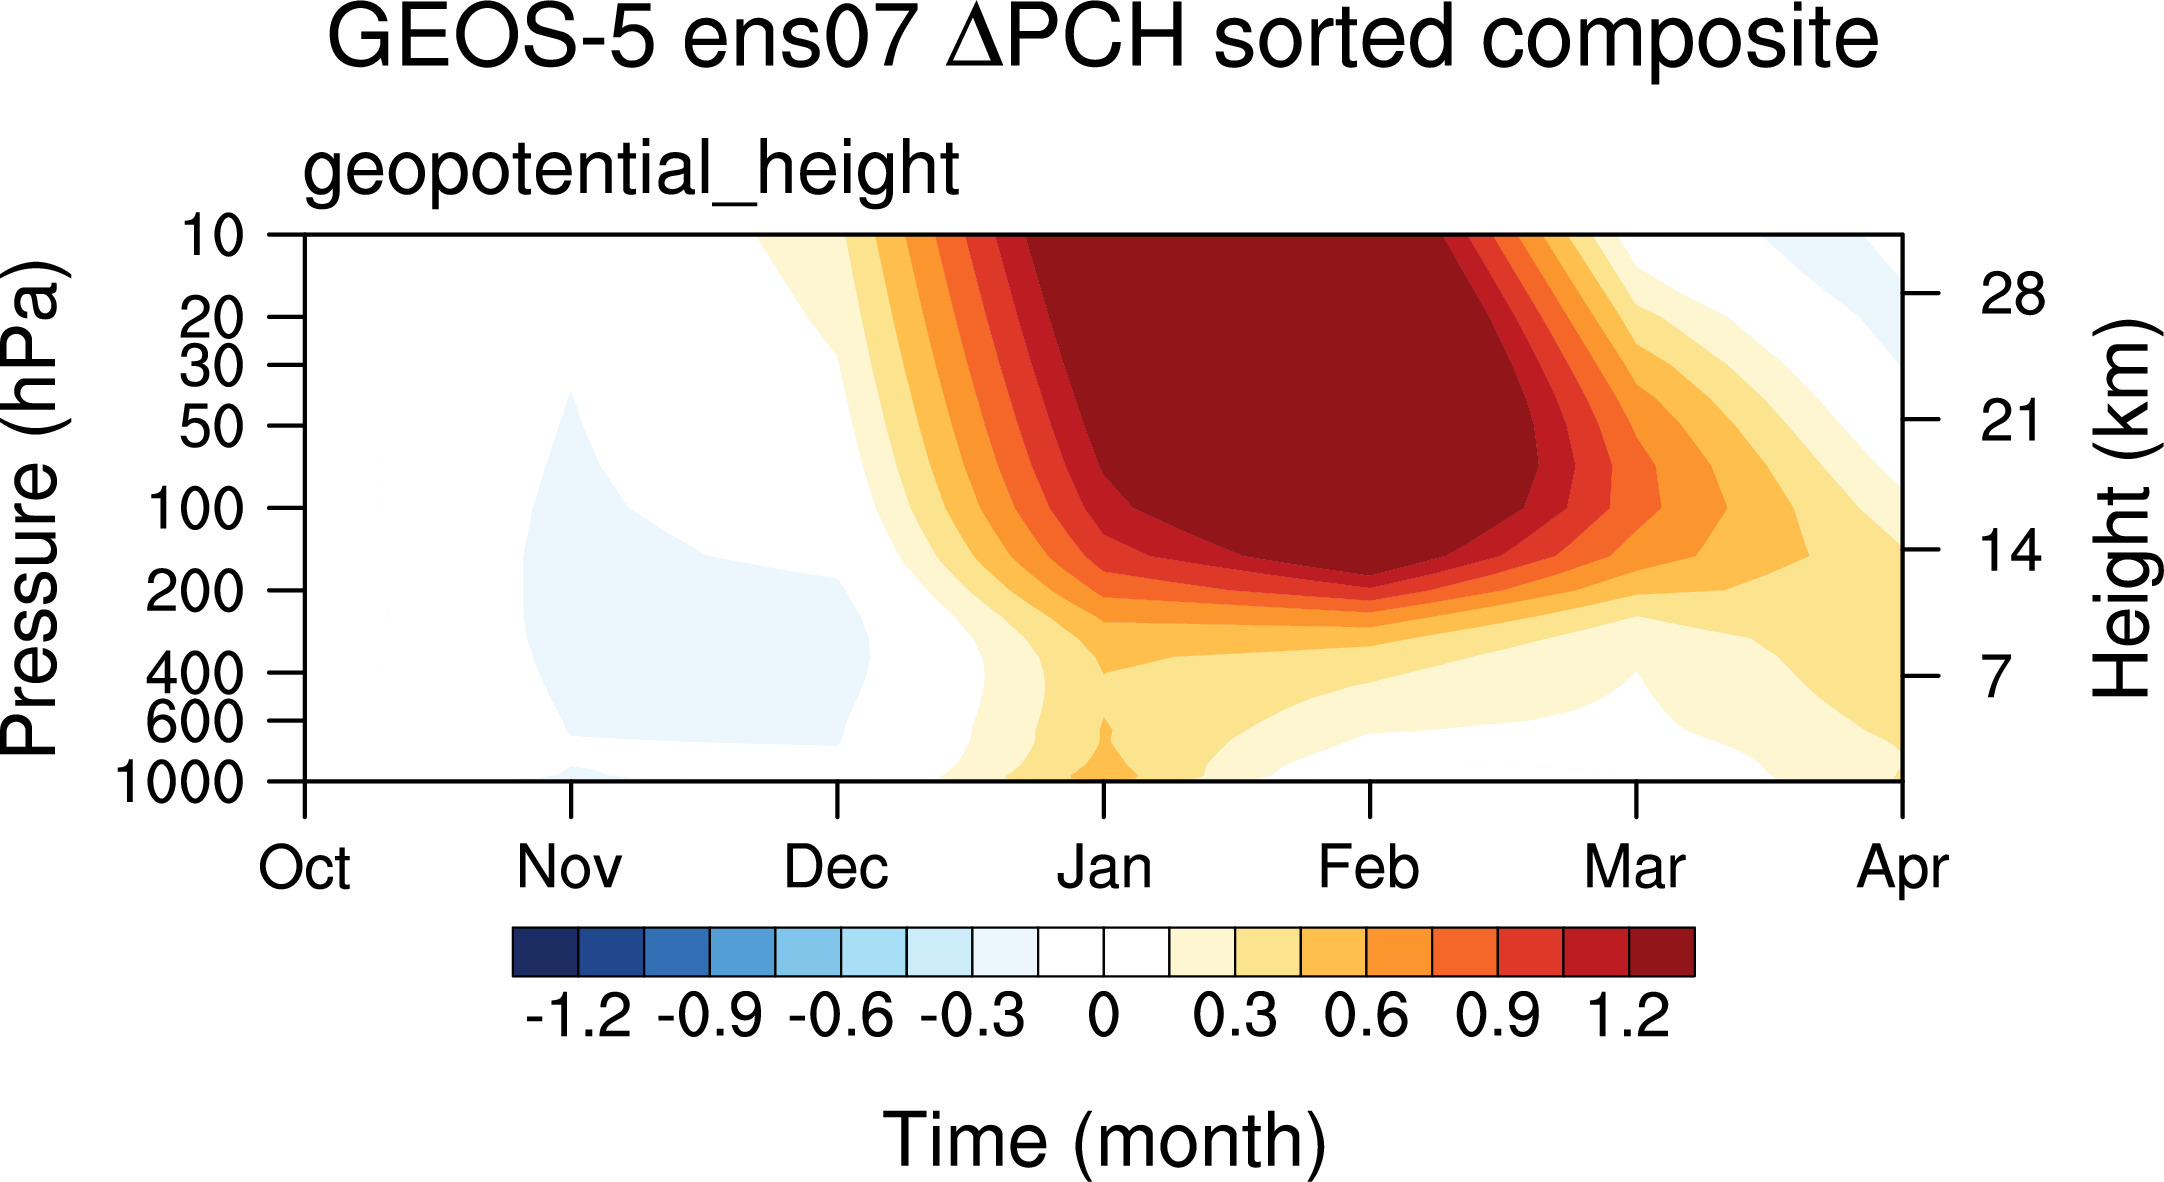
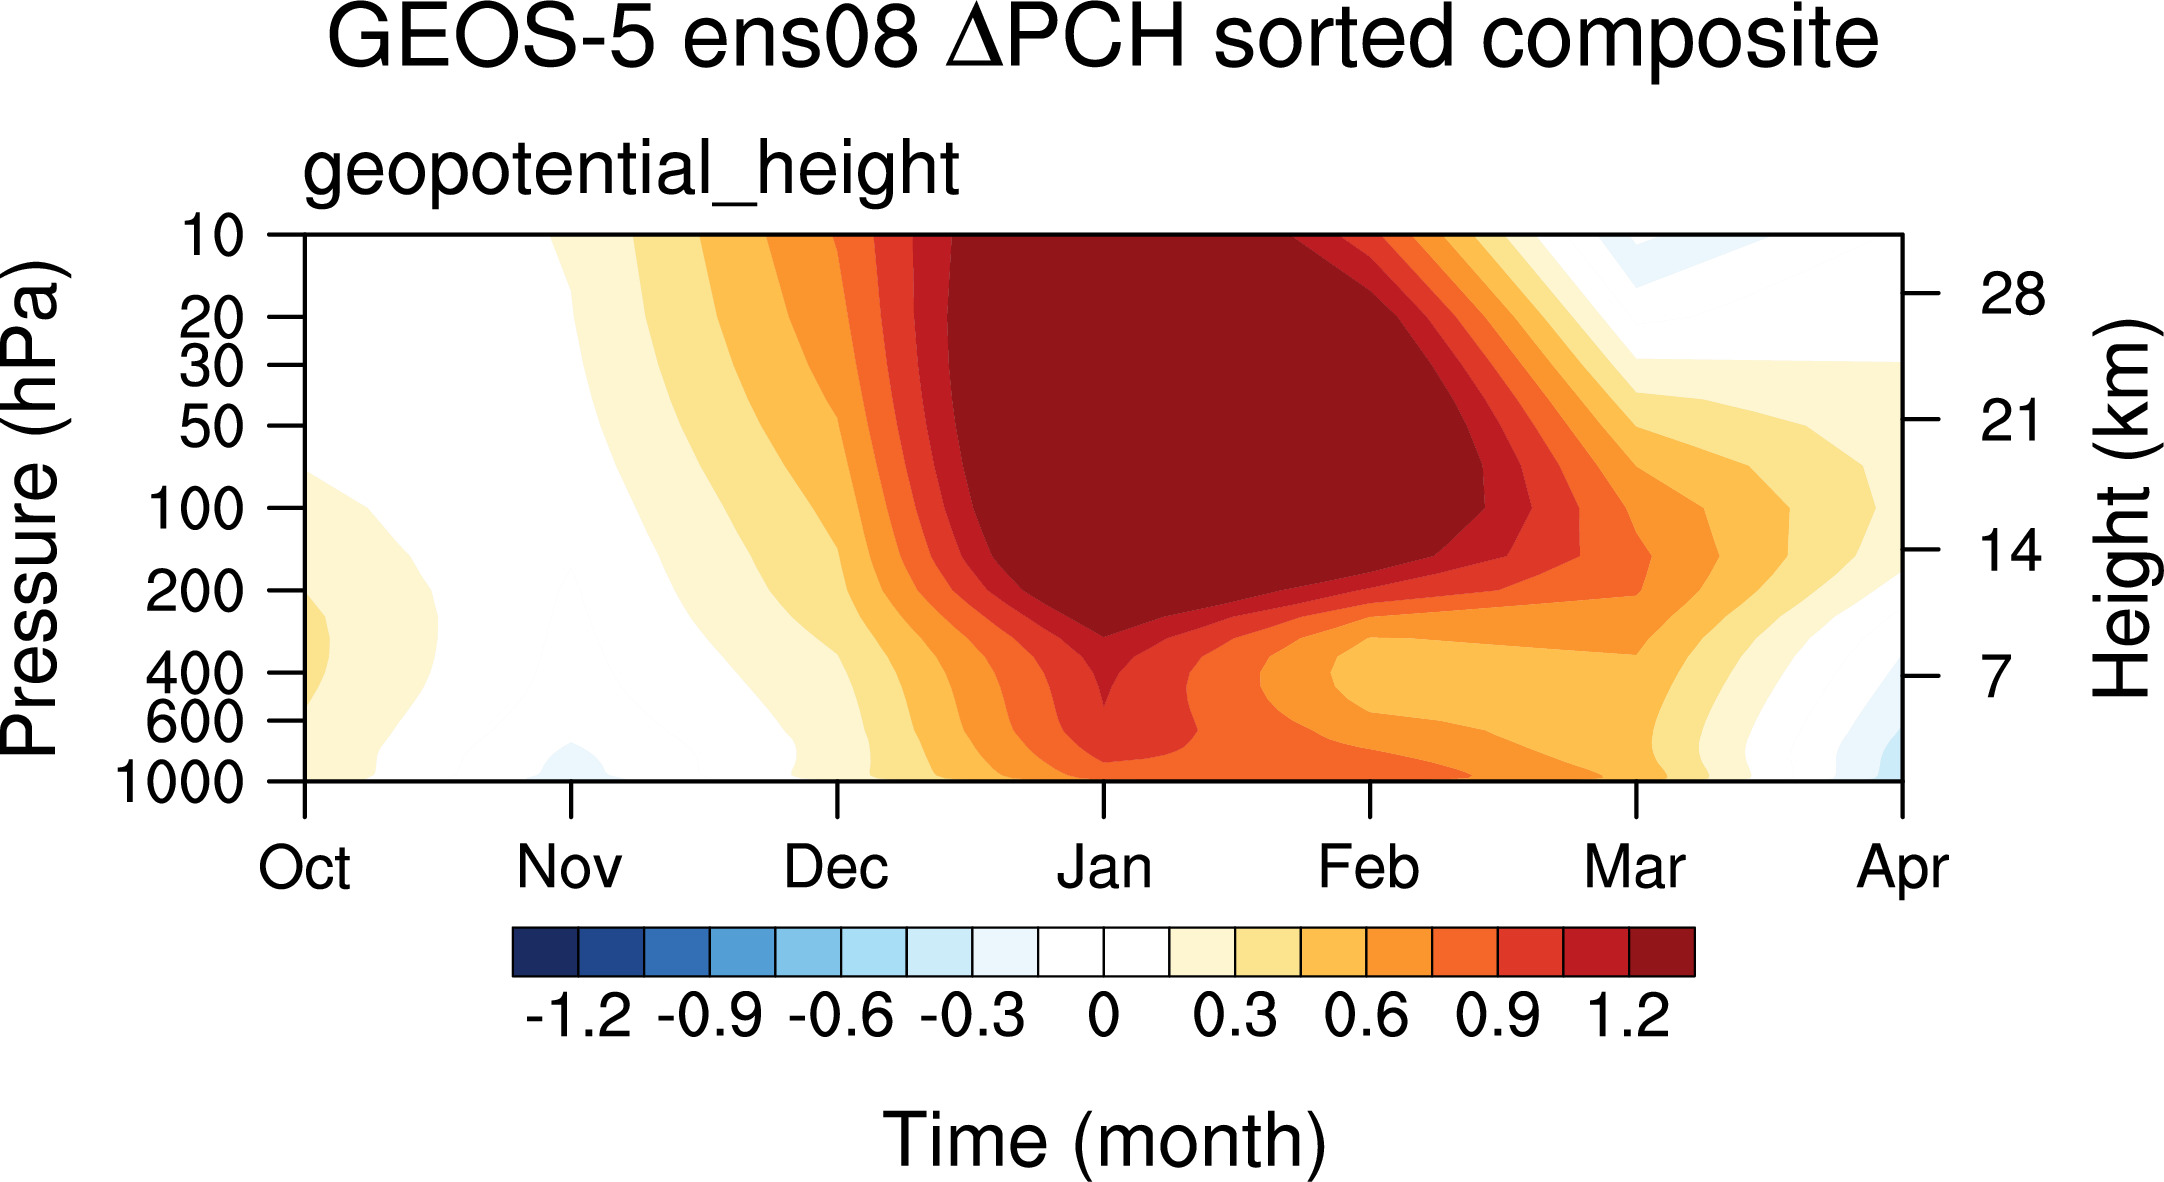
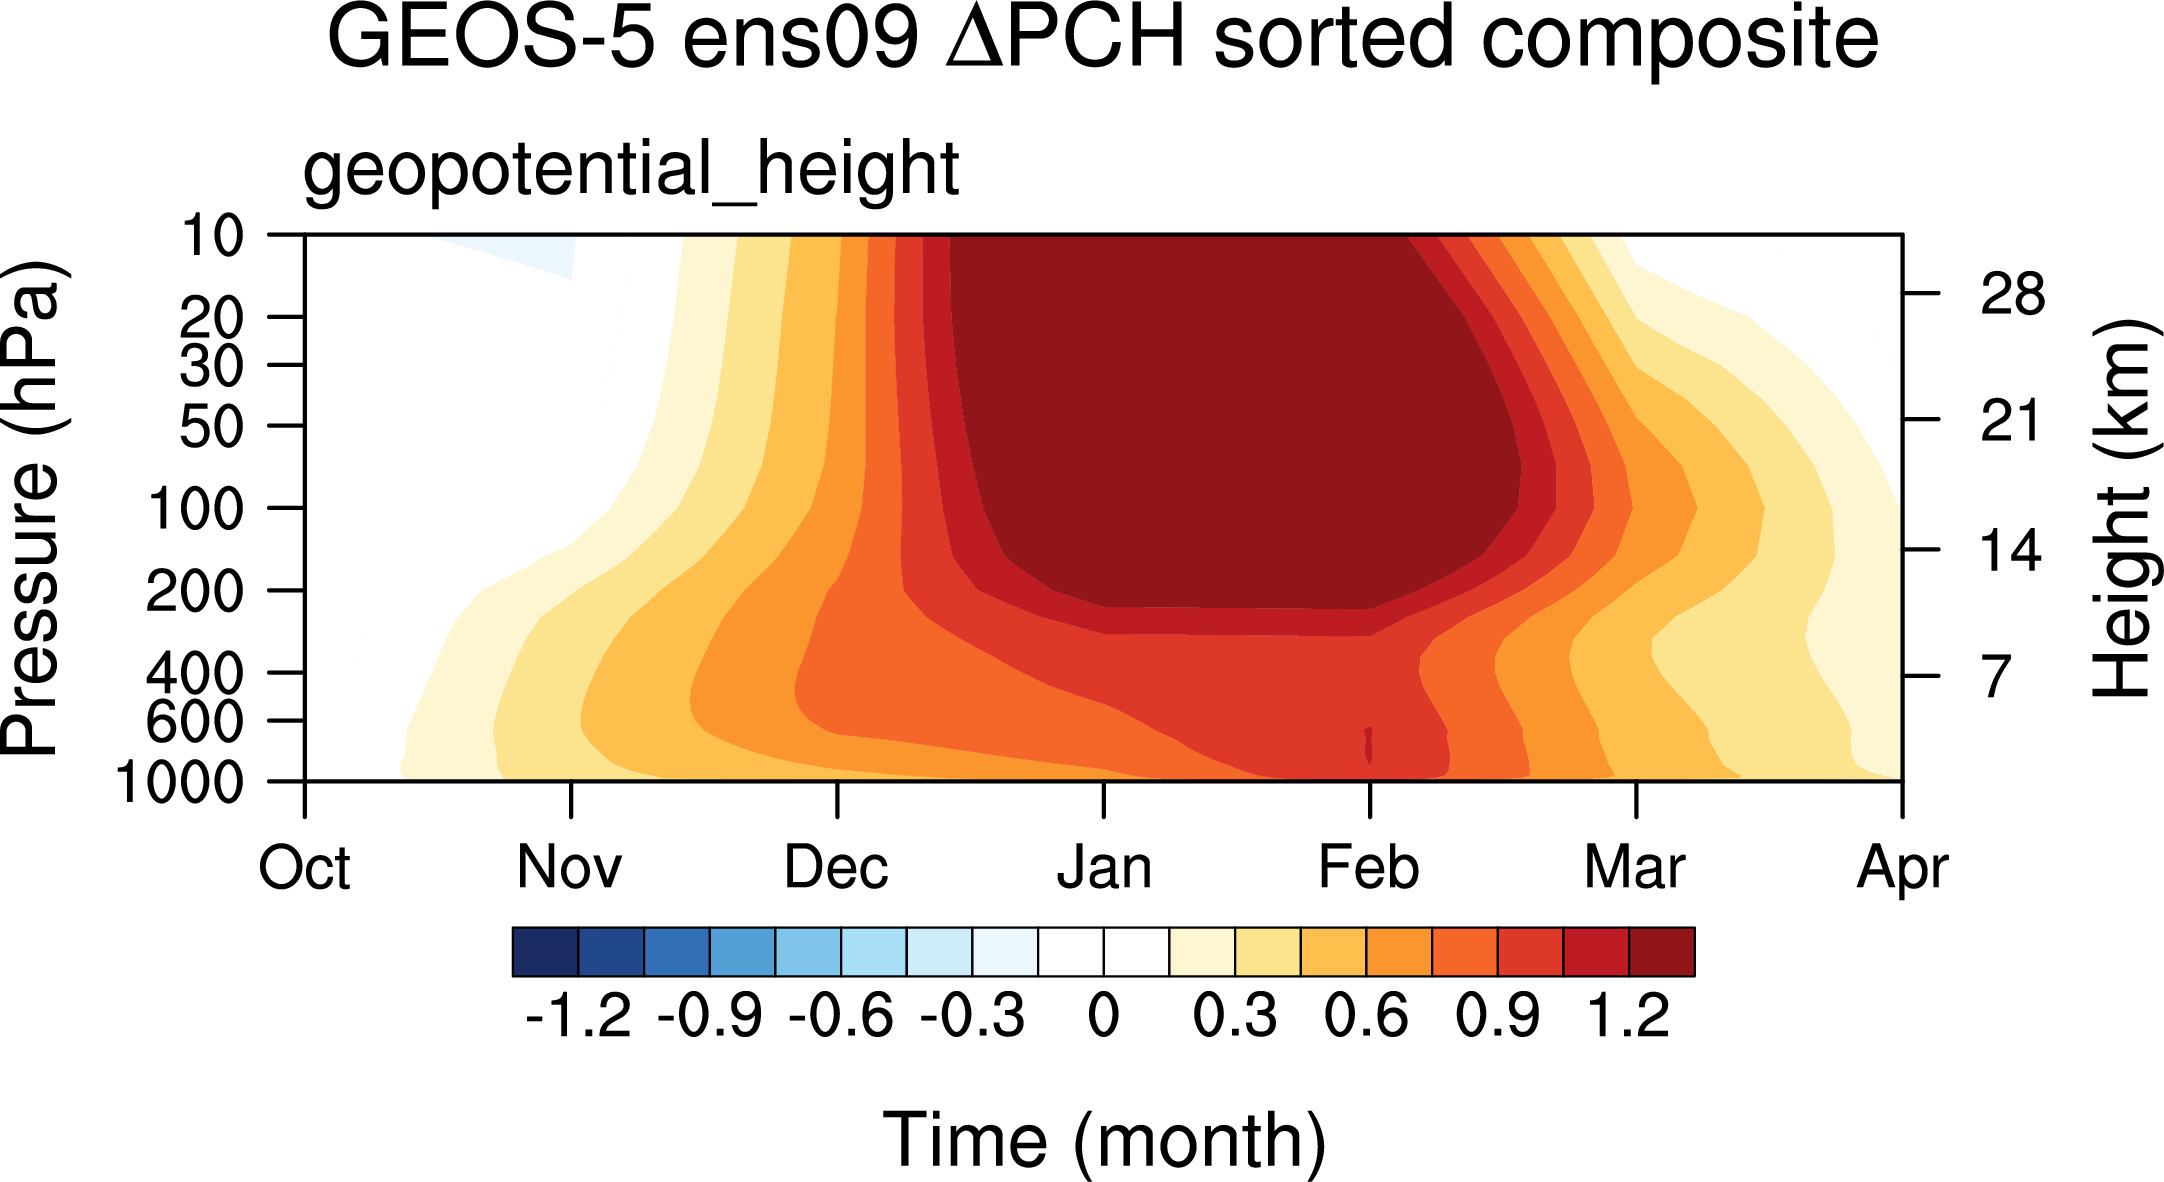
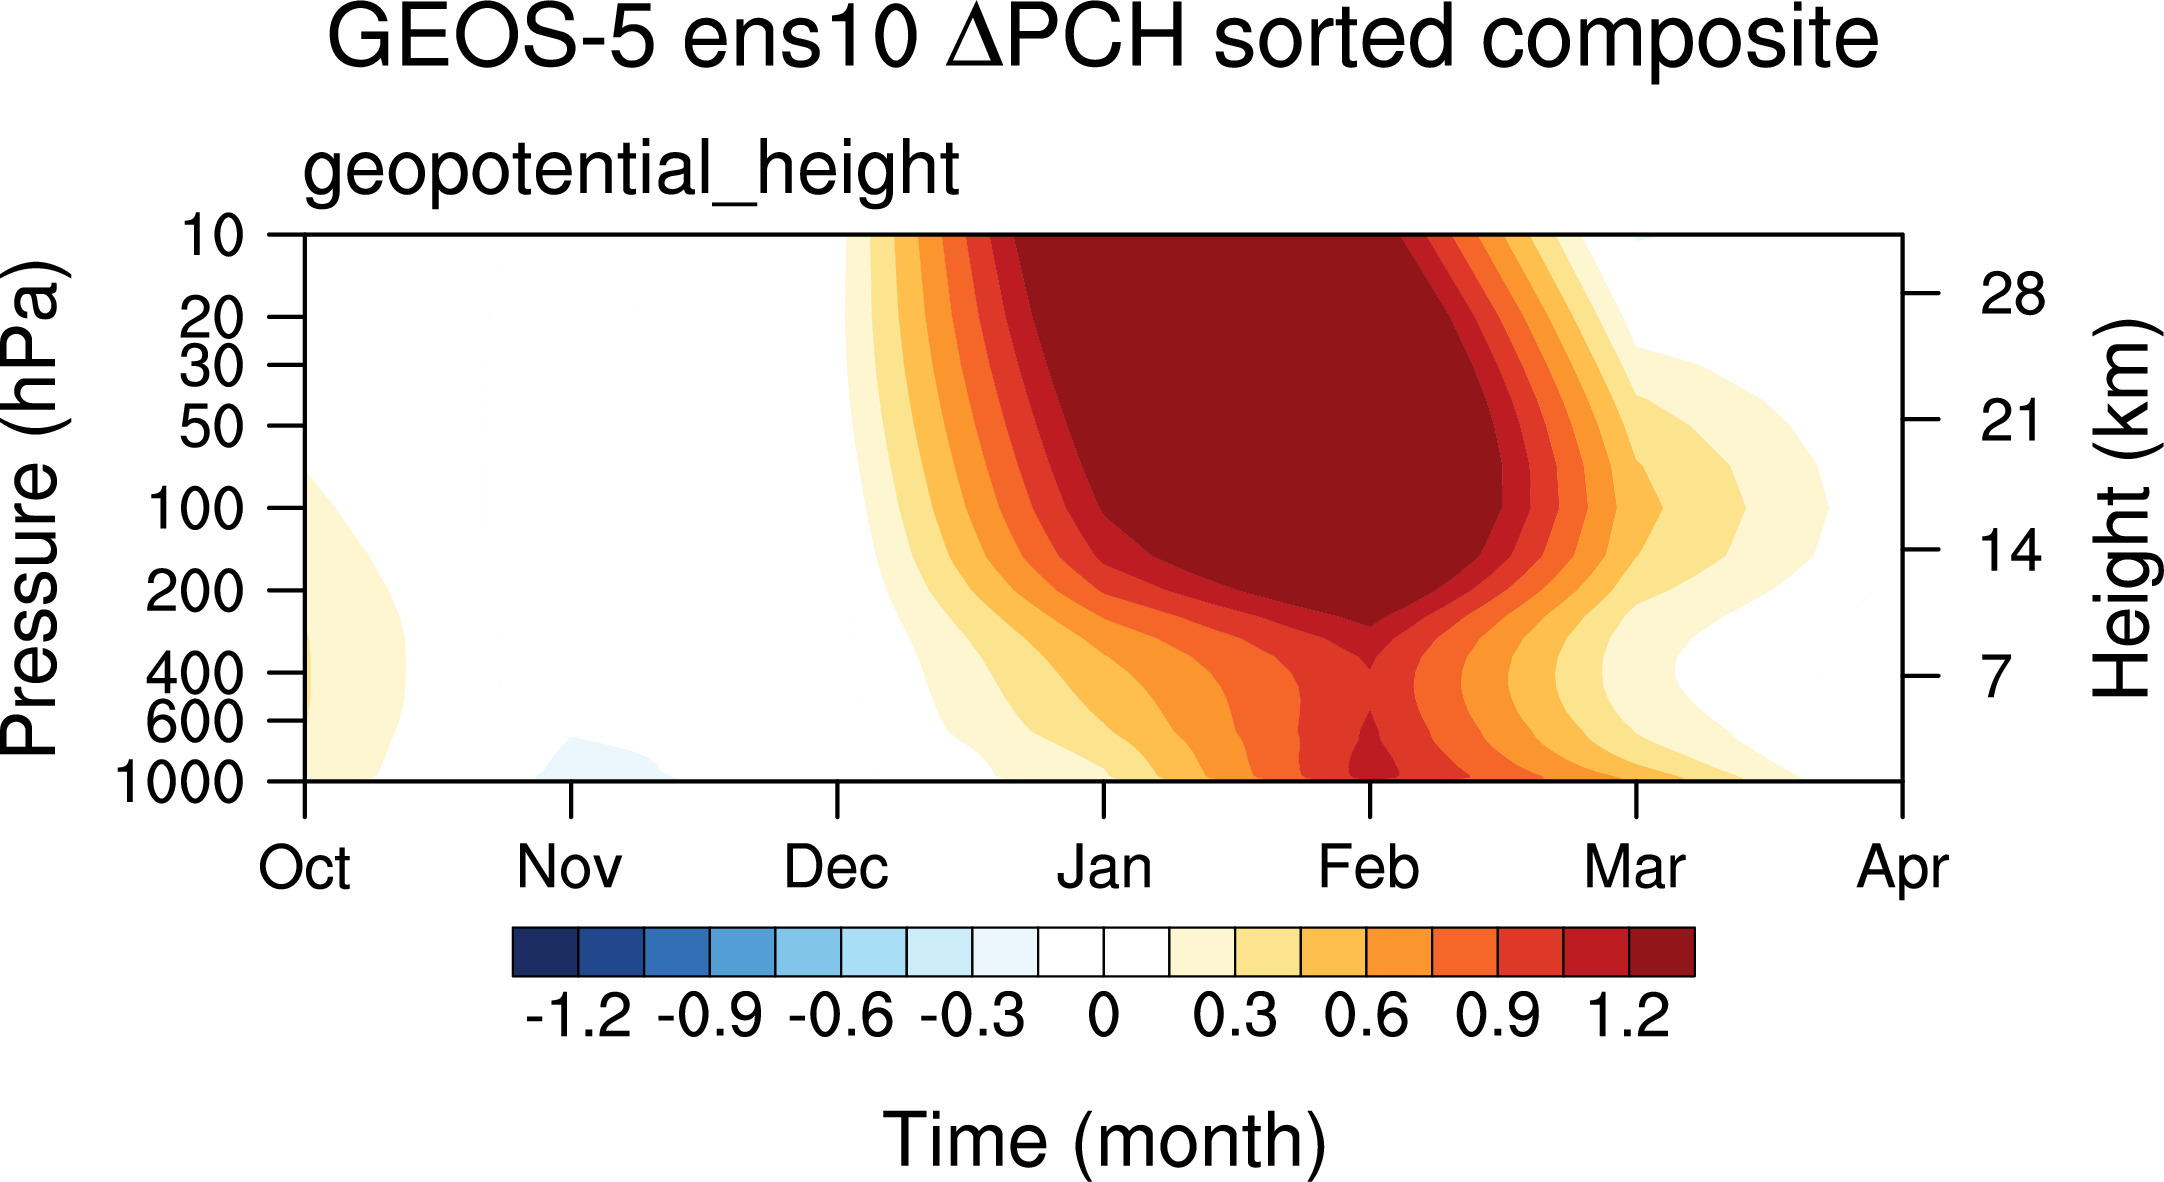
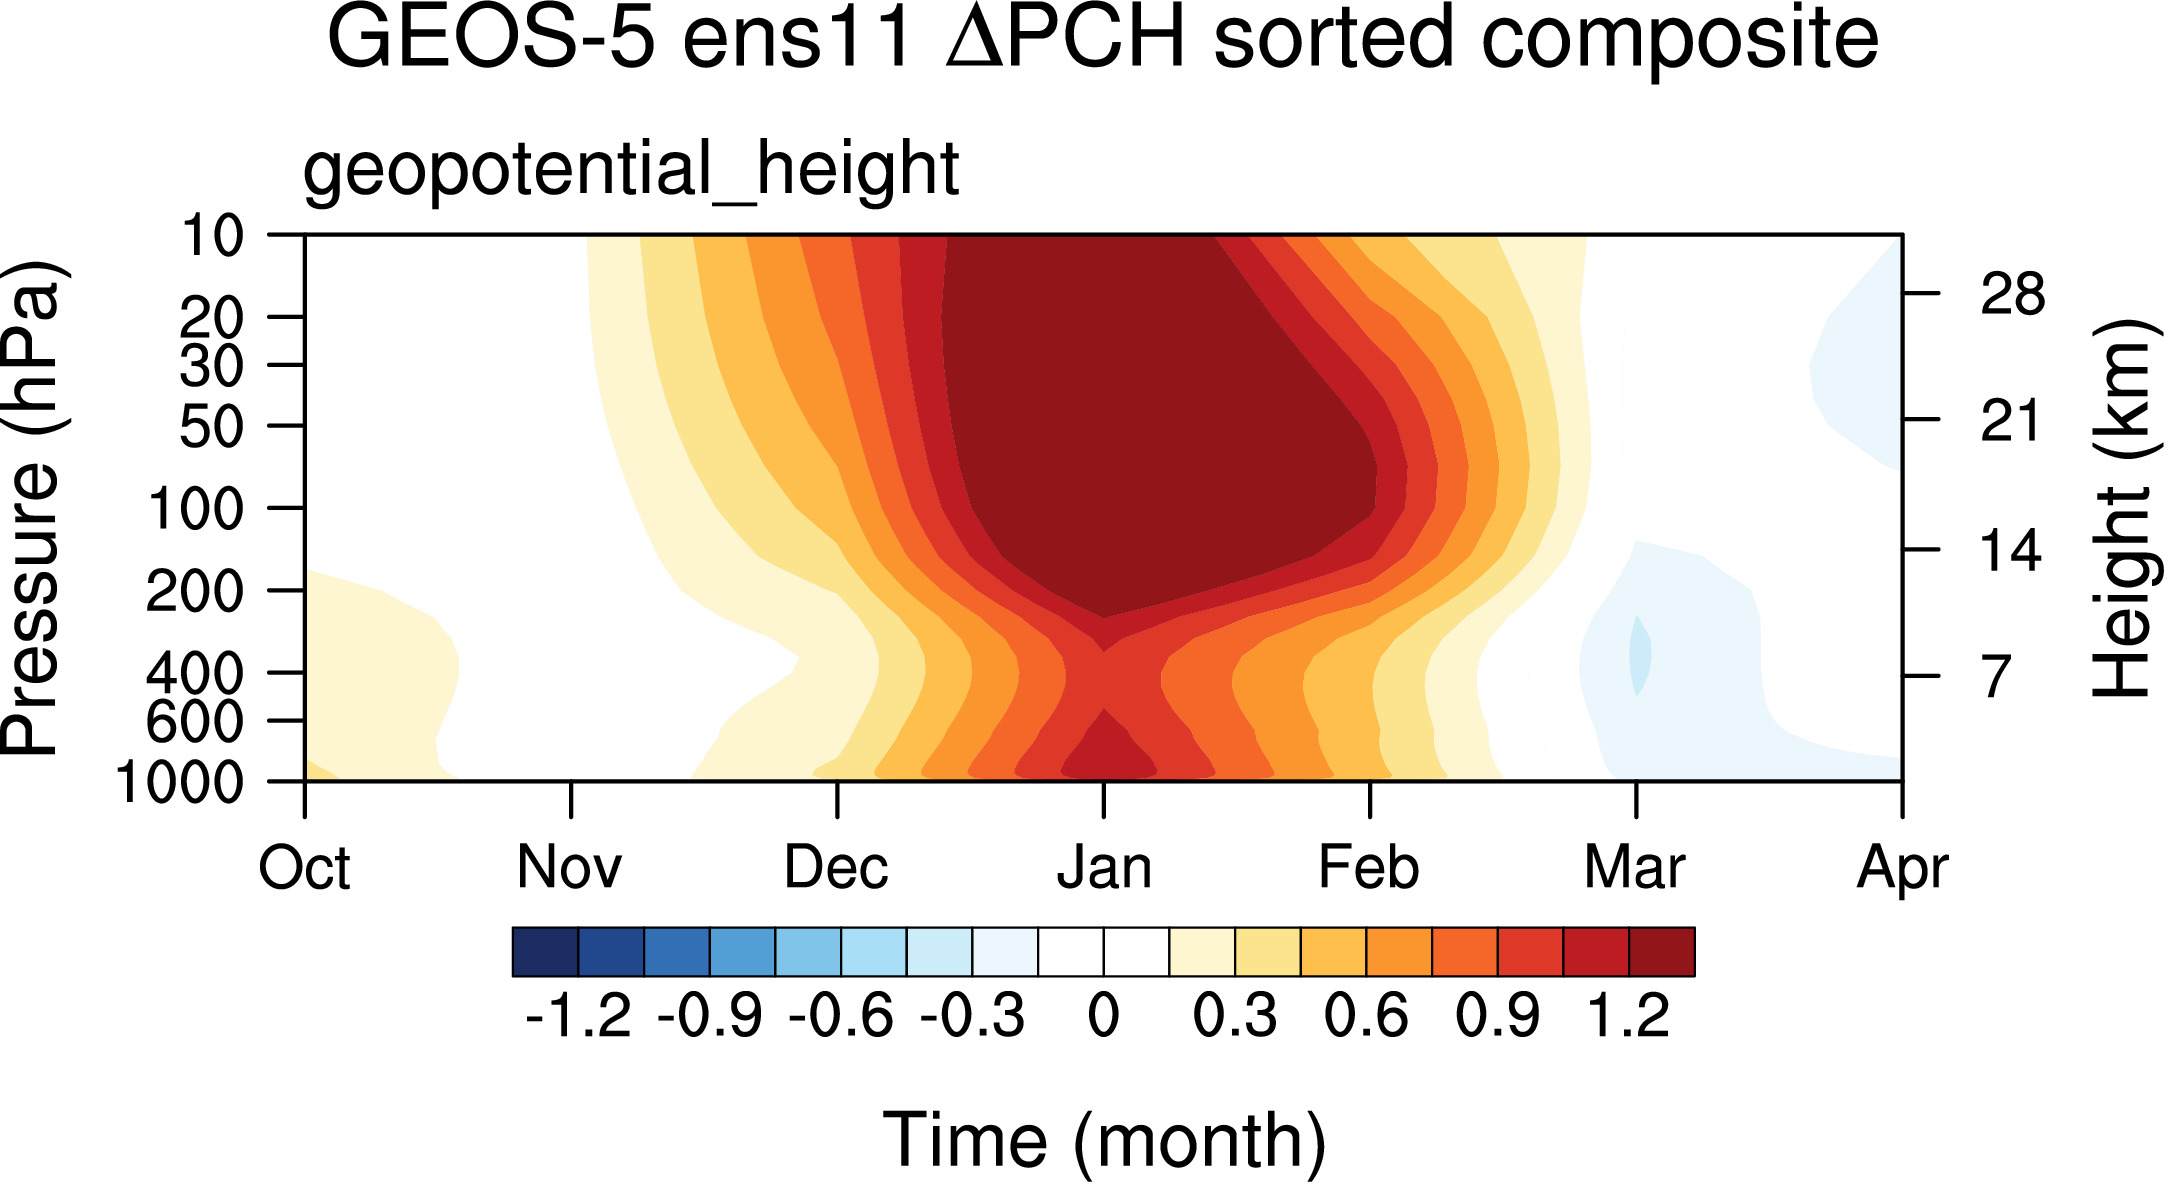
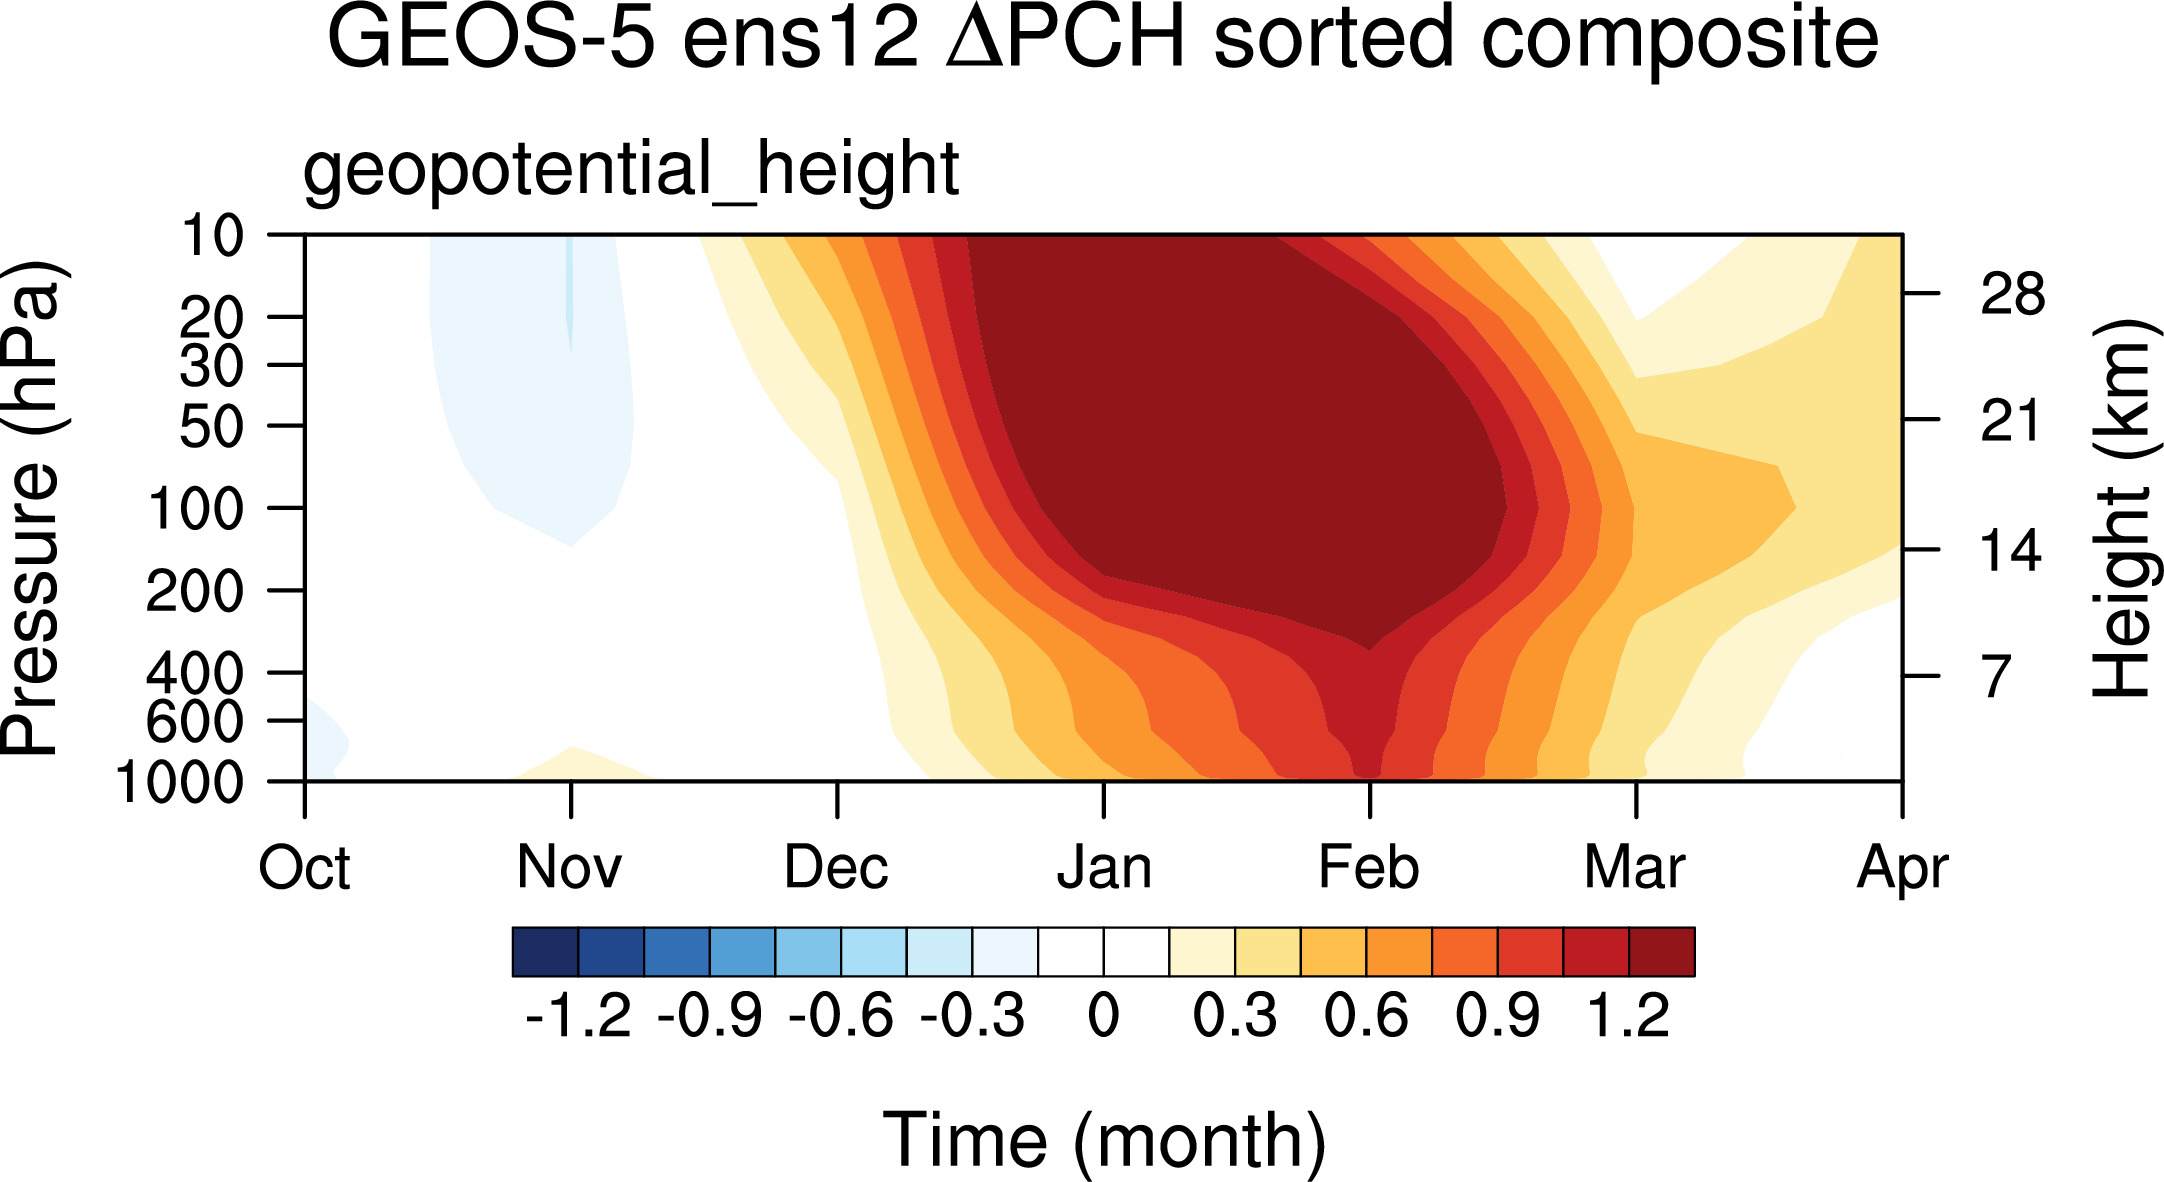
 GEOS-5
Ensemble mean:
Individual Runs:
Individual Years here
-----
Special case Sorted on largest values of Jan Feb mean at 50hPa
Ensemble mean:
Individual Runs:
-------------------------------------------------------------------------------
-----------------------------
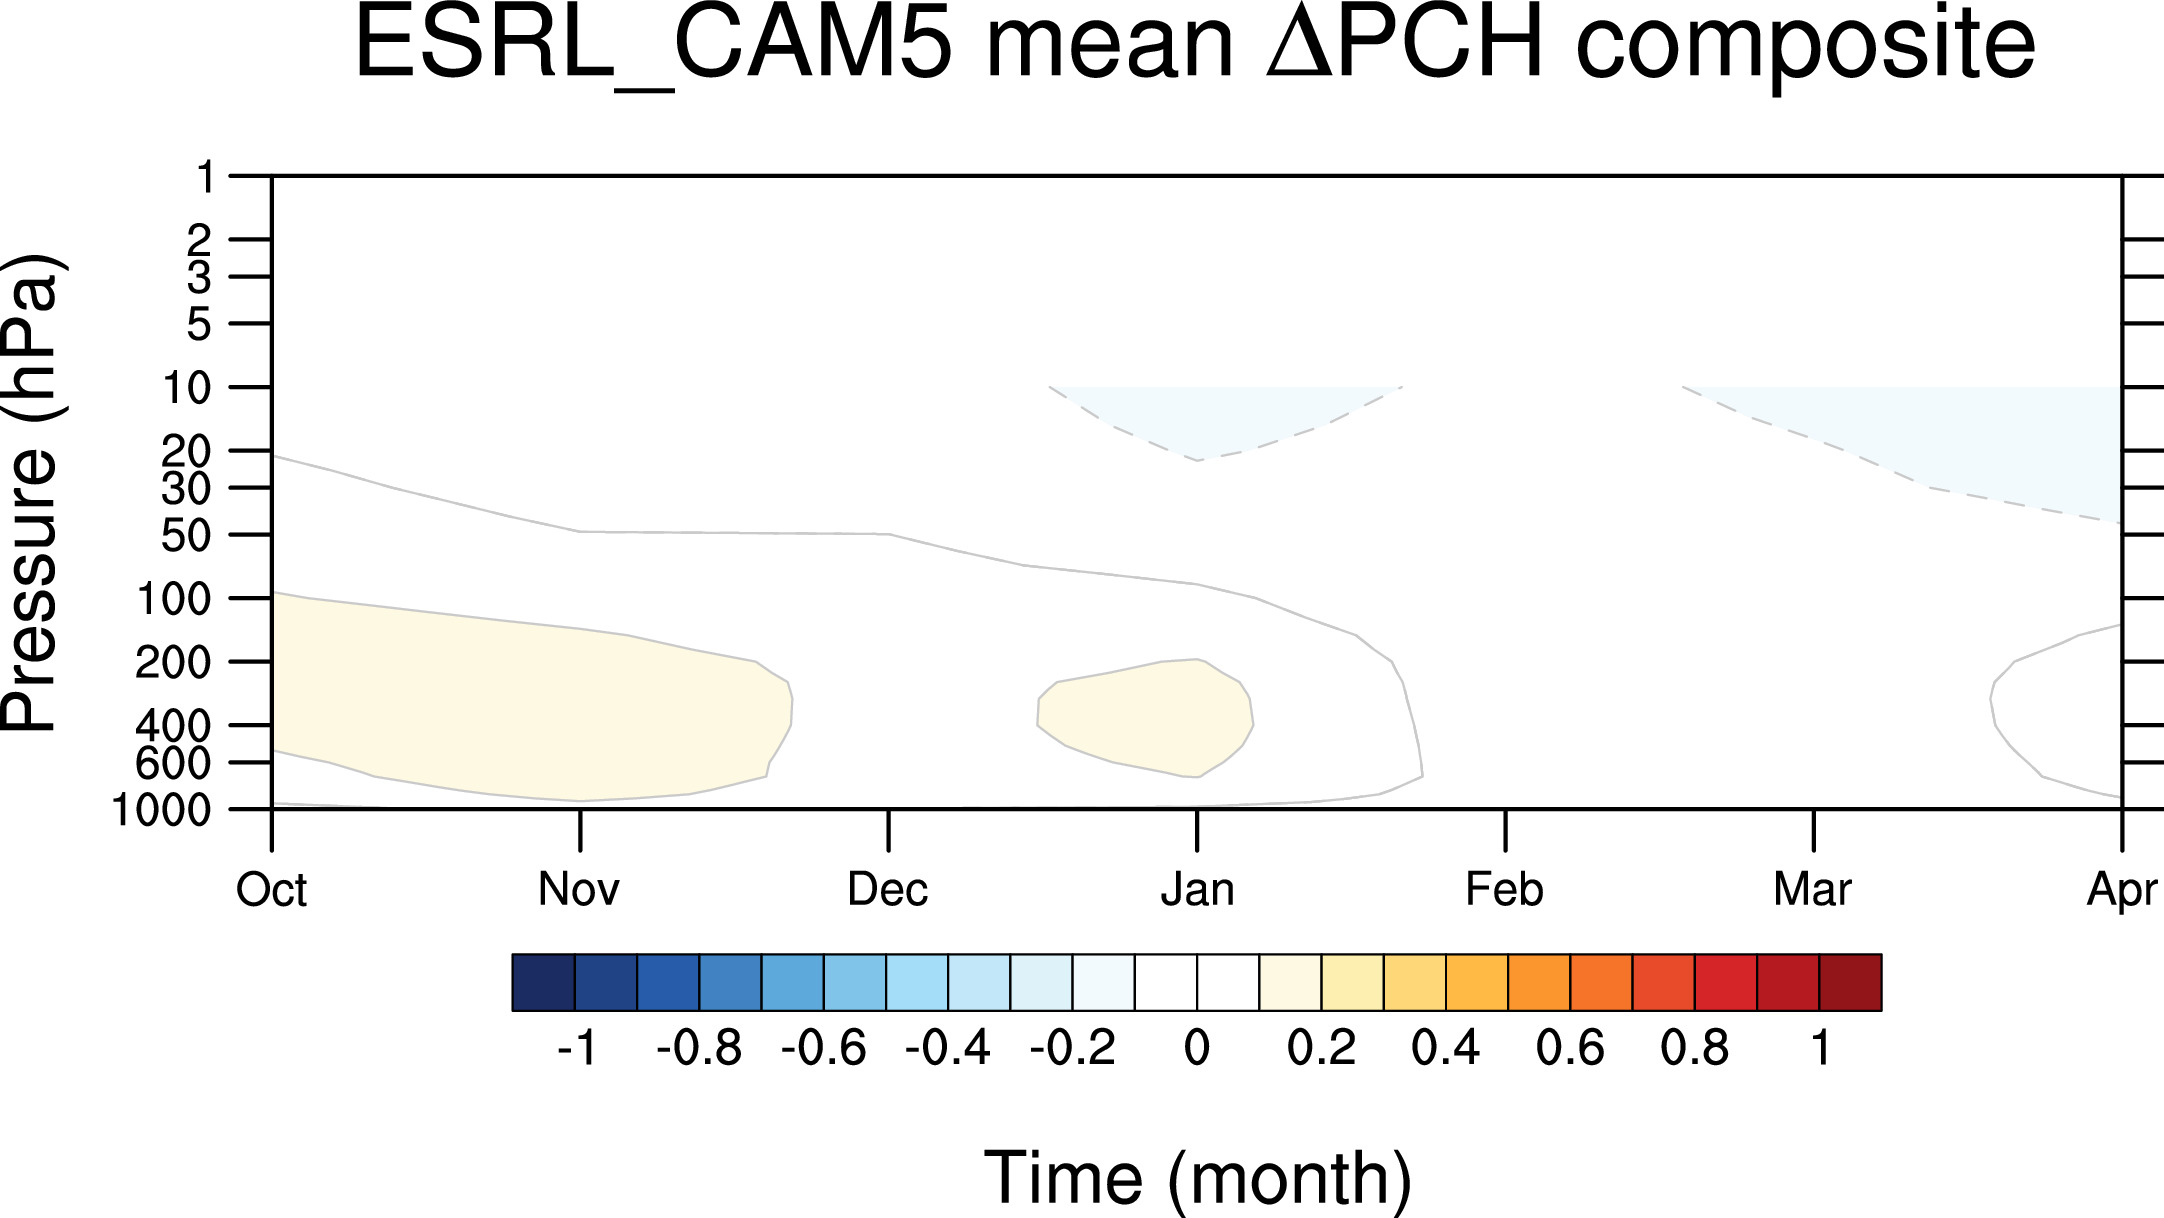
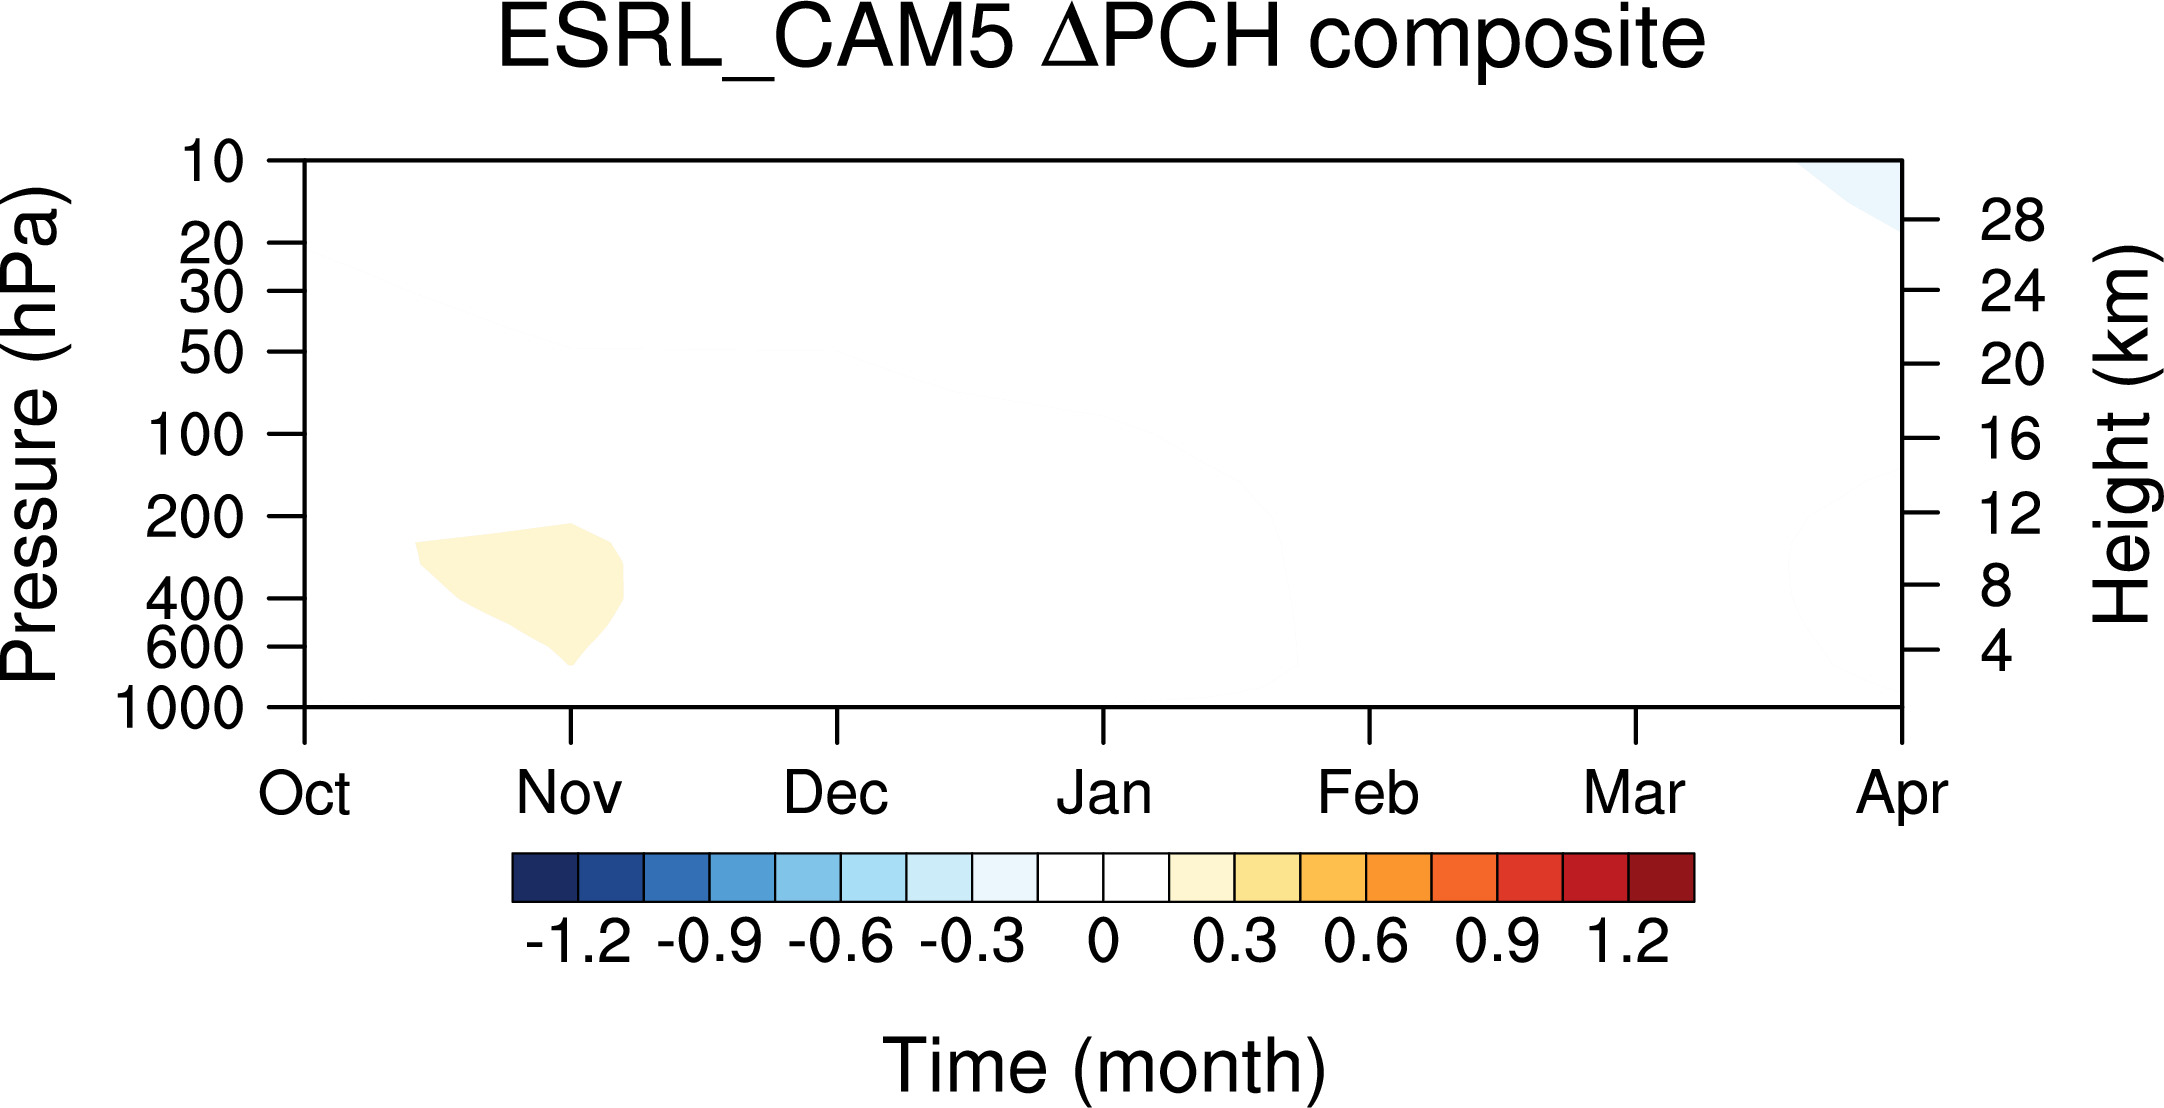
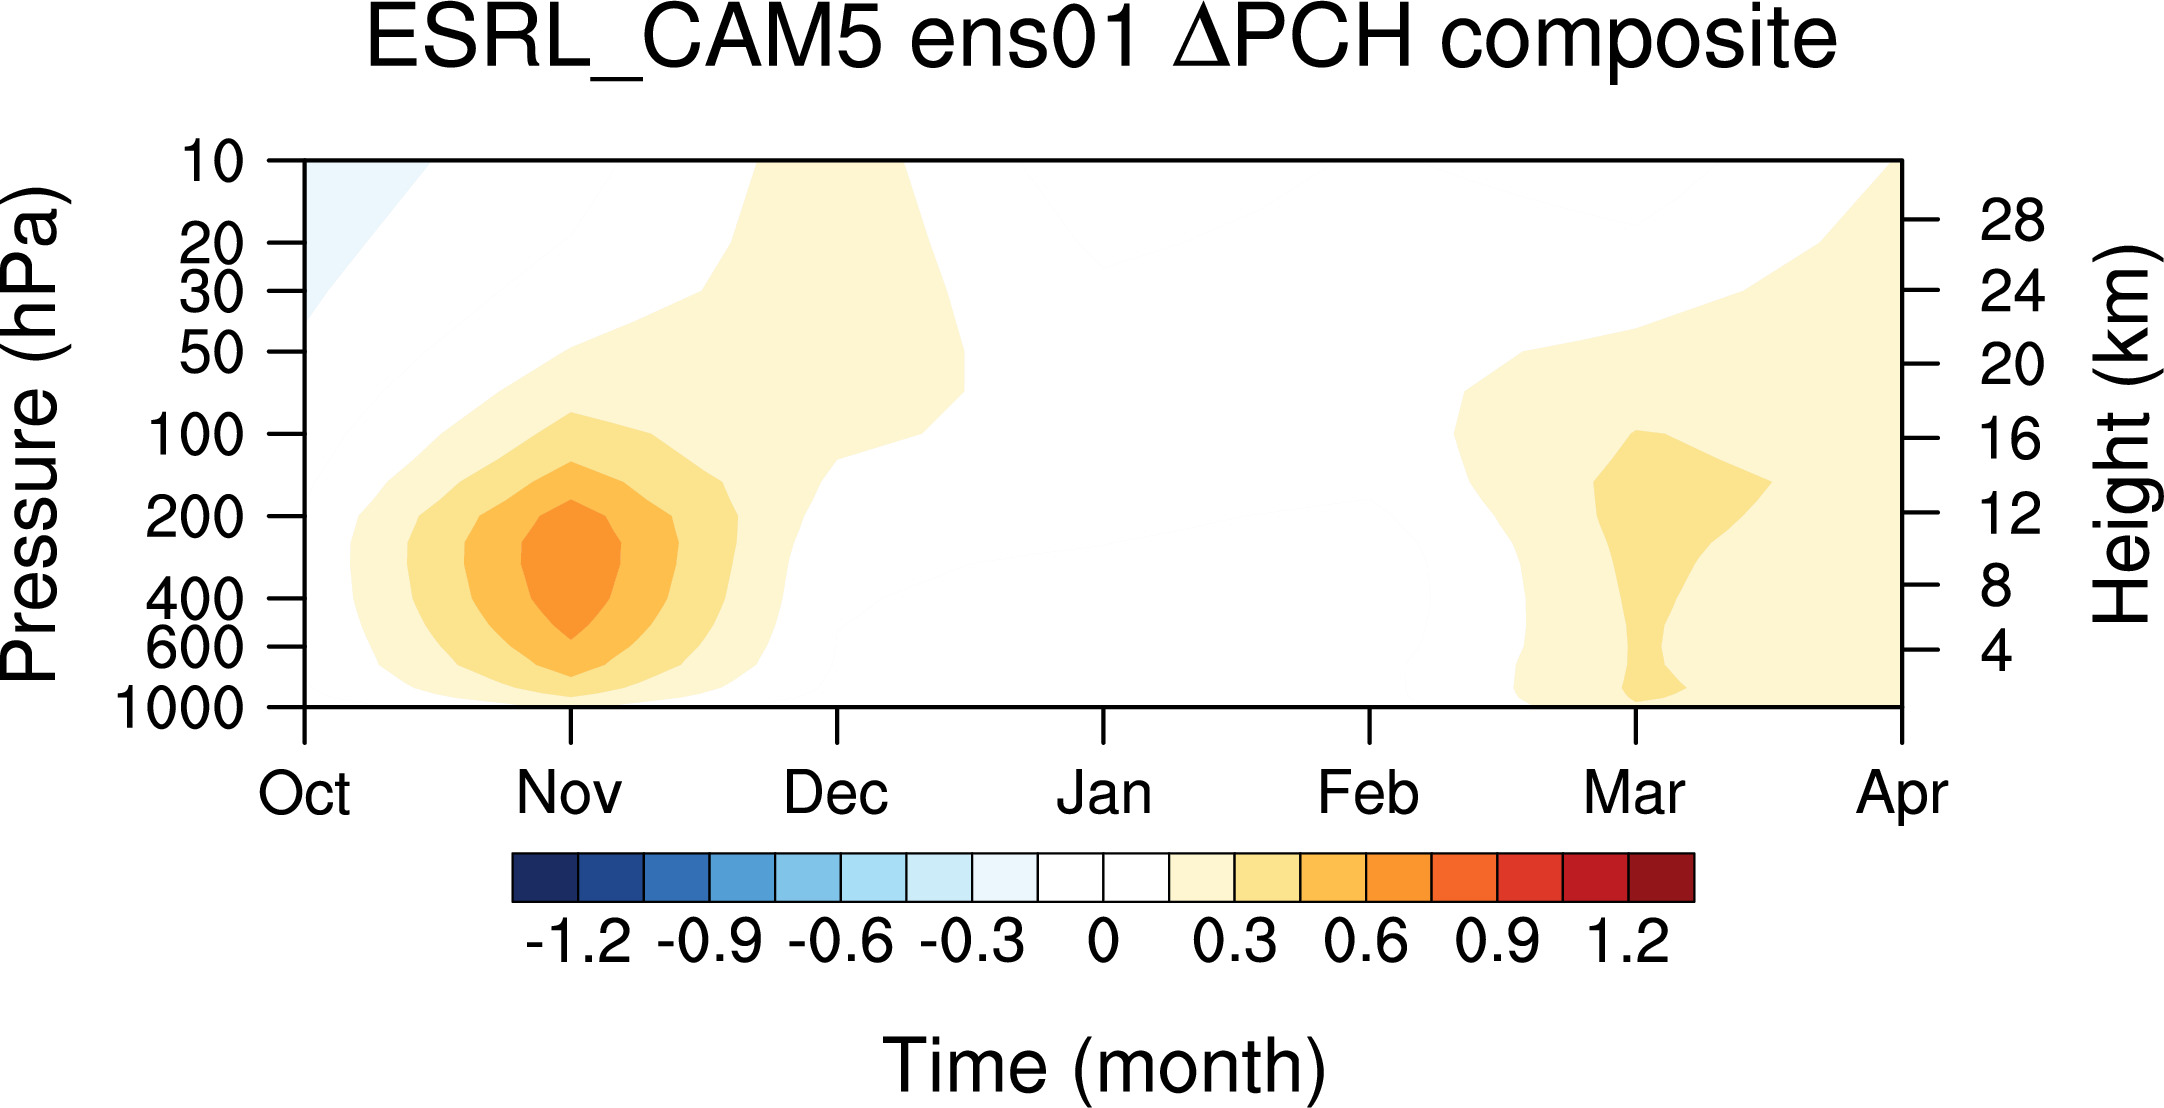
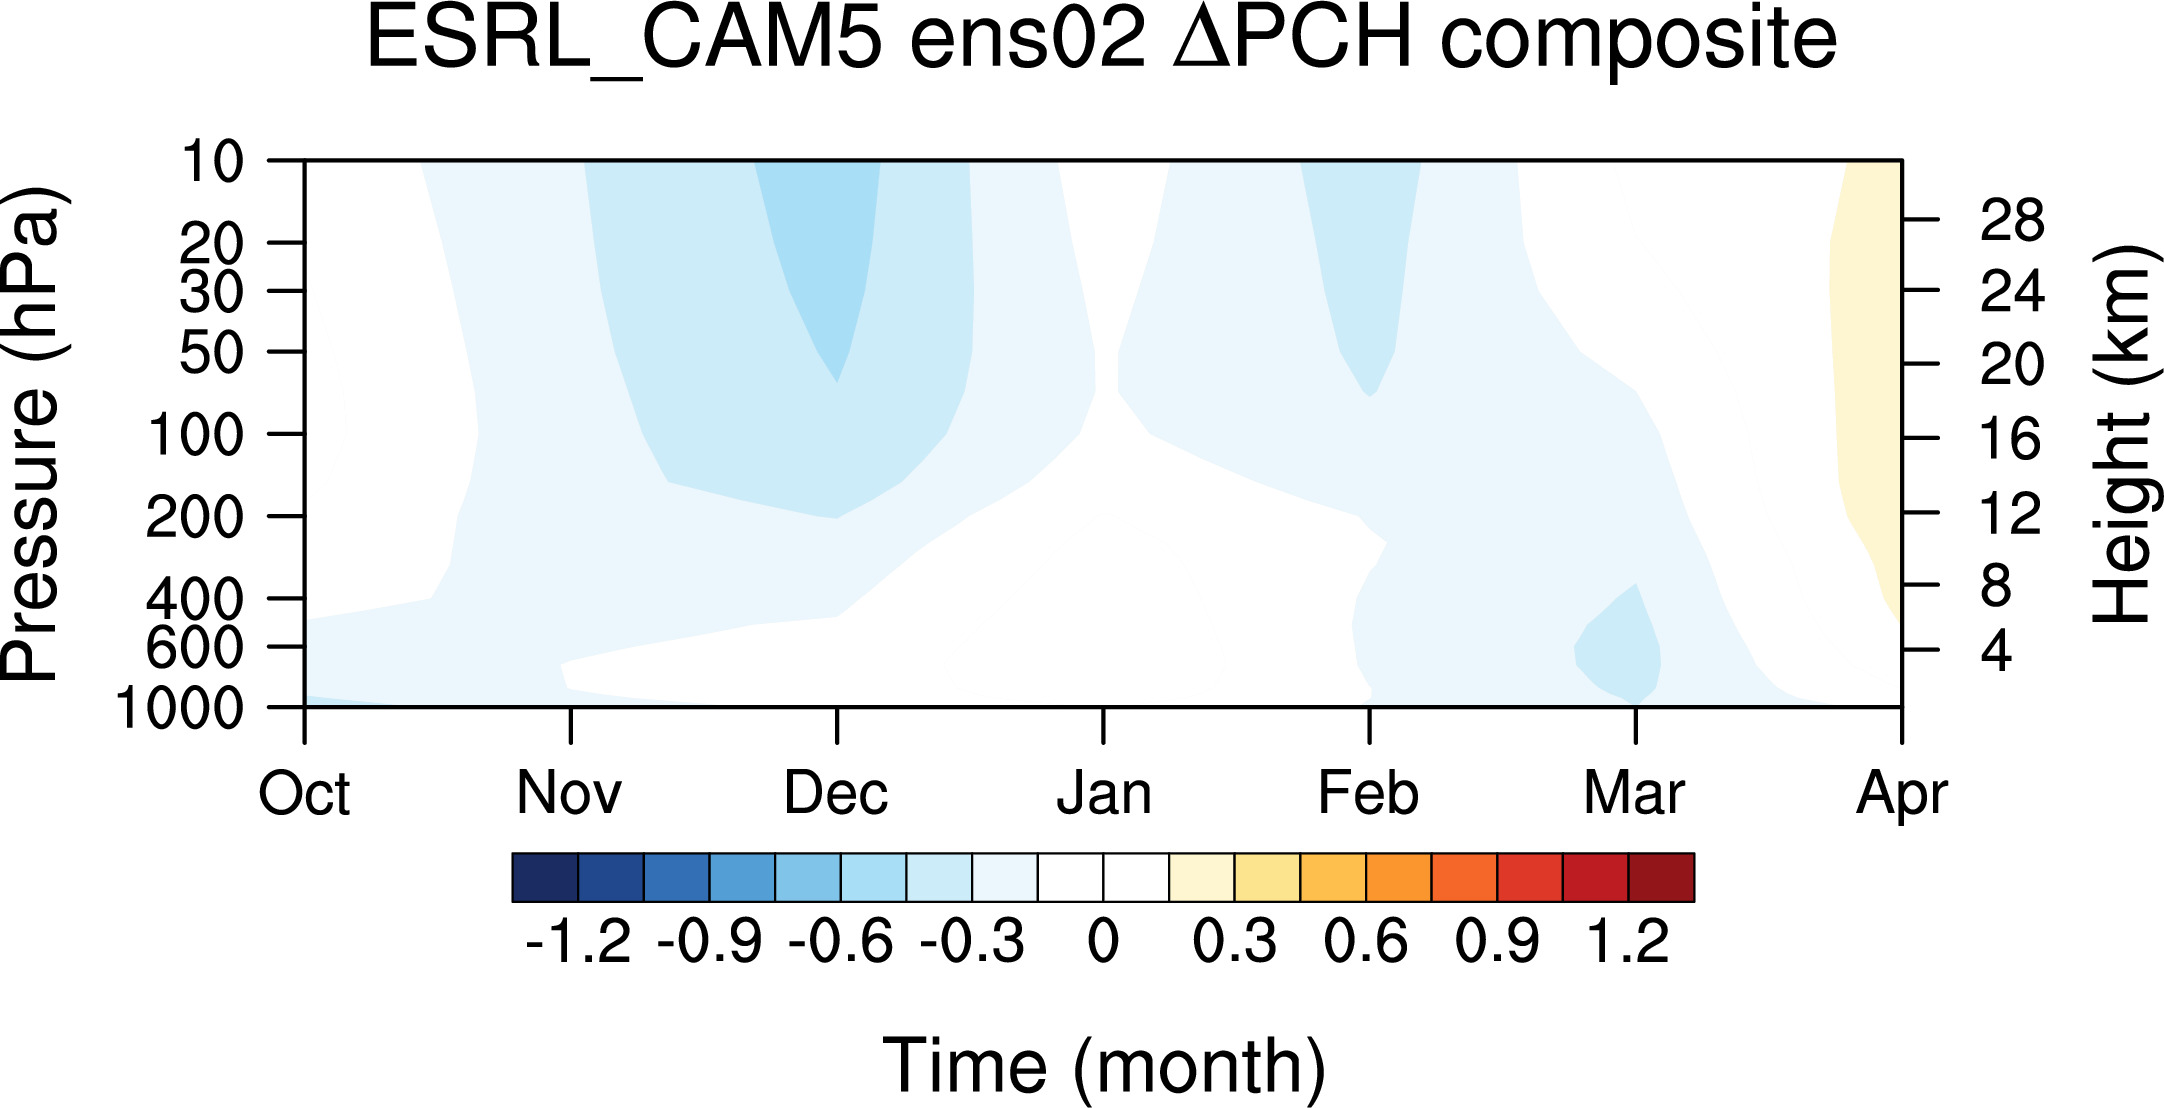
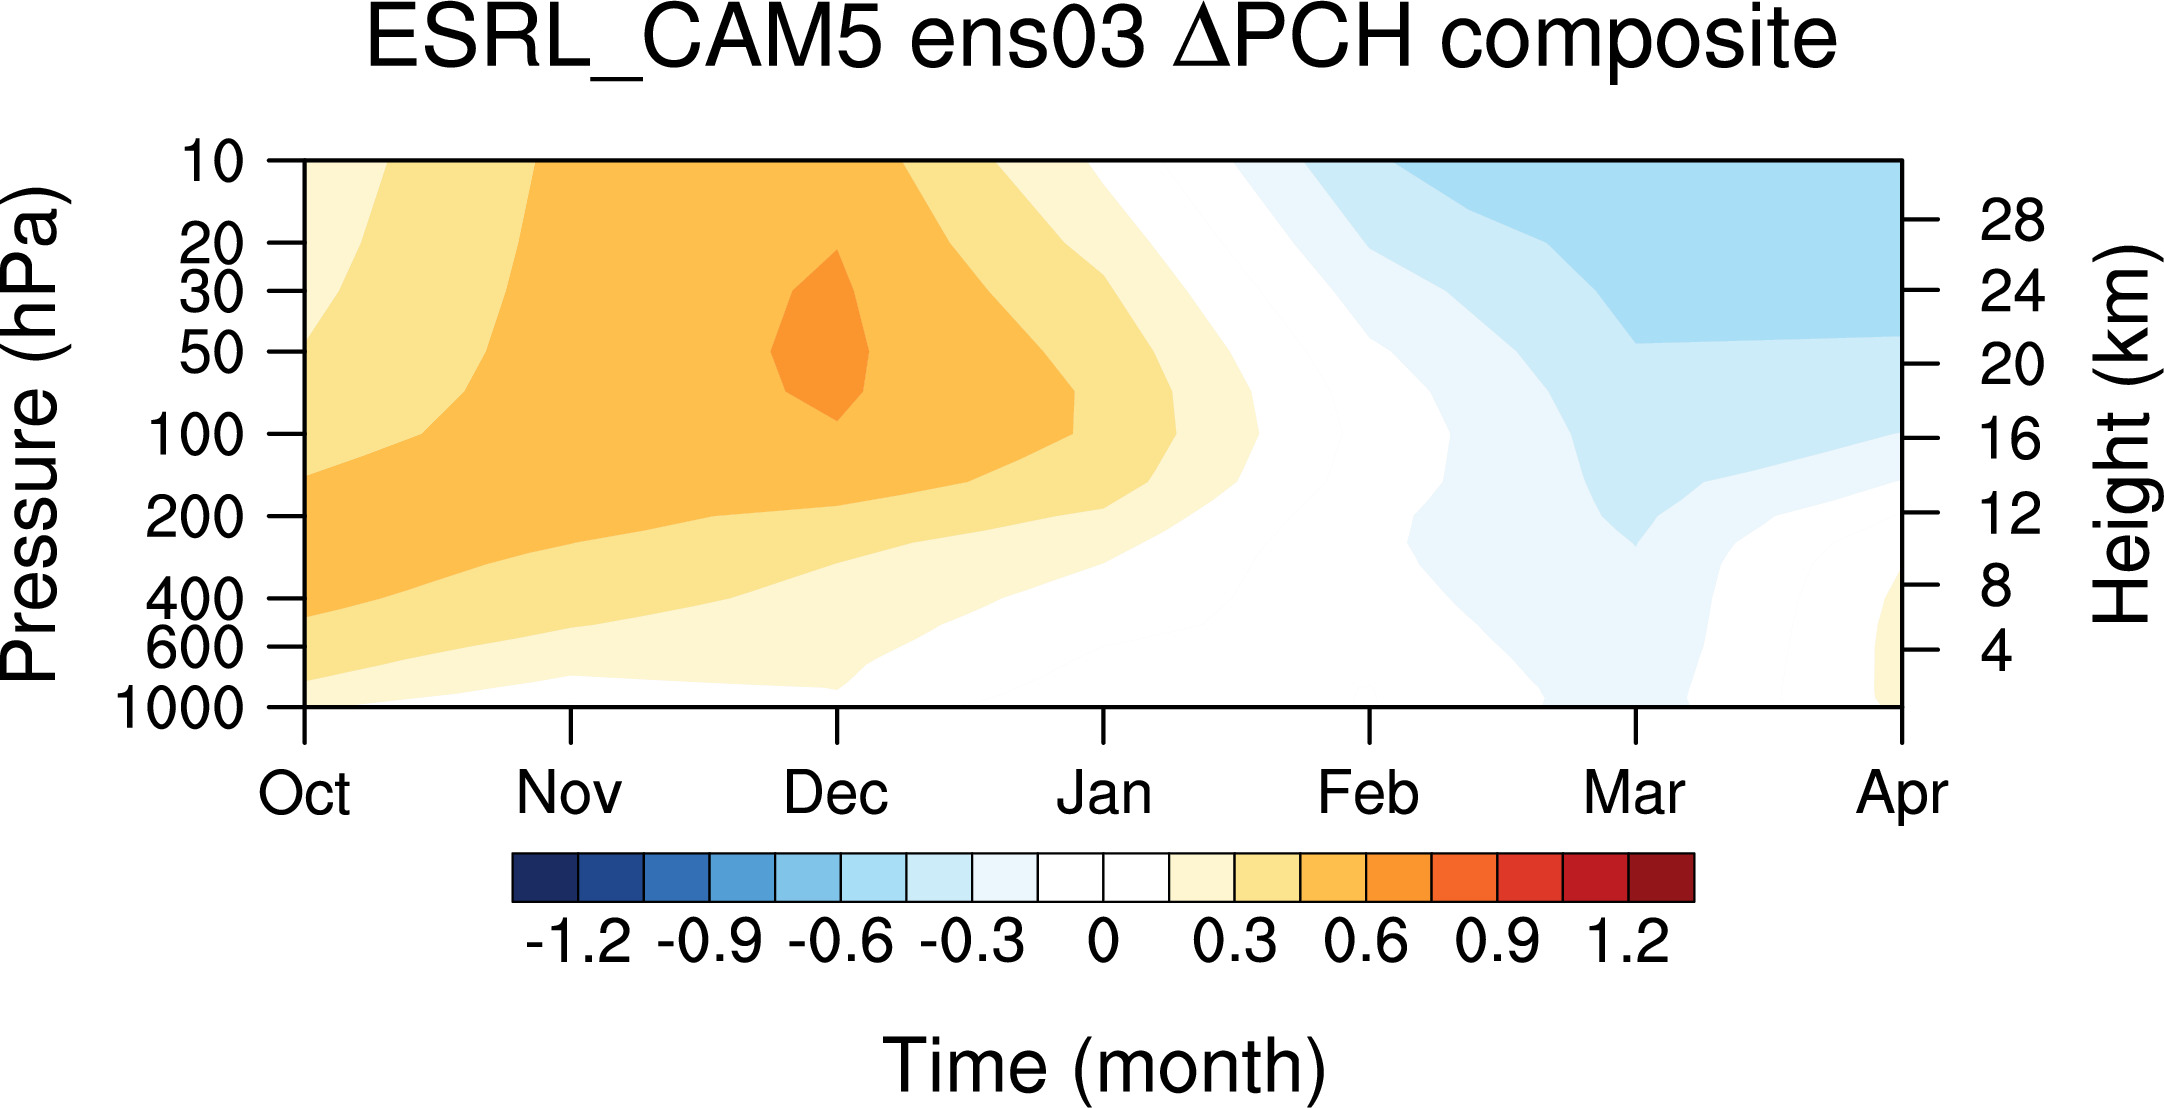
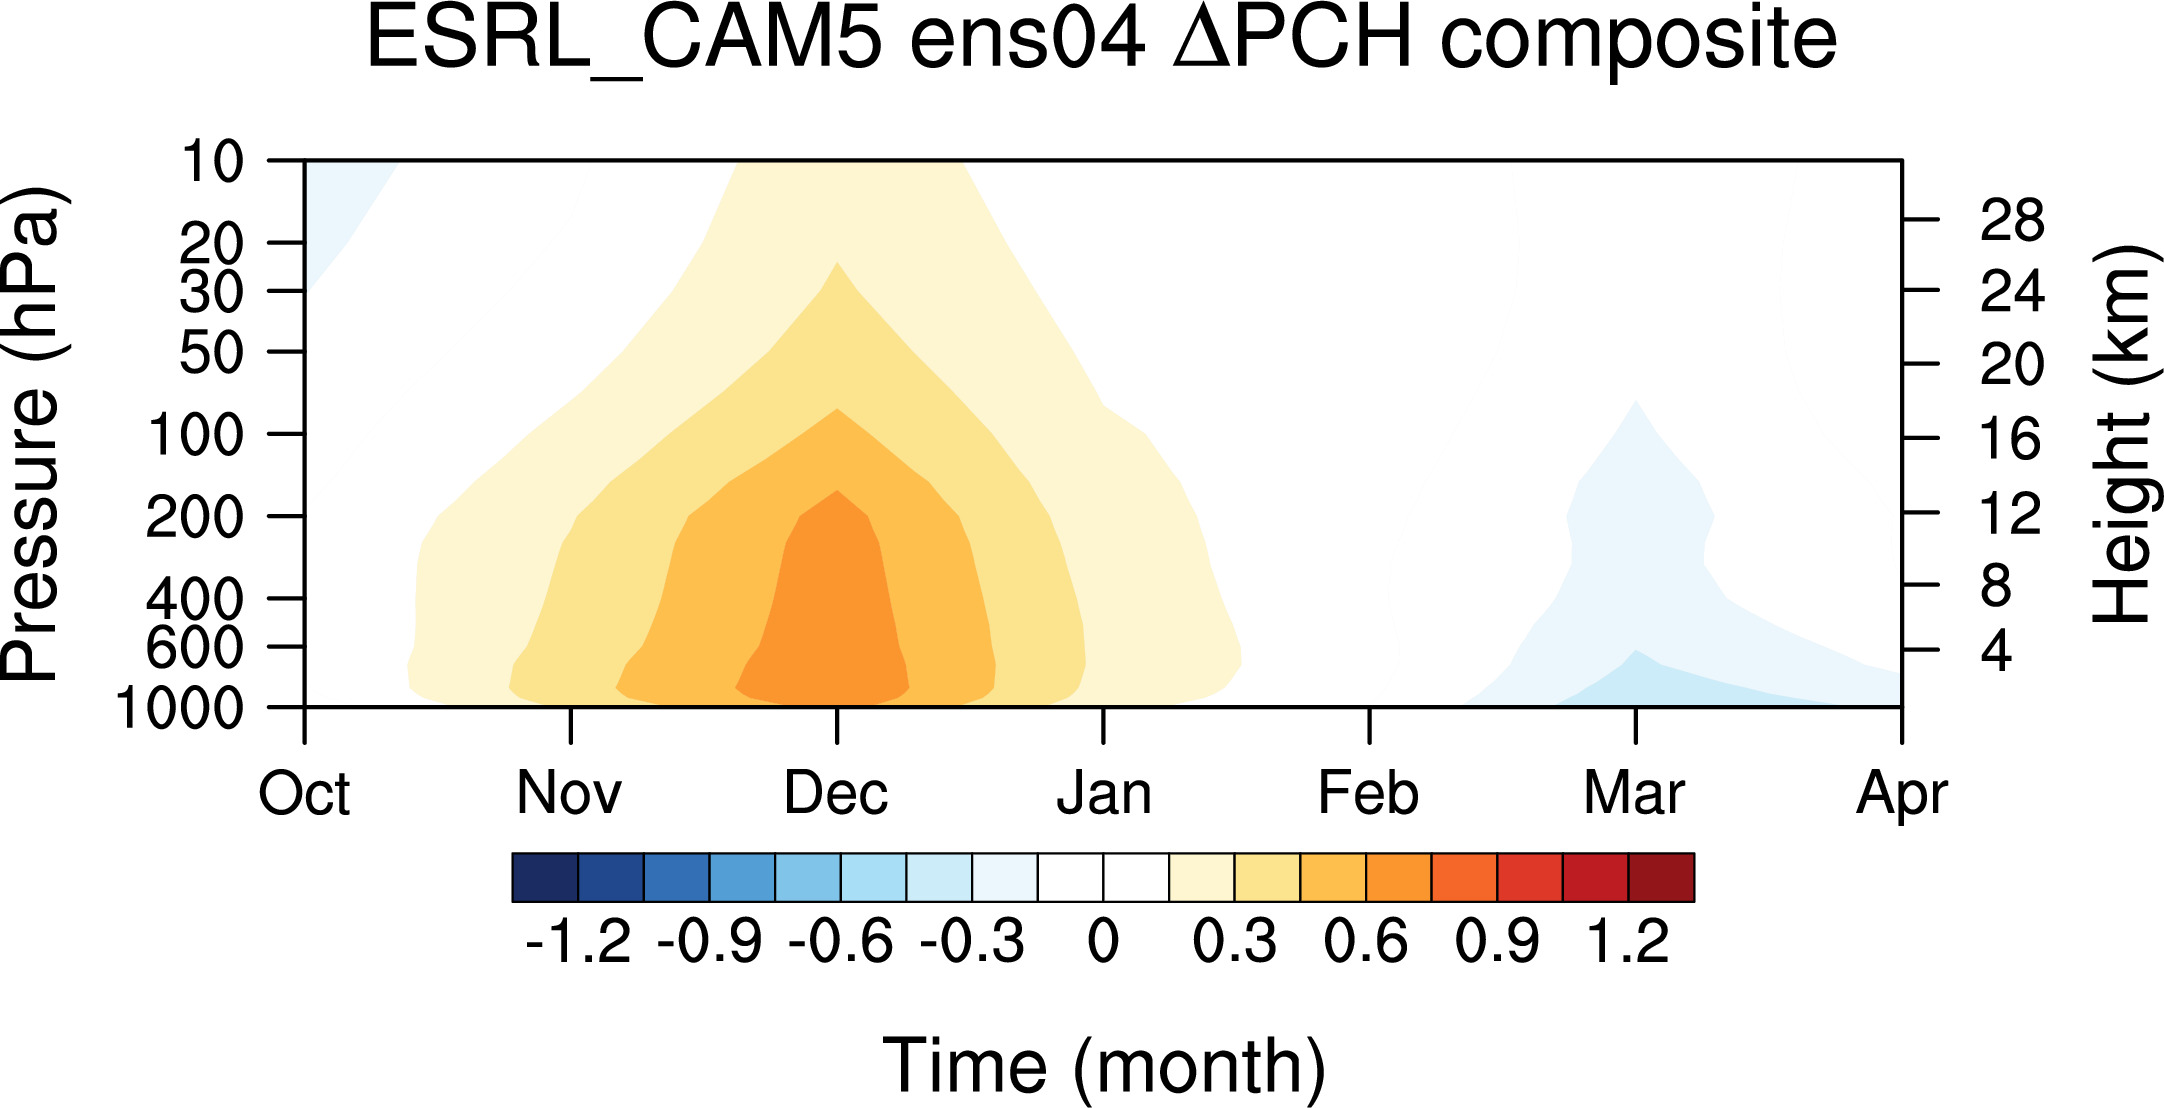
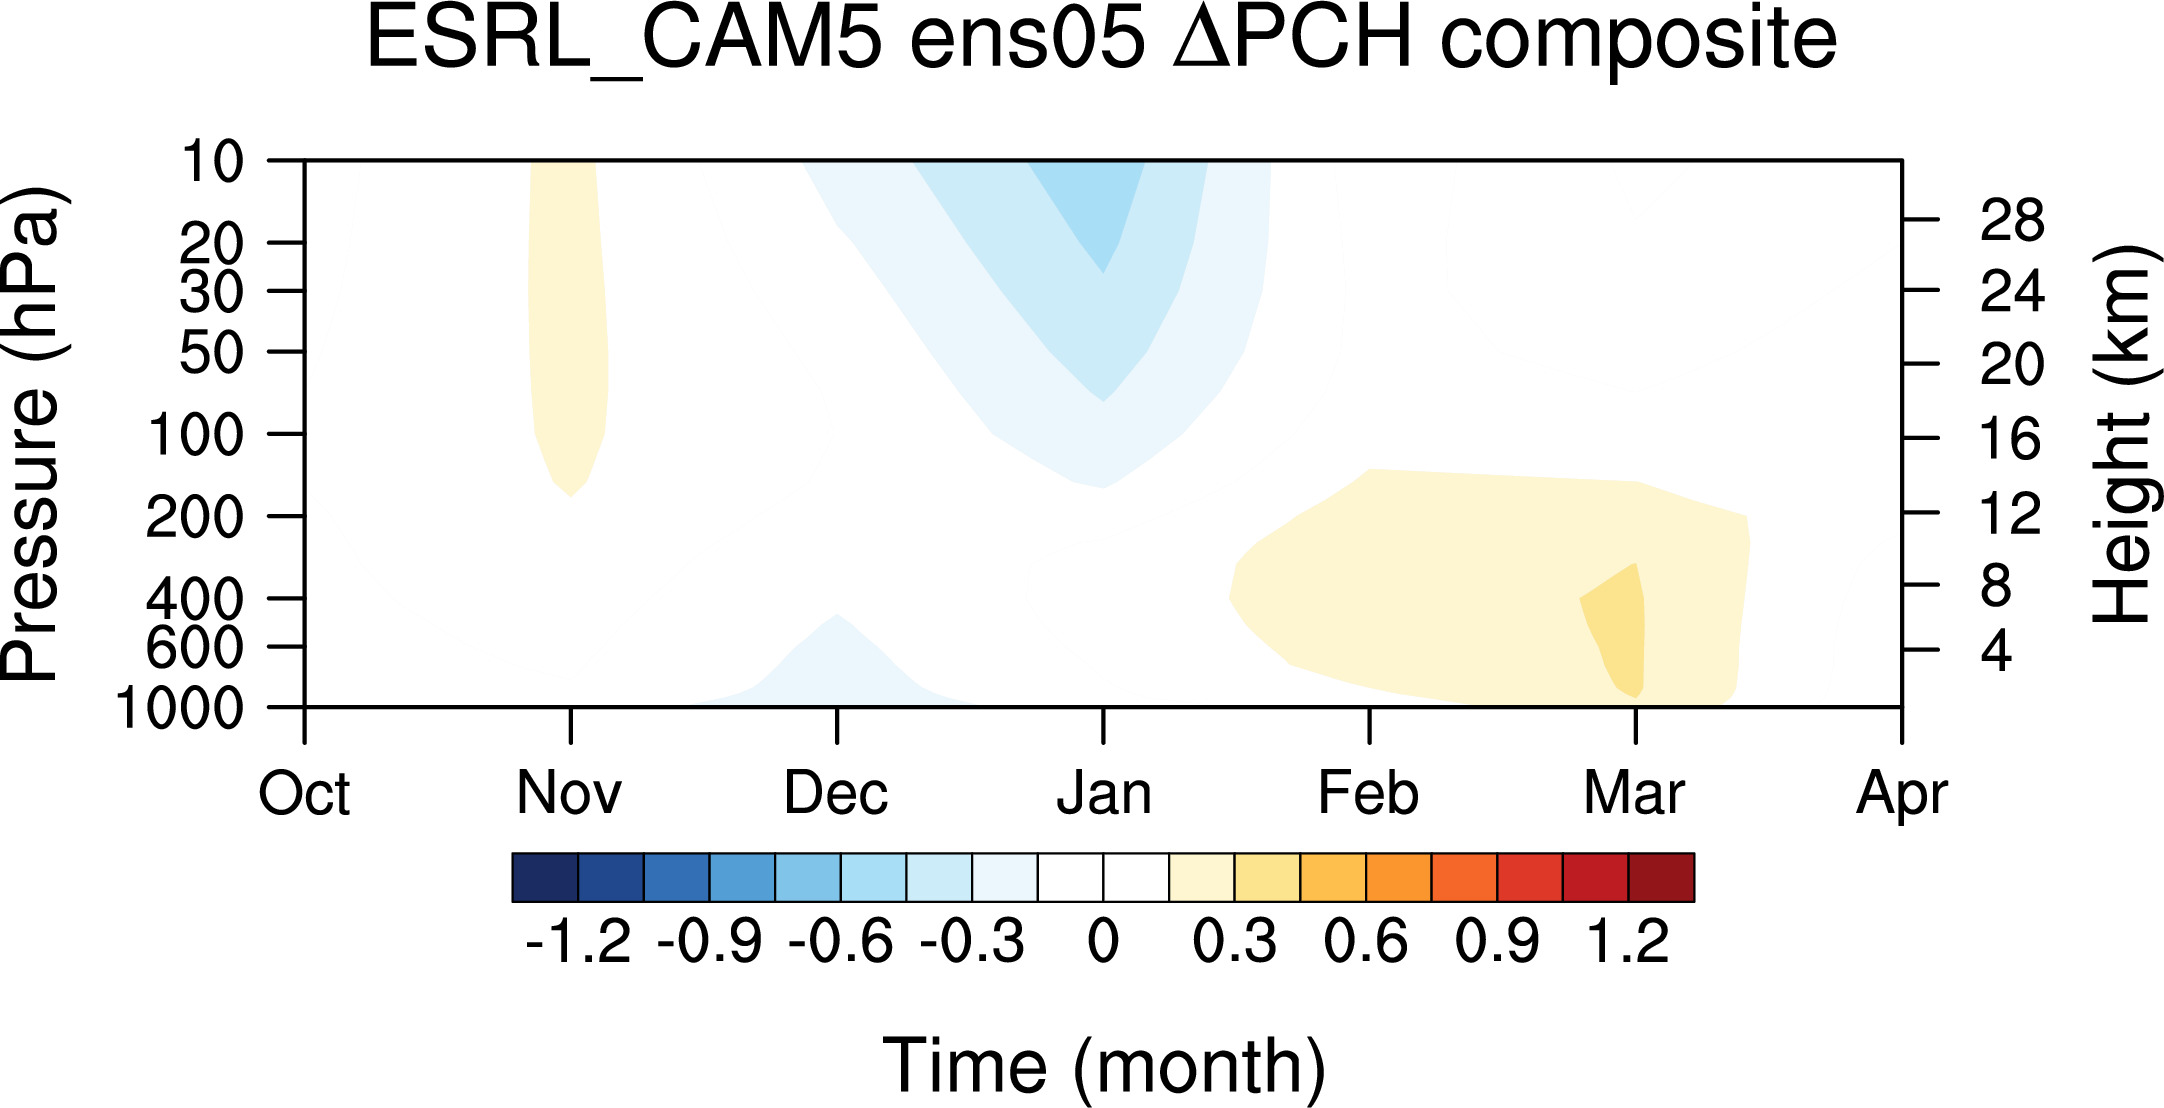
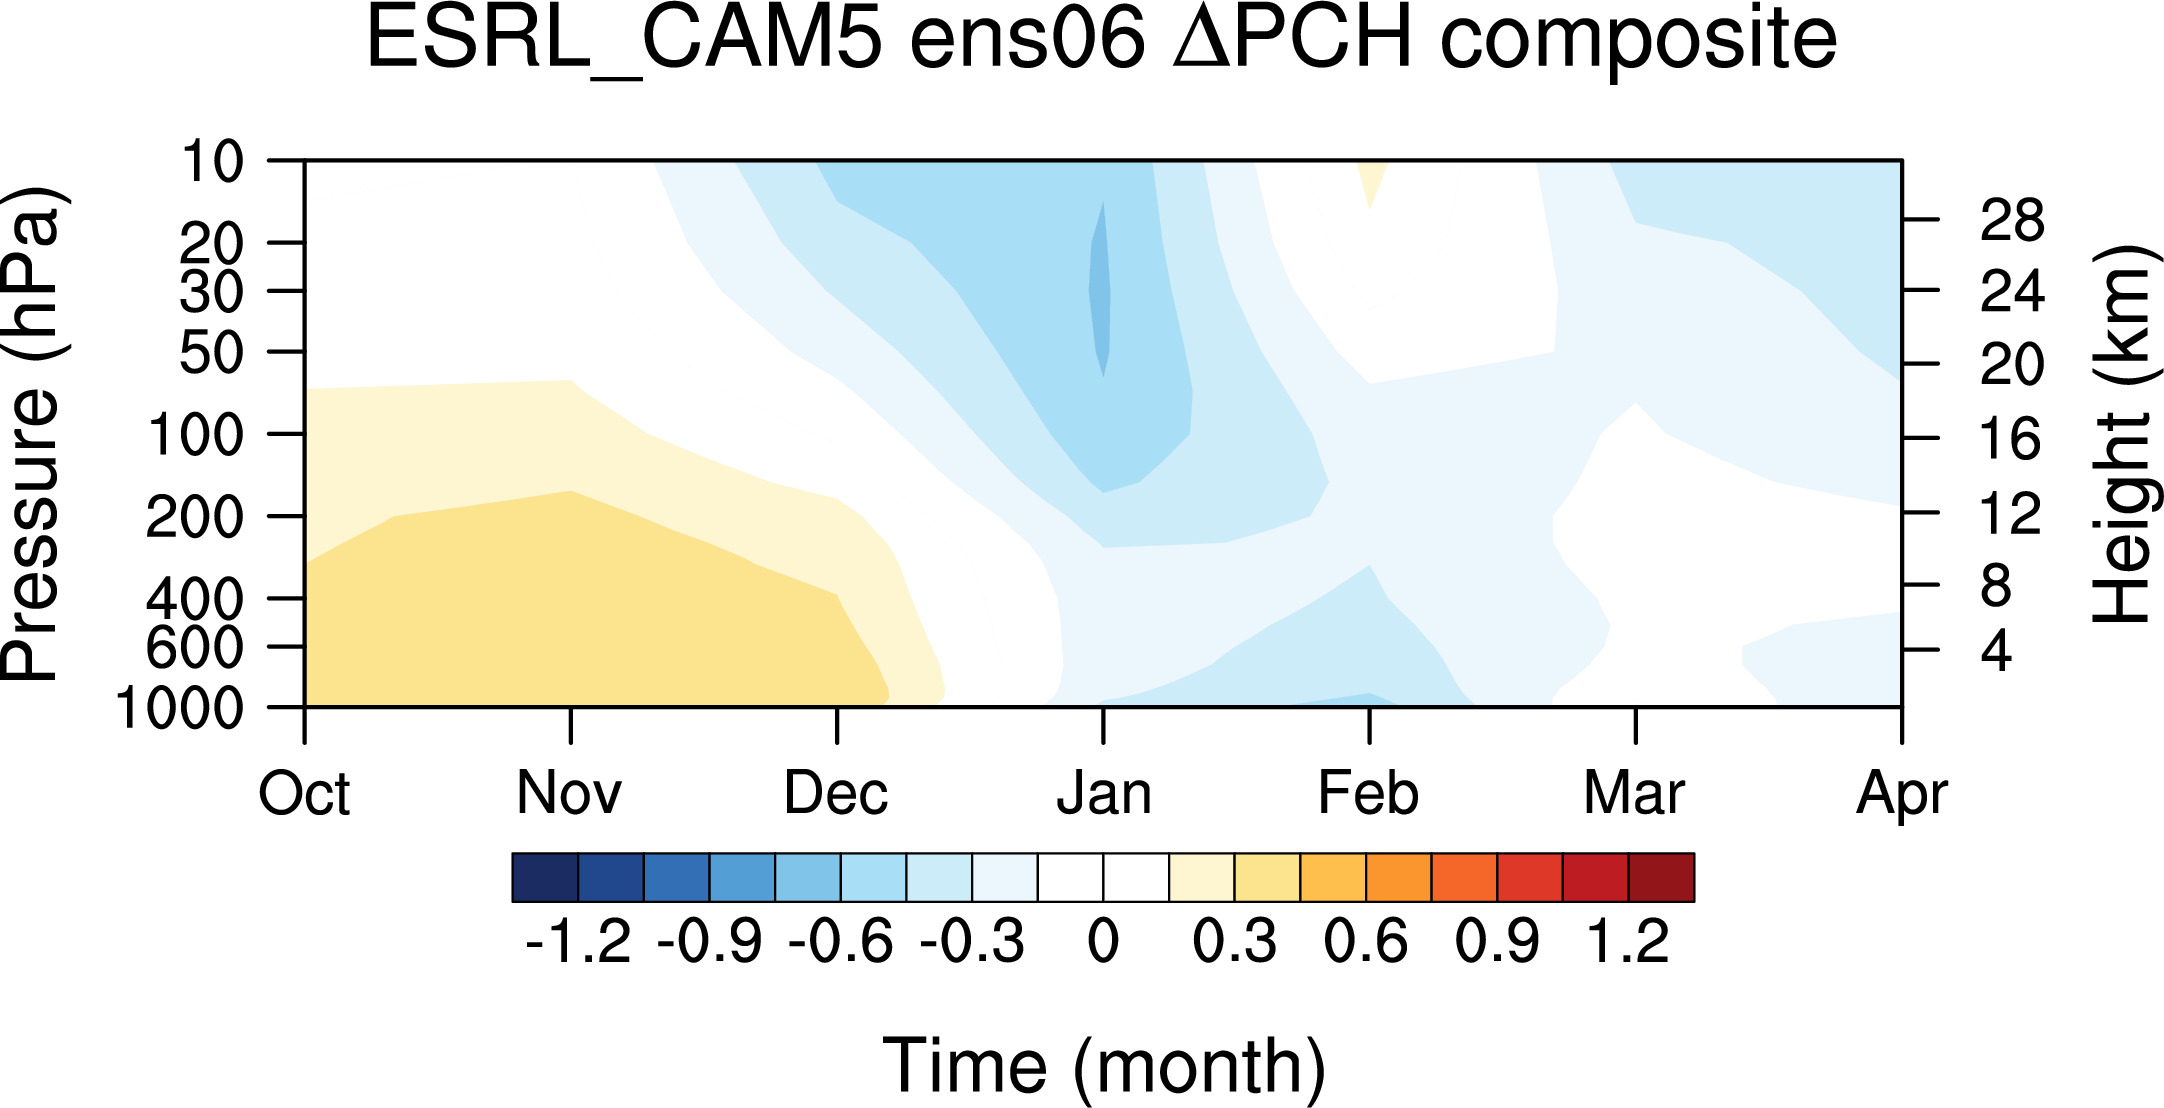
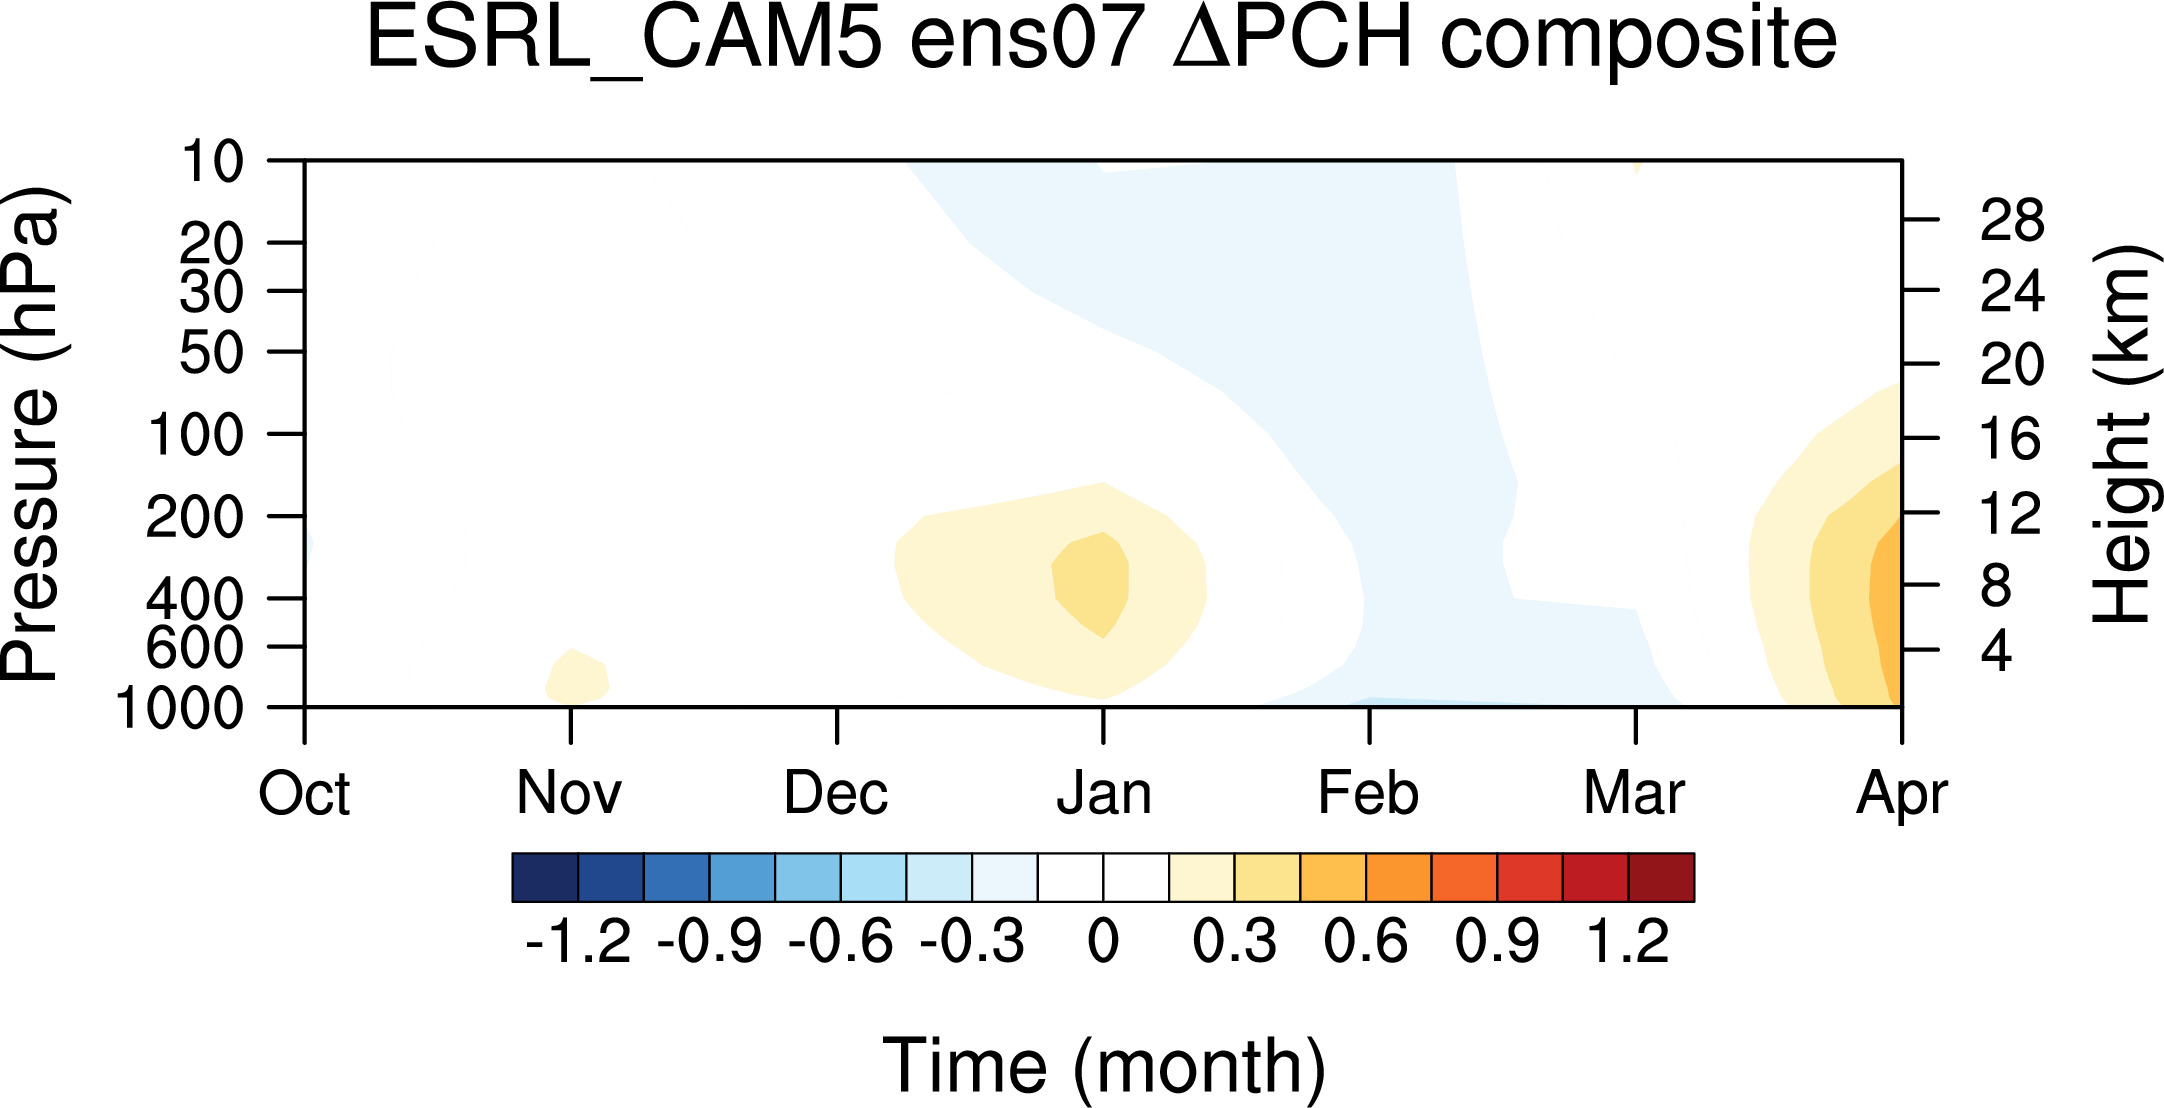
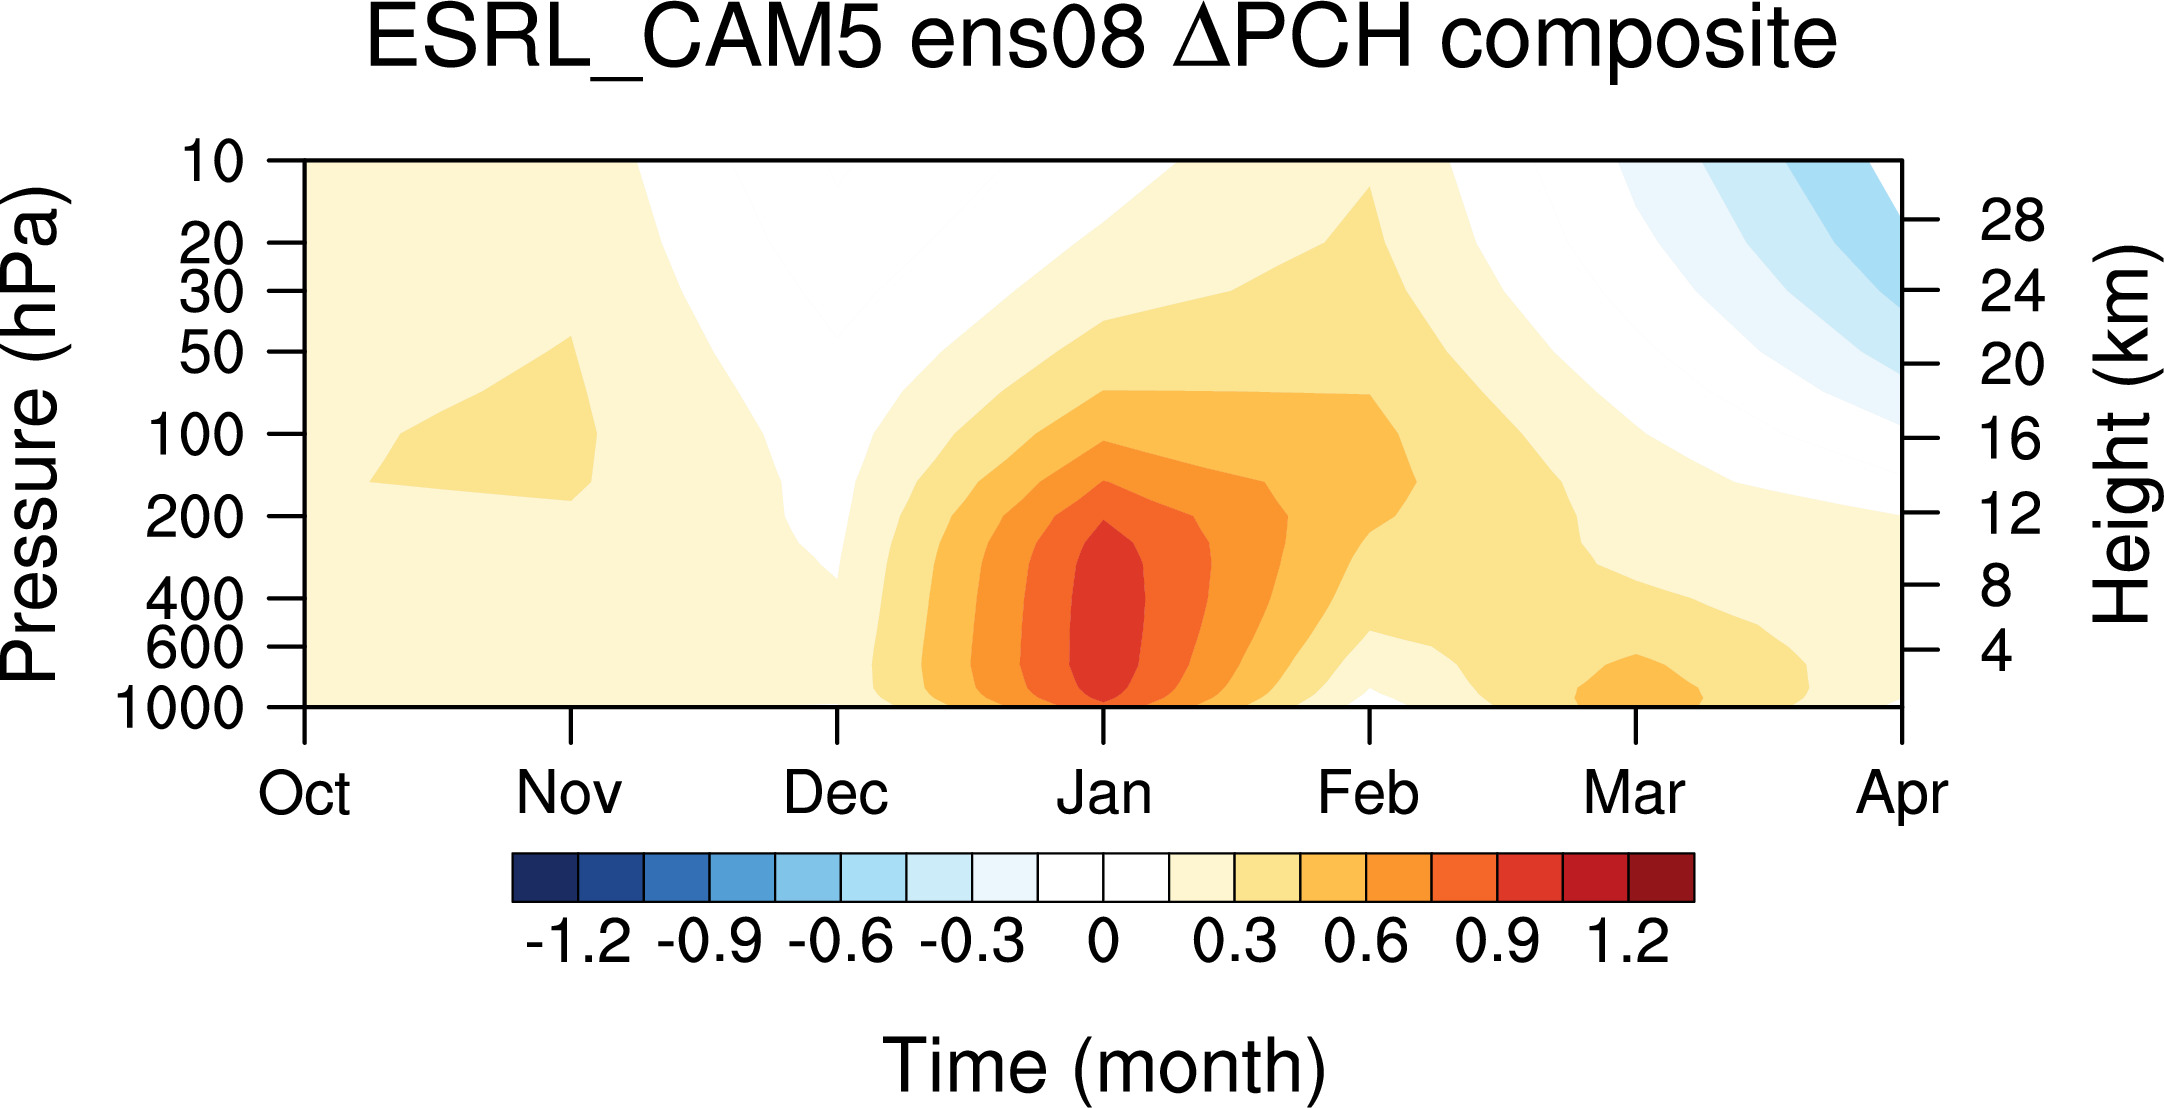
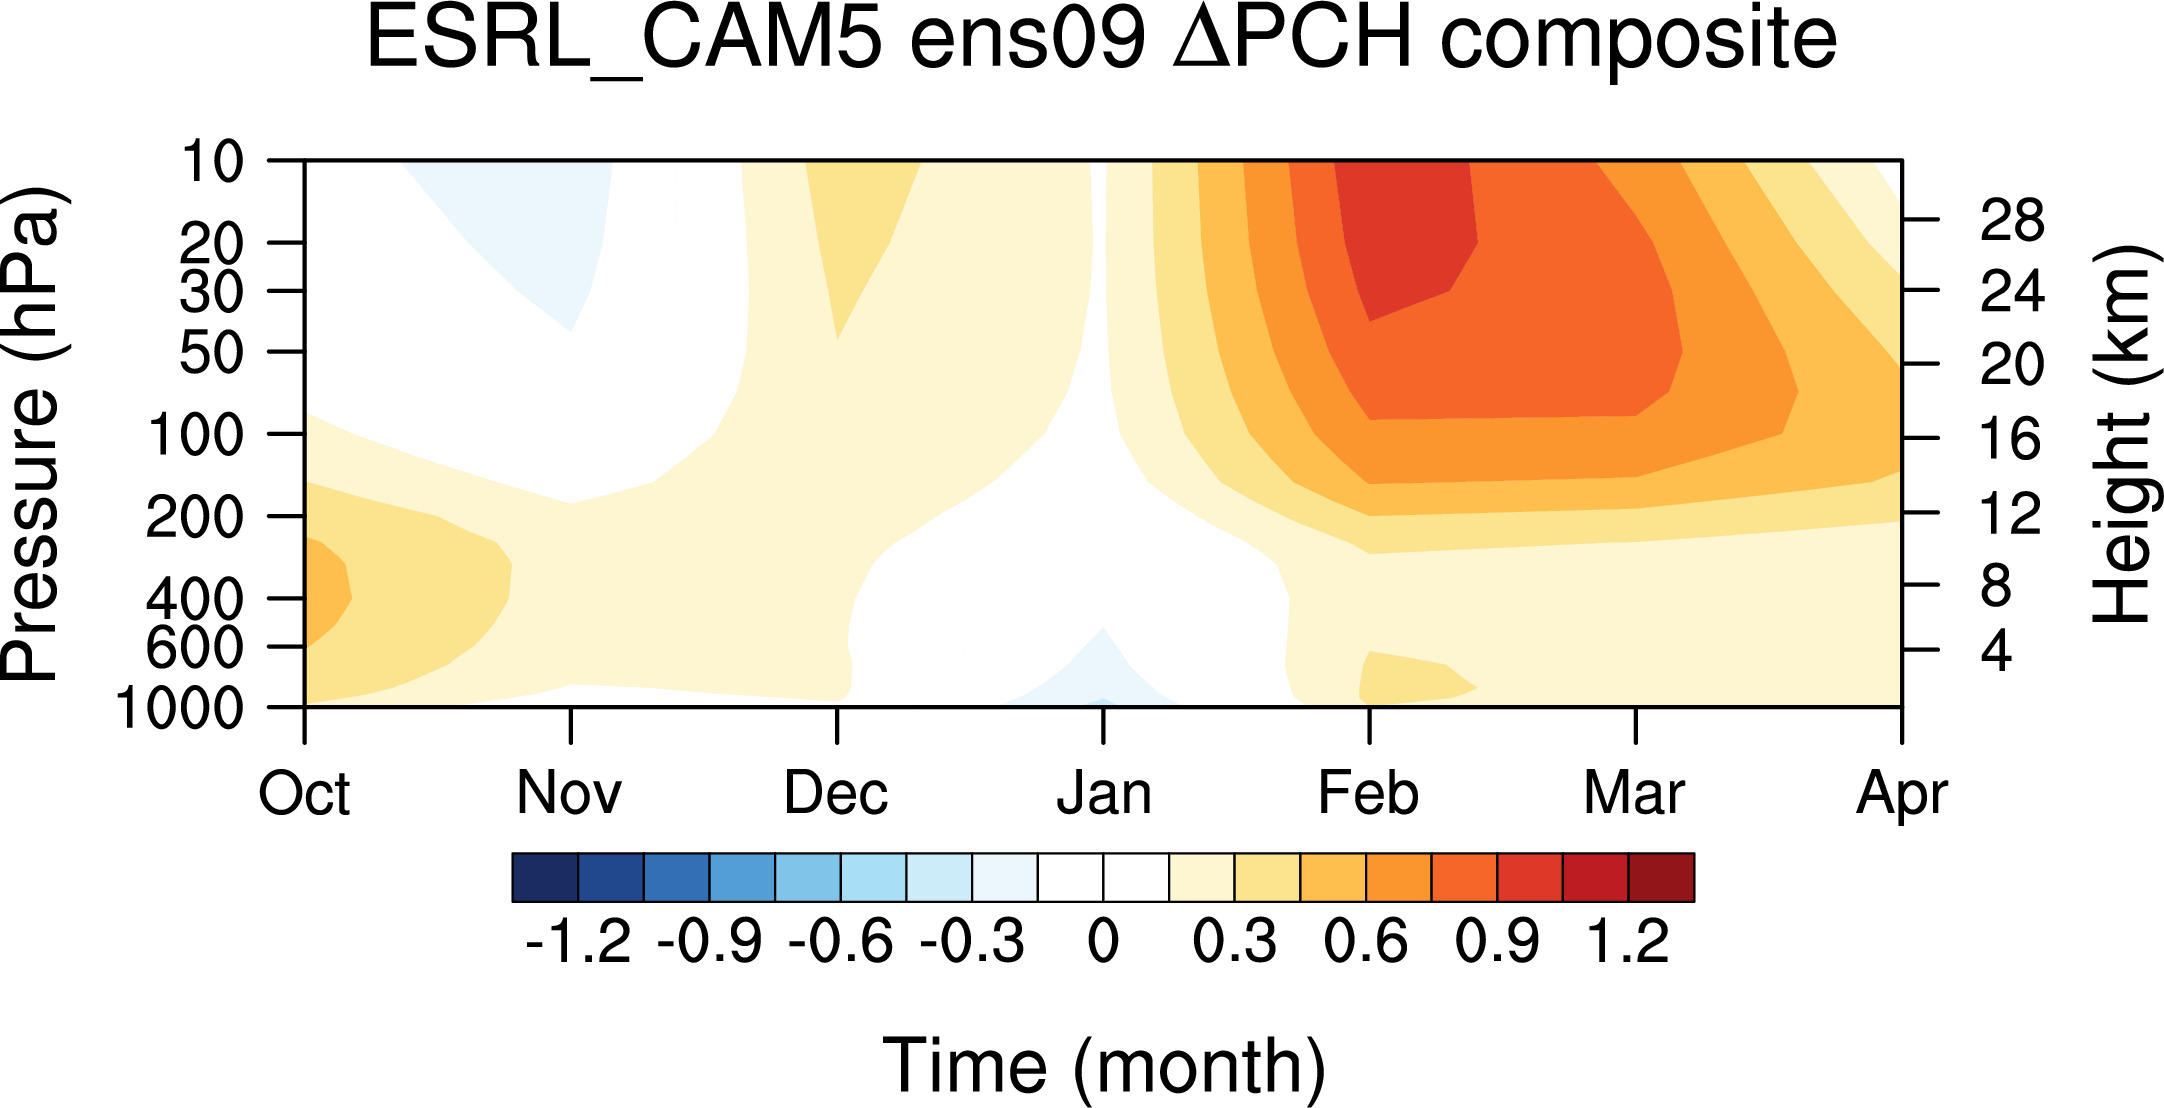
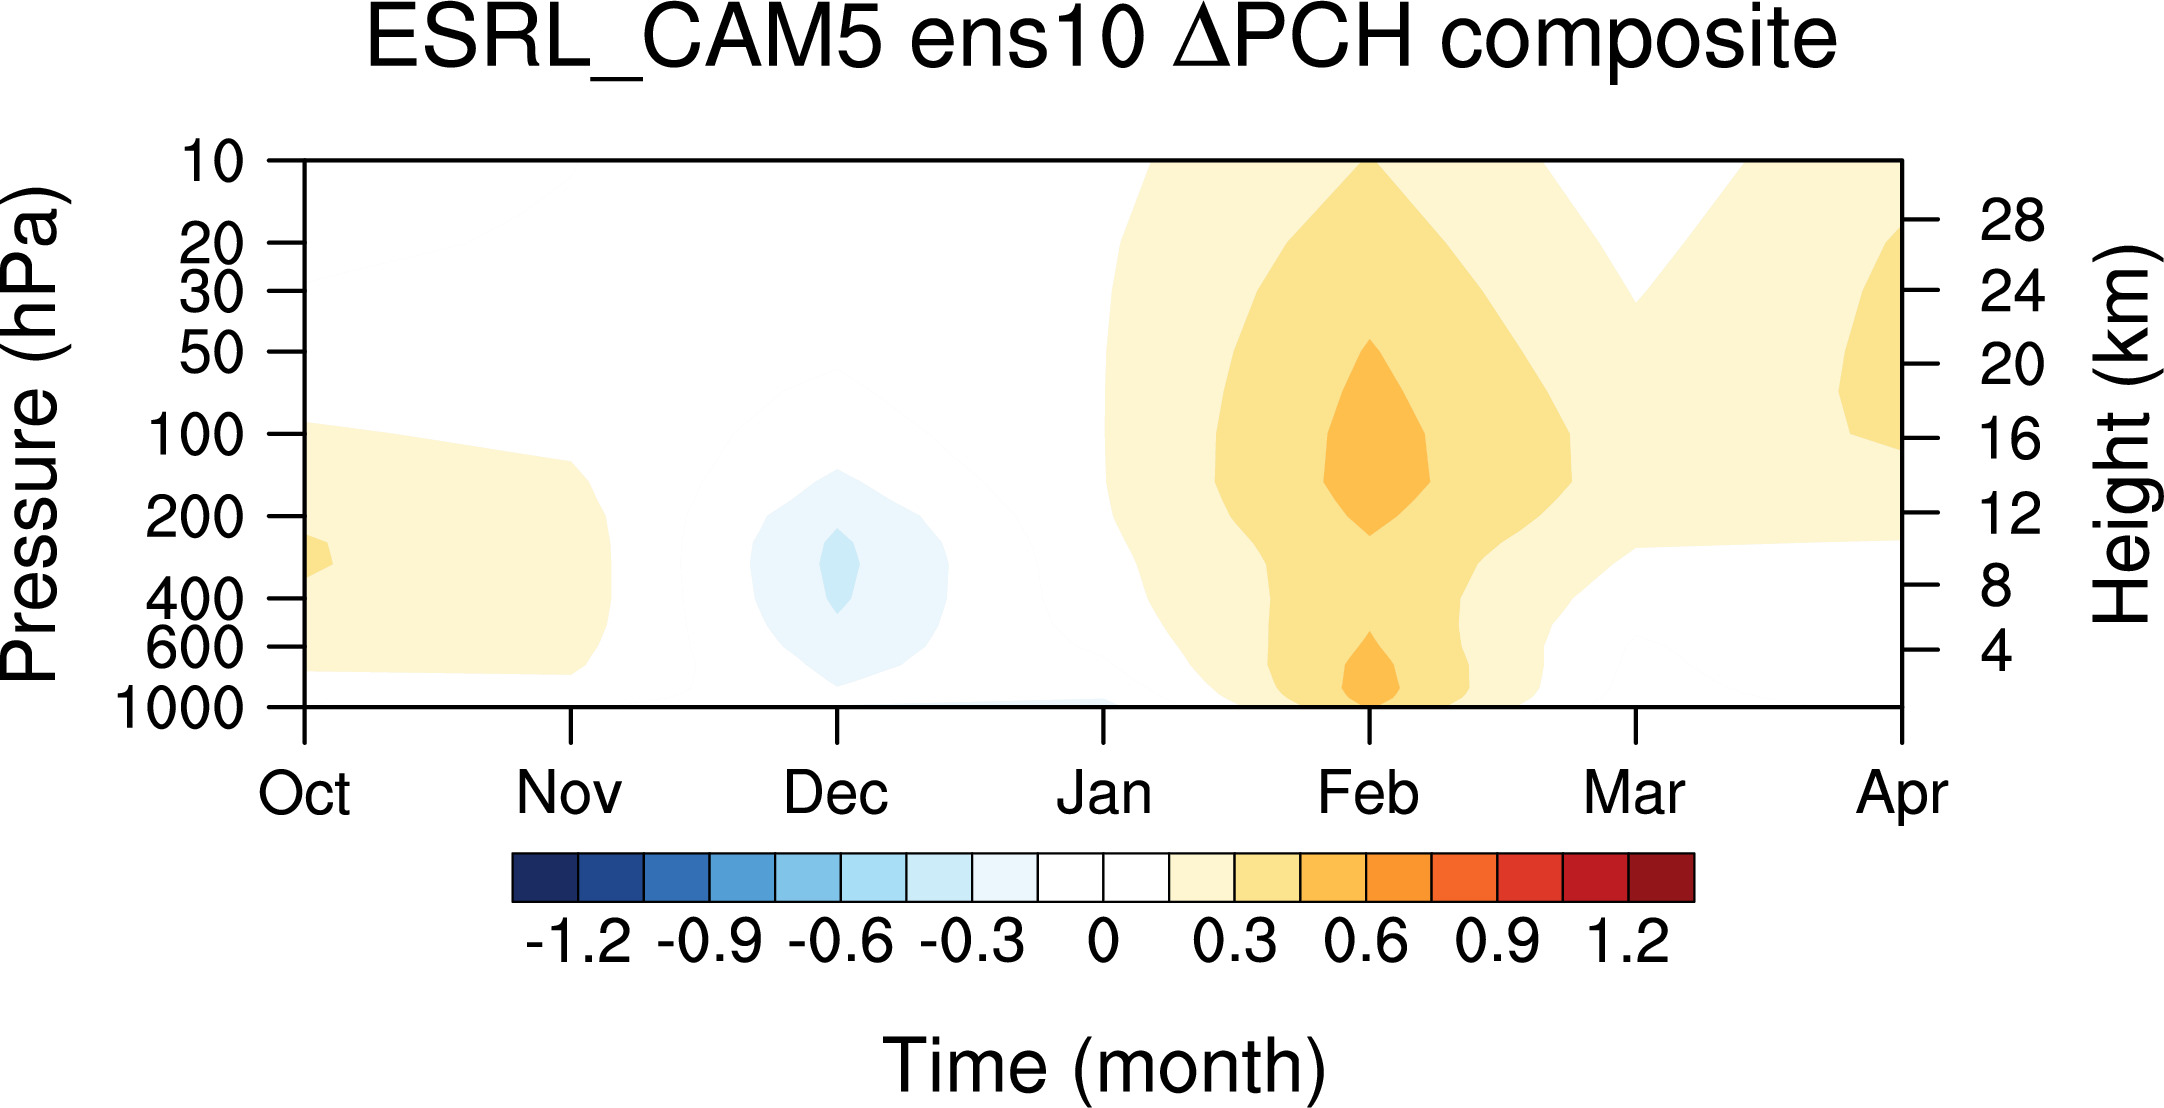
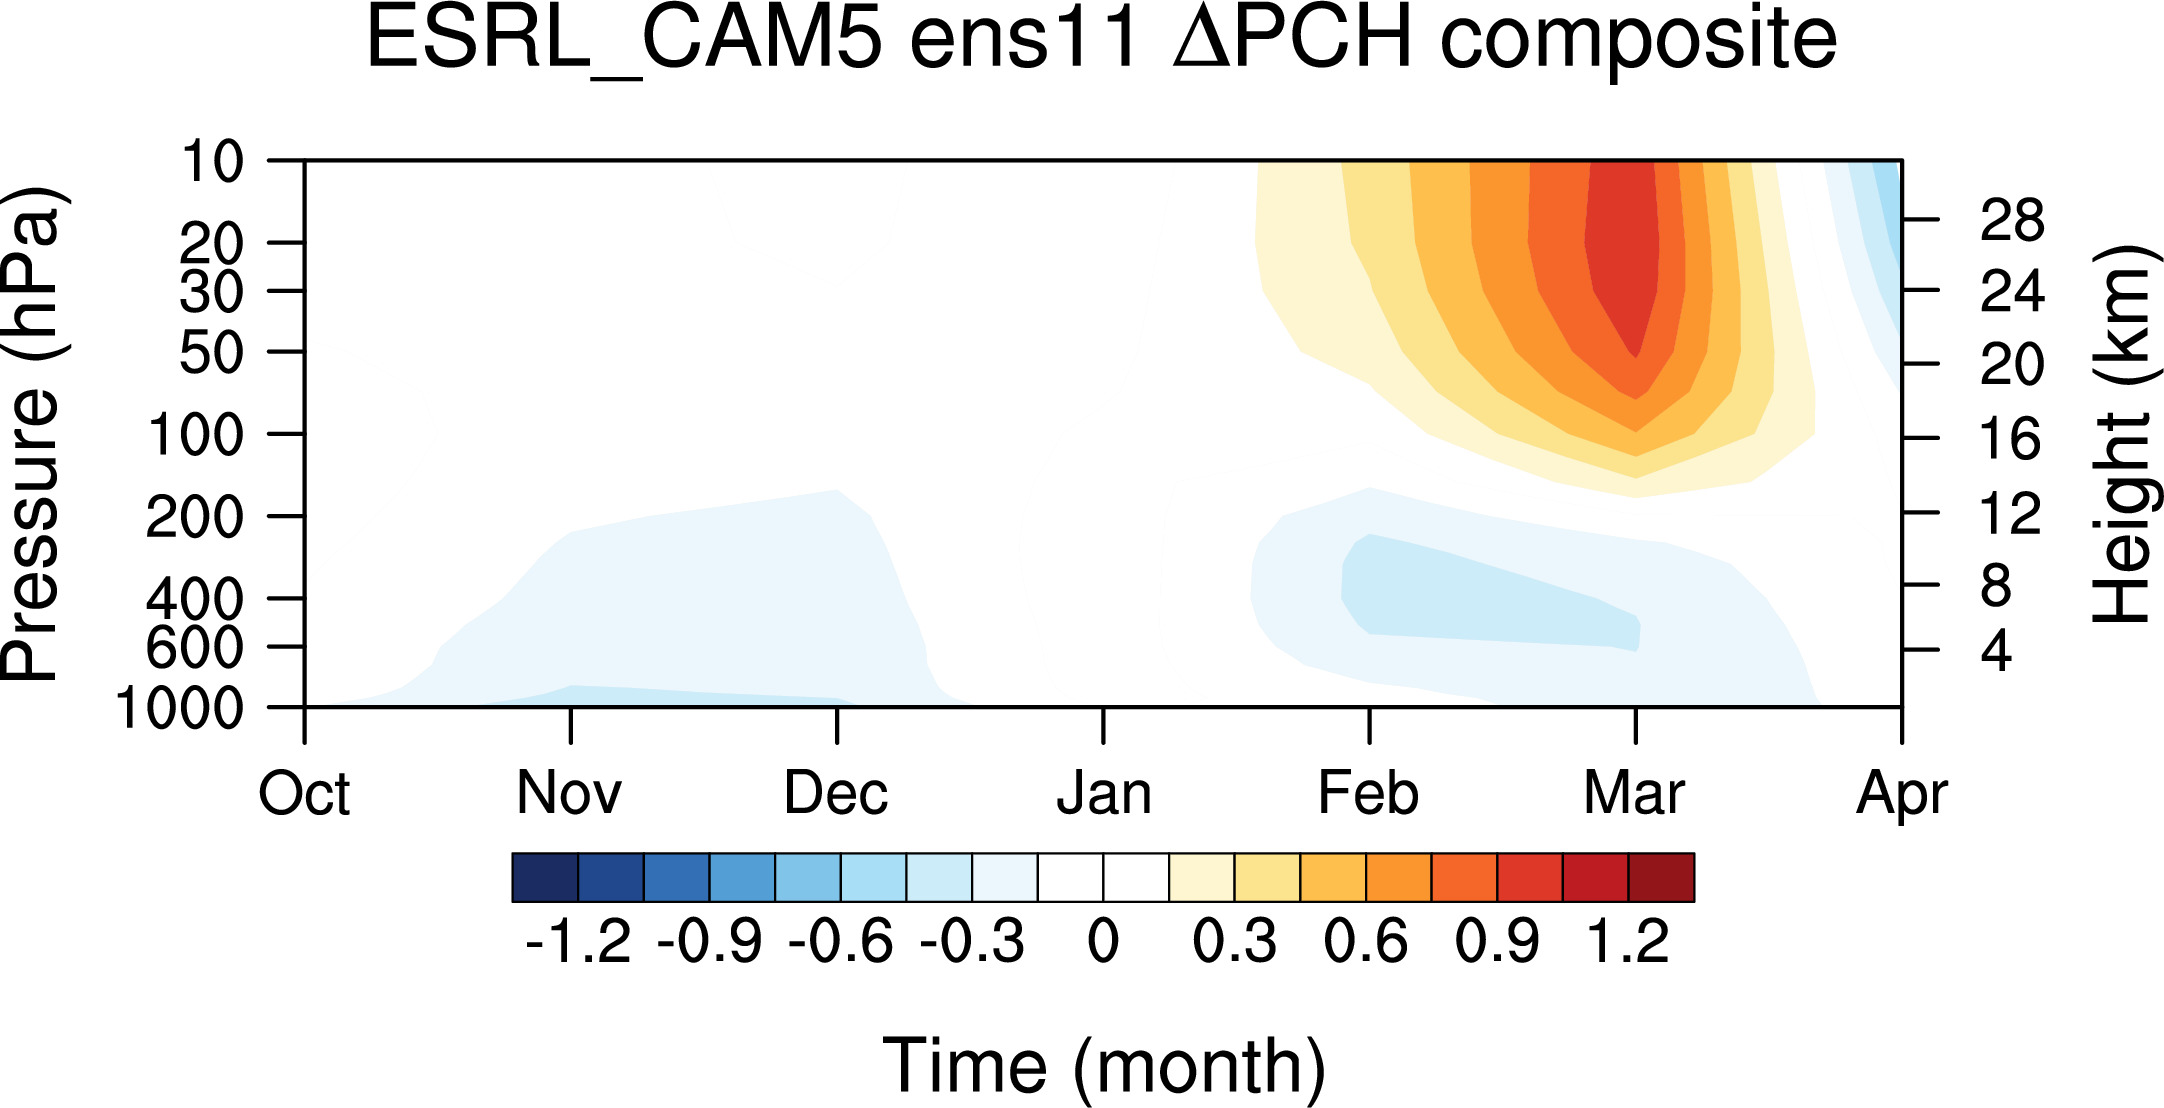
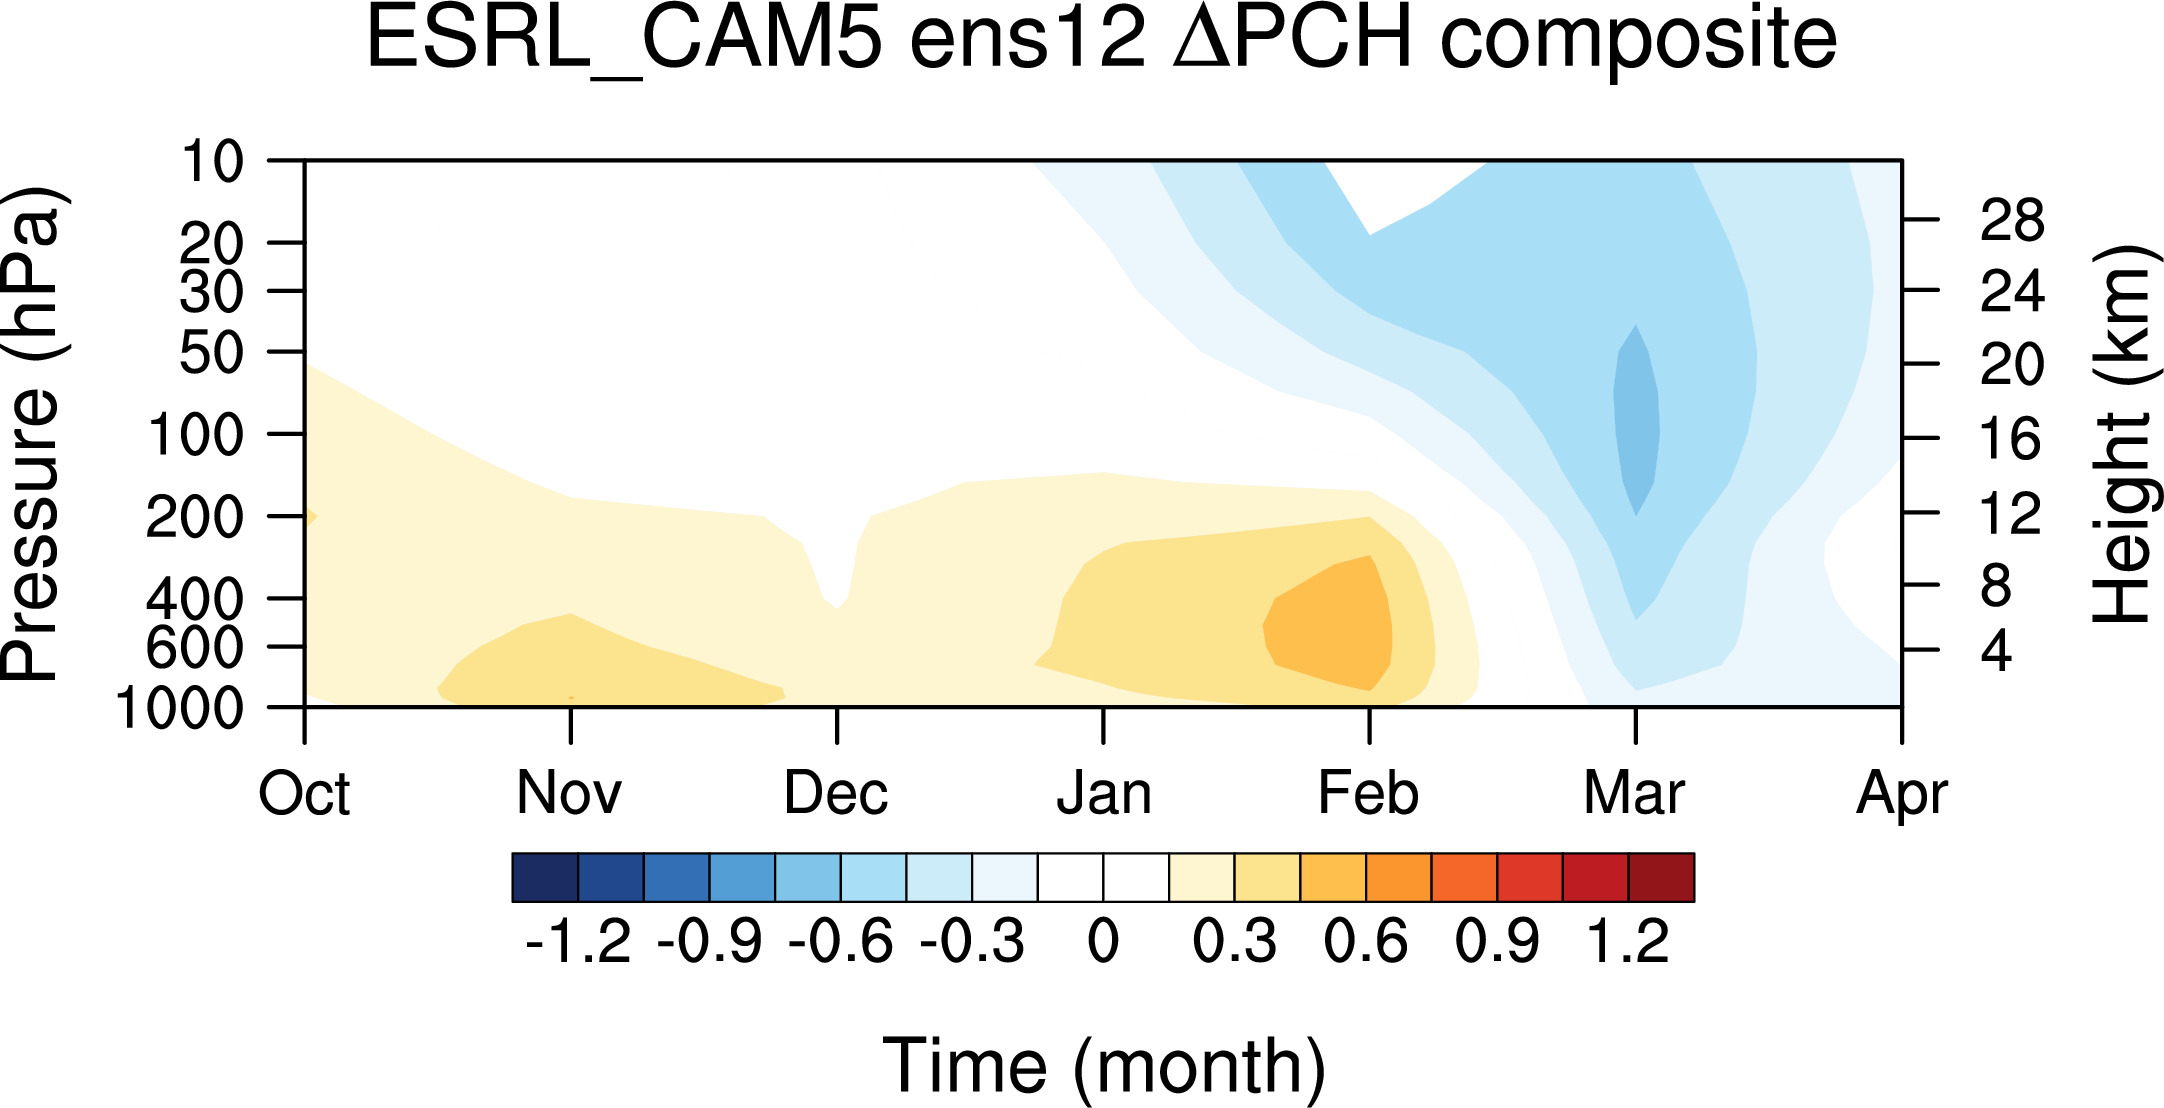
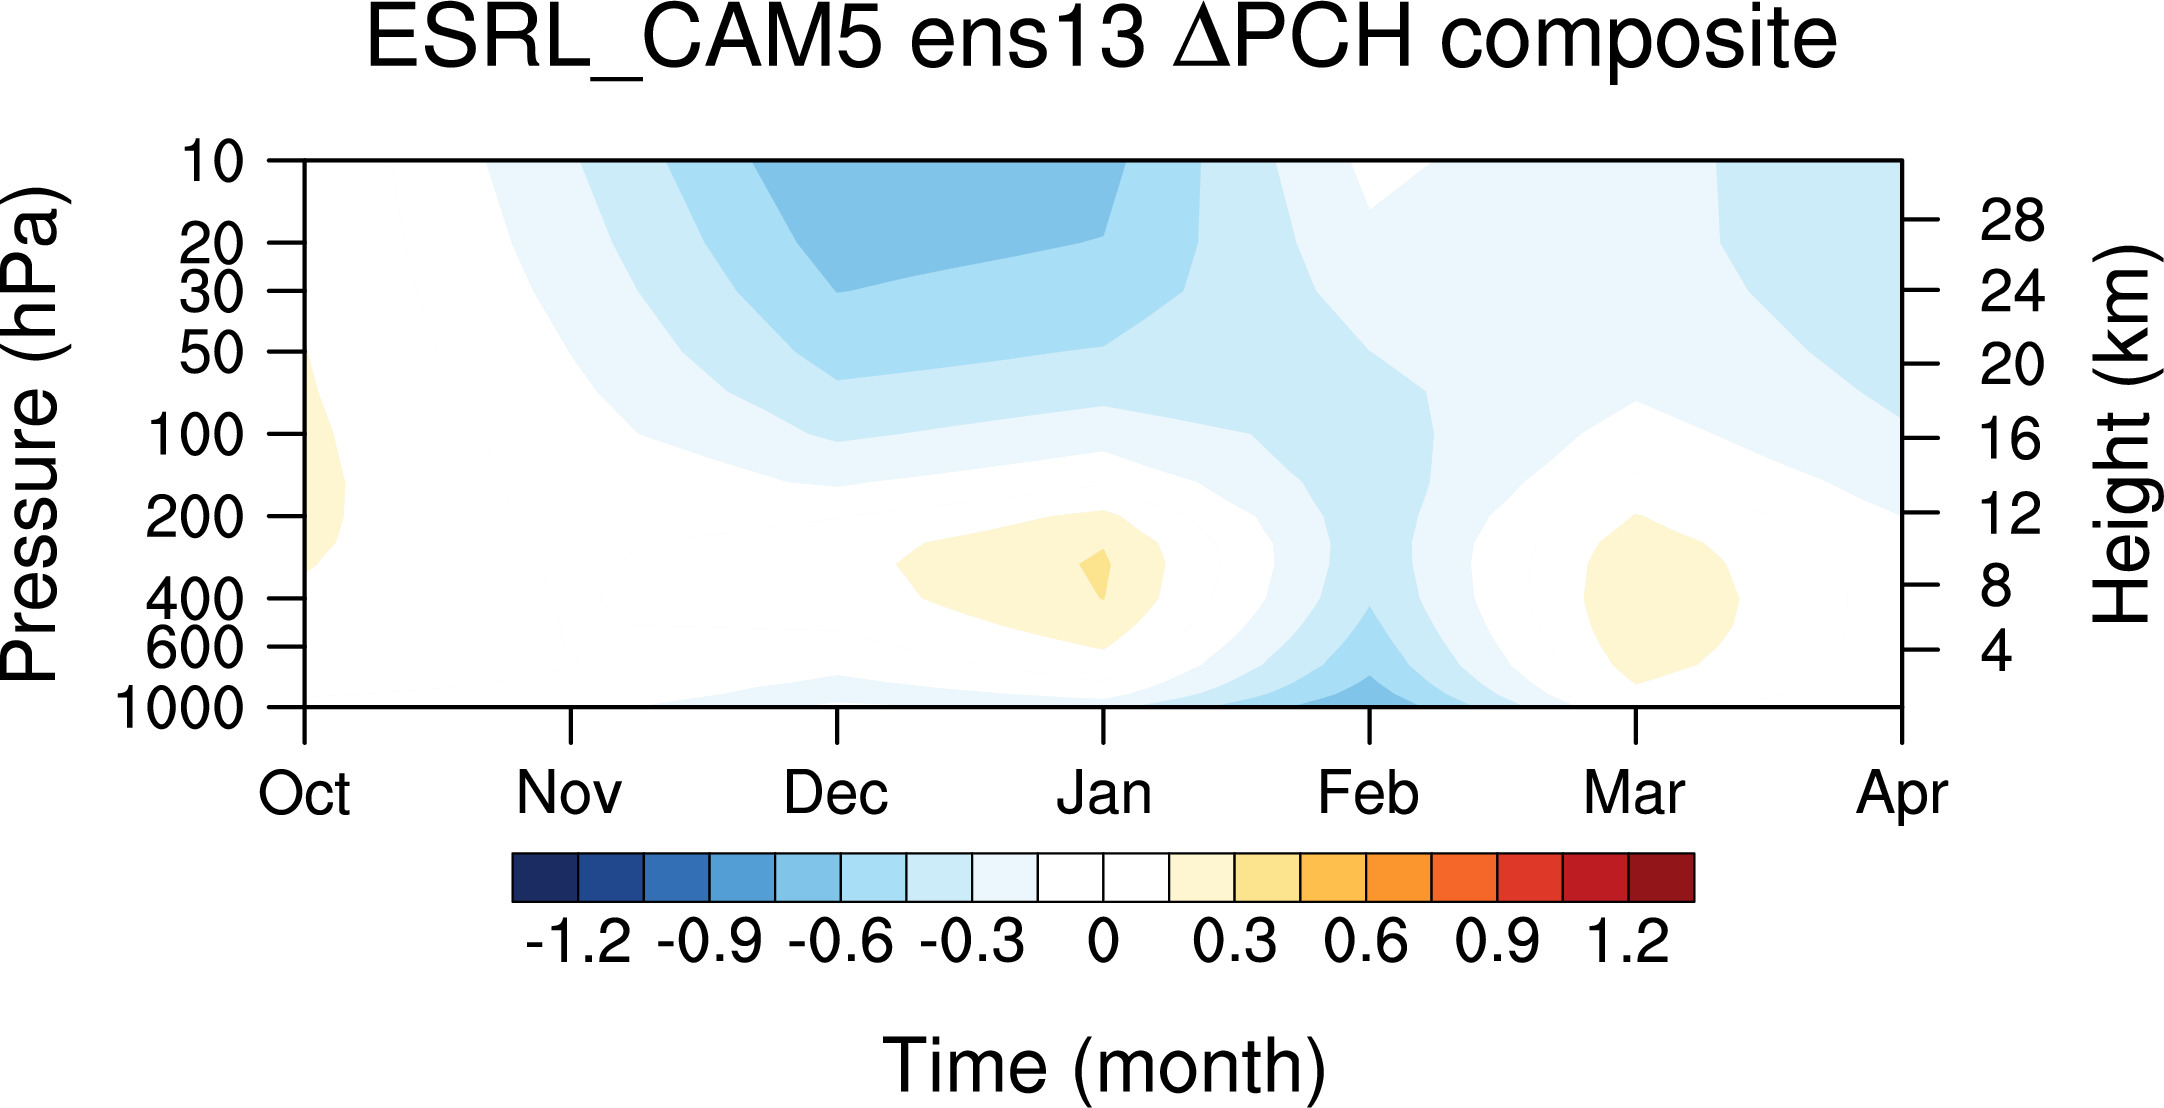
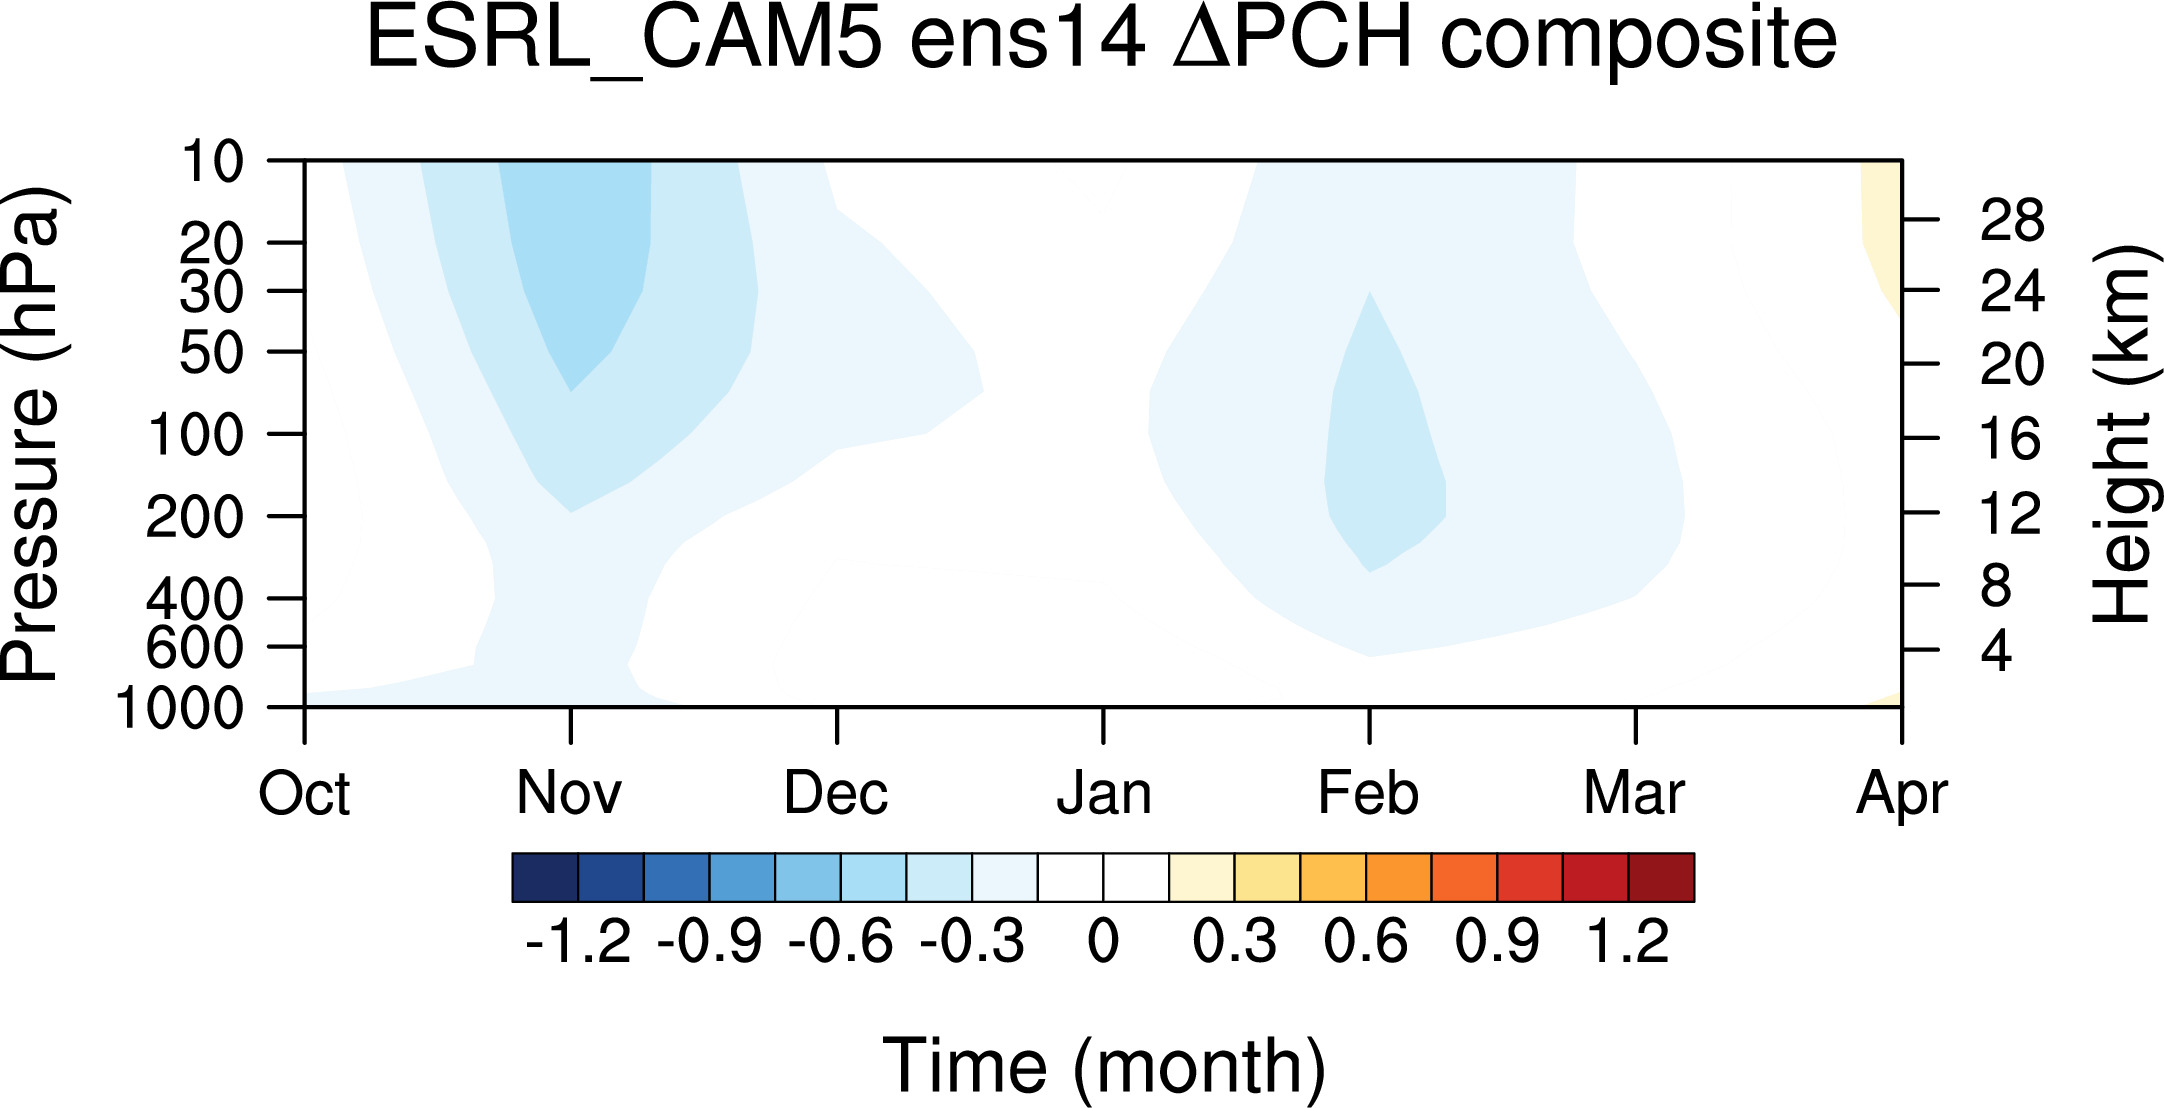
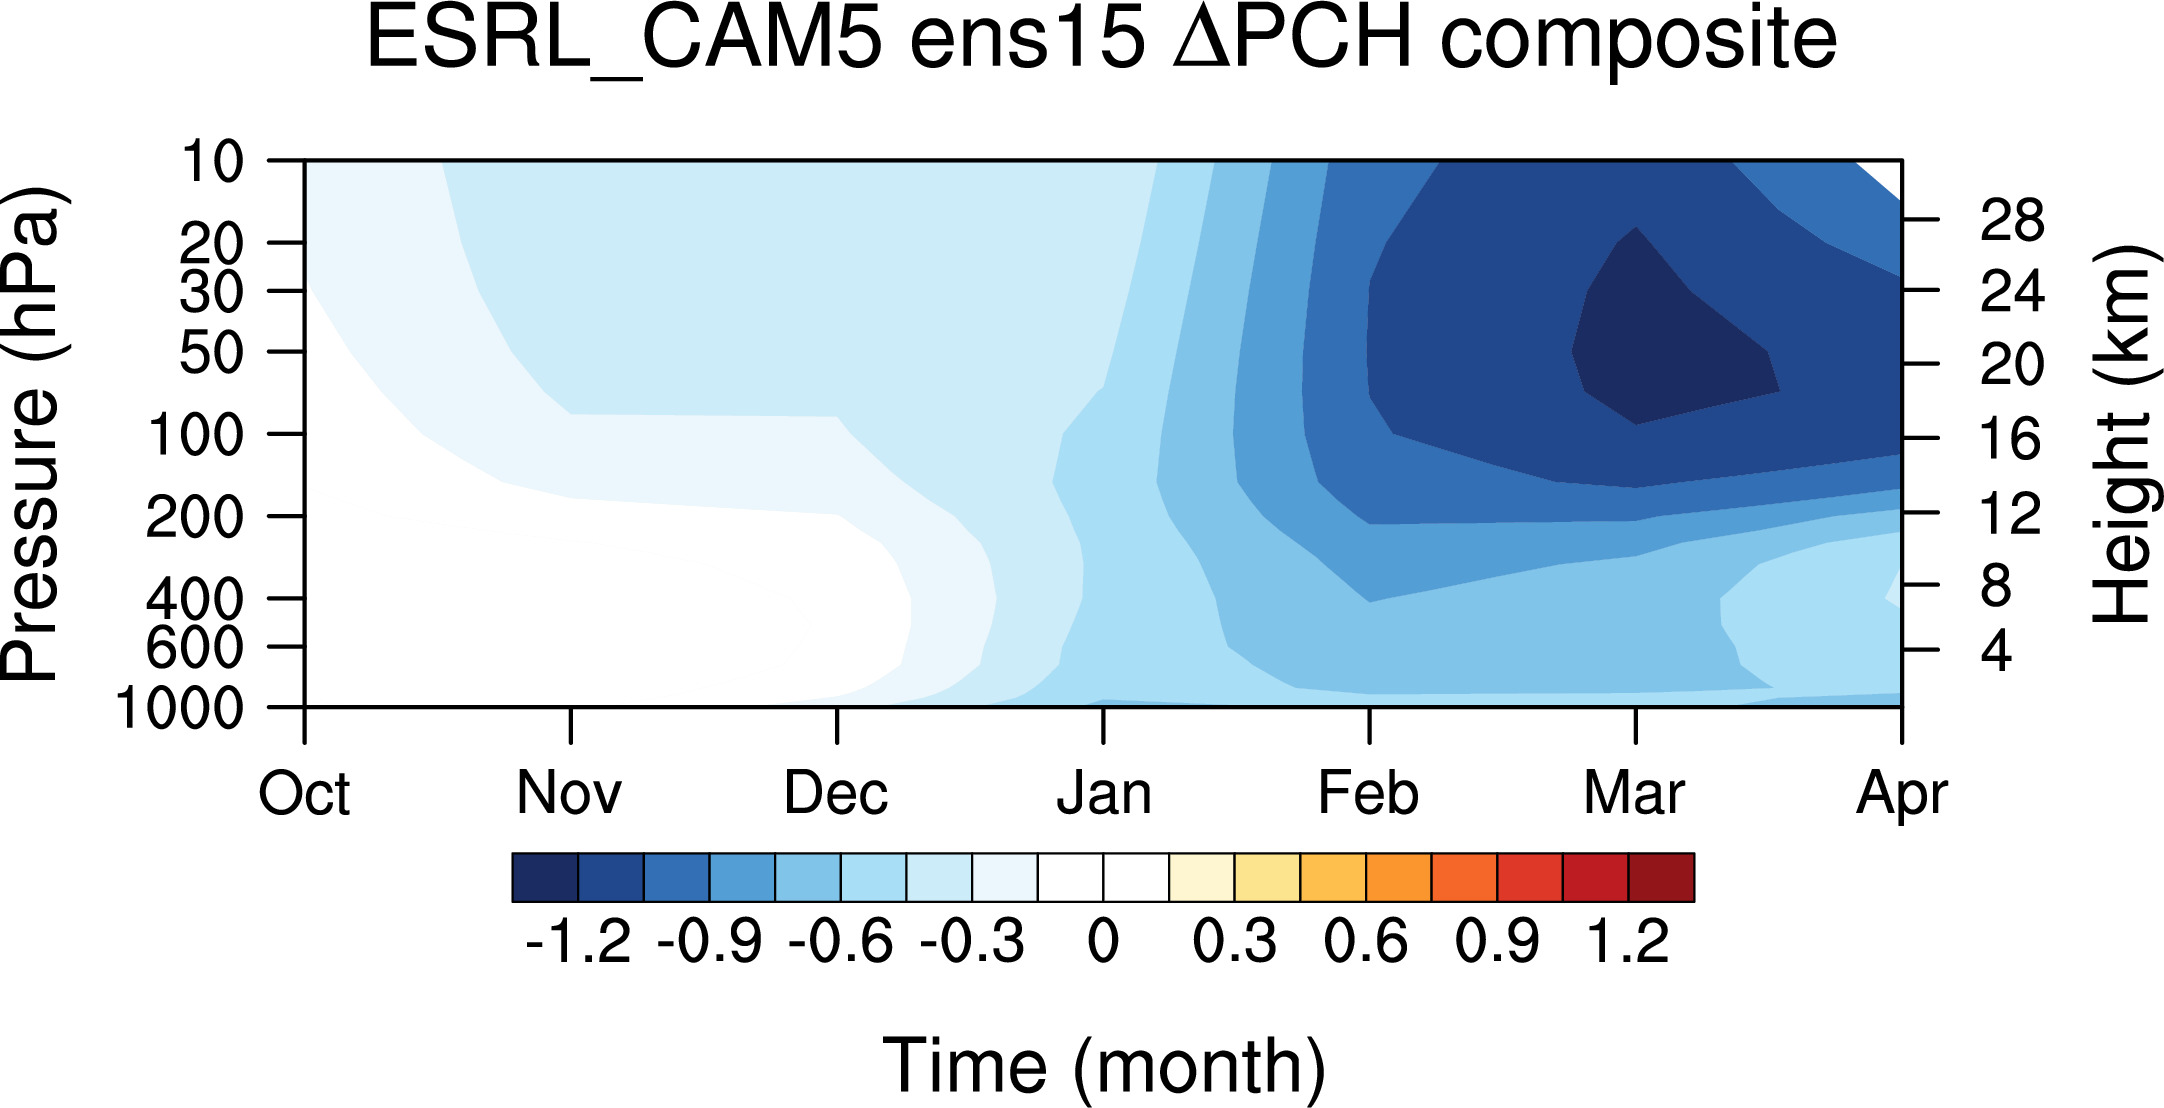
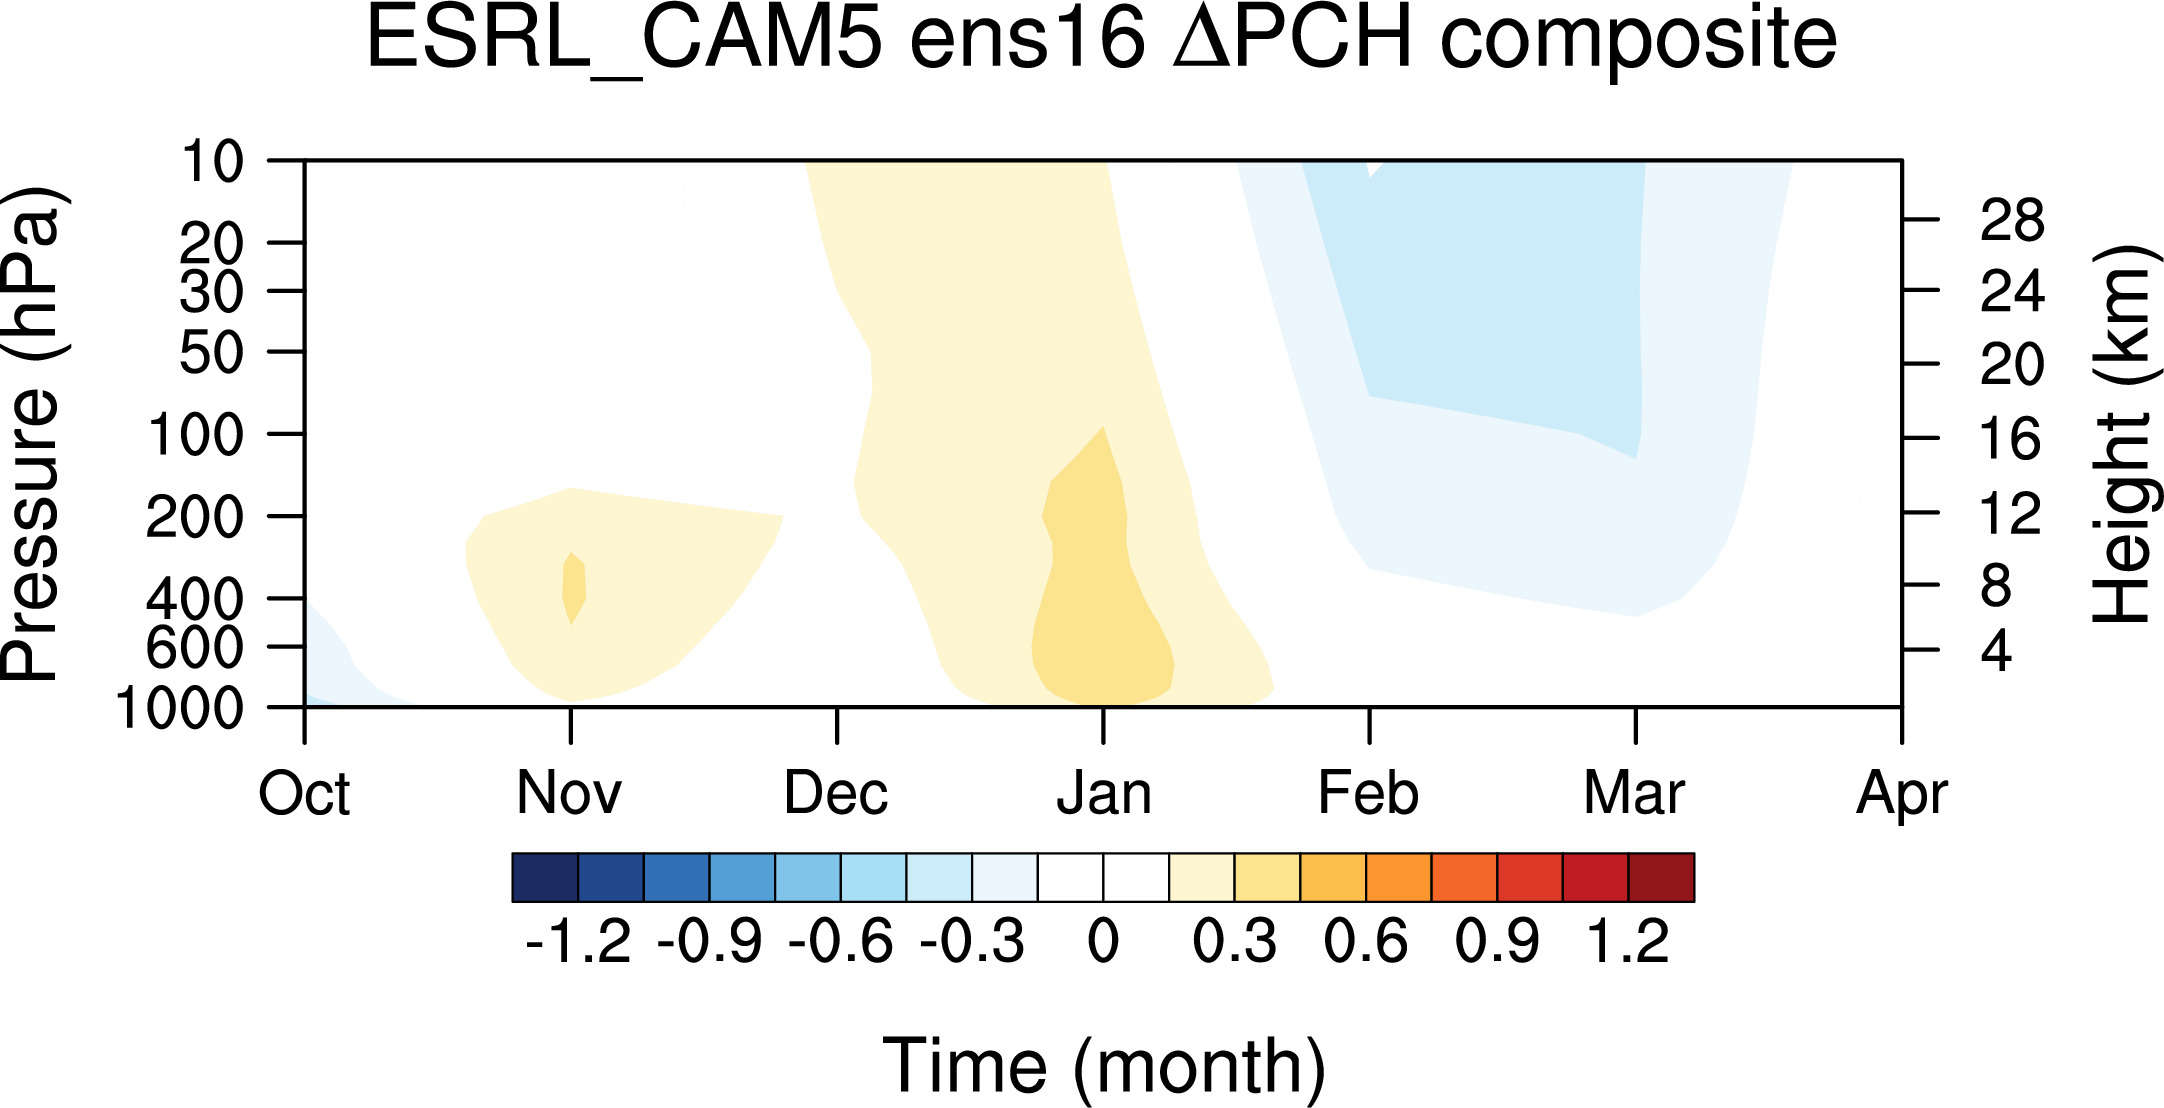
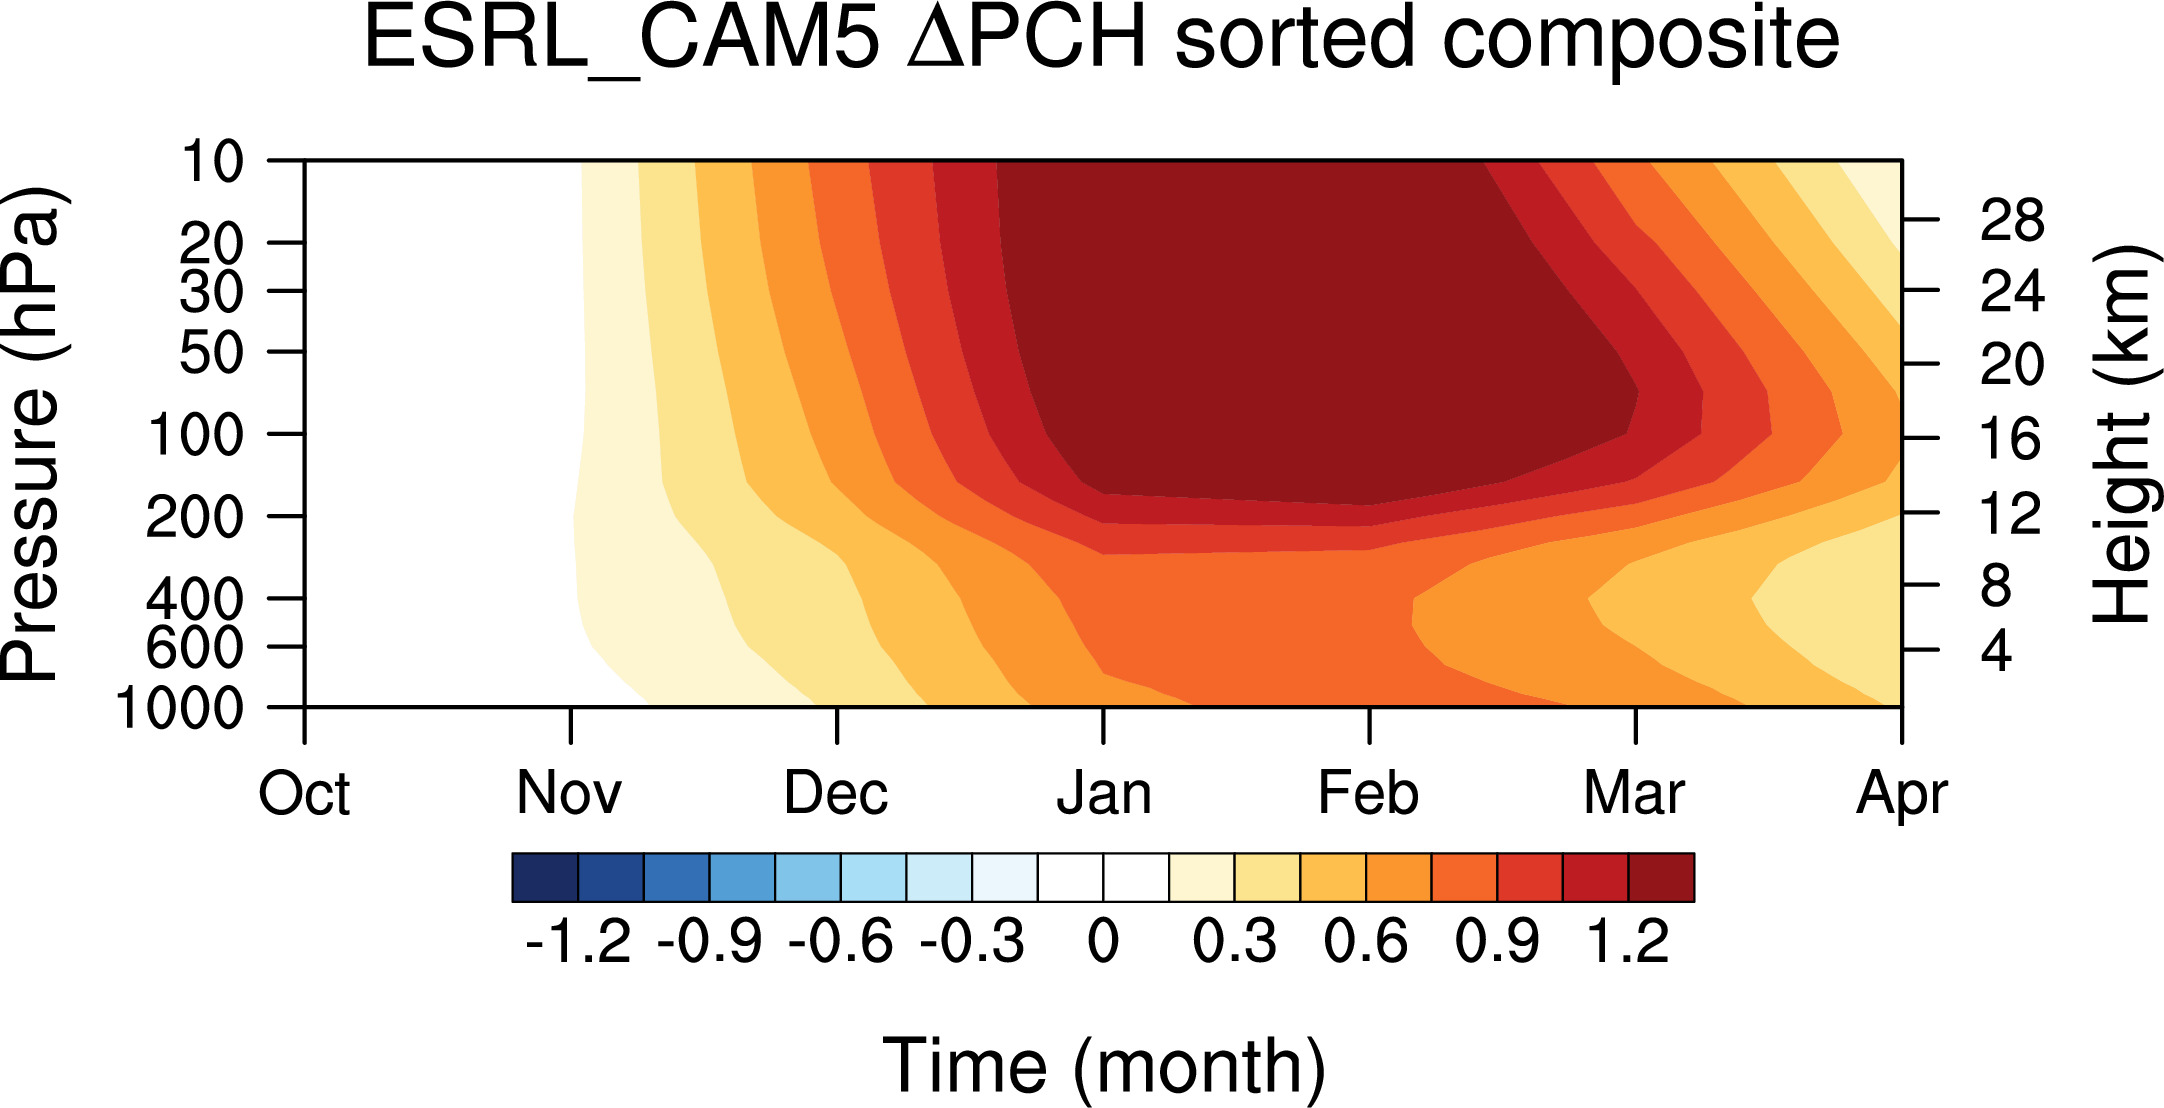
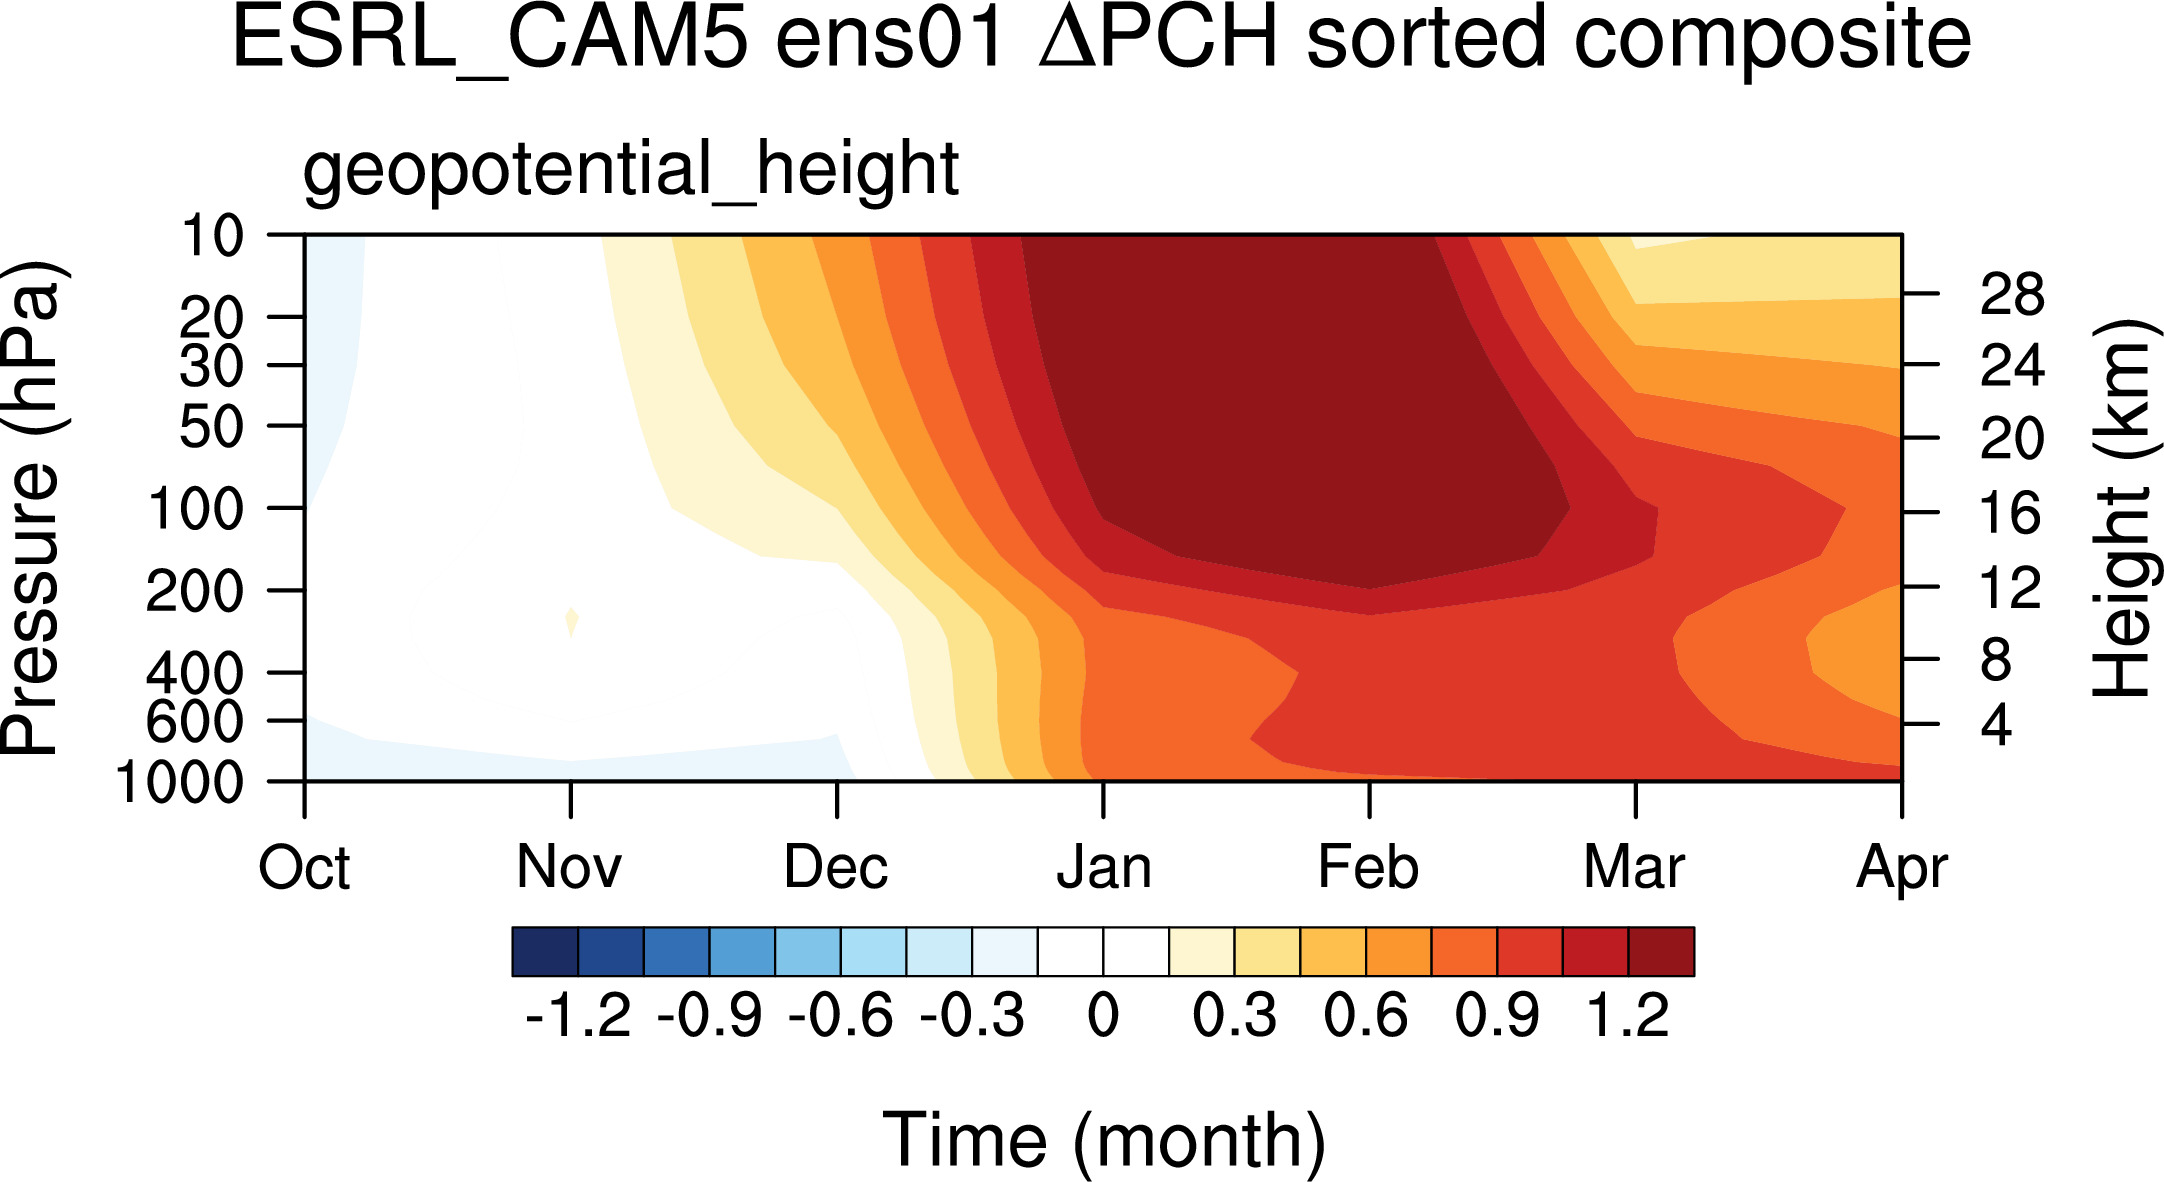
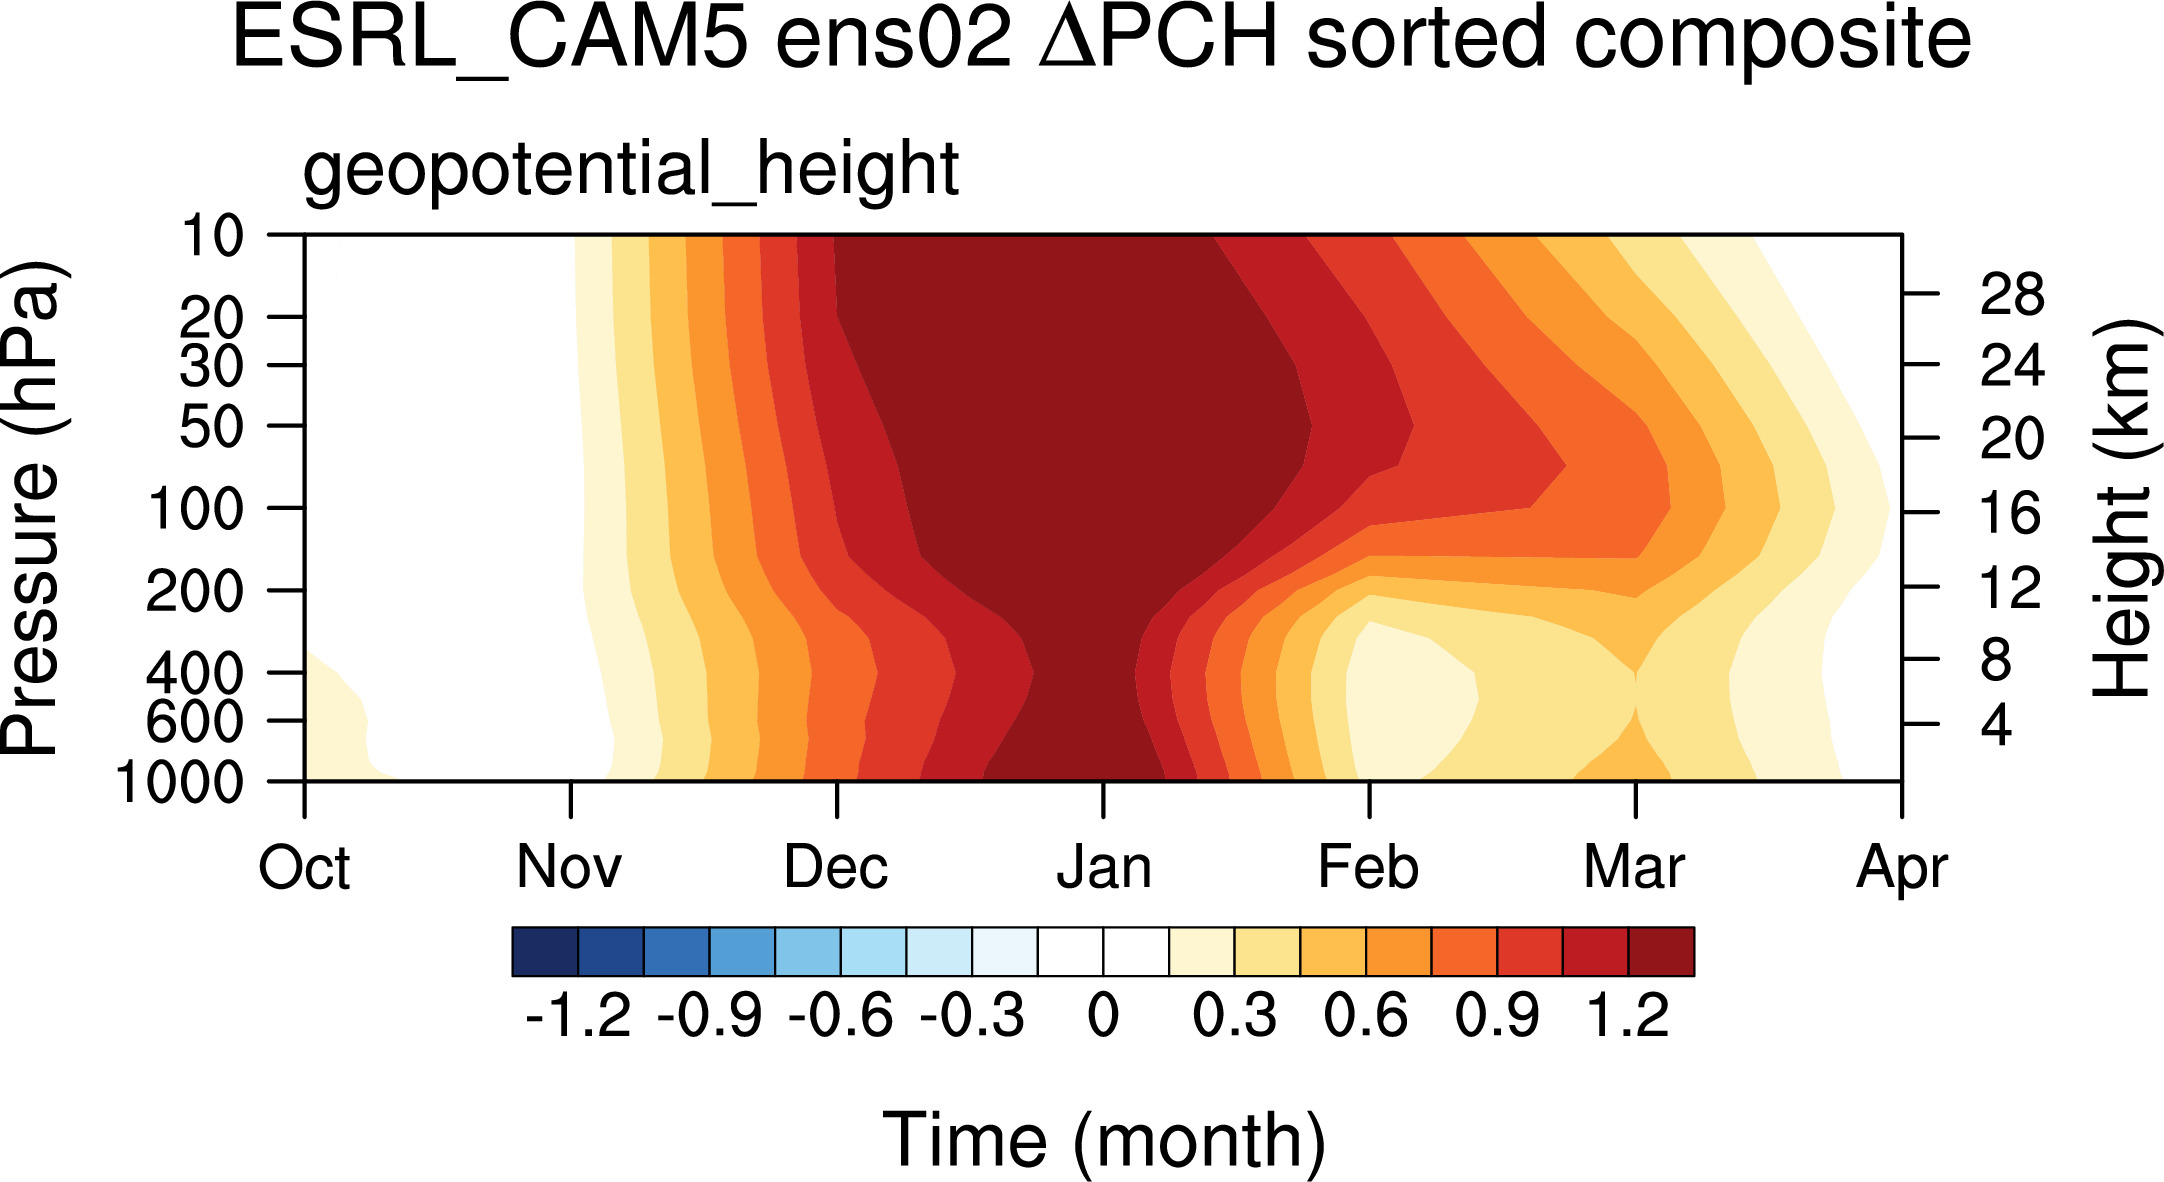
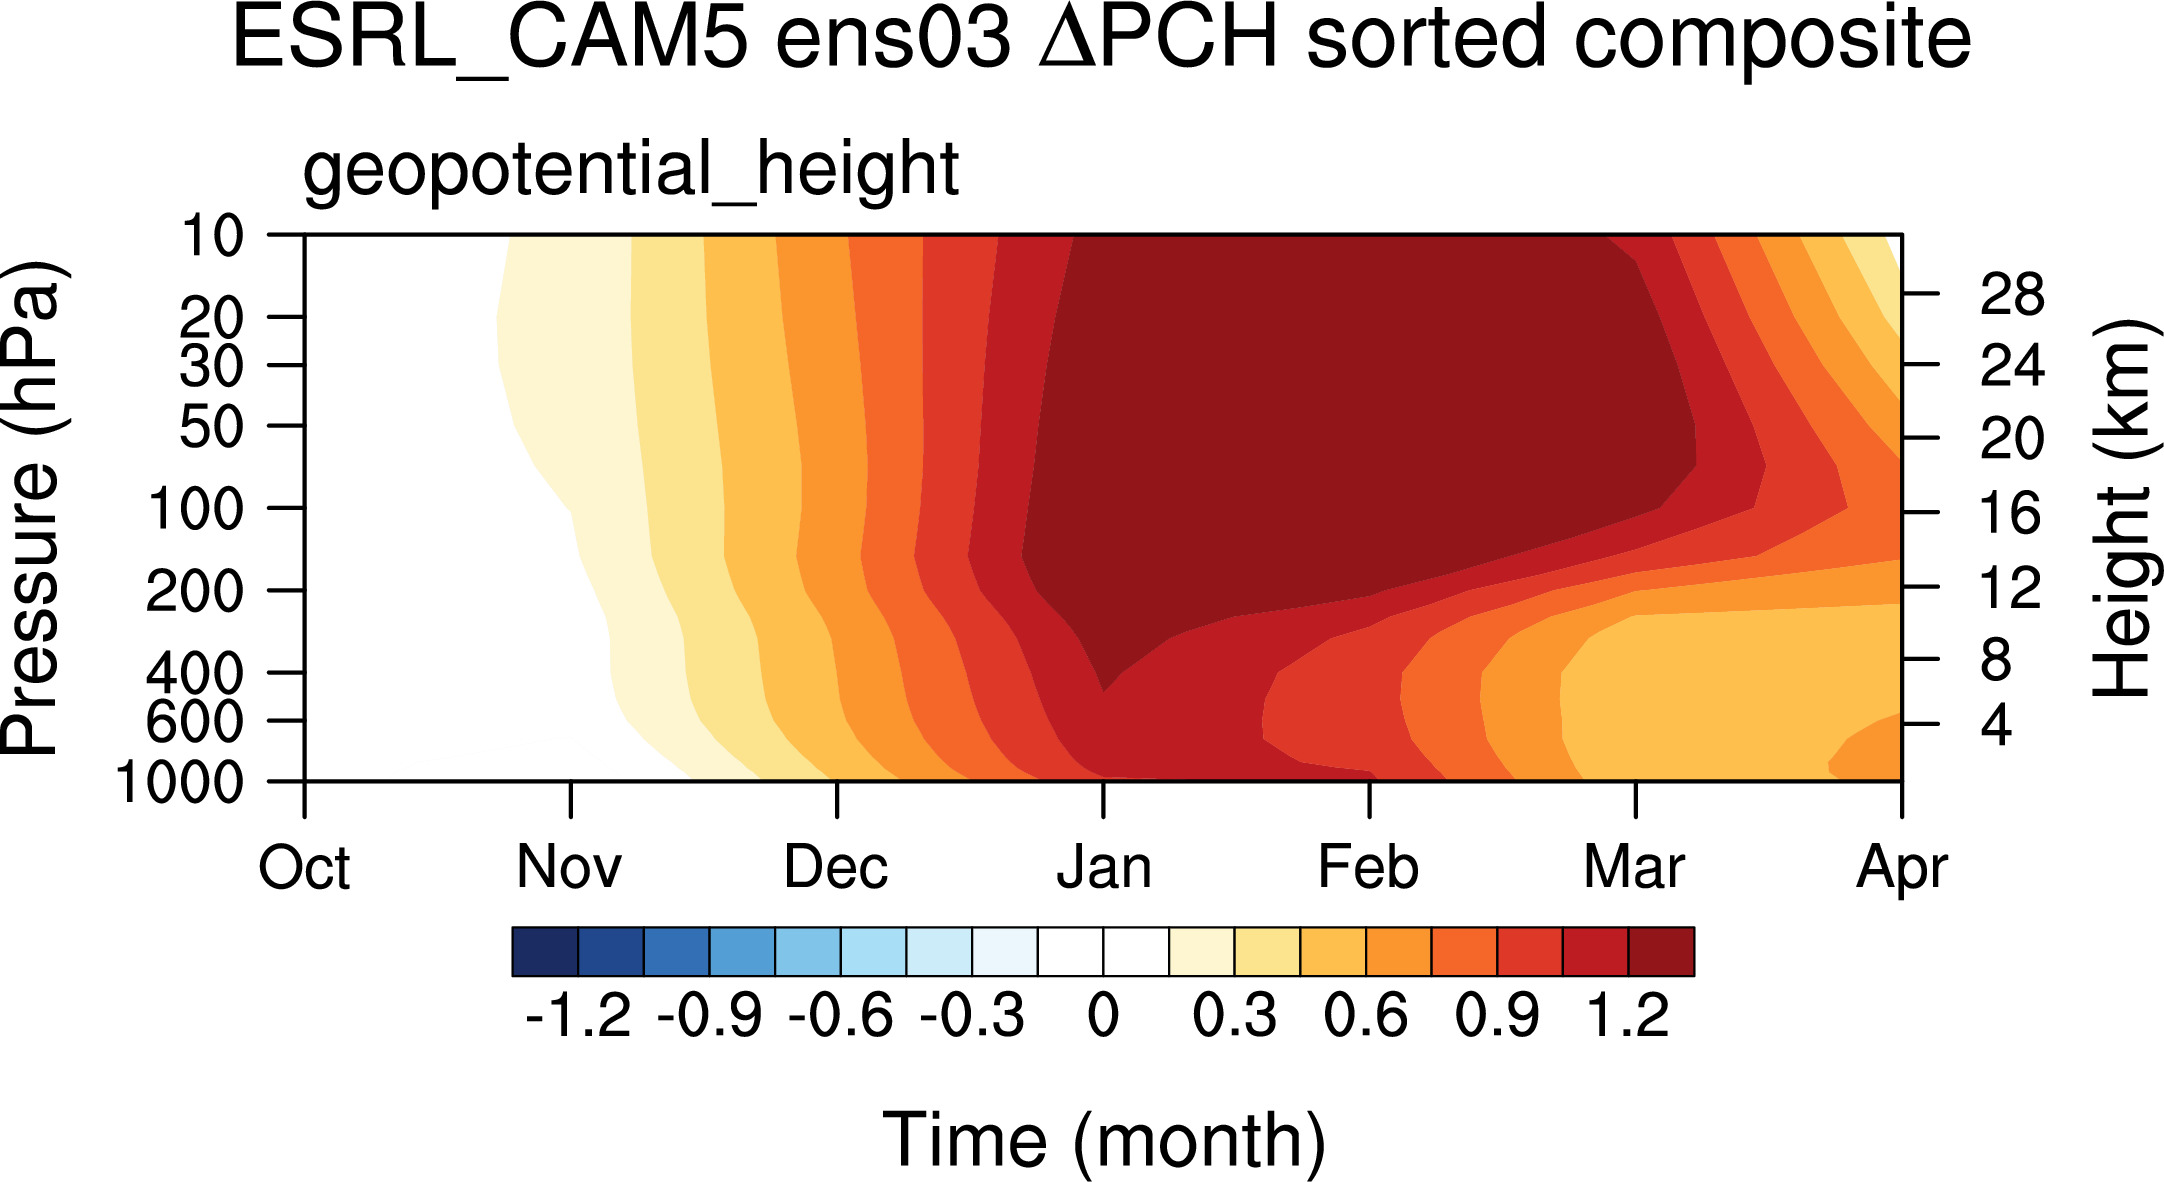
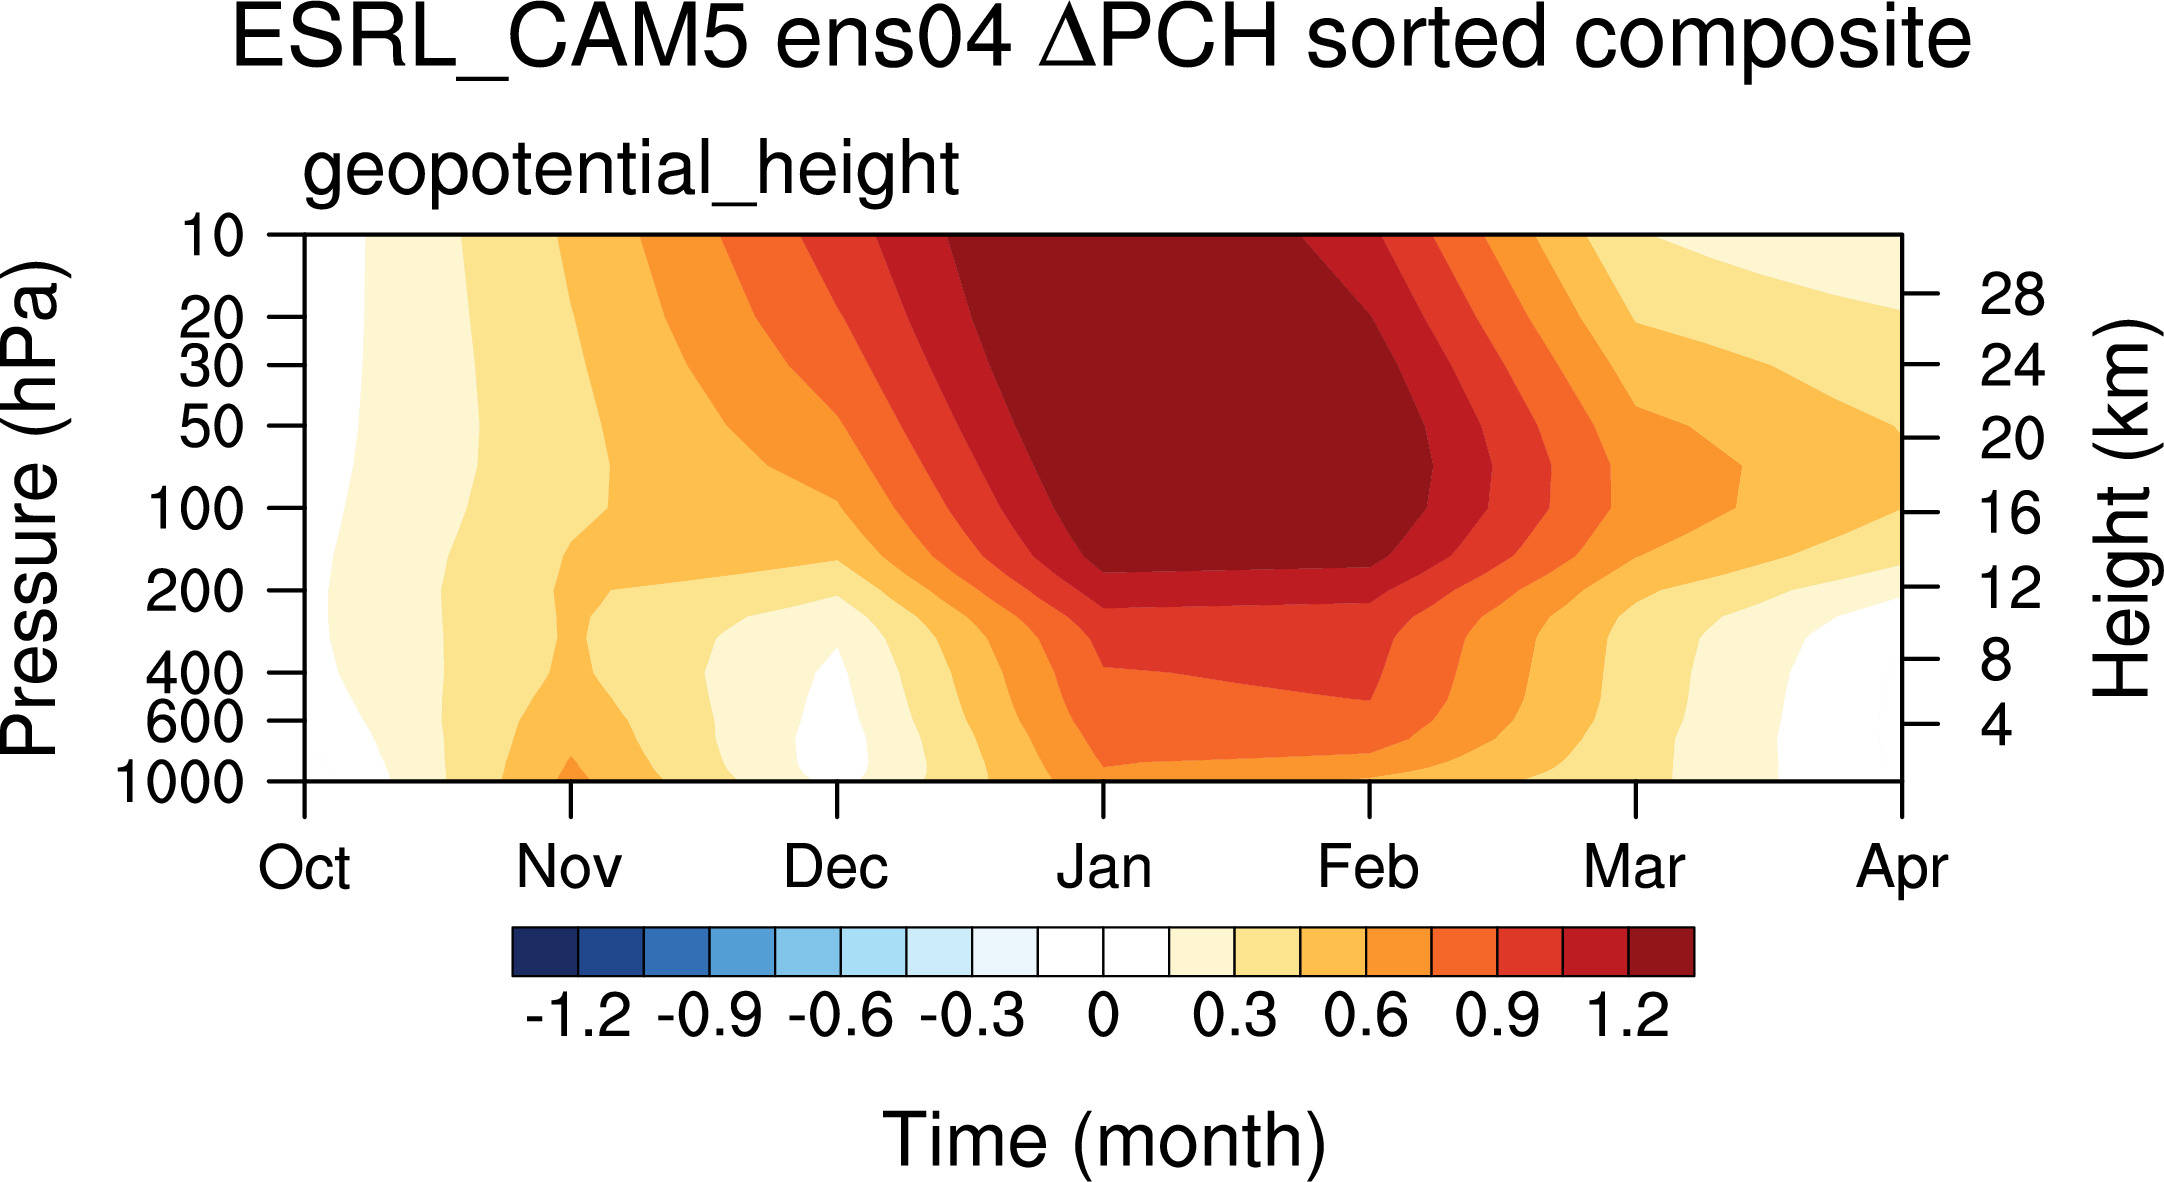
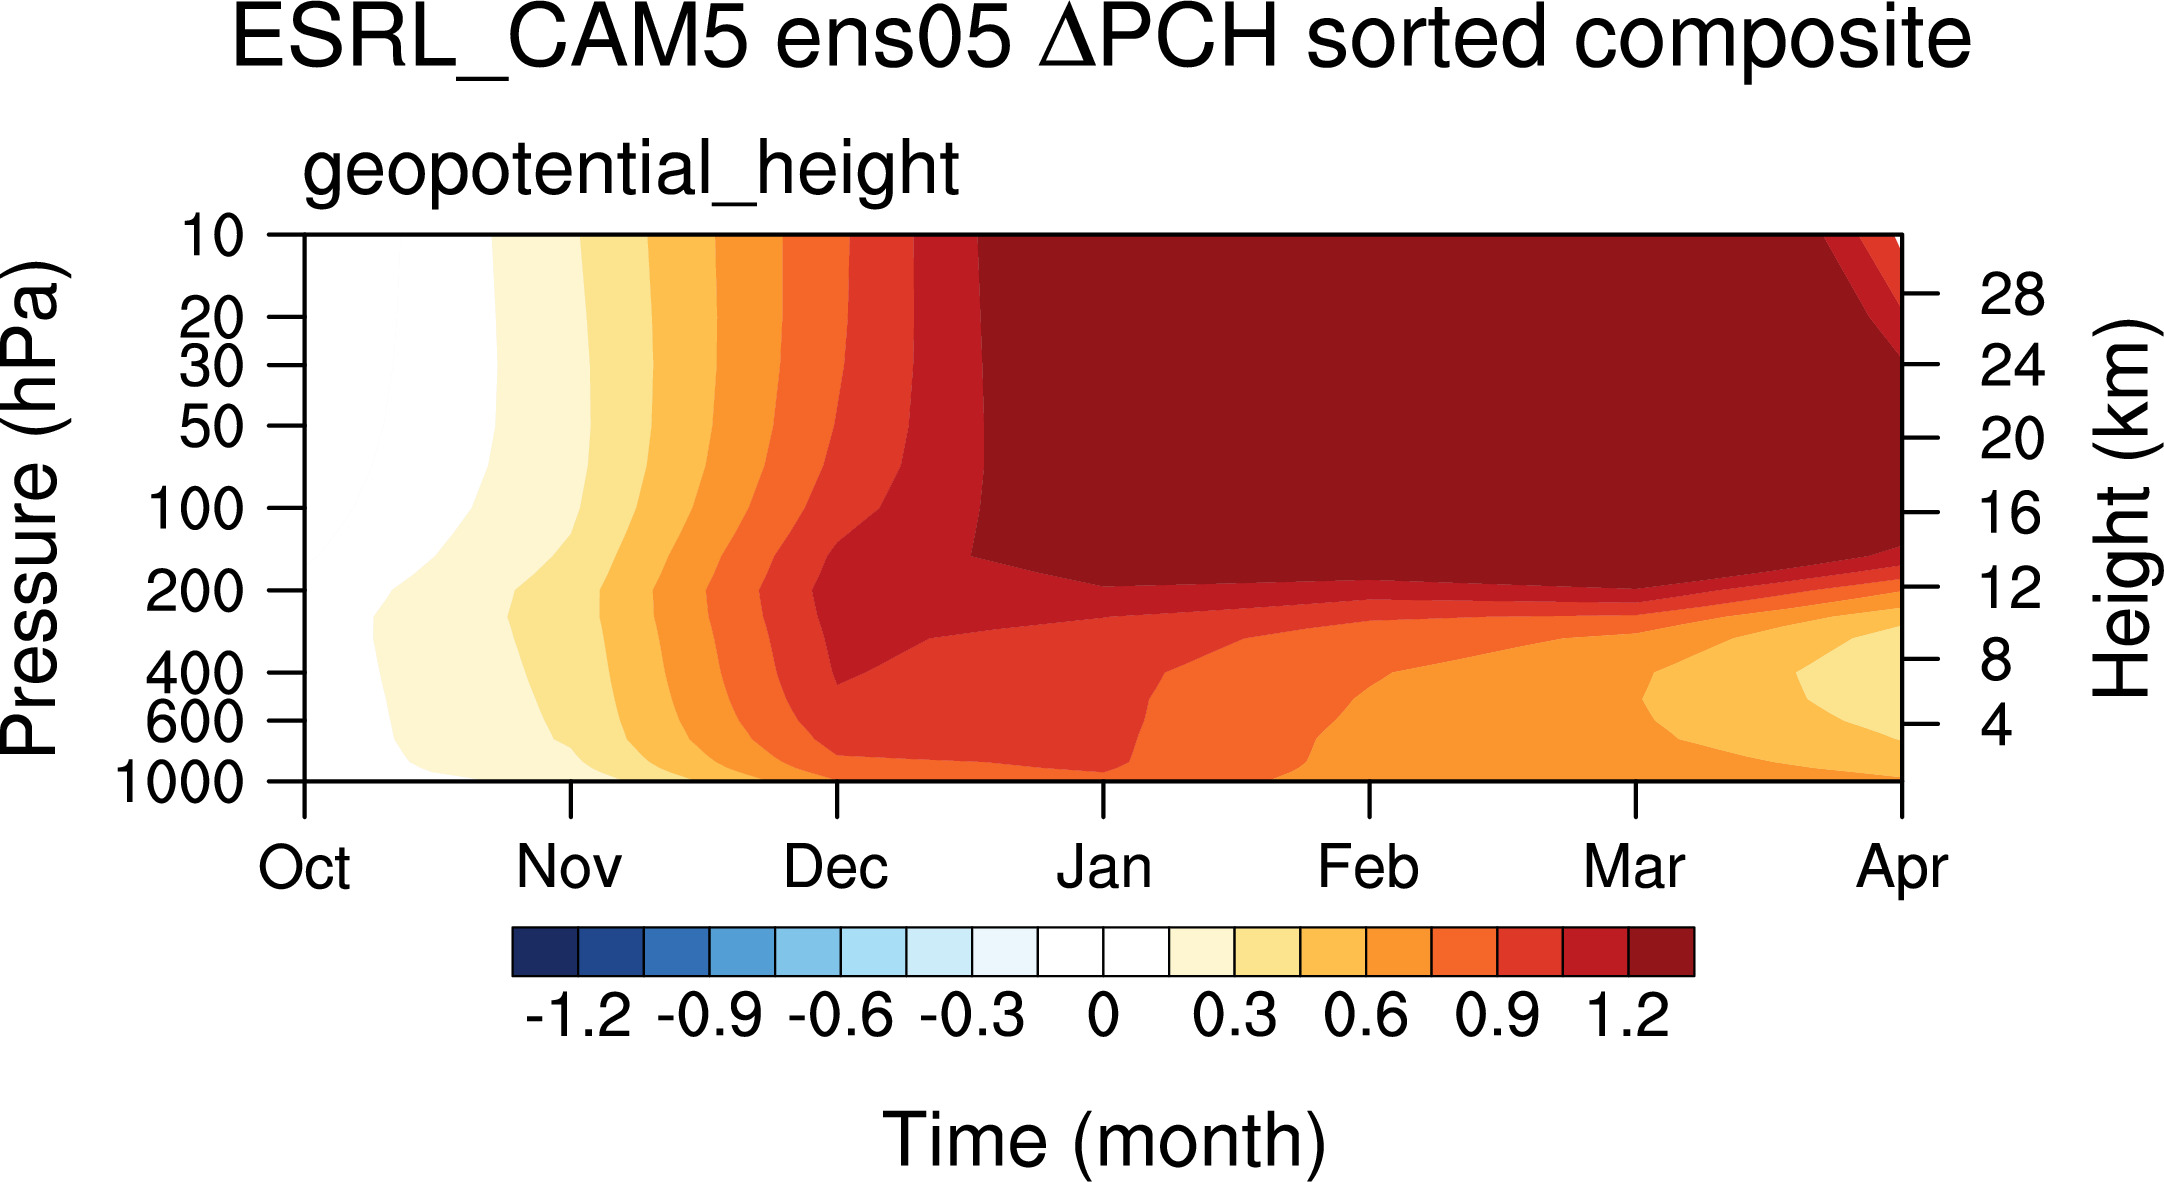
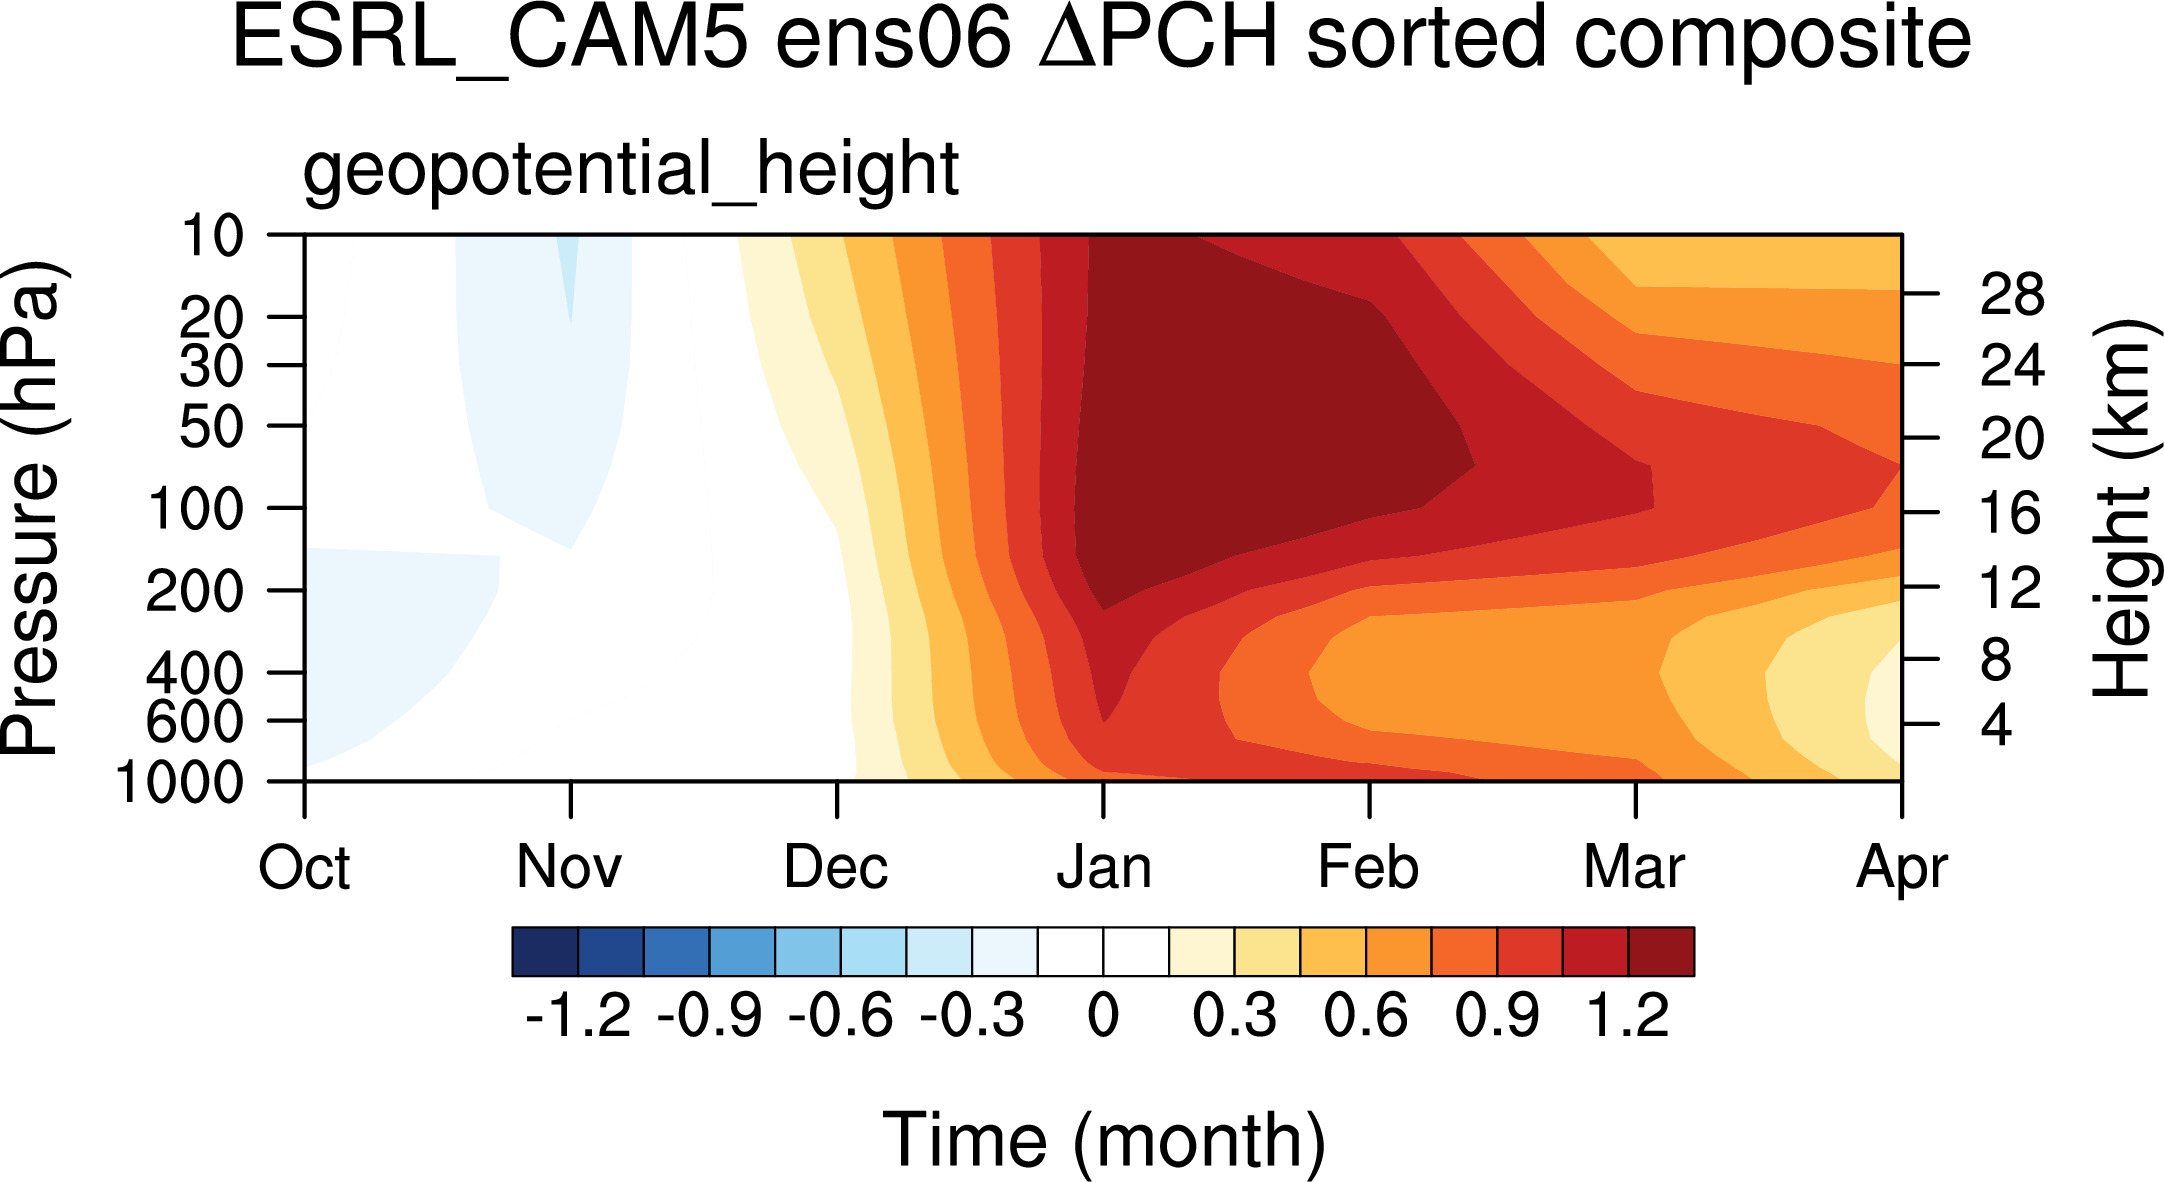
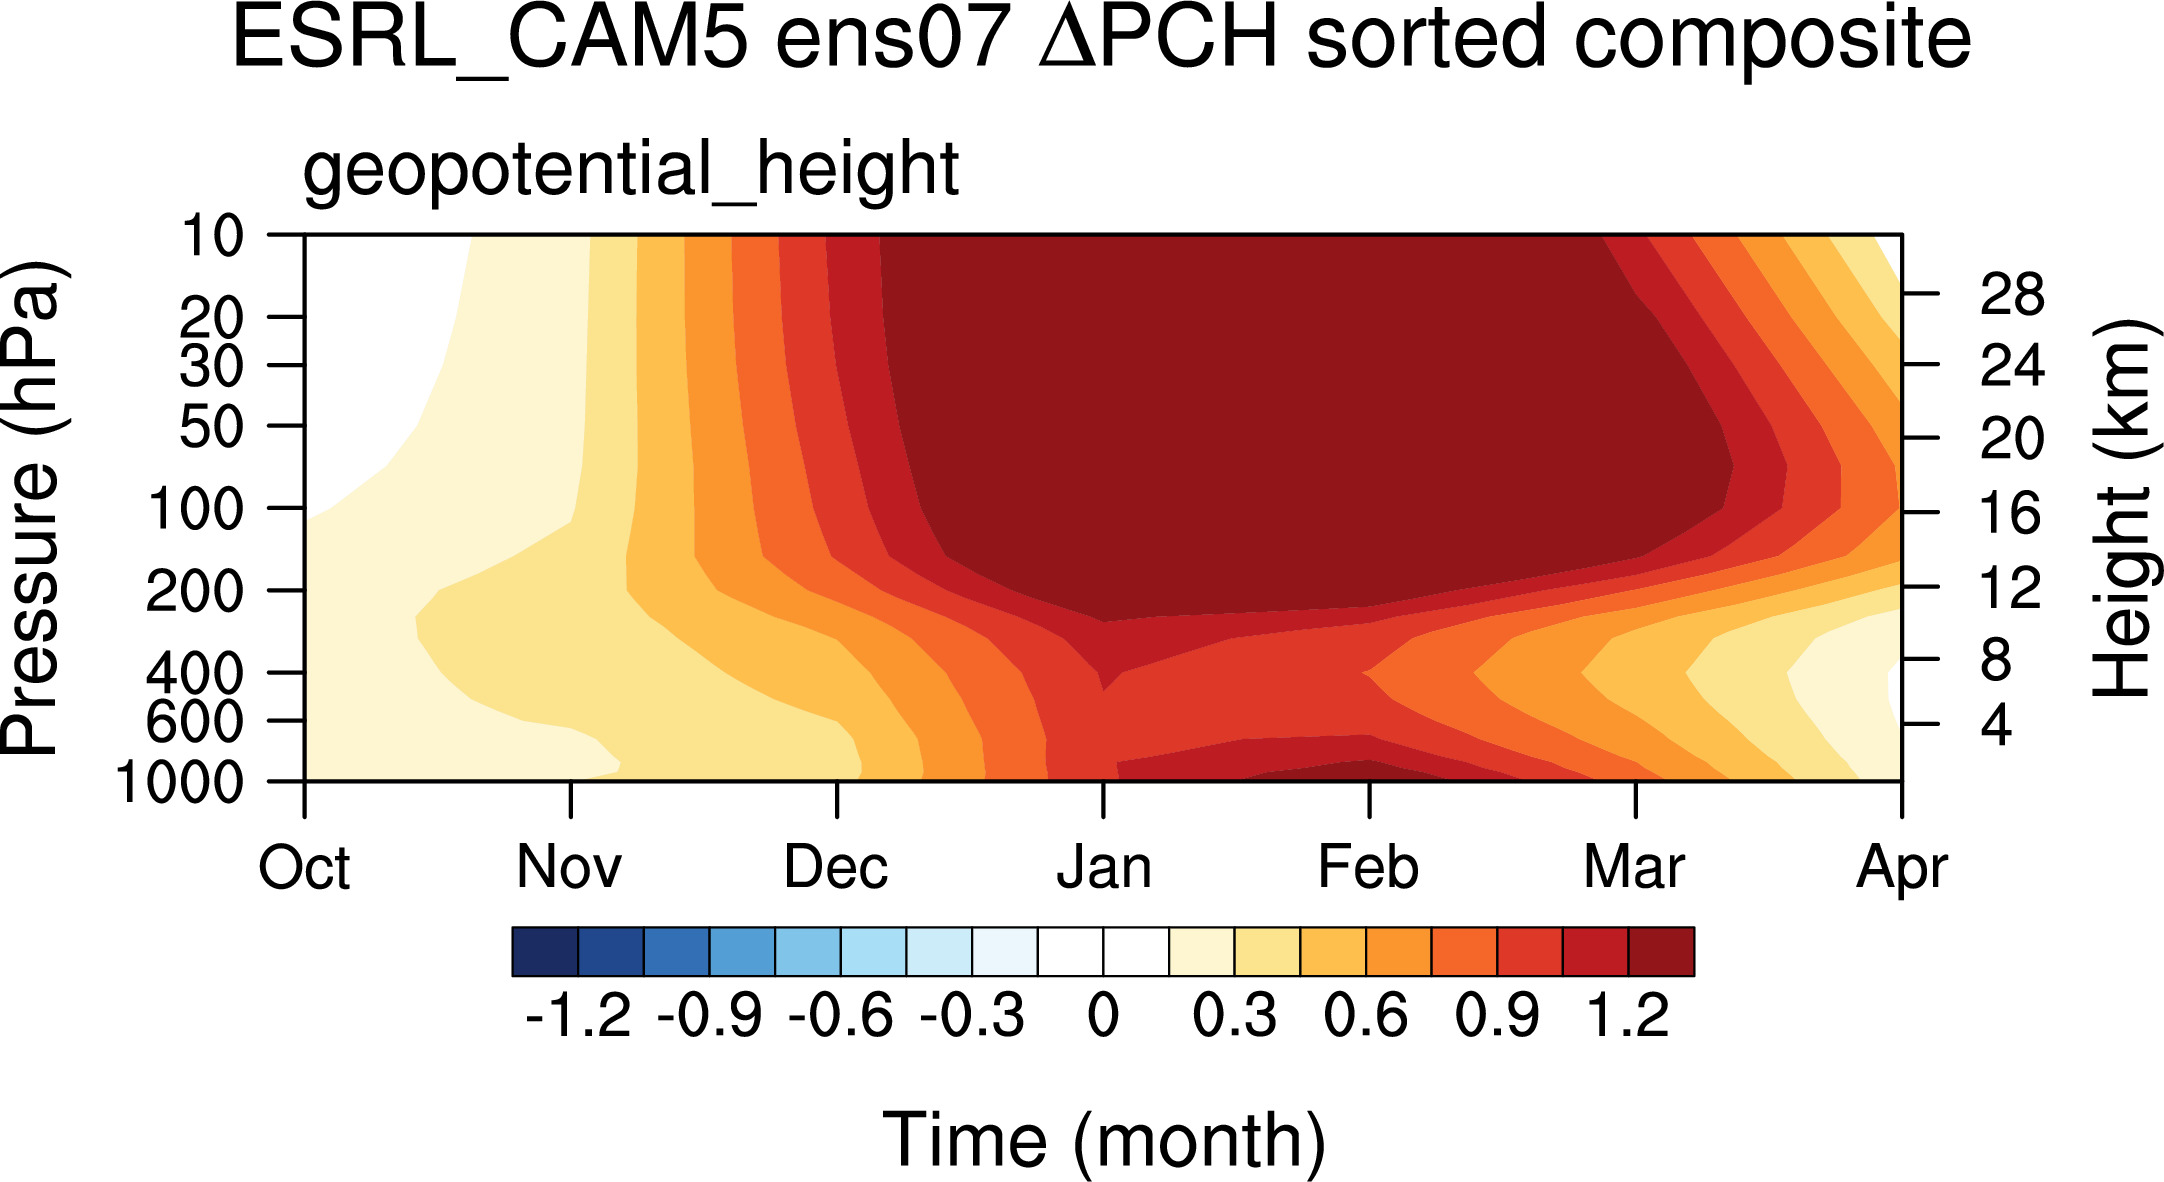
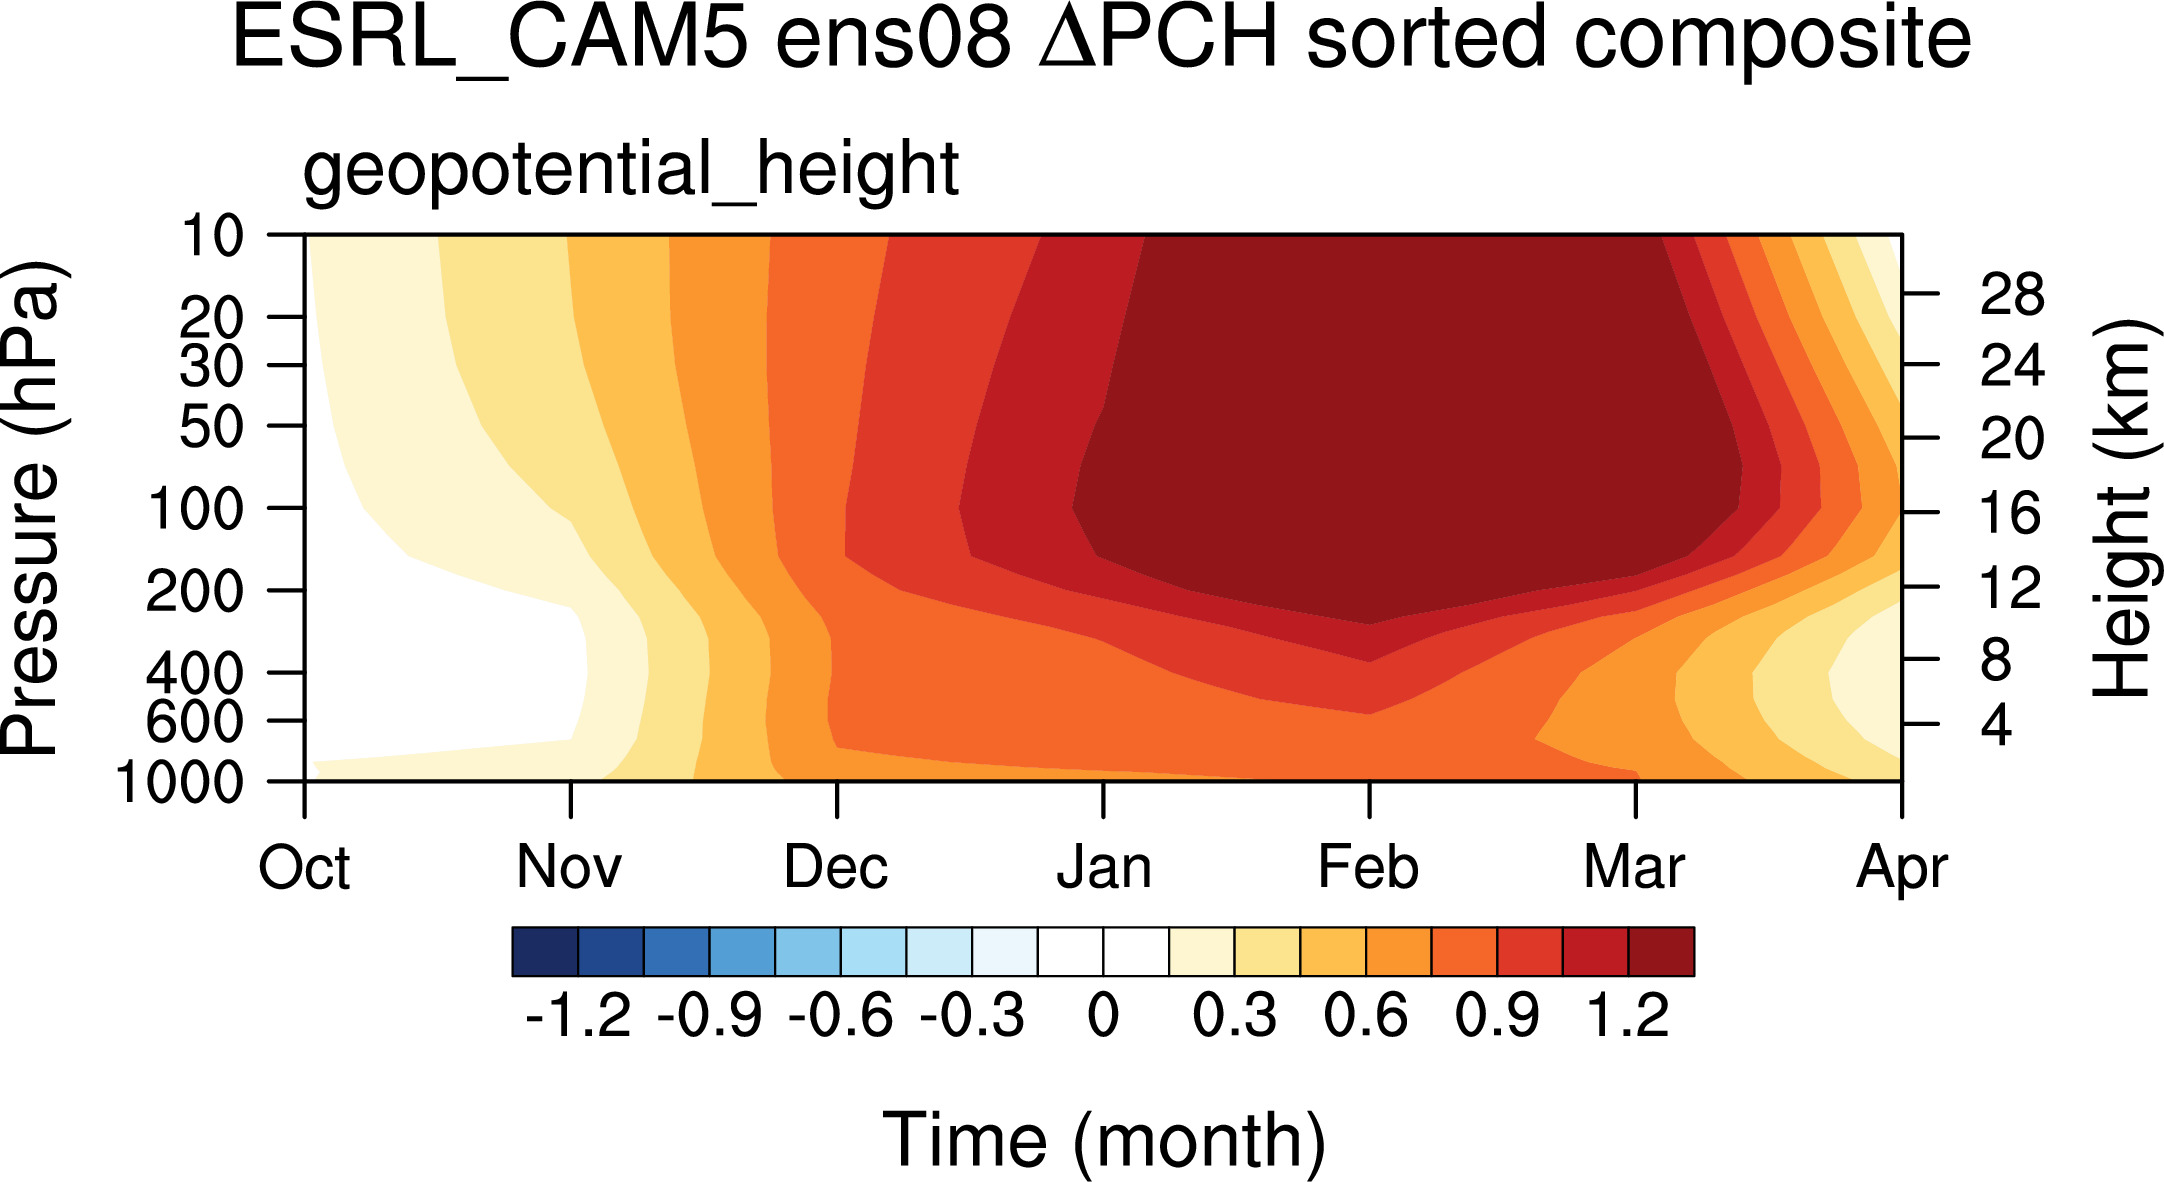
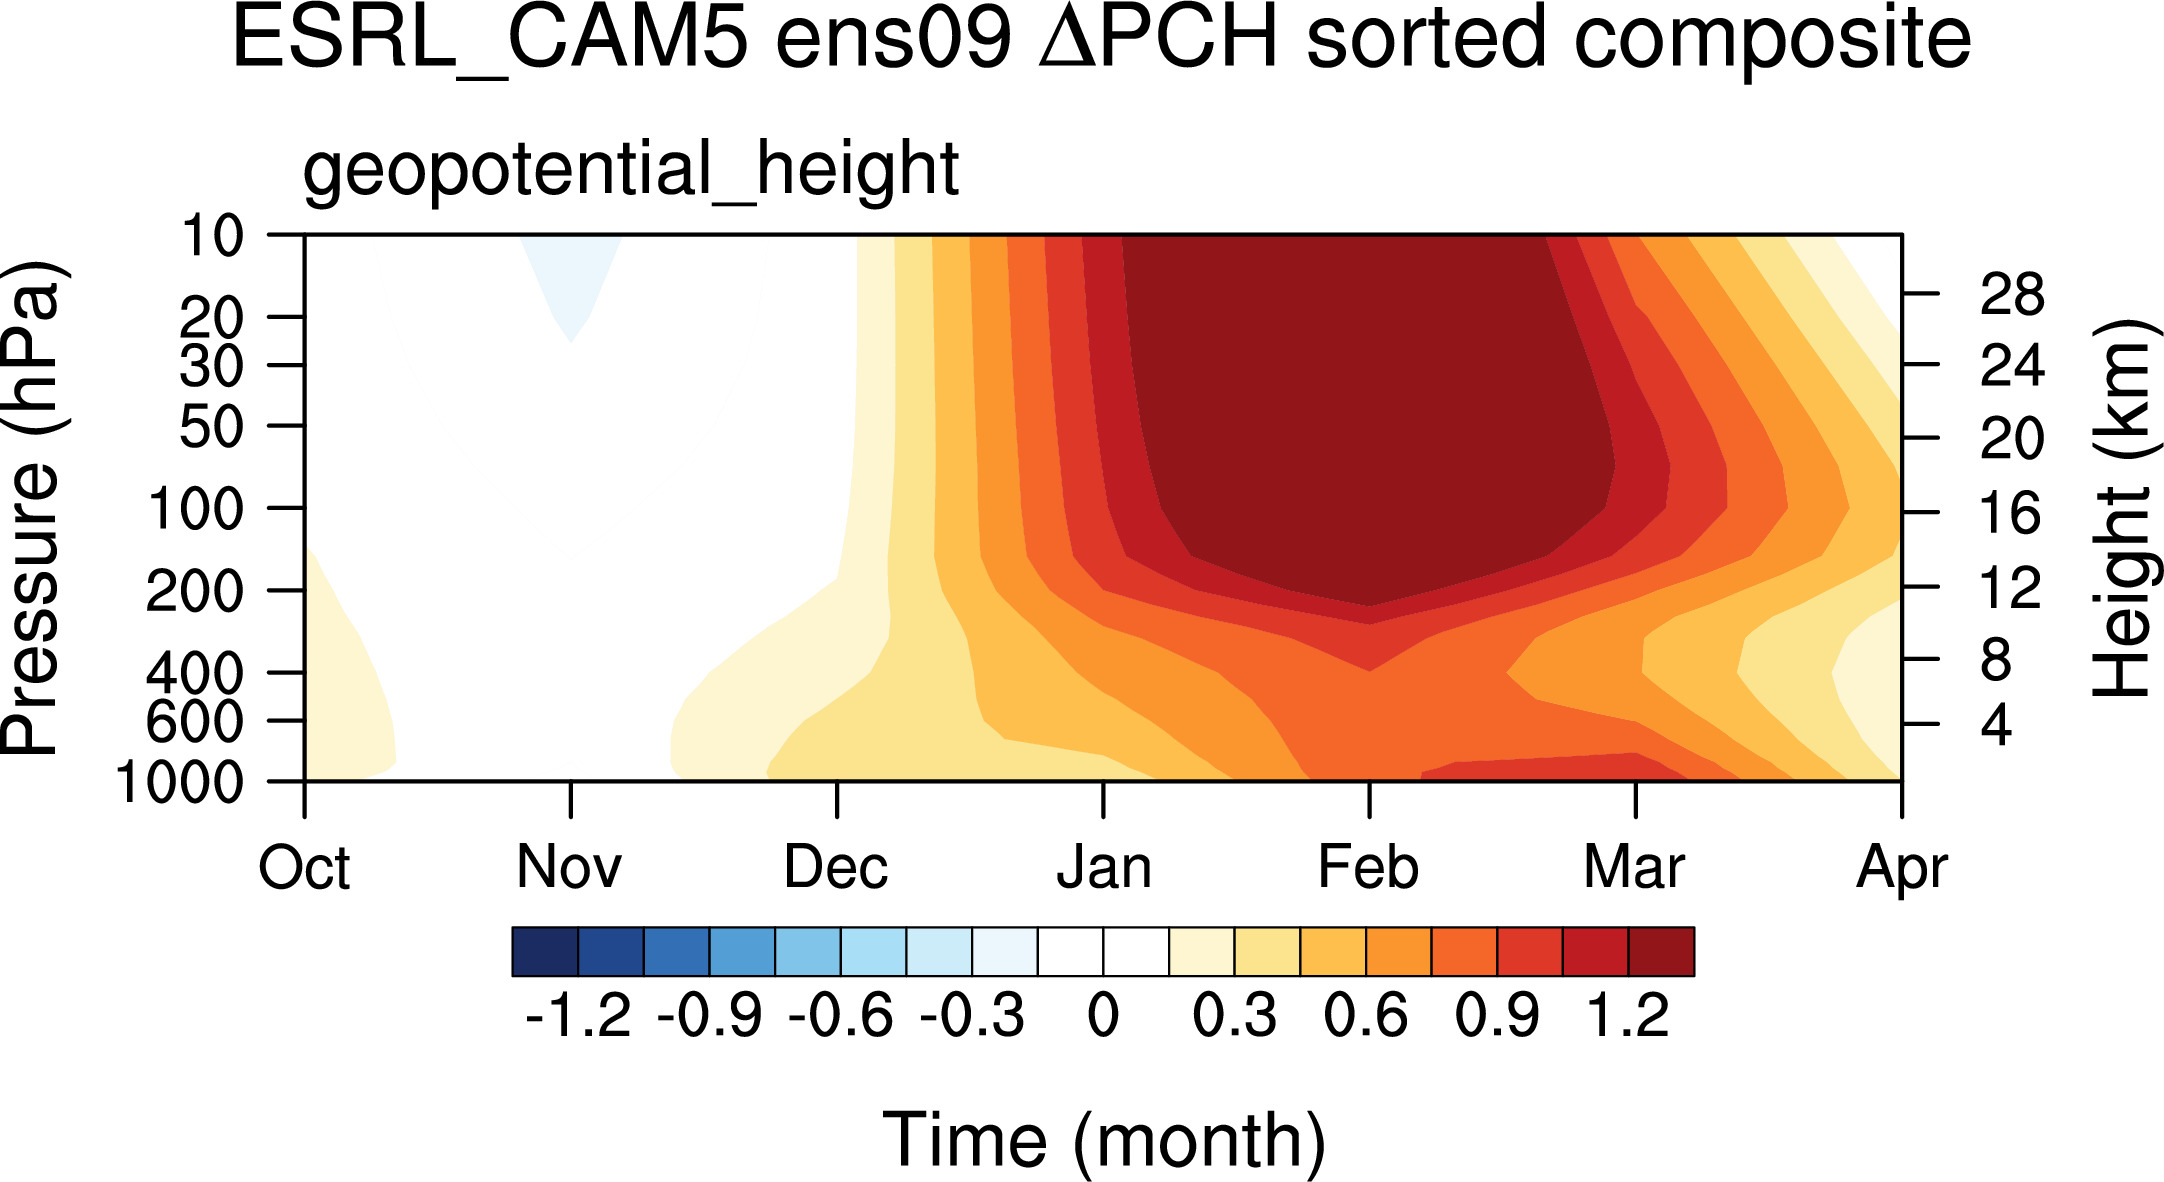
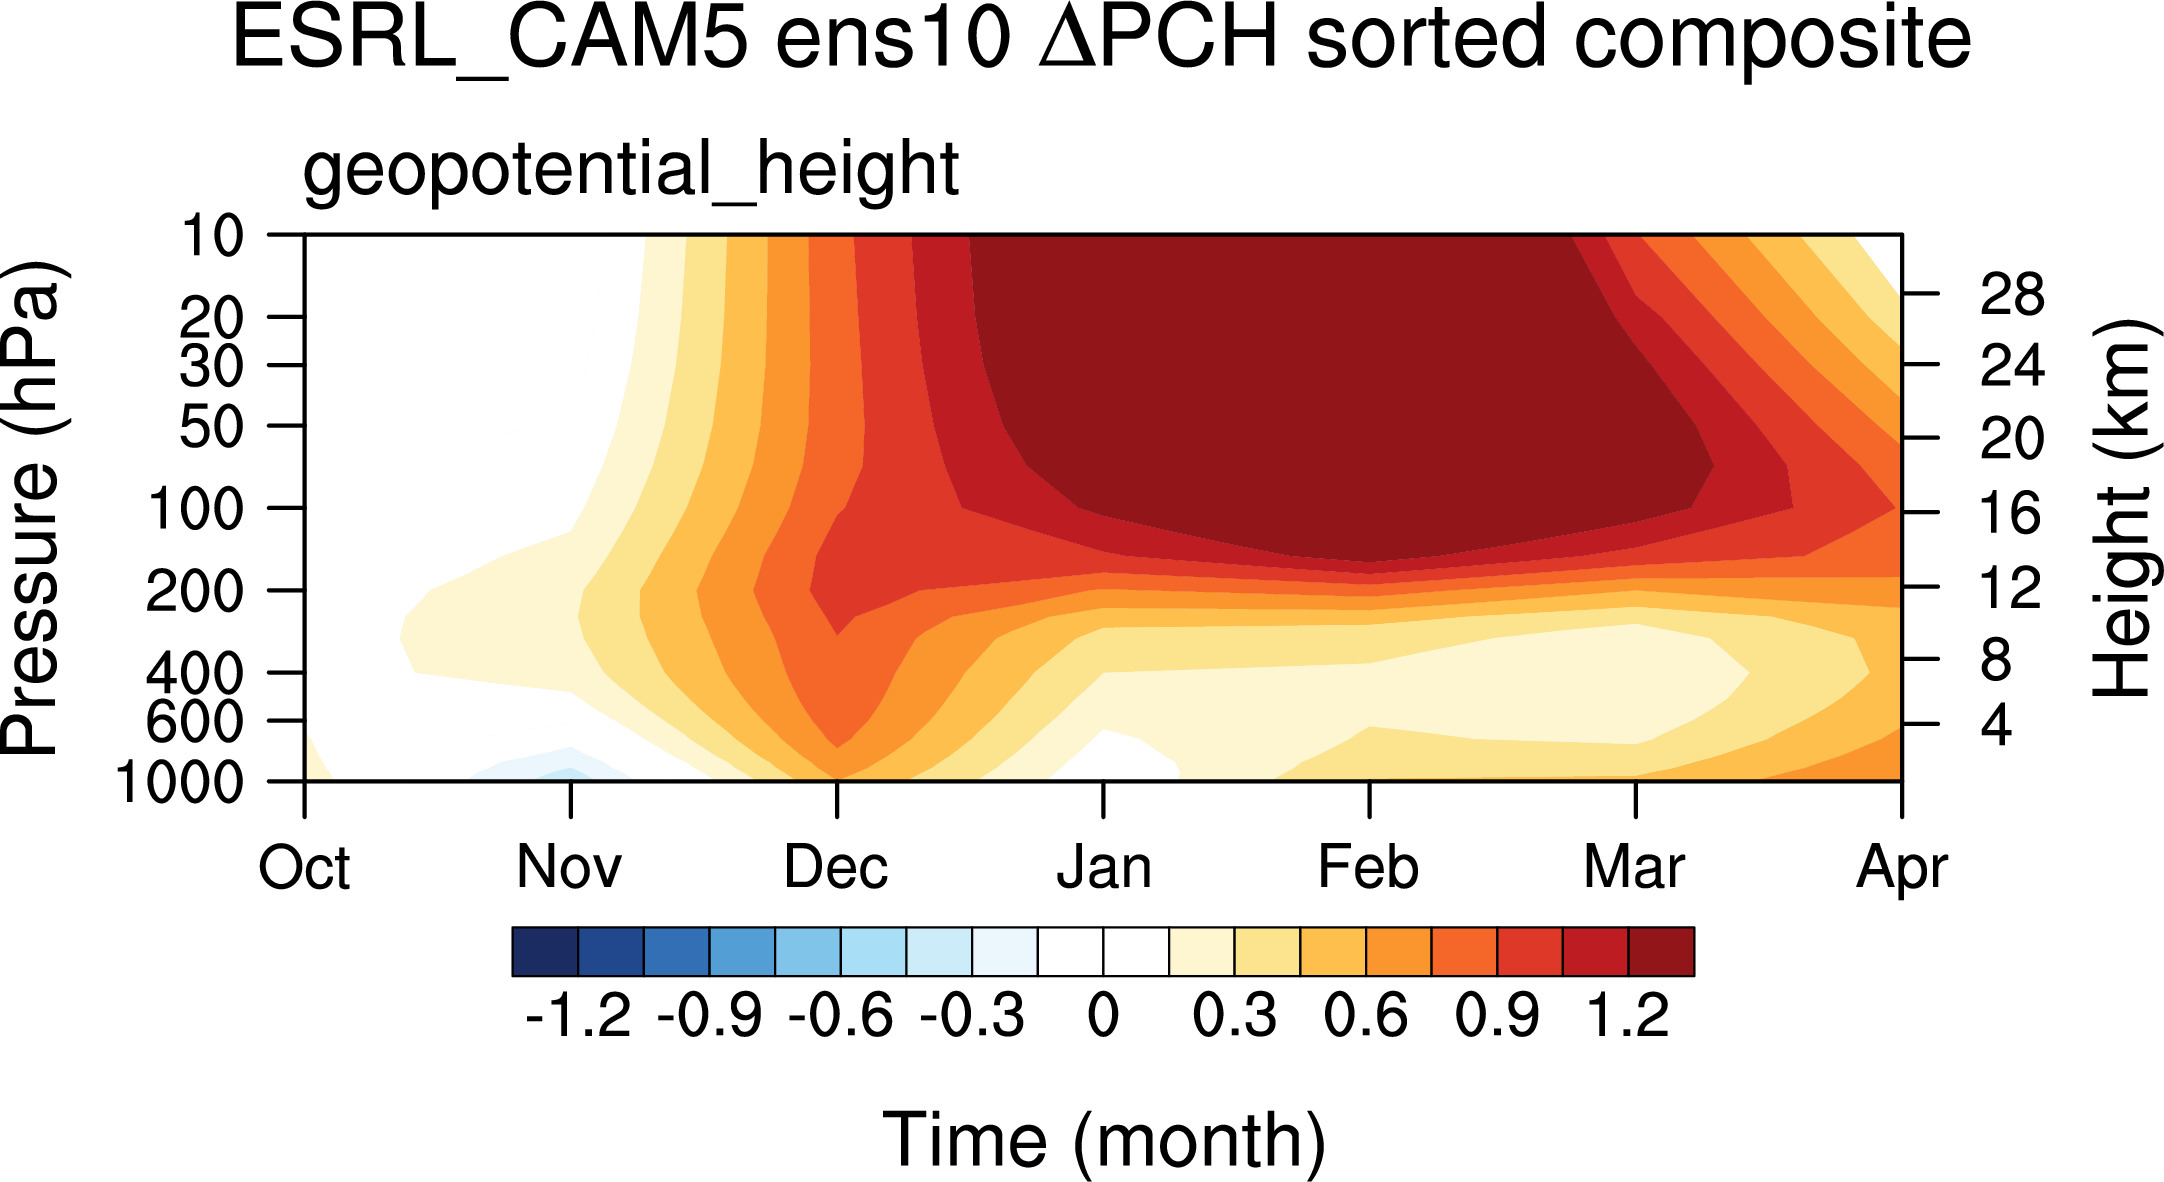
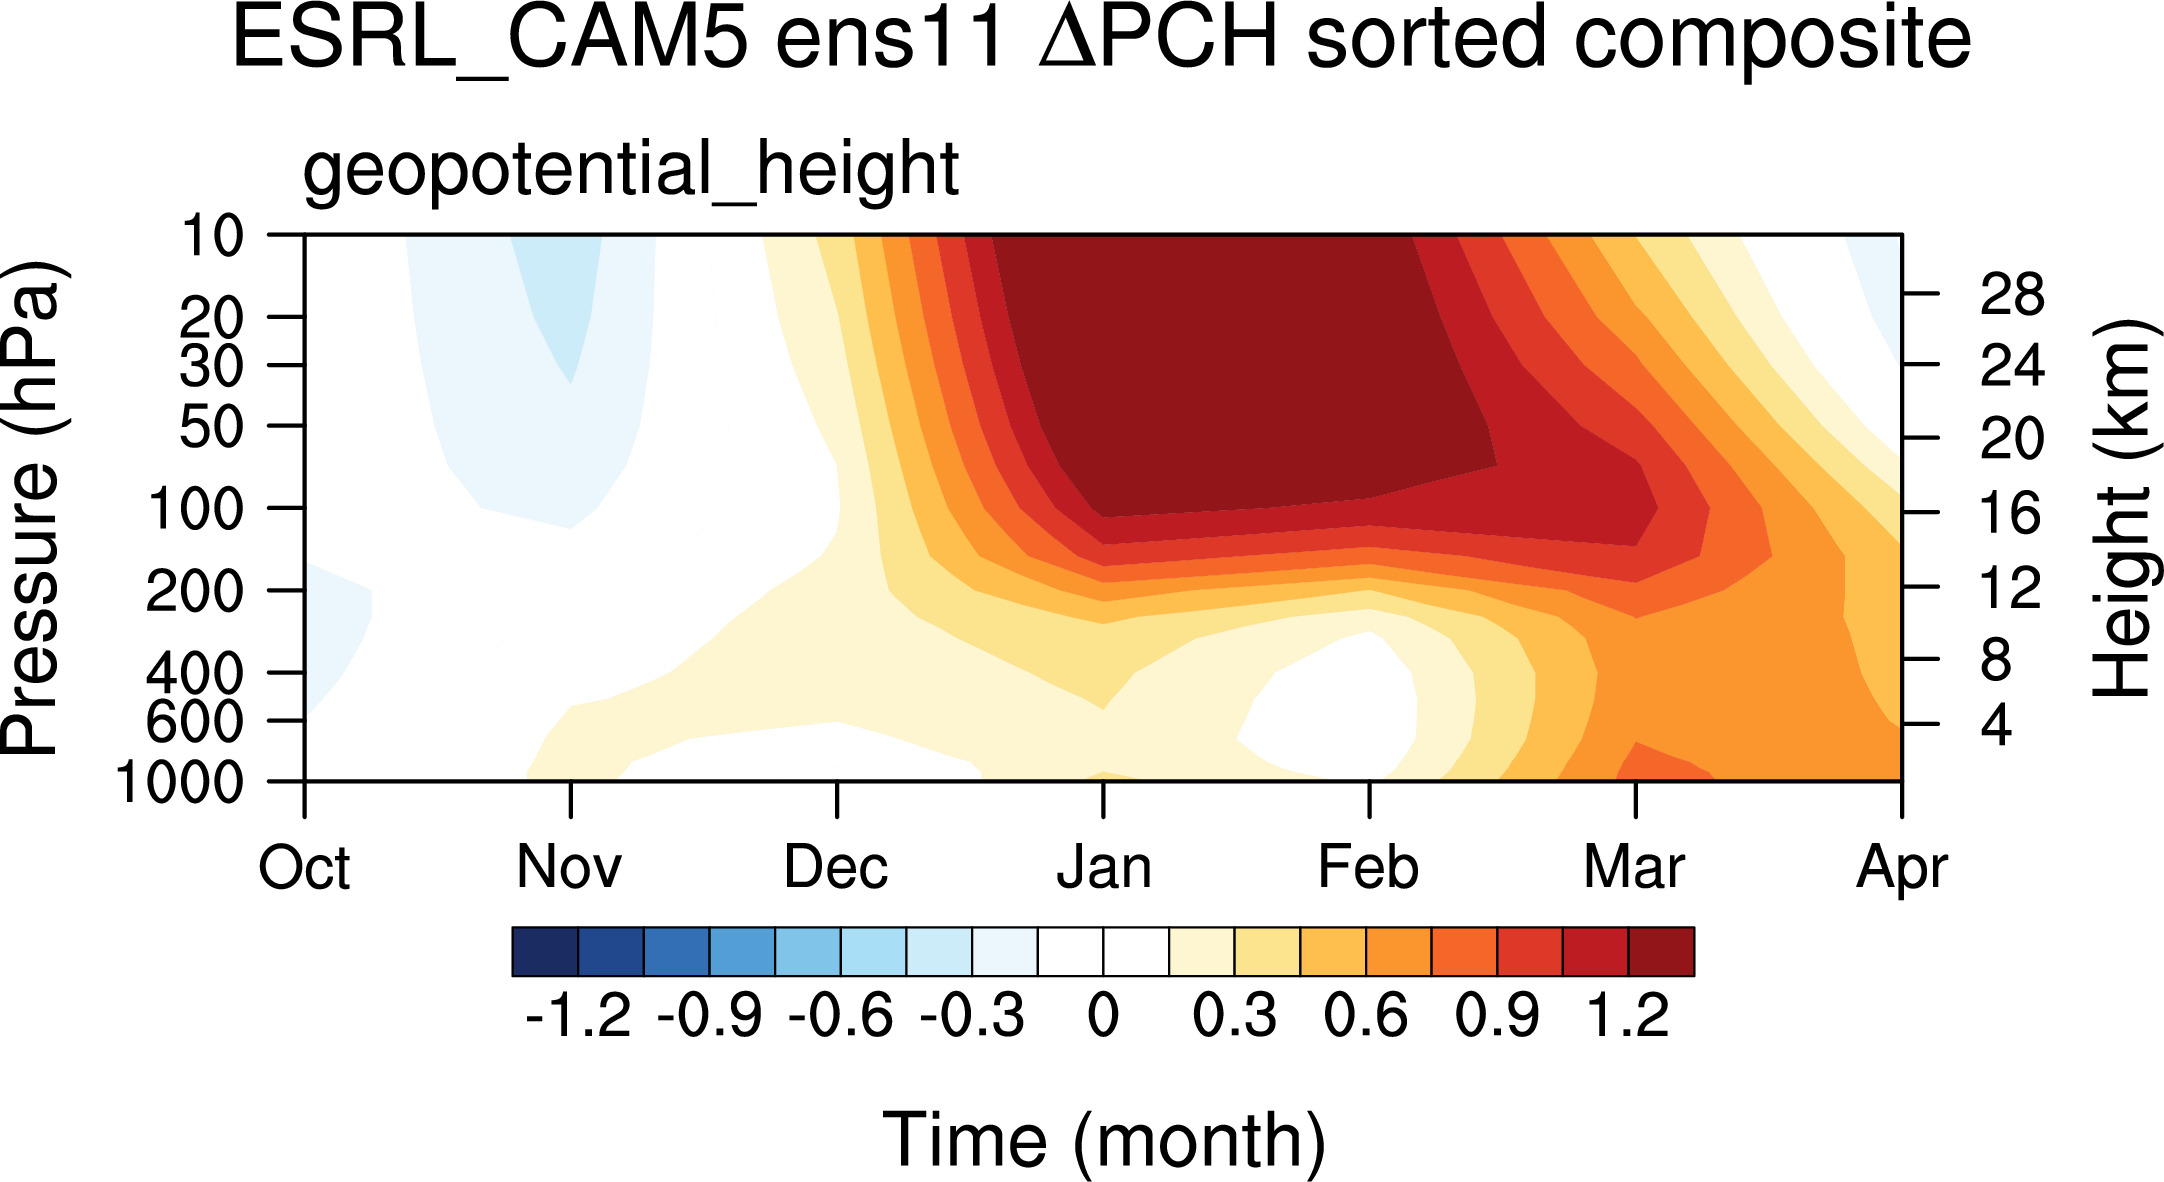
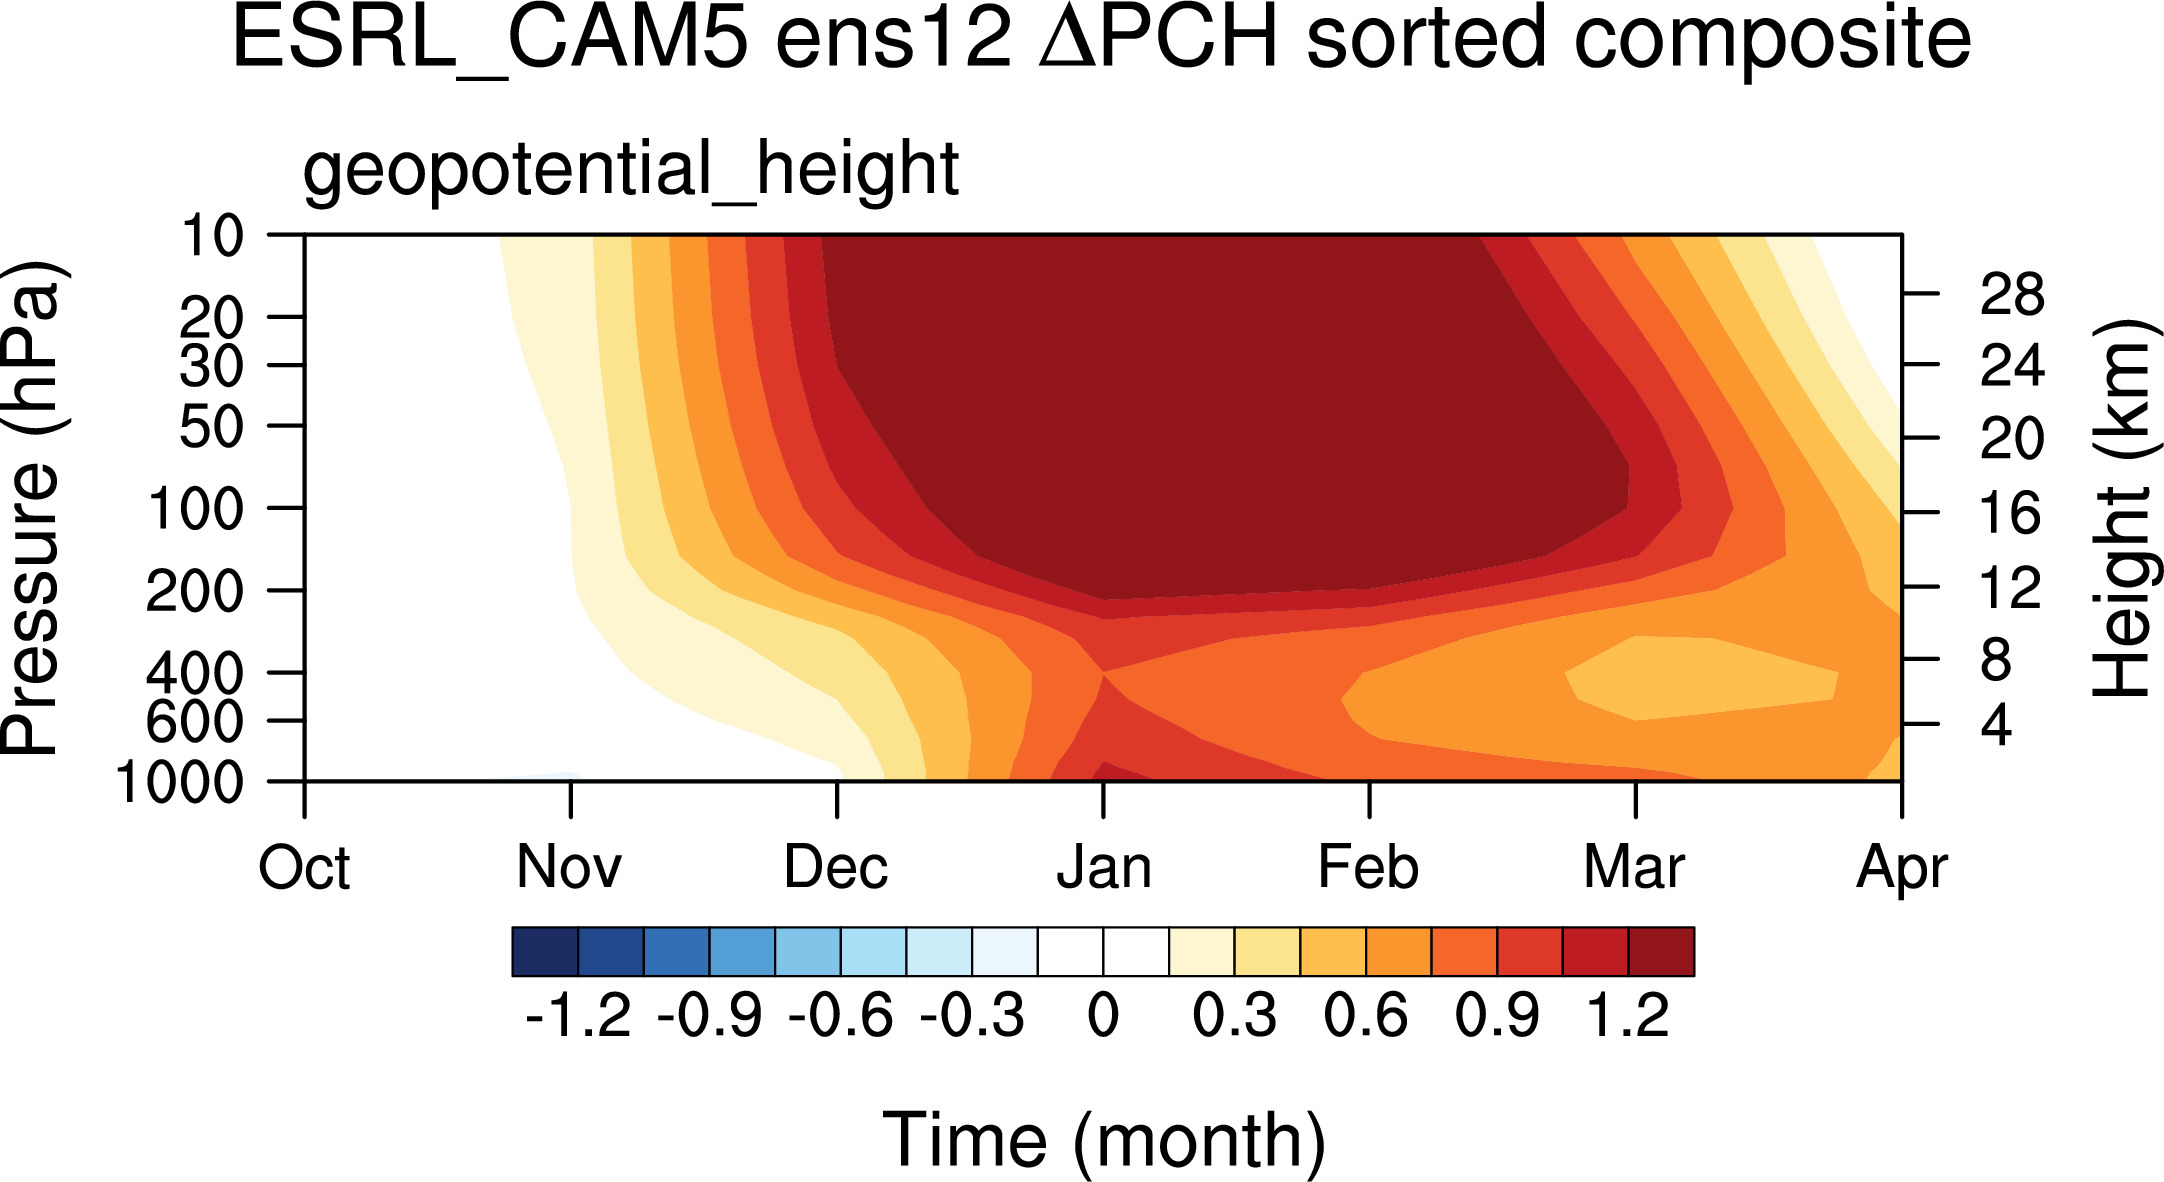
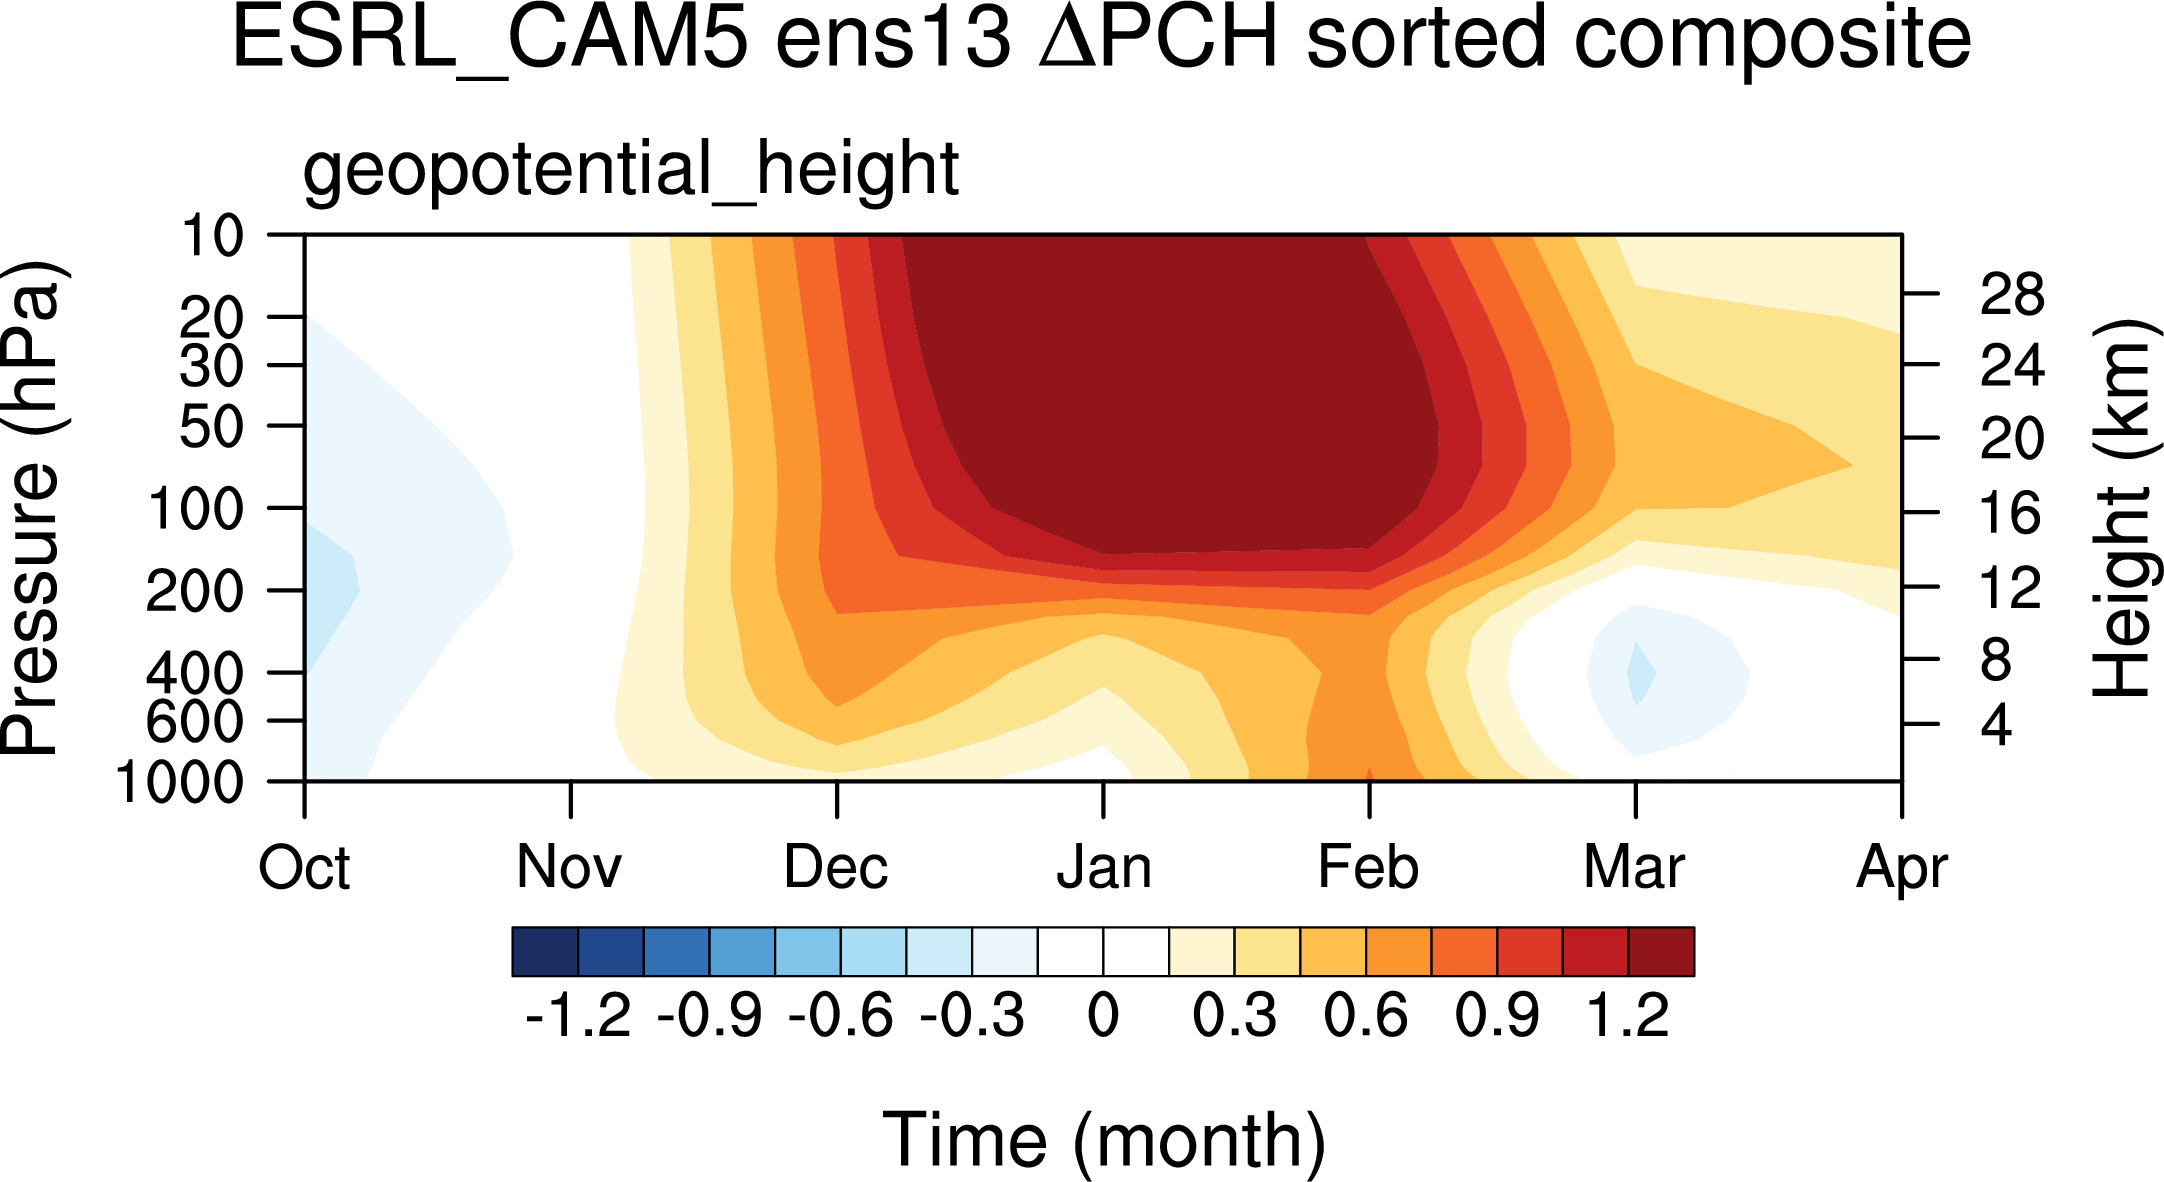
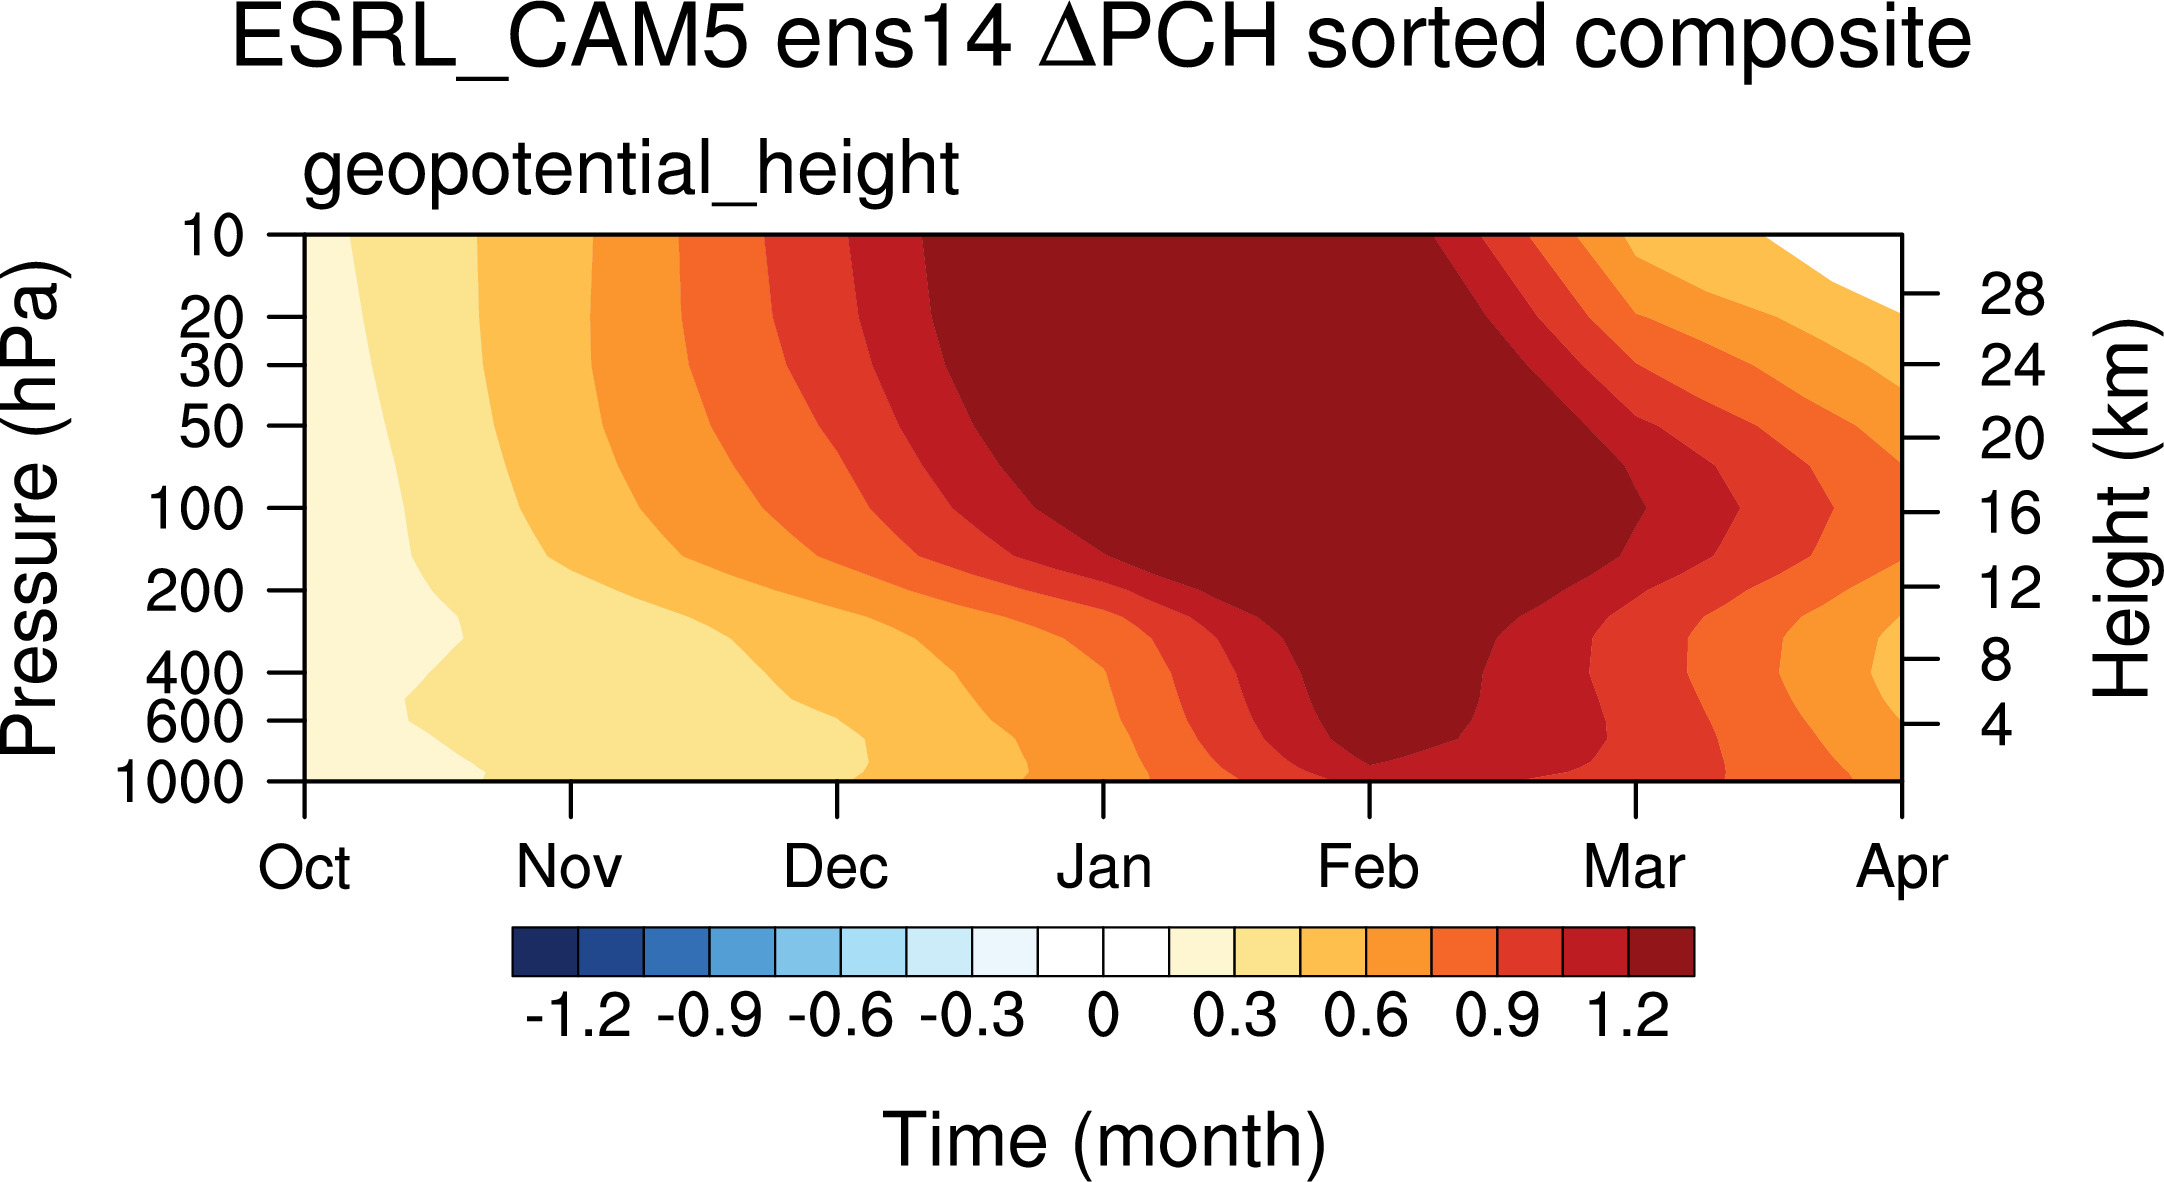
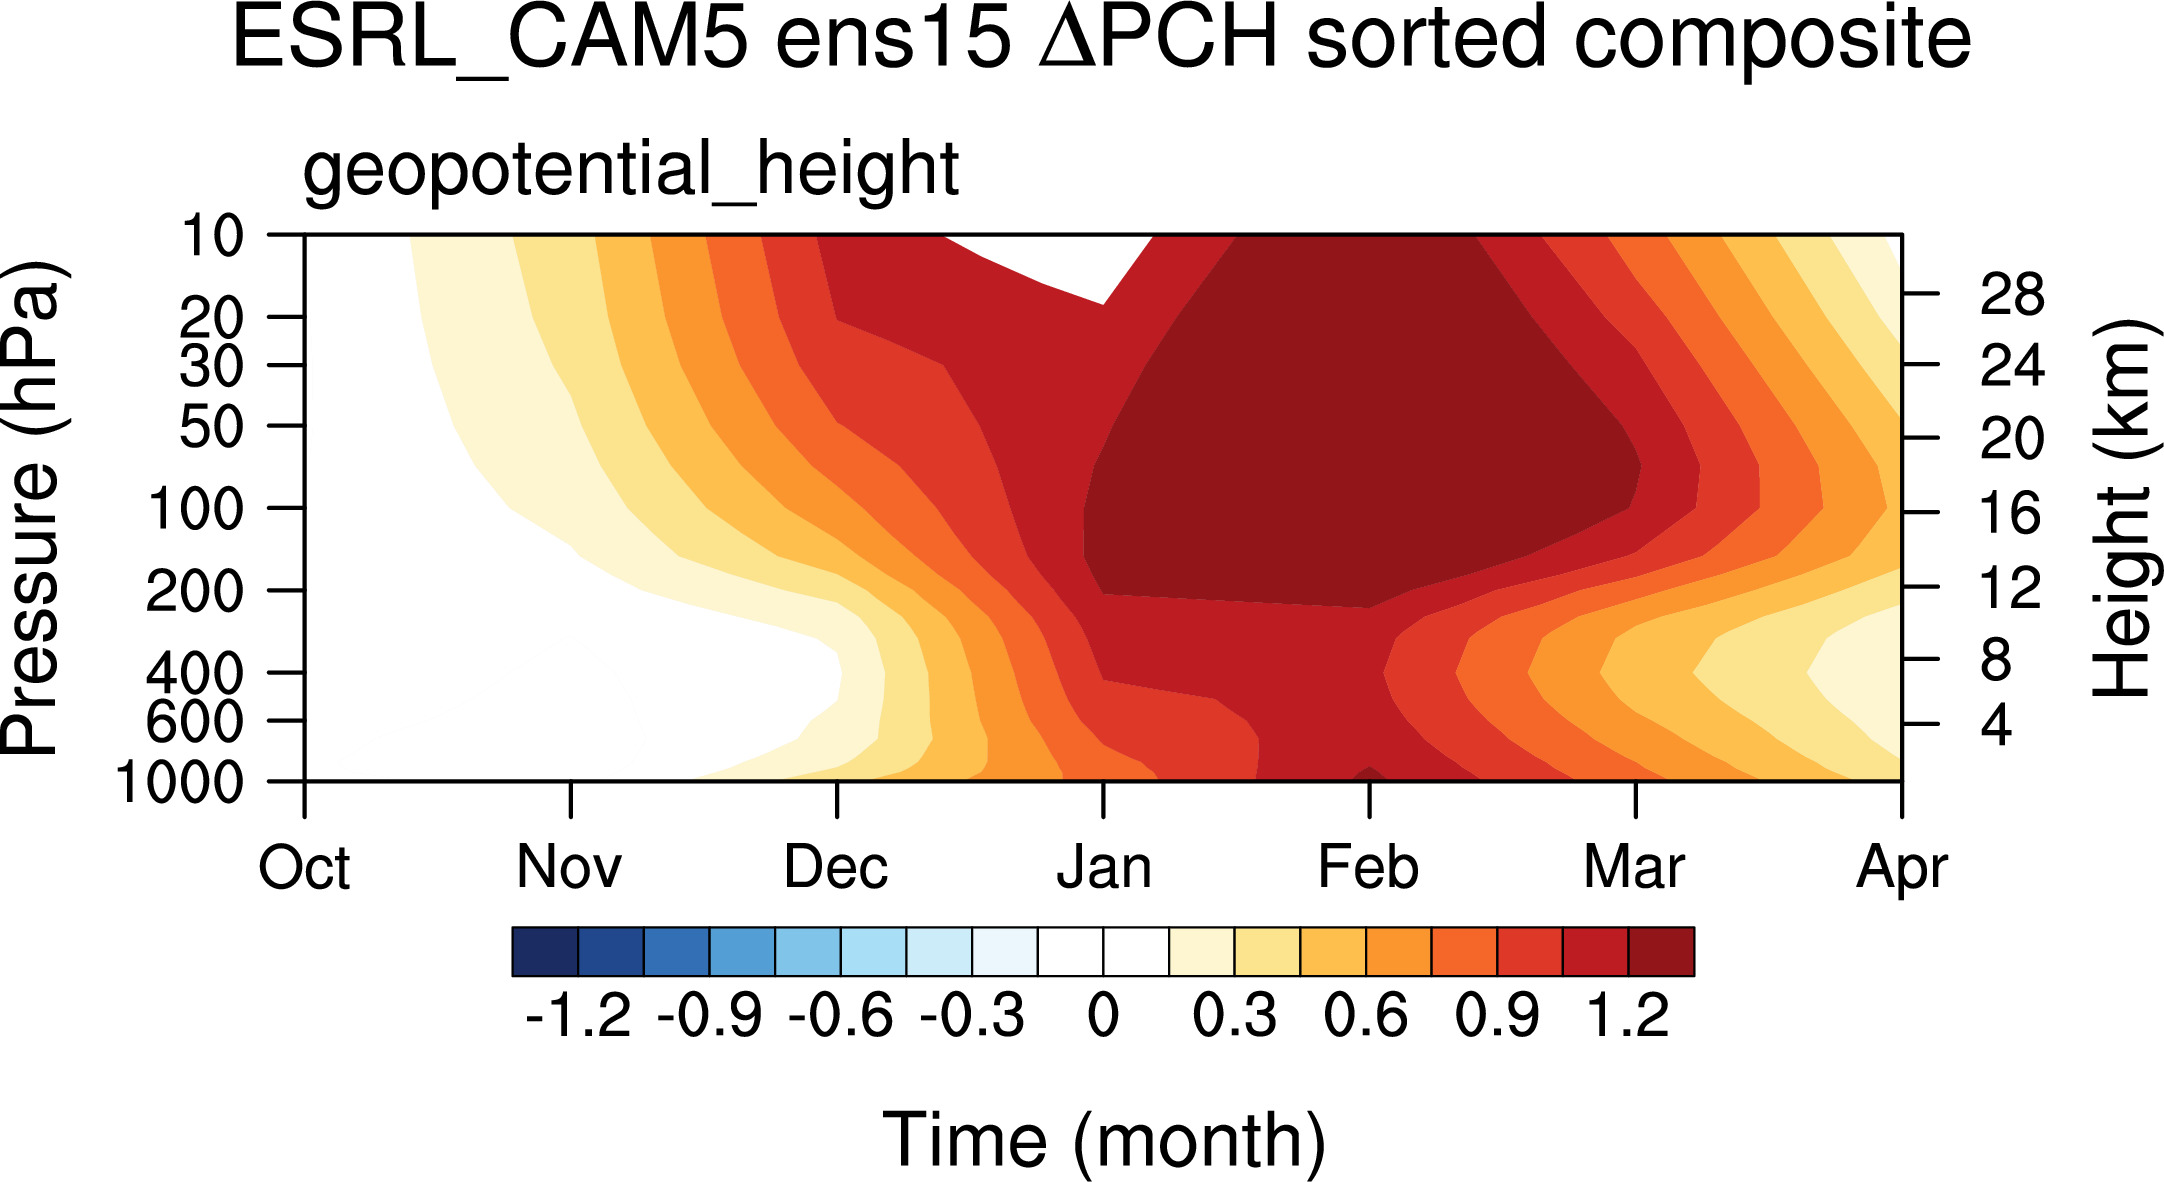
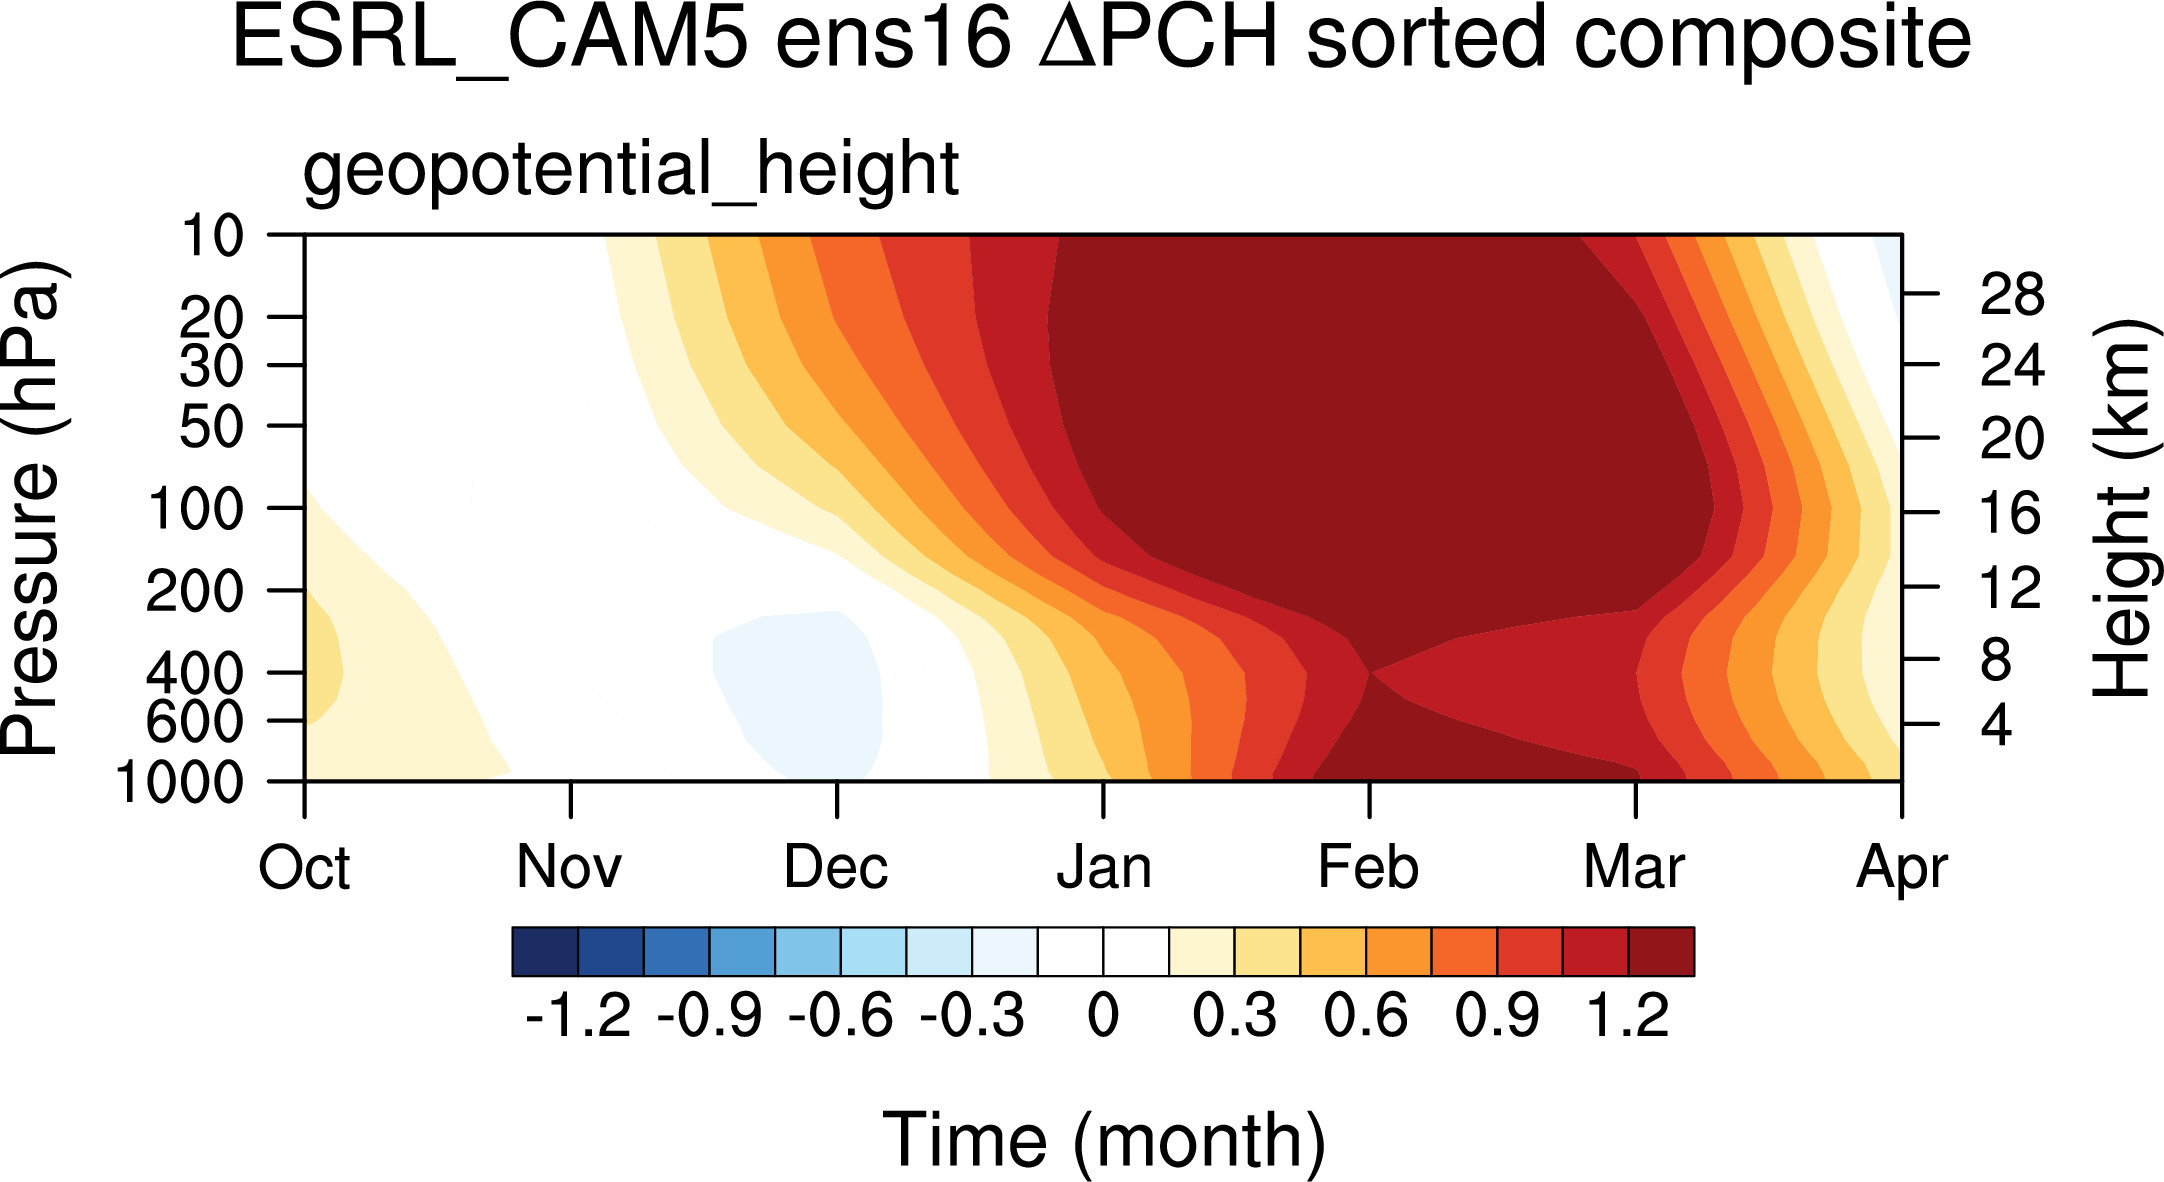
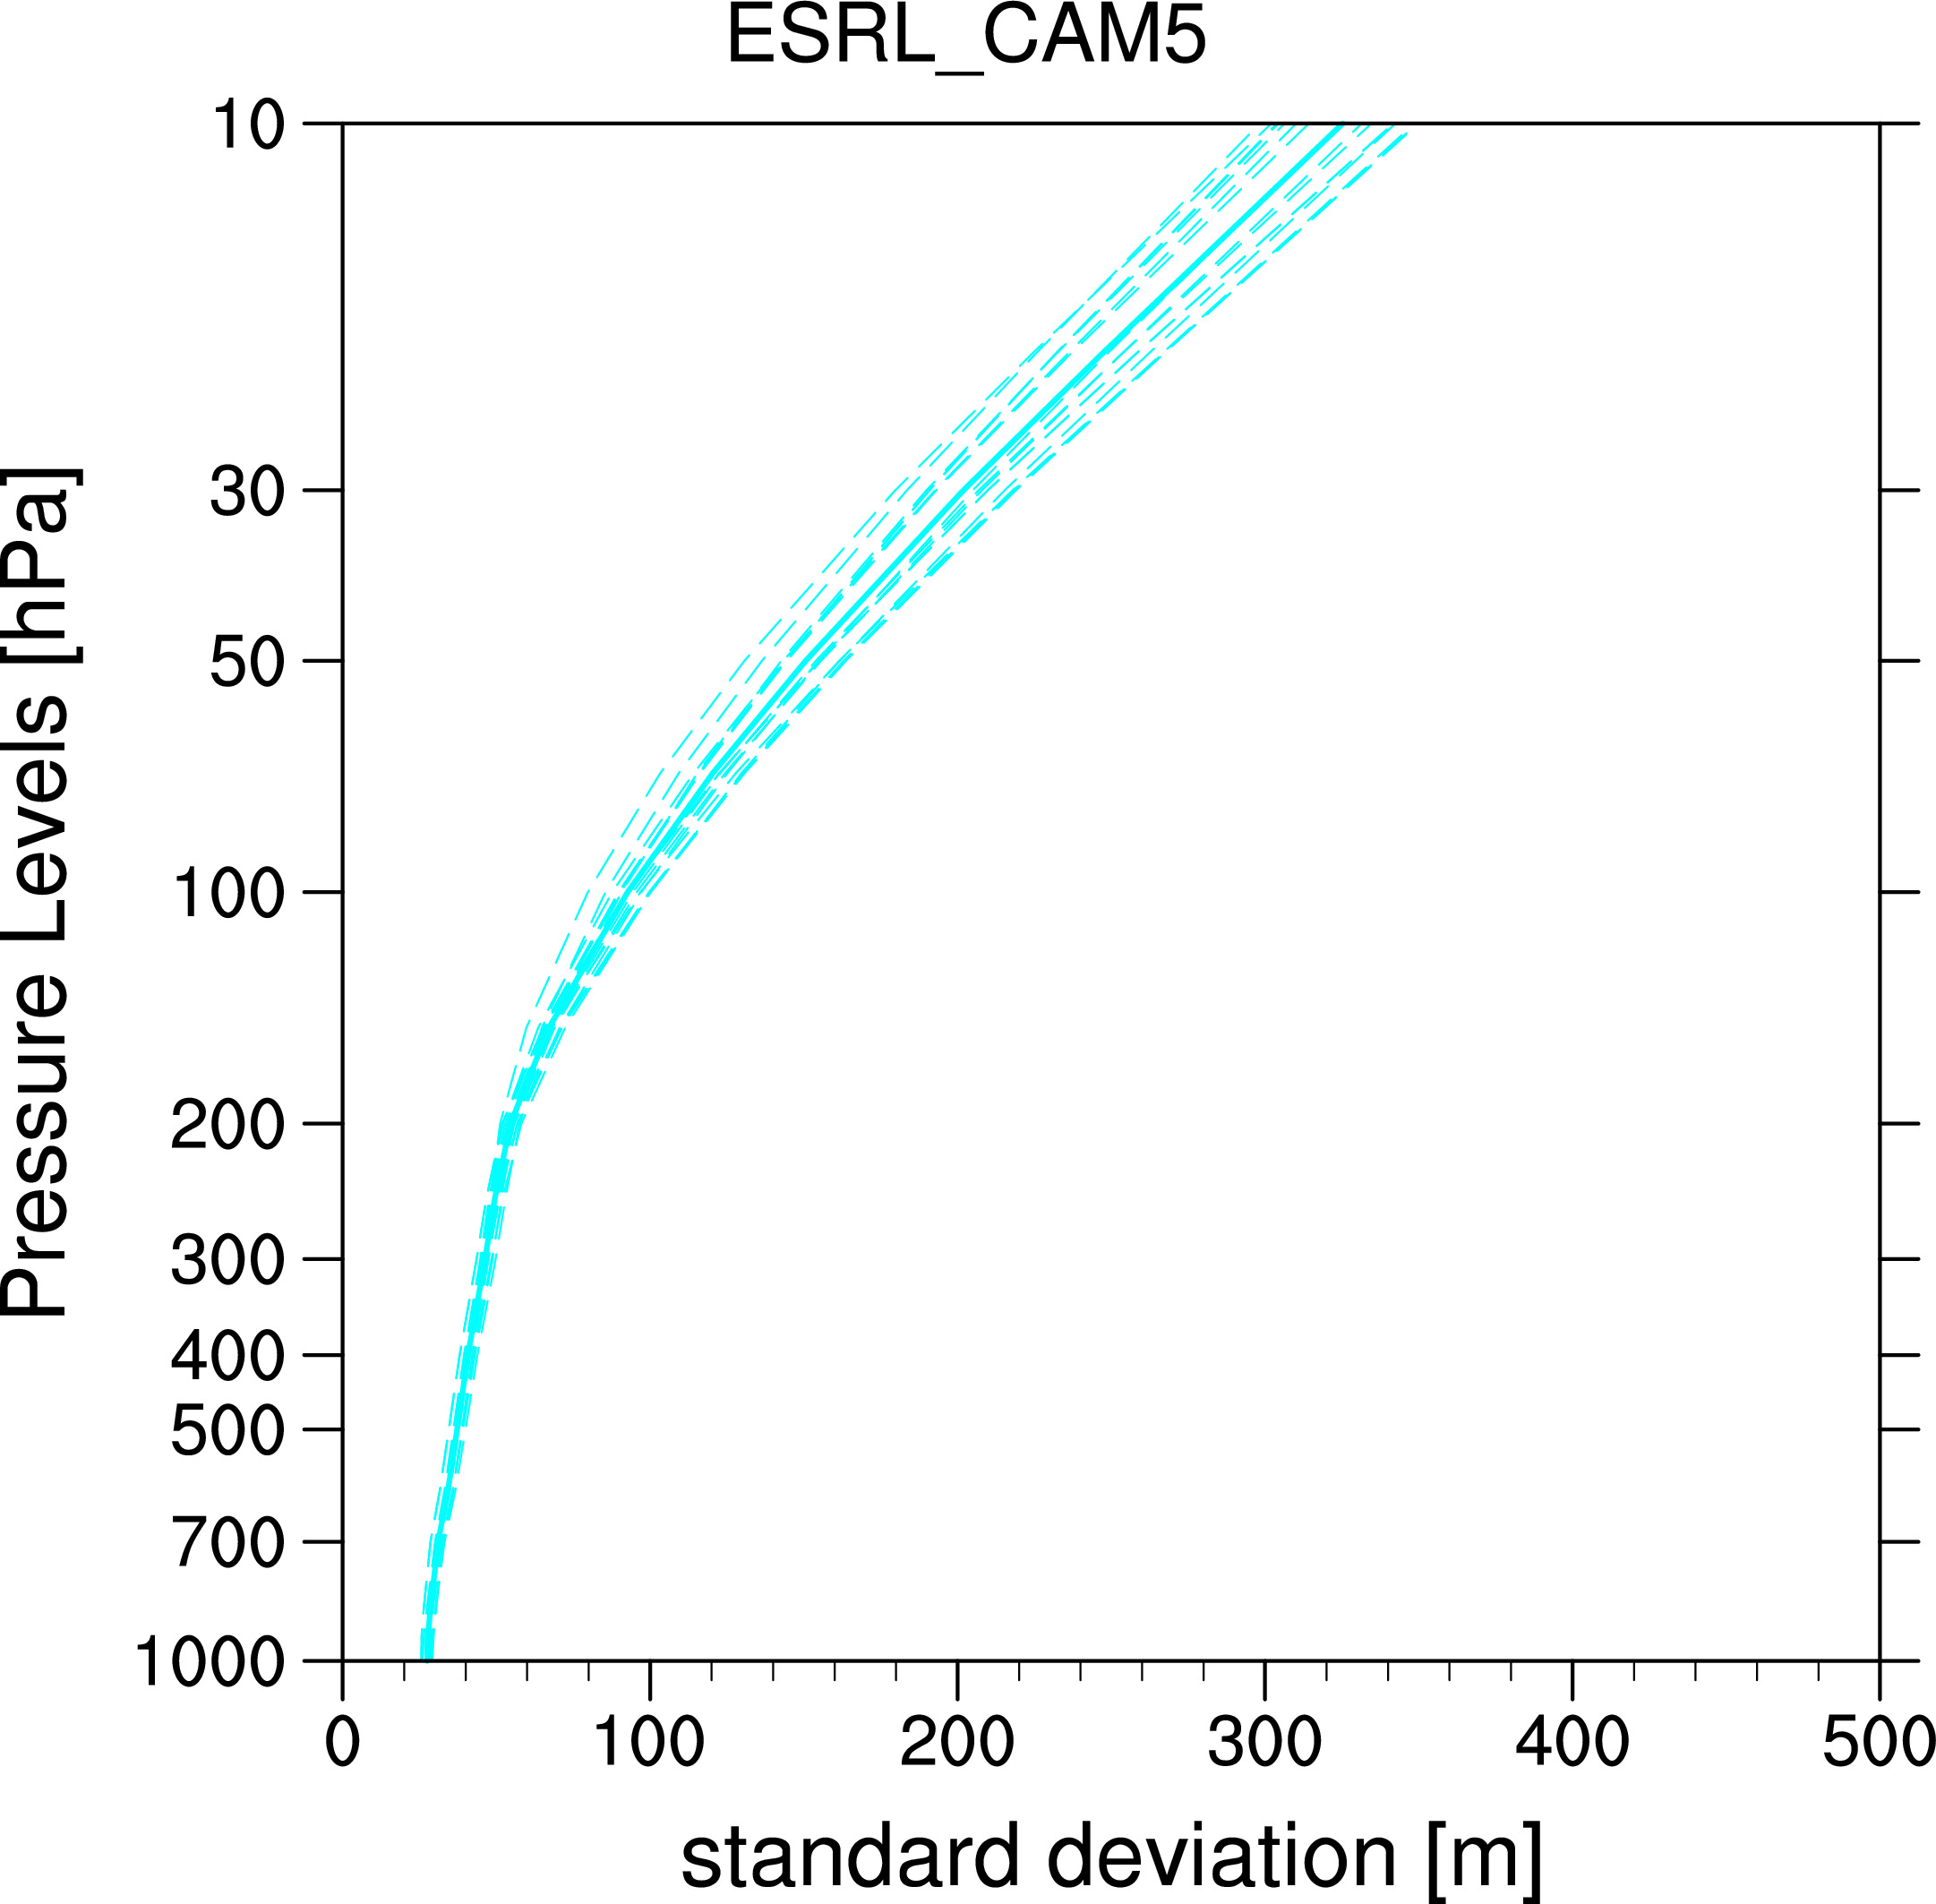 ESRL_CAM5
Ensemble mean:
Individual Runs:
Individual Years here
-----
Special case Sorted on largest values of Jan Feb mean at 50hPa
Ensemble mean:
Individual Runs:
-------------------------------------------------------------------------------
-----------------------------
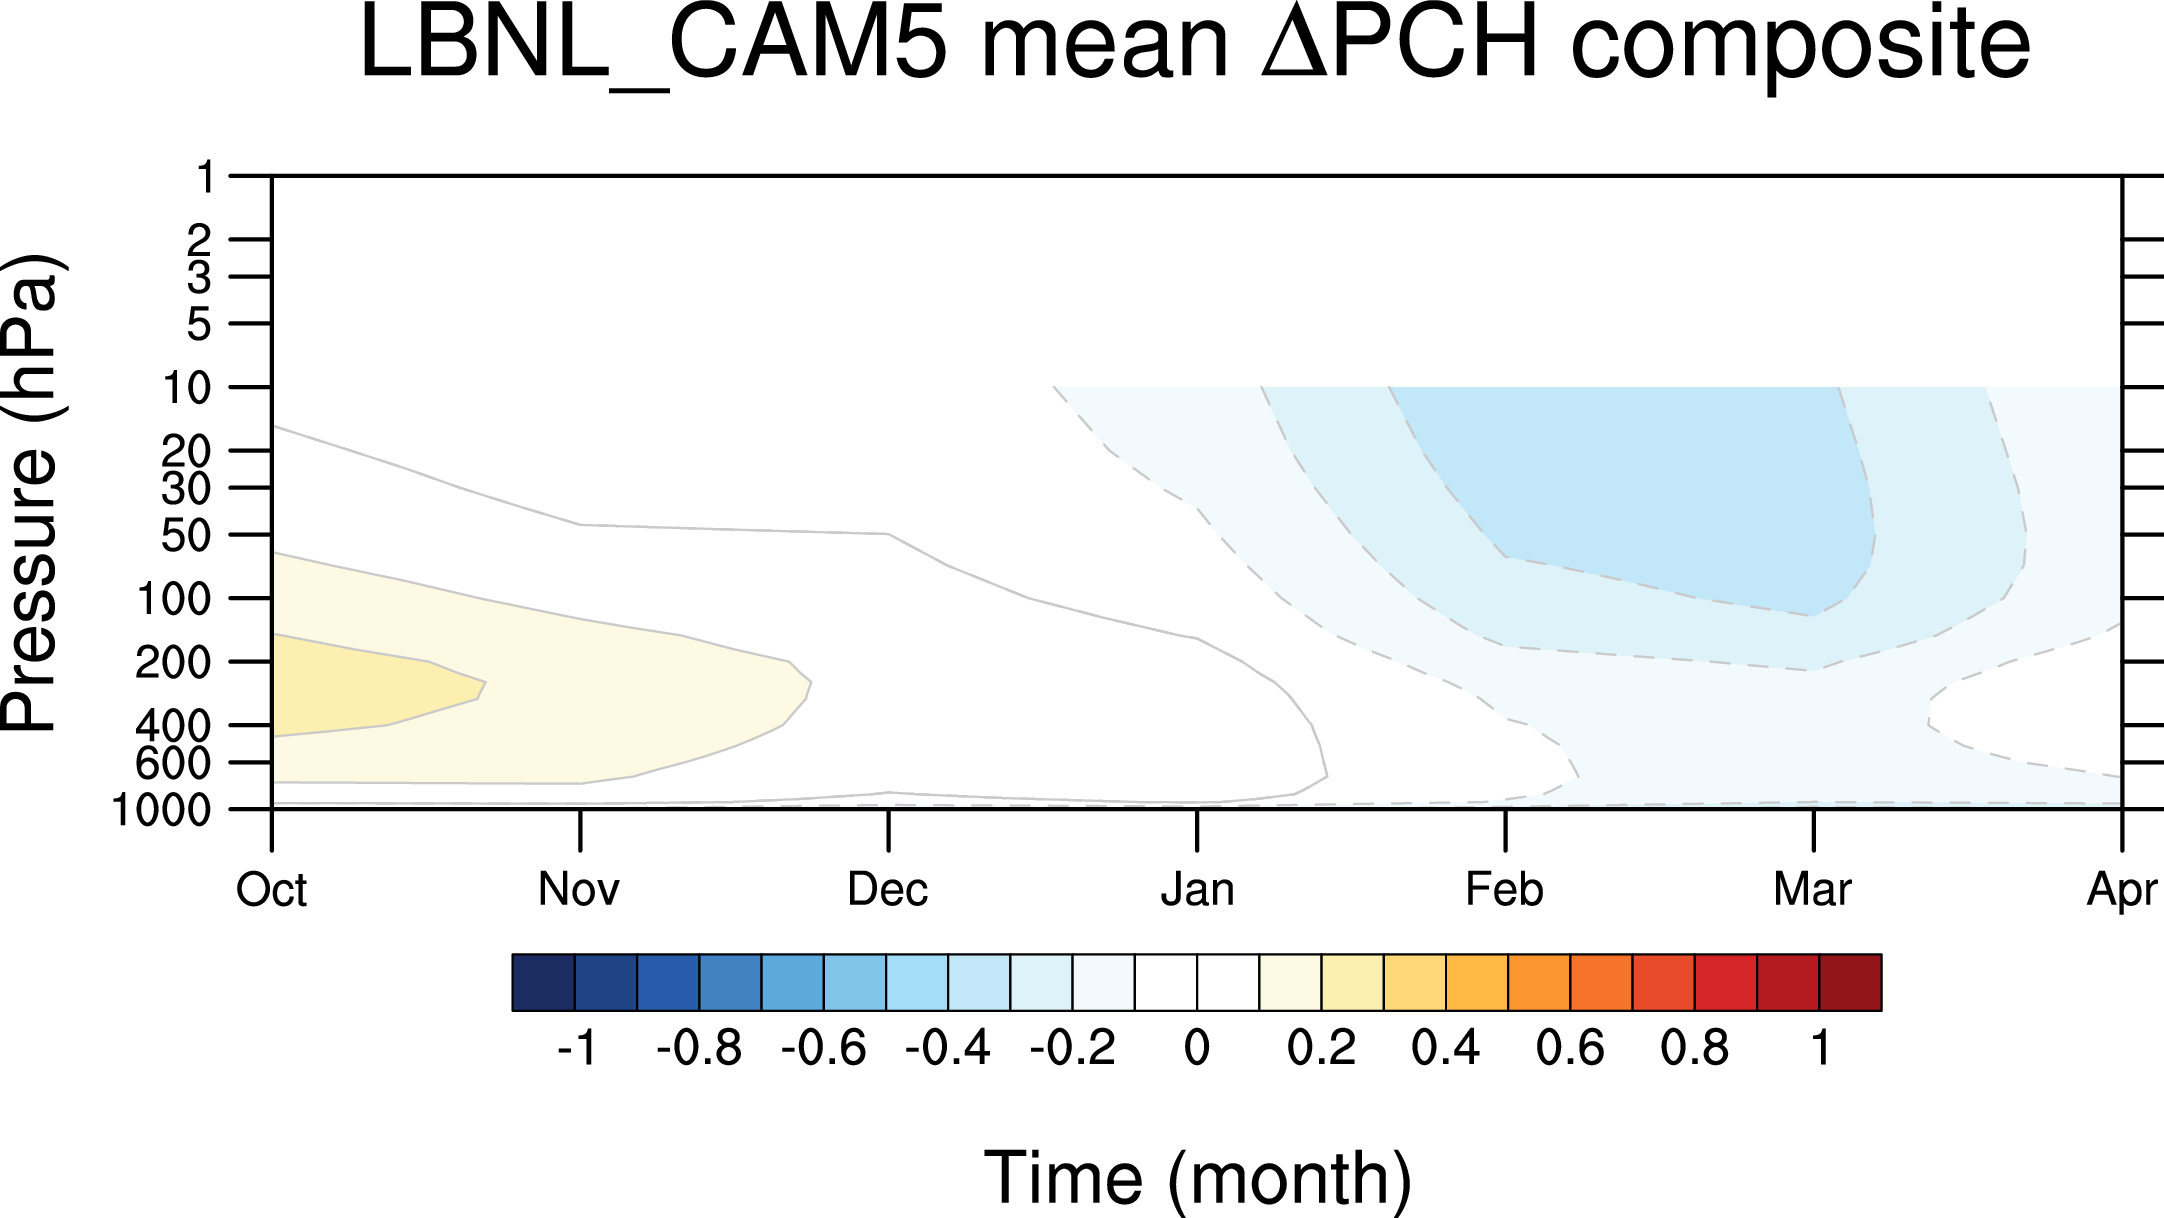
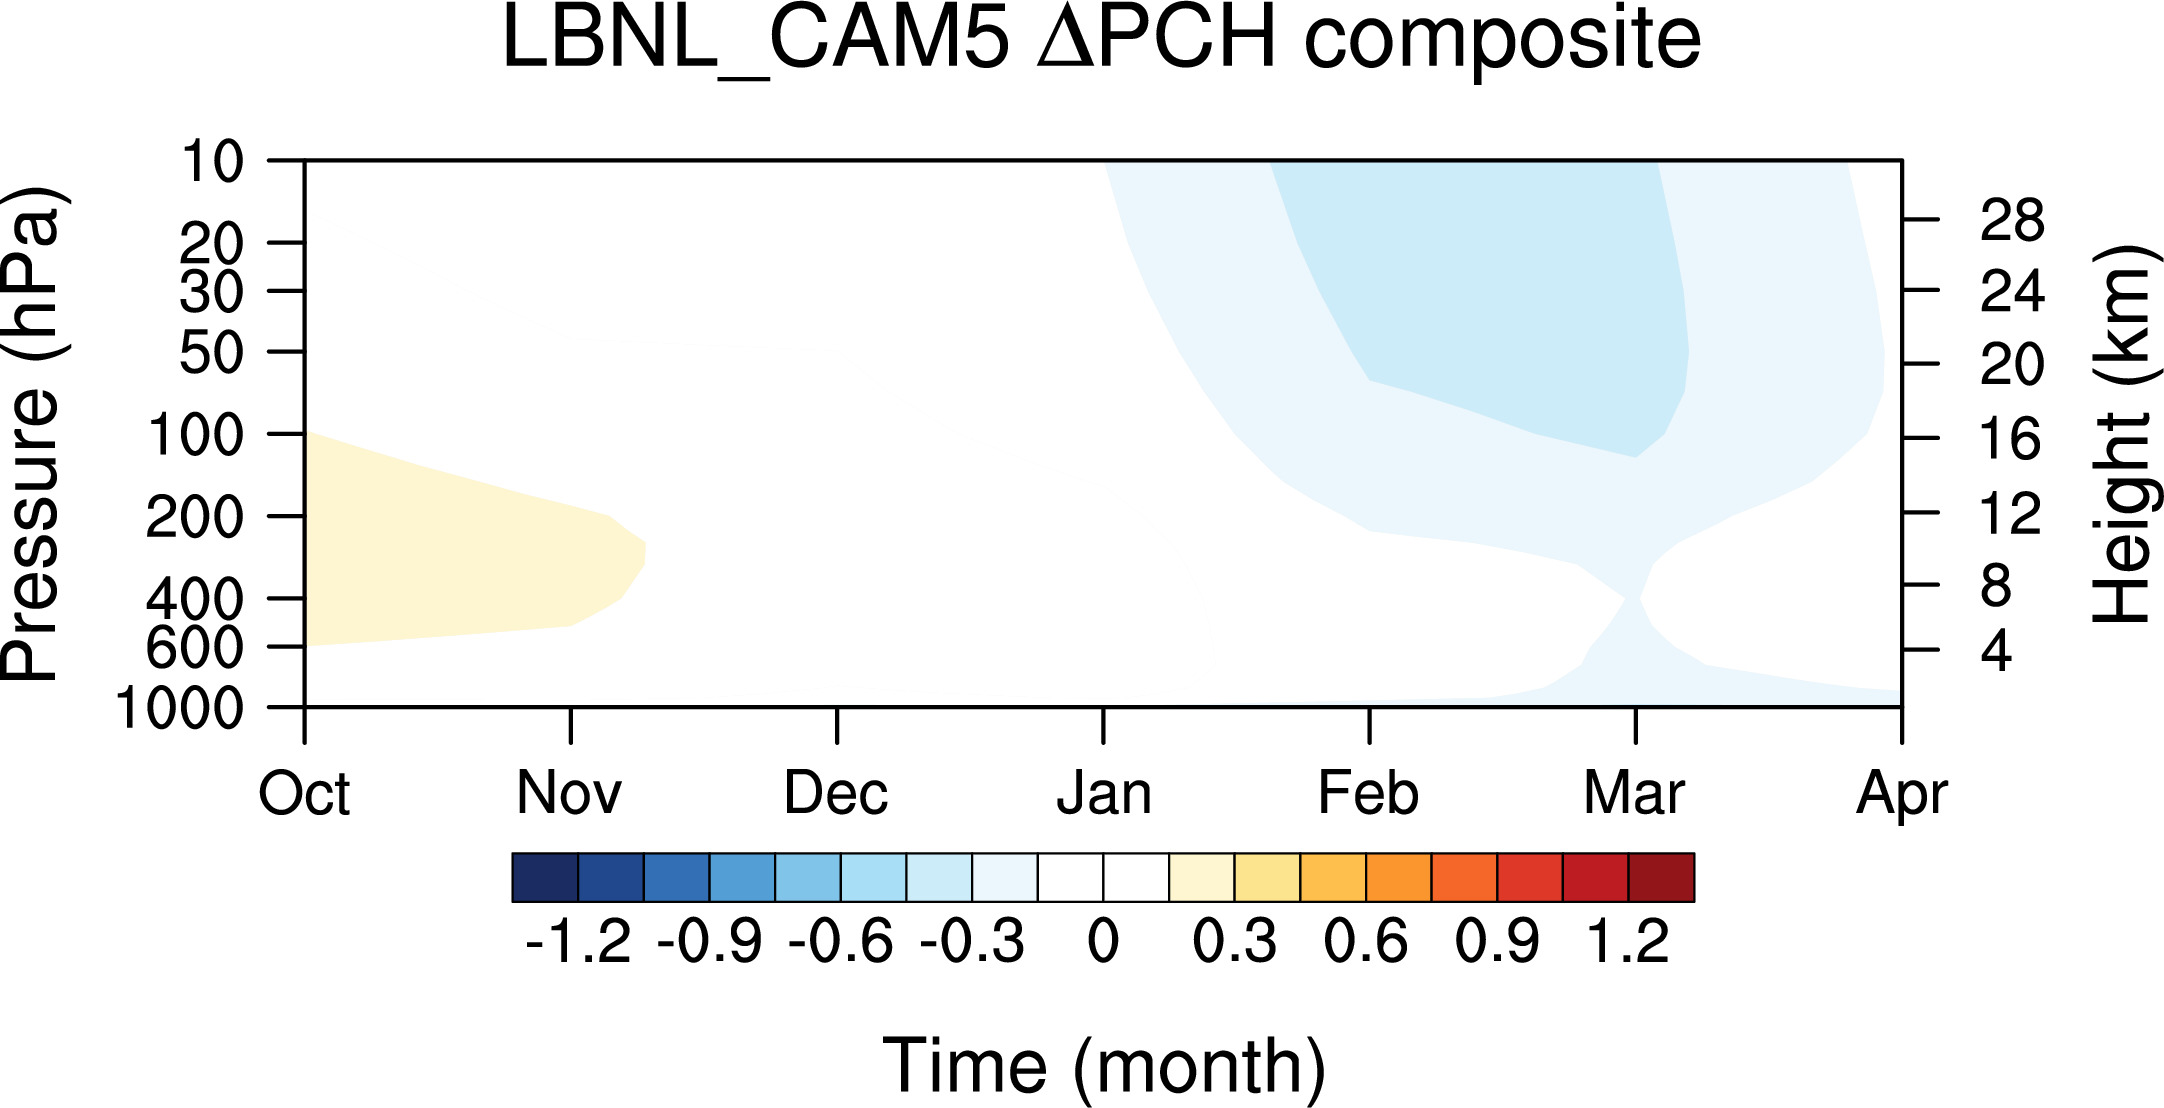
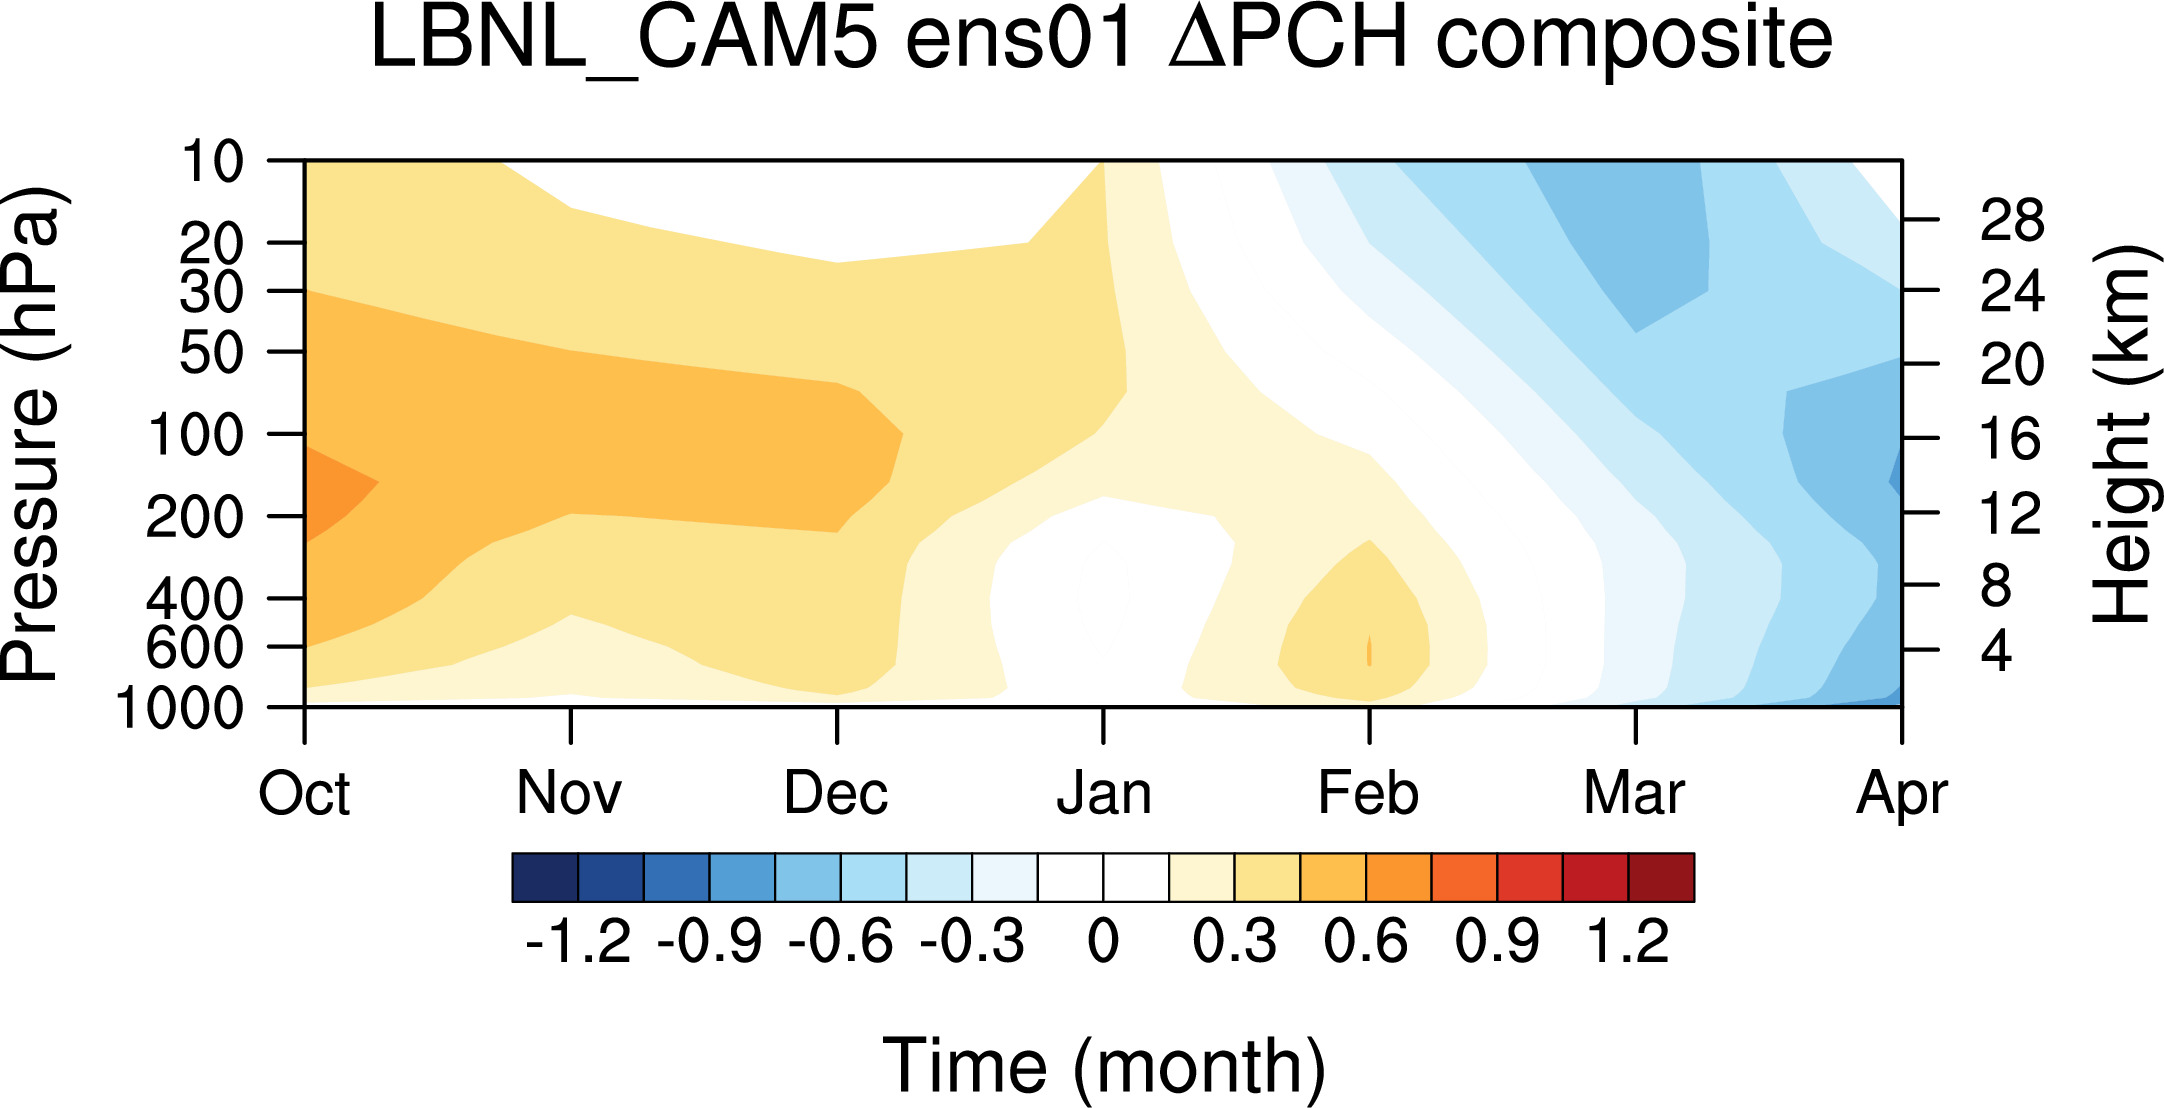
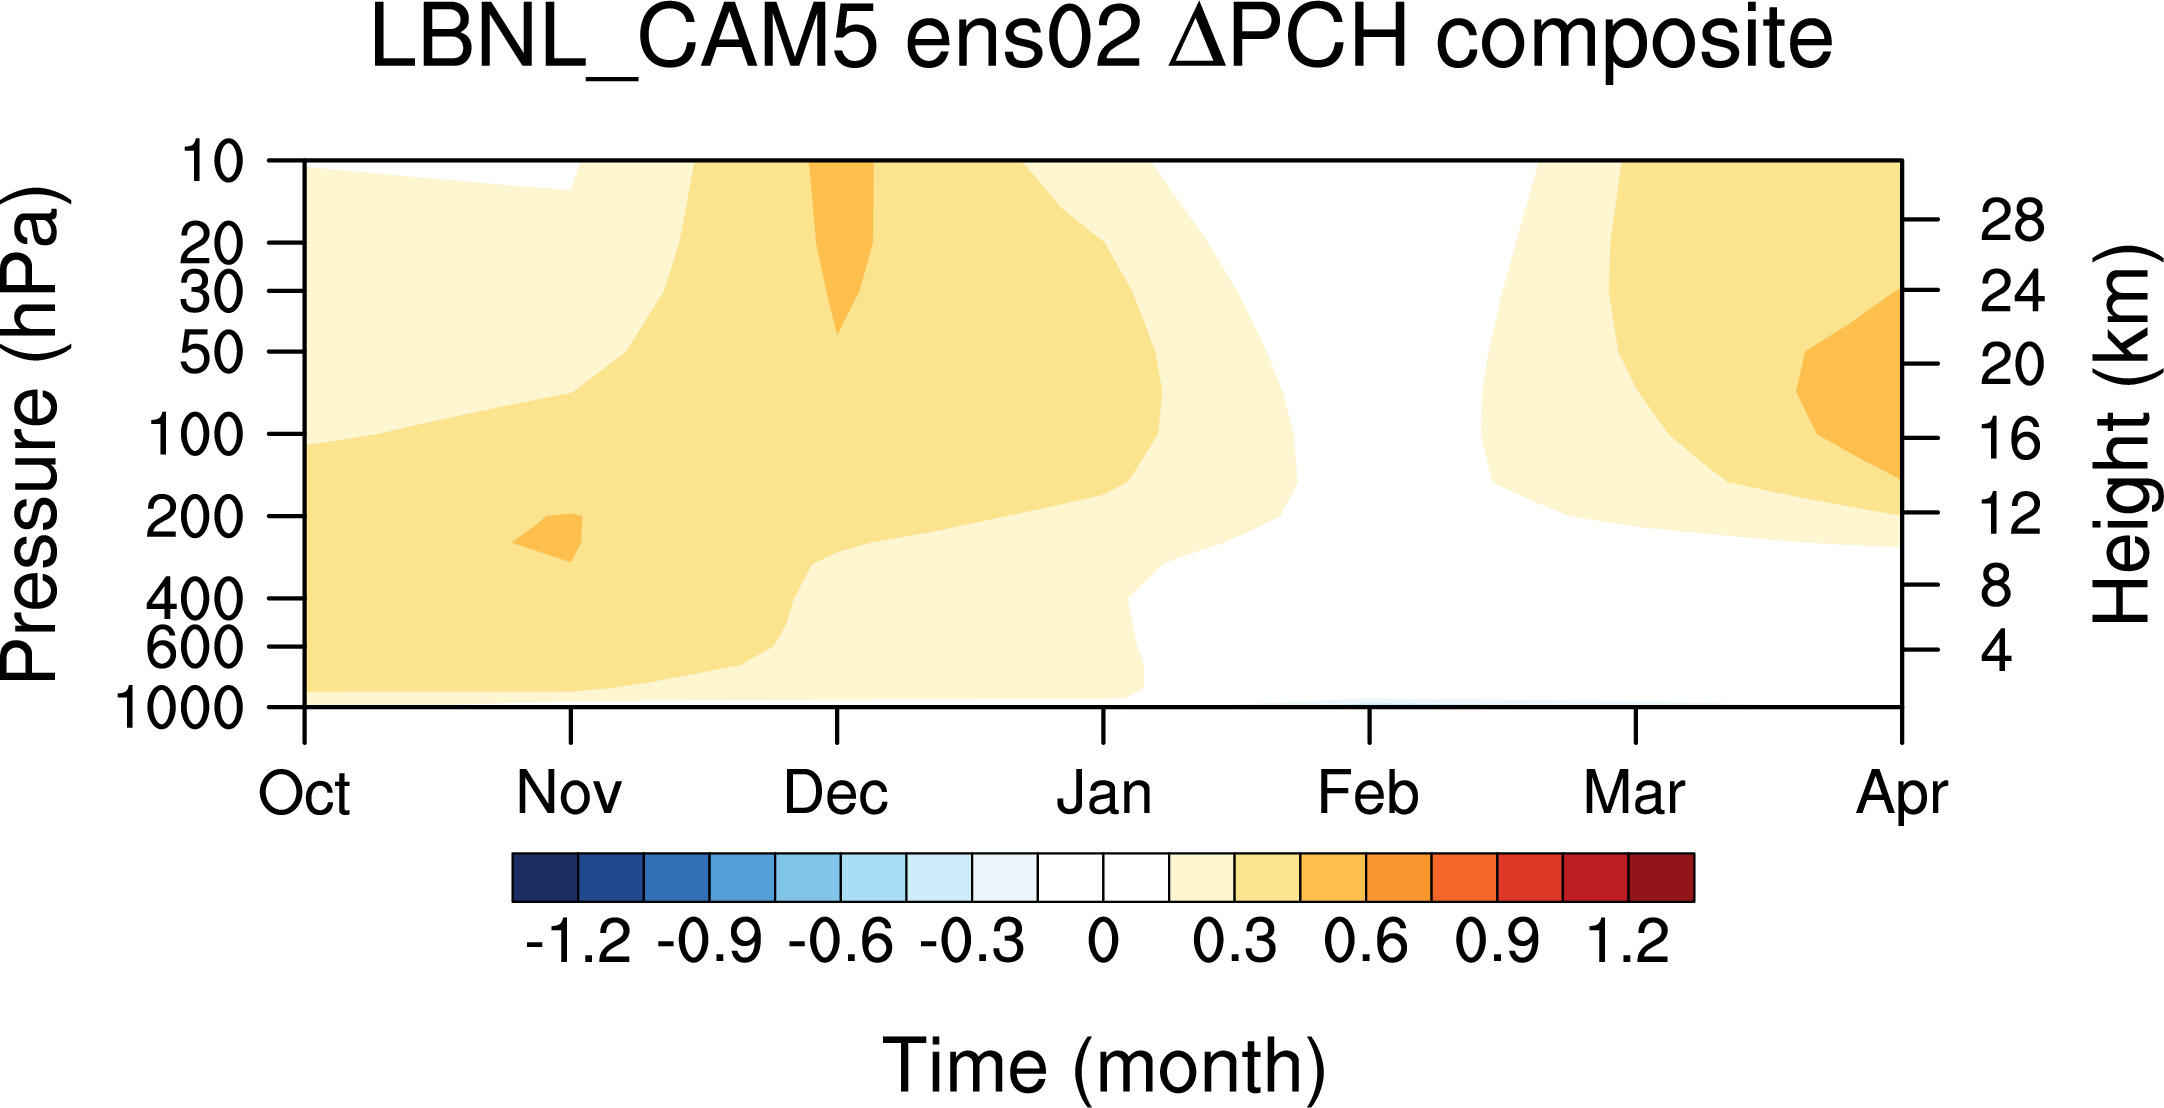
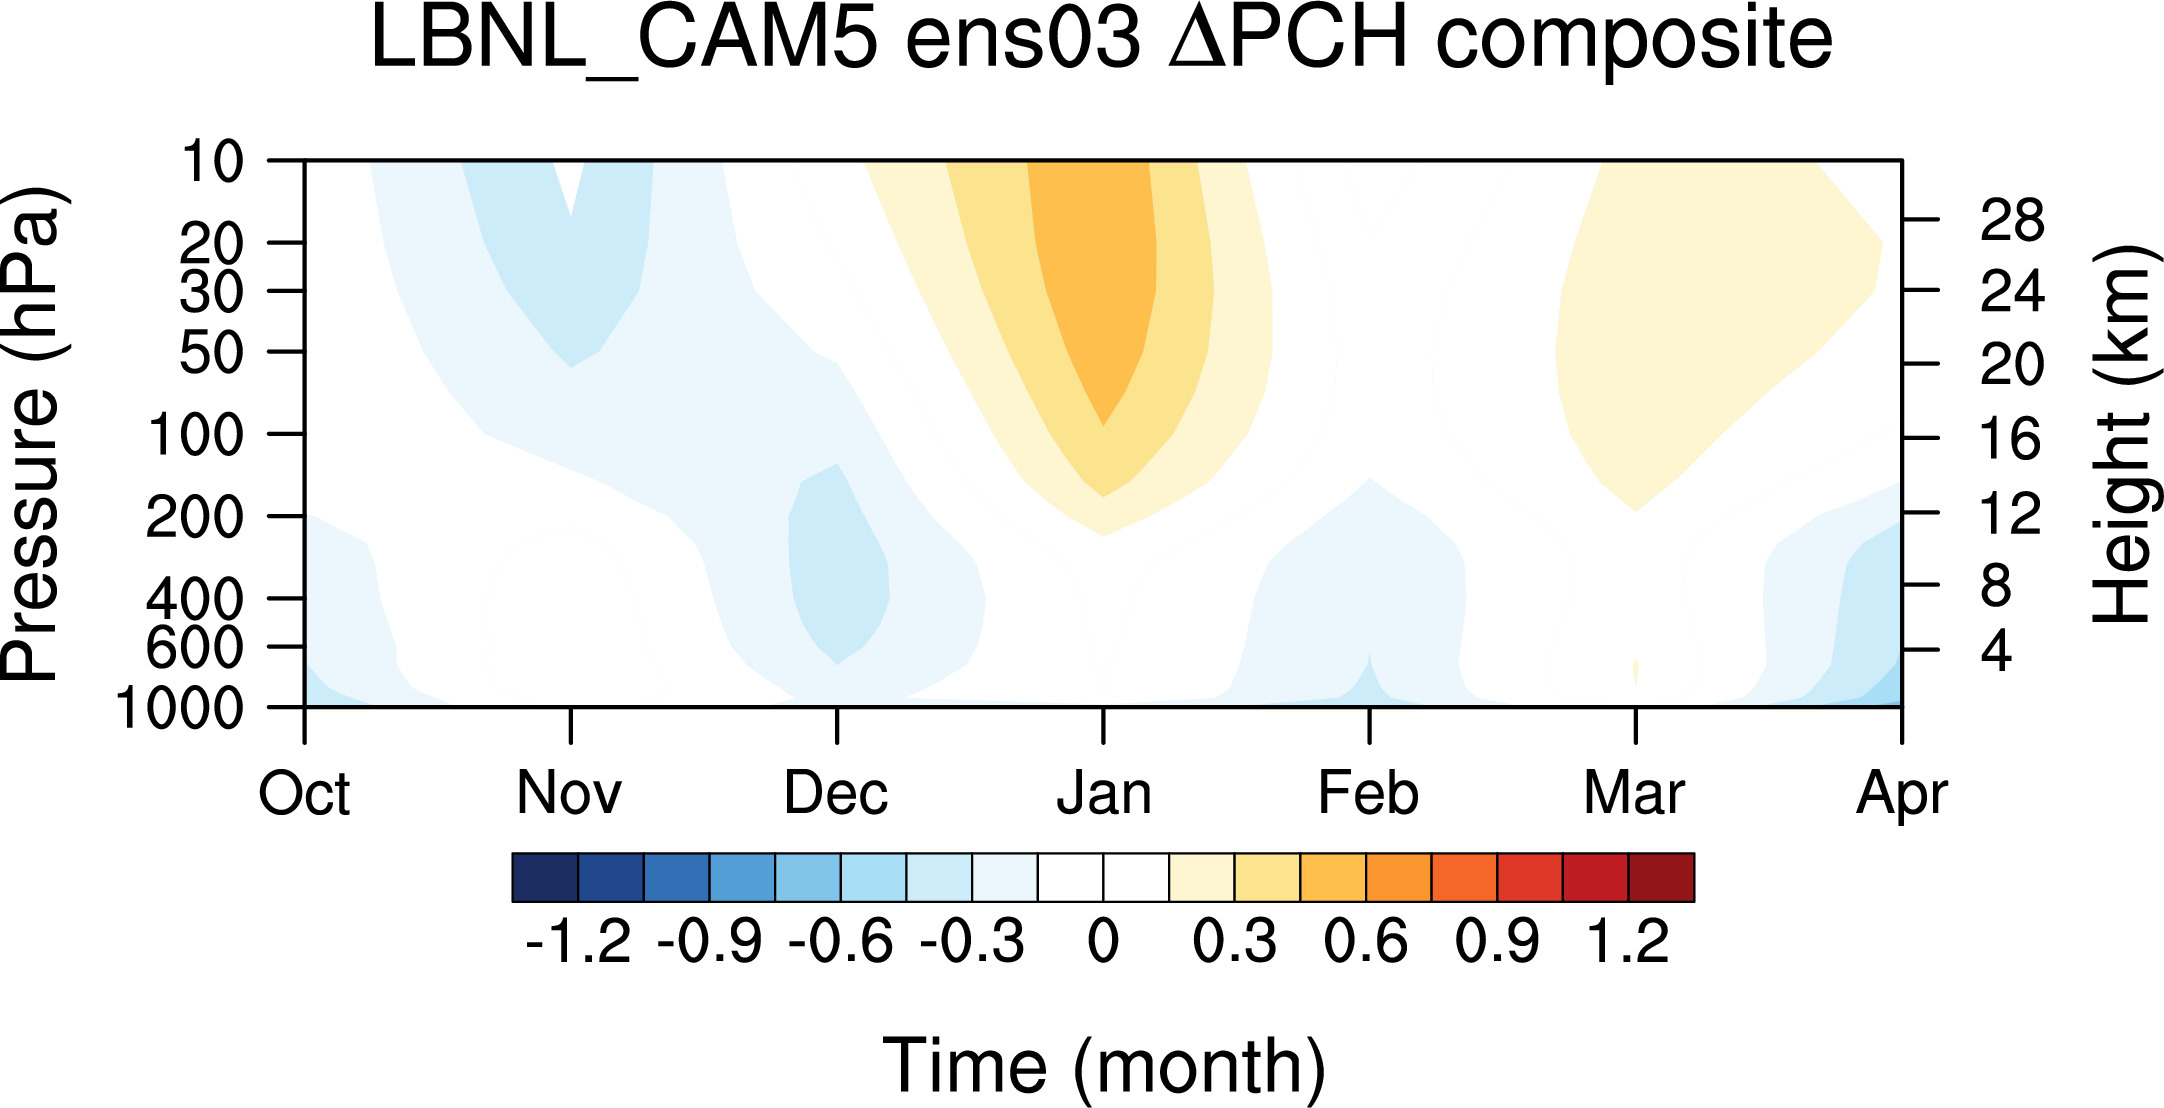
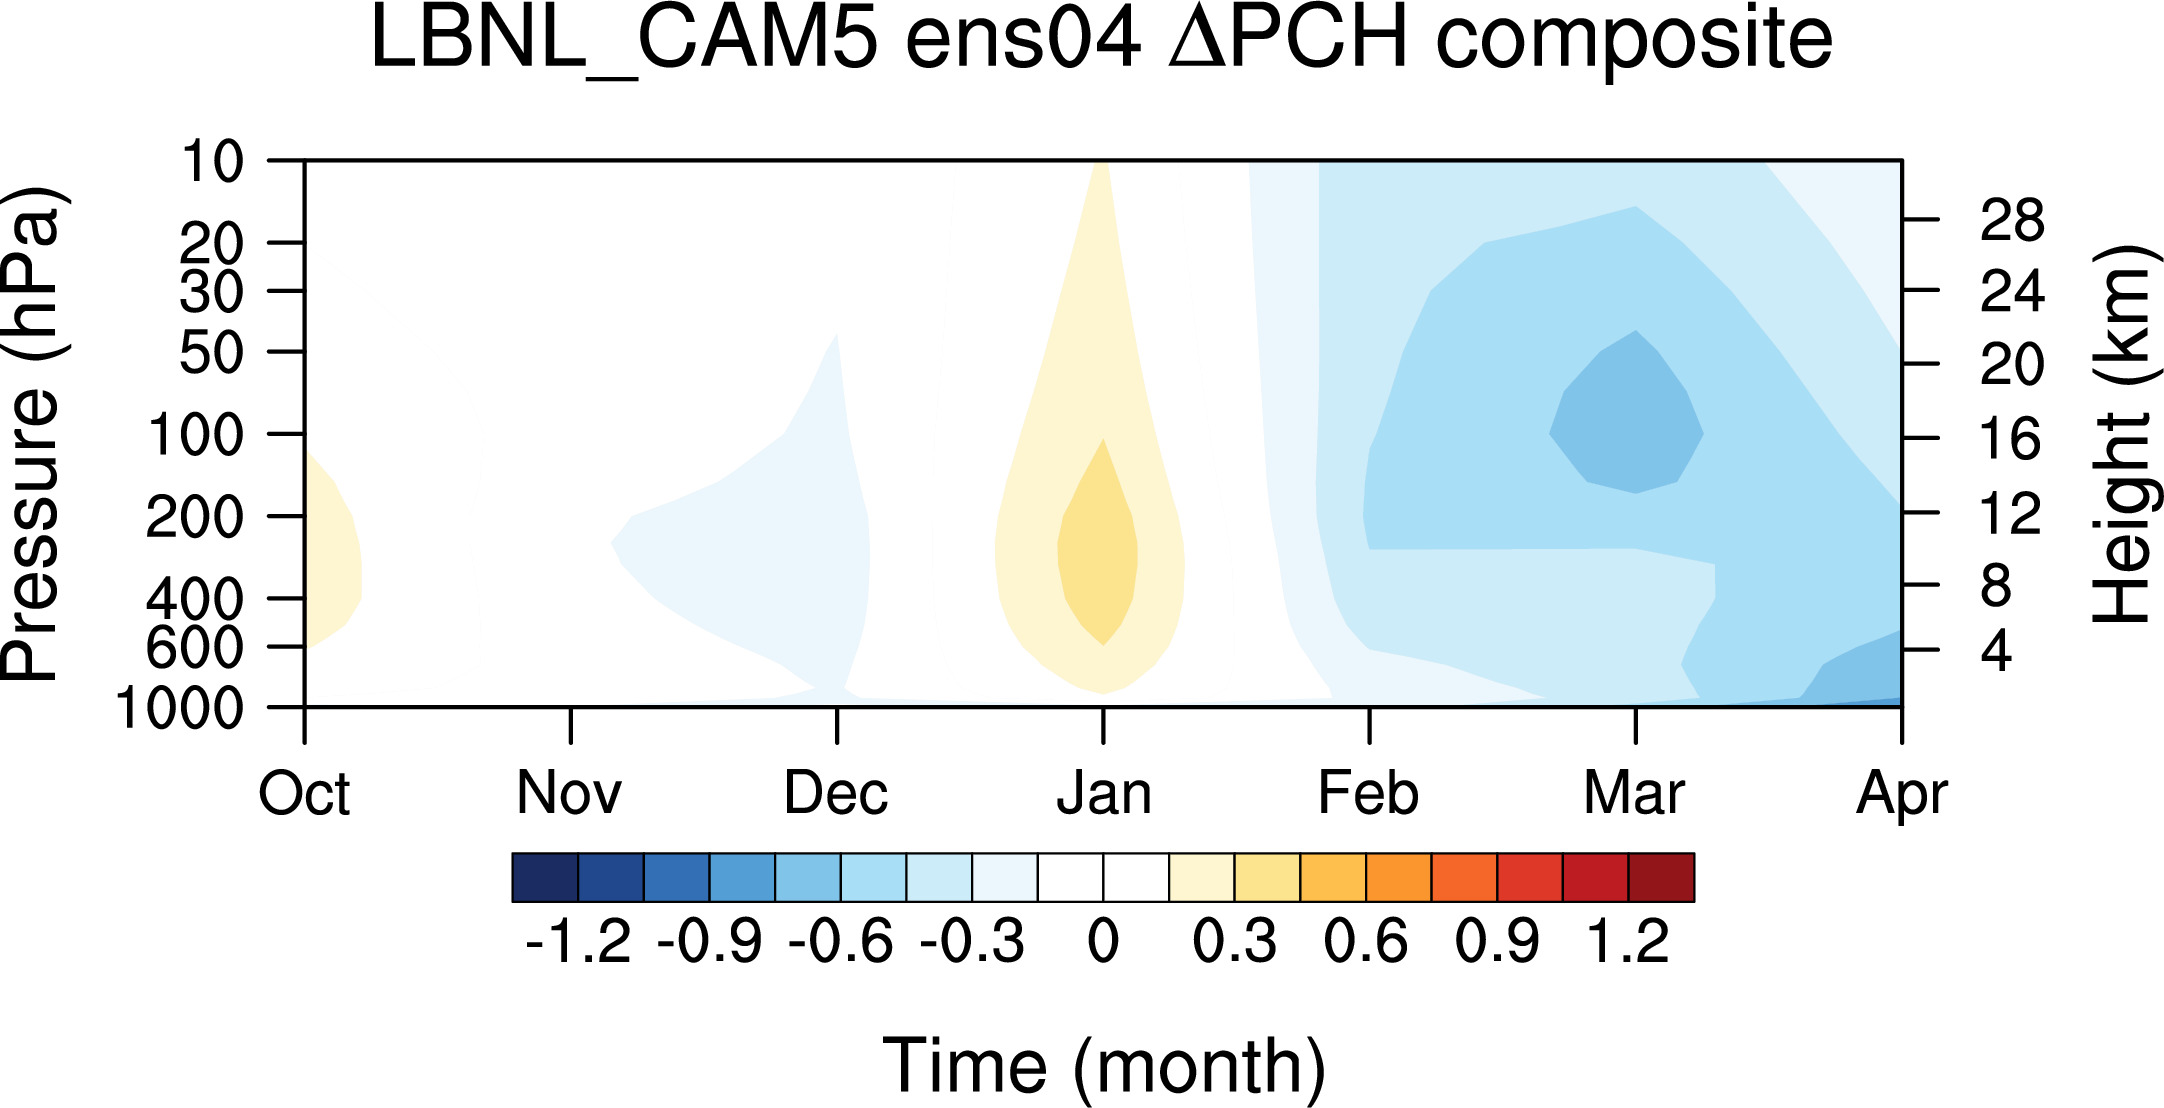
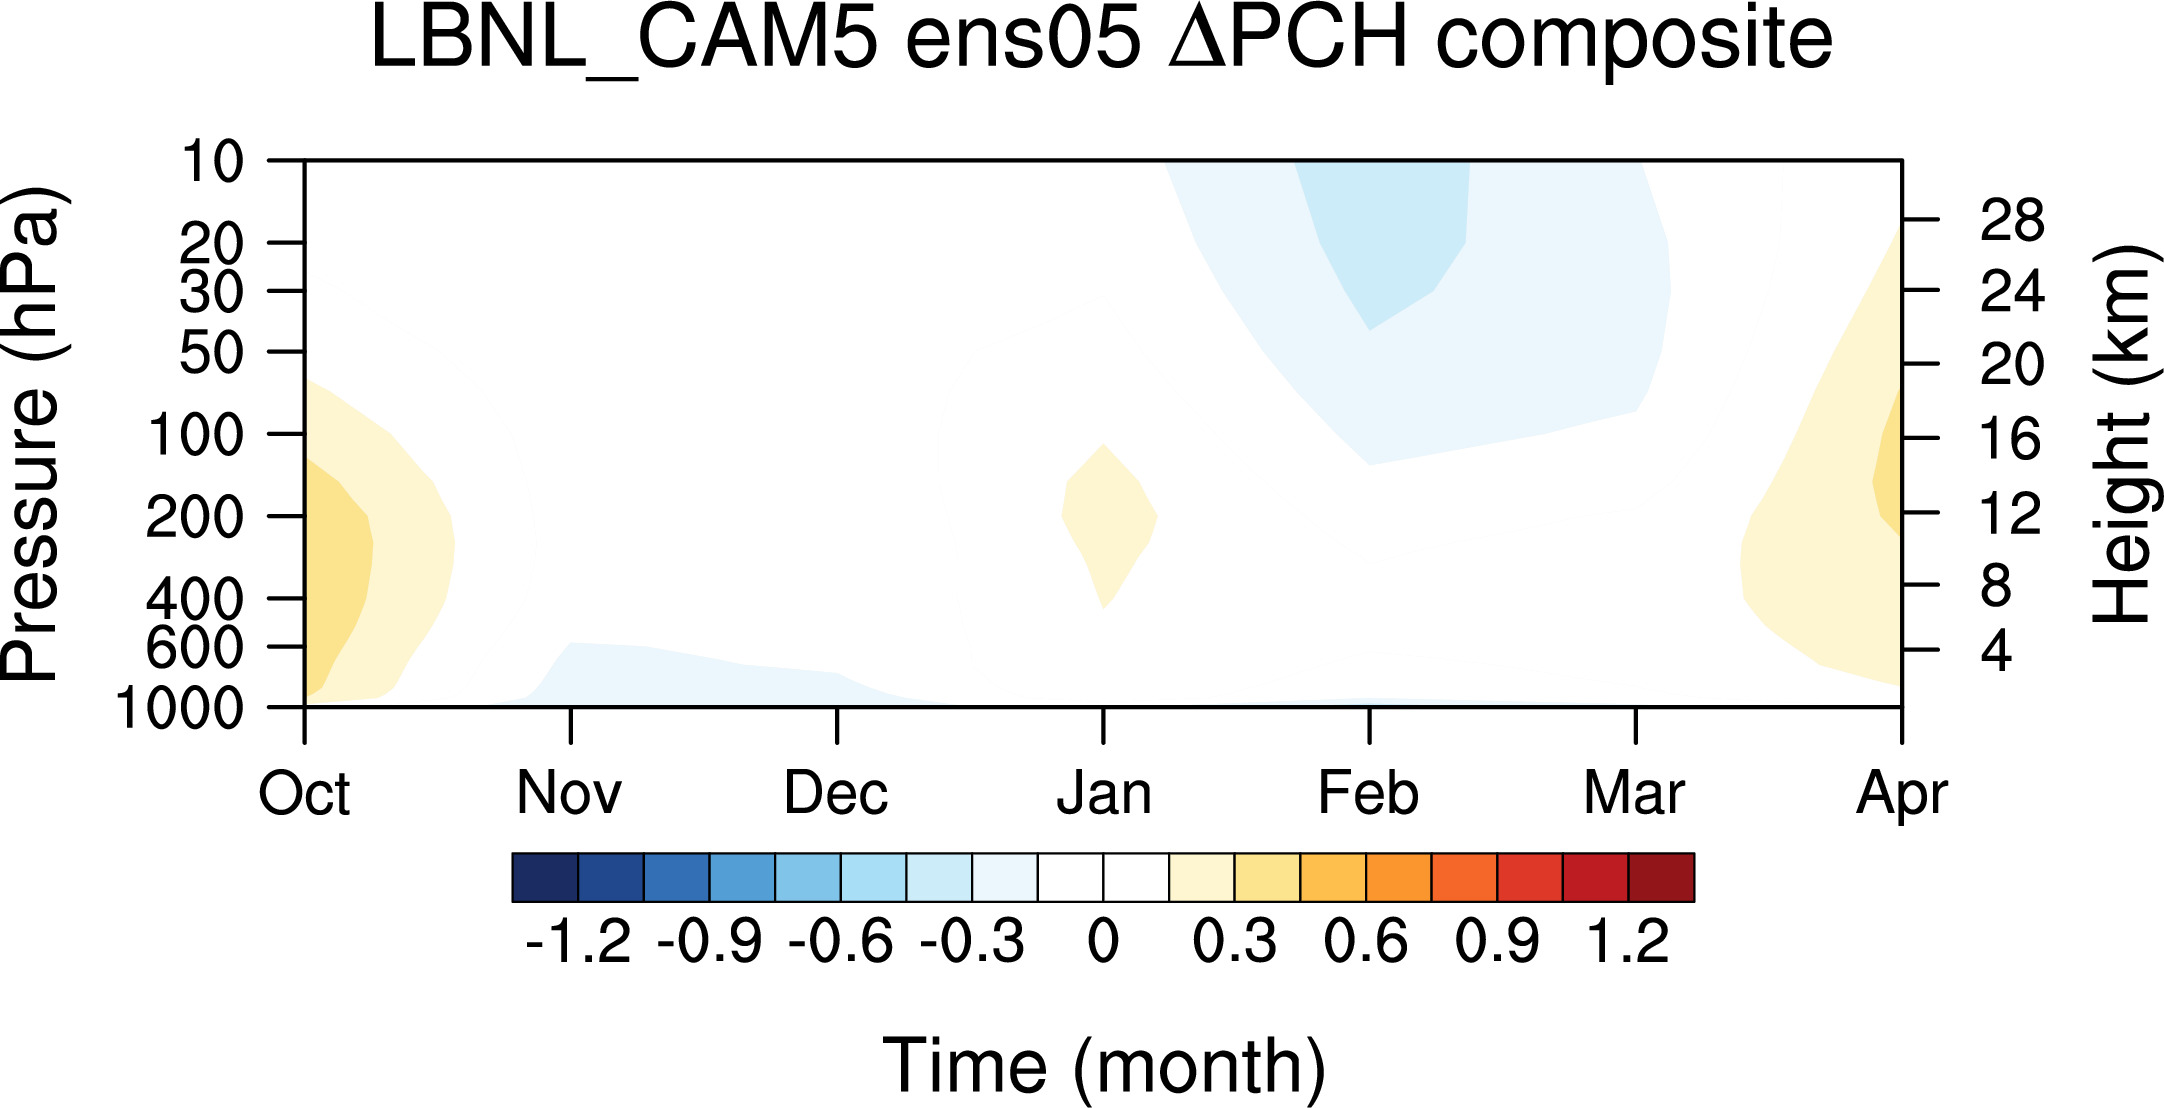
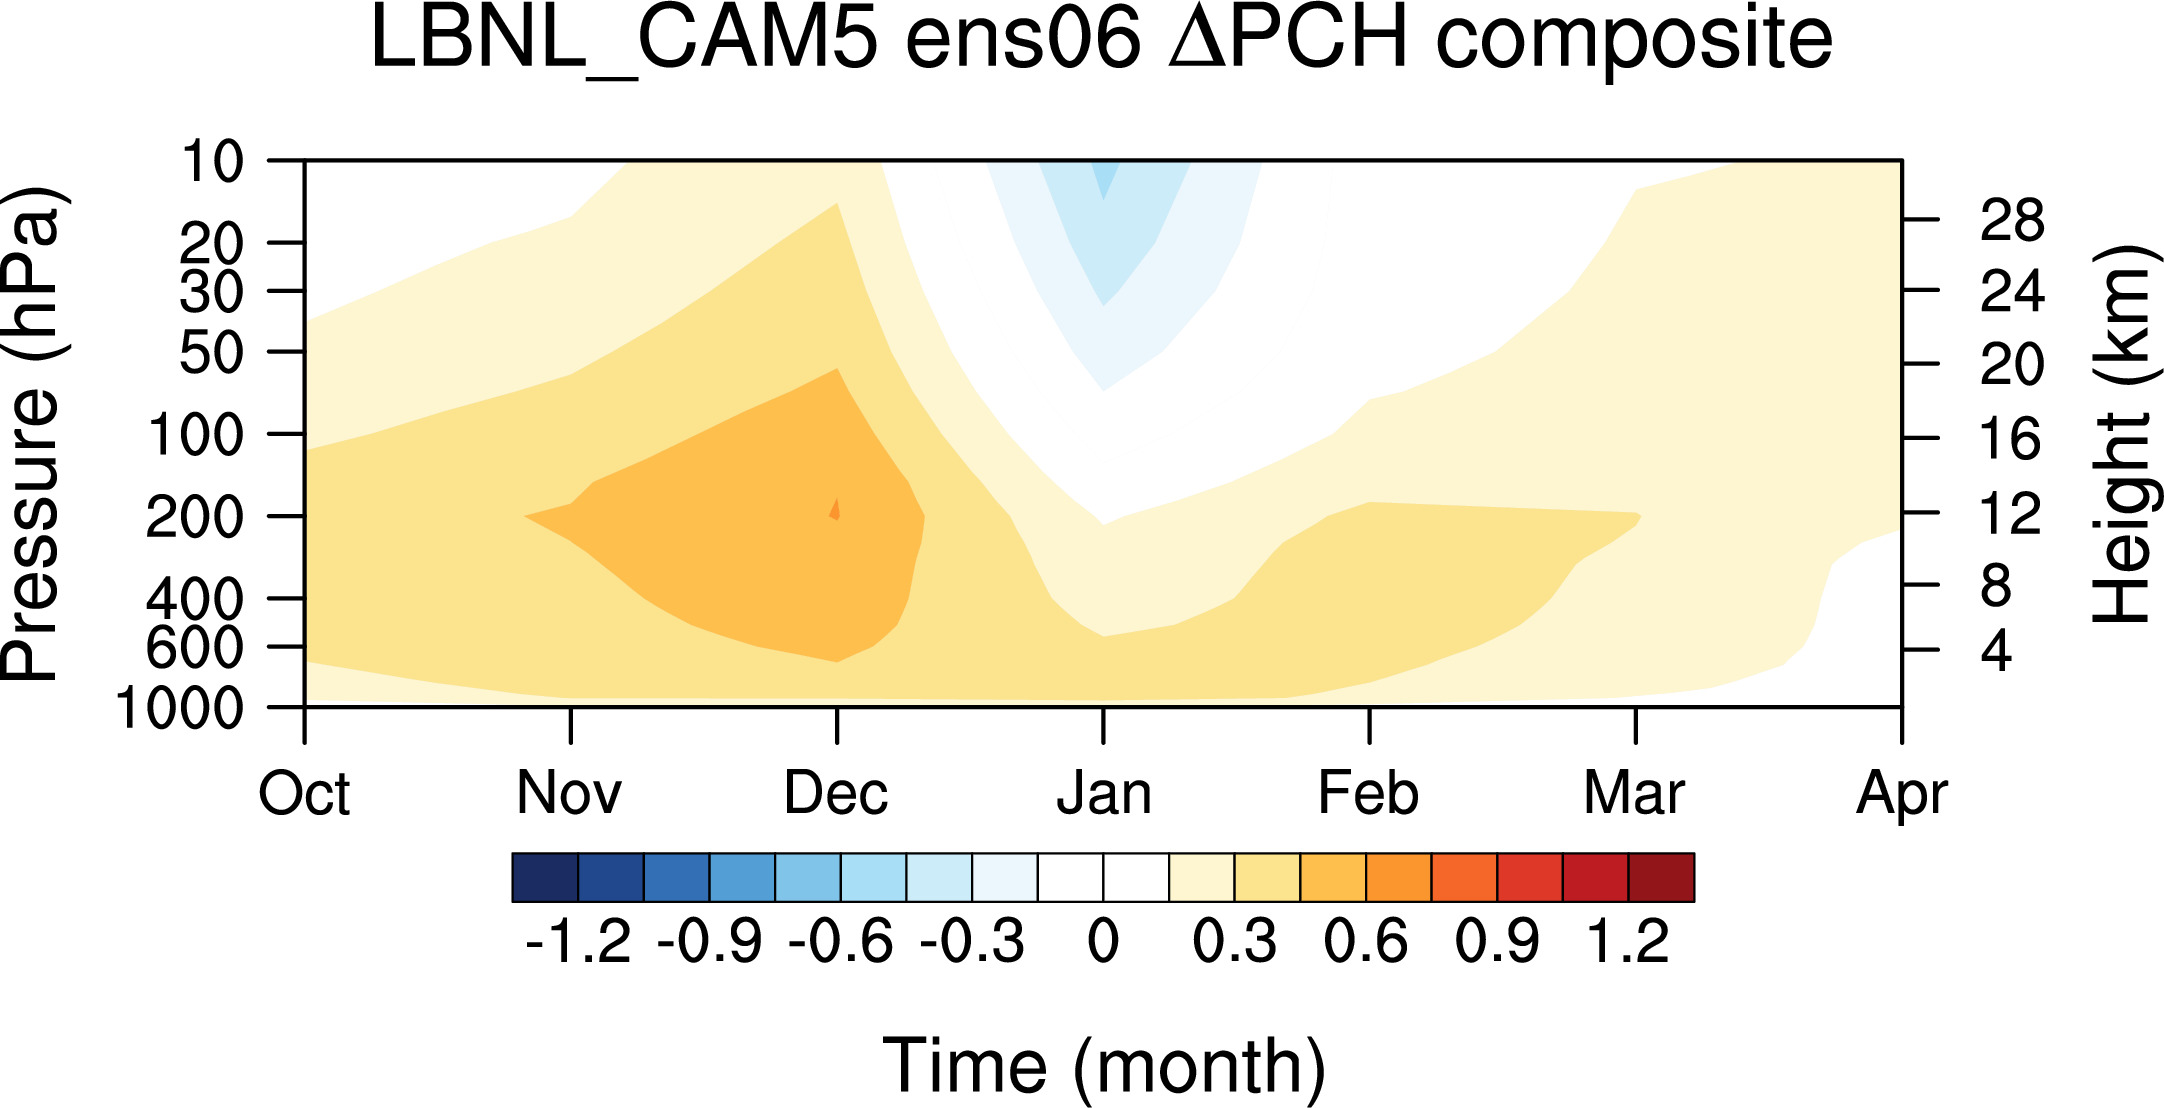
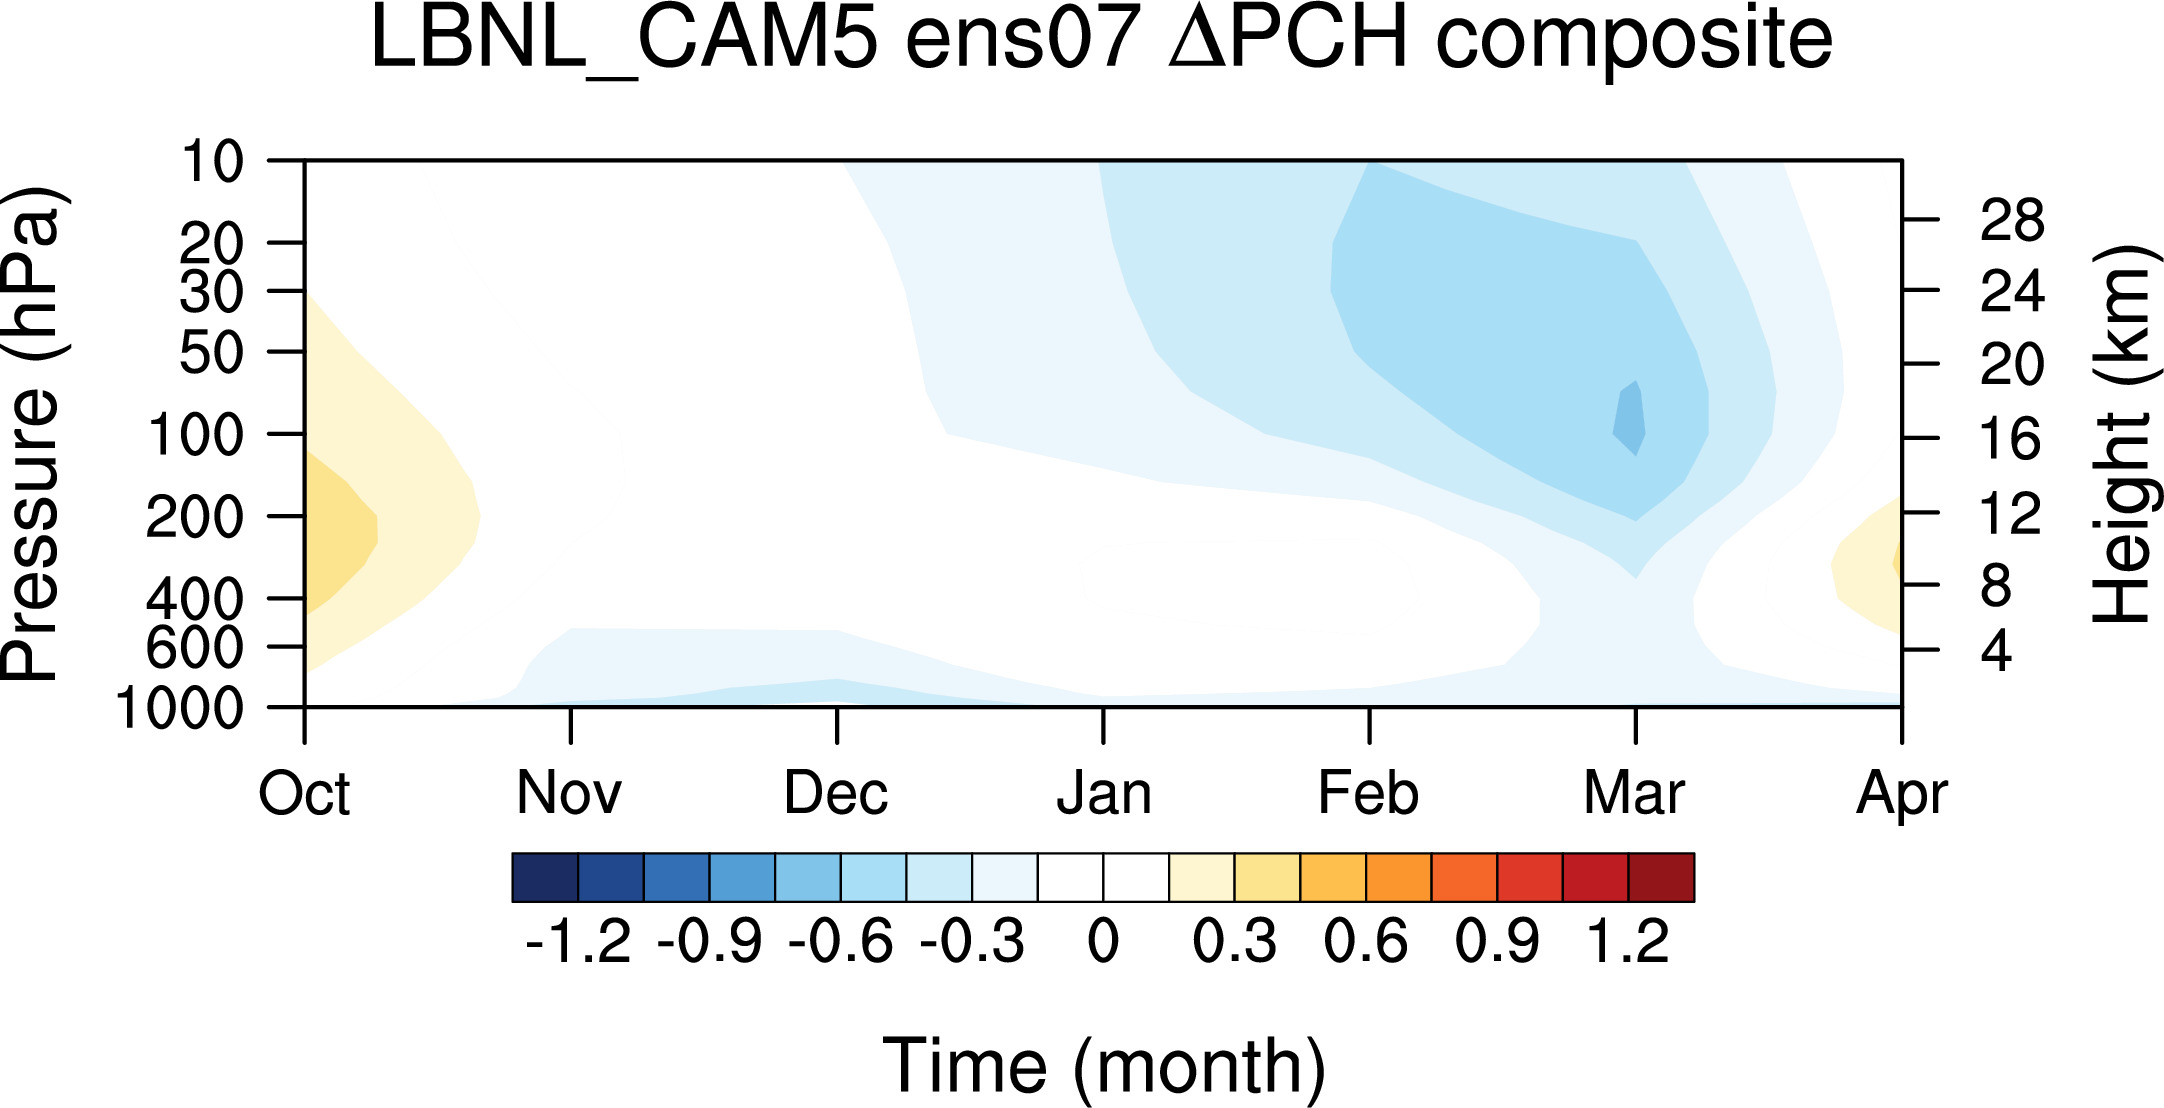
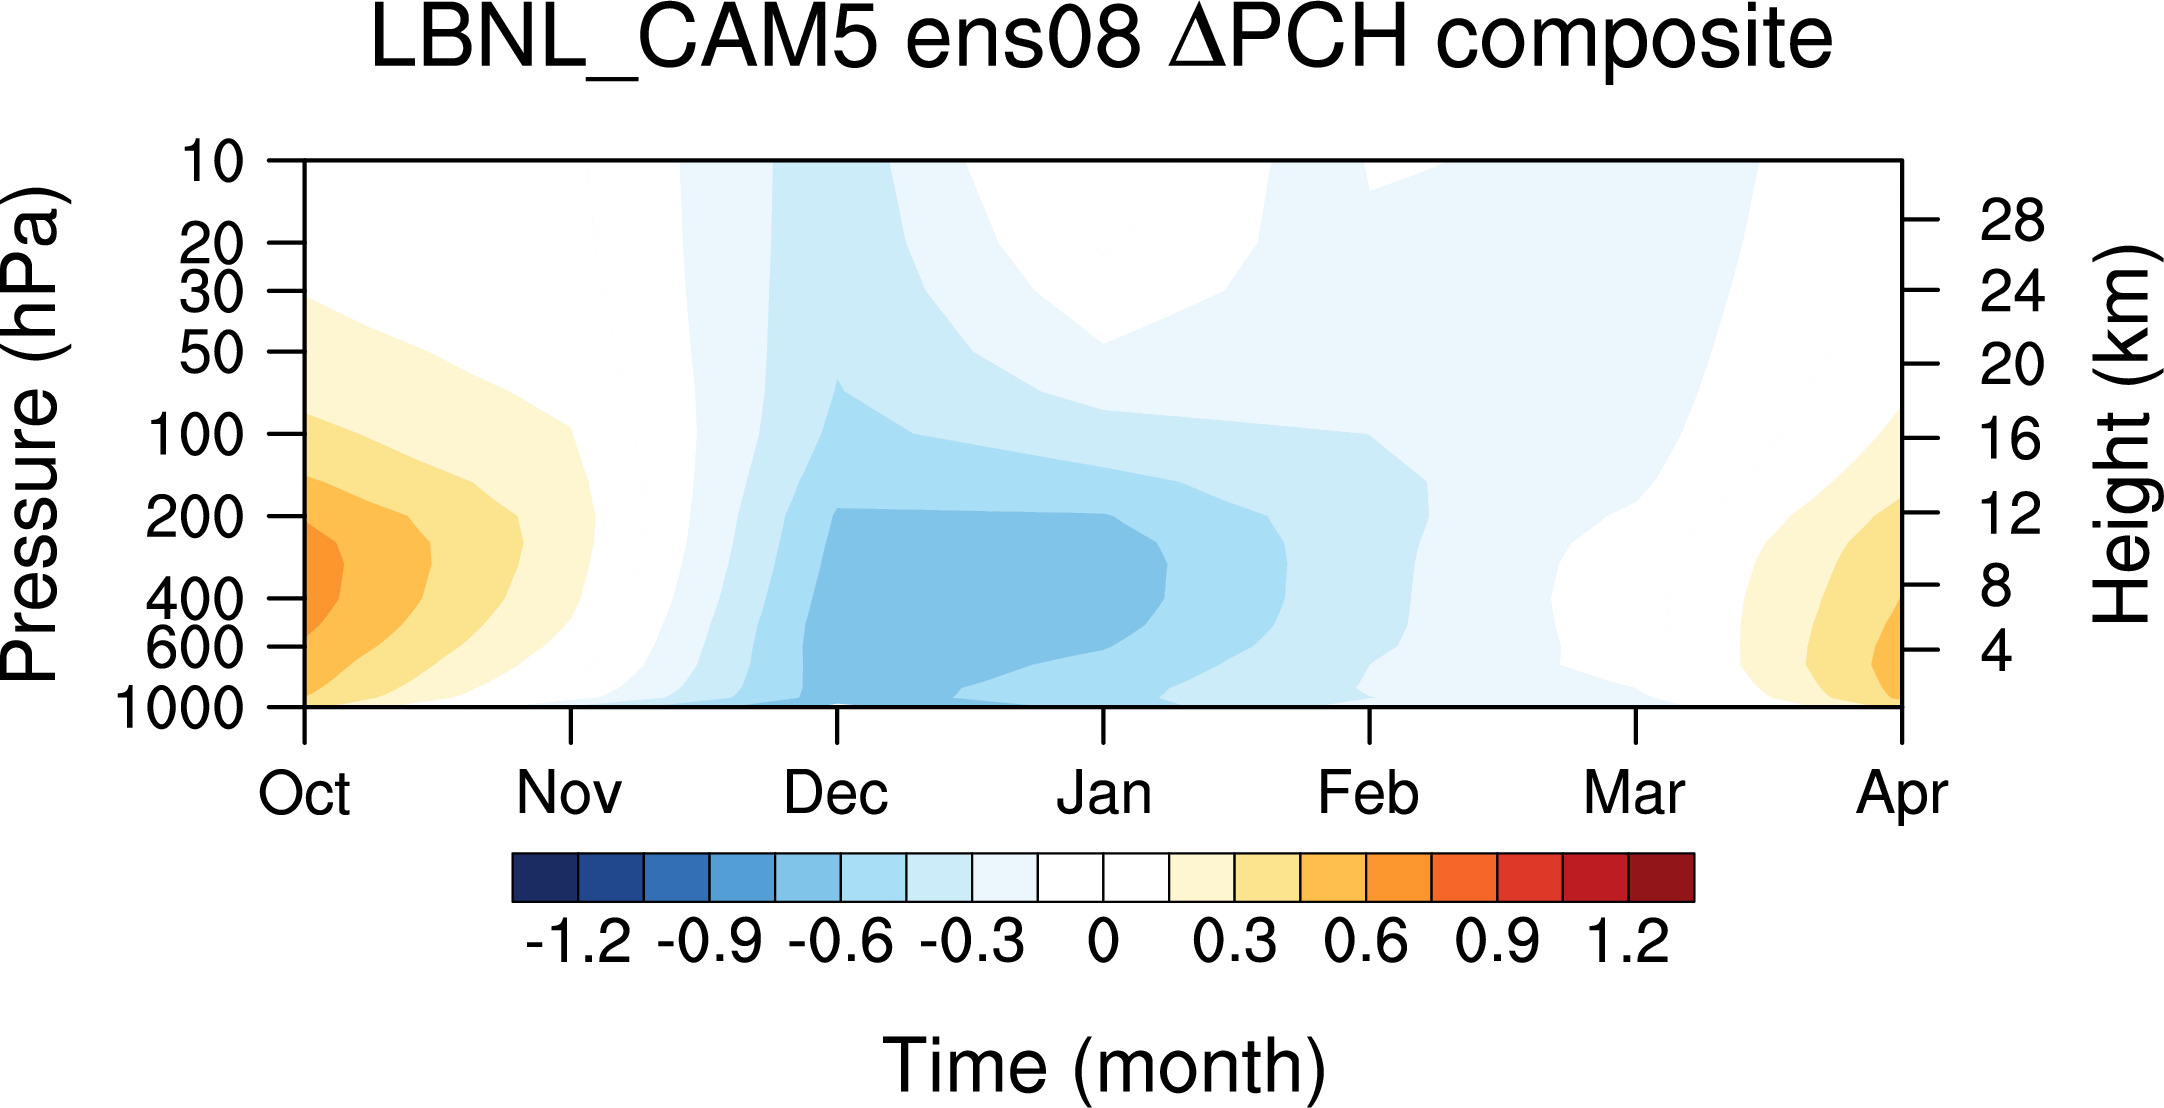
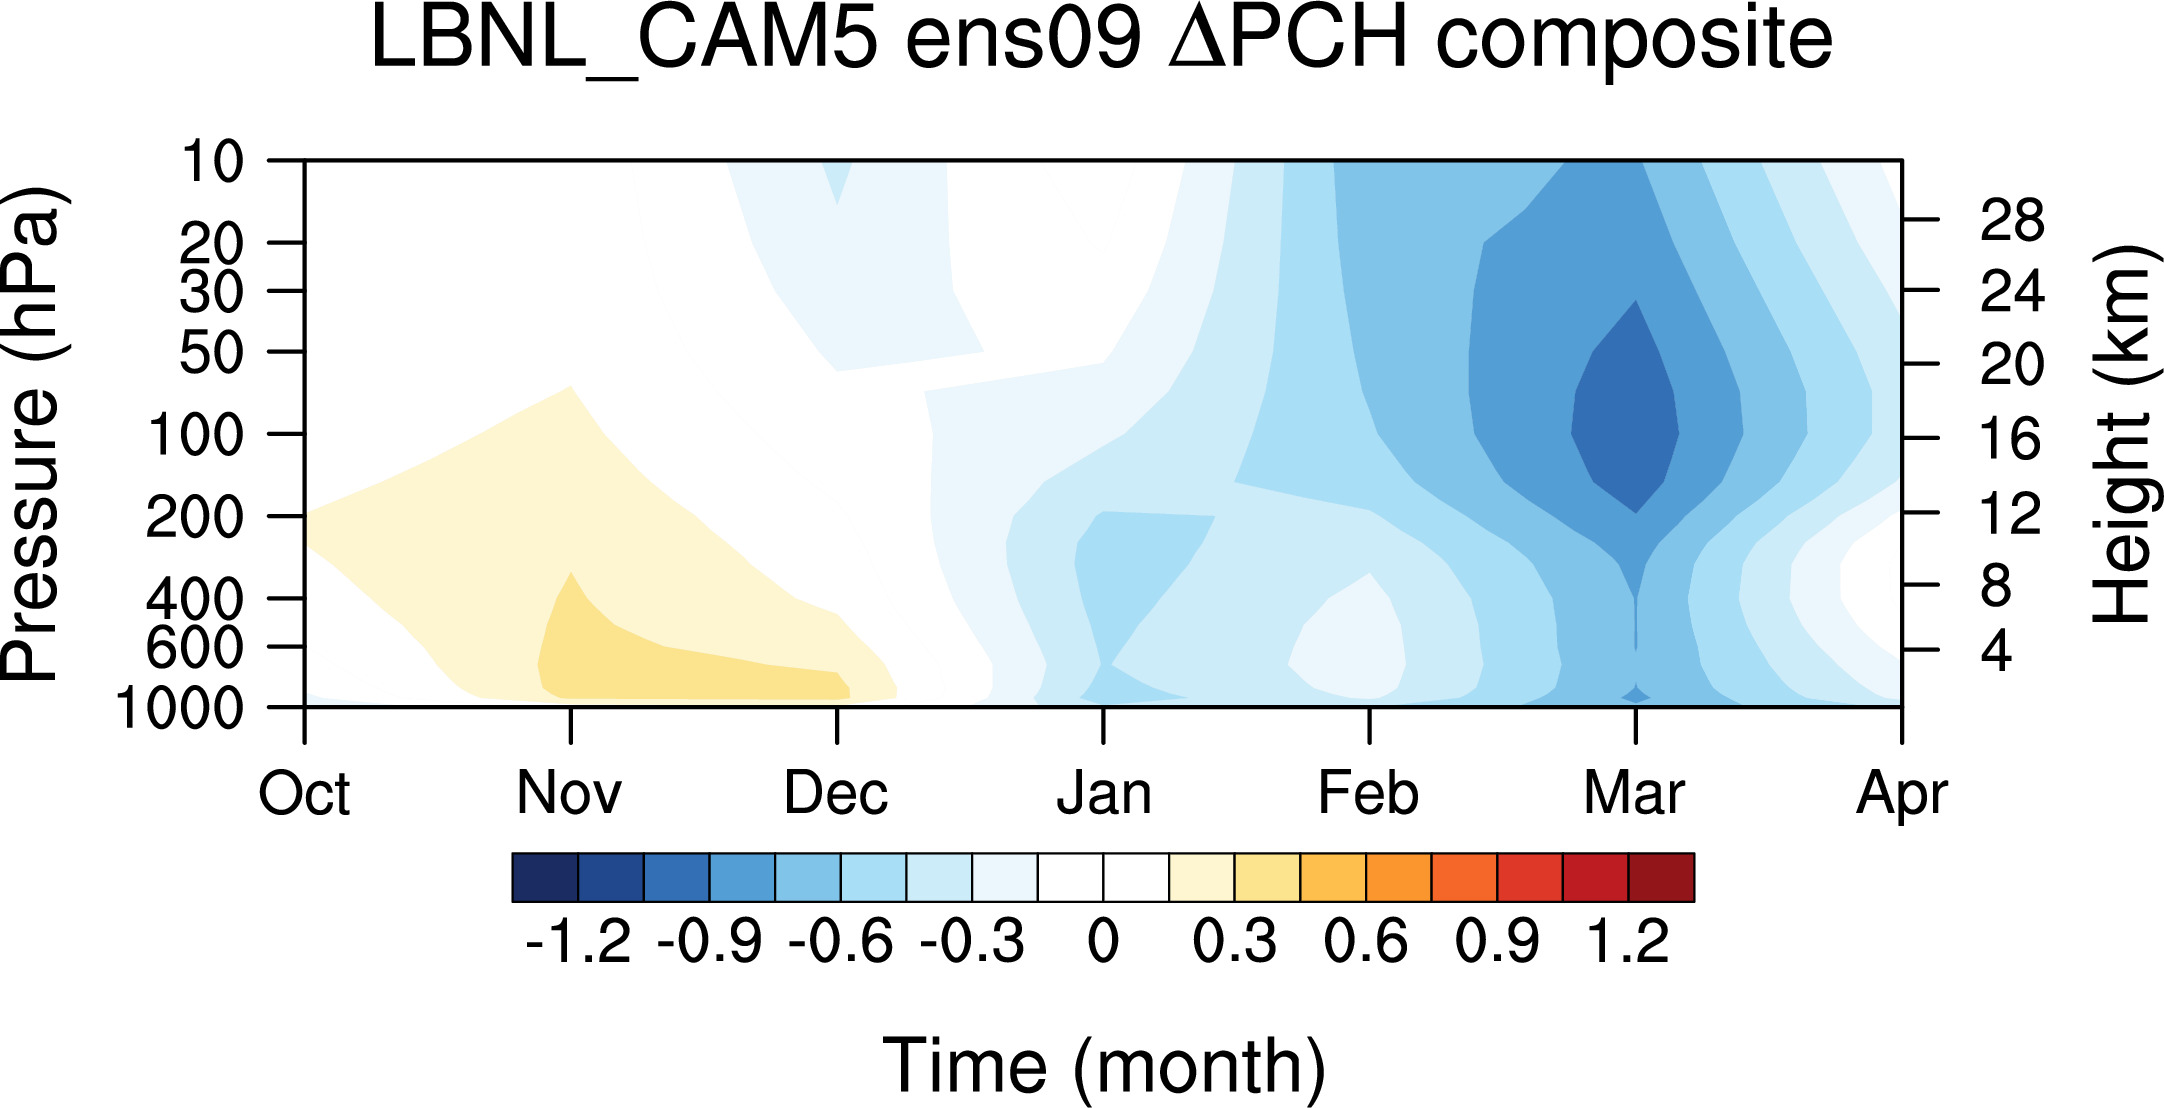
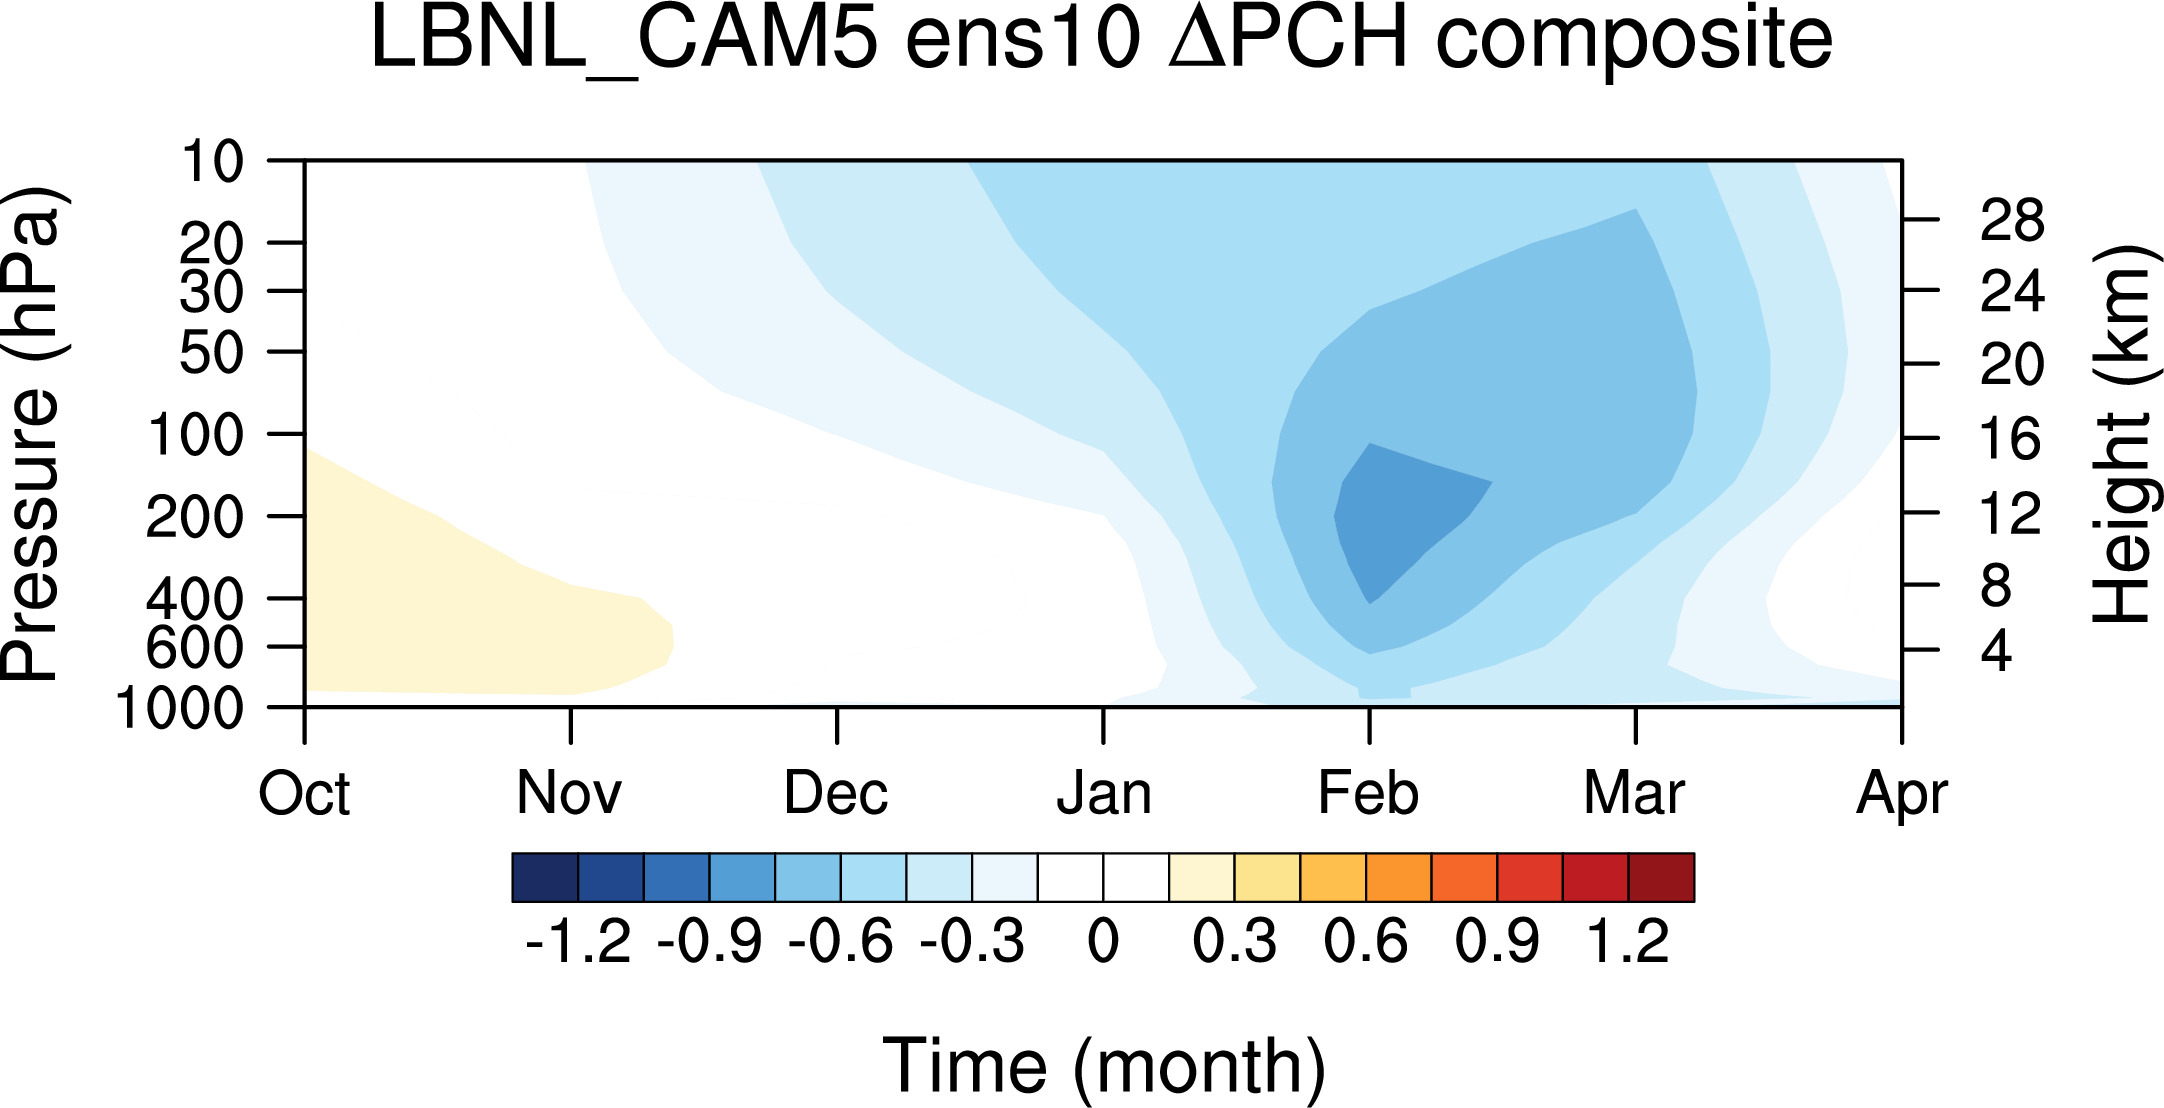
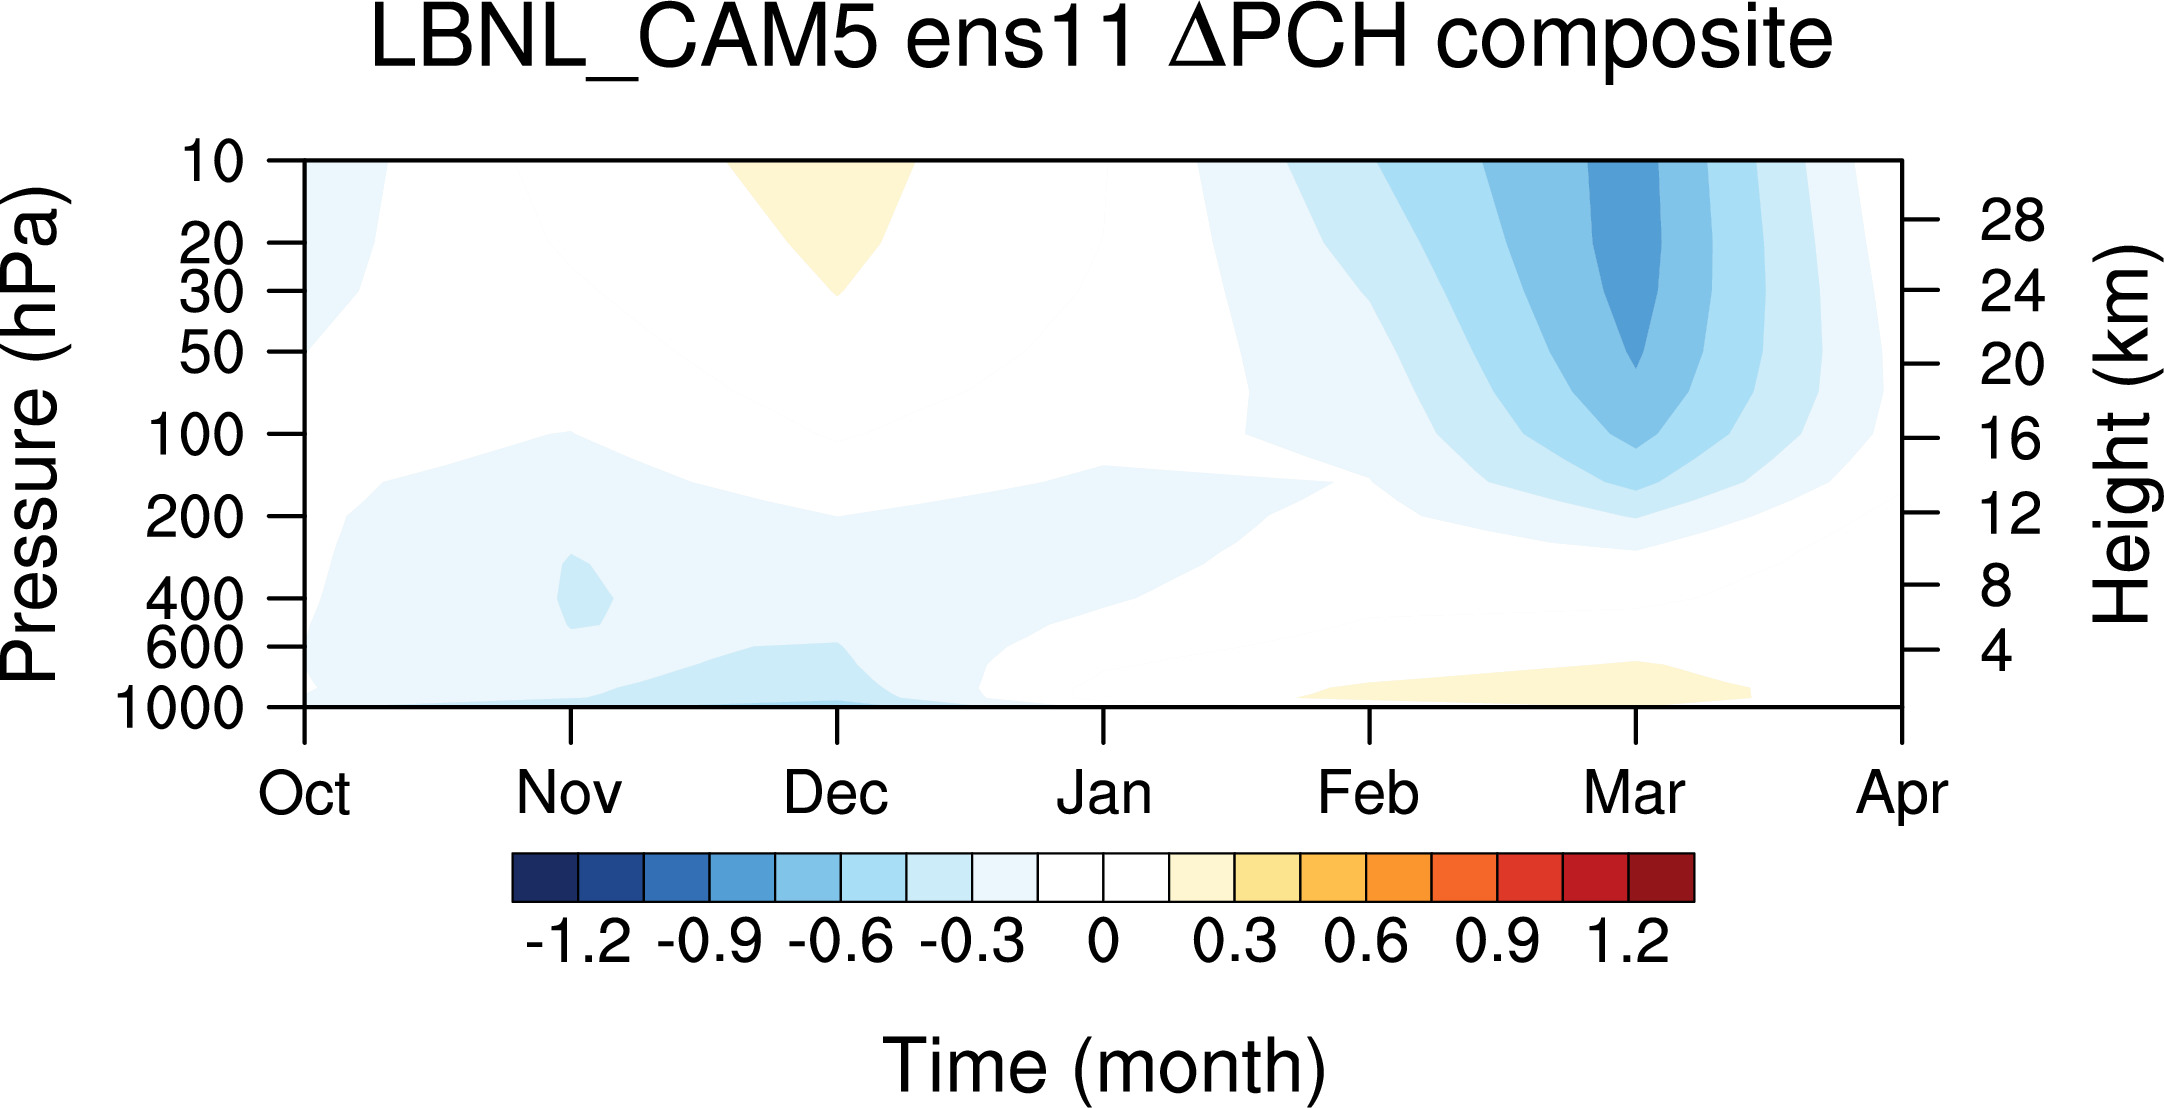
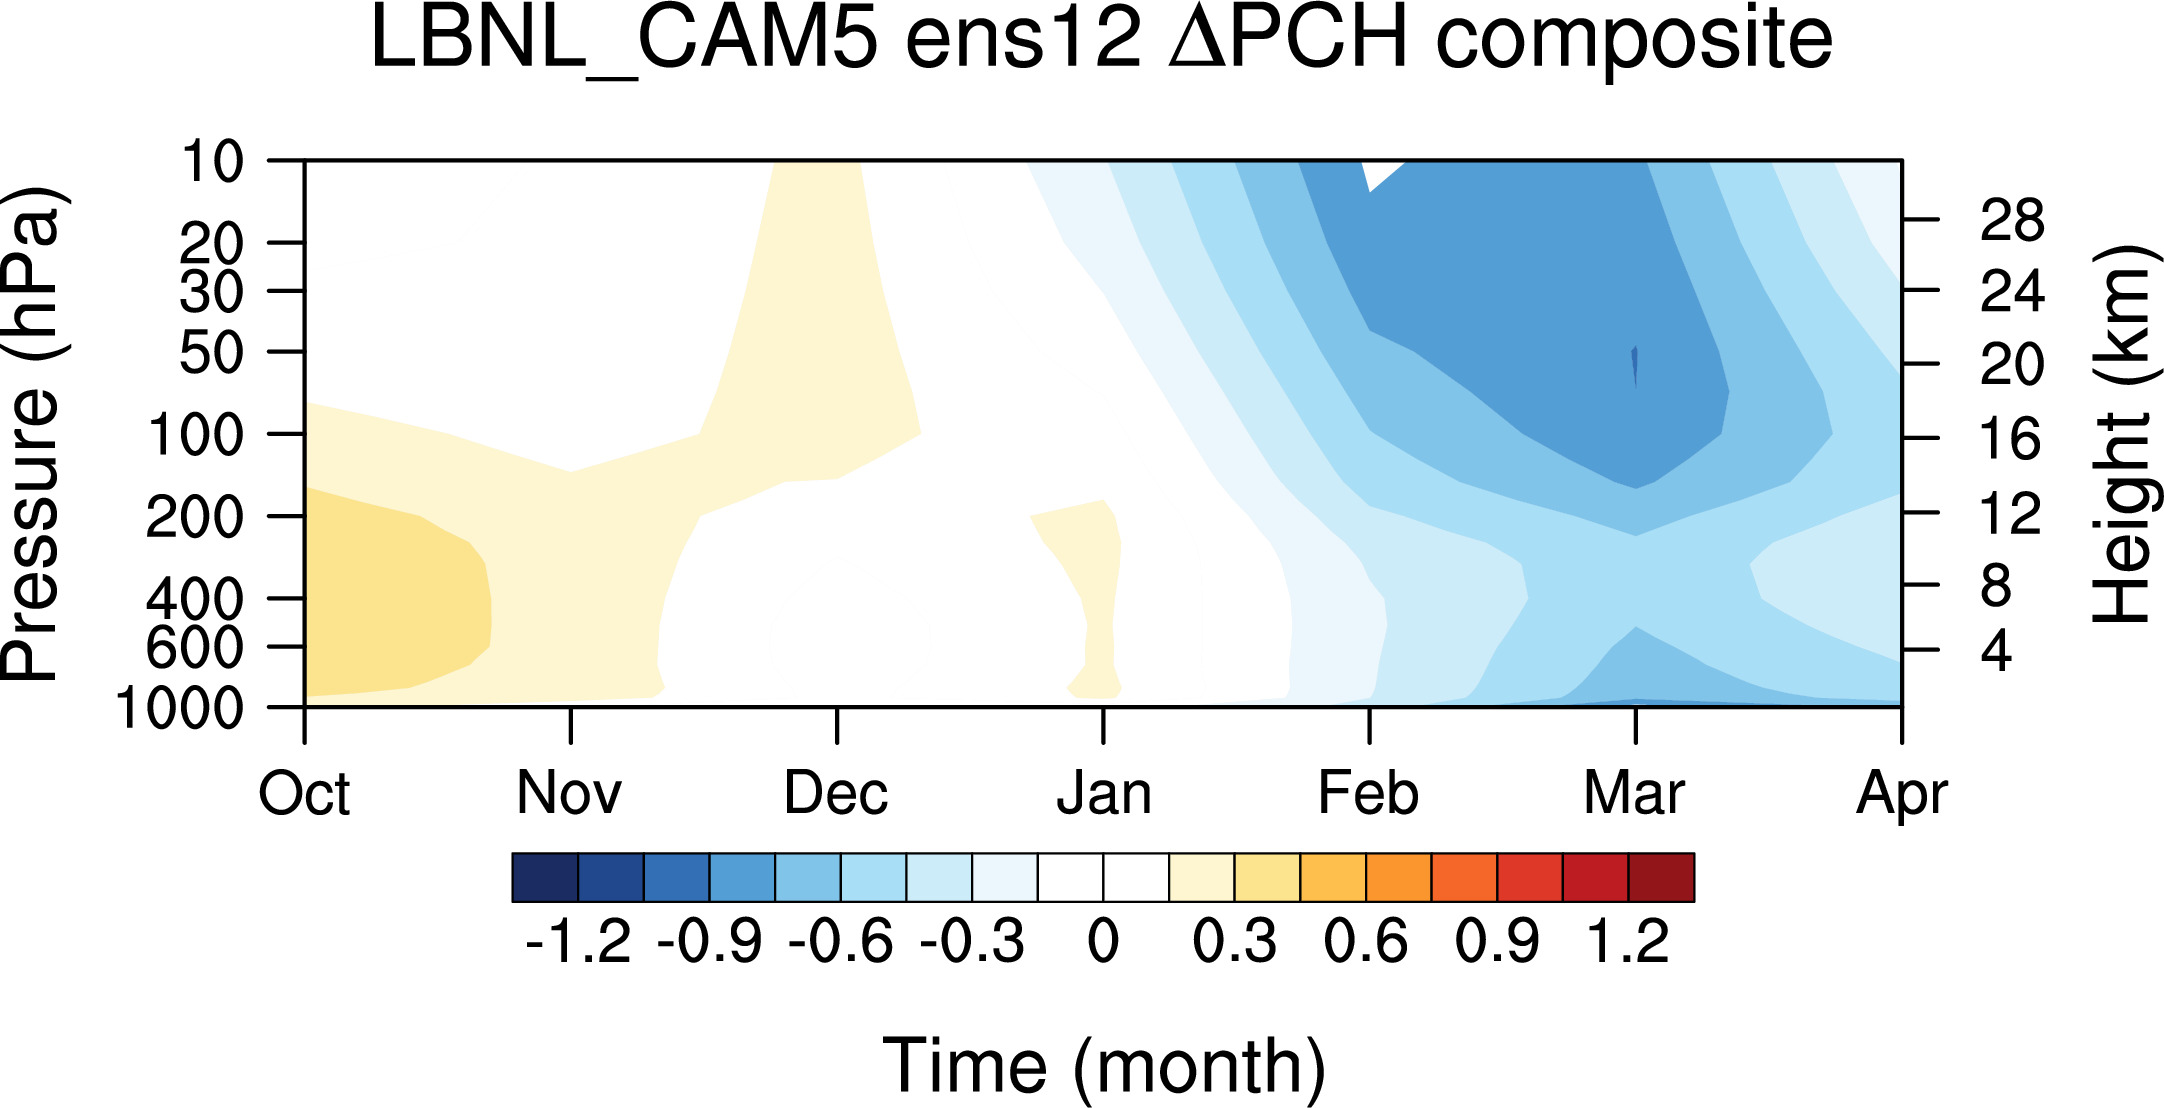
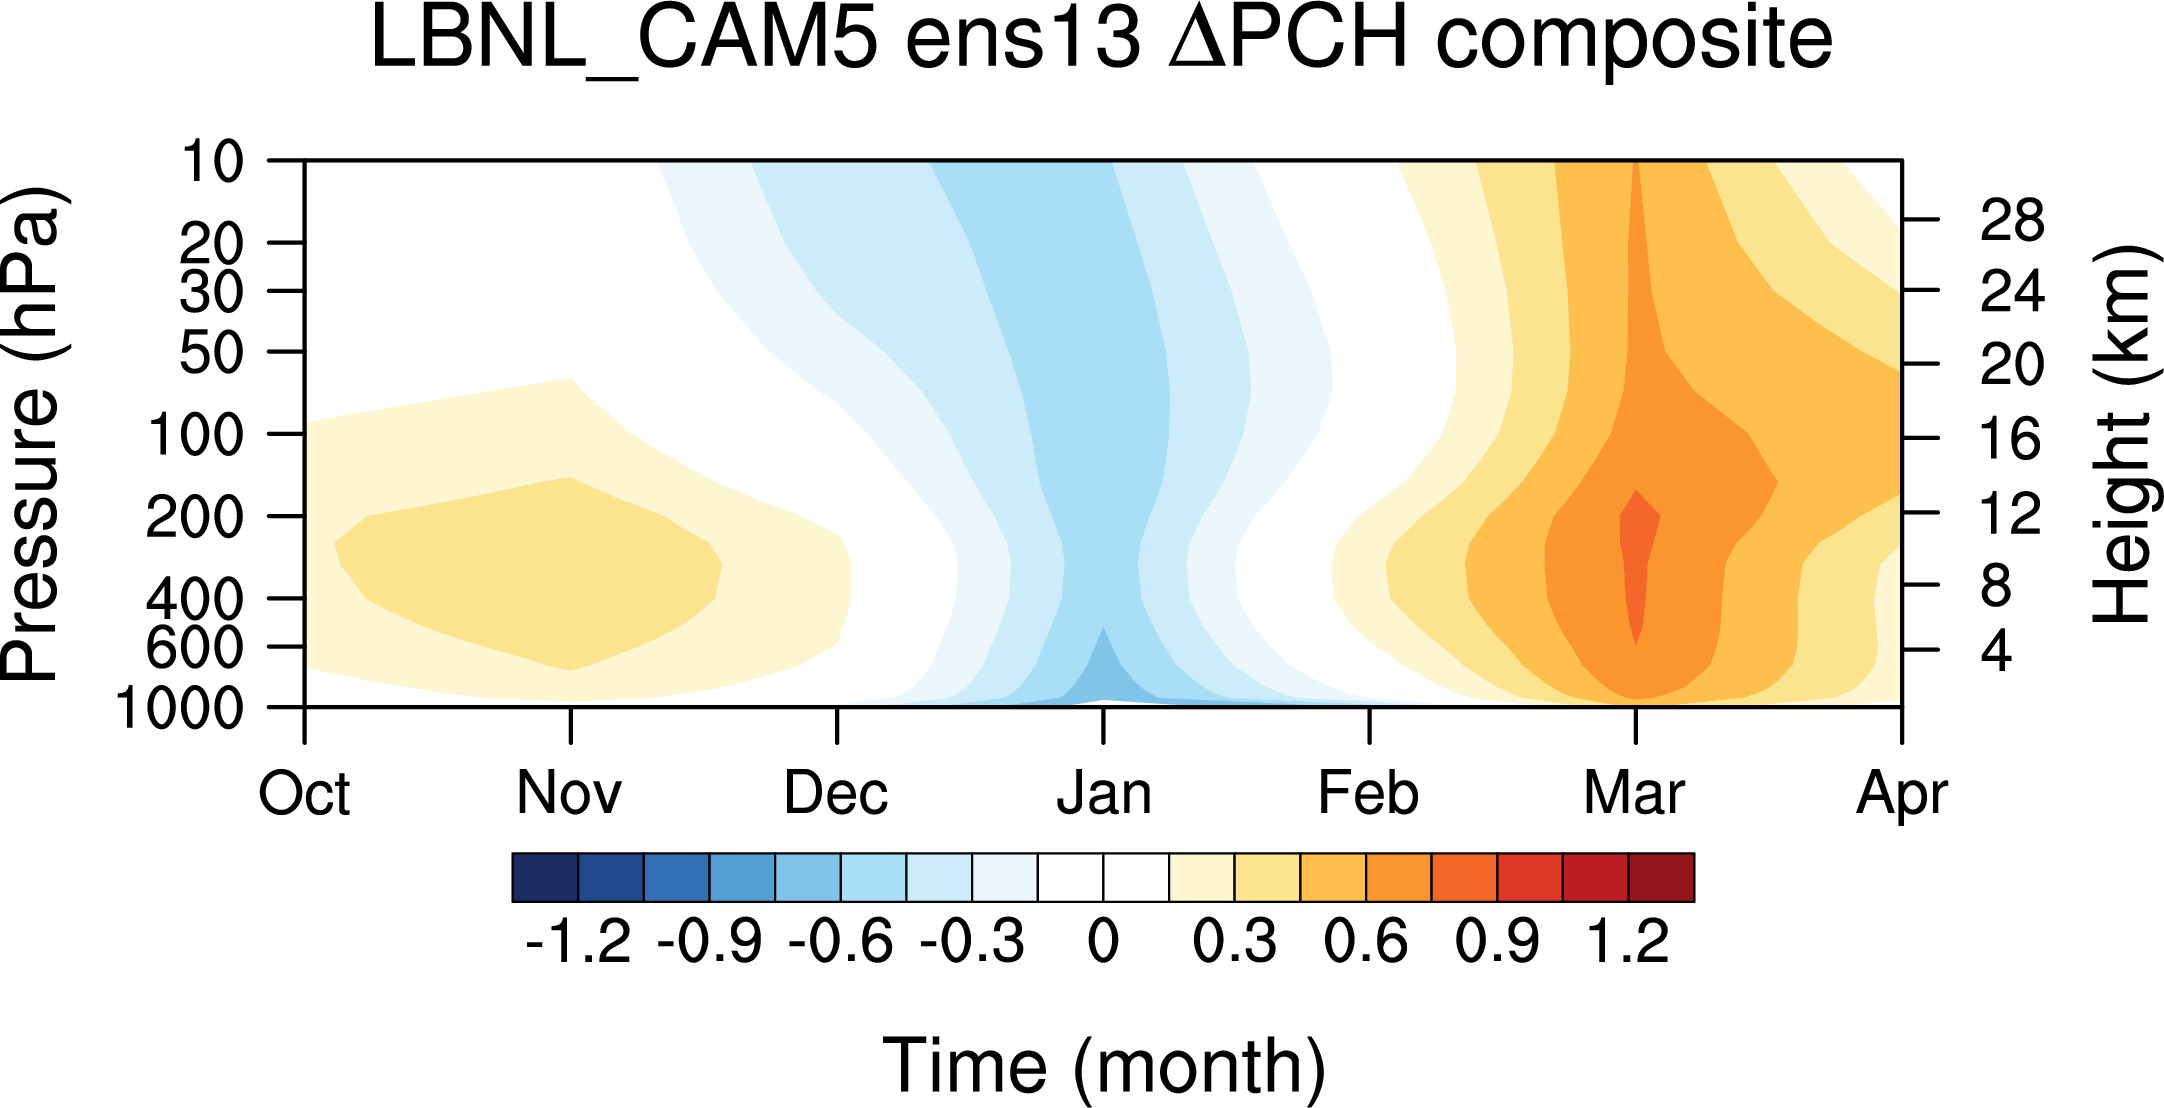
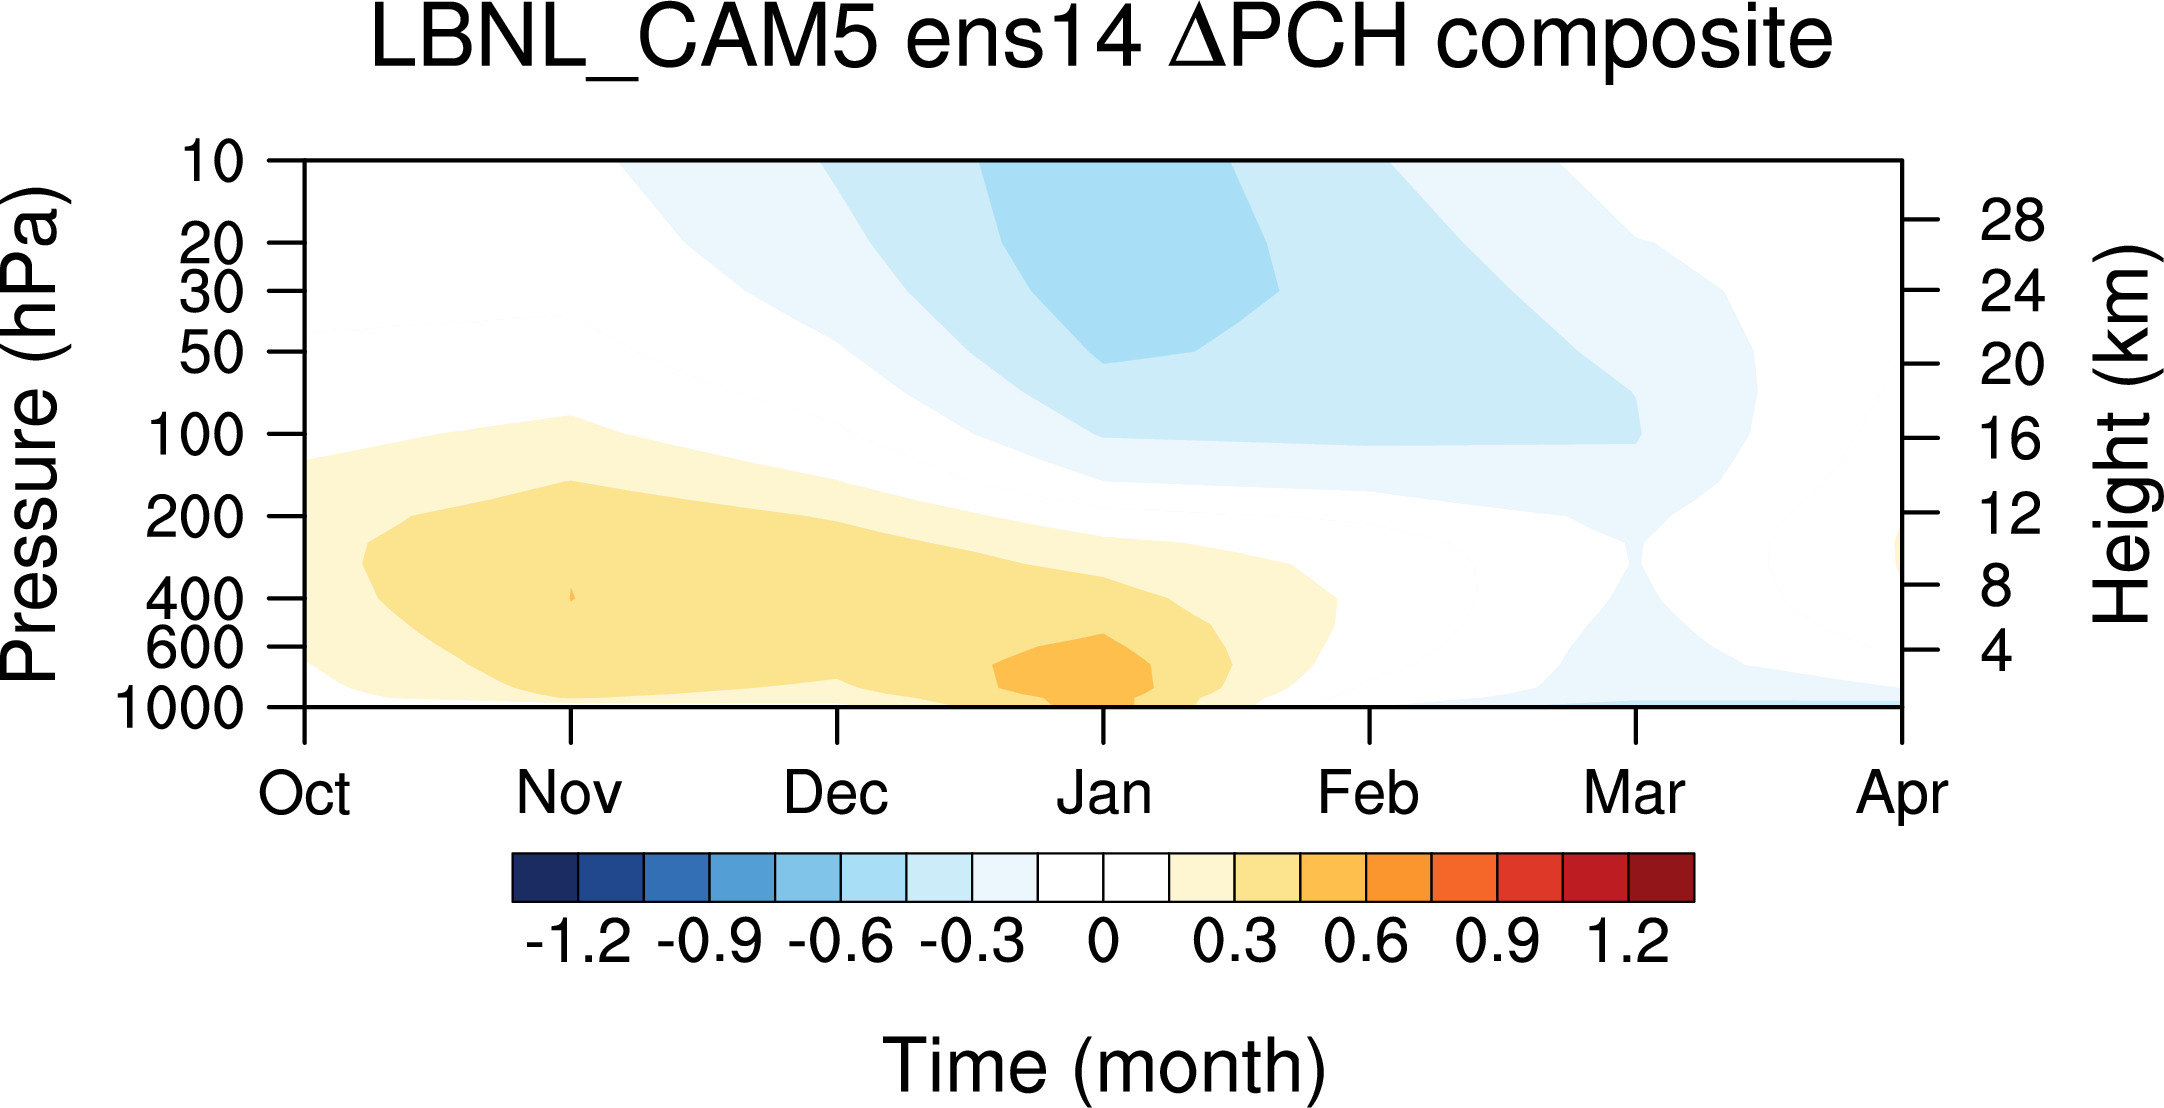
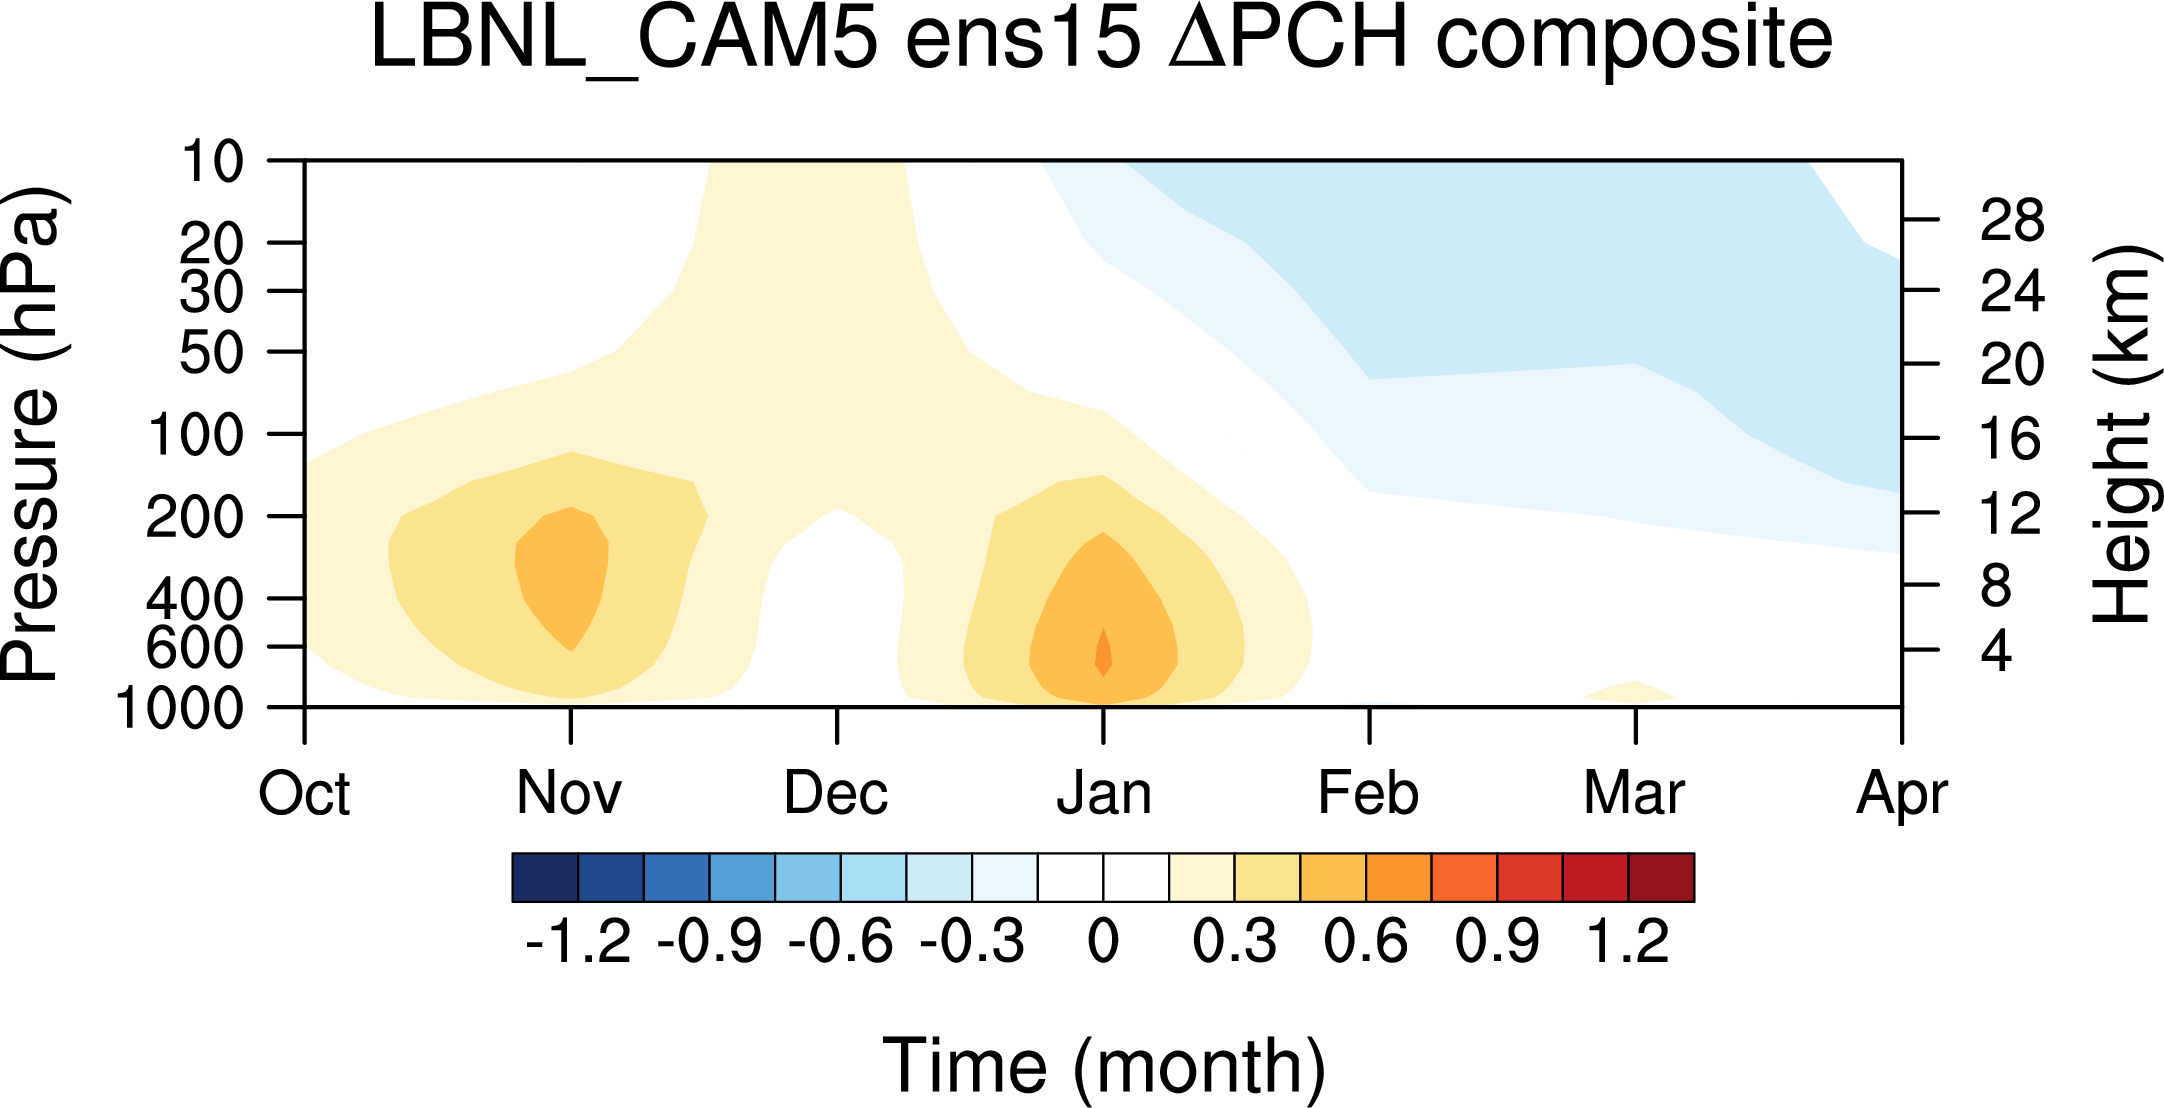
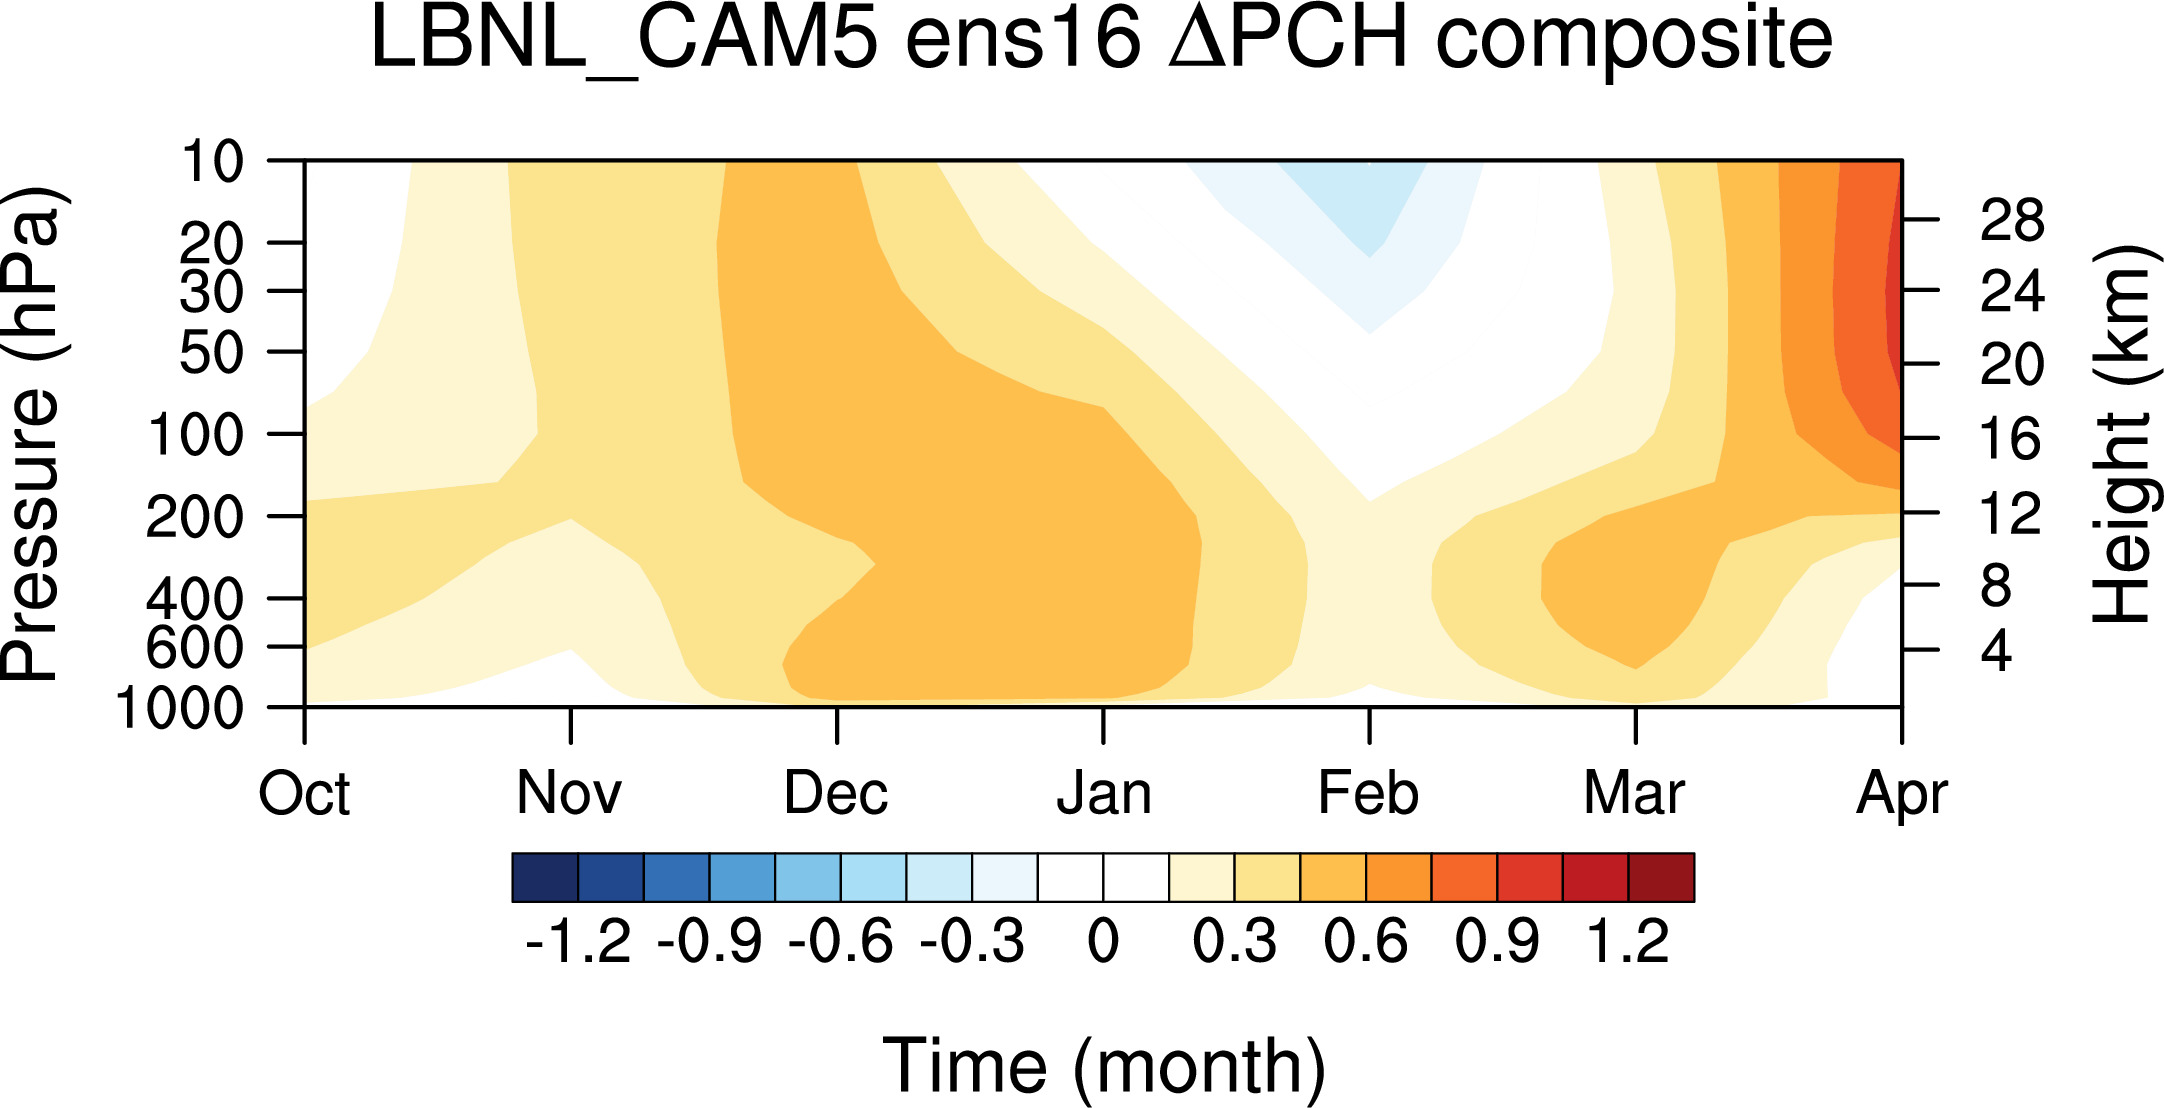
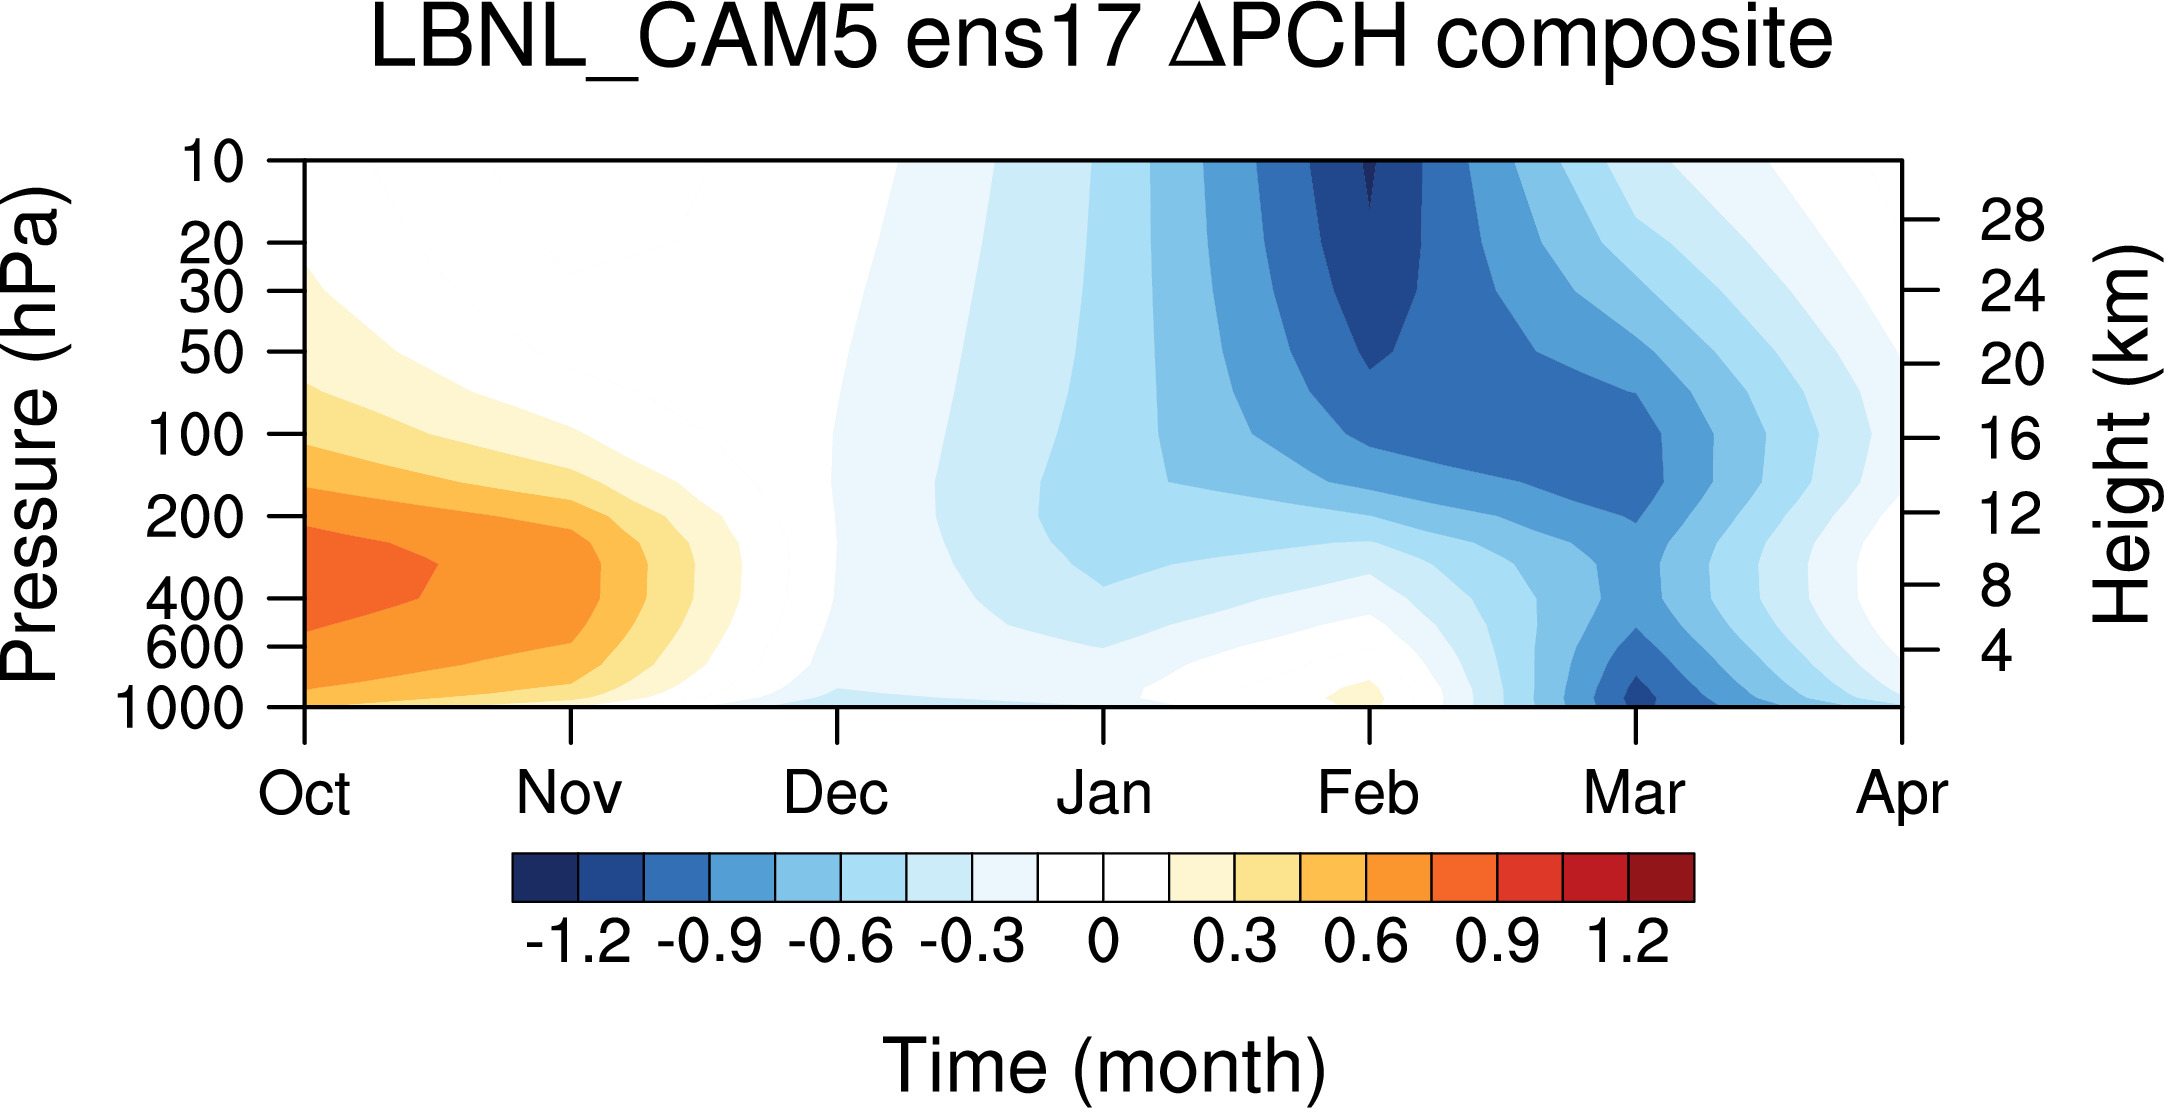
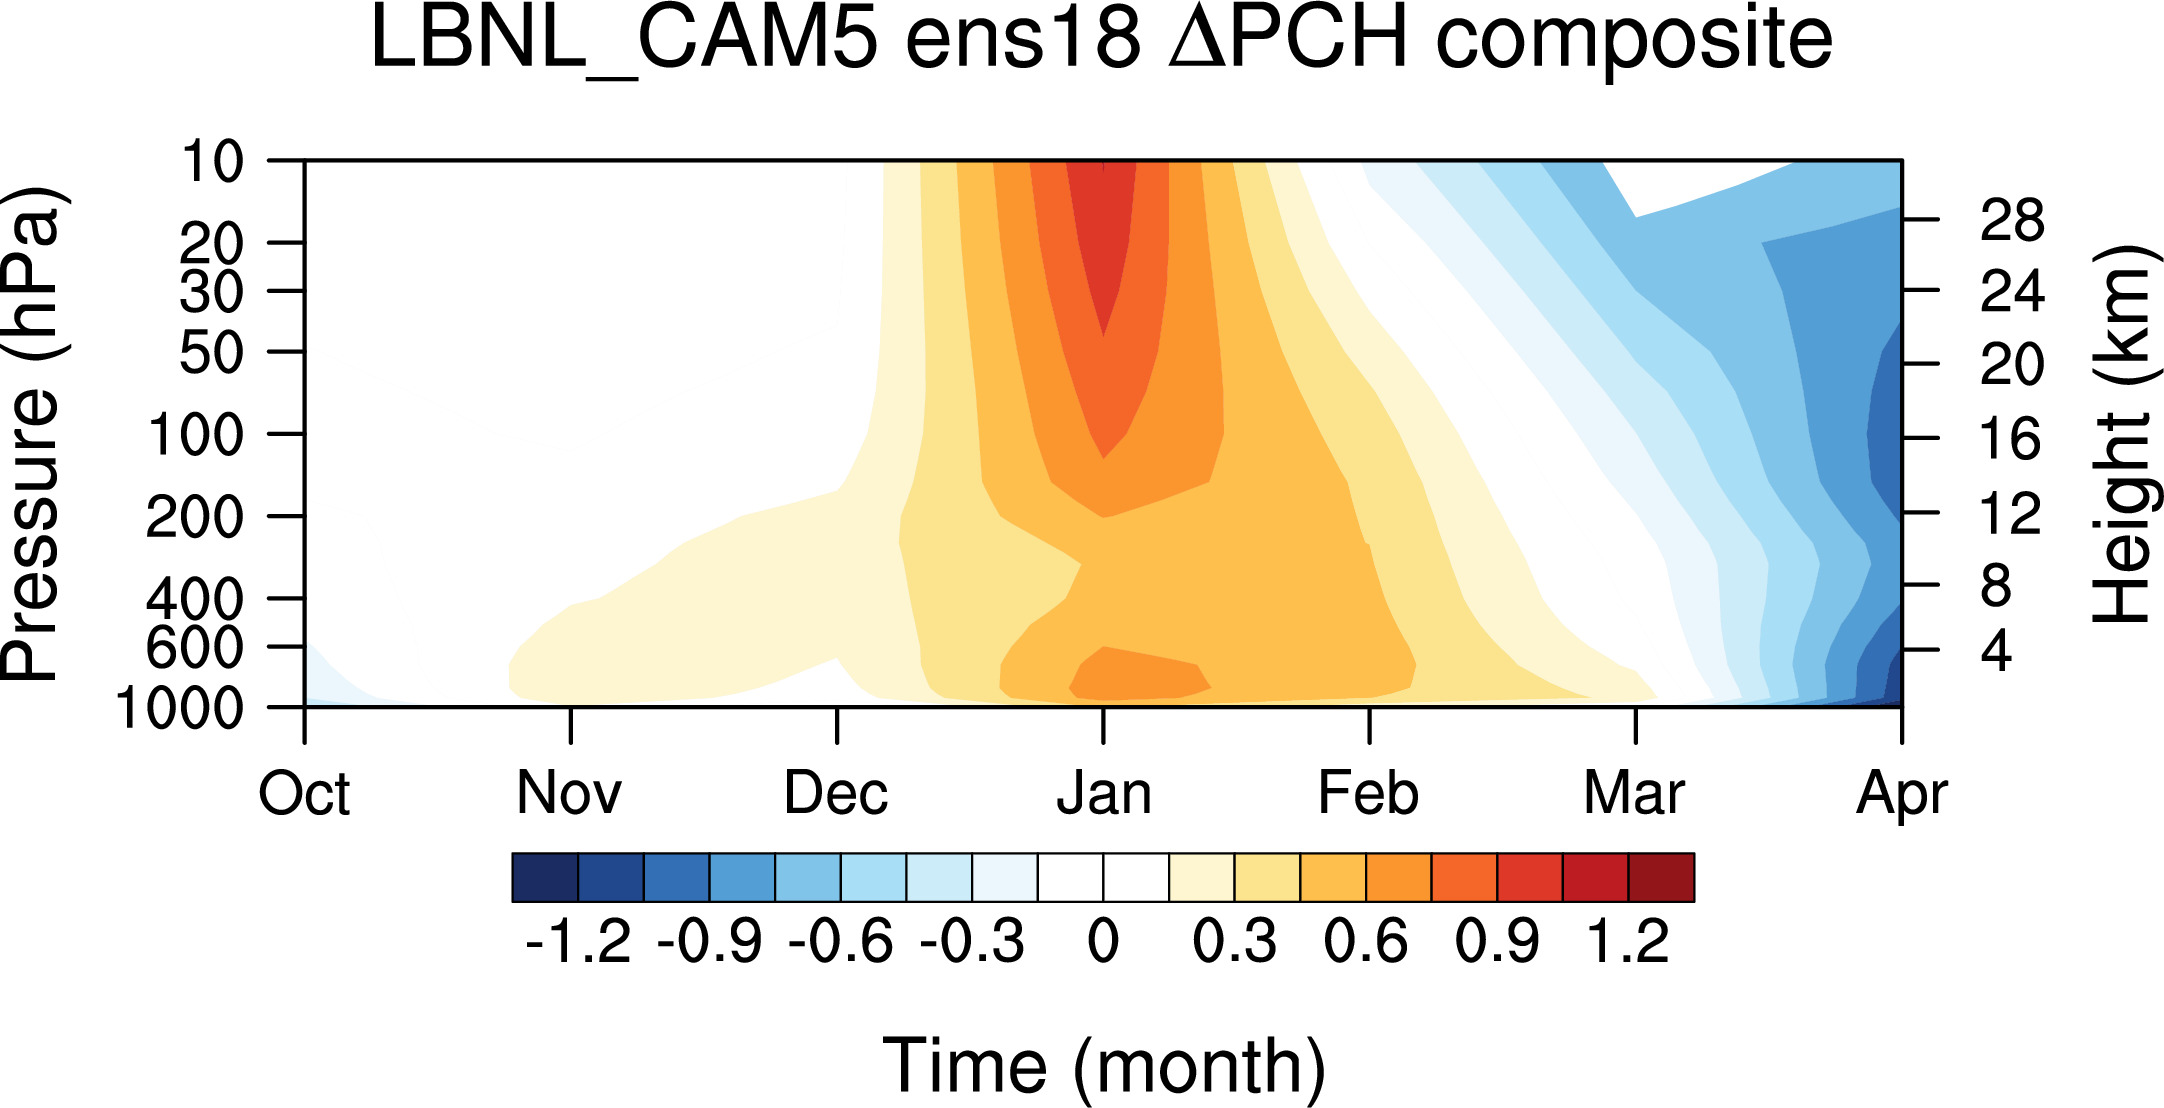
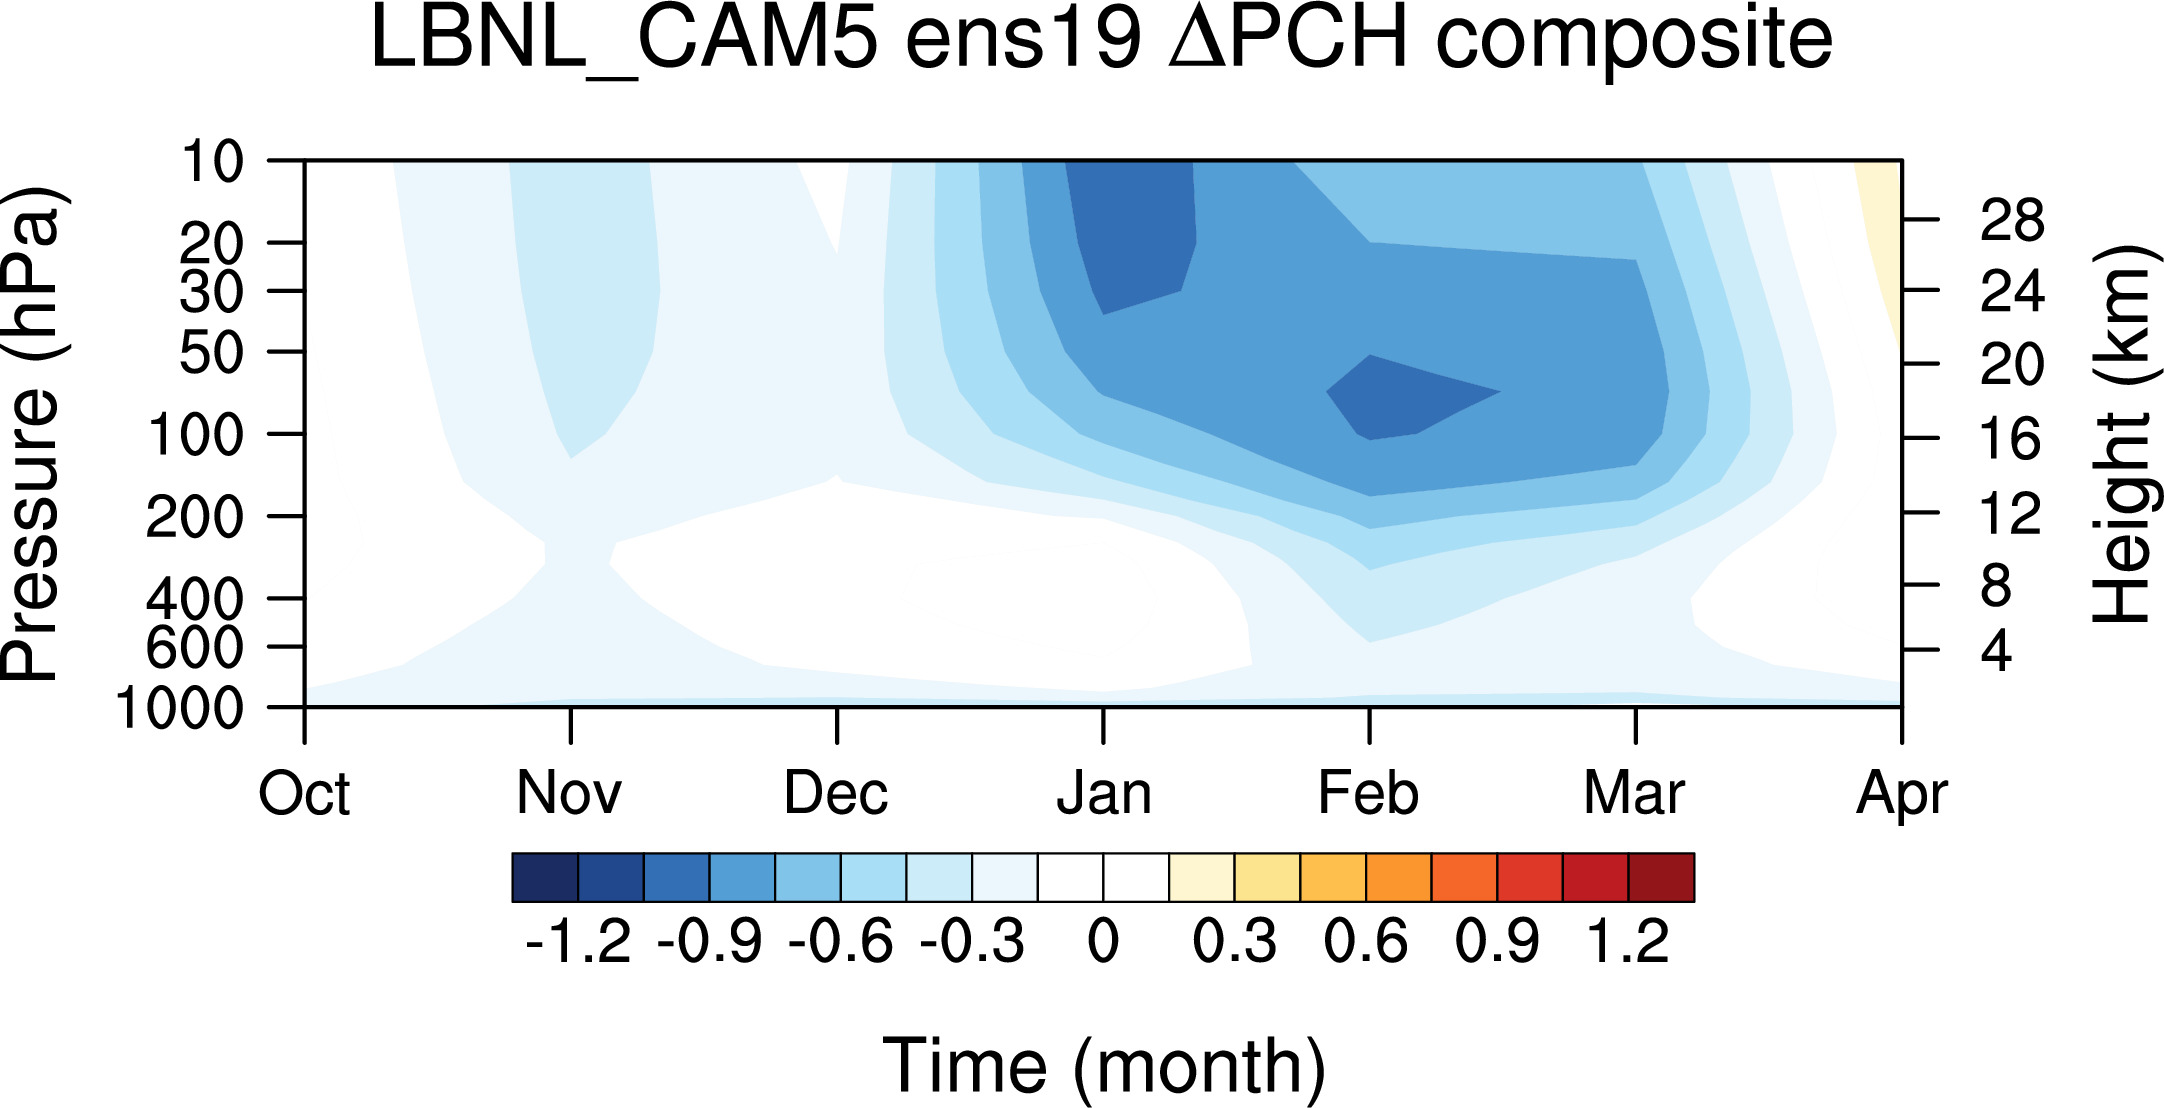
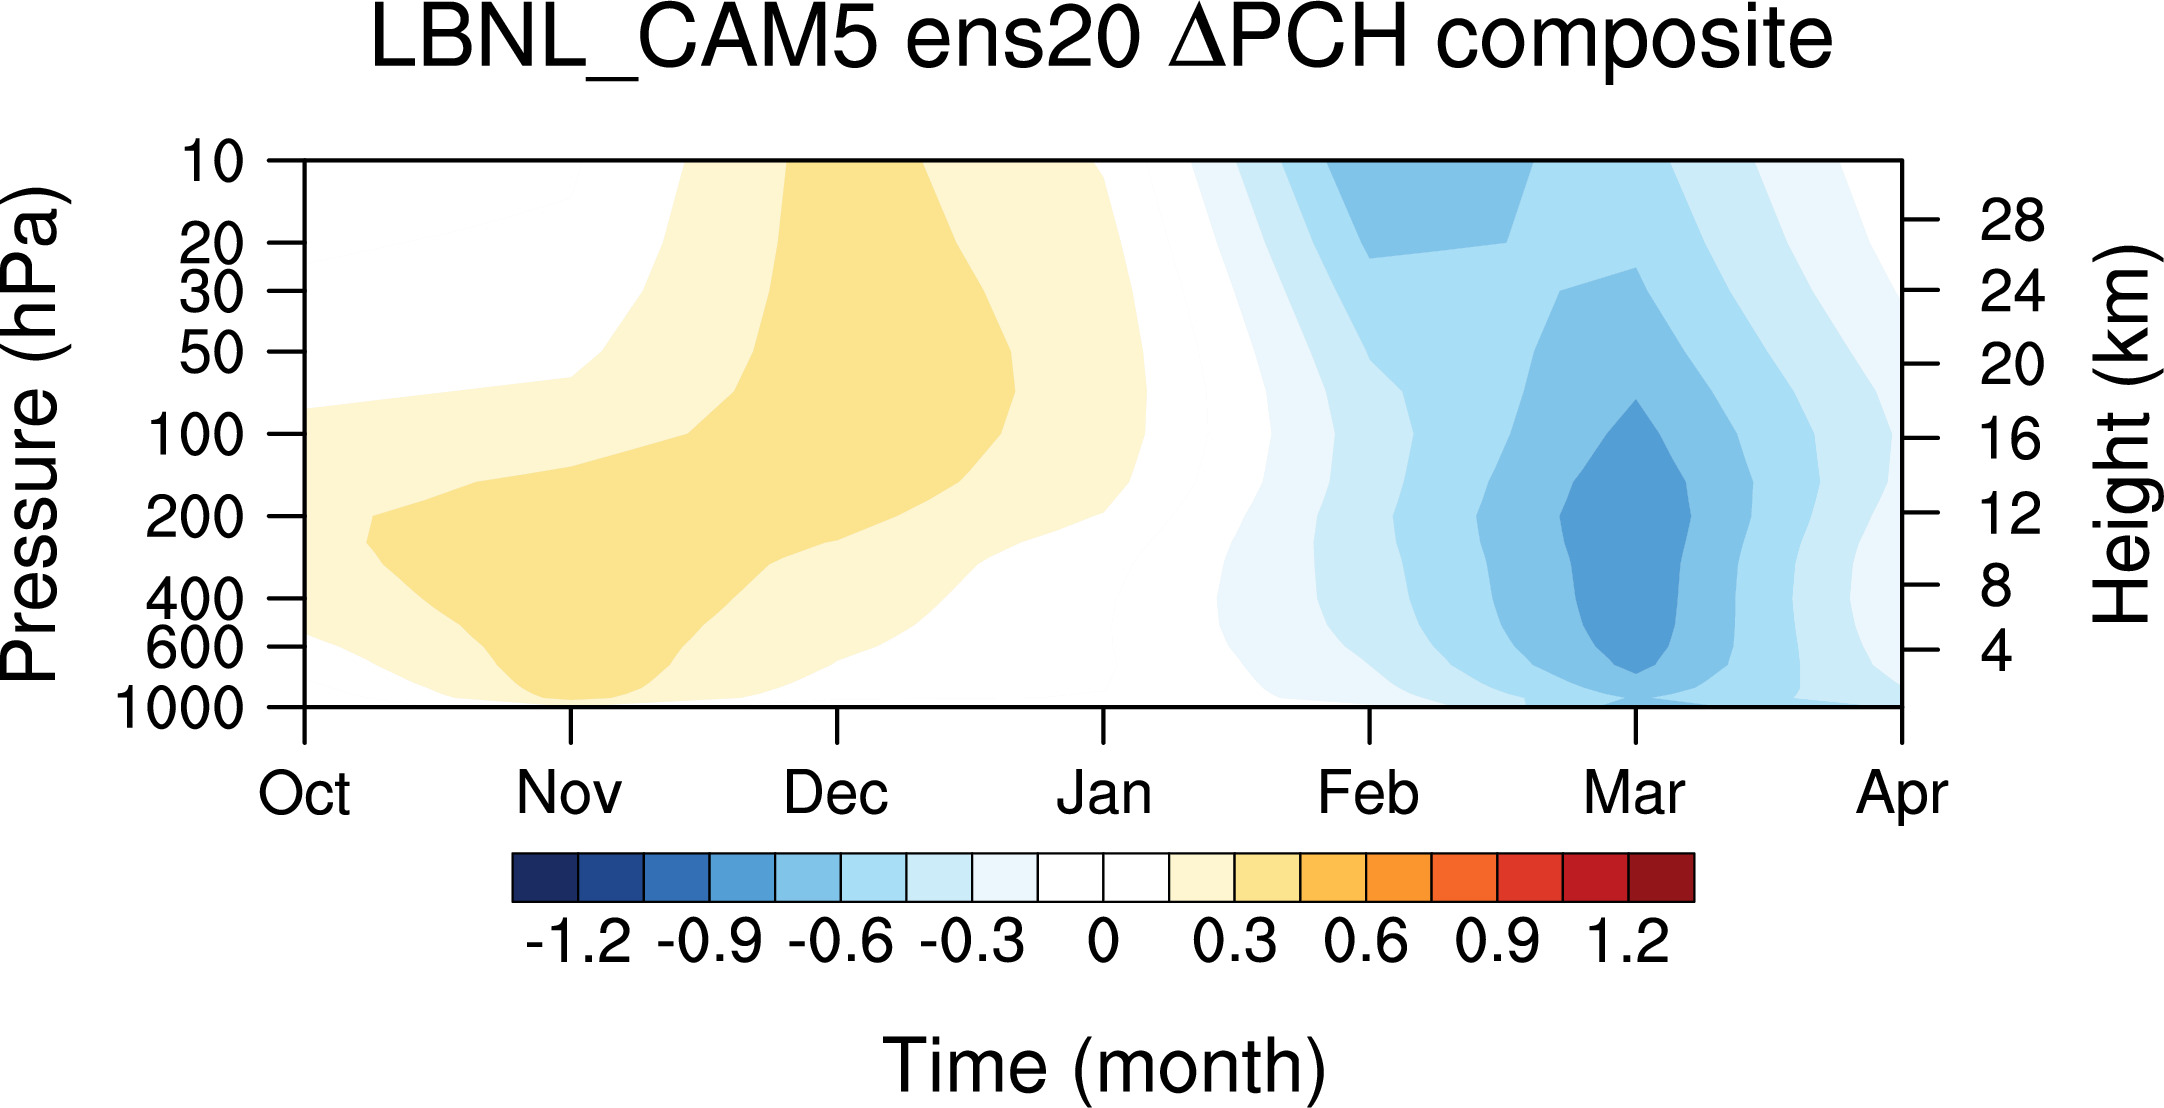
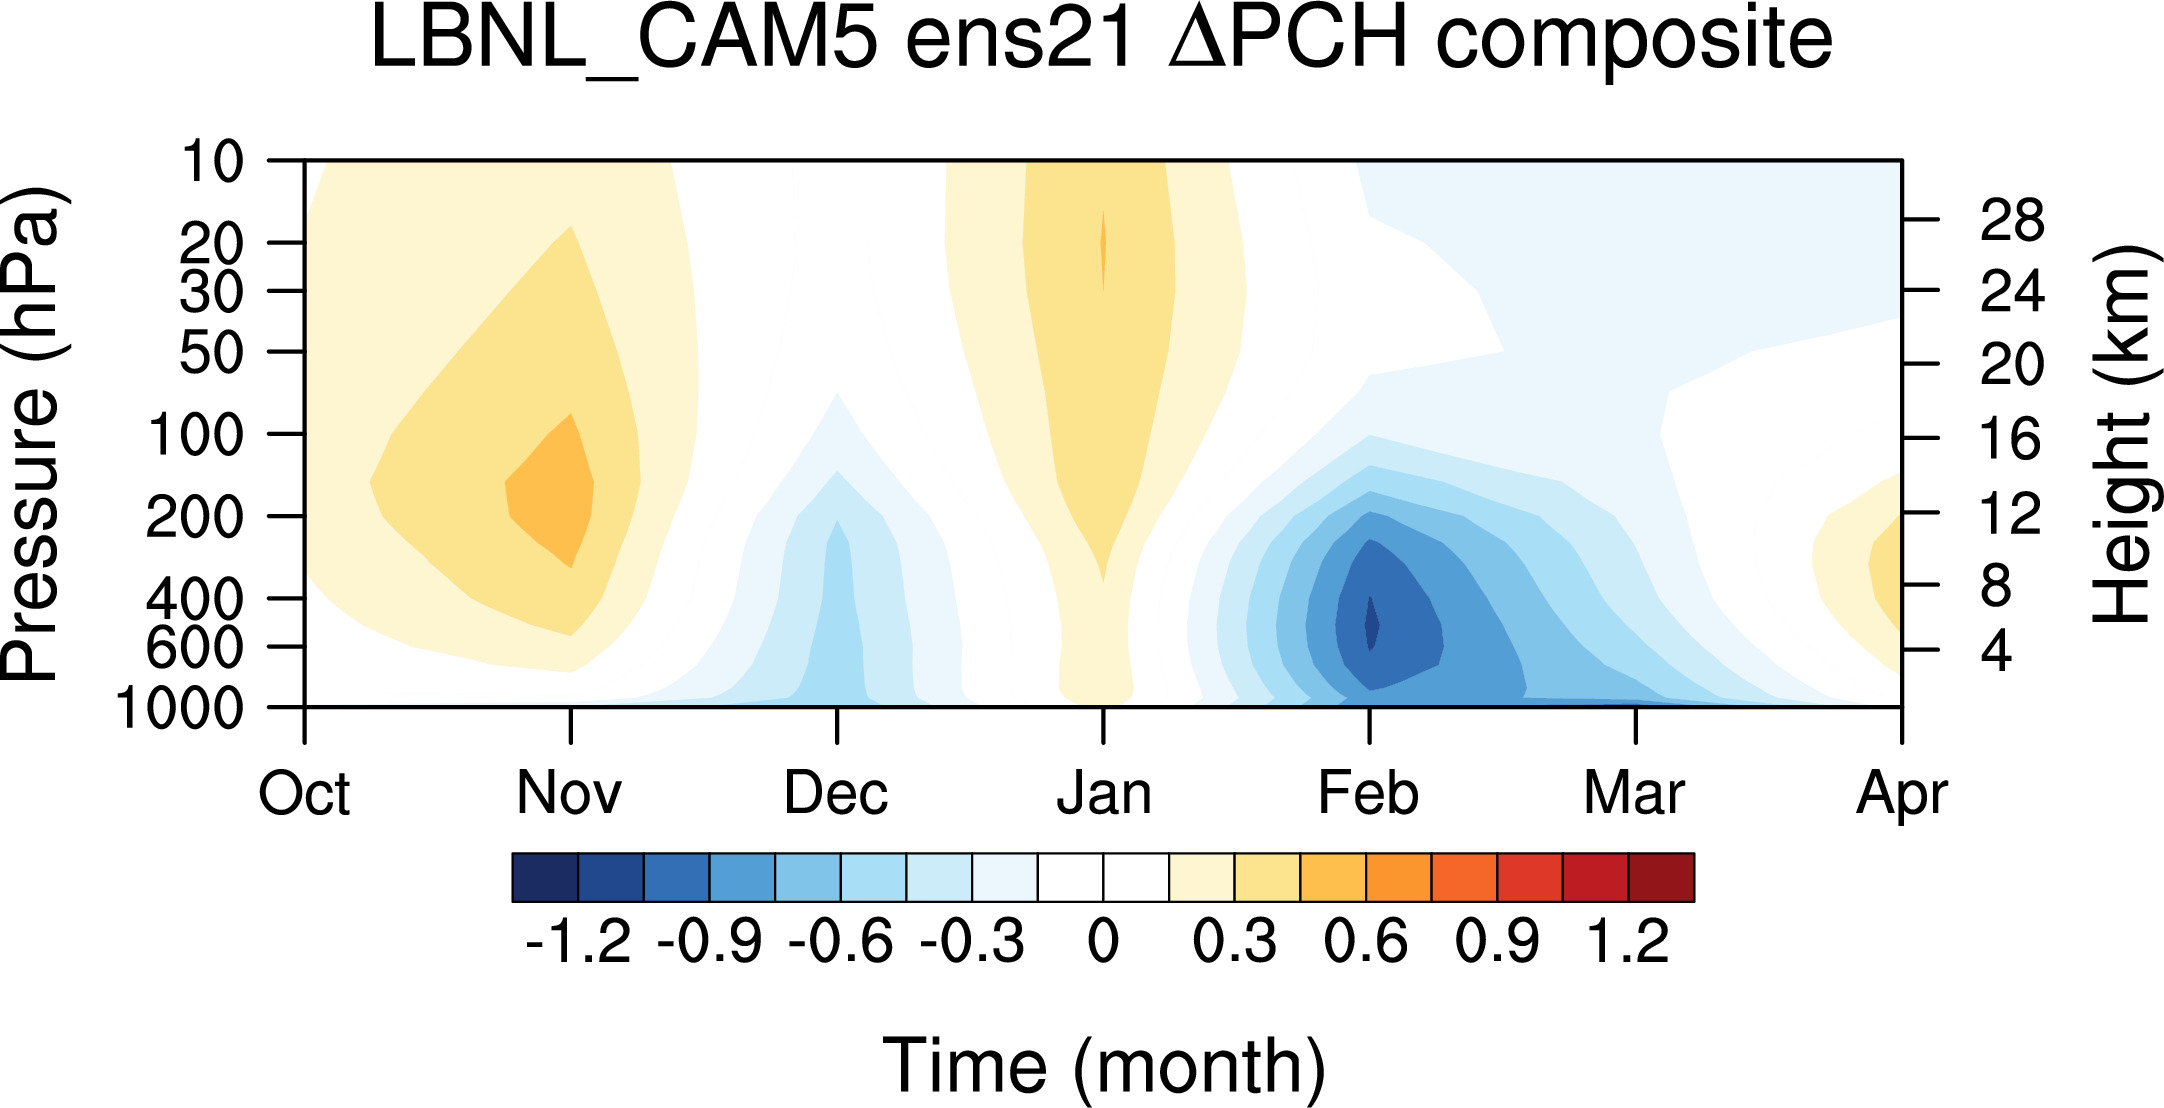
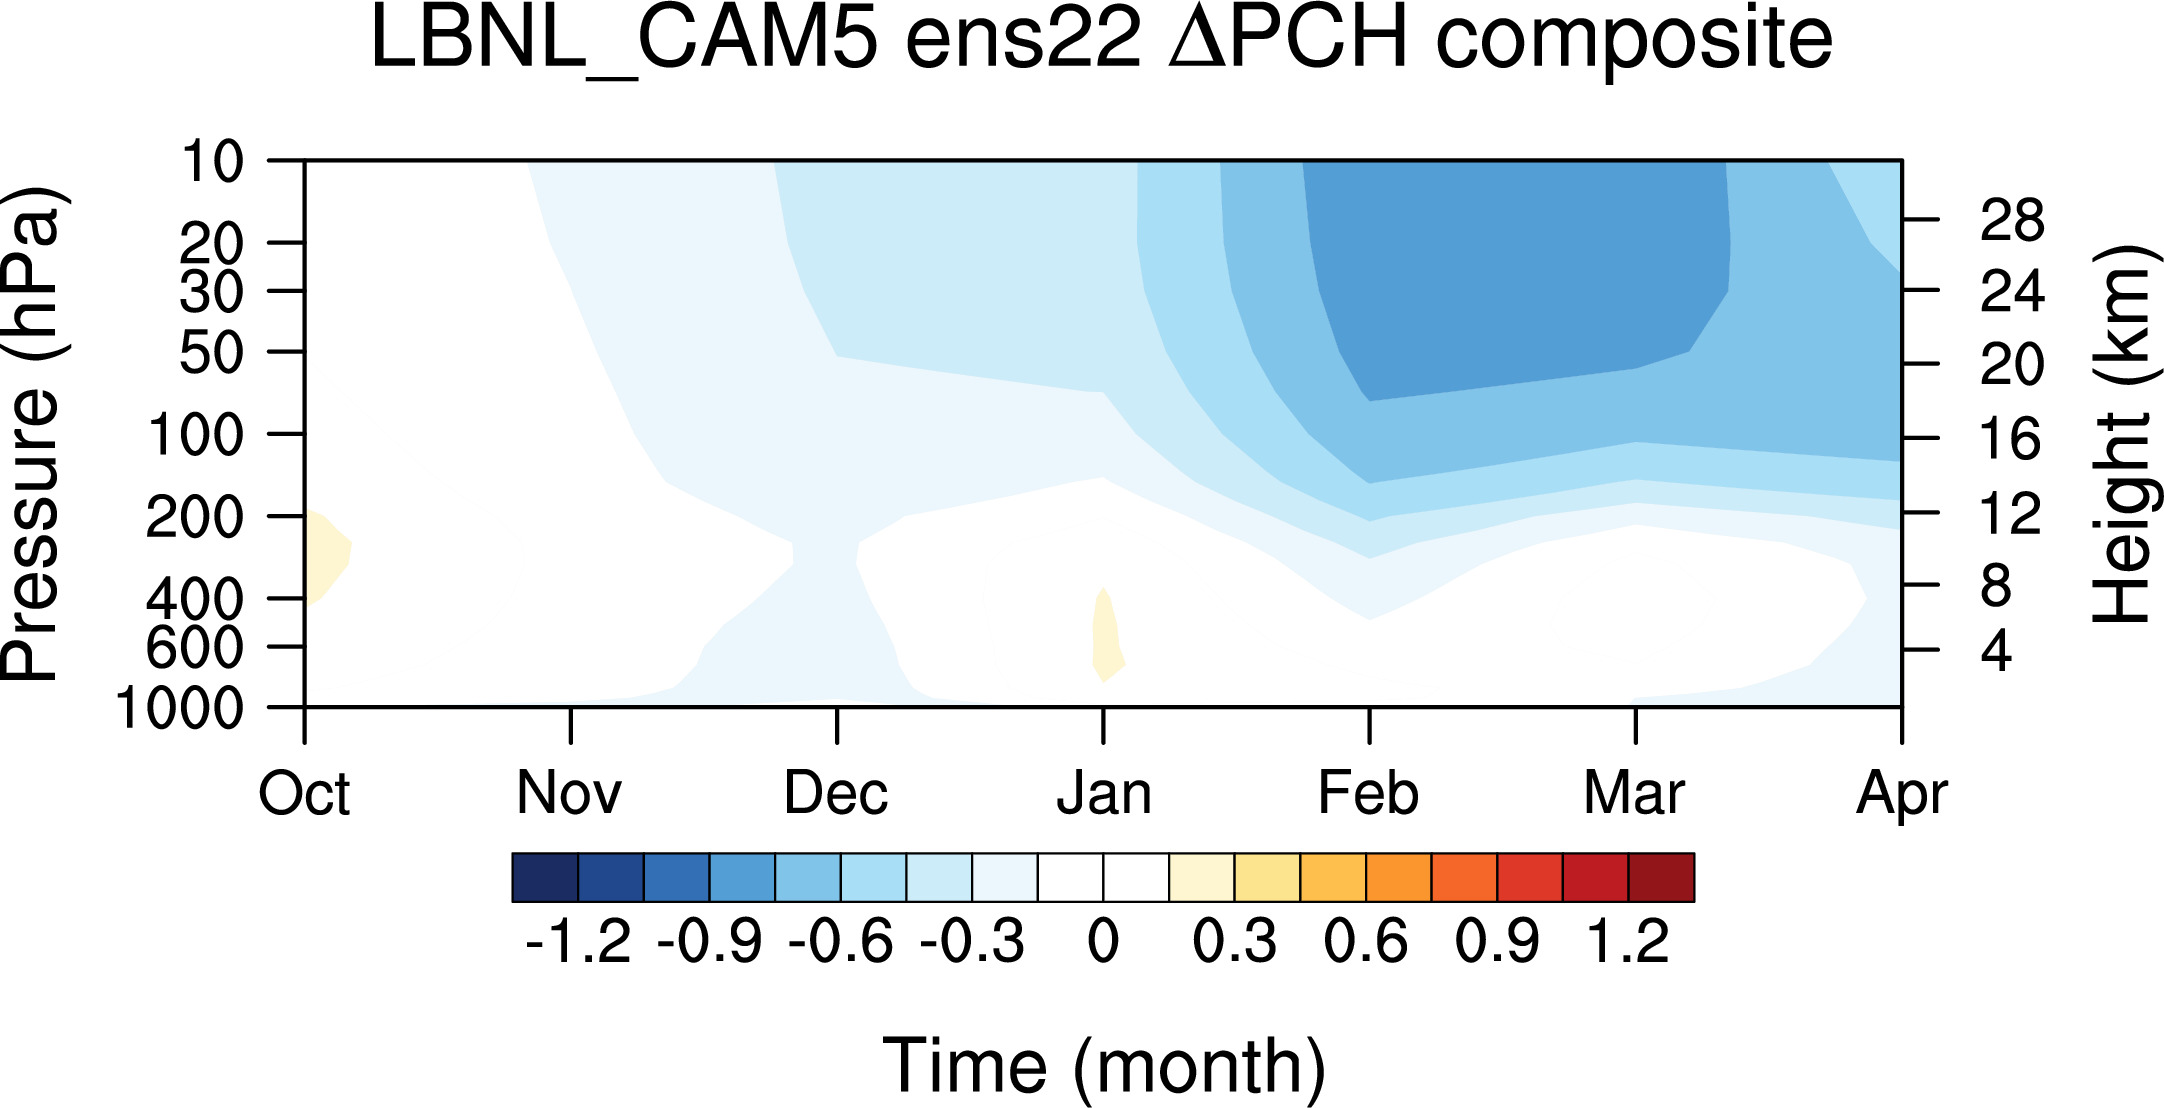
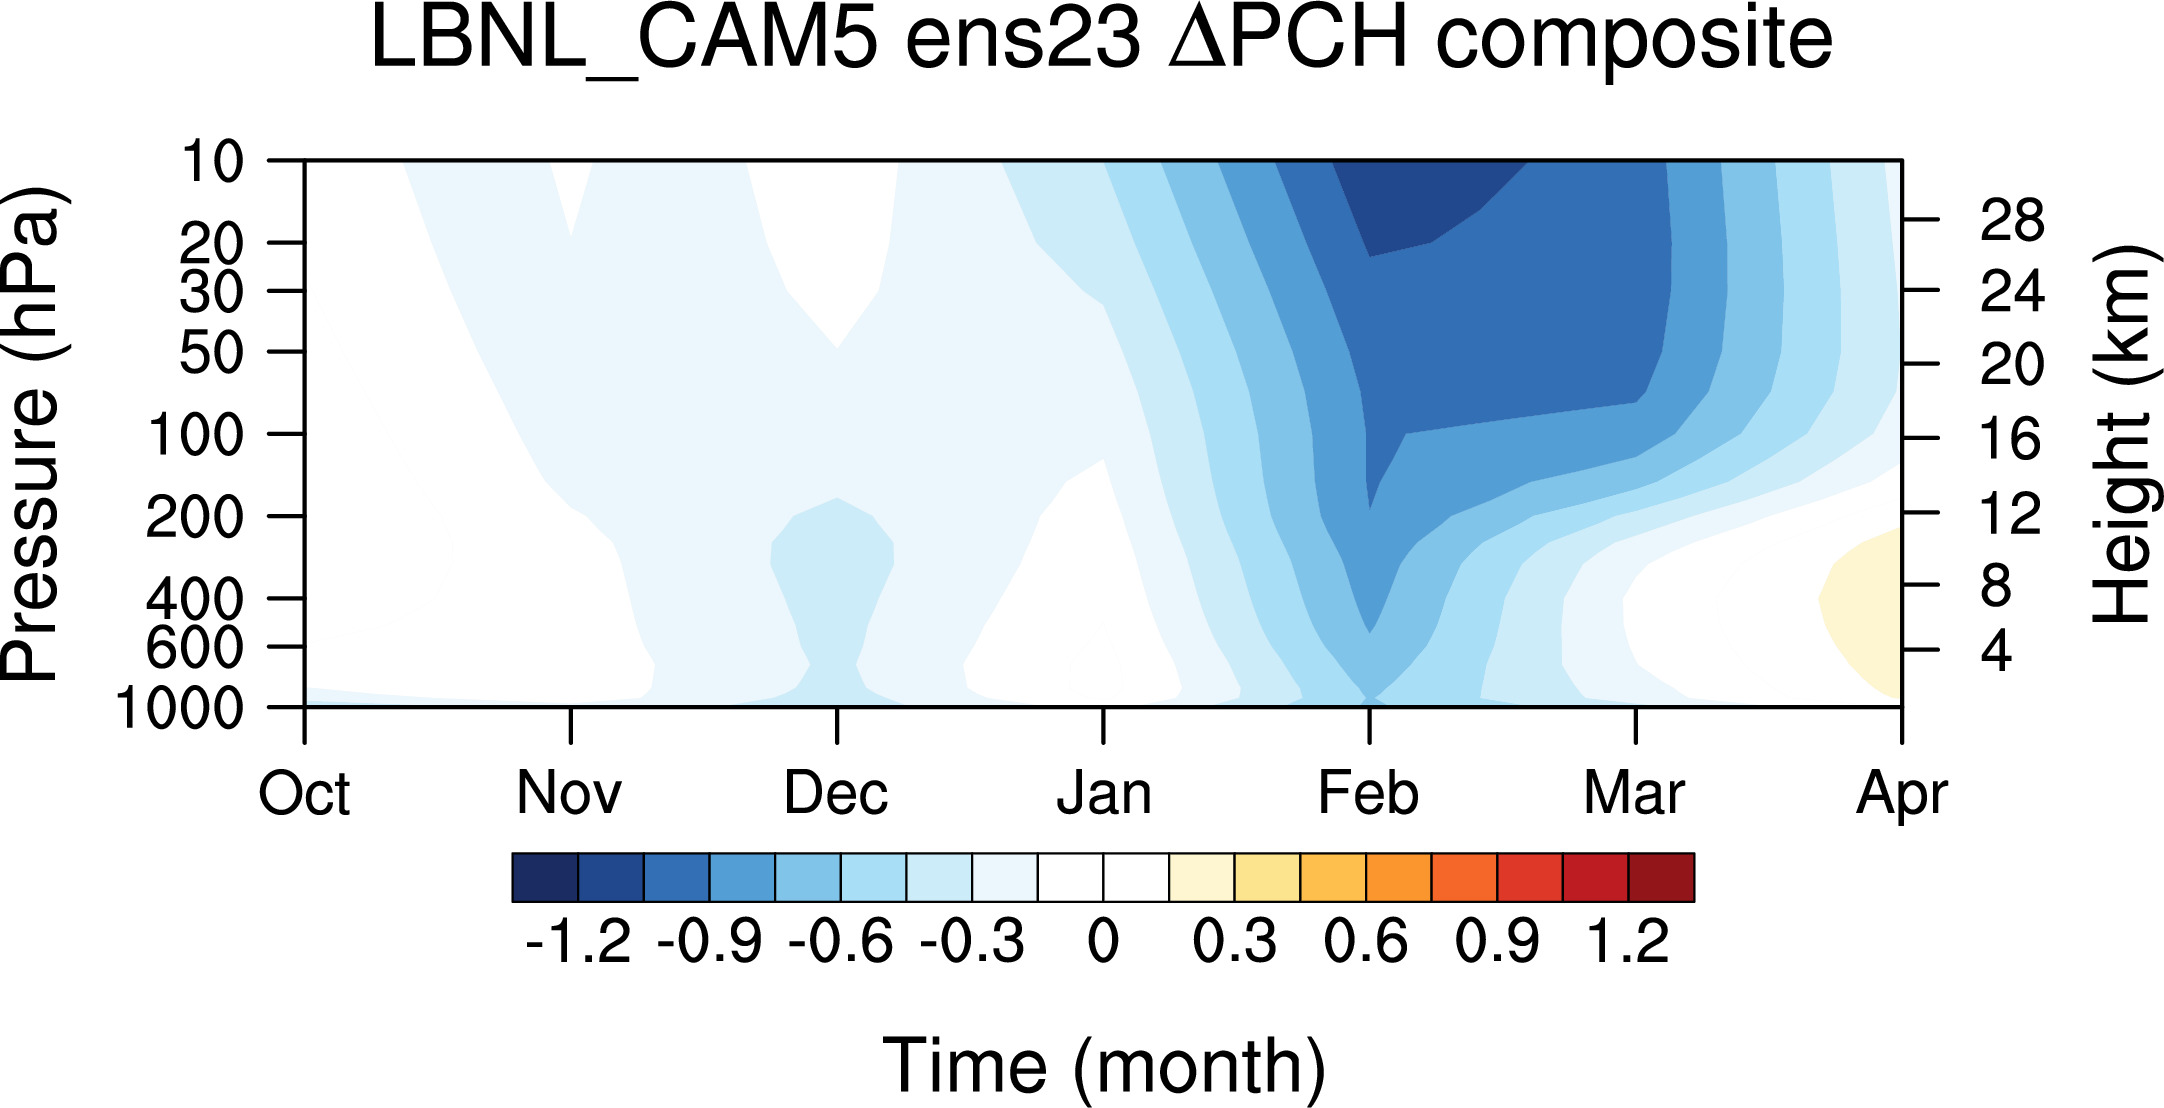
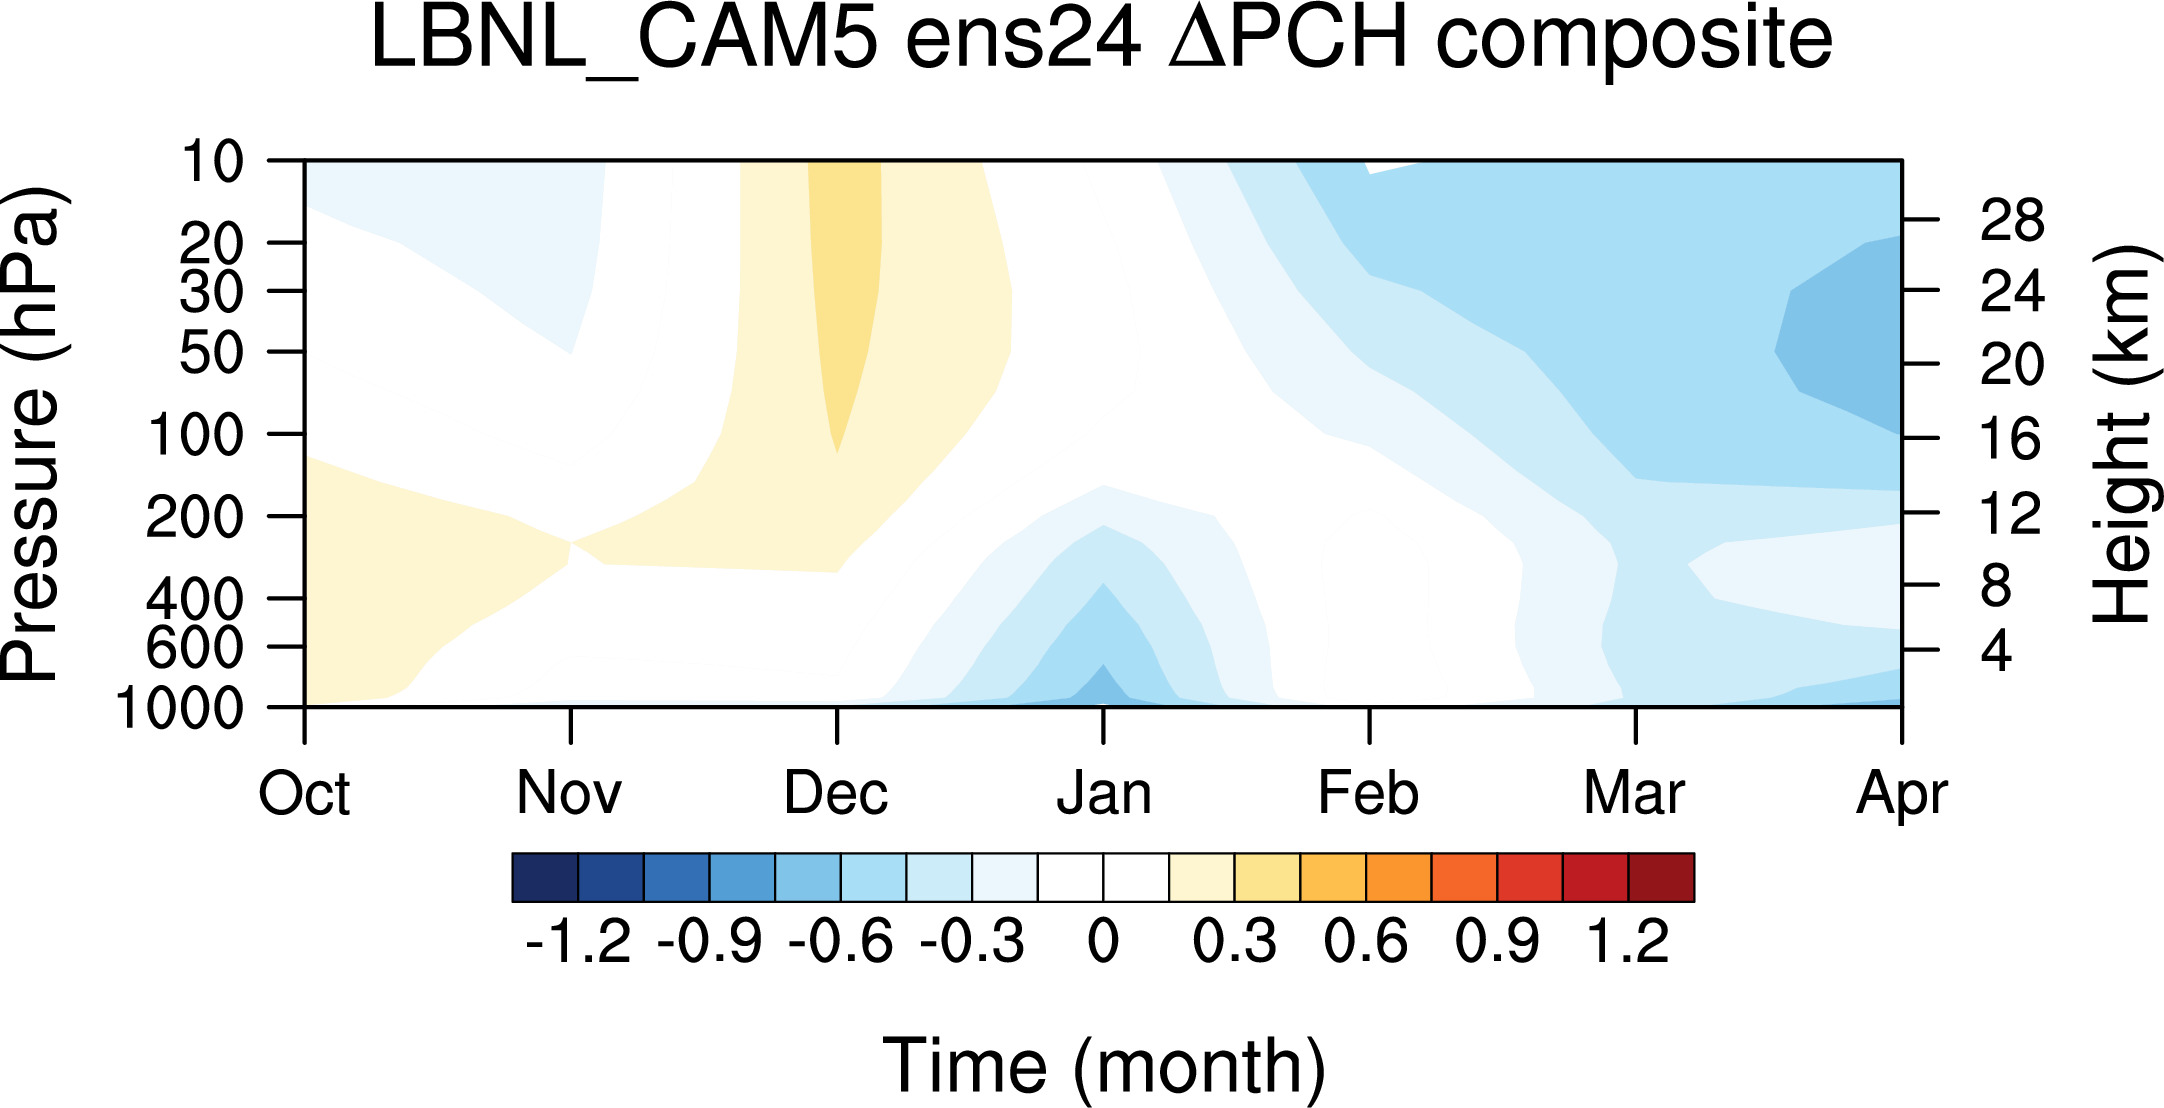
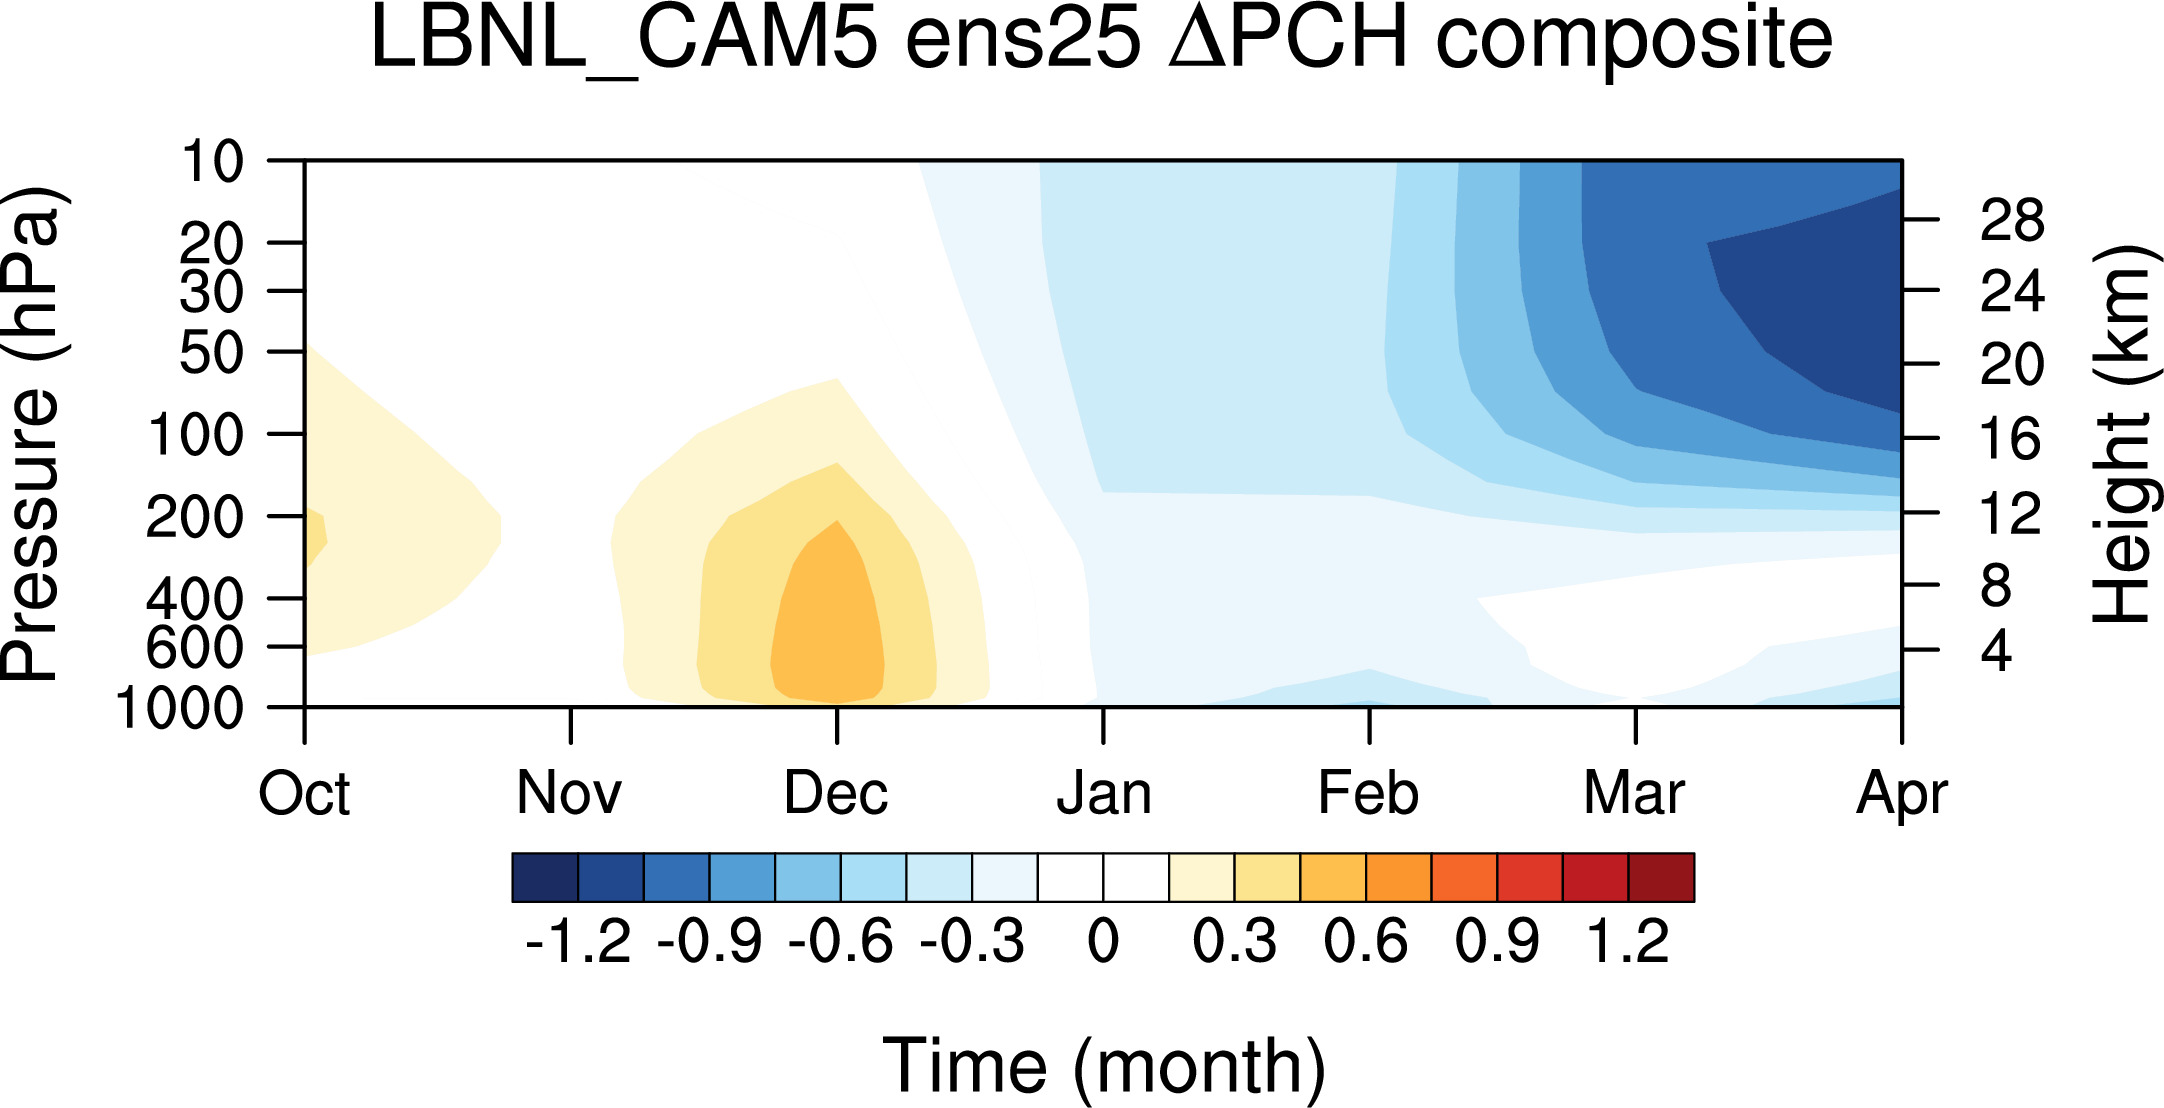
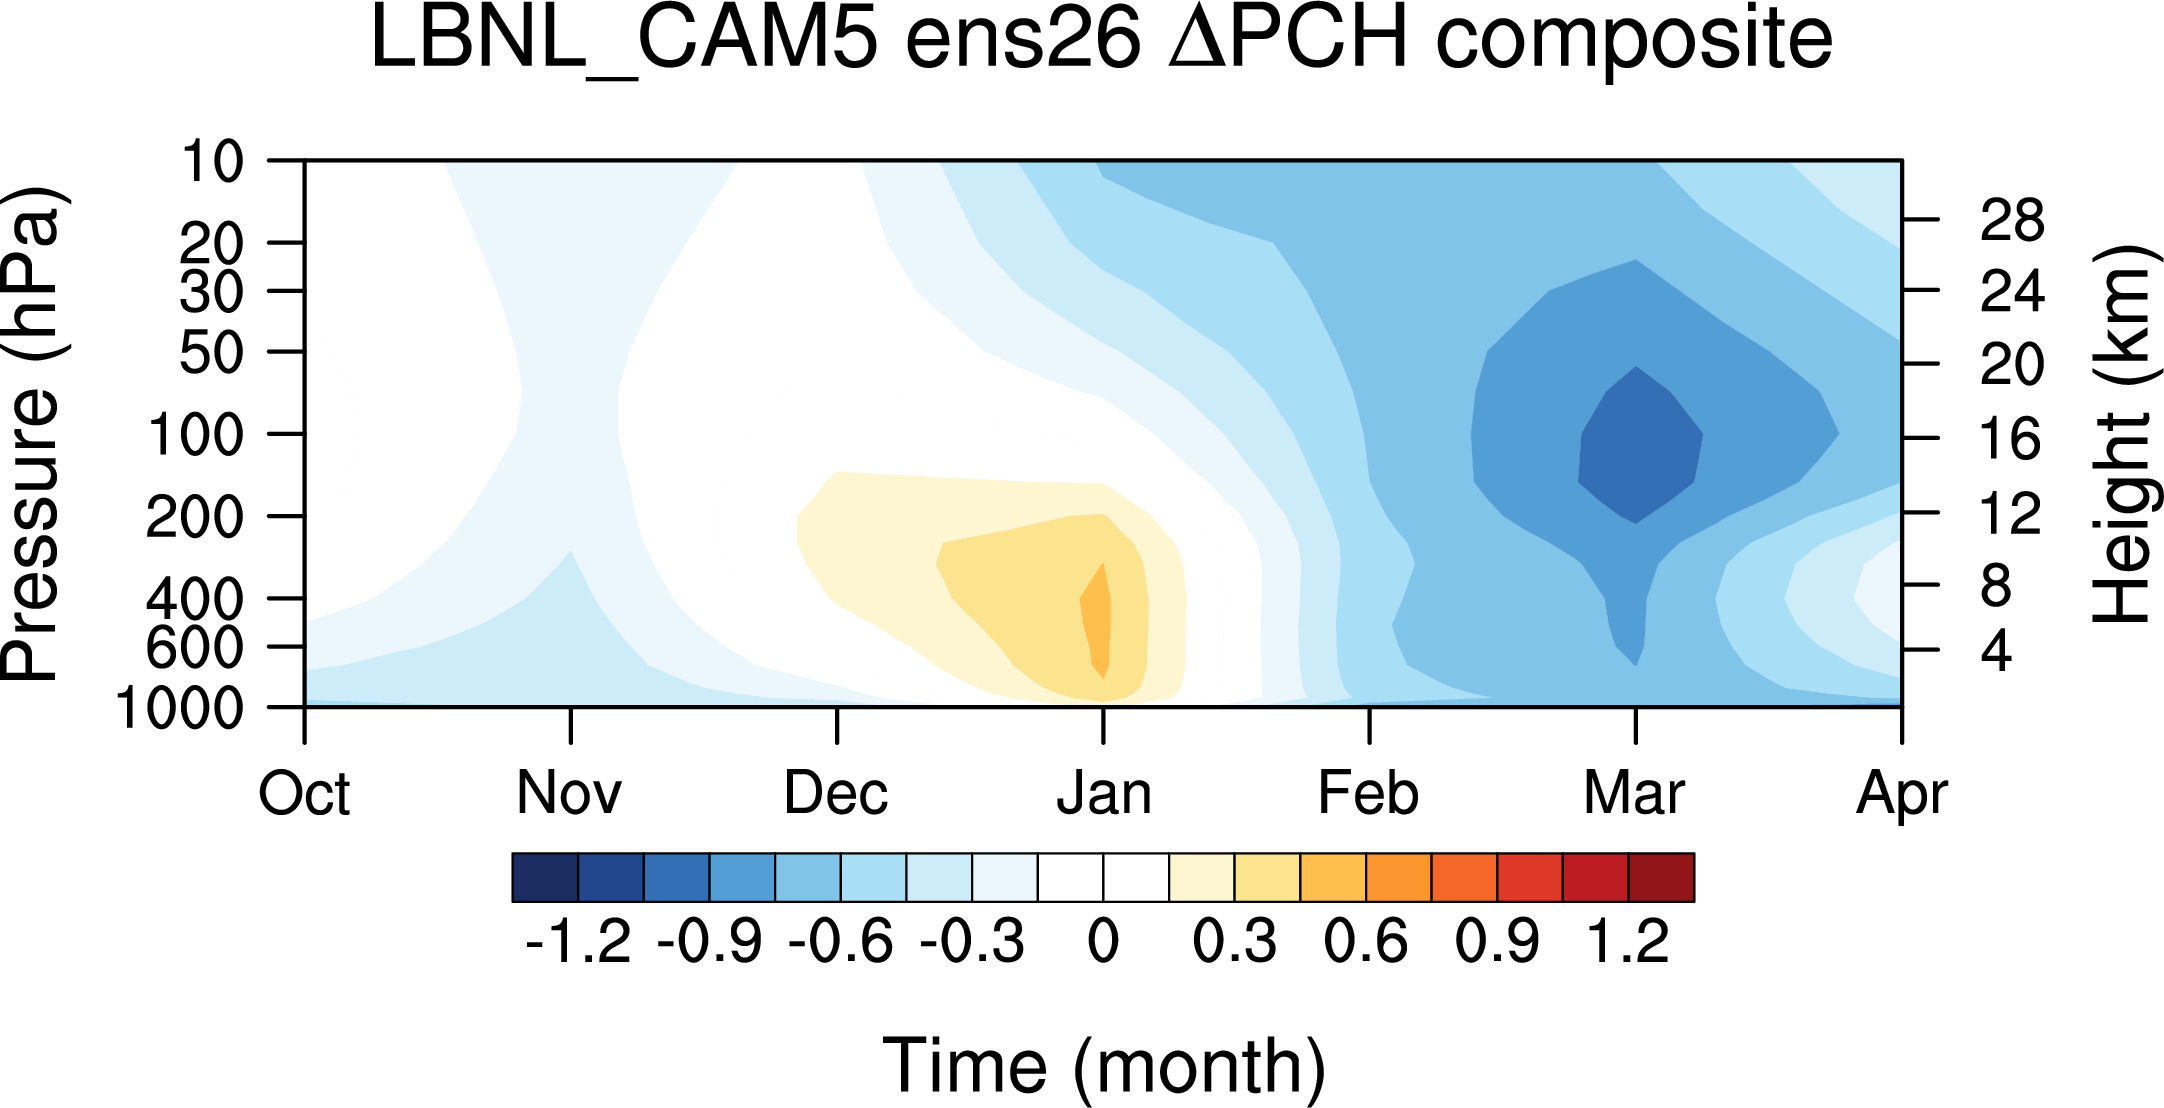
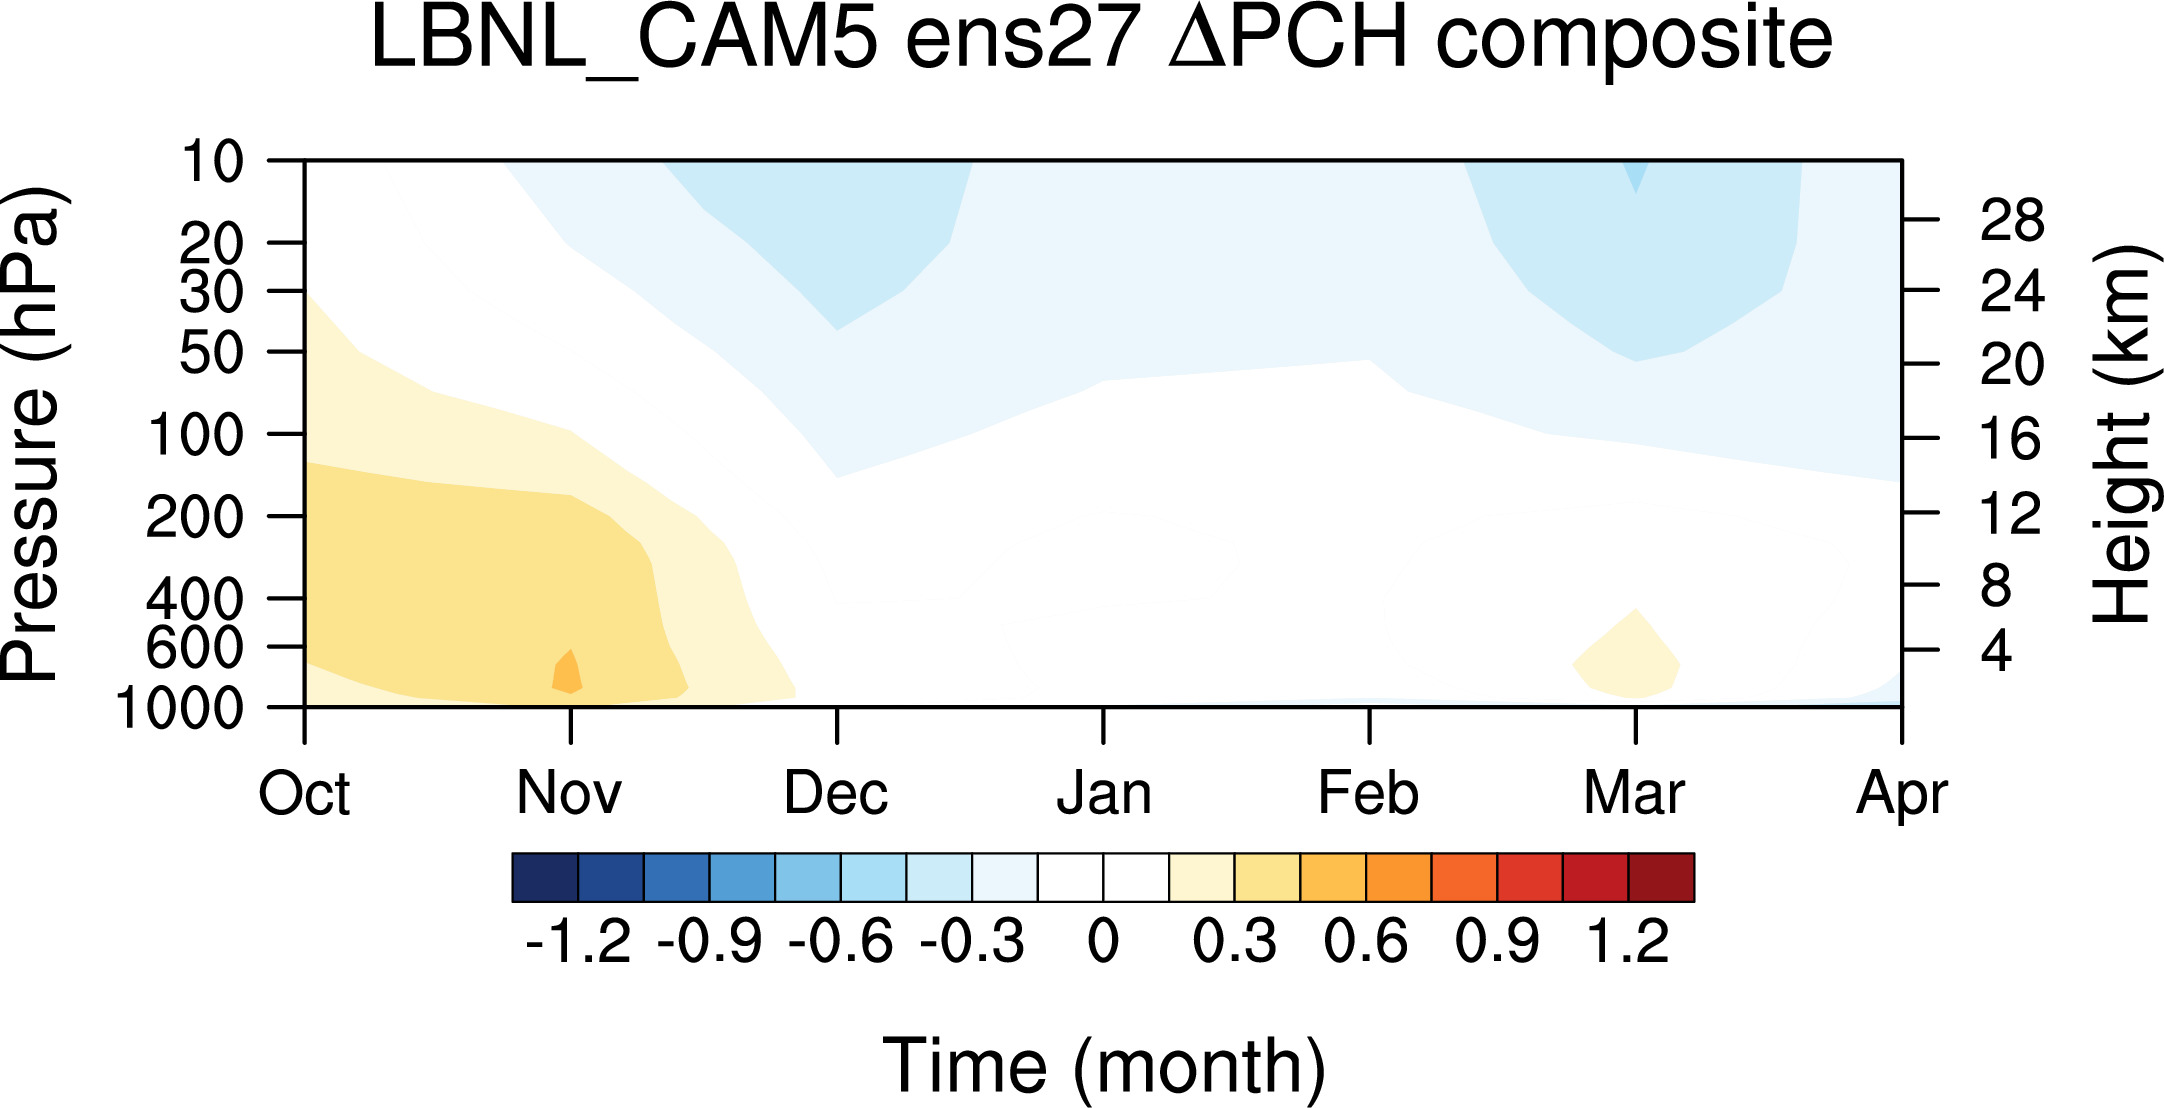
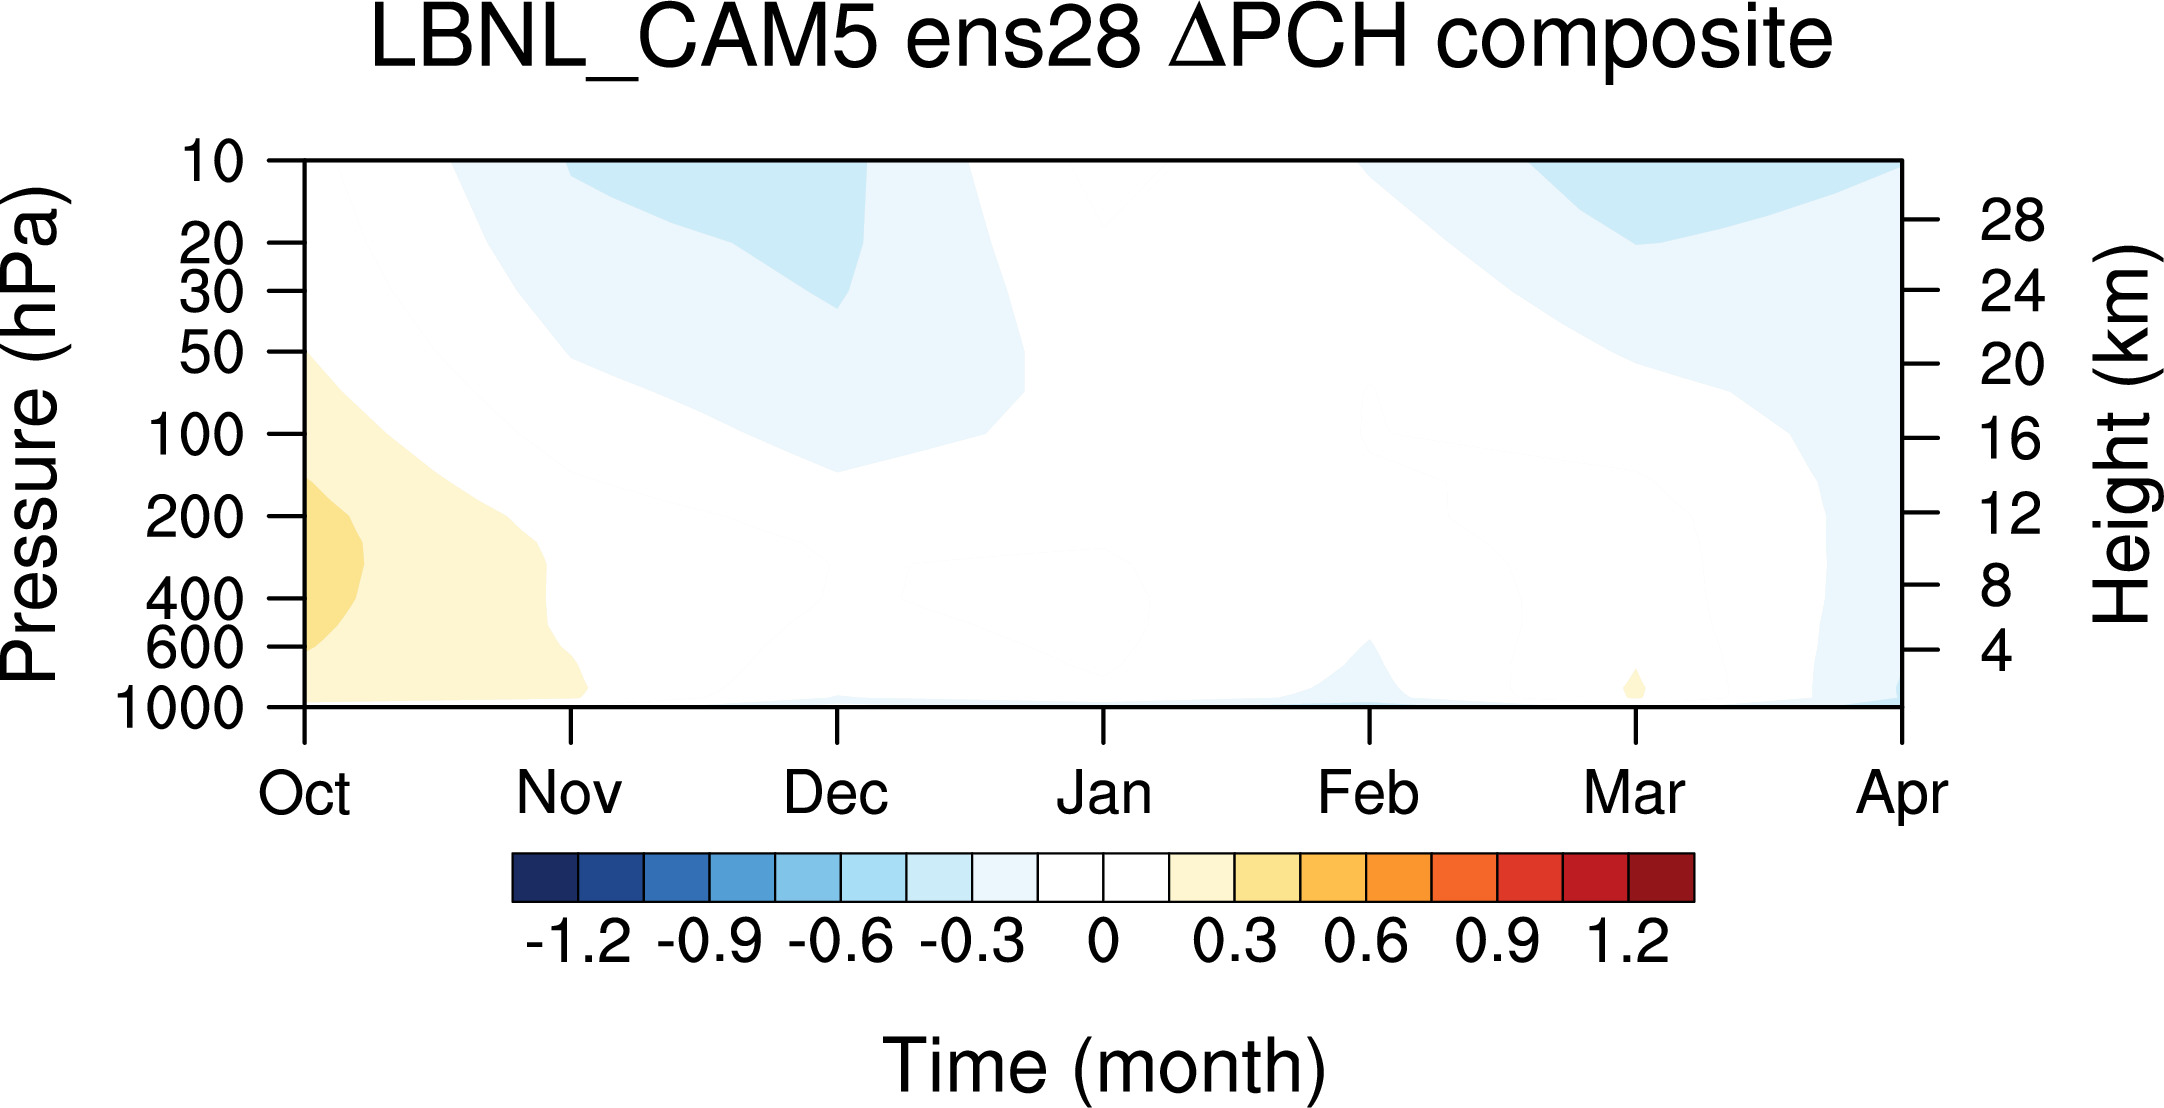
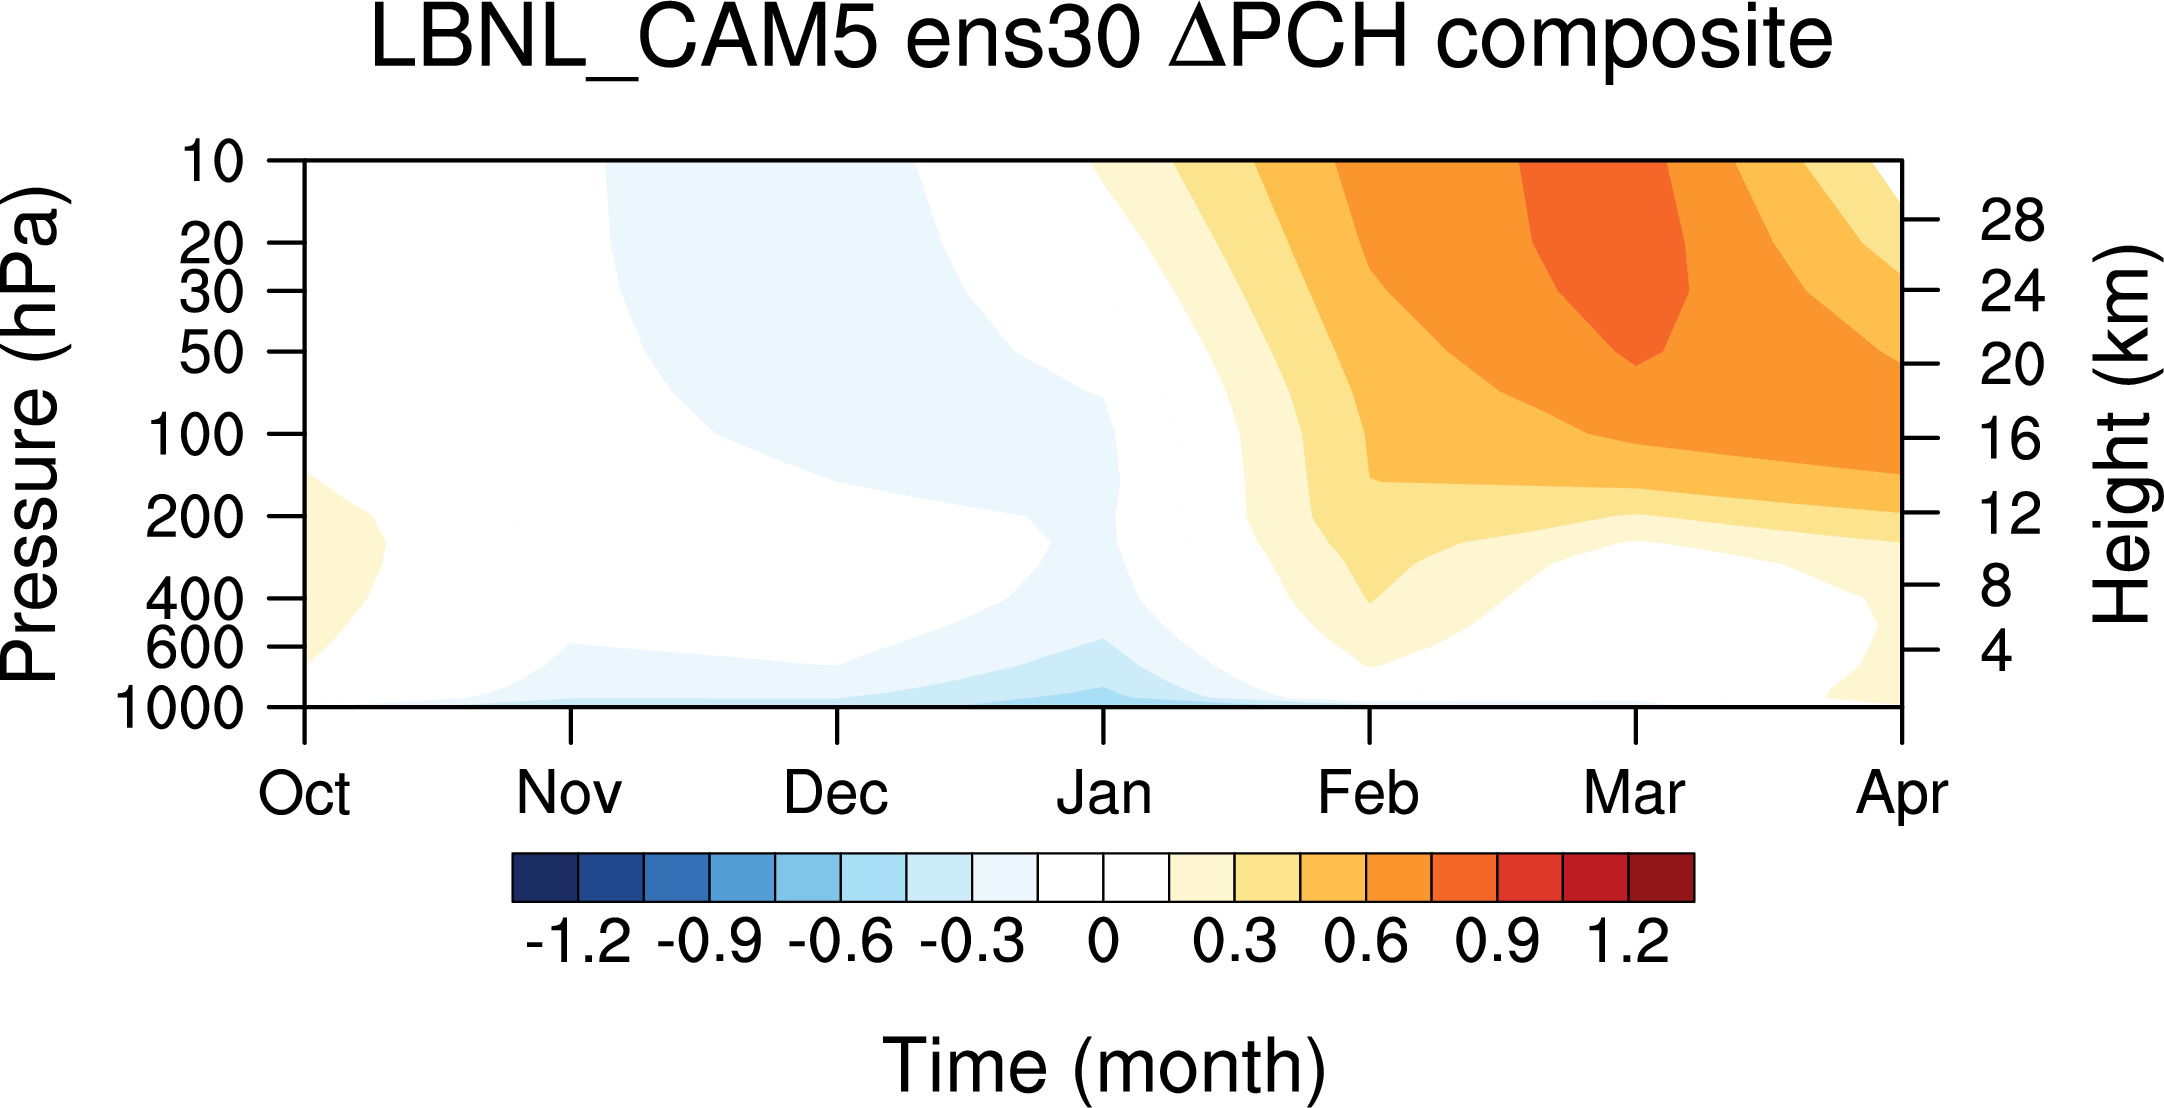
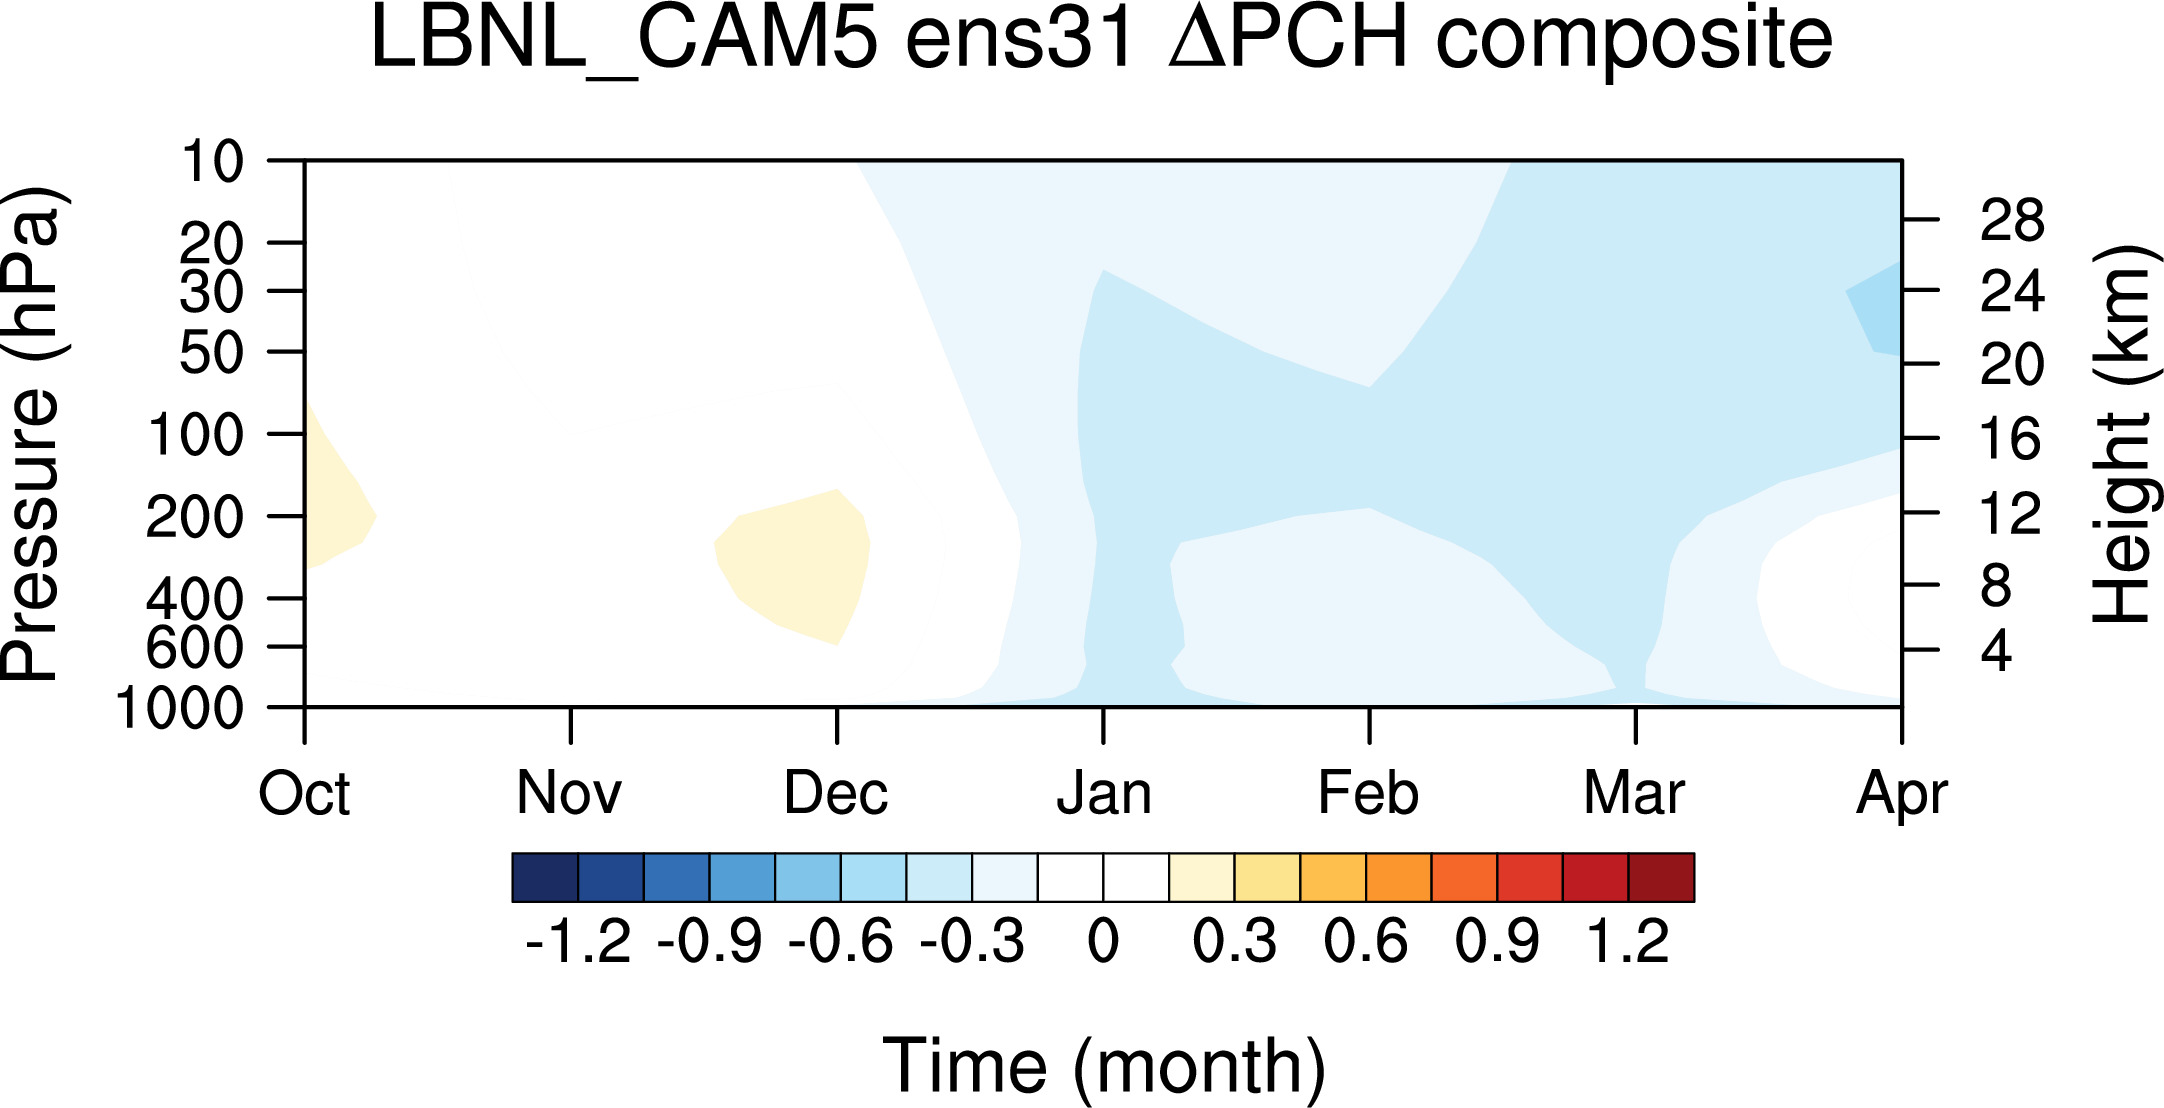
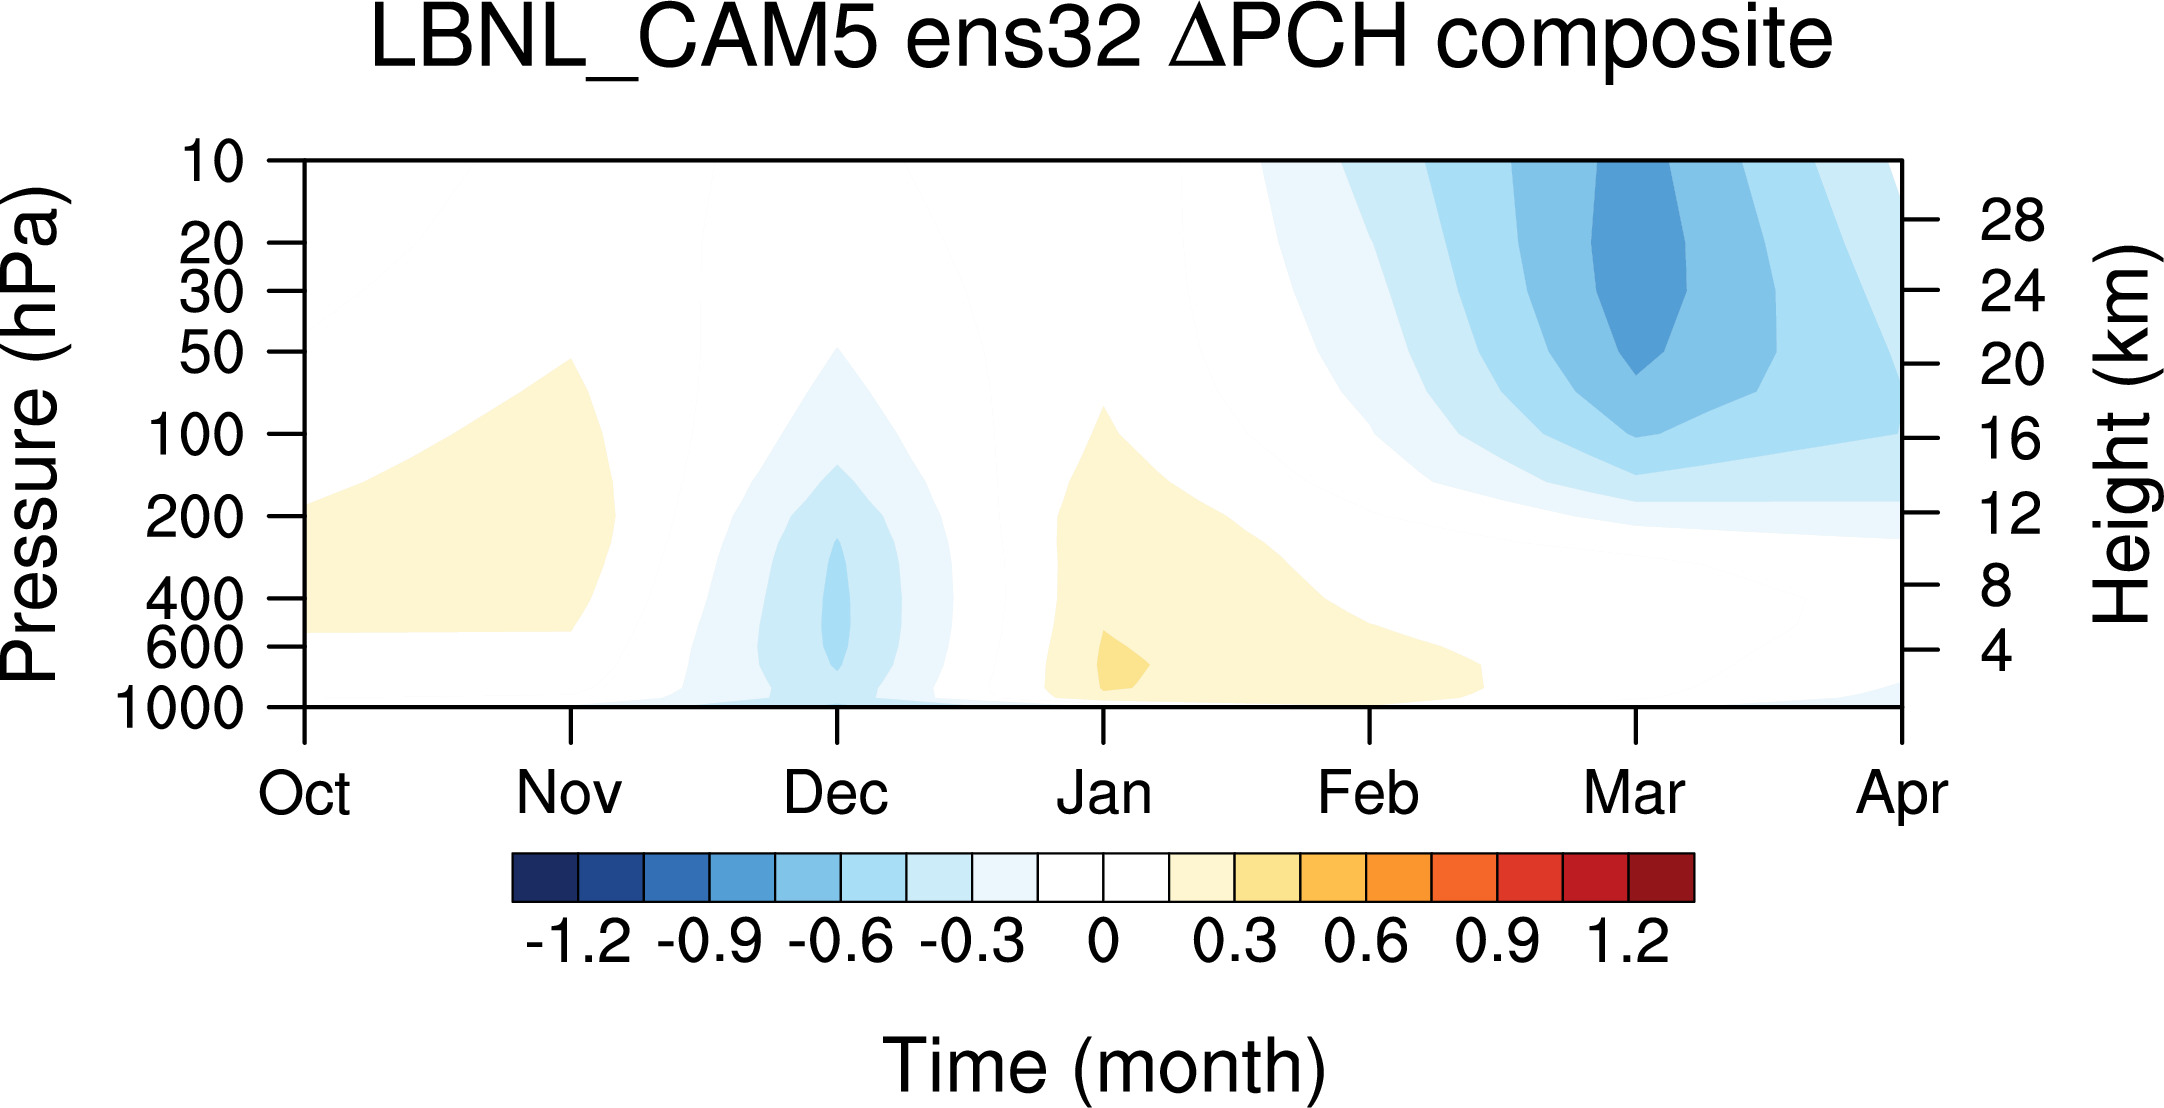
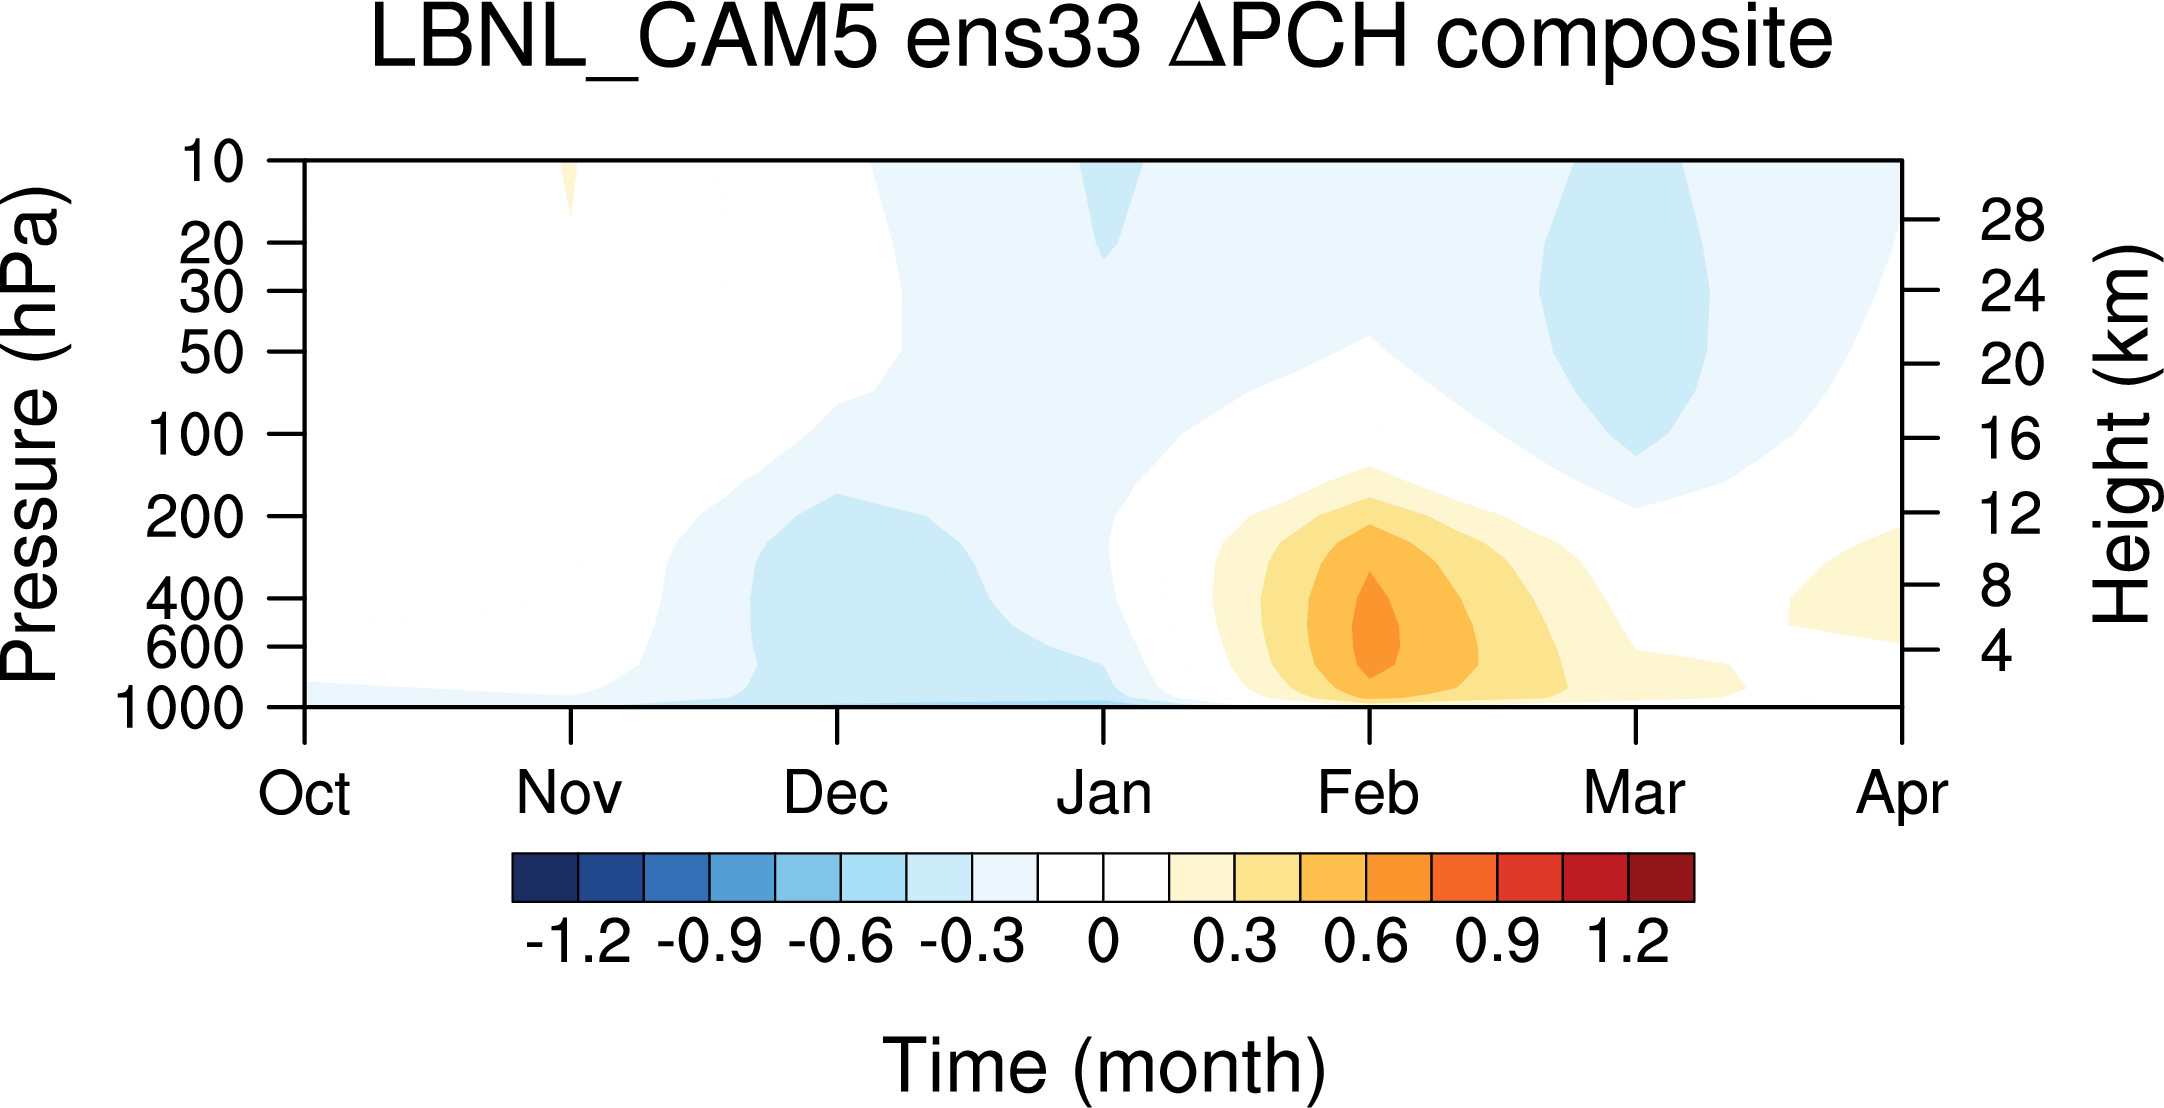
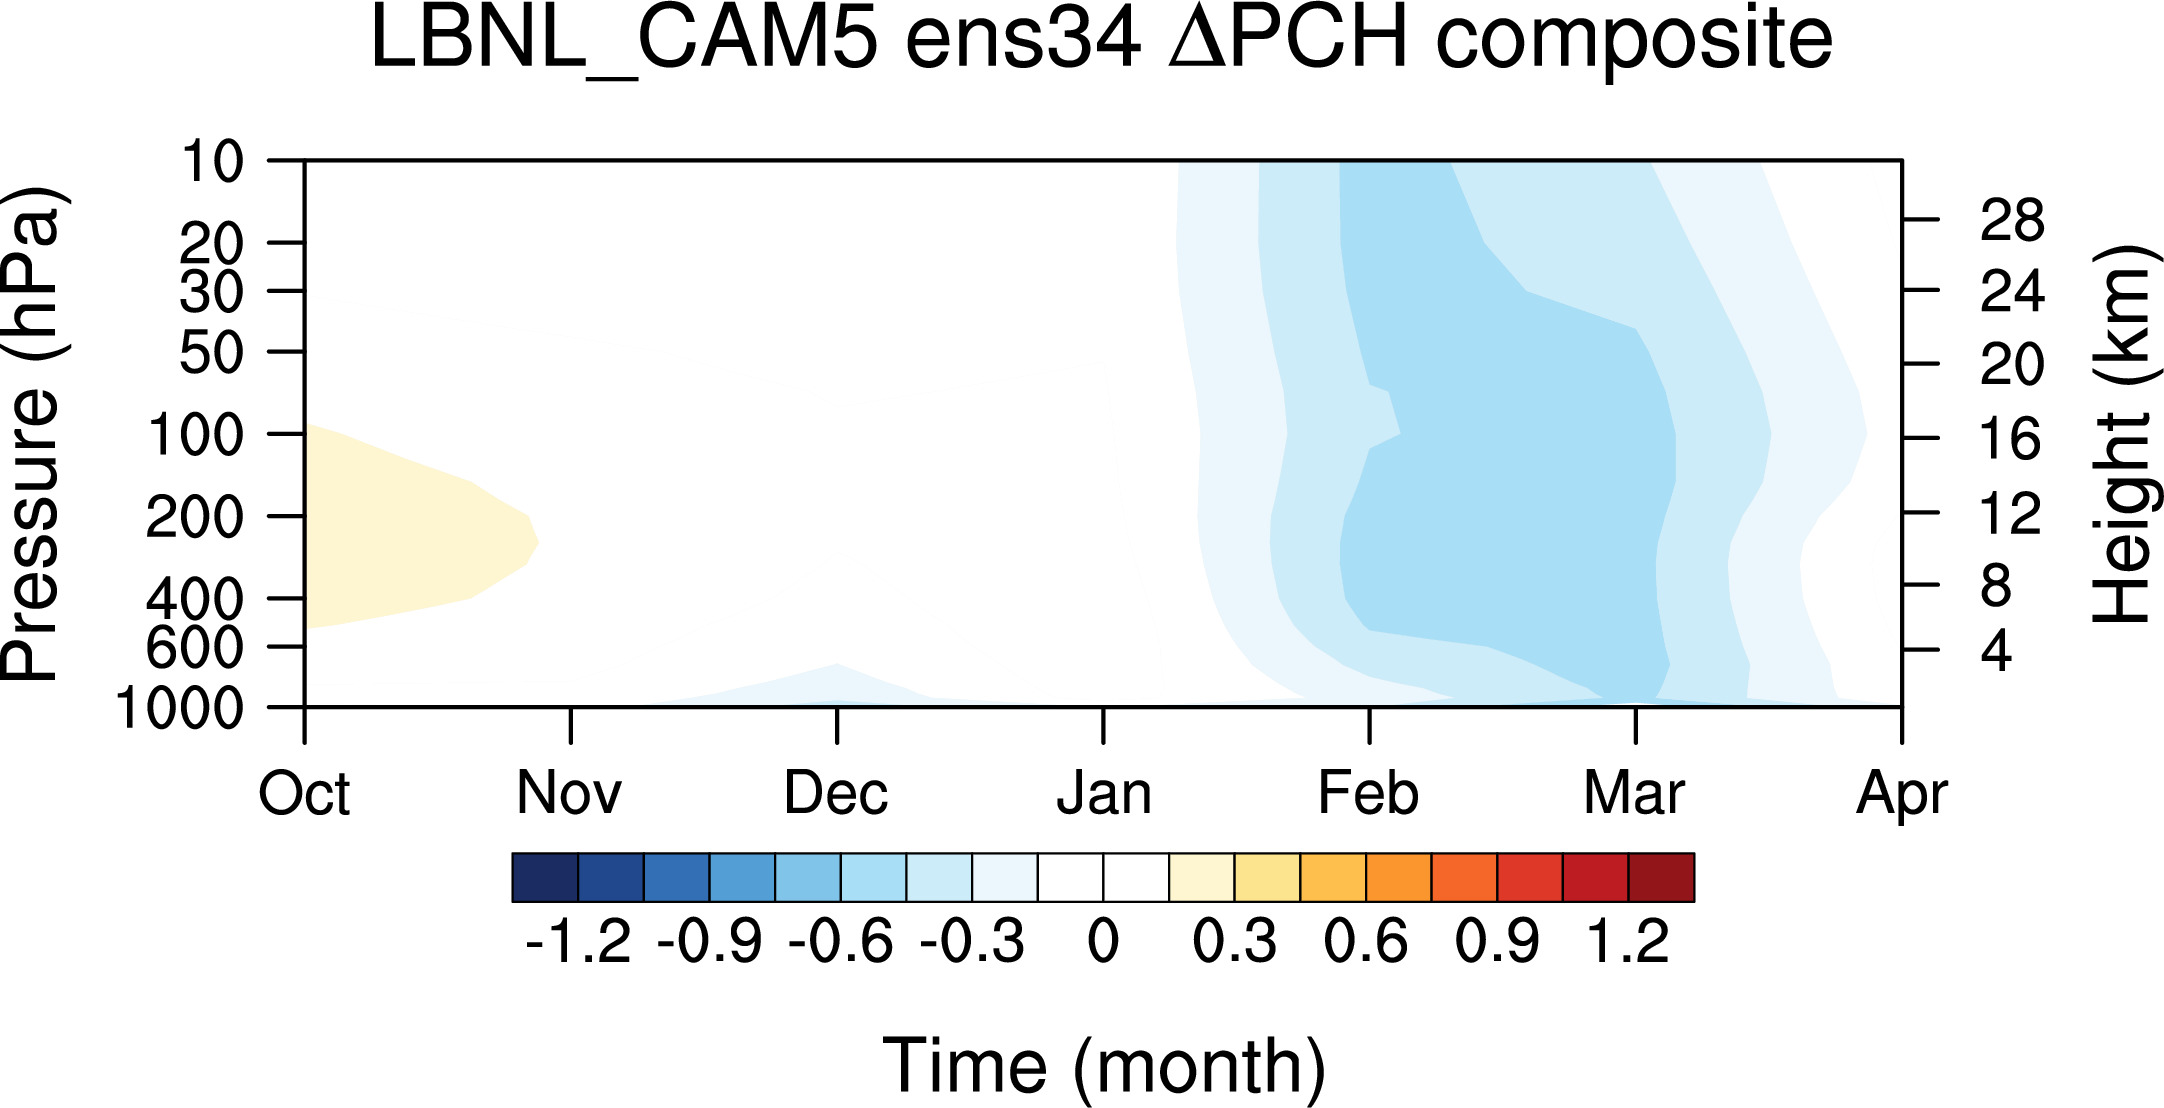
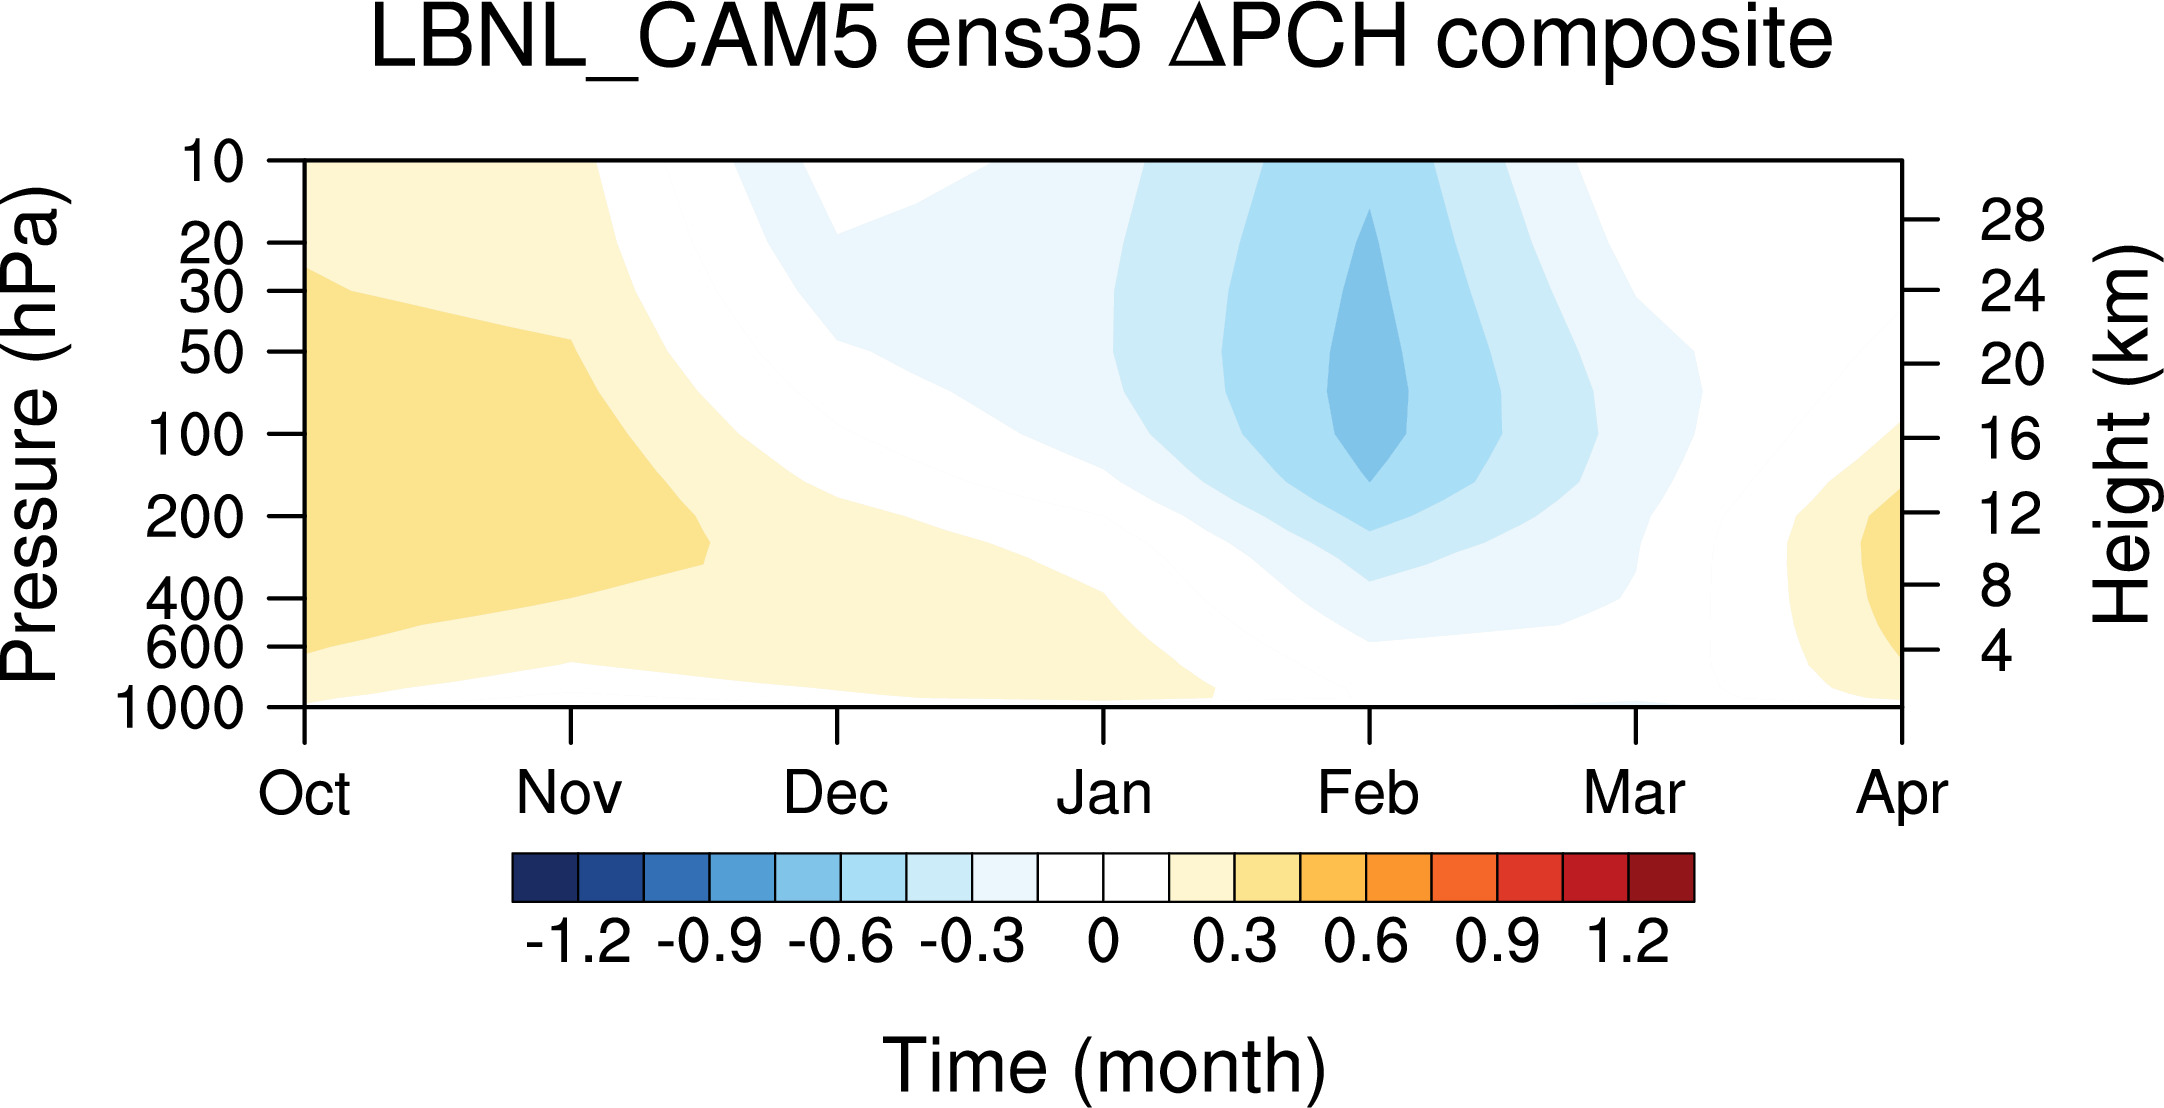
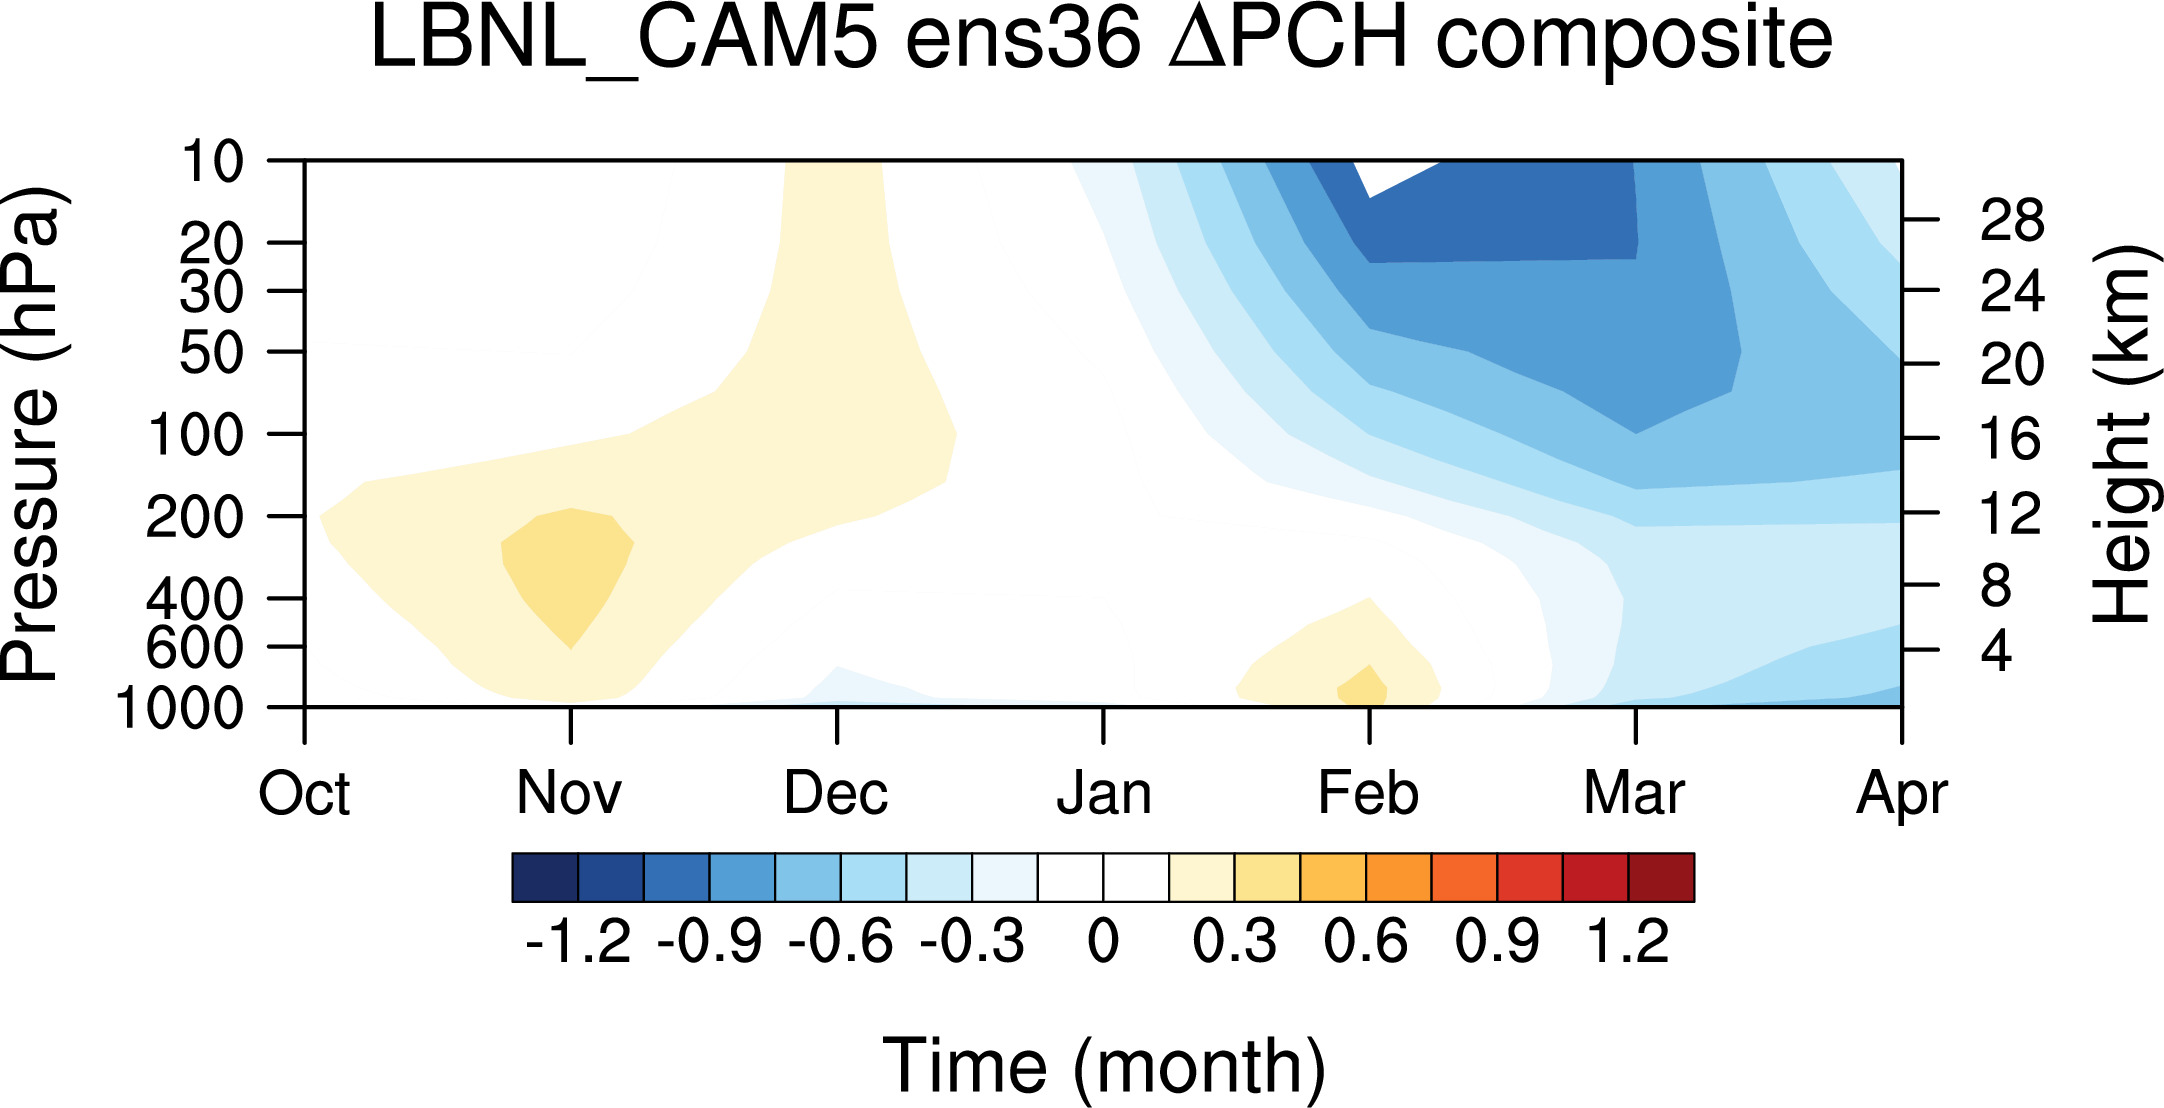
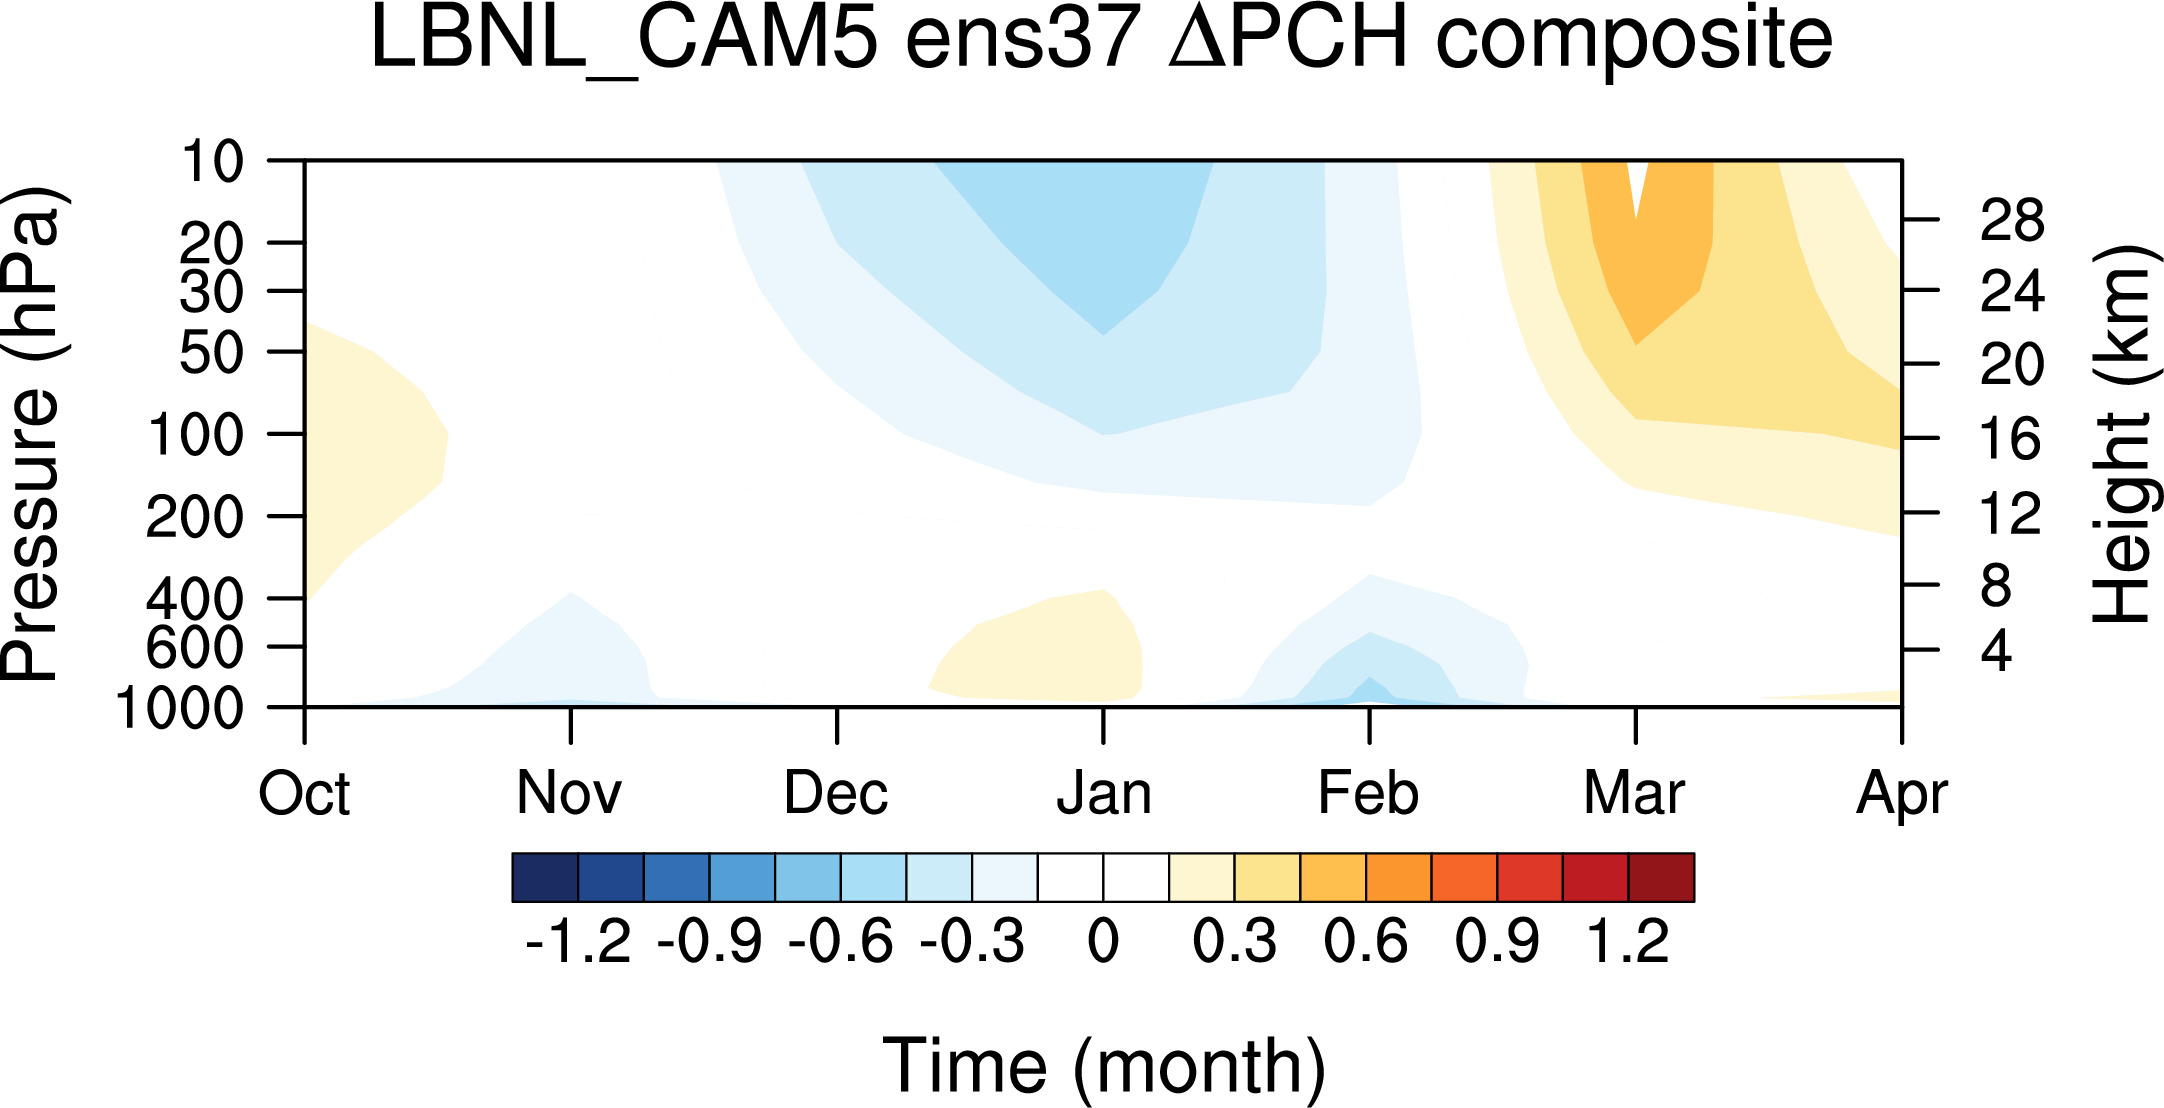
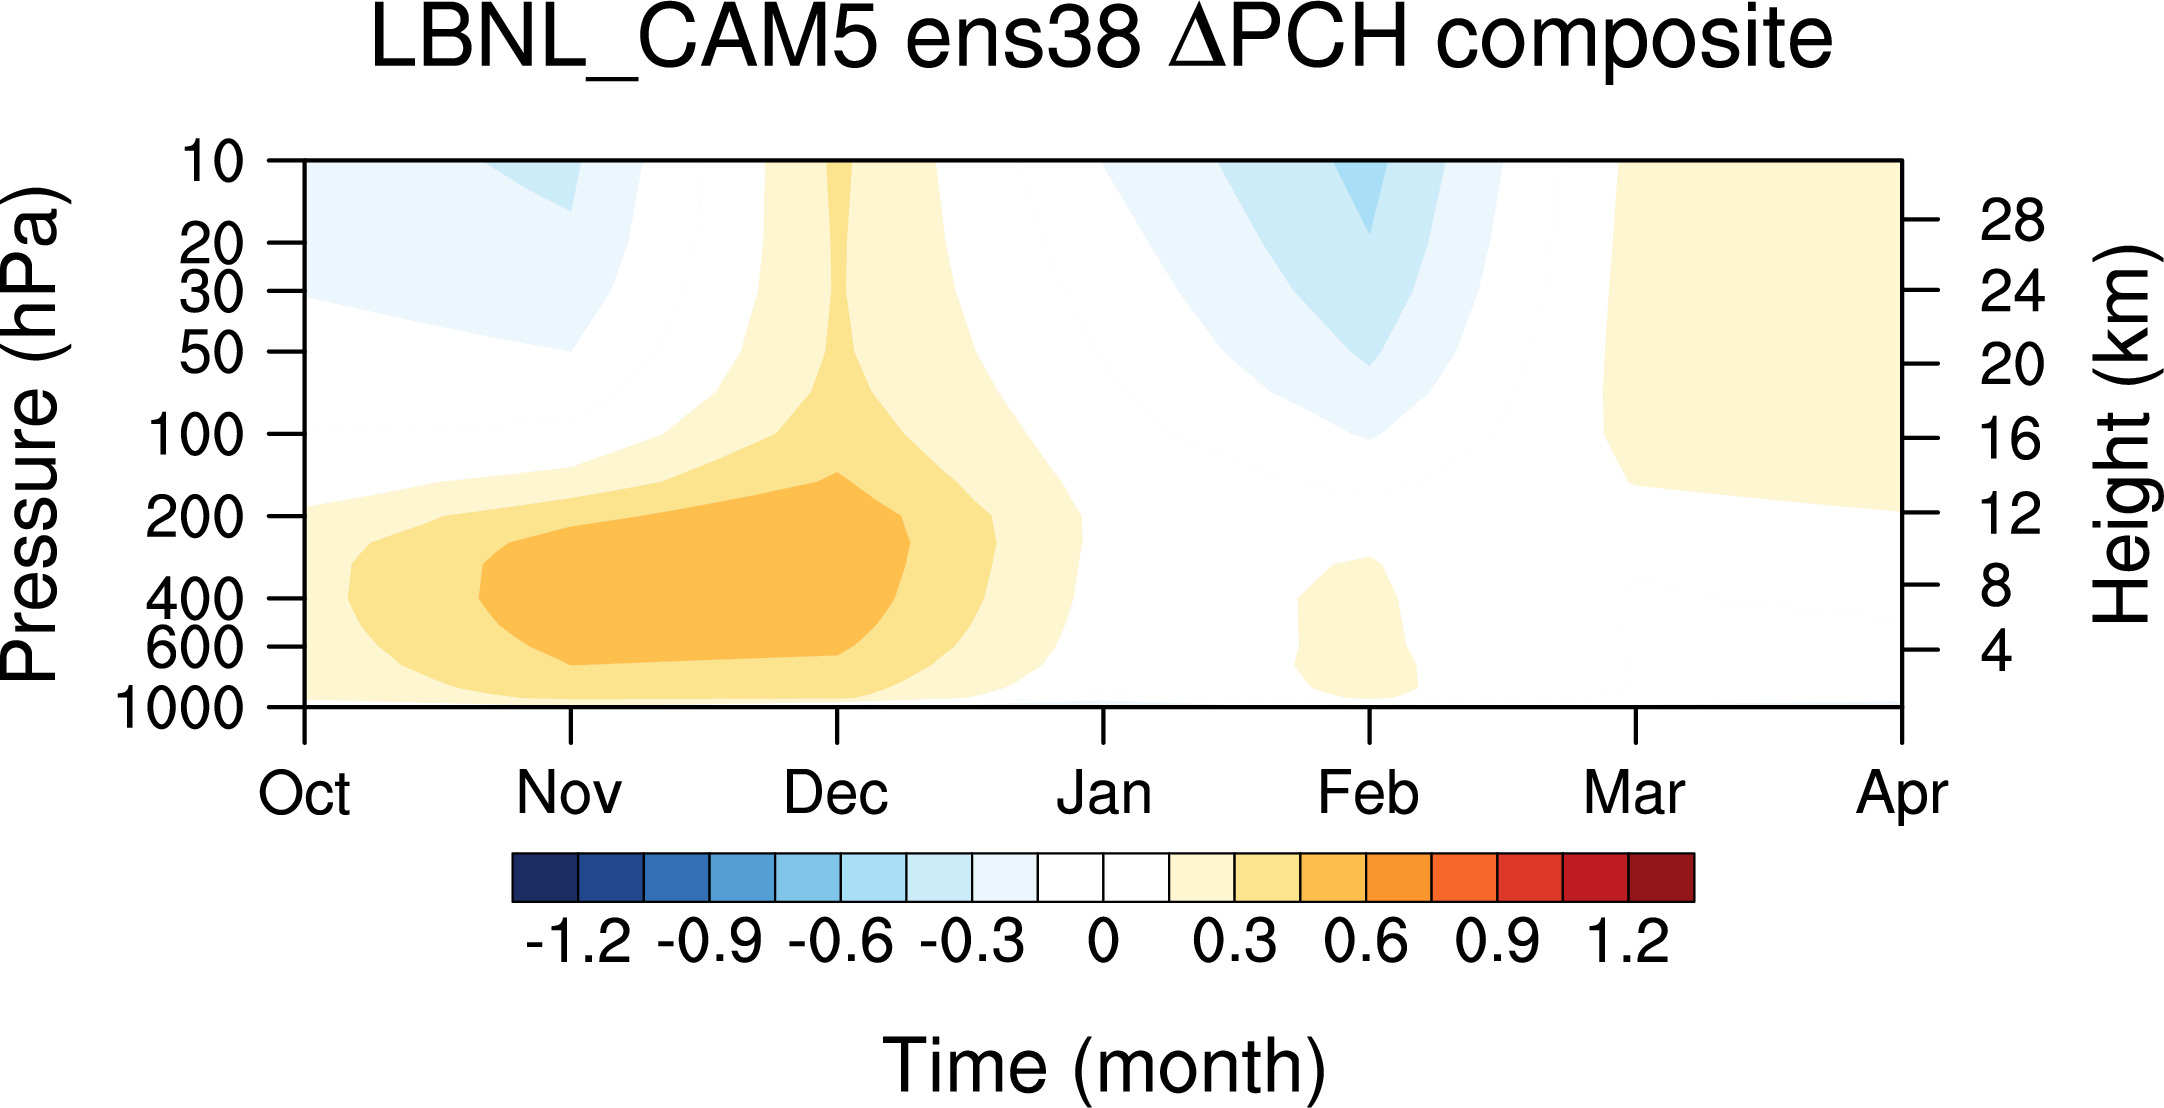
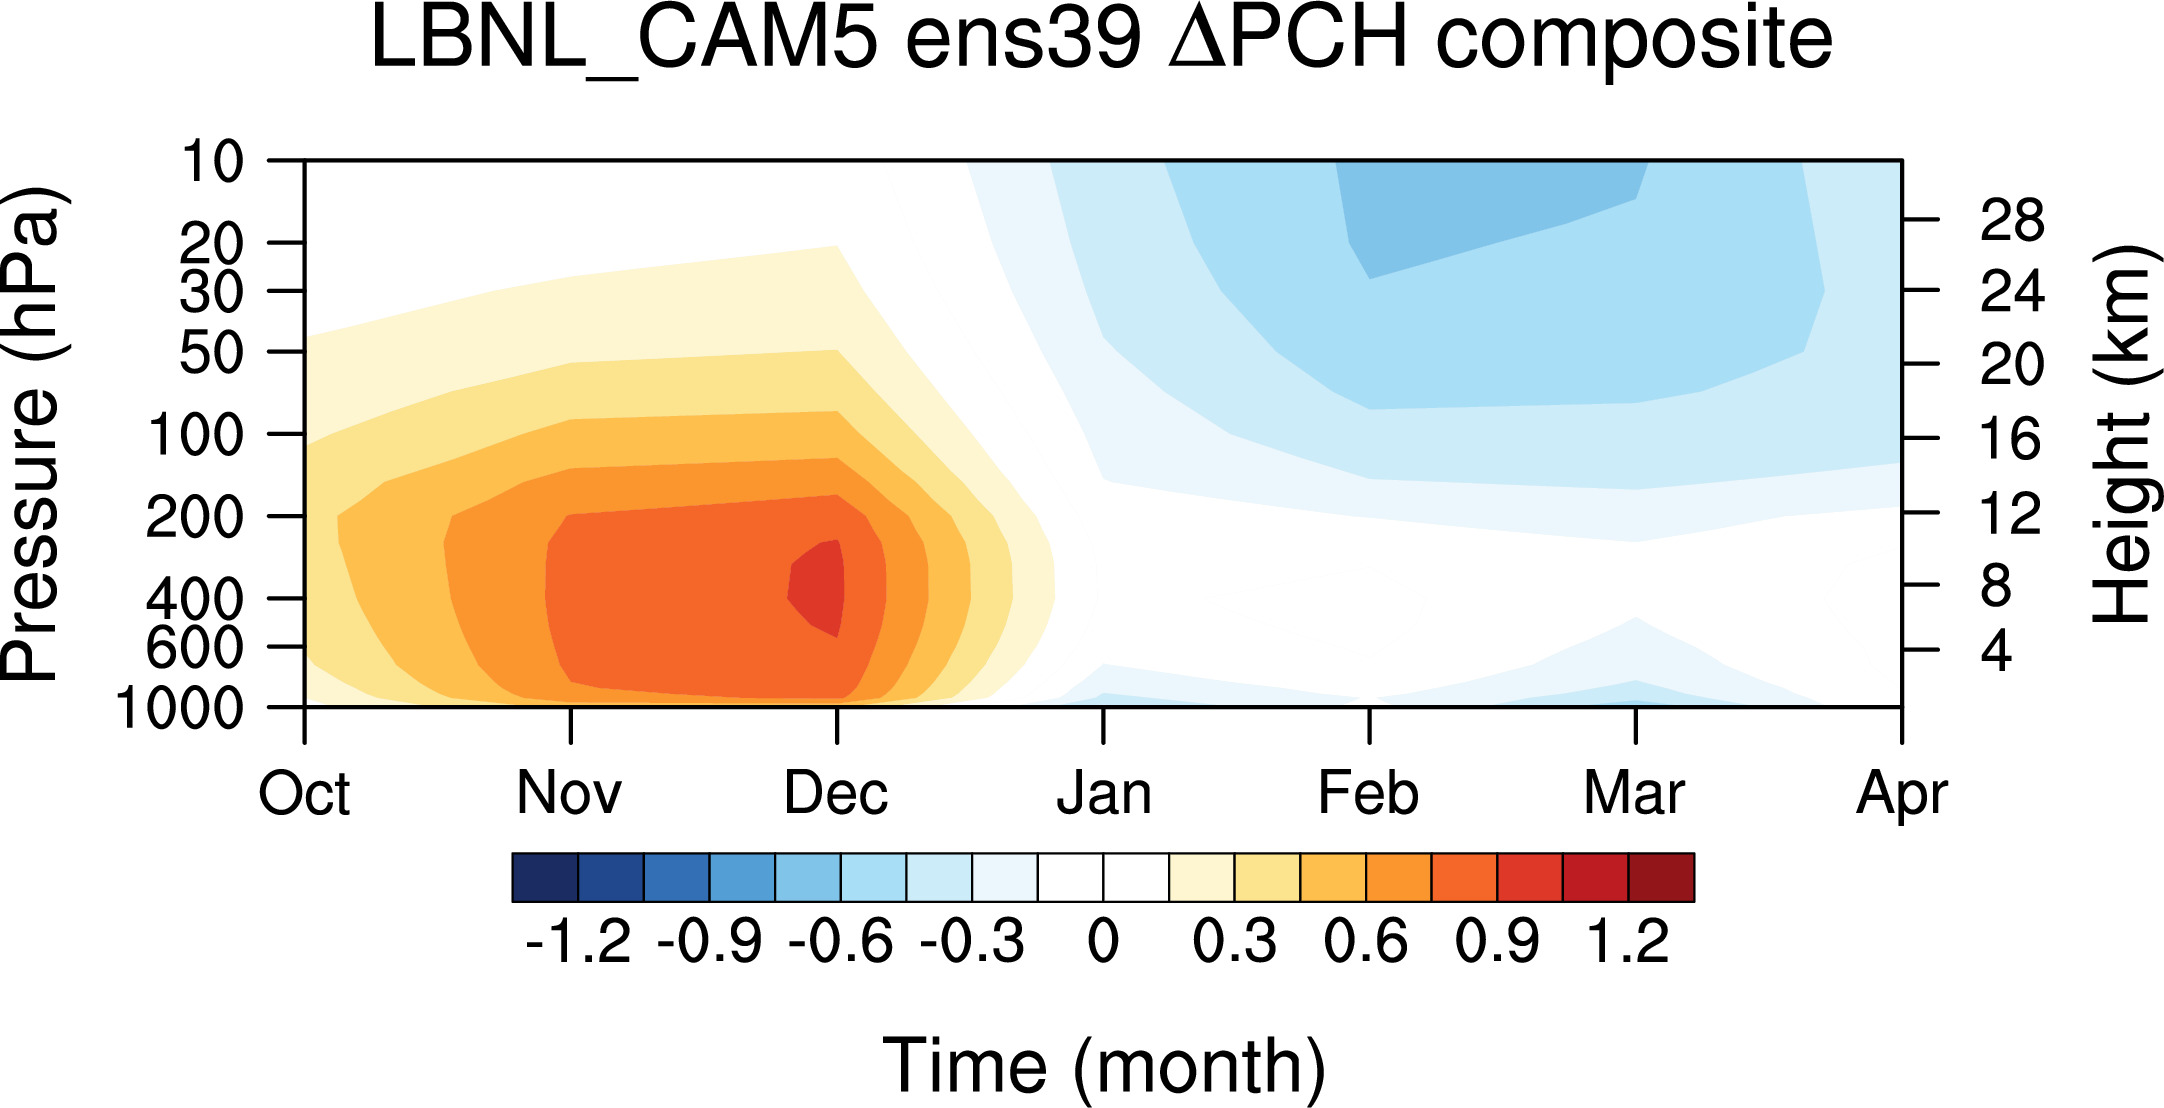
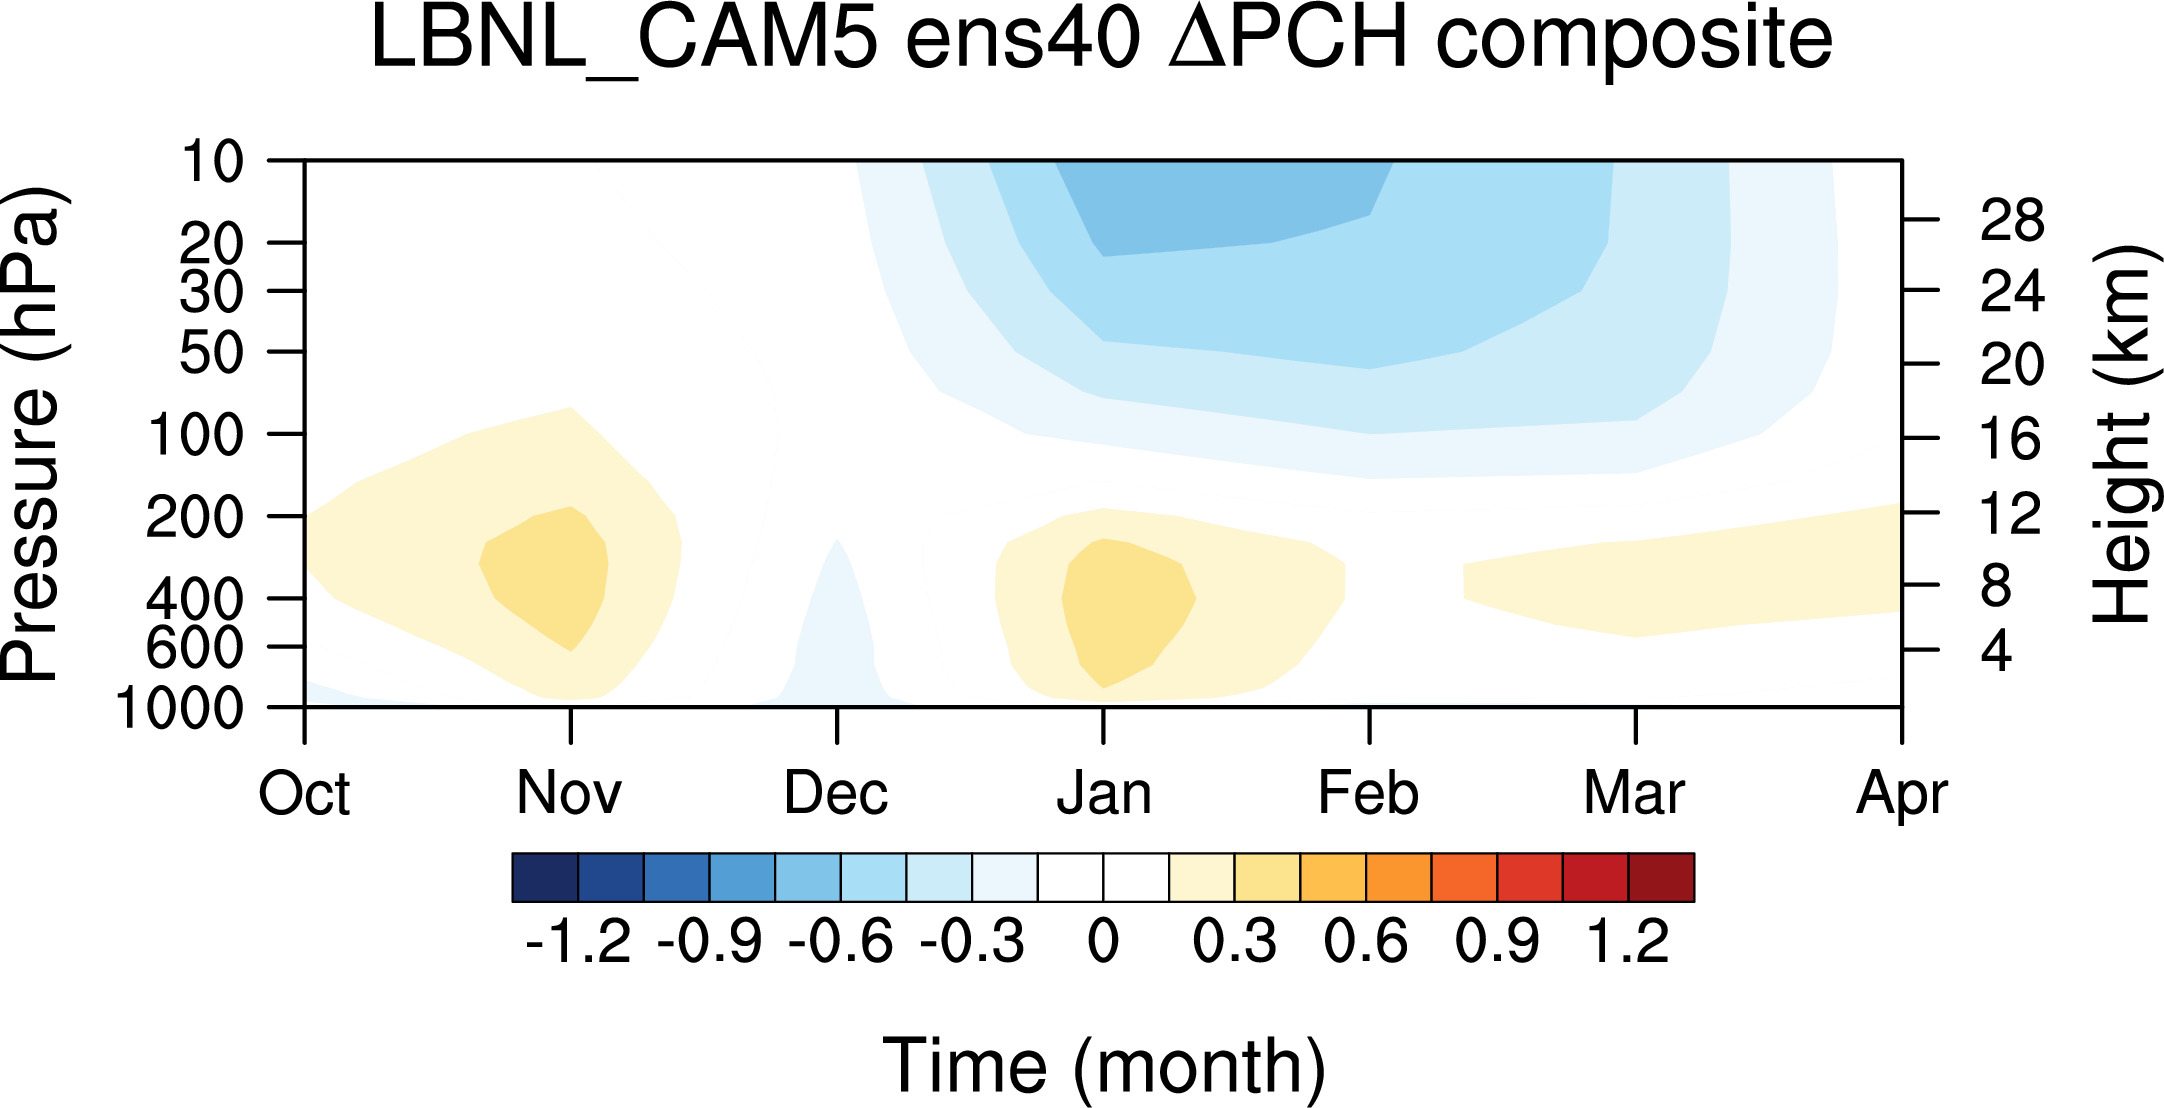
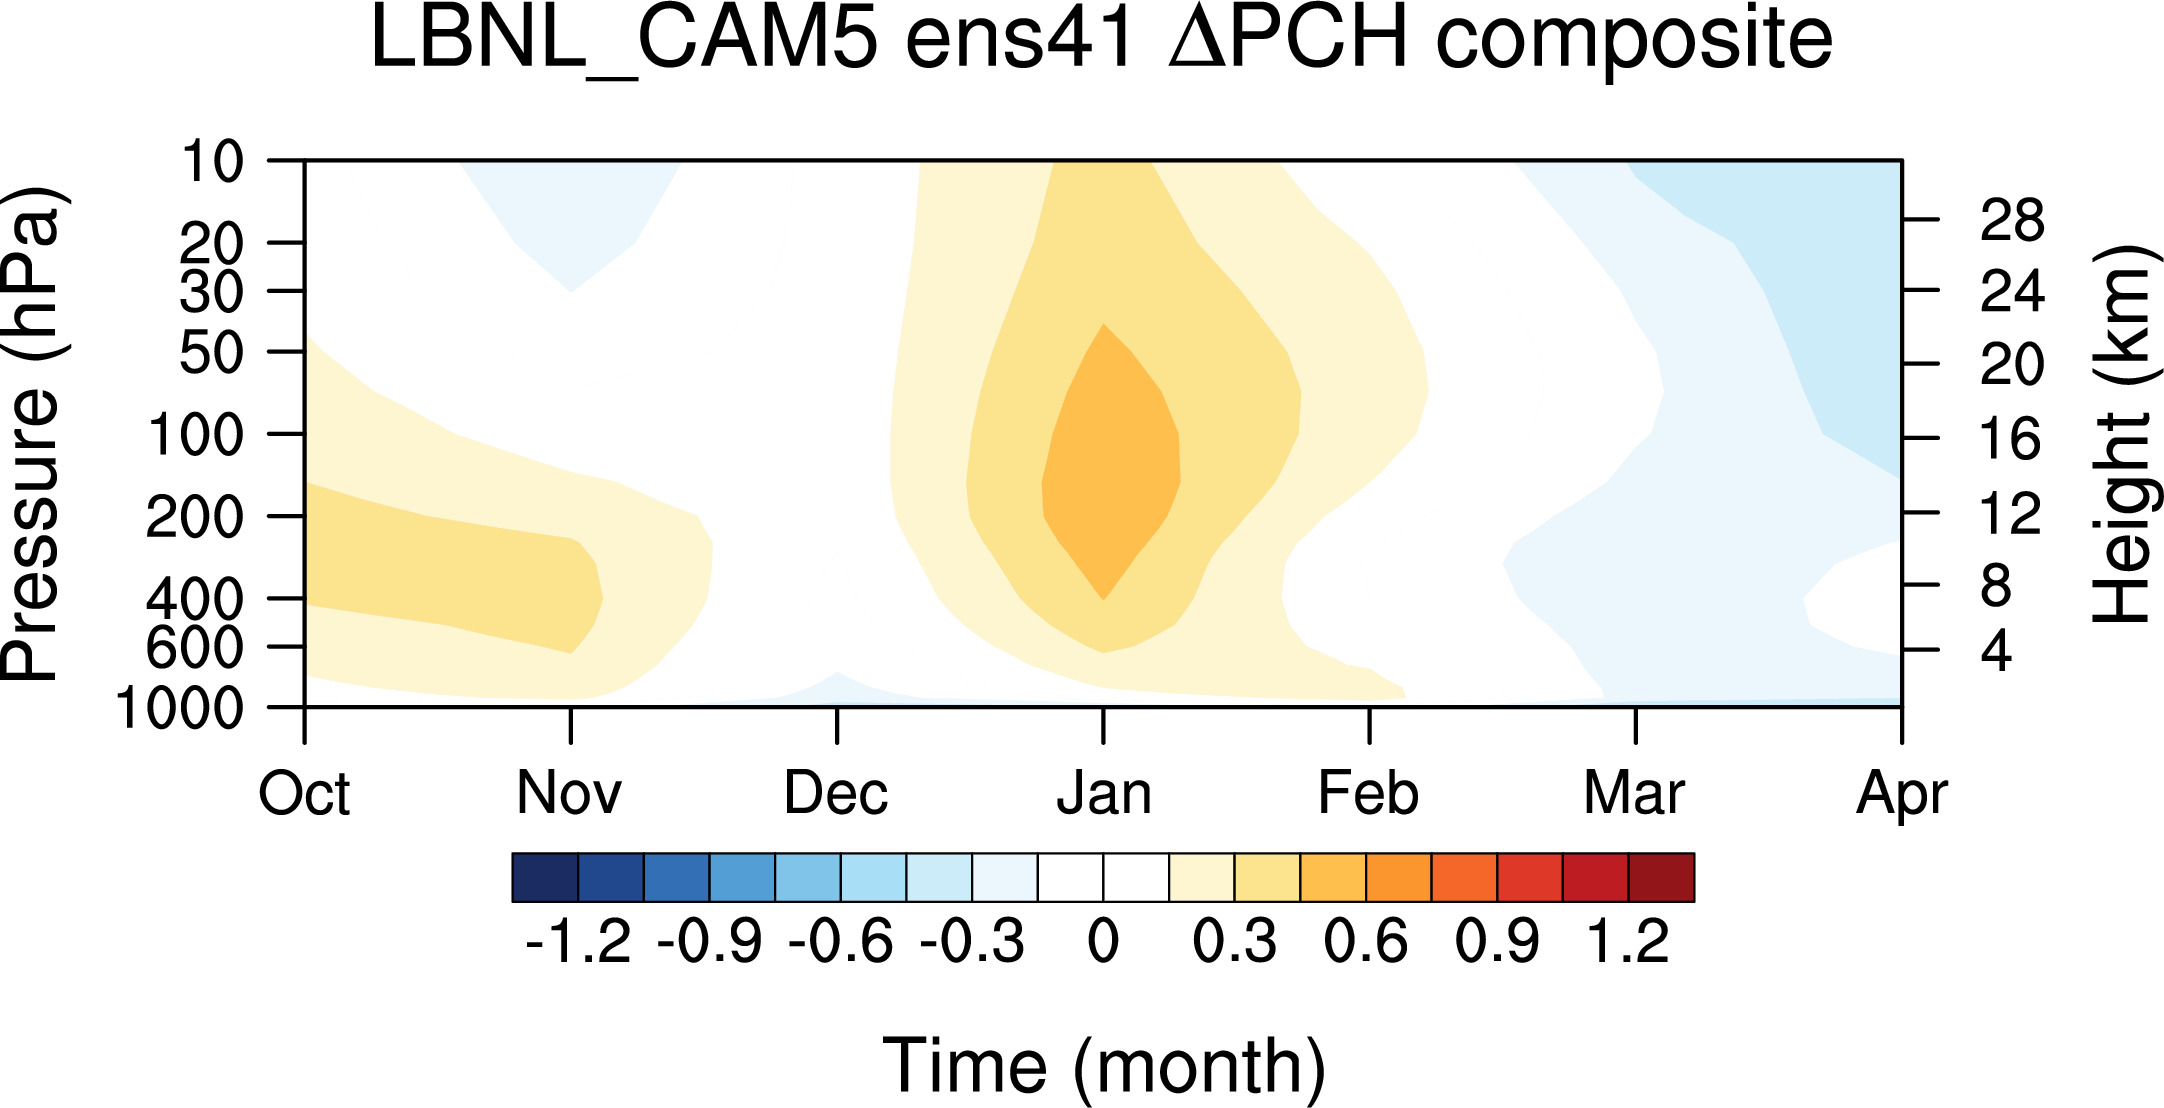
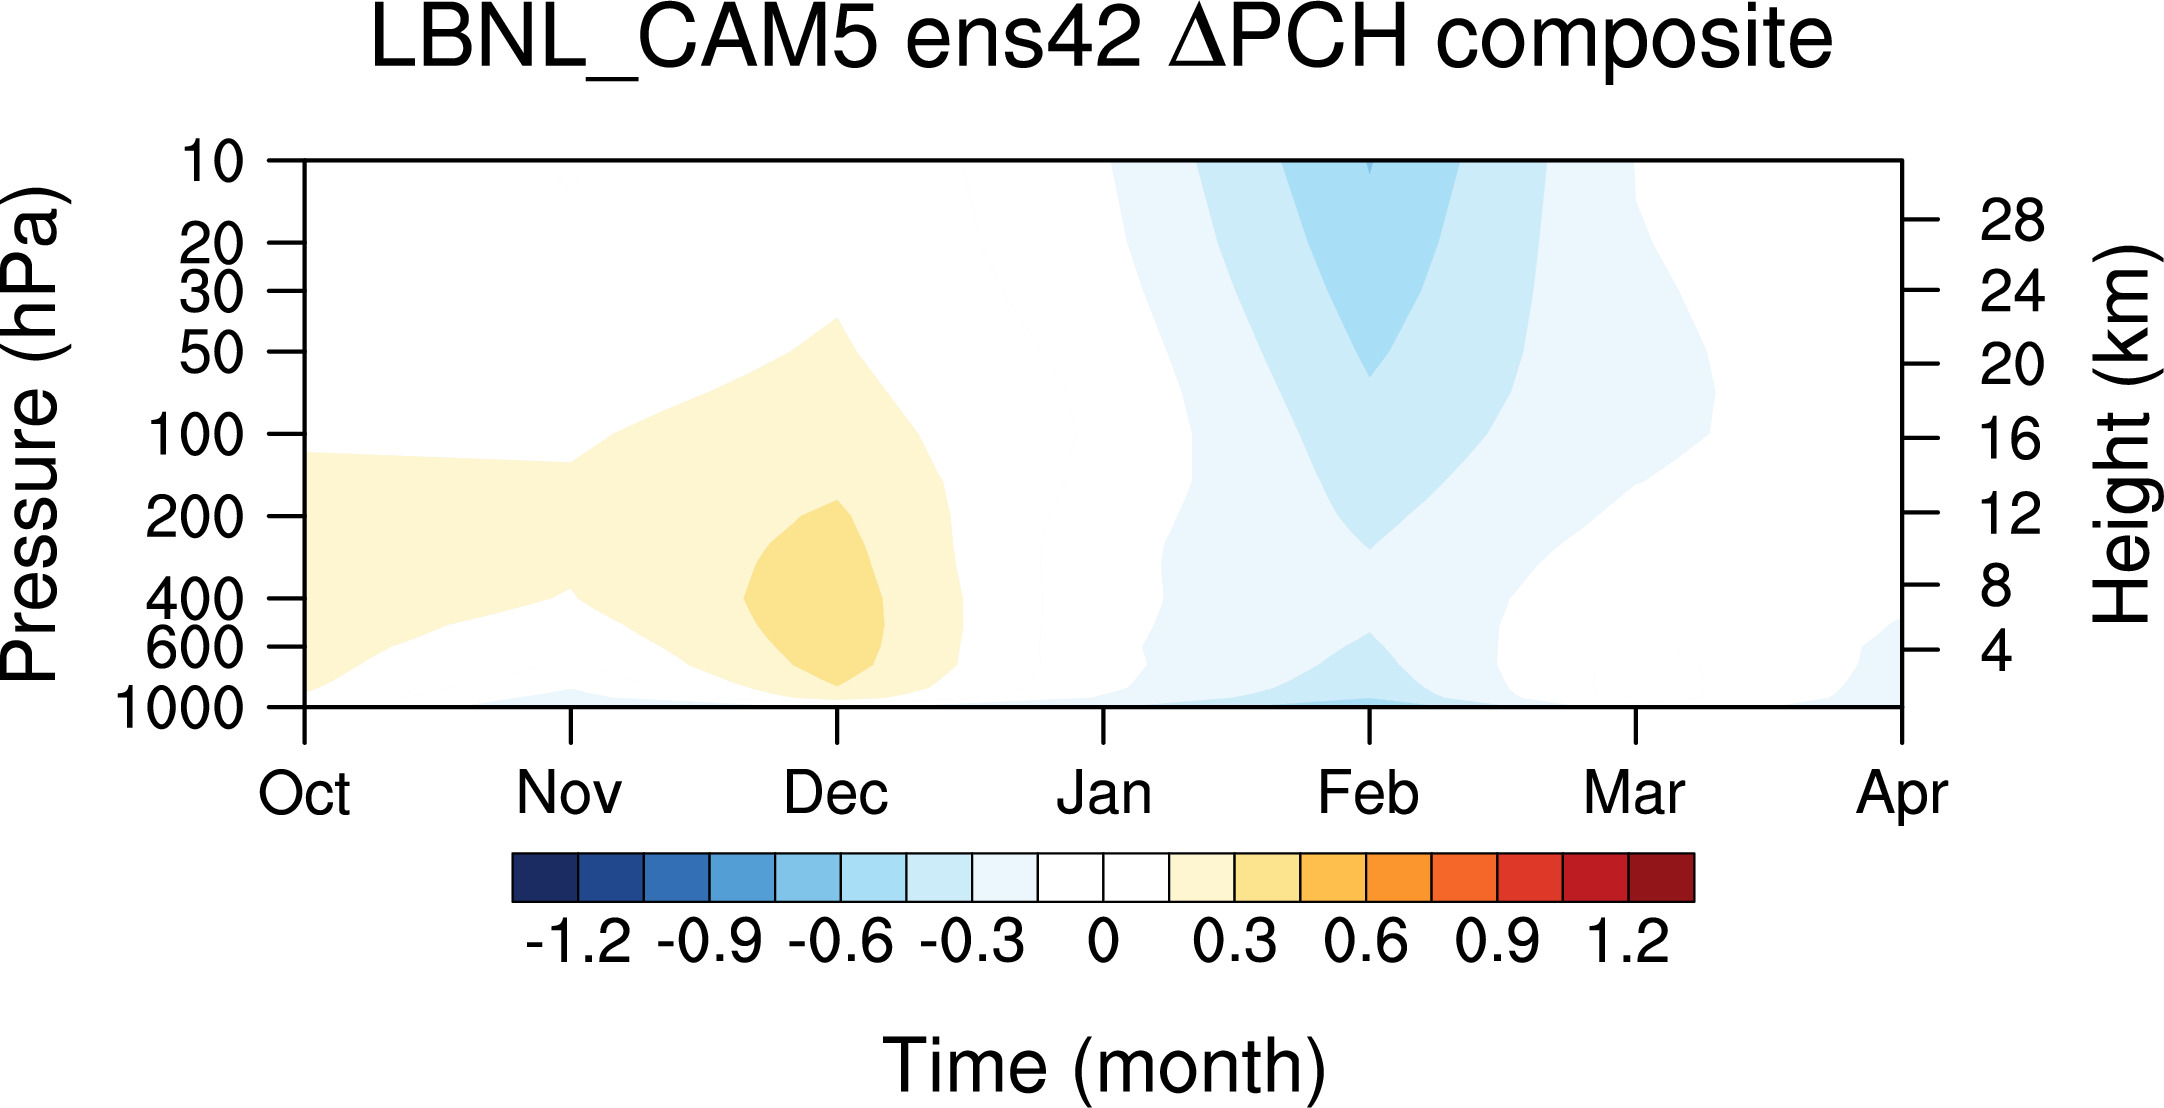
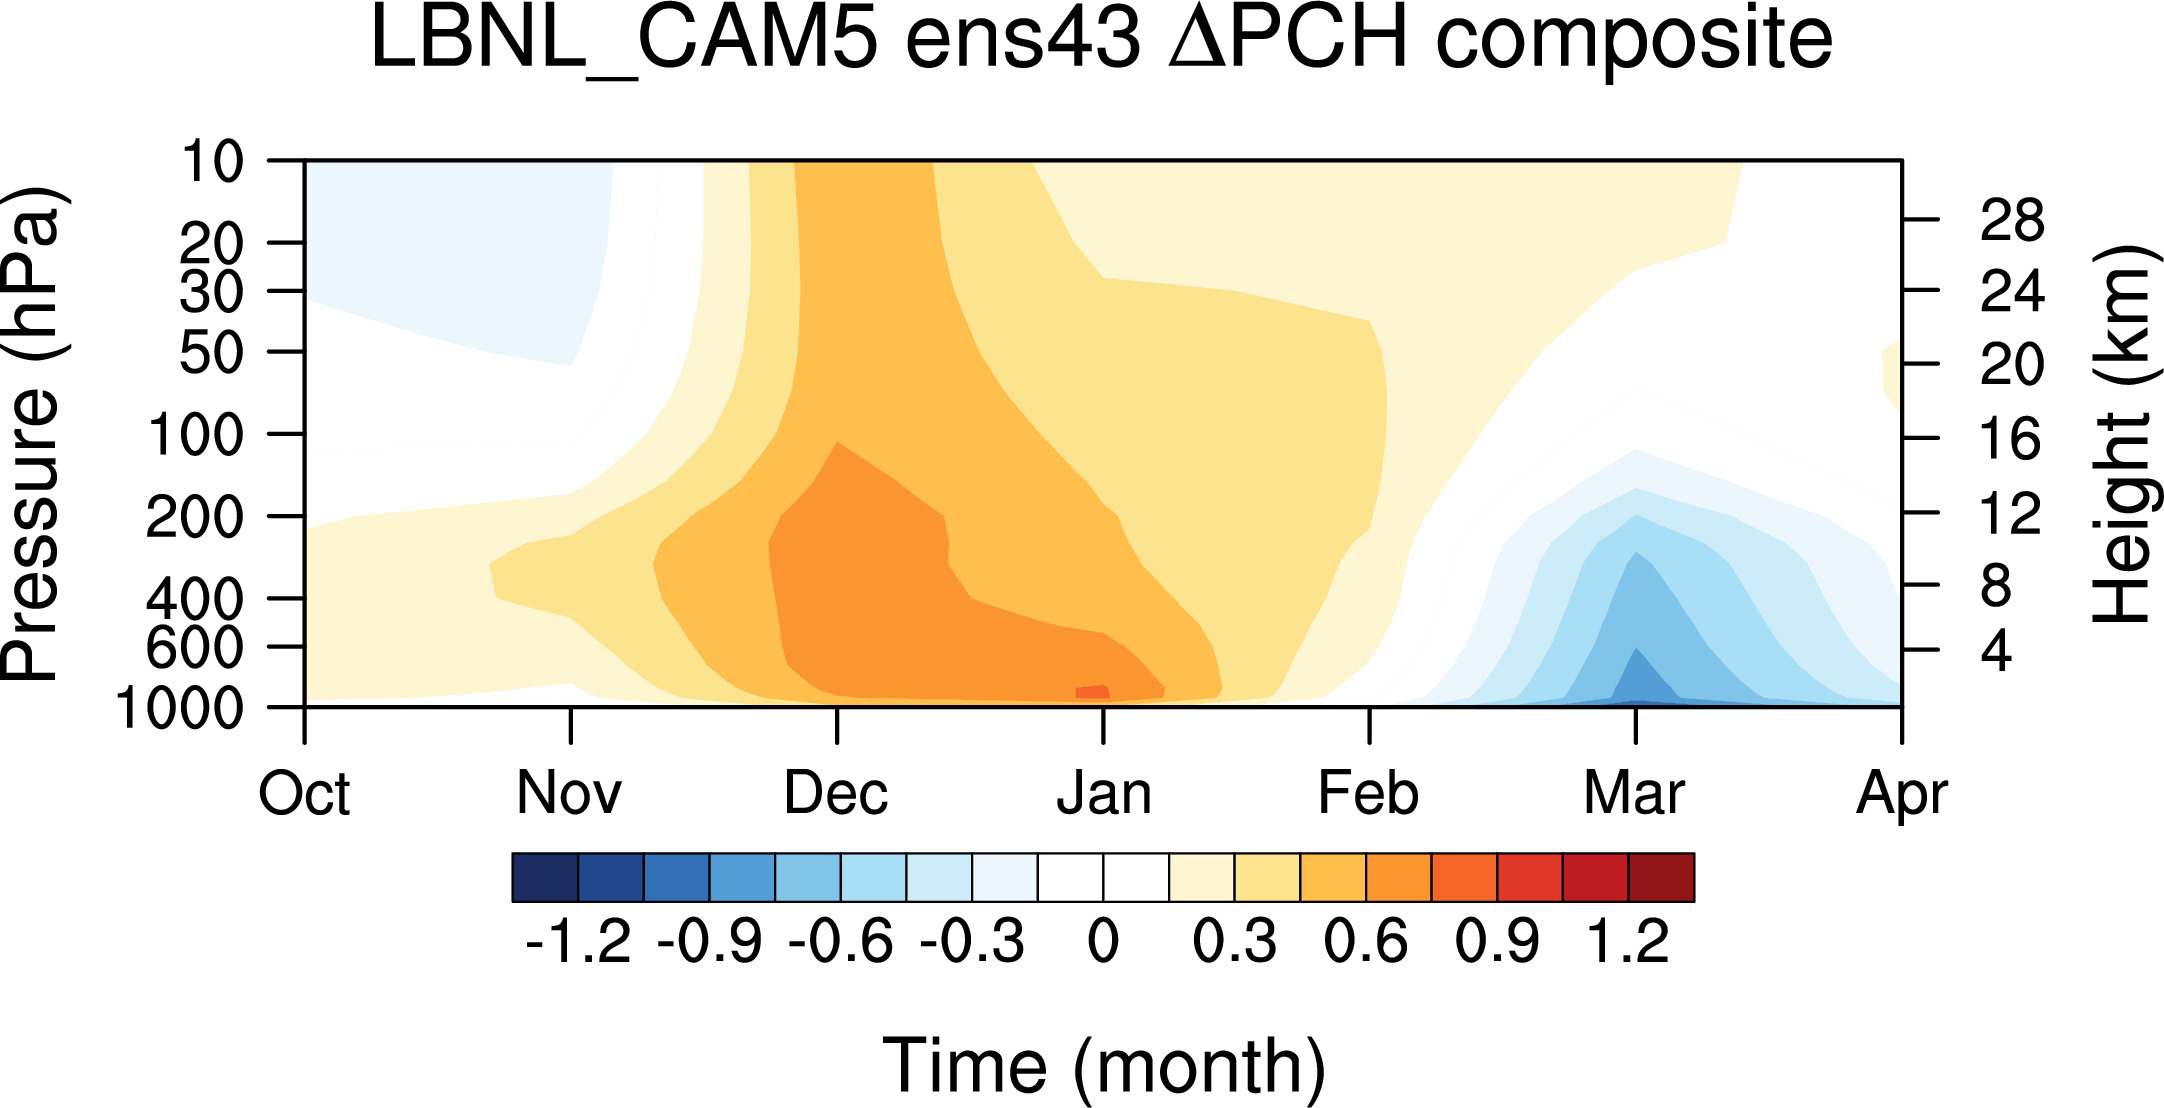
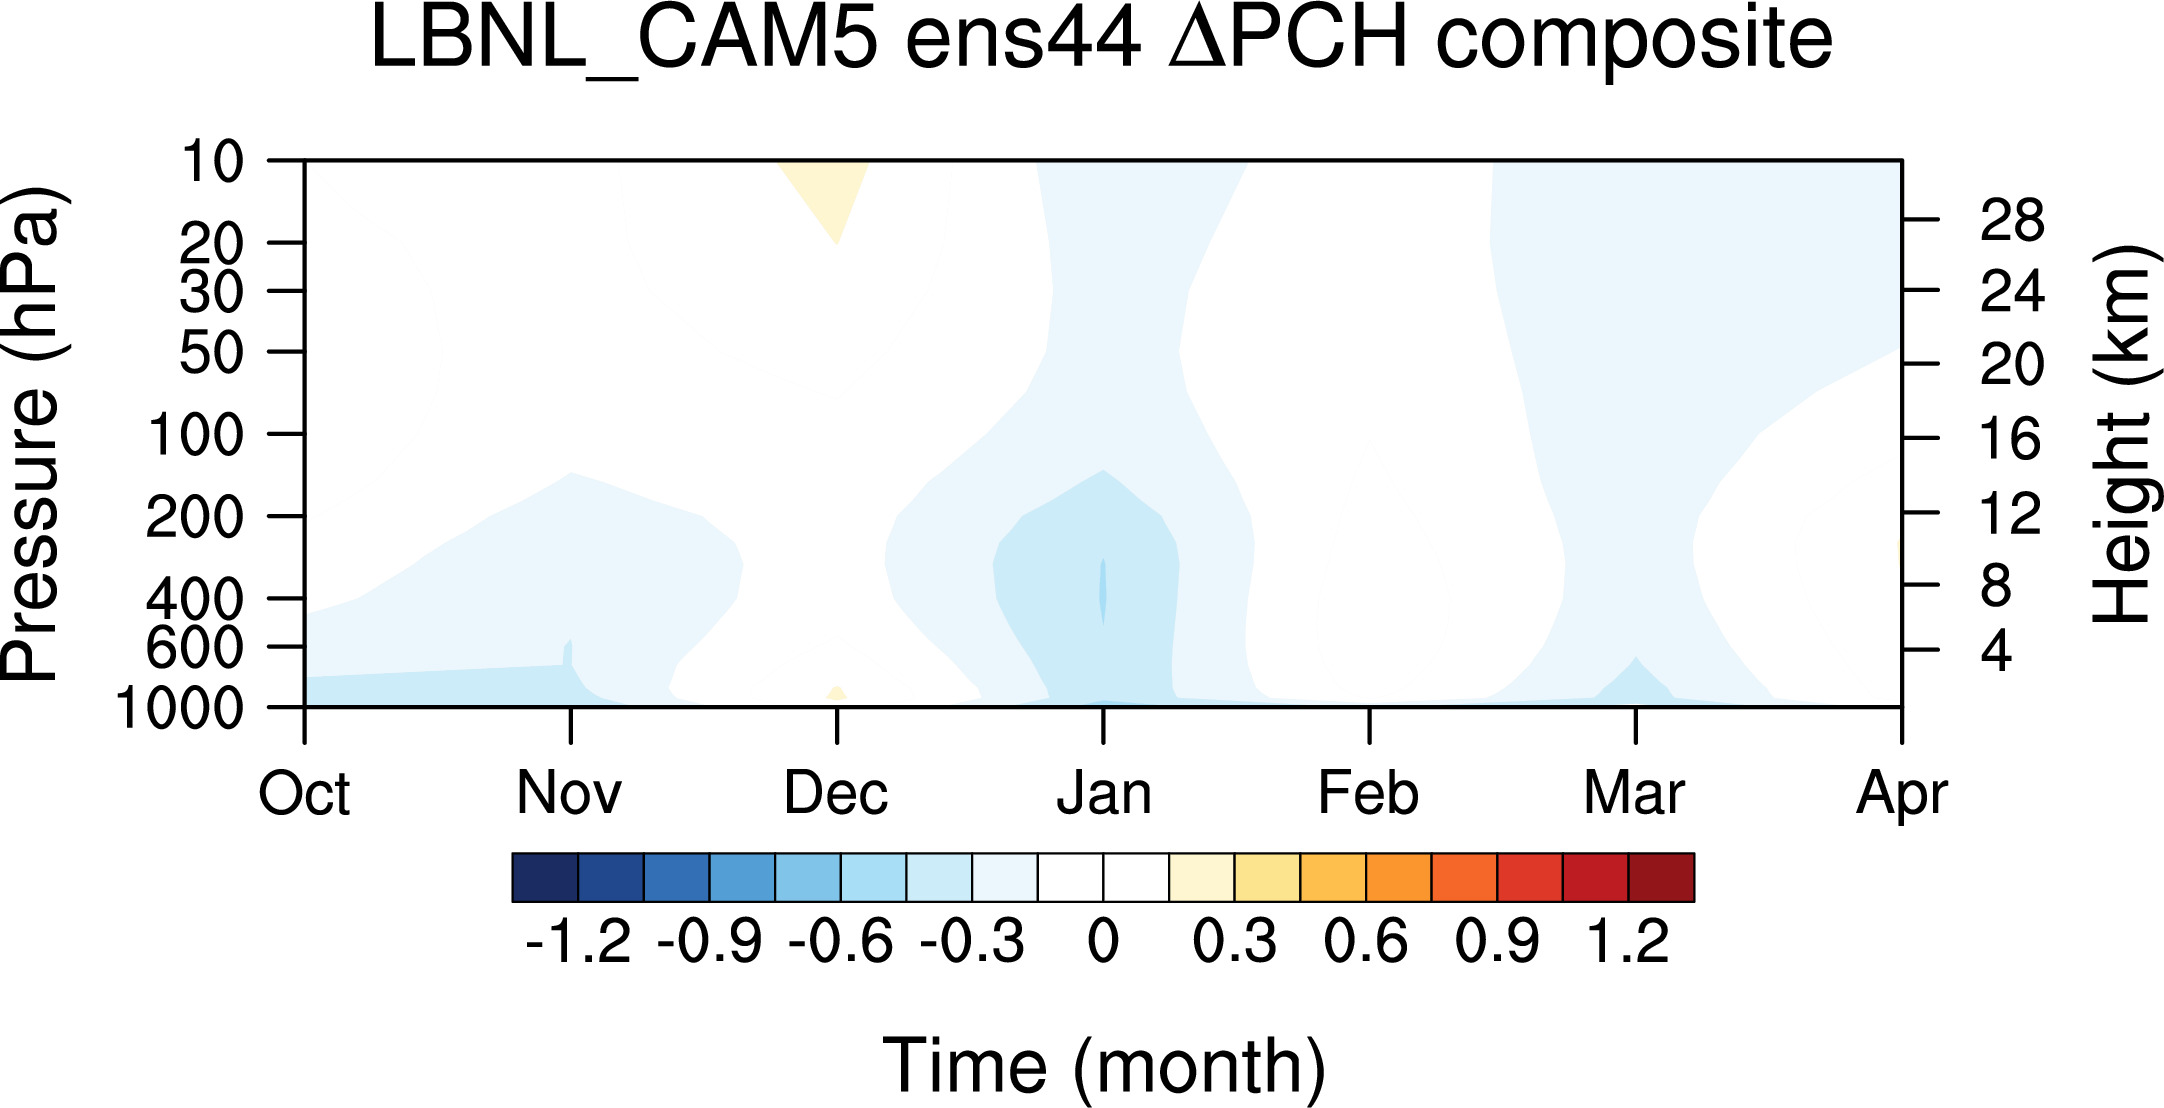
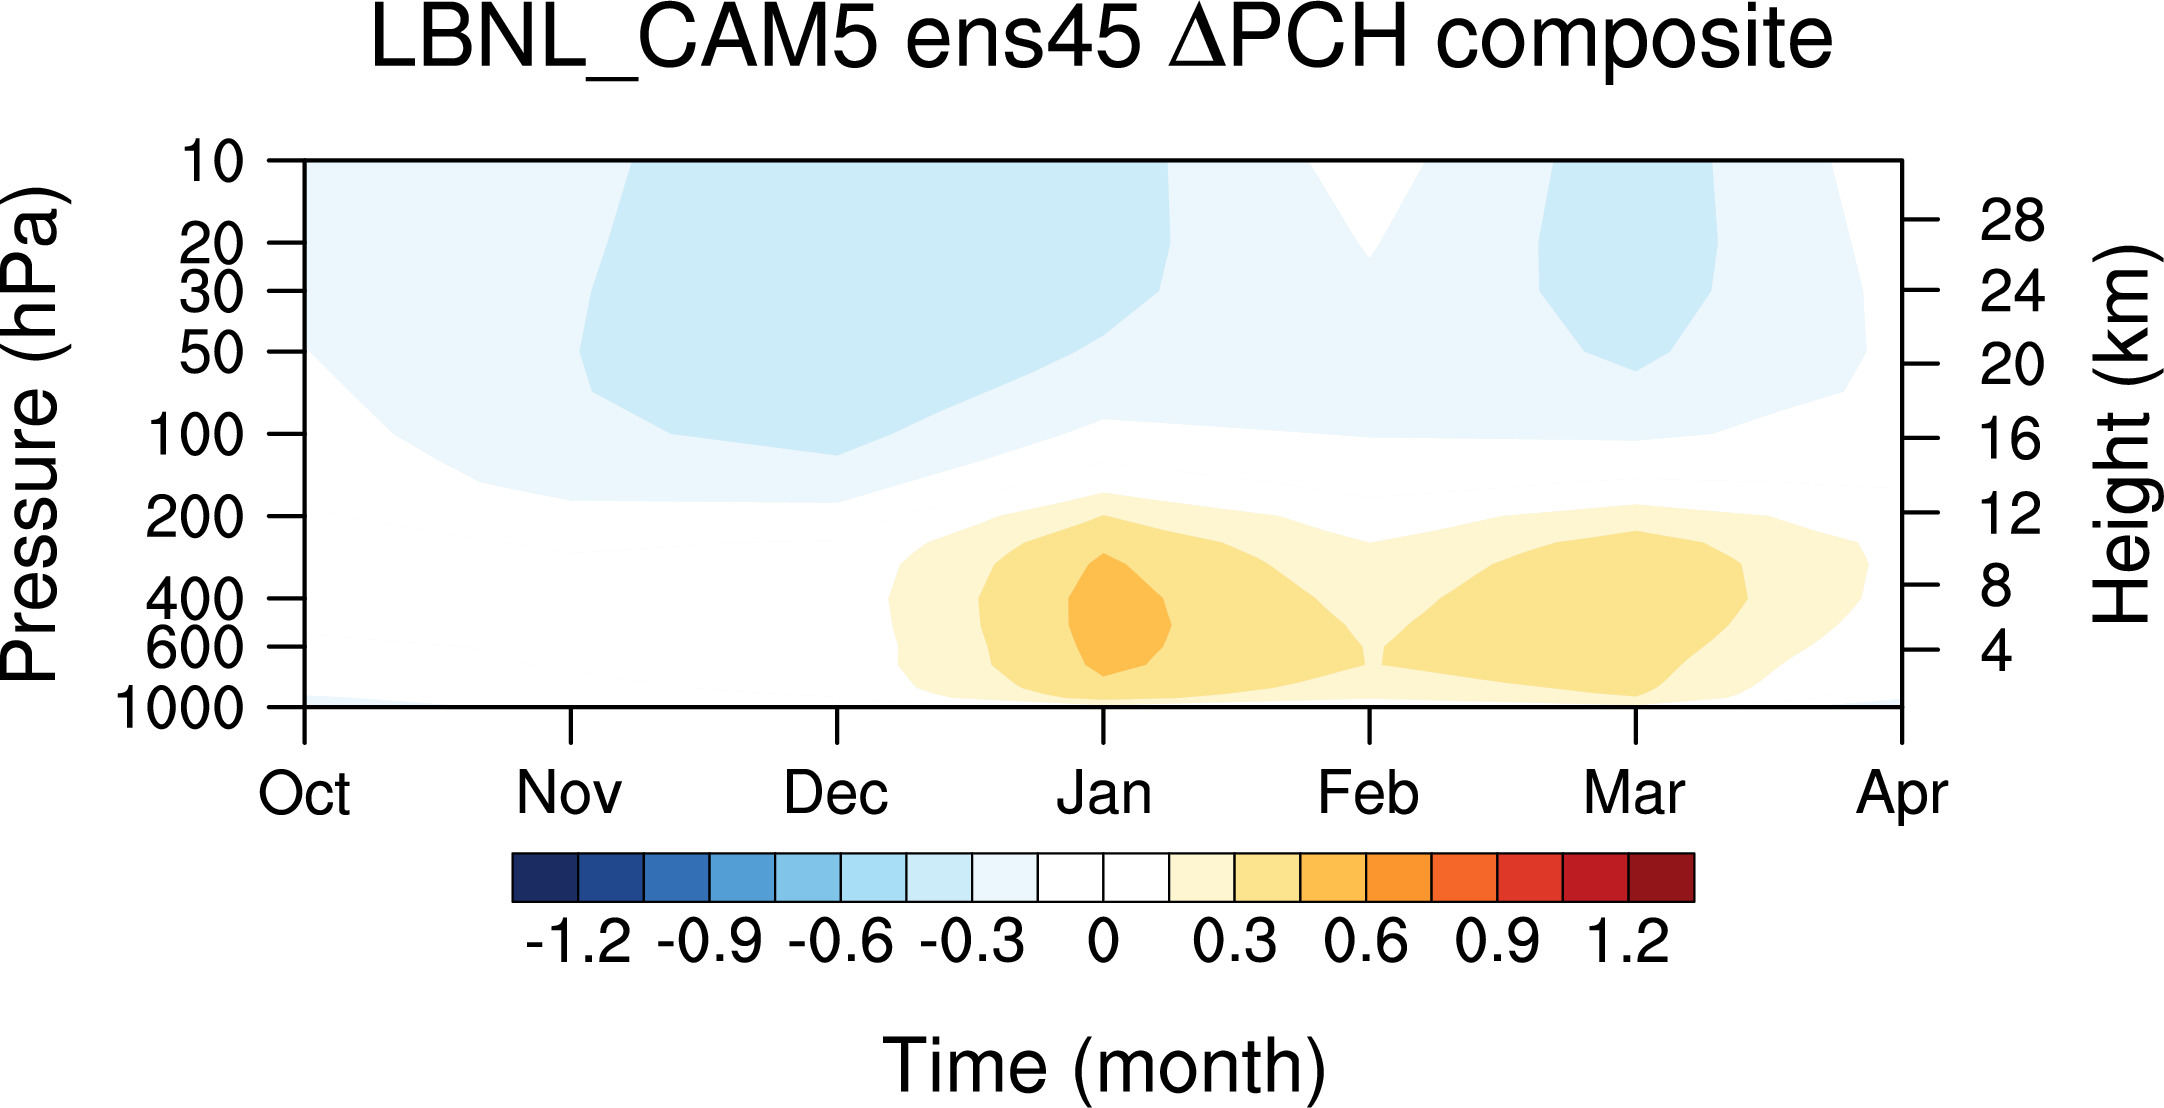
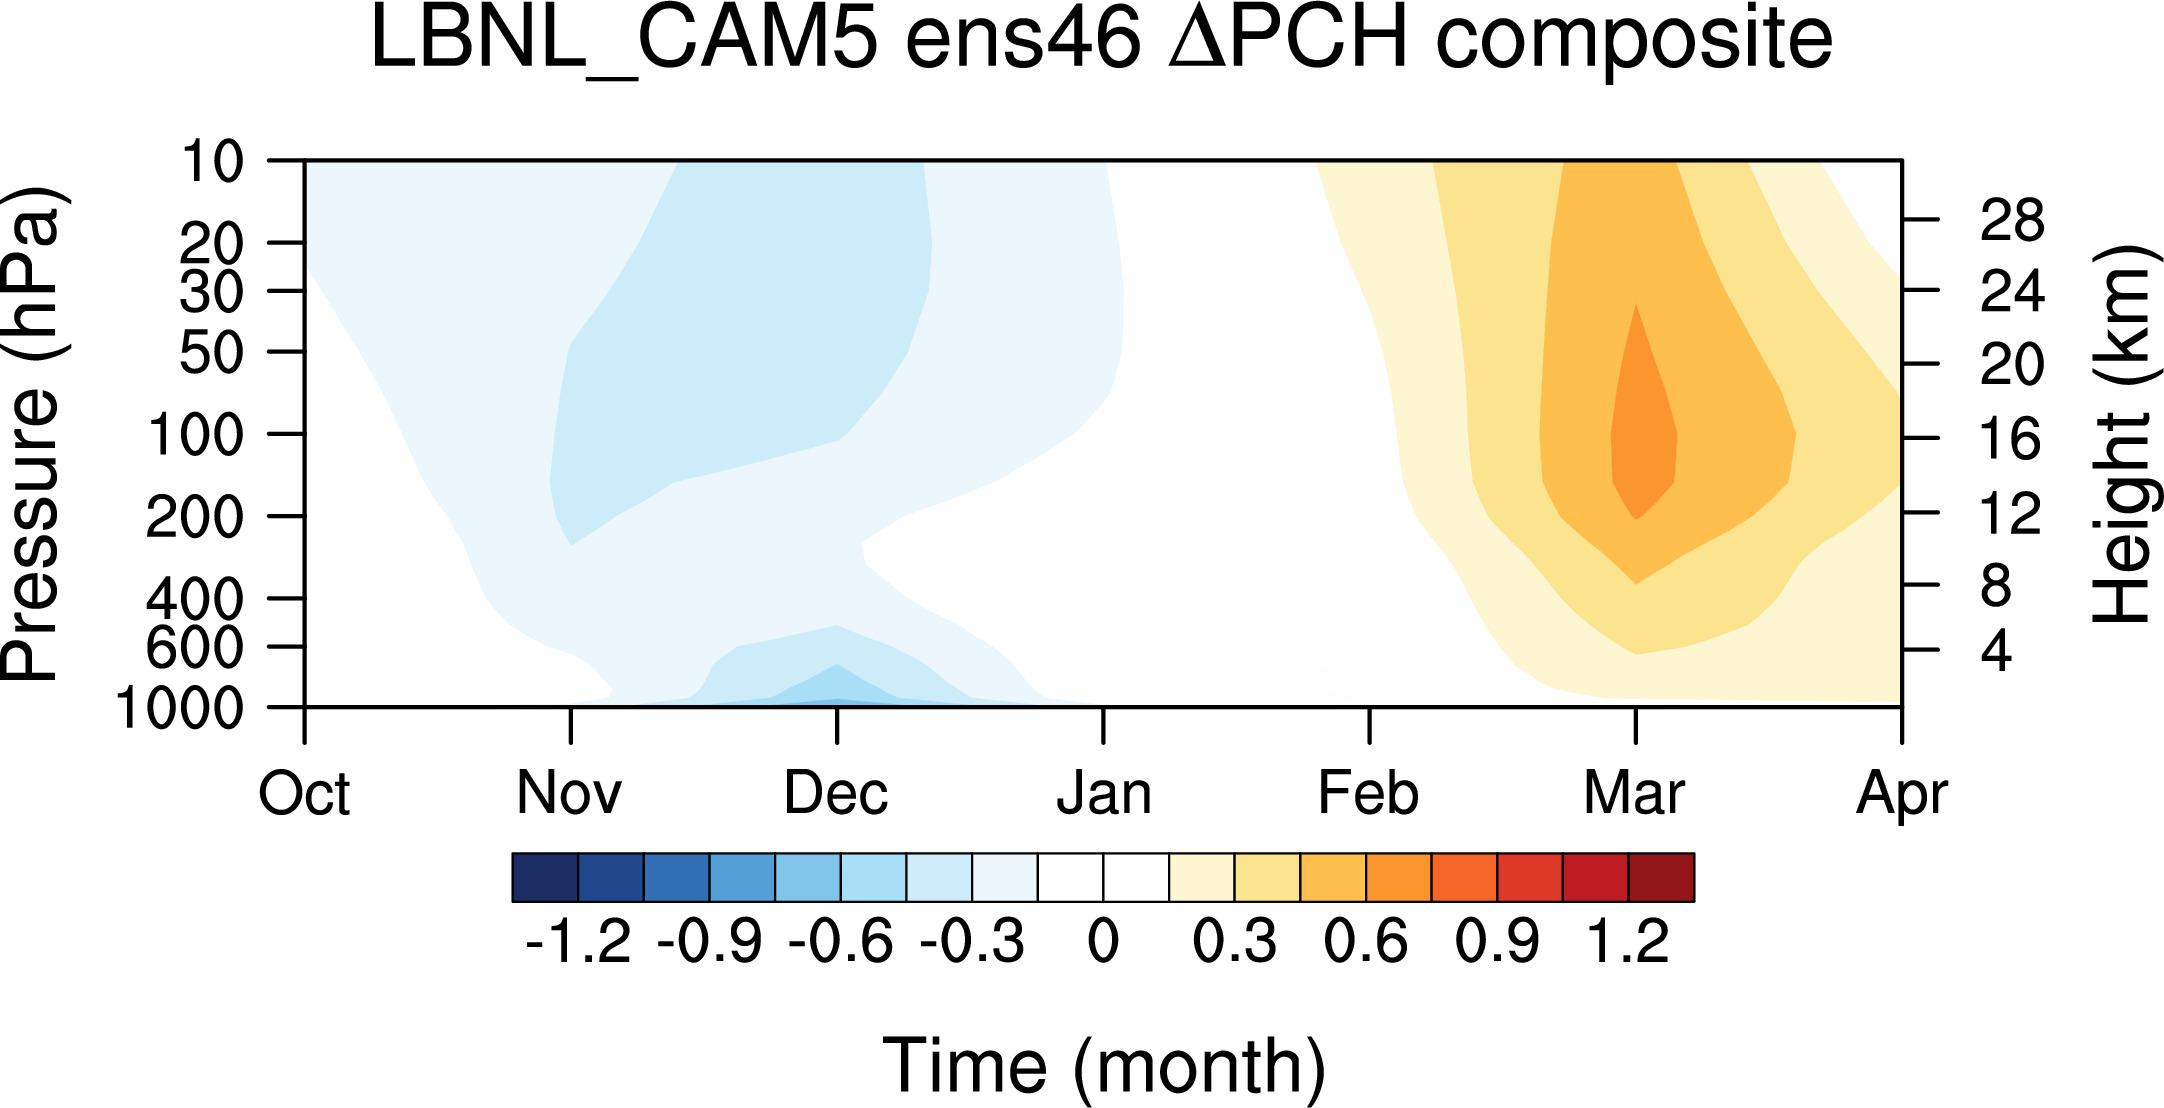
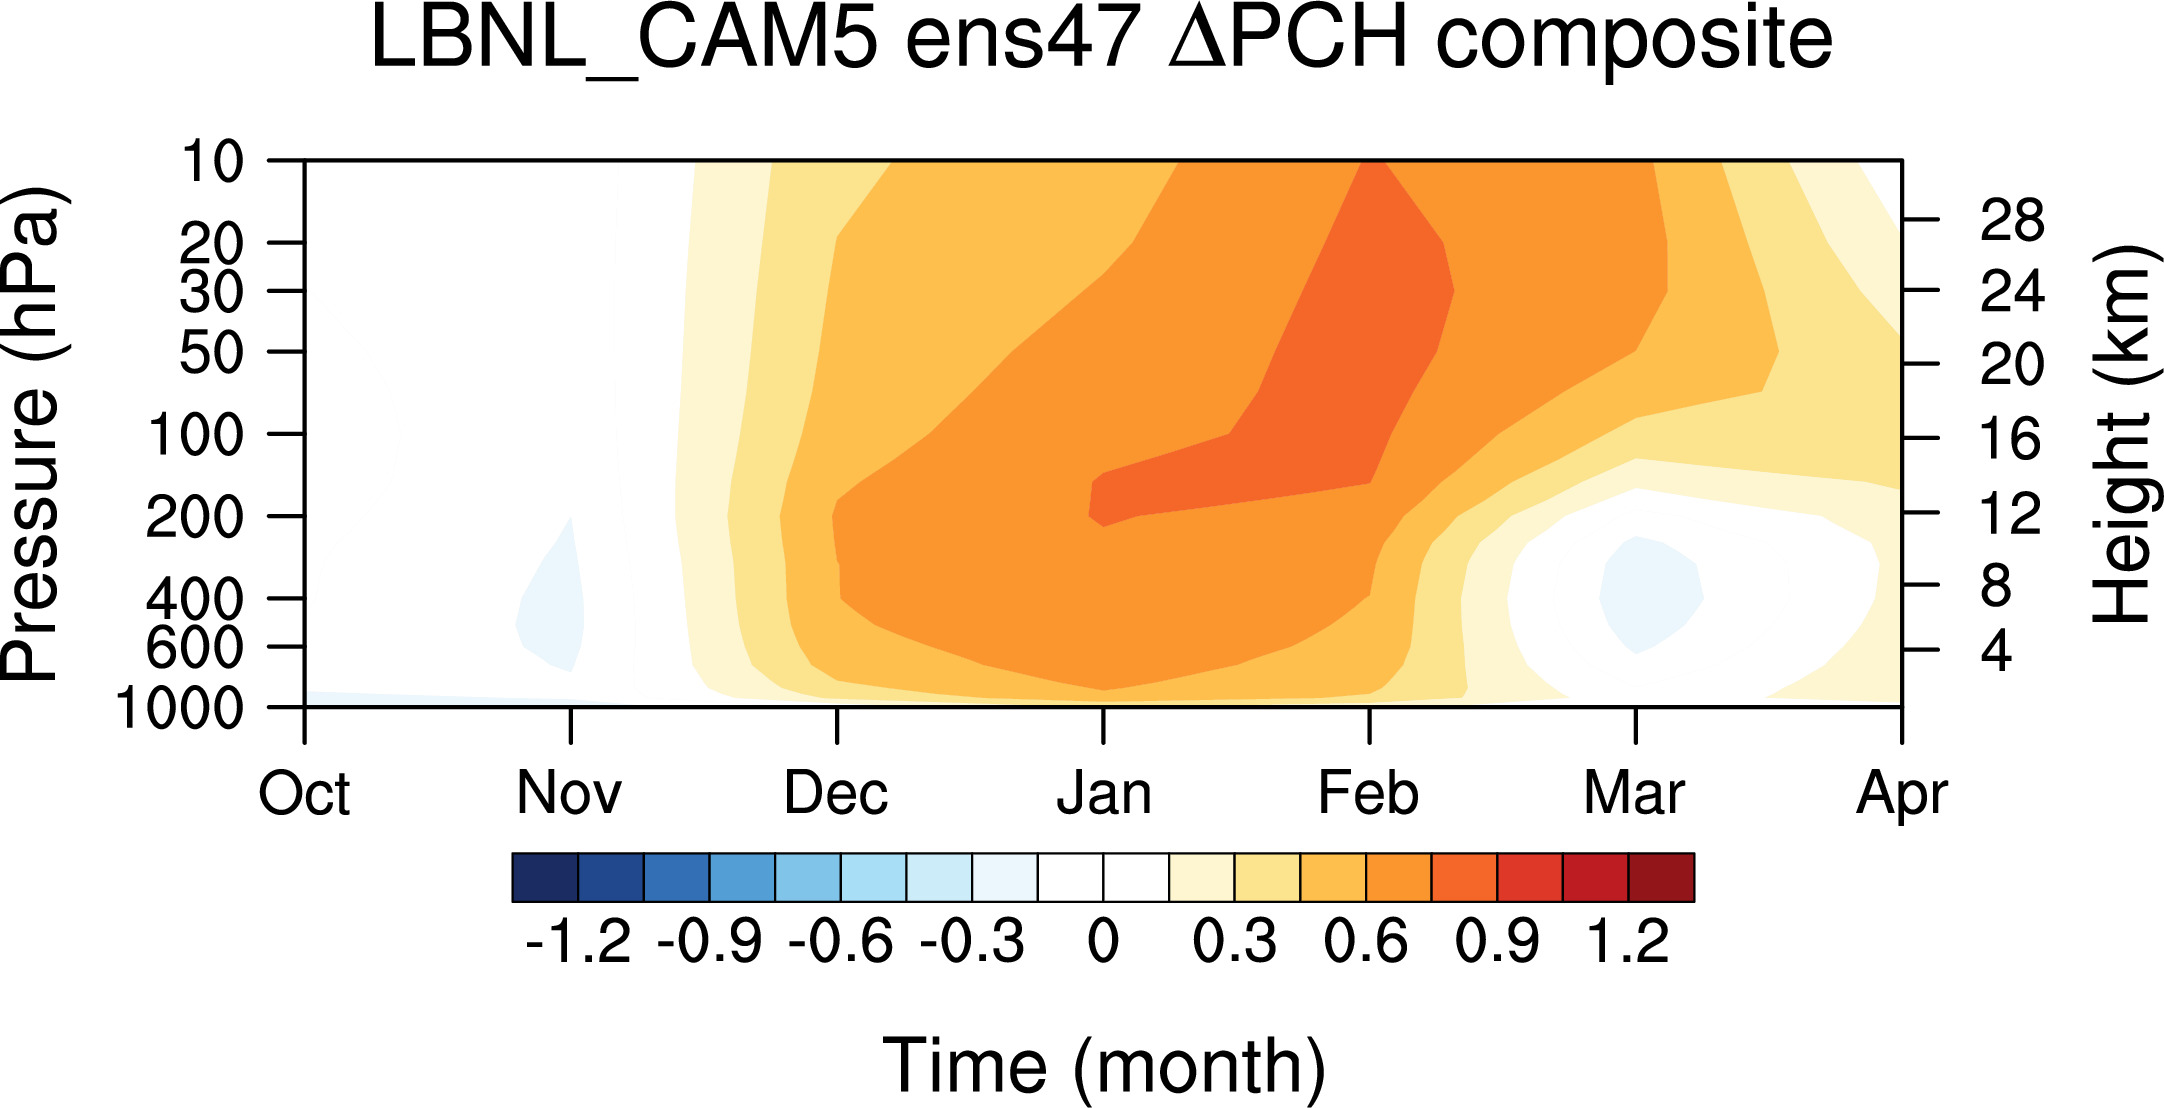
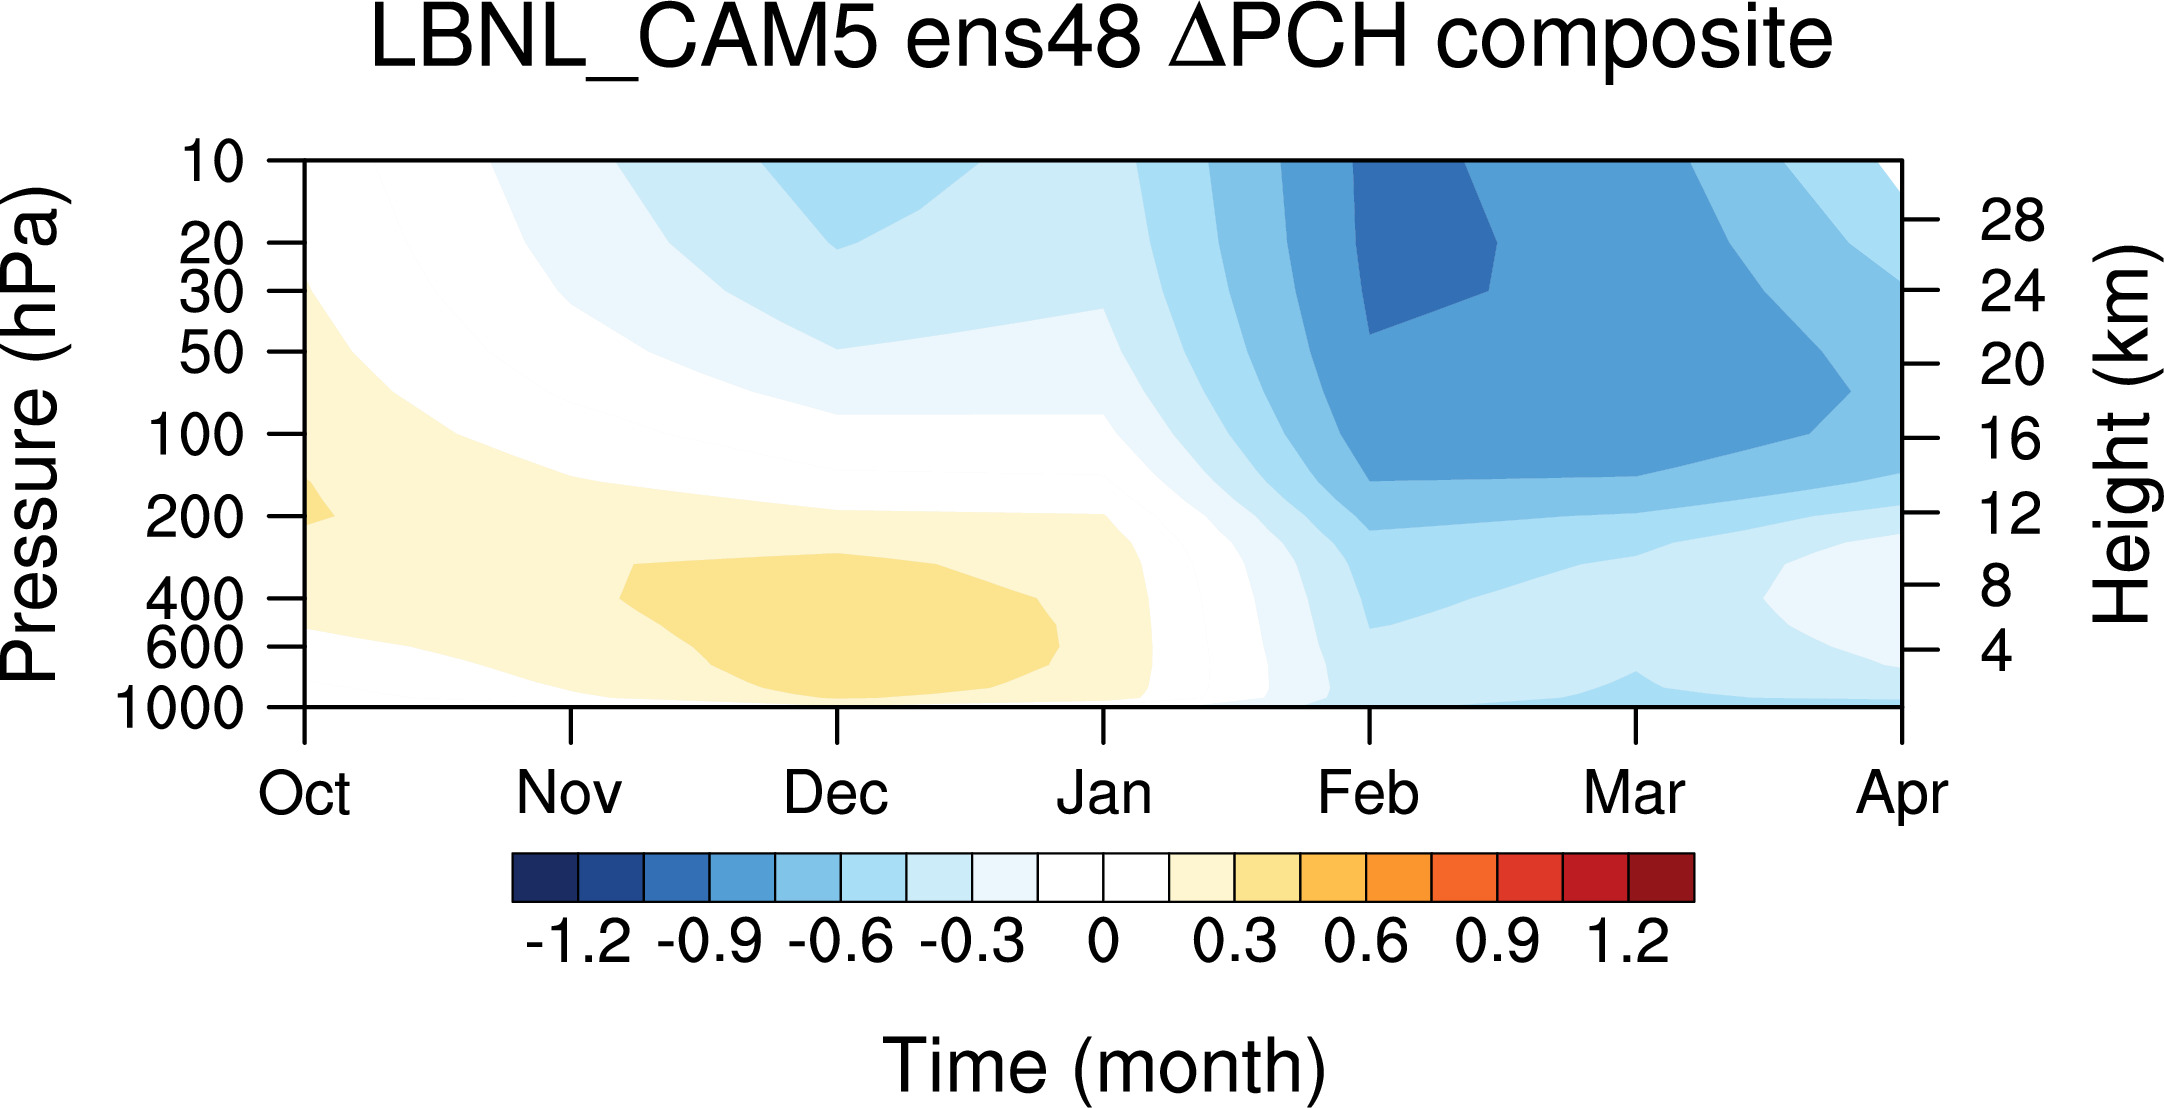
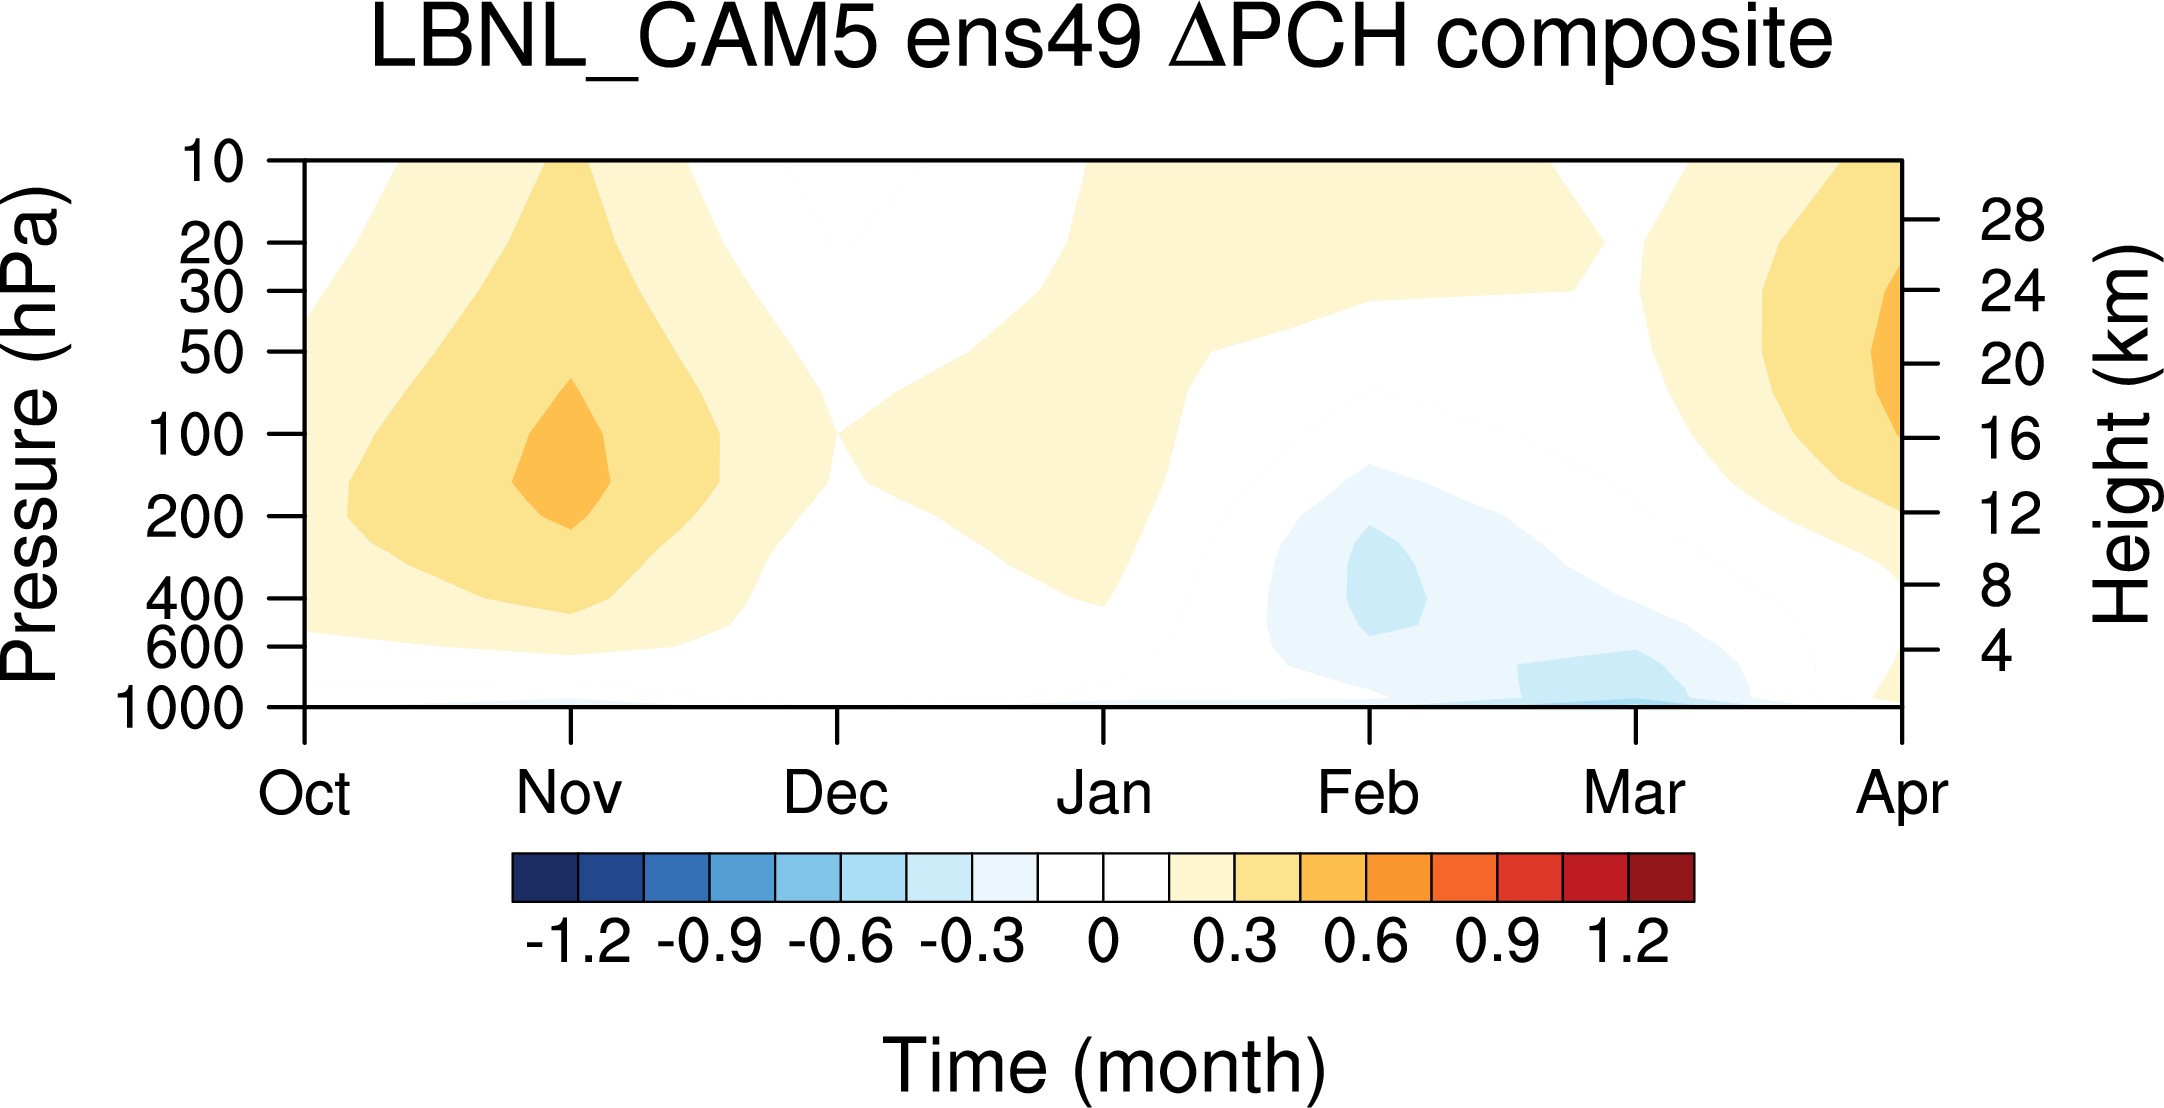
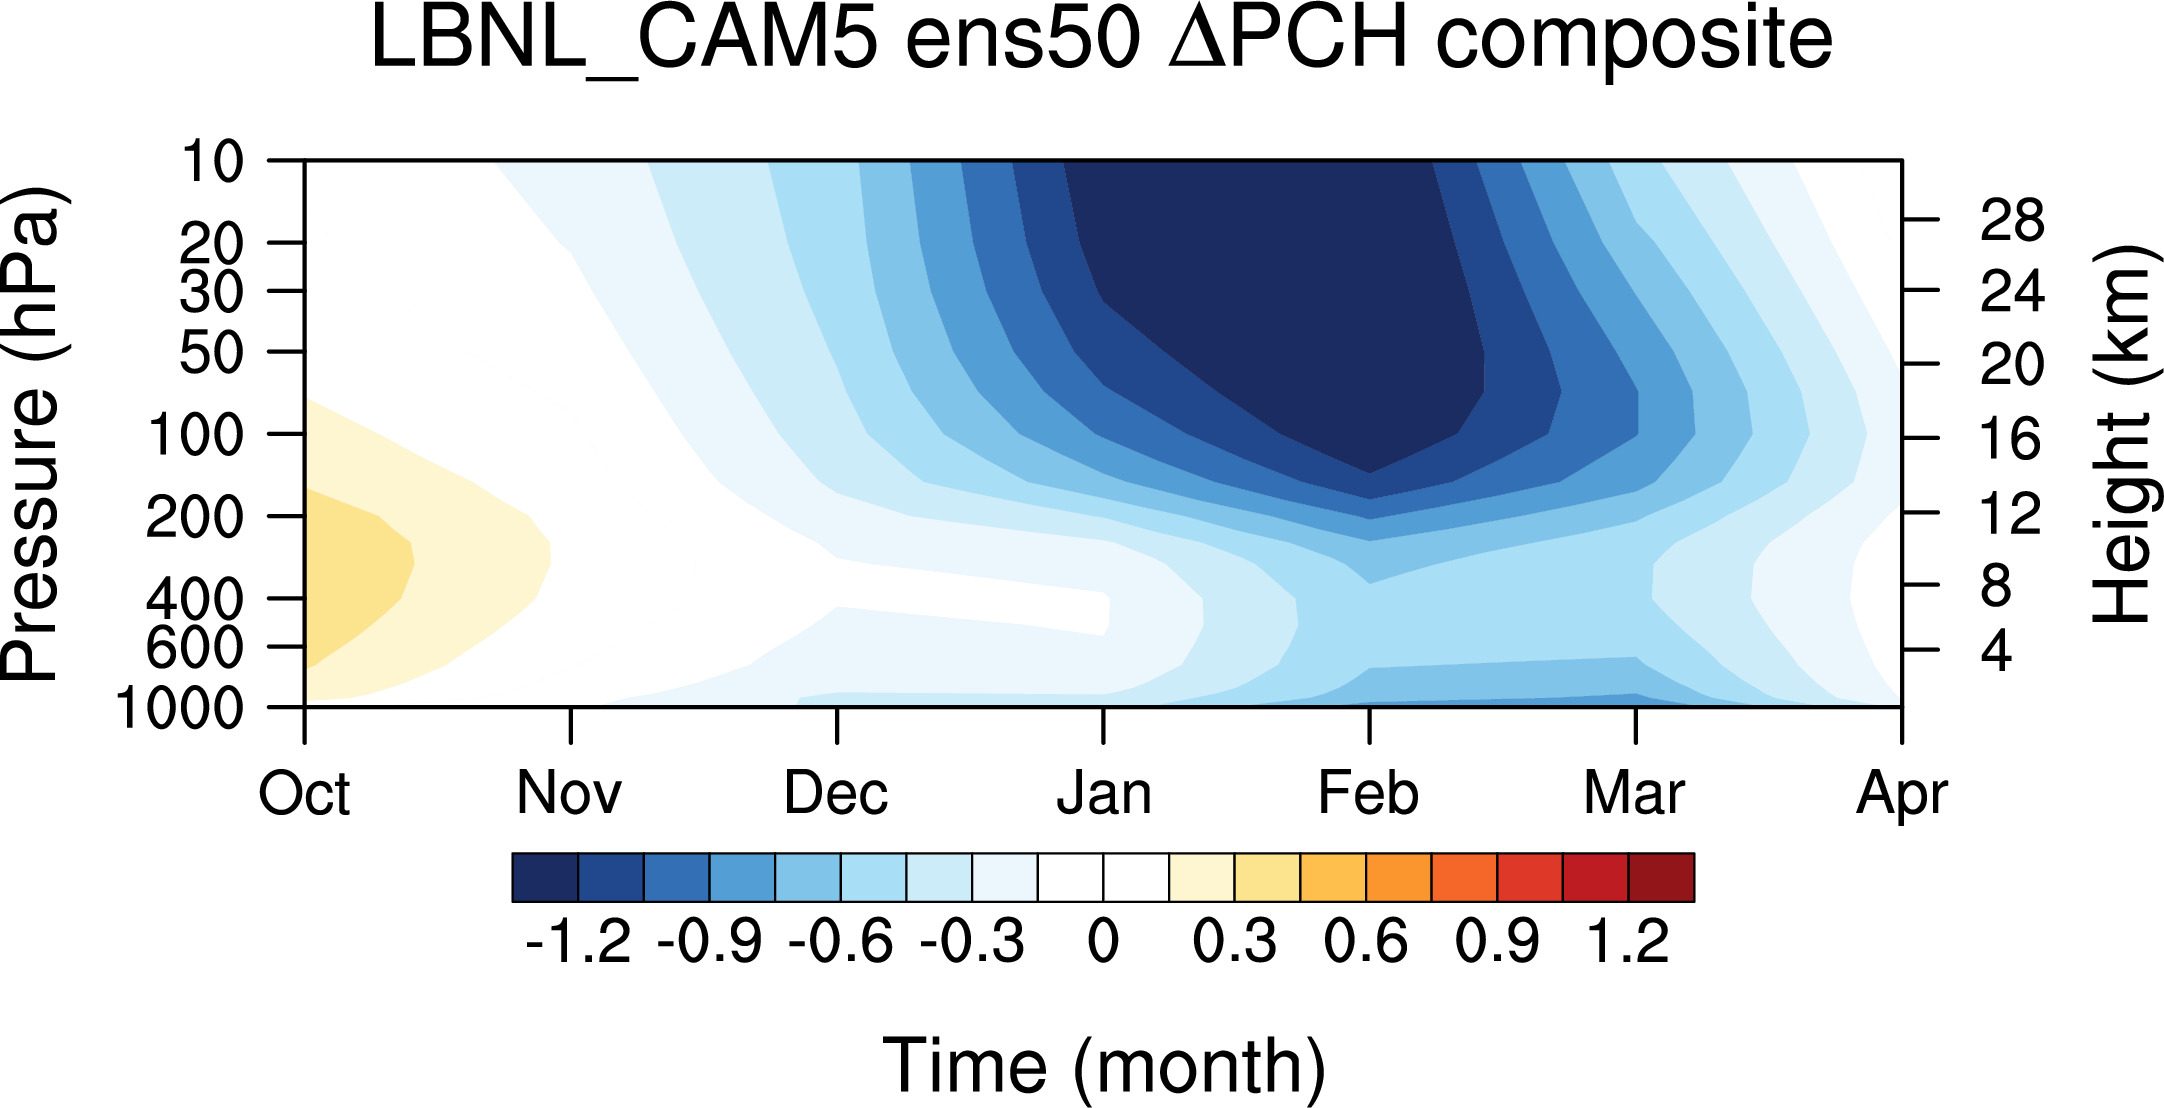
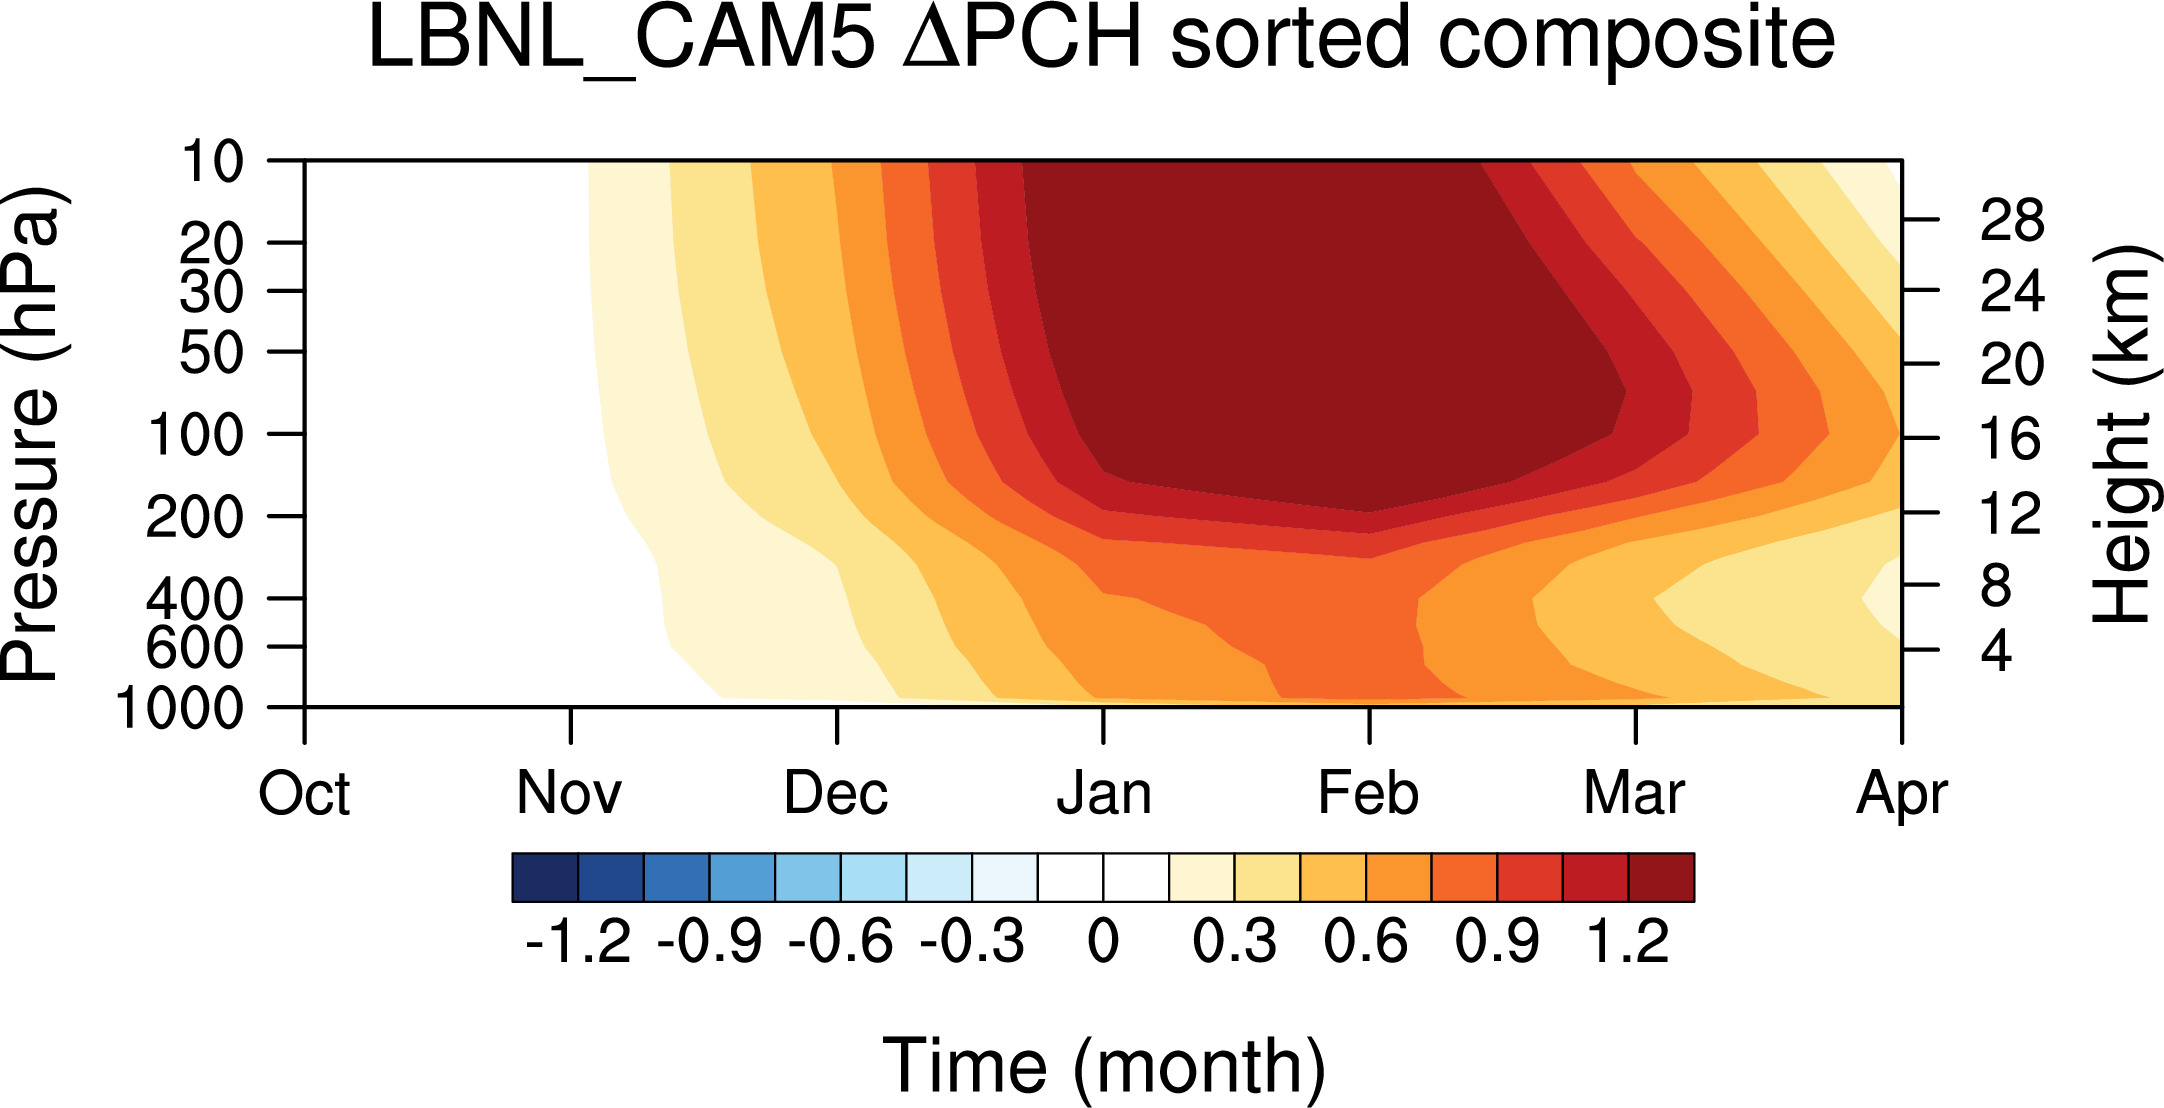
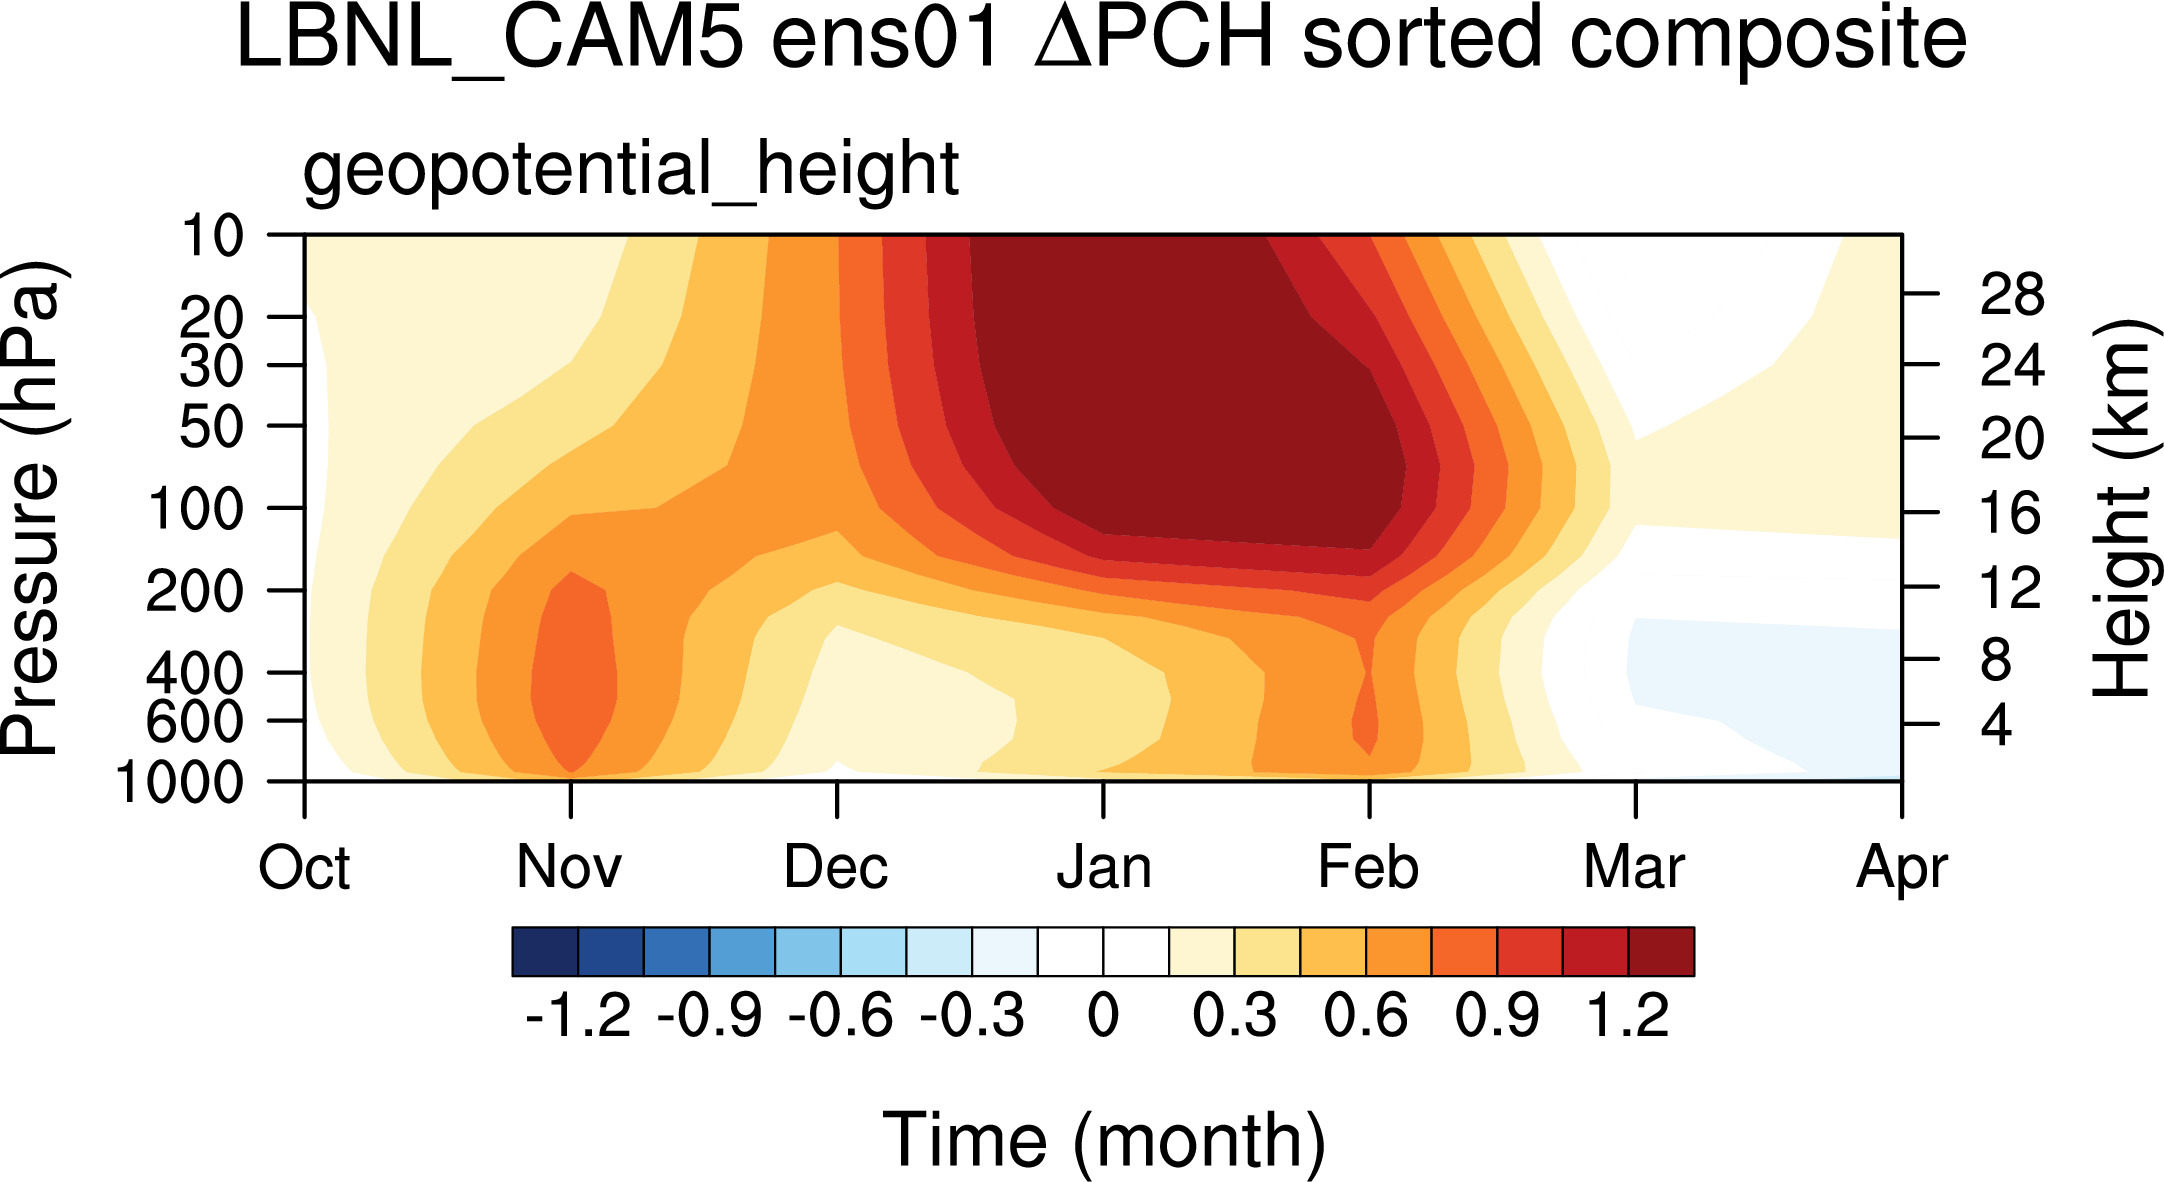
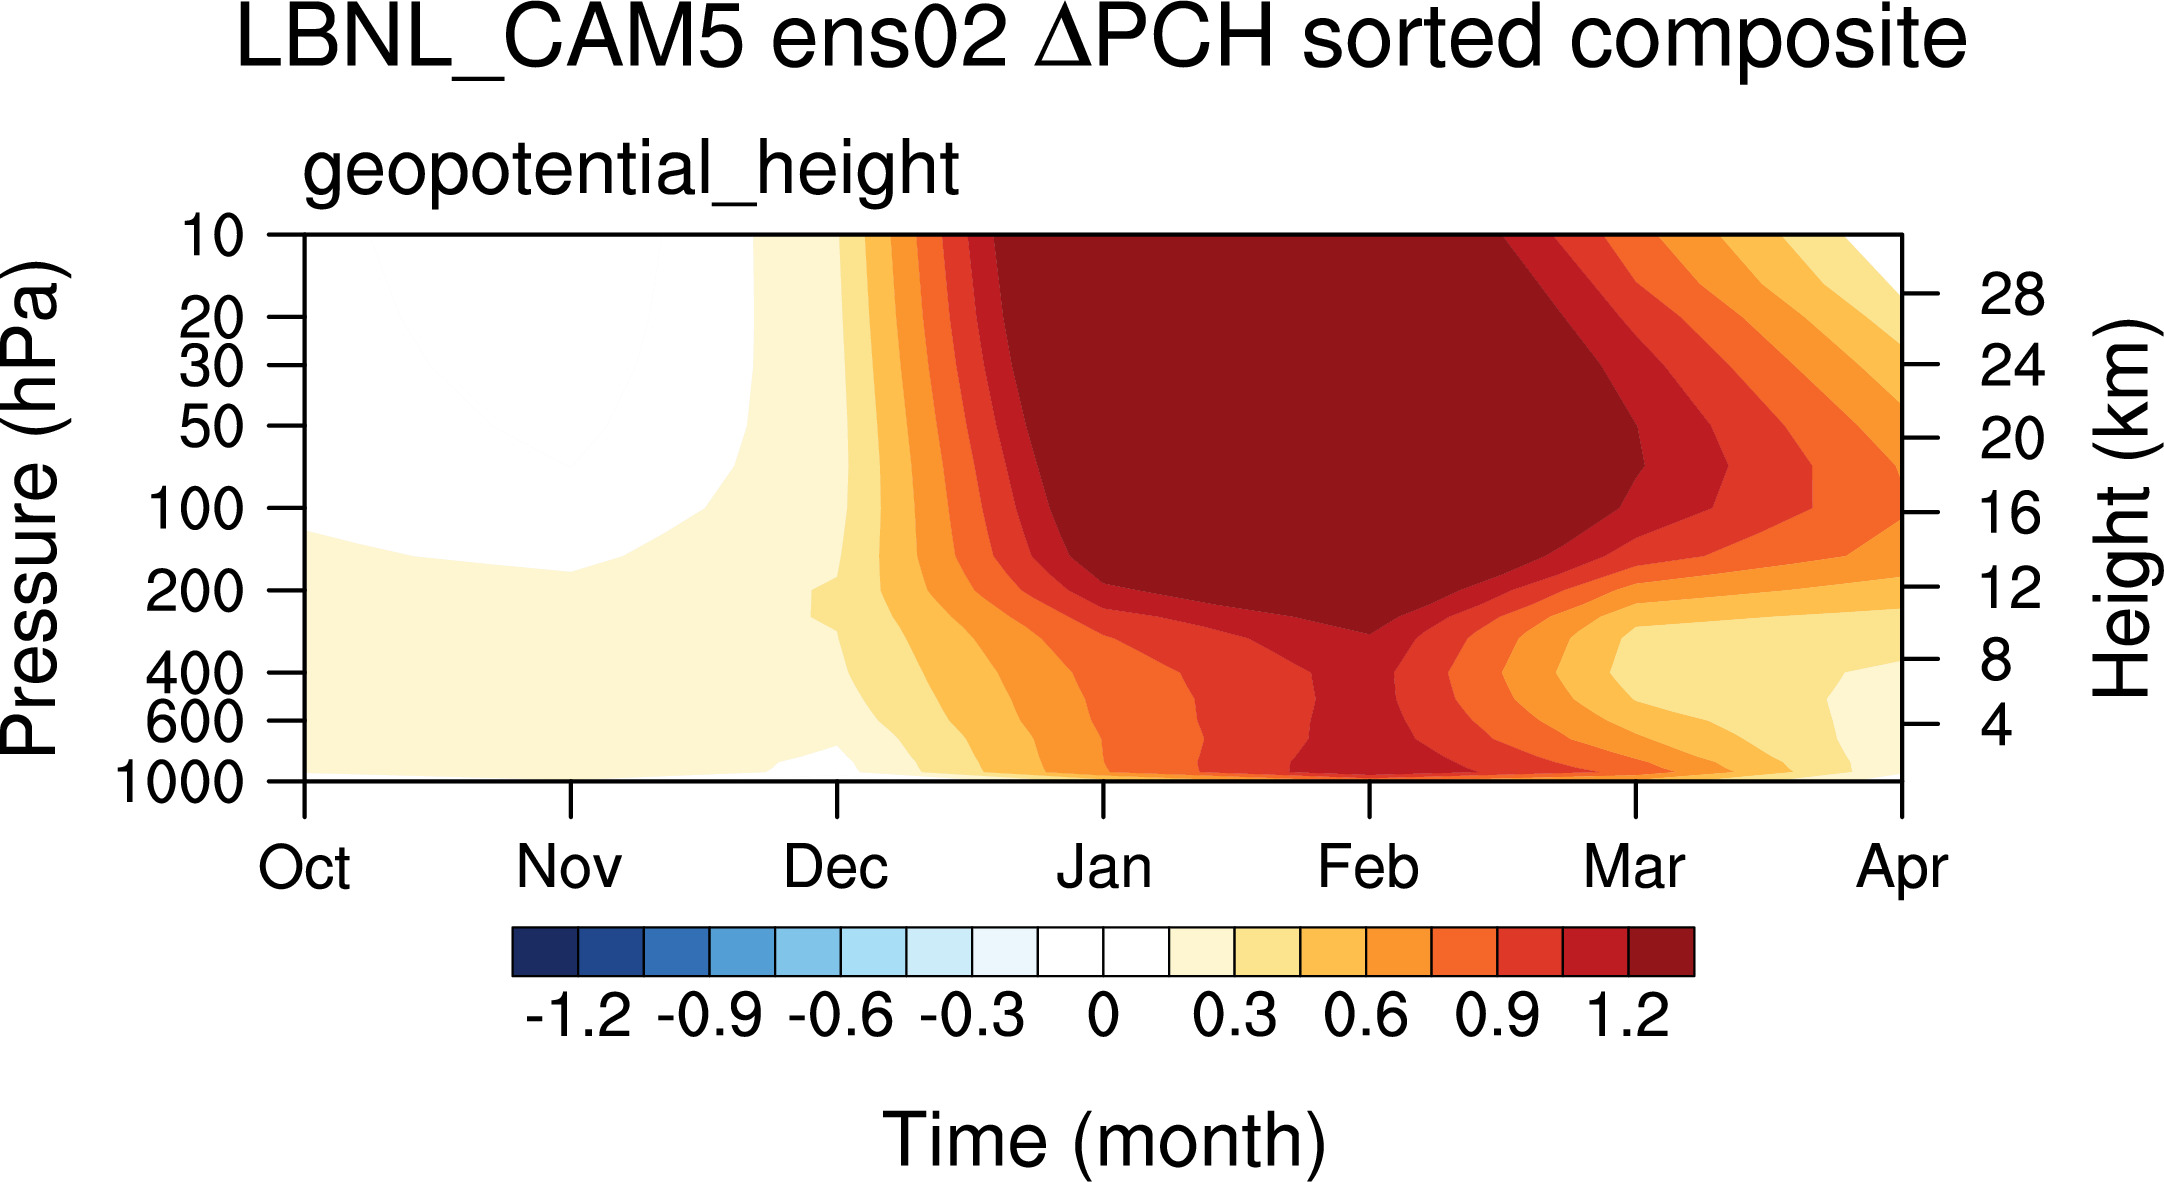
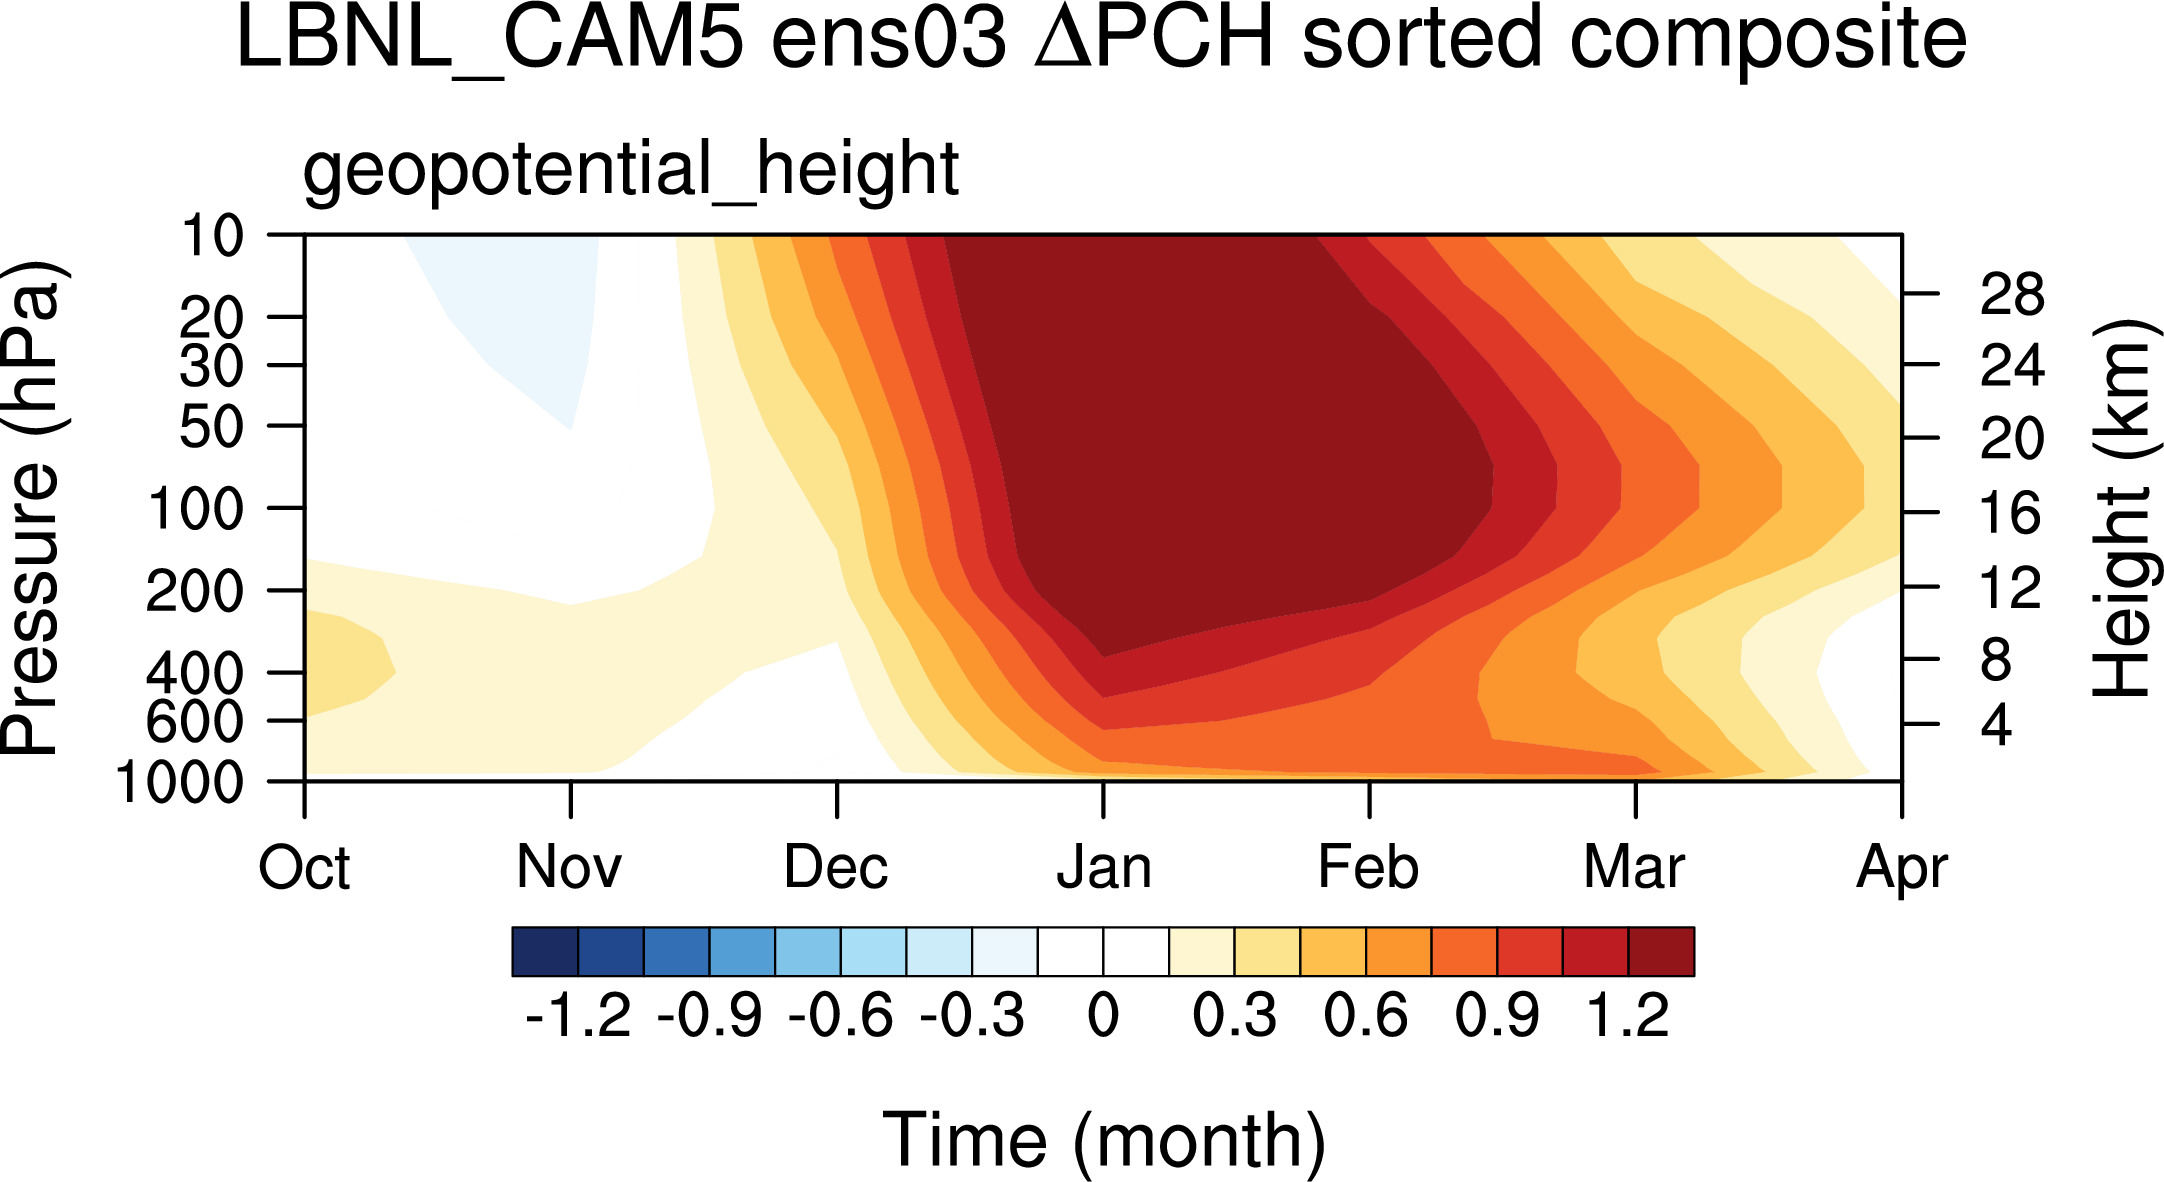
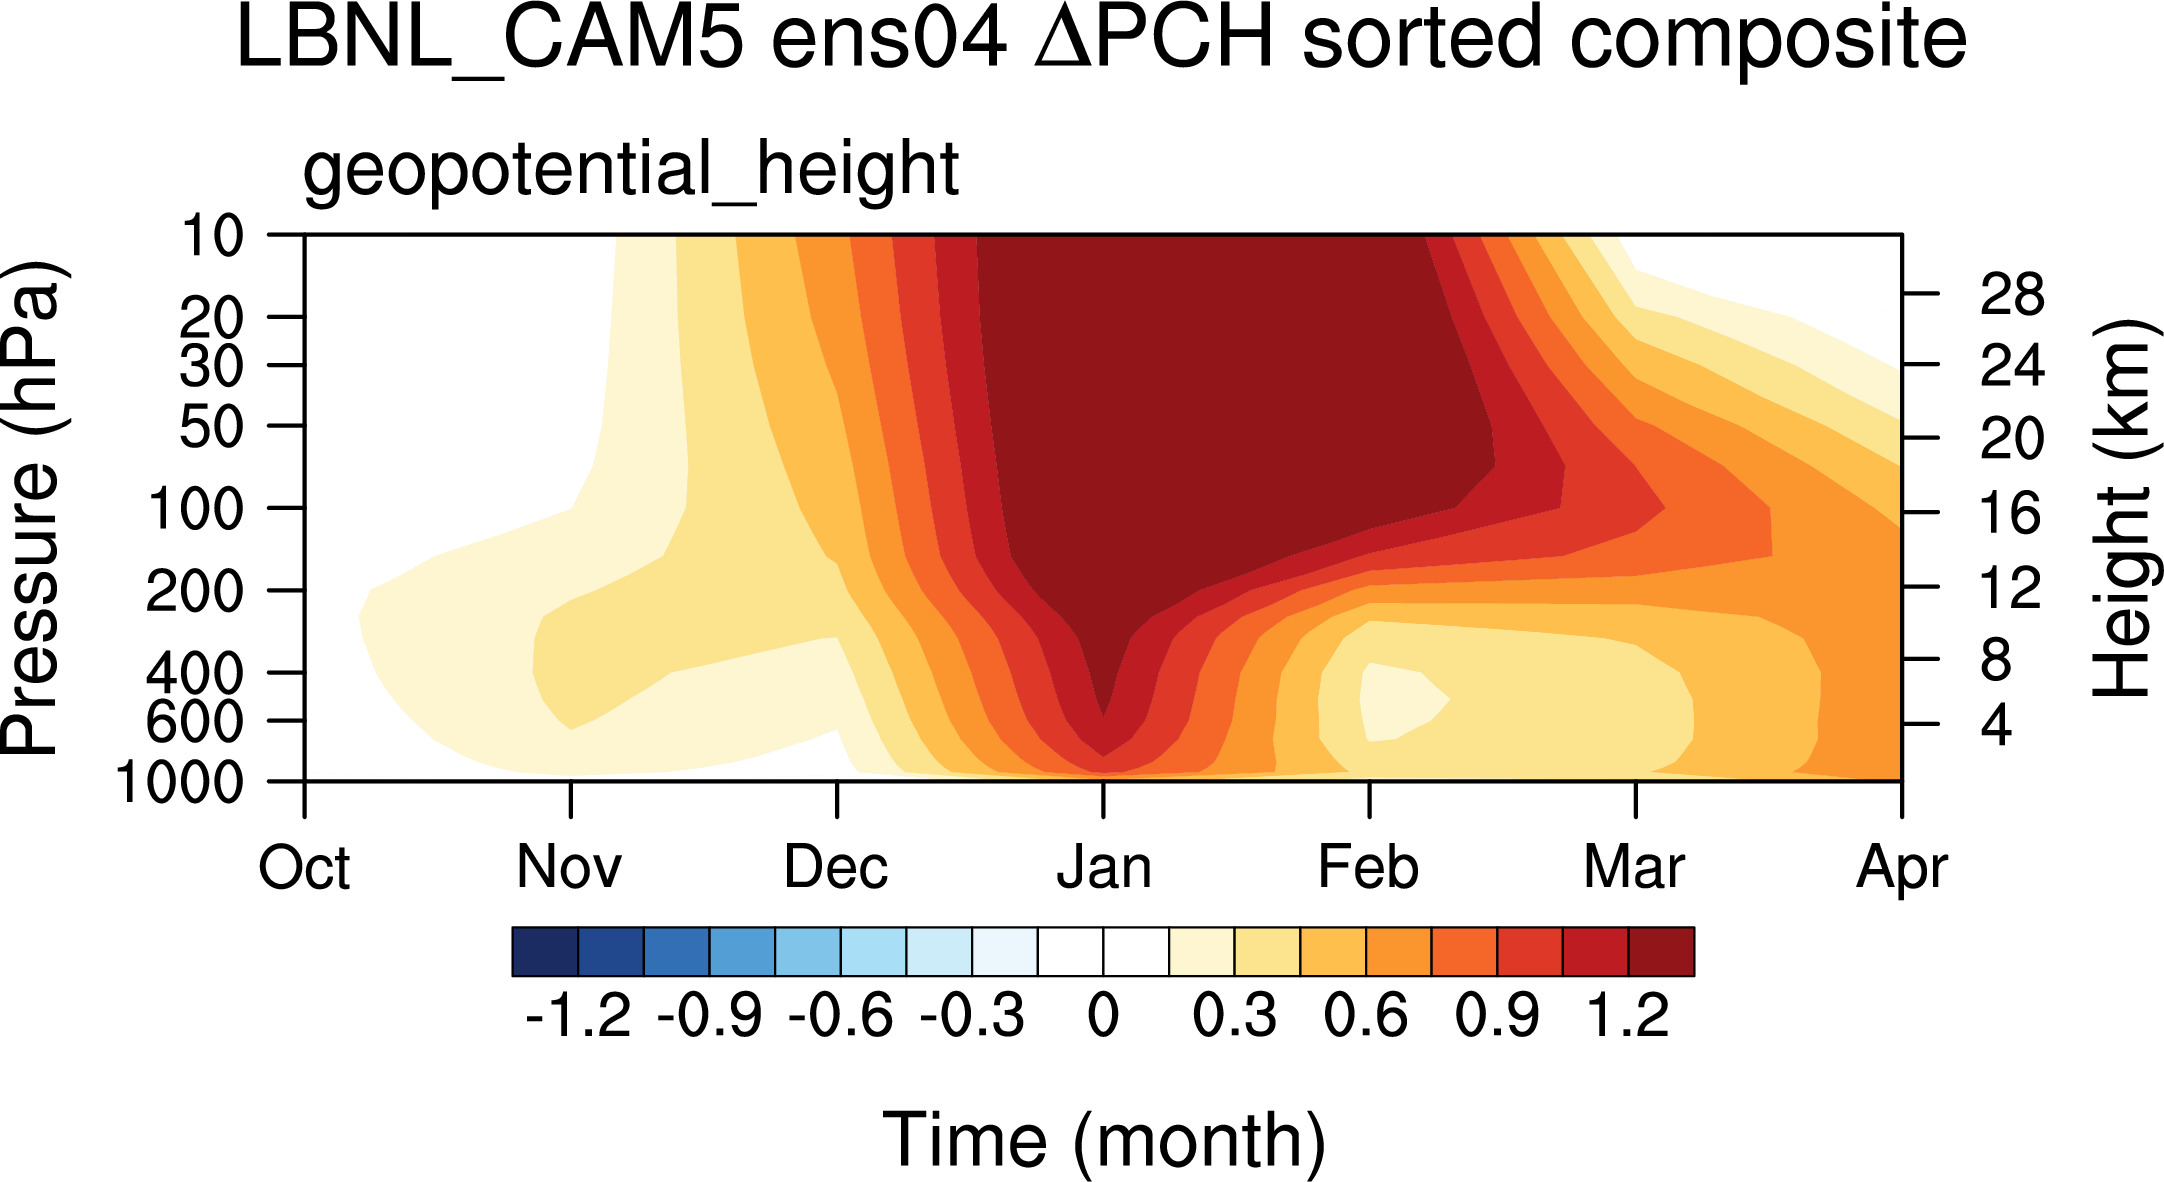
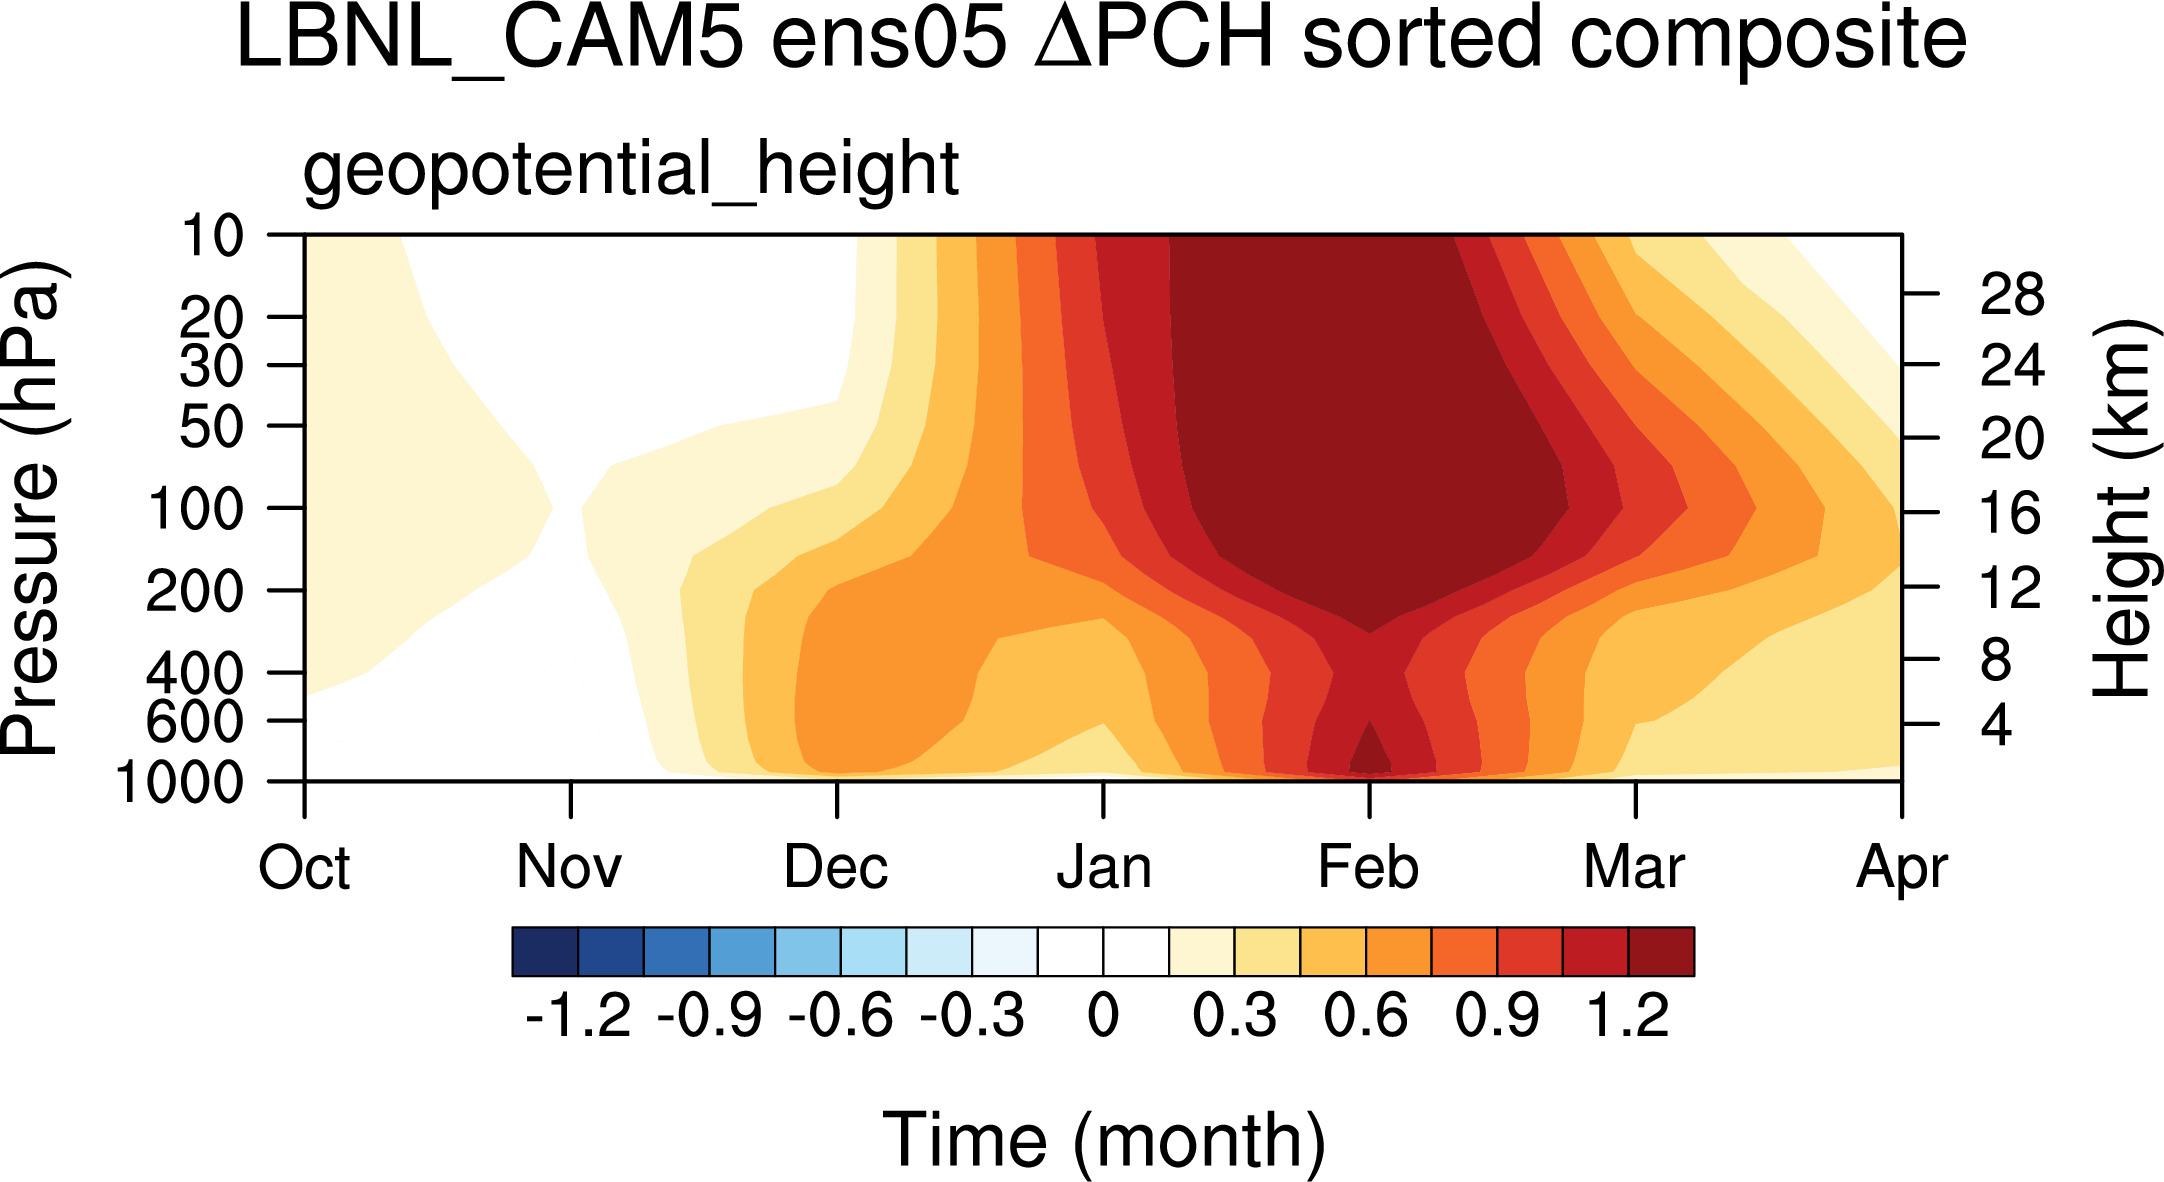
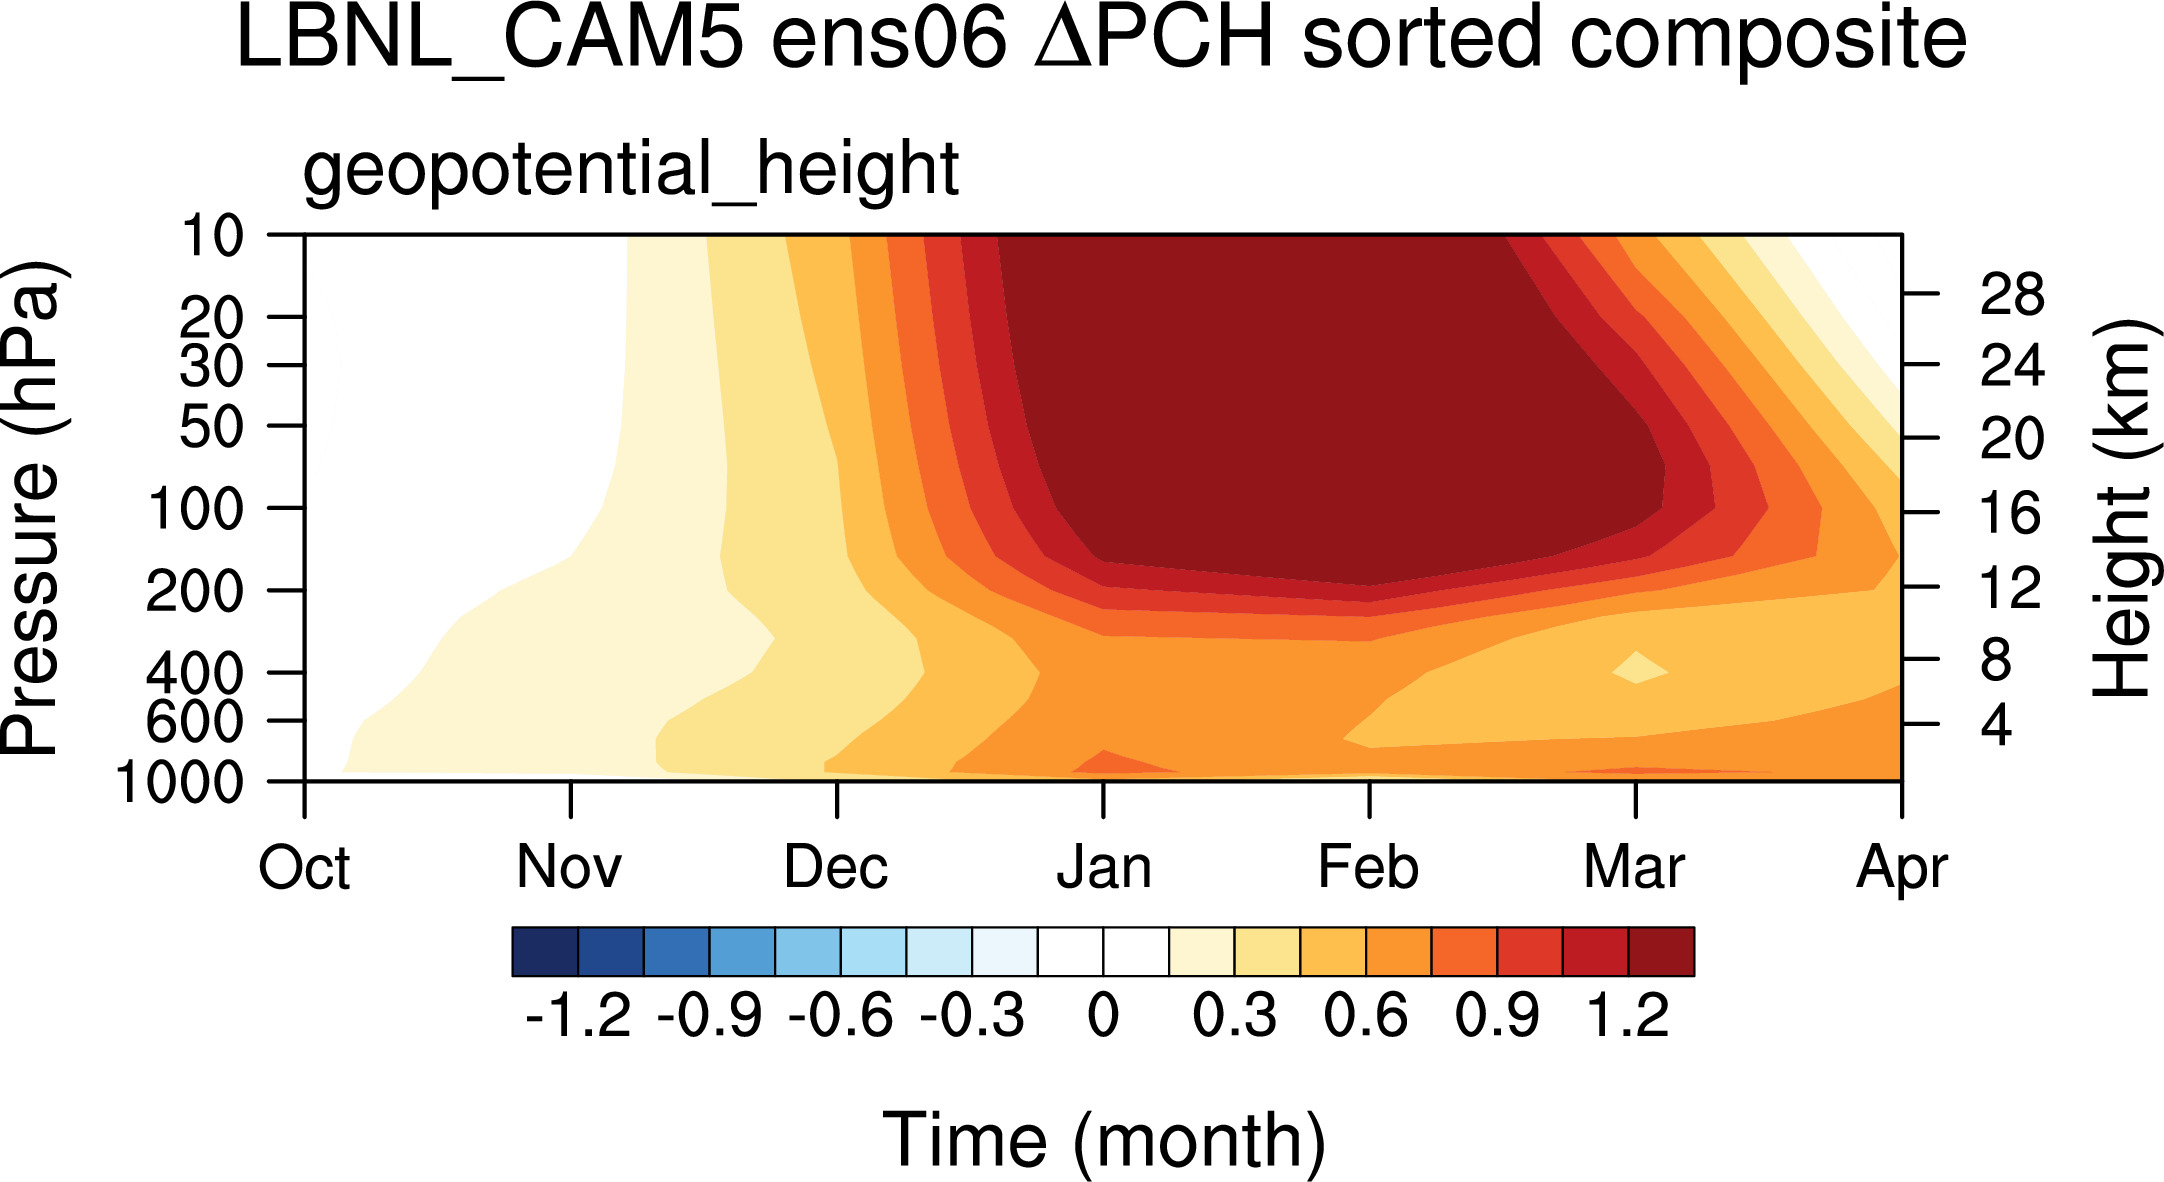
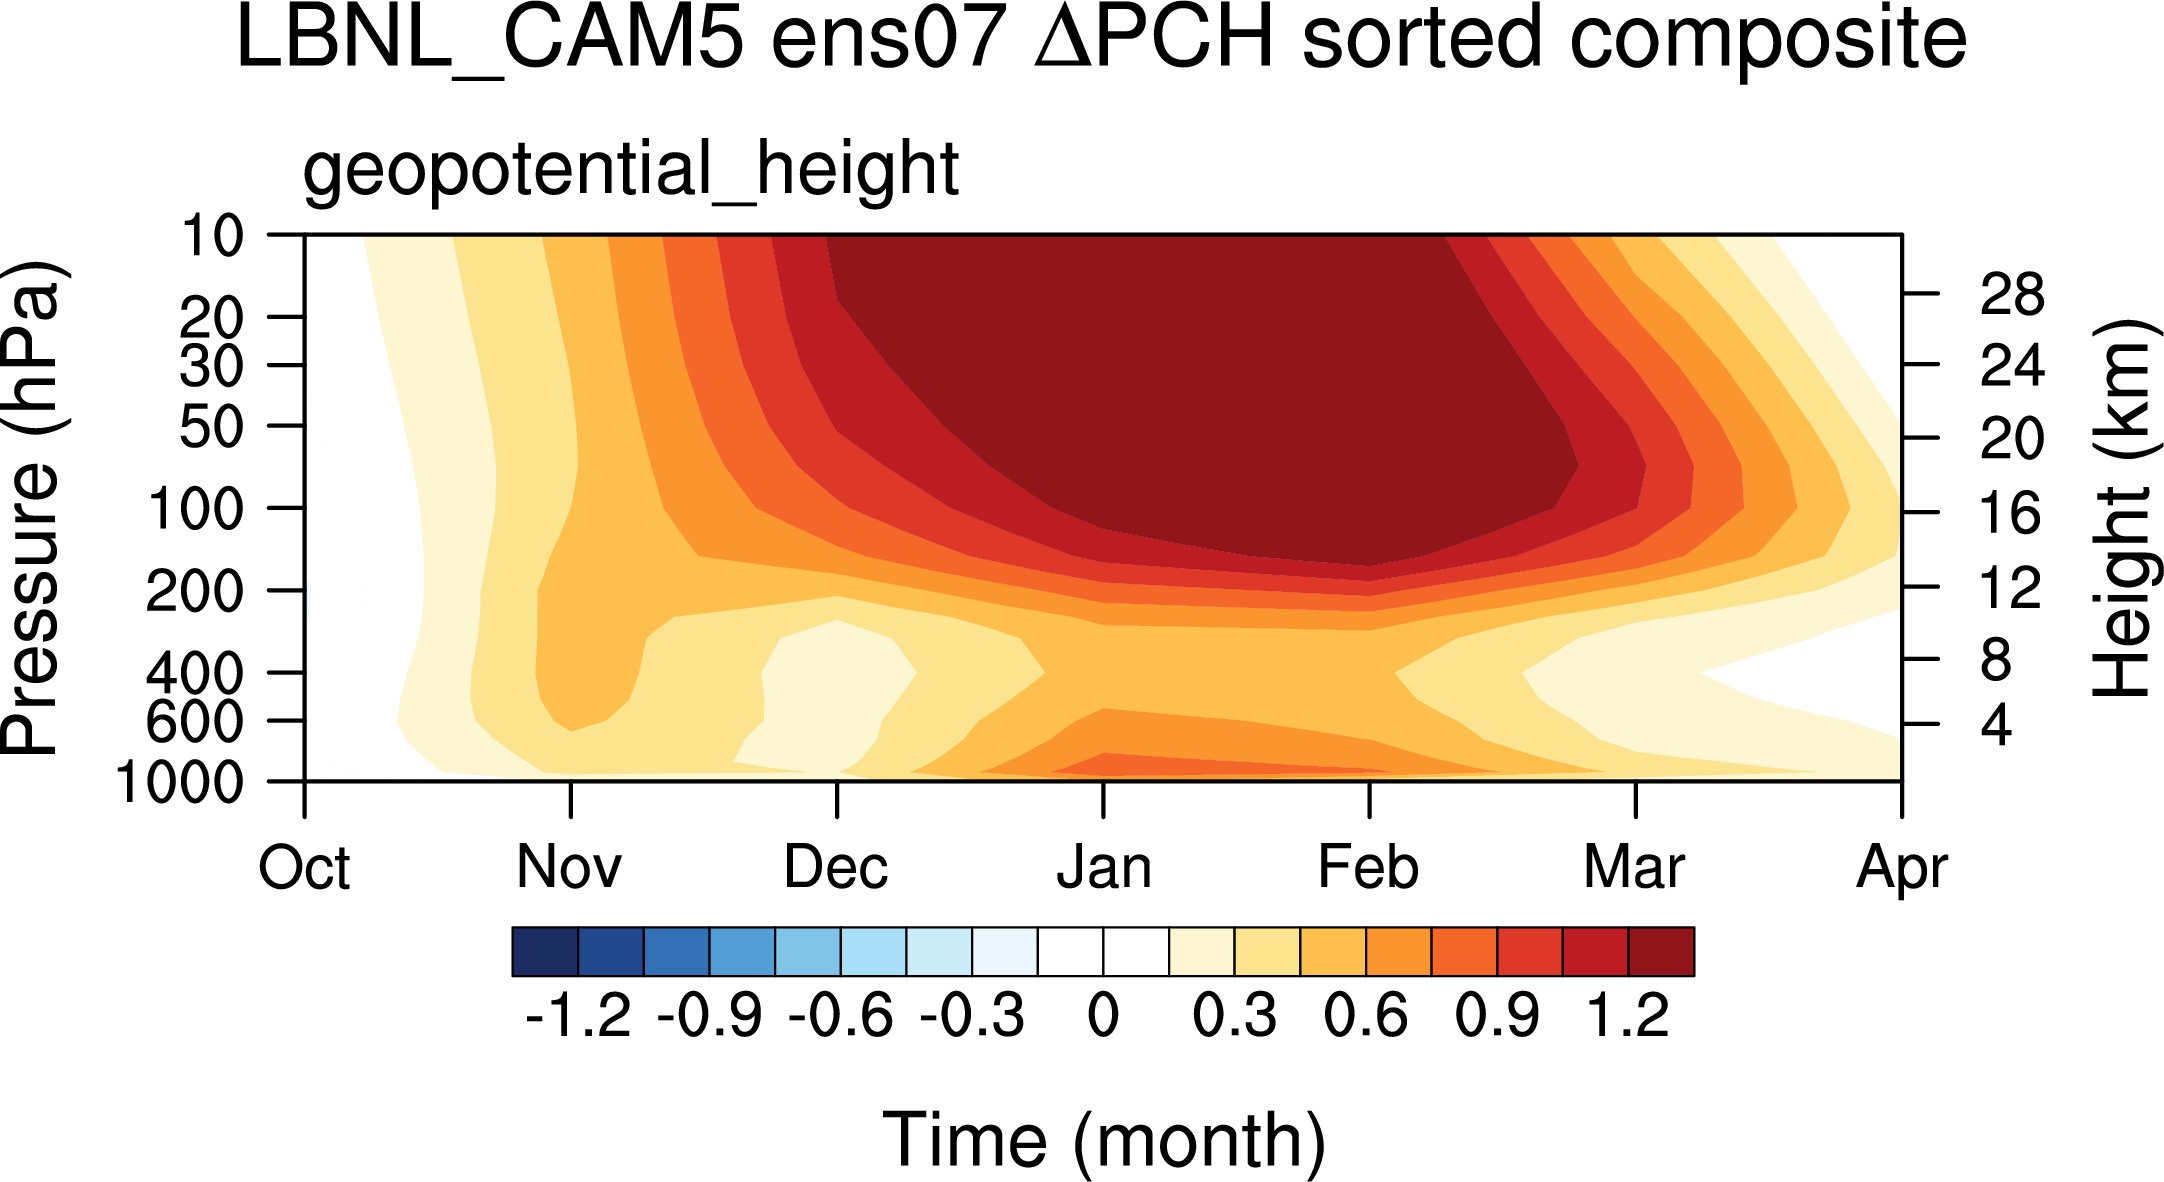
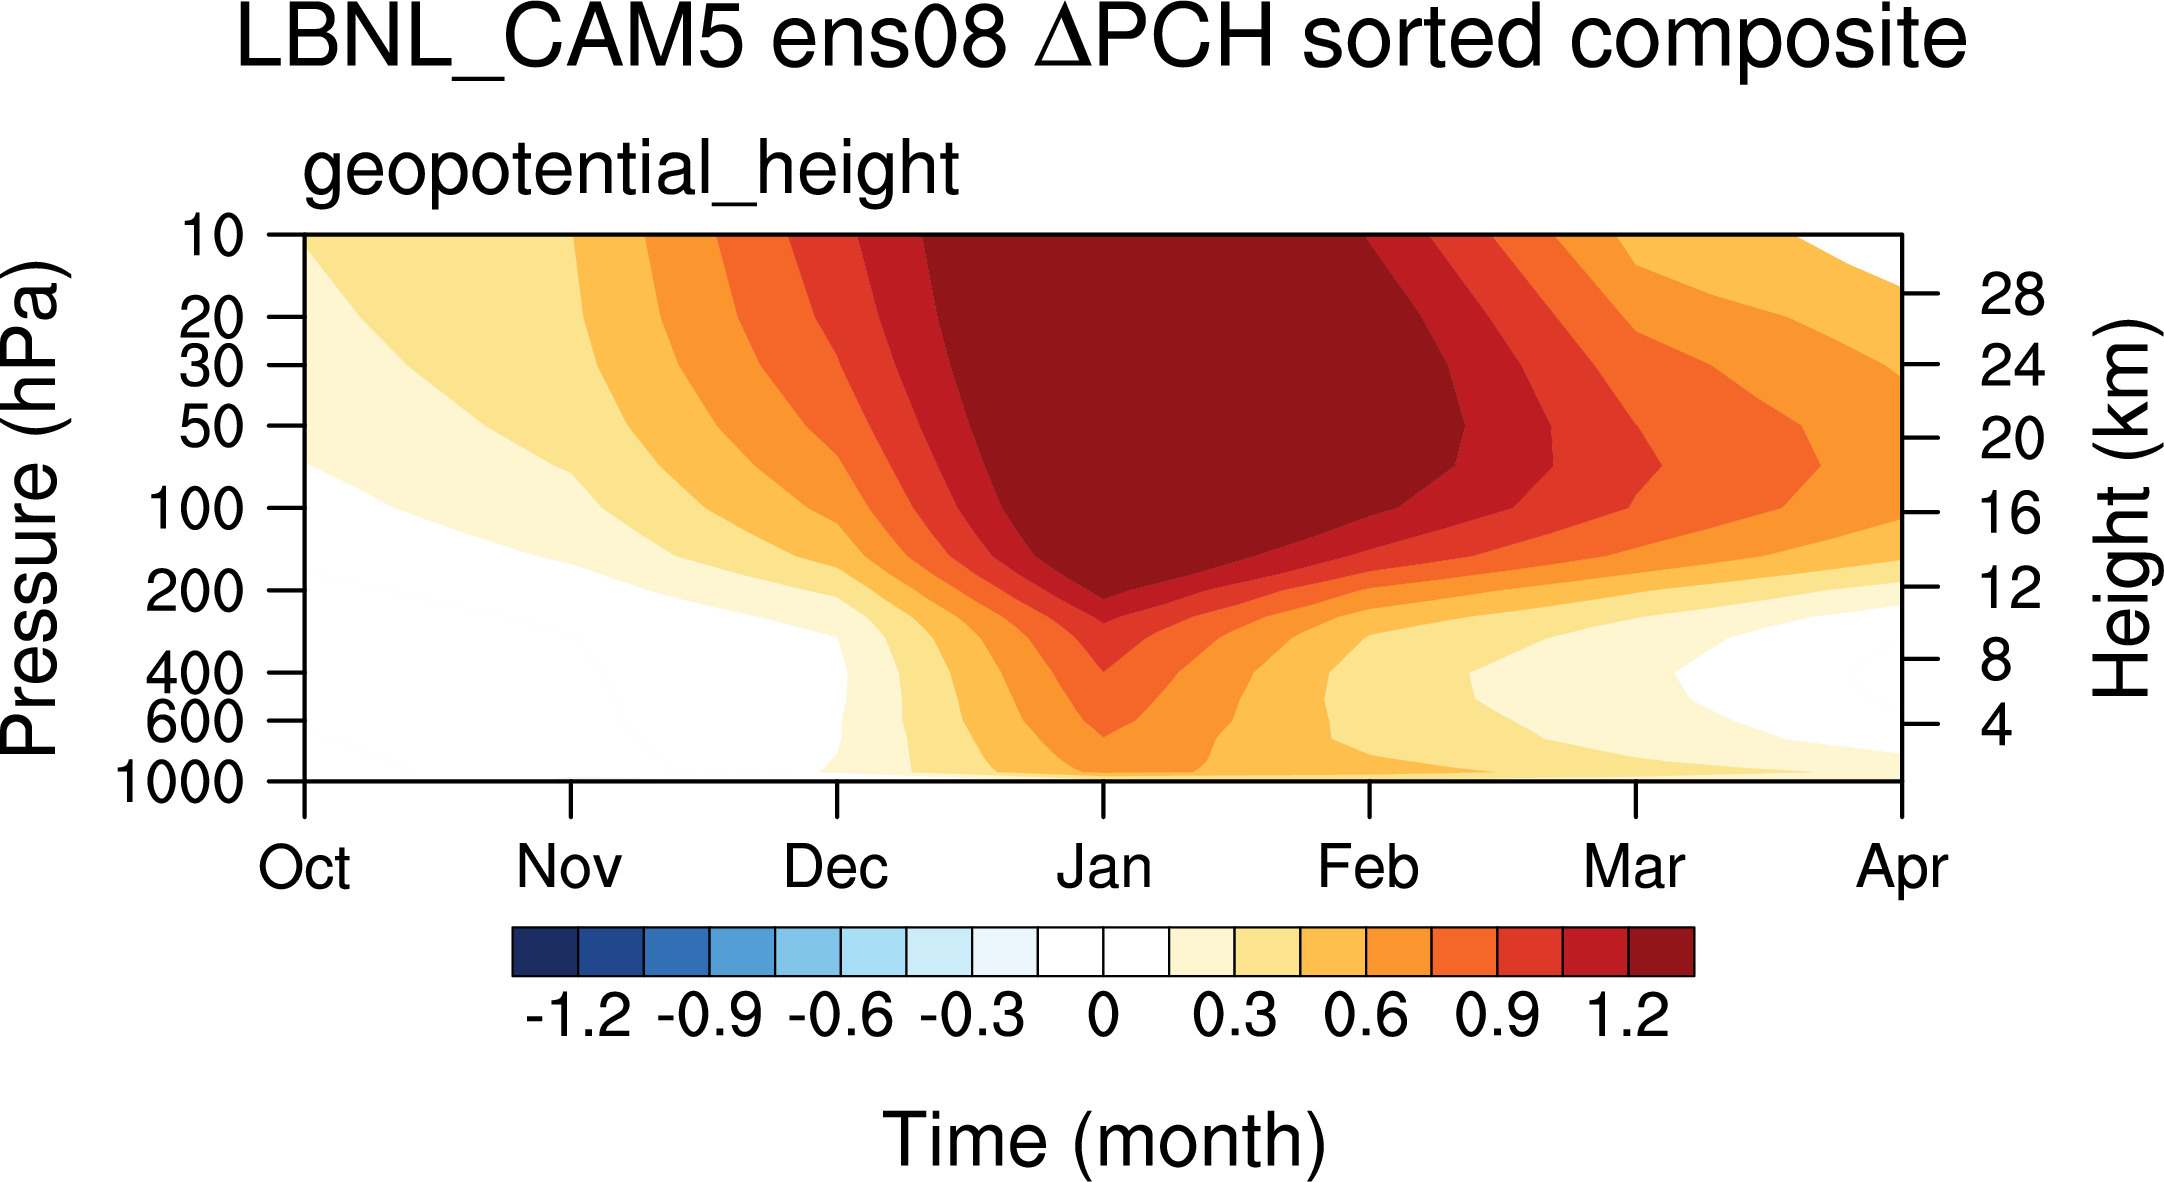
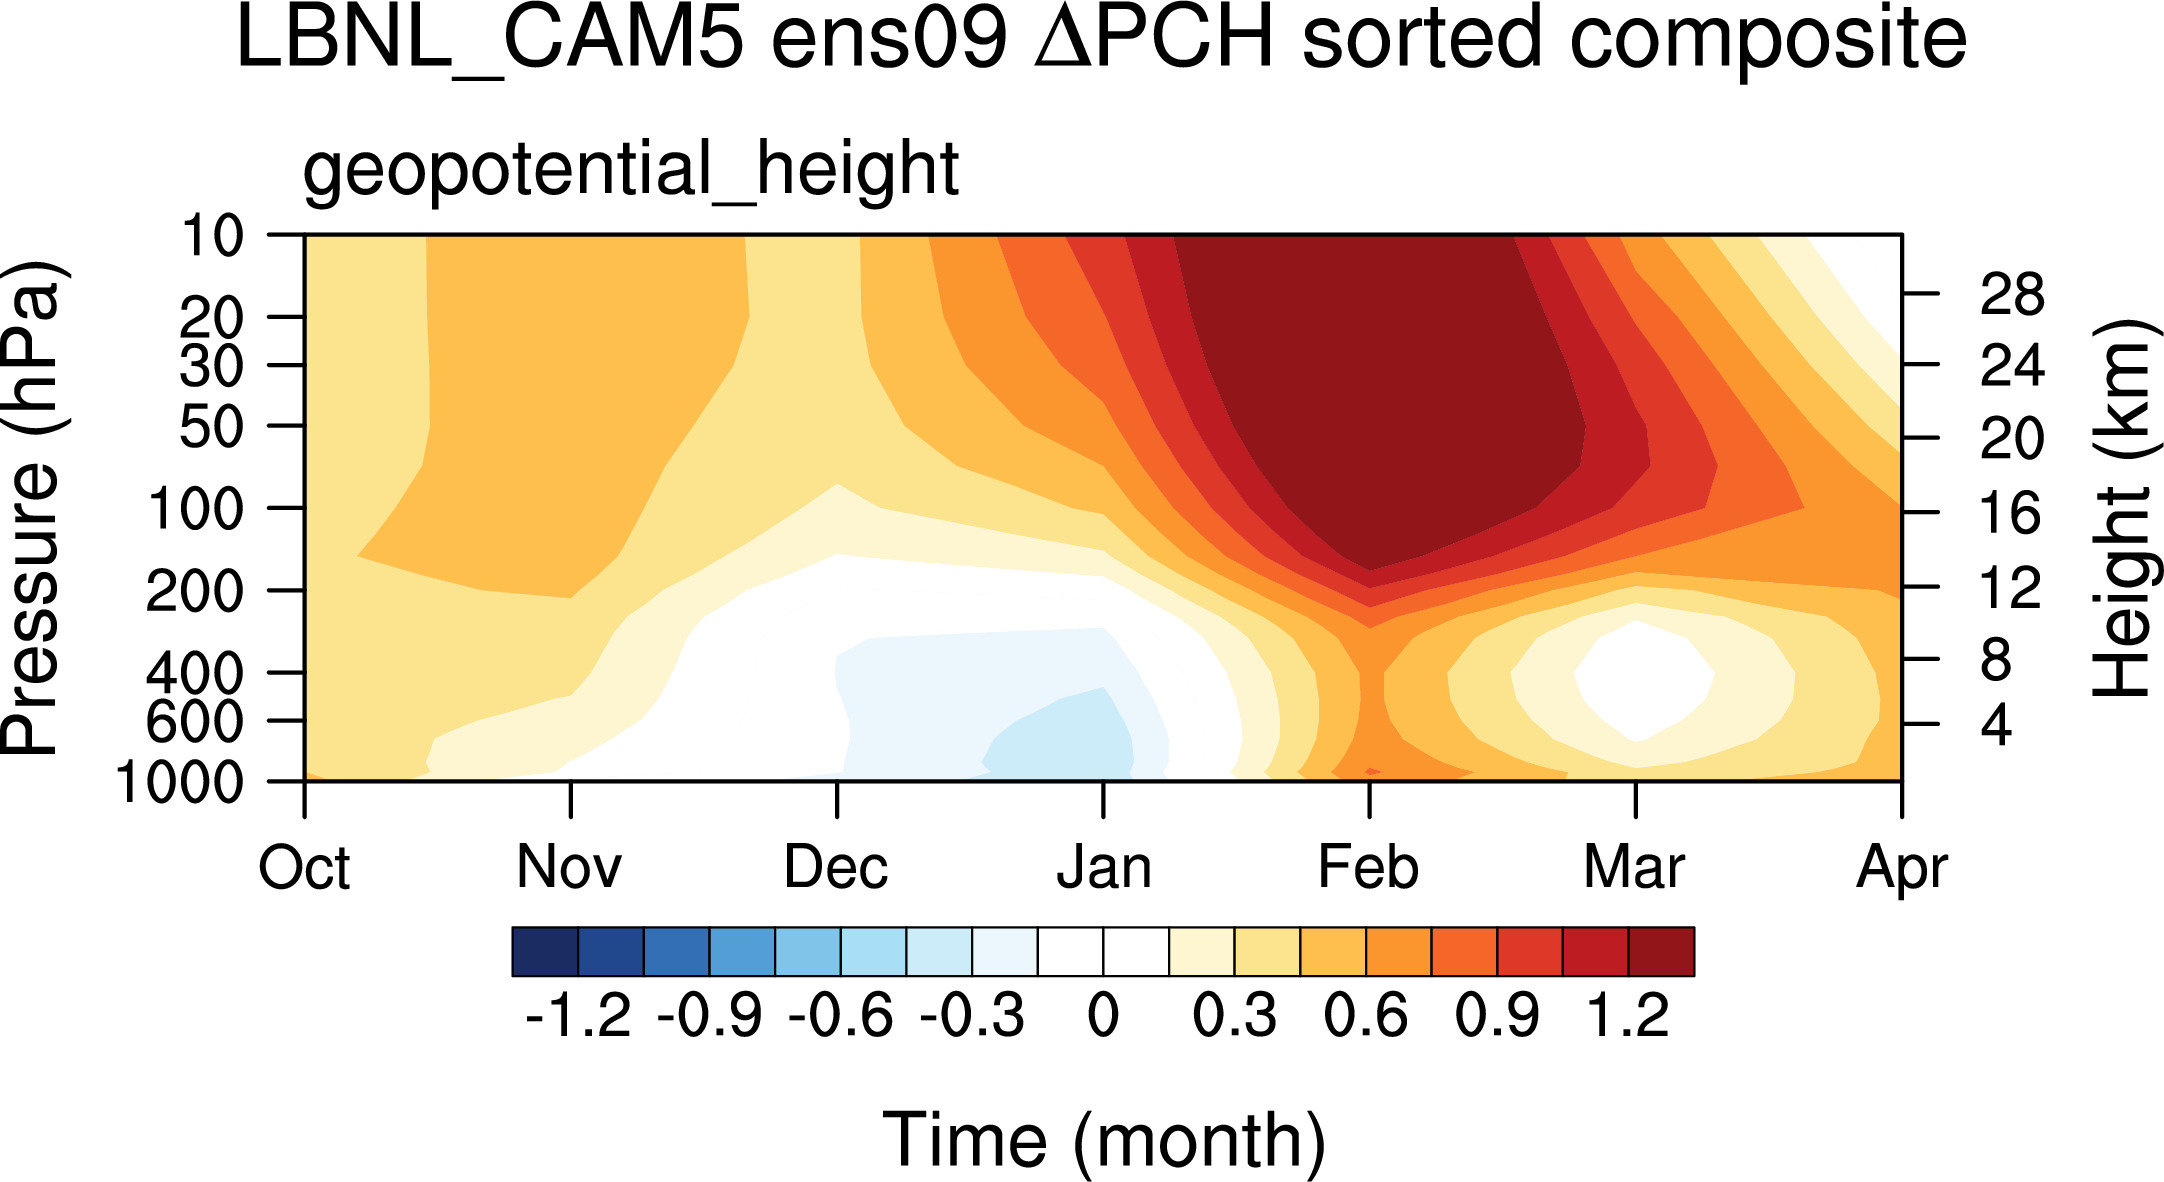
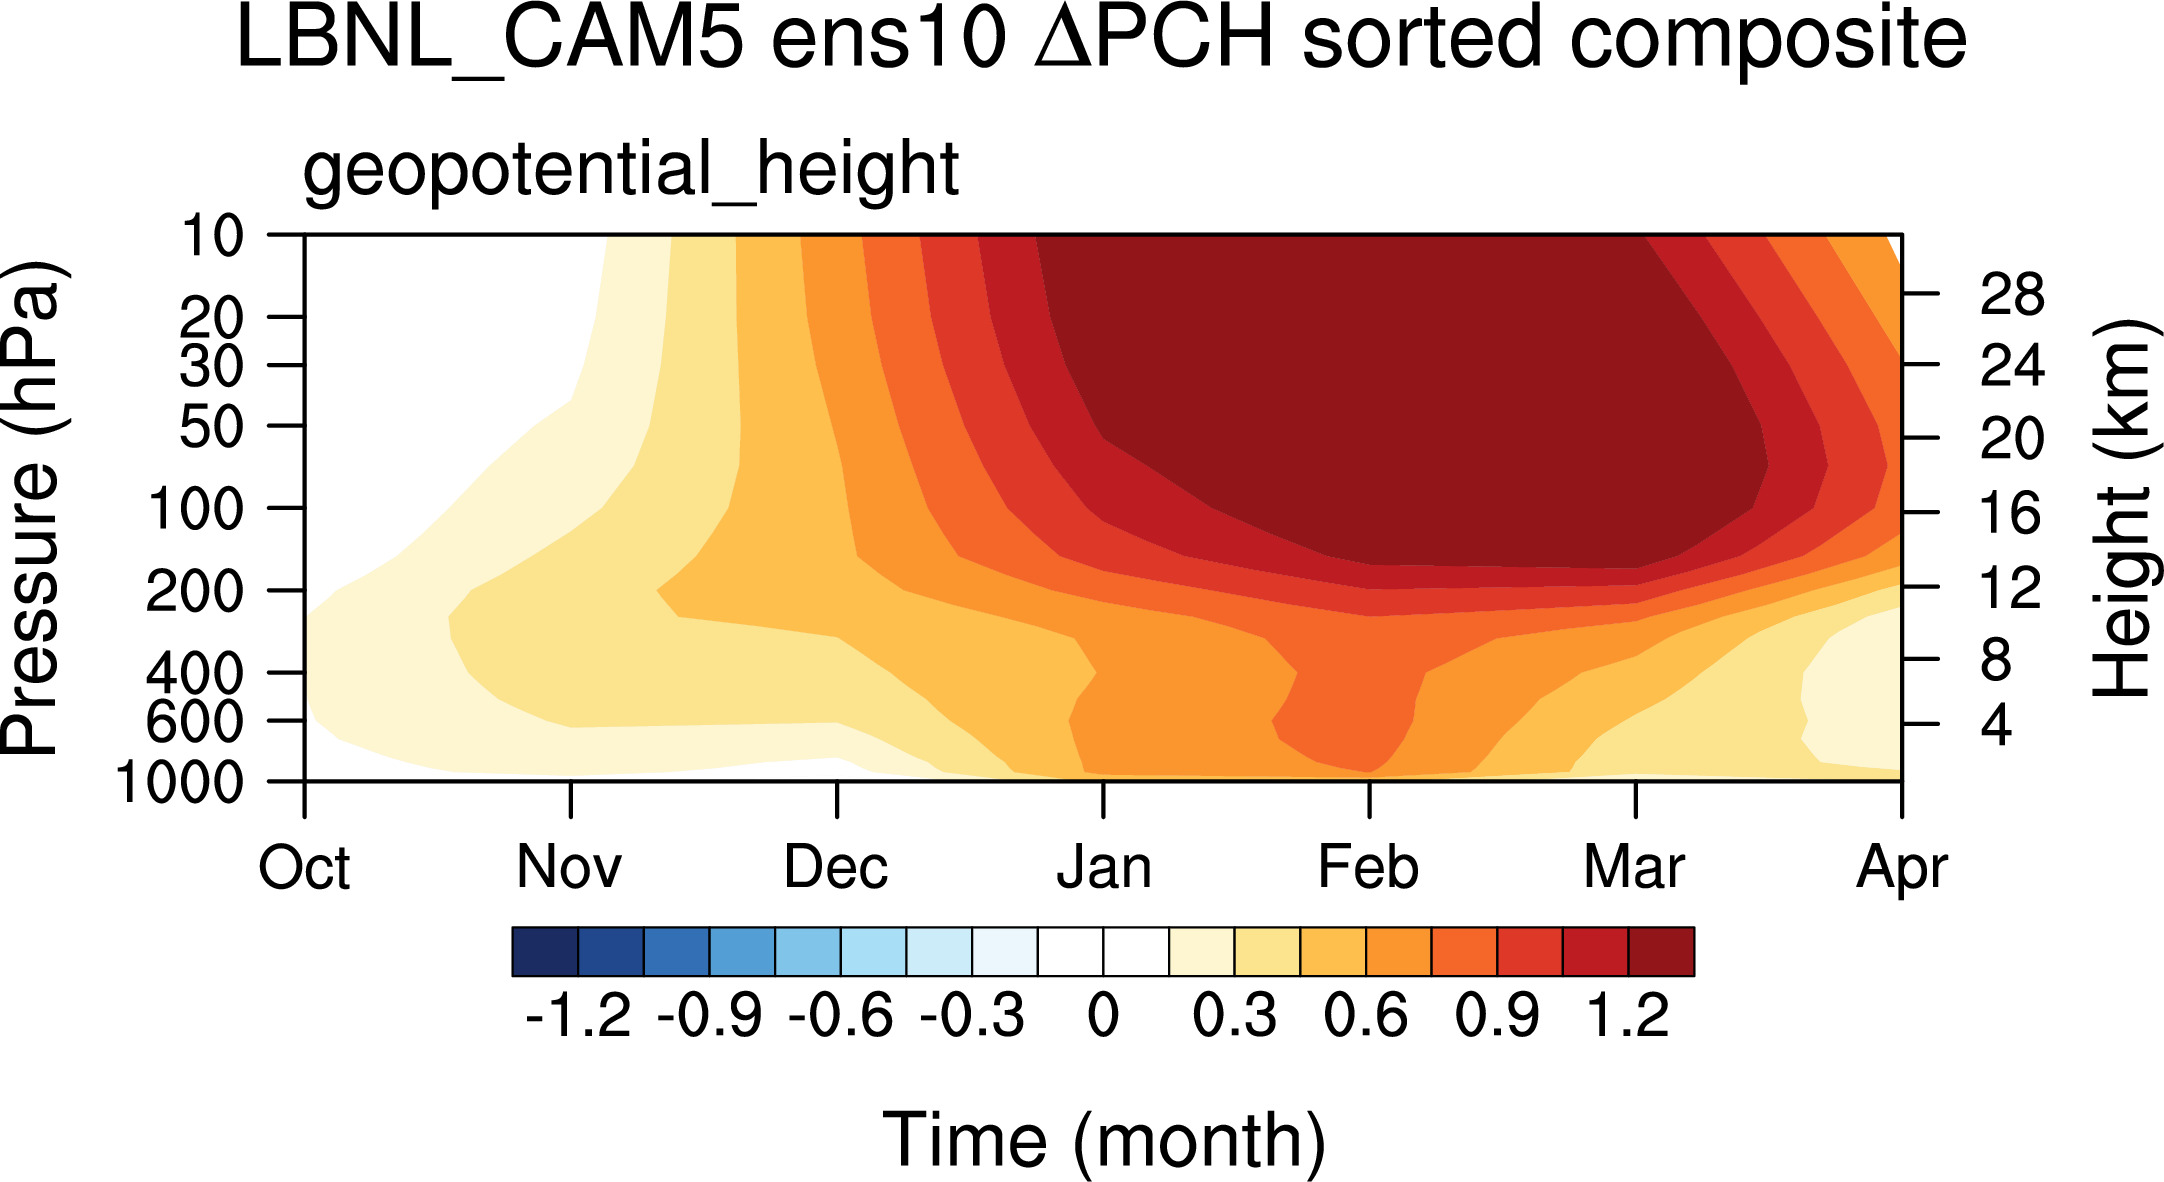
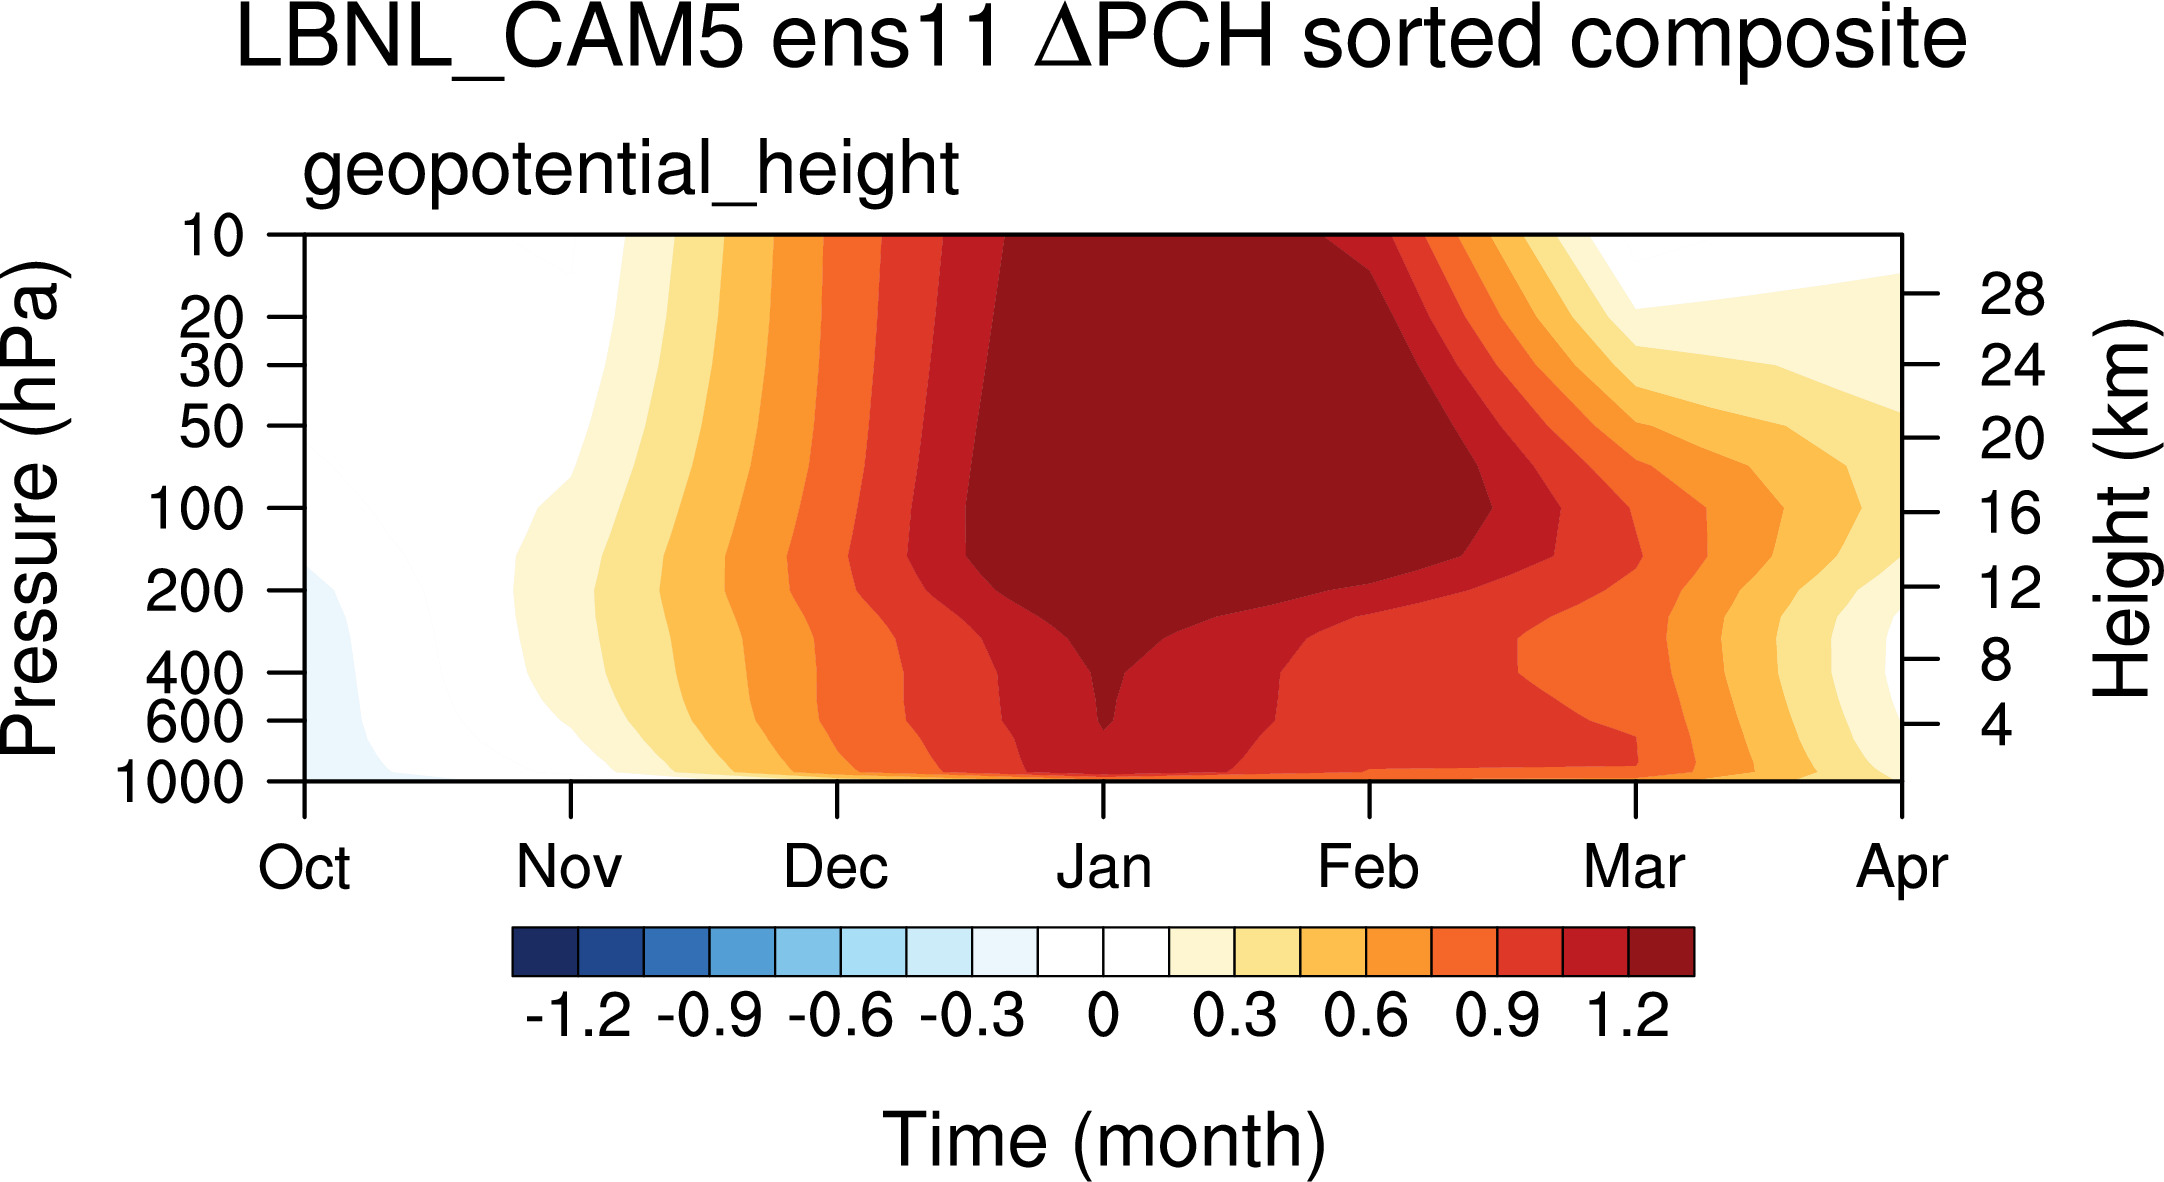
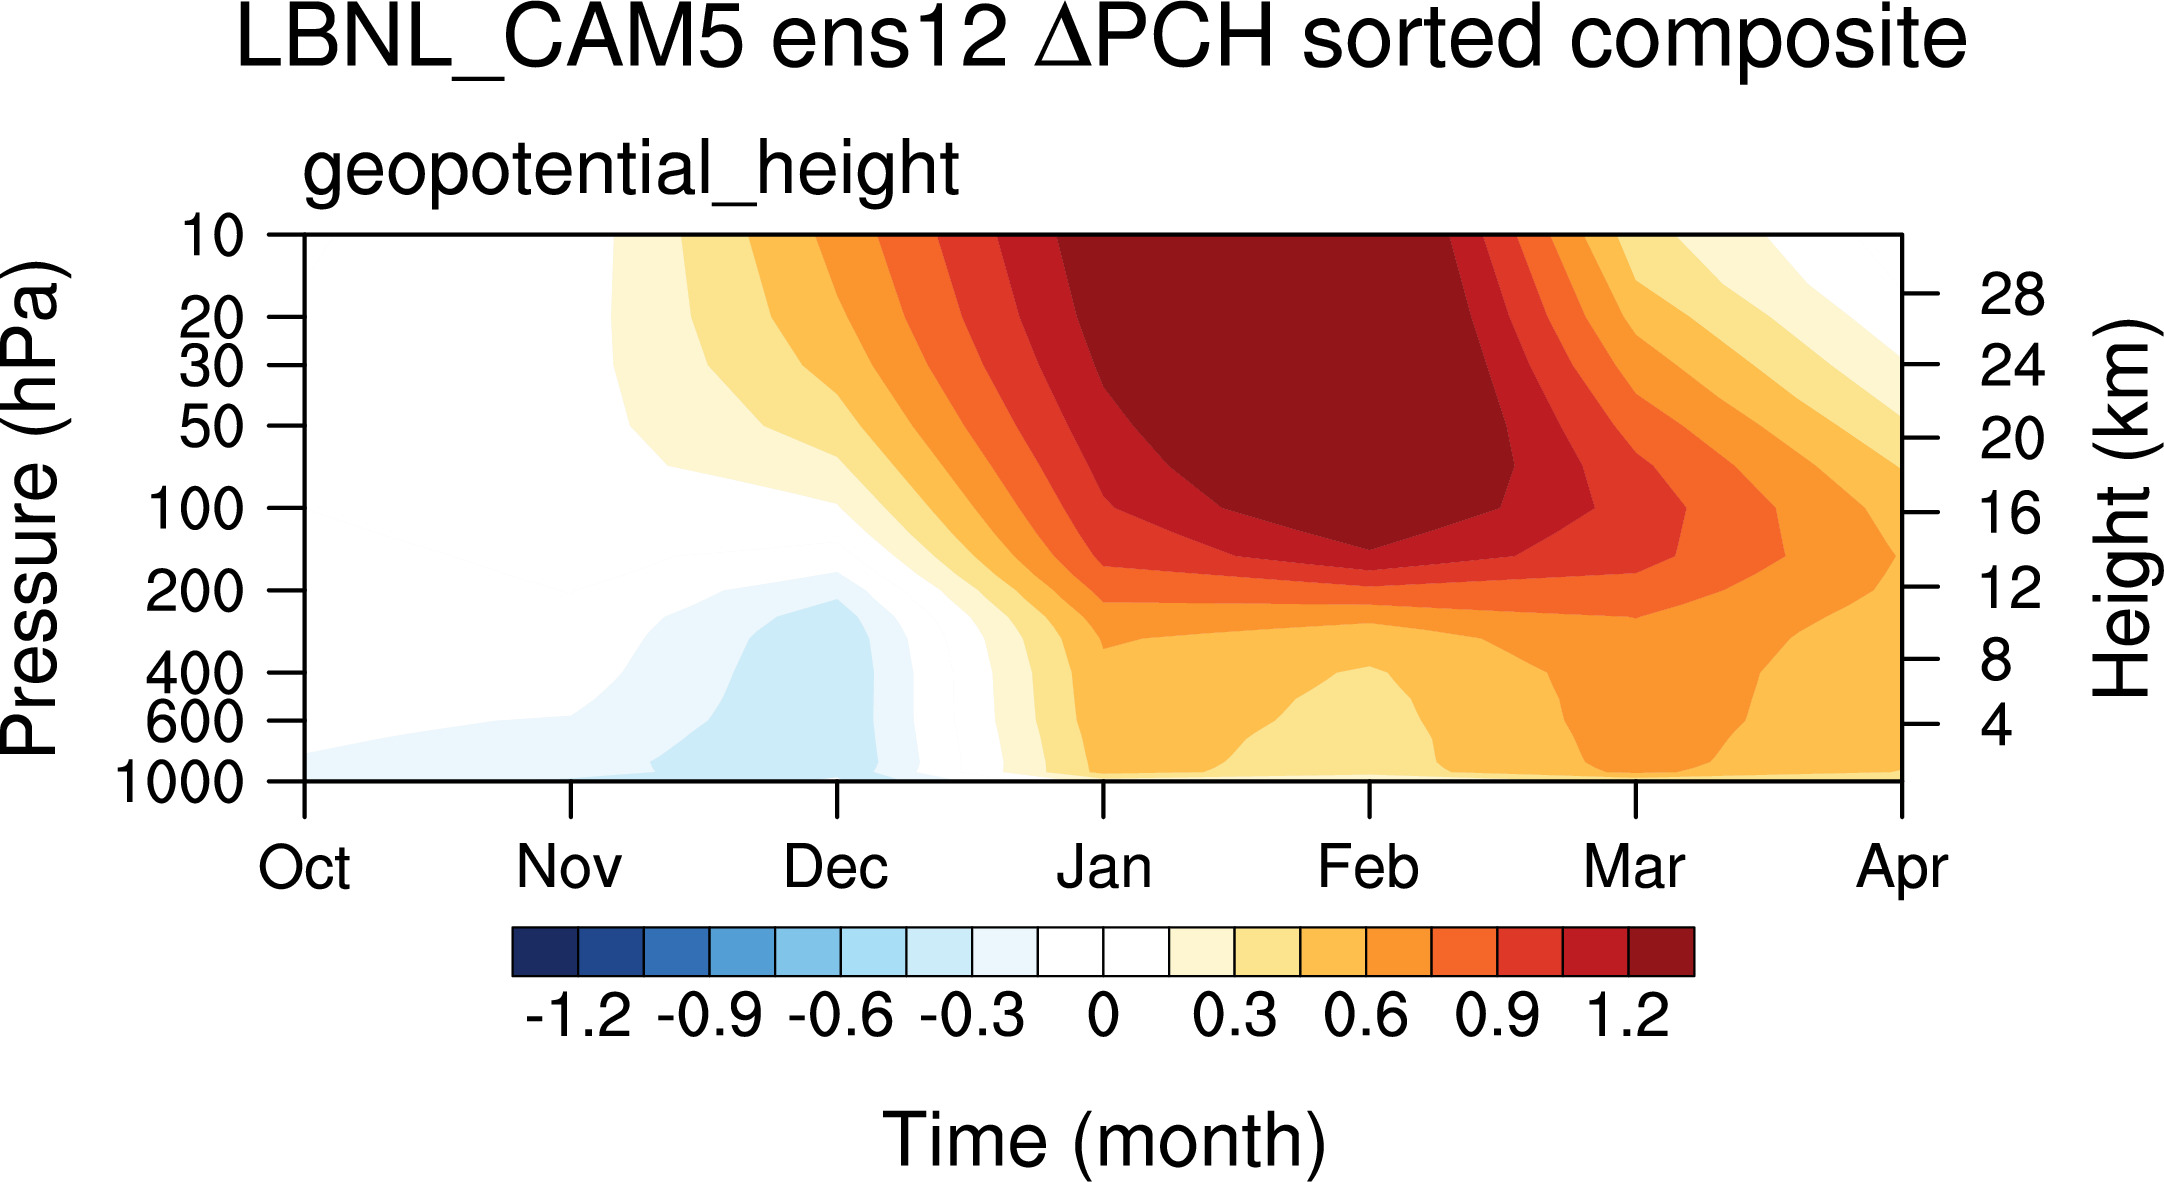
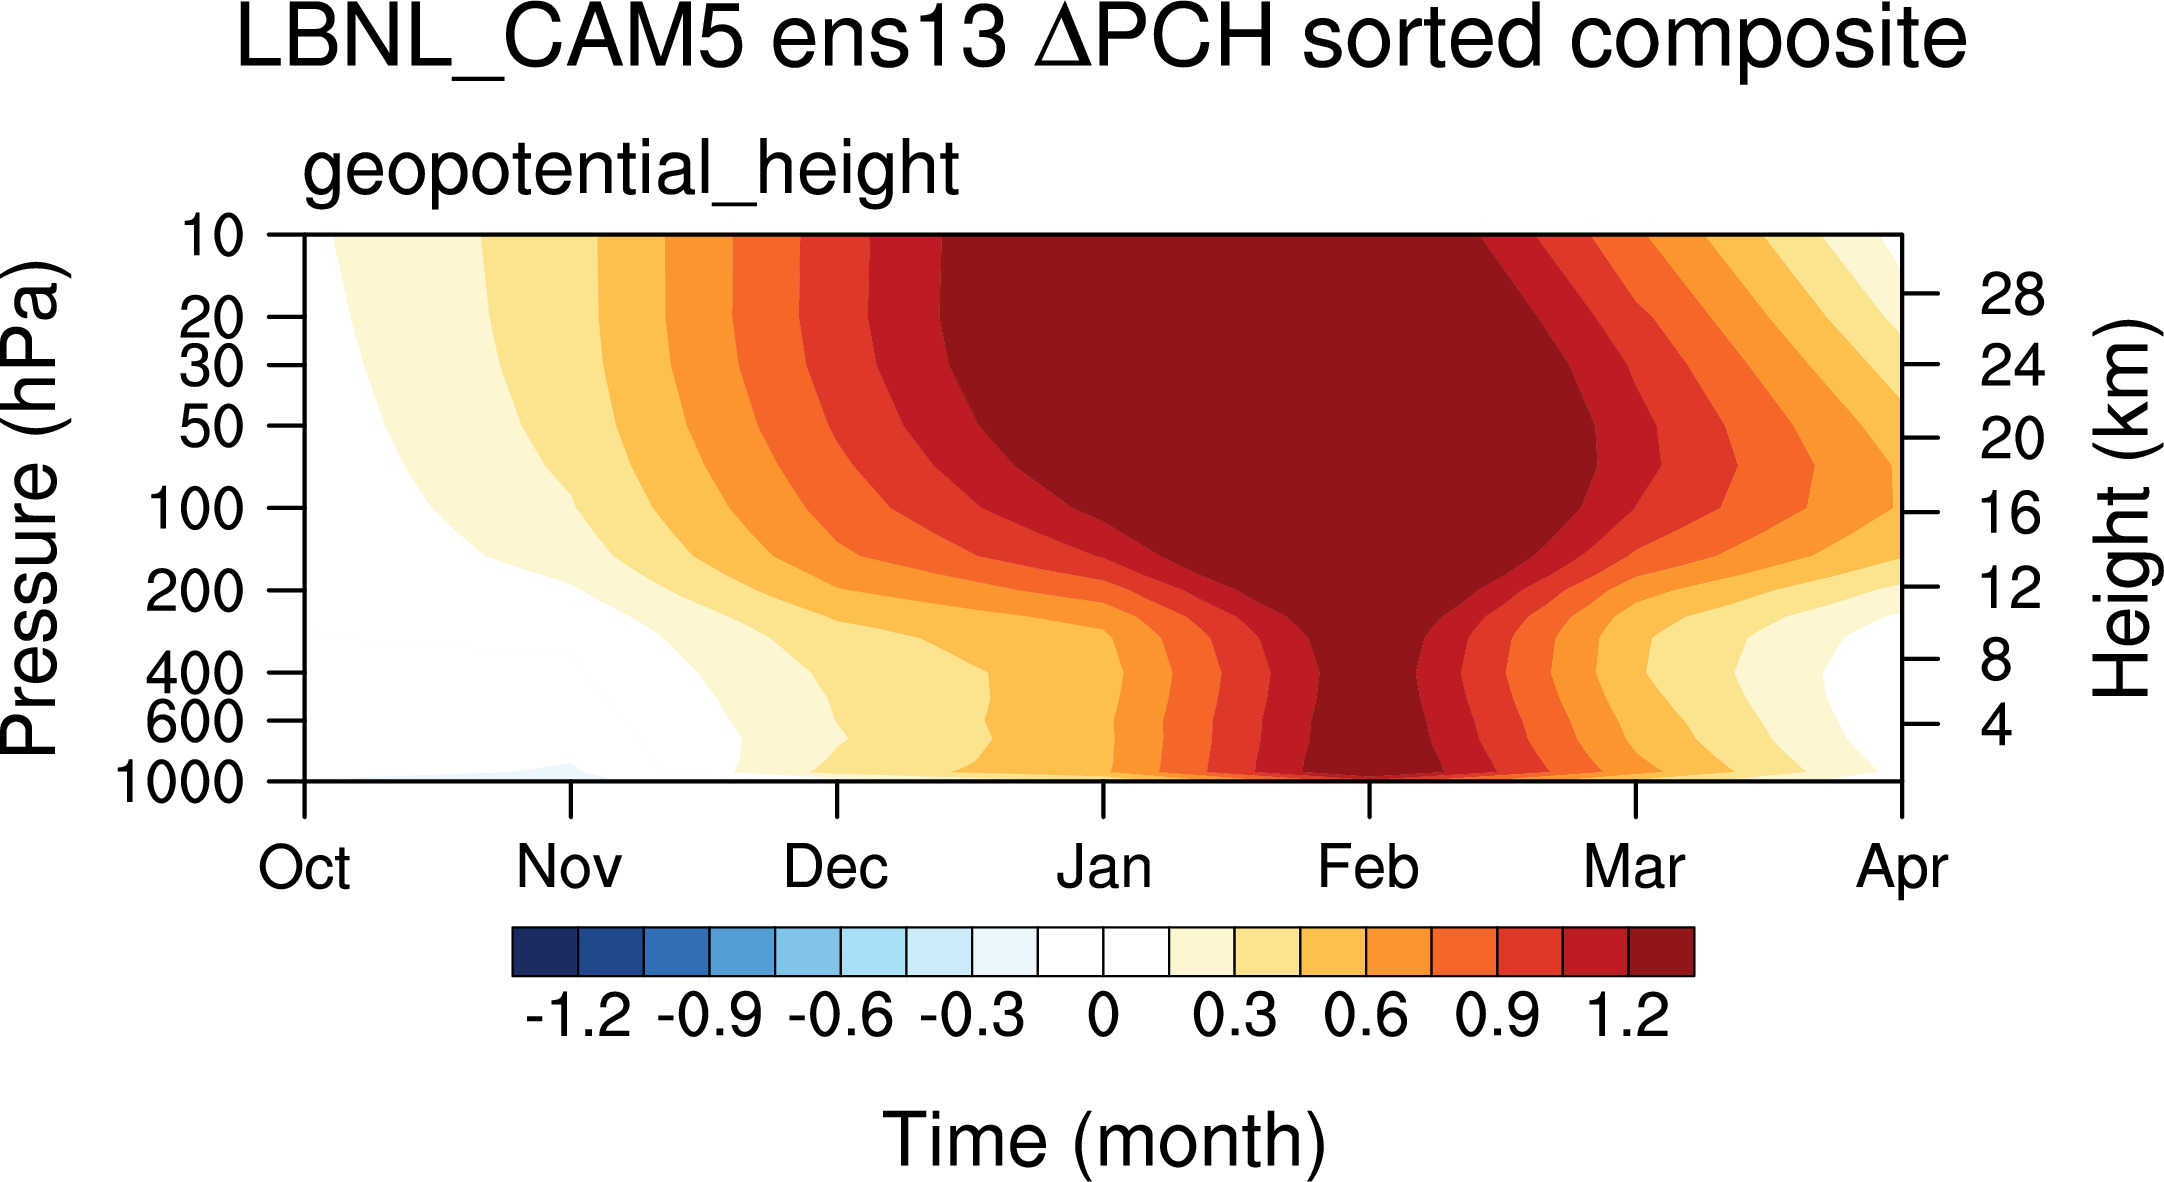
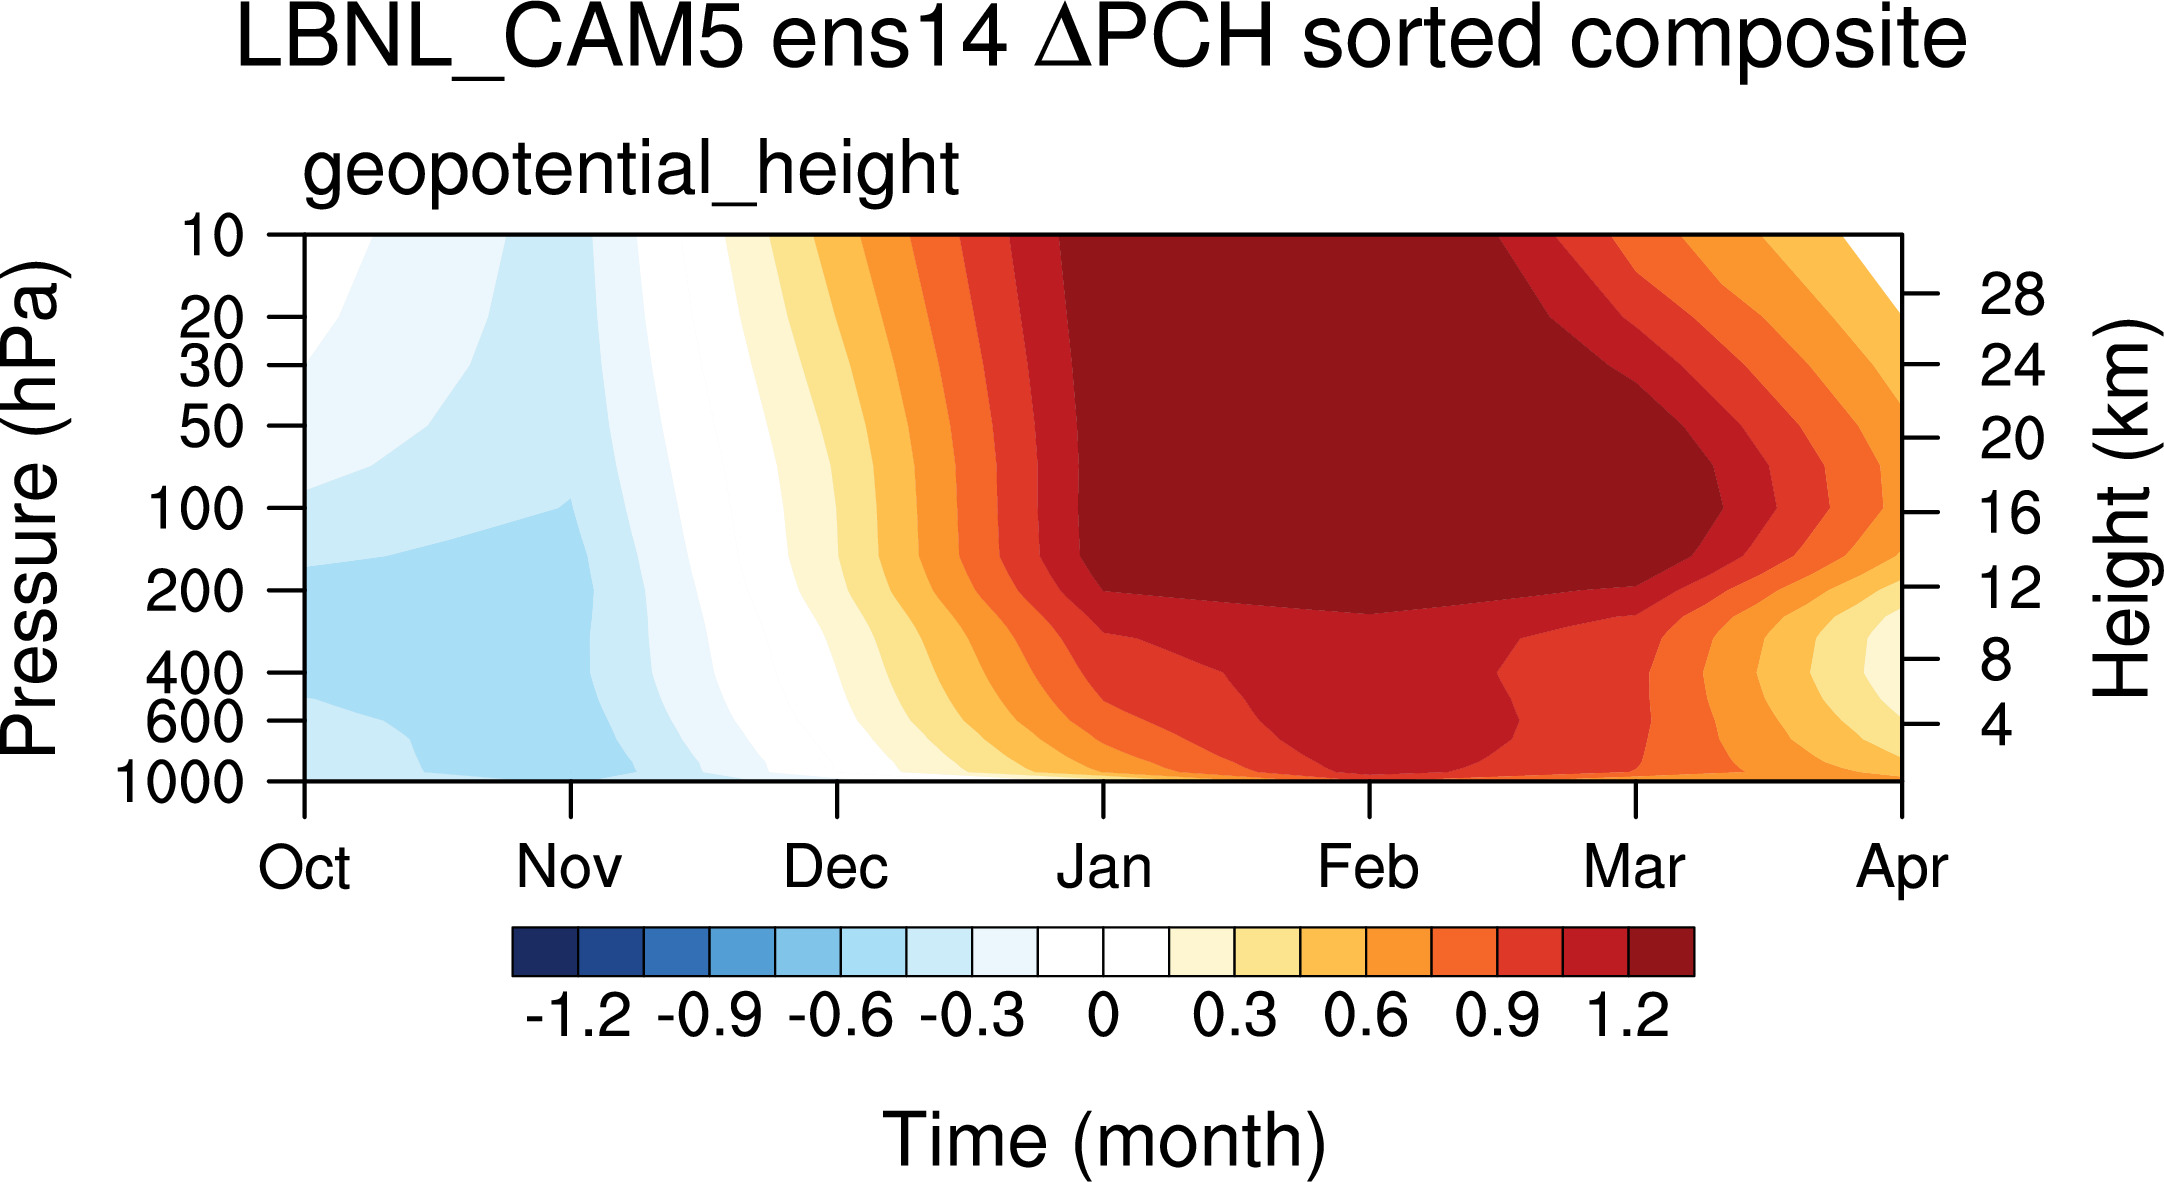
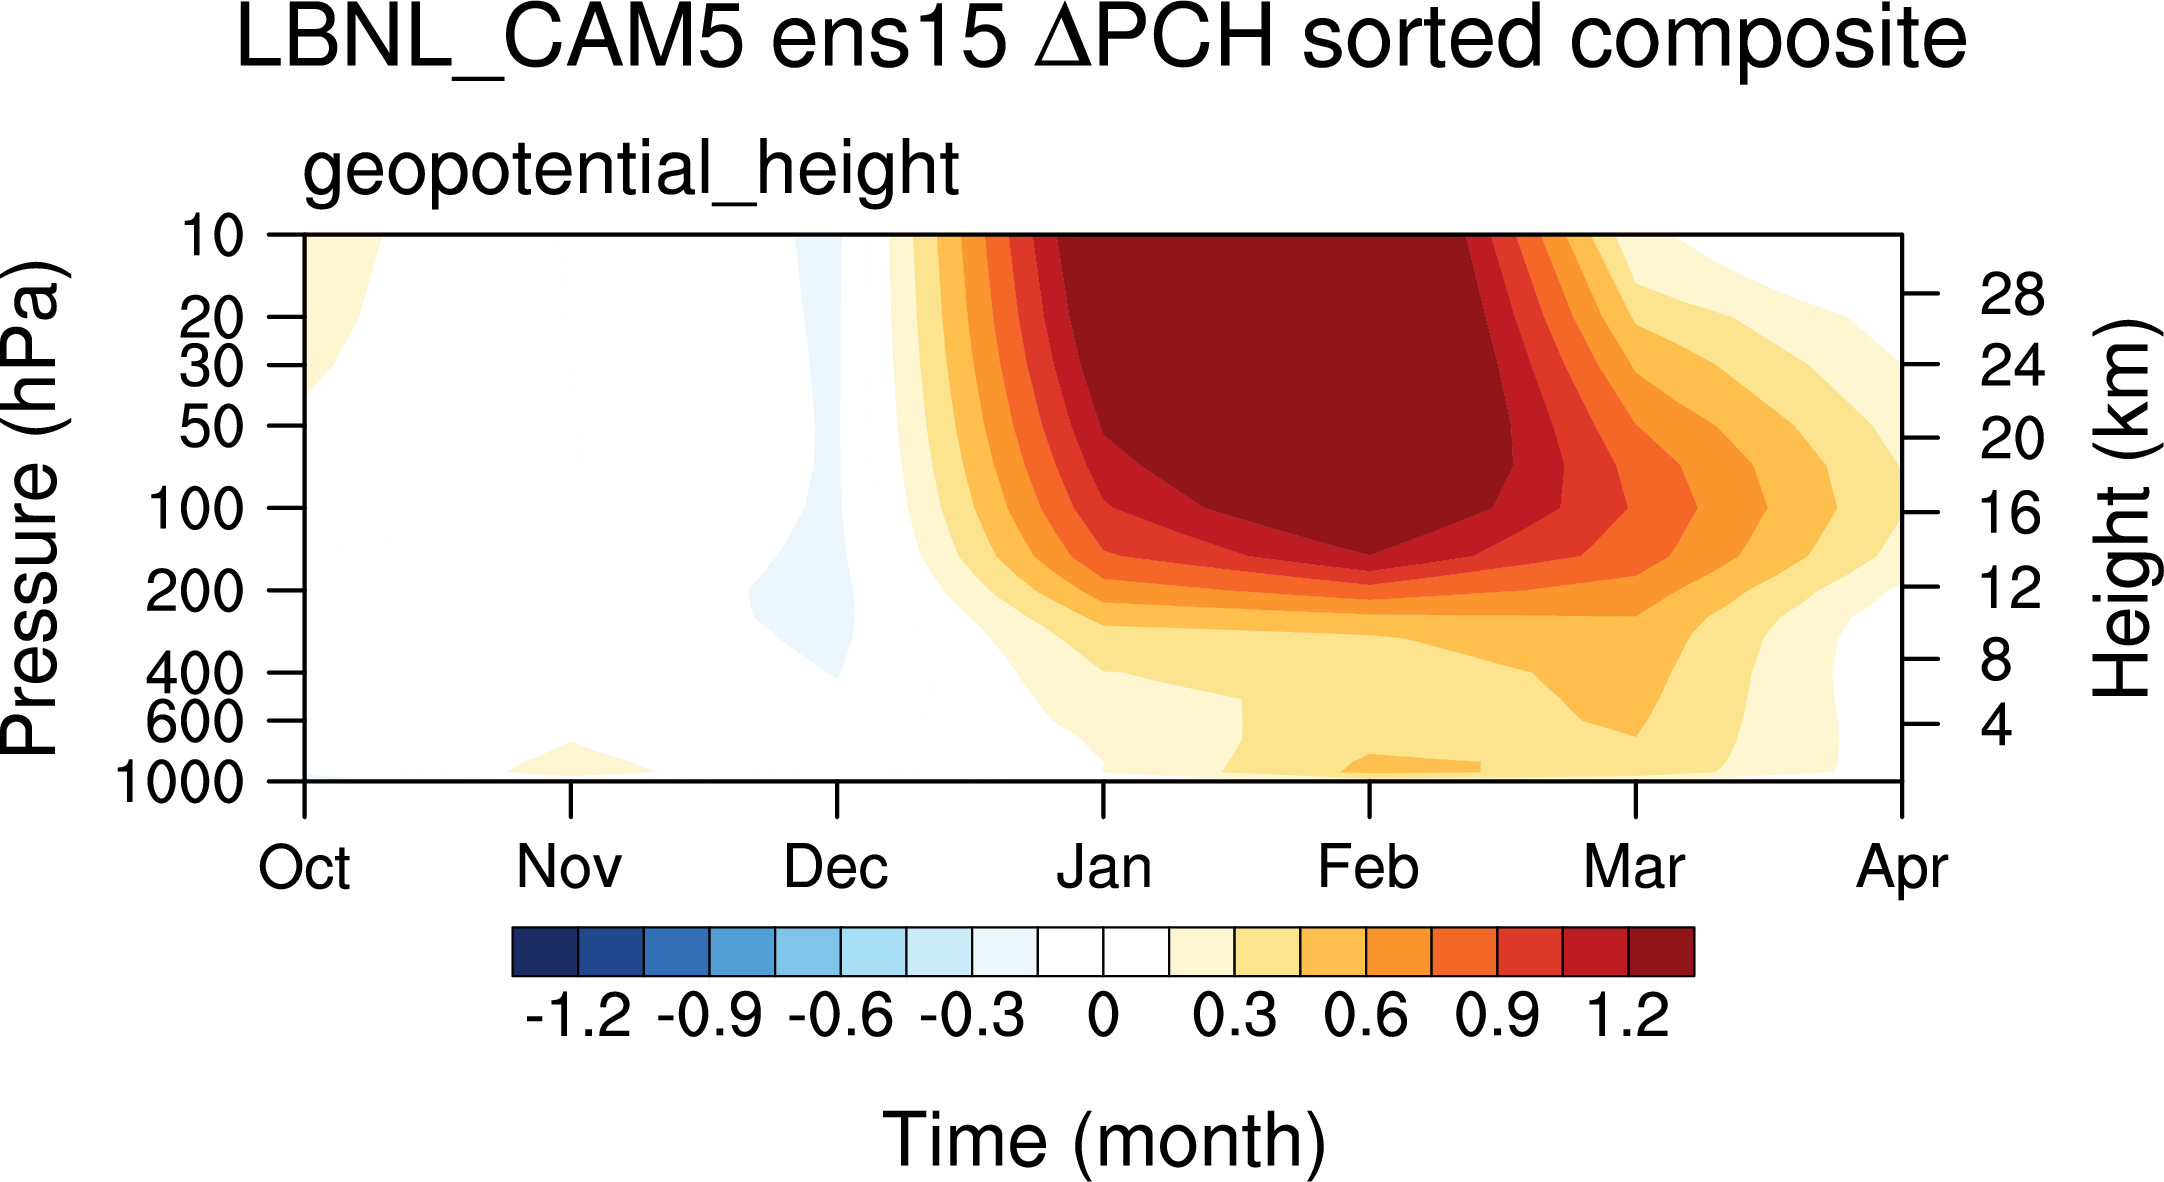
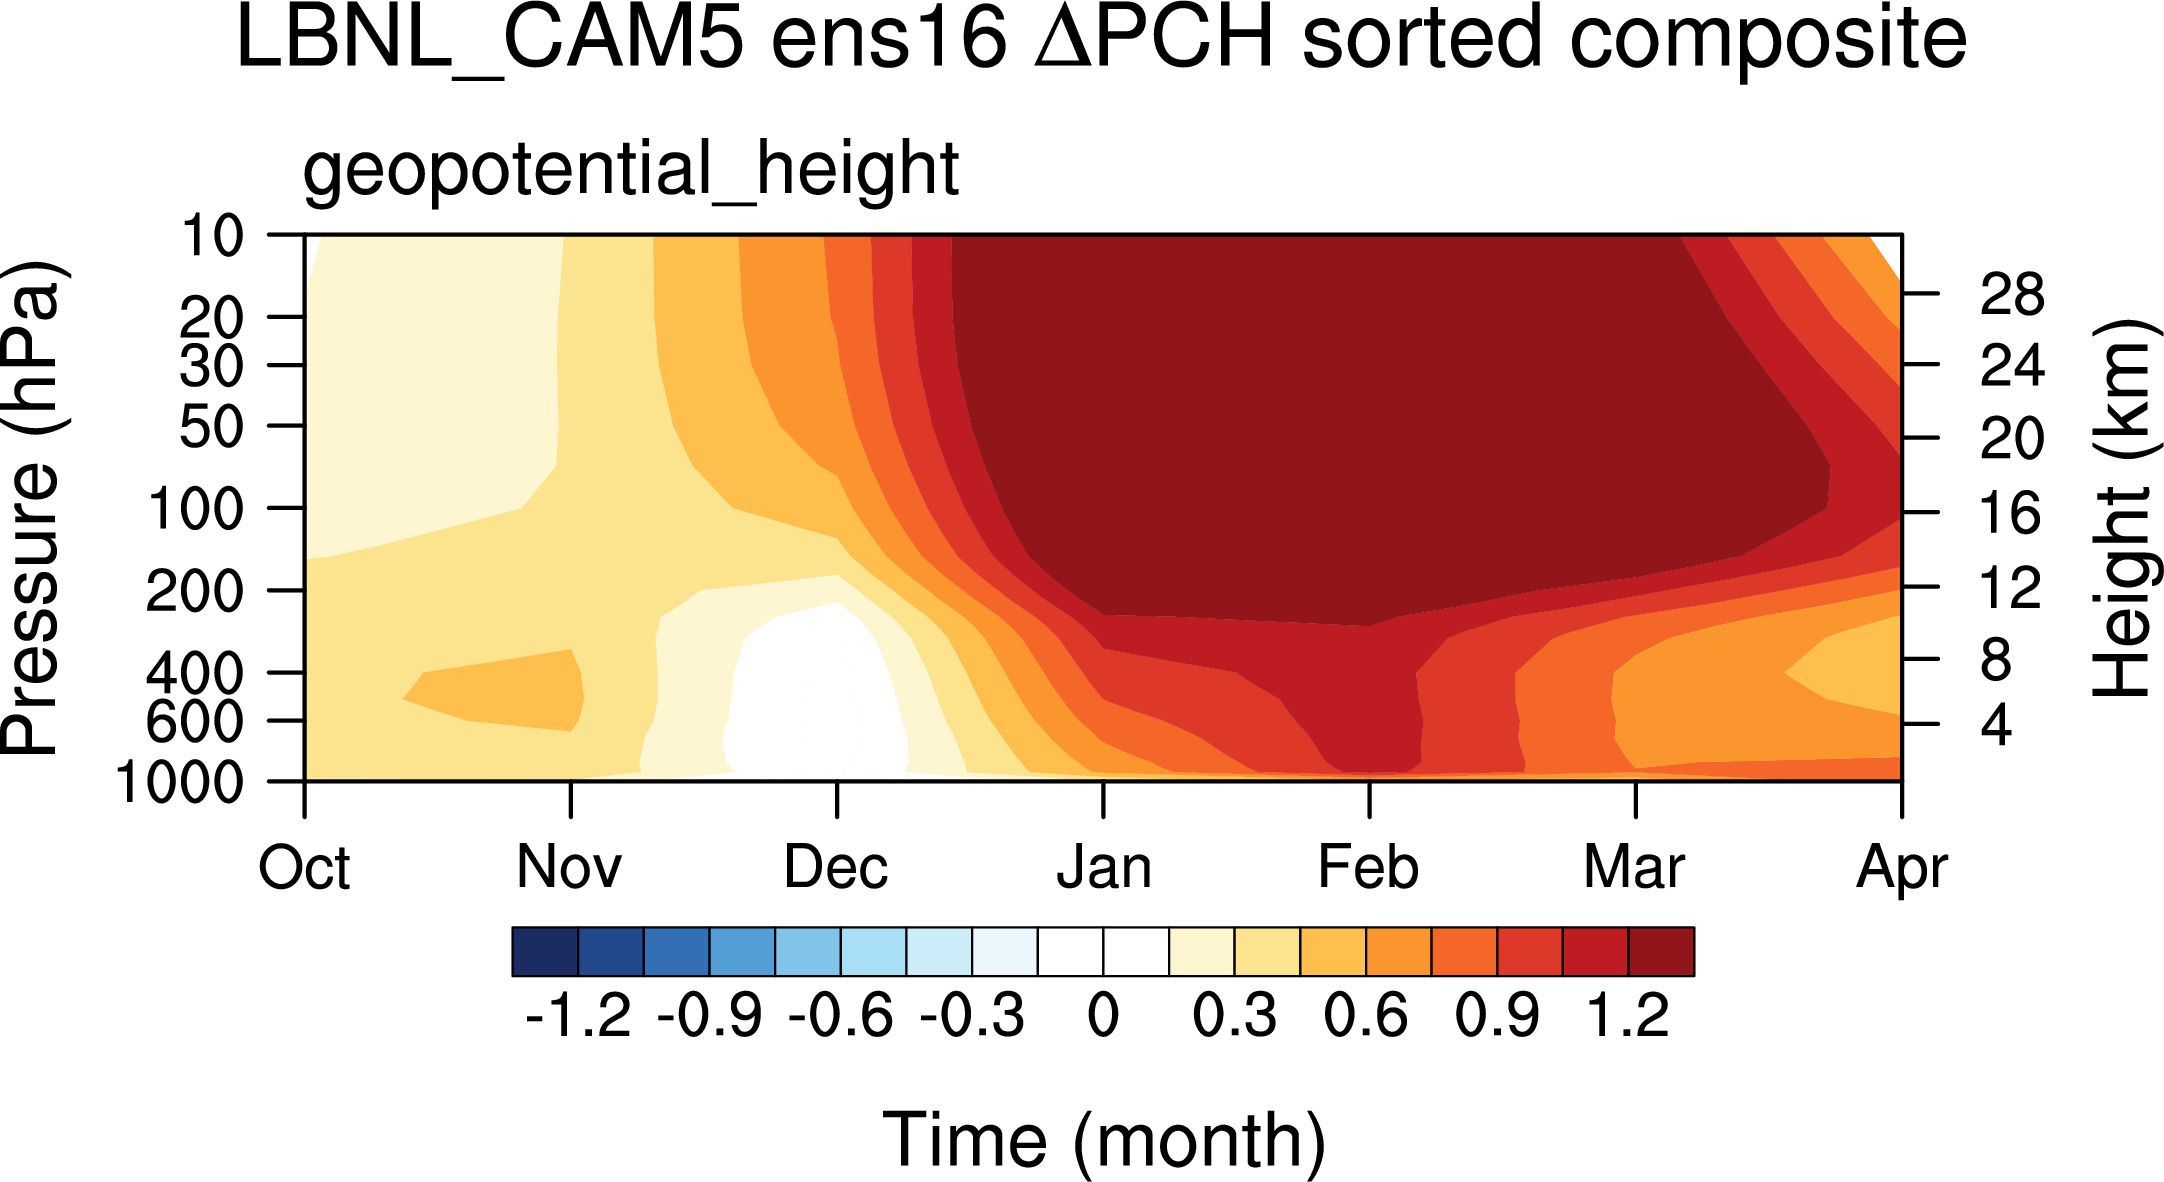
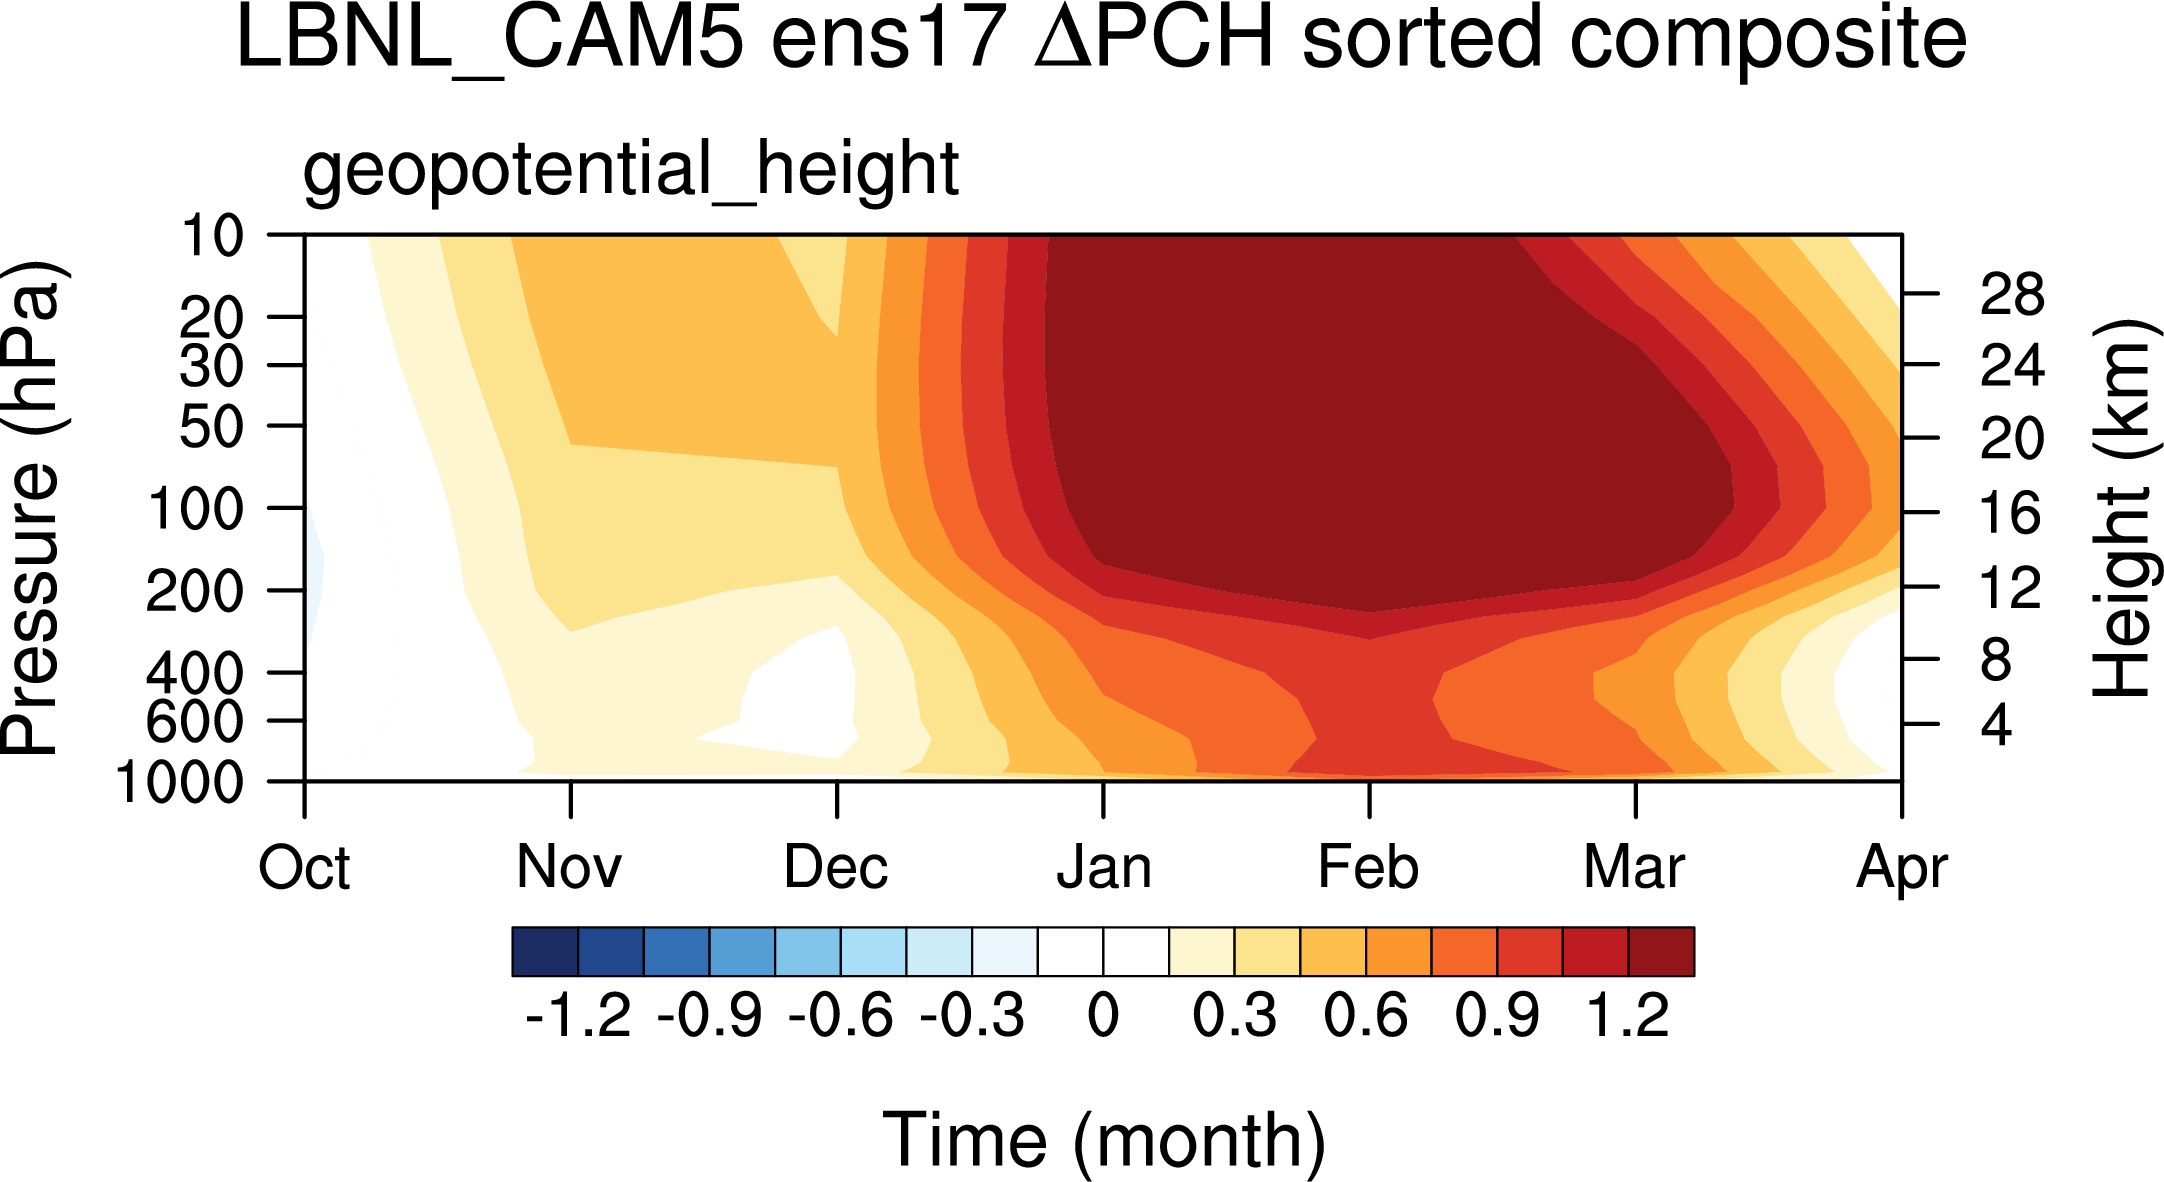
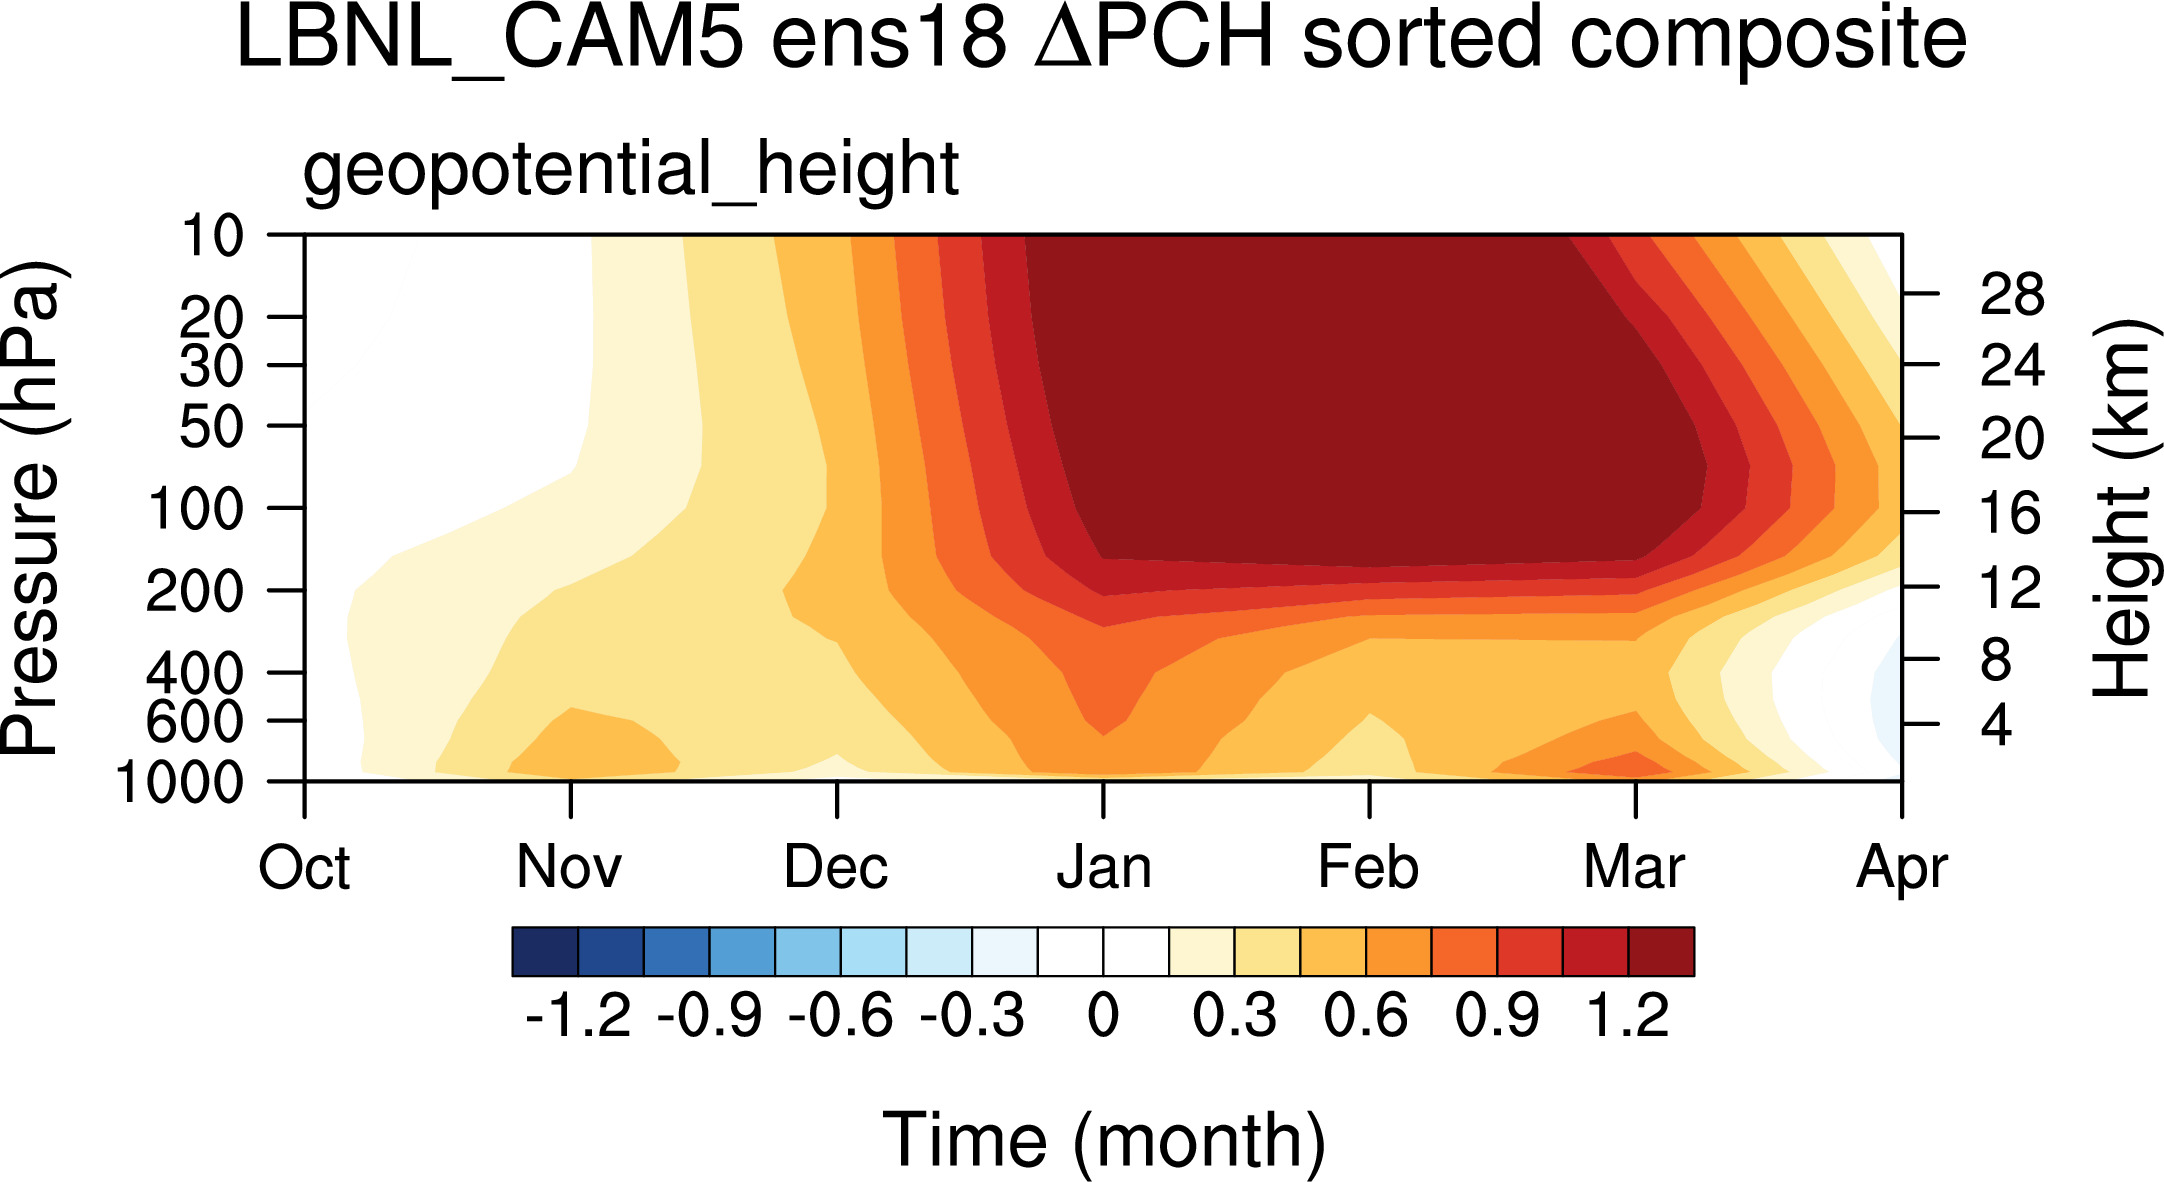
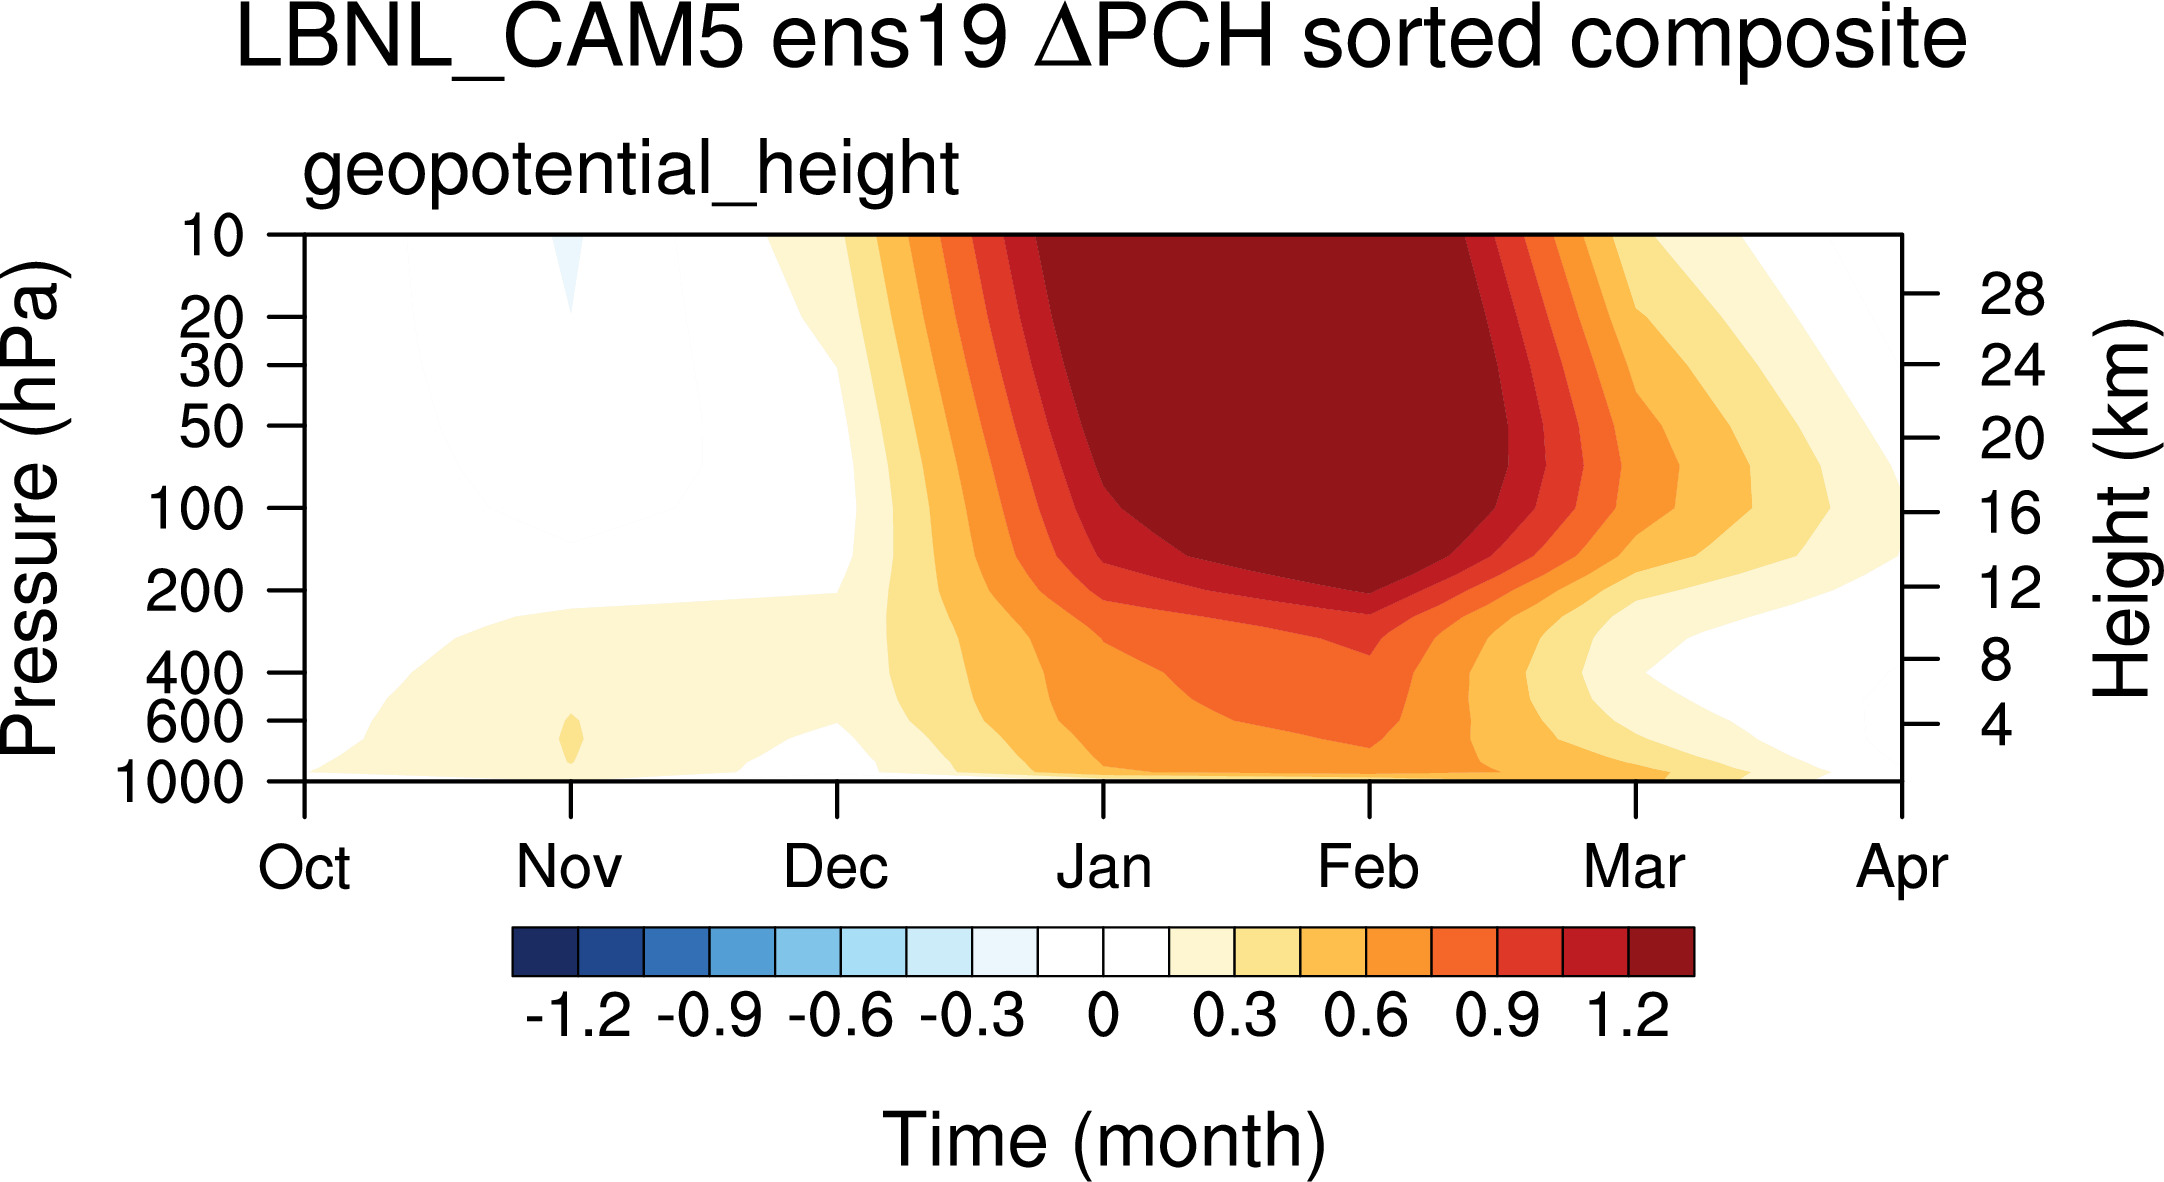
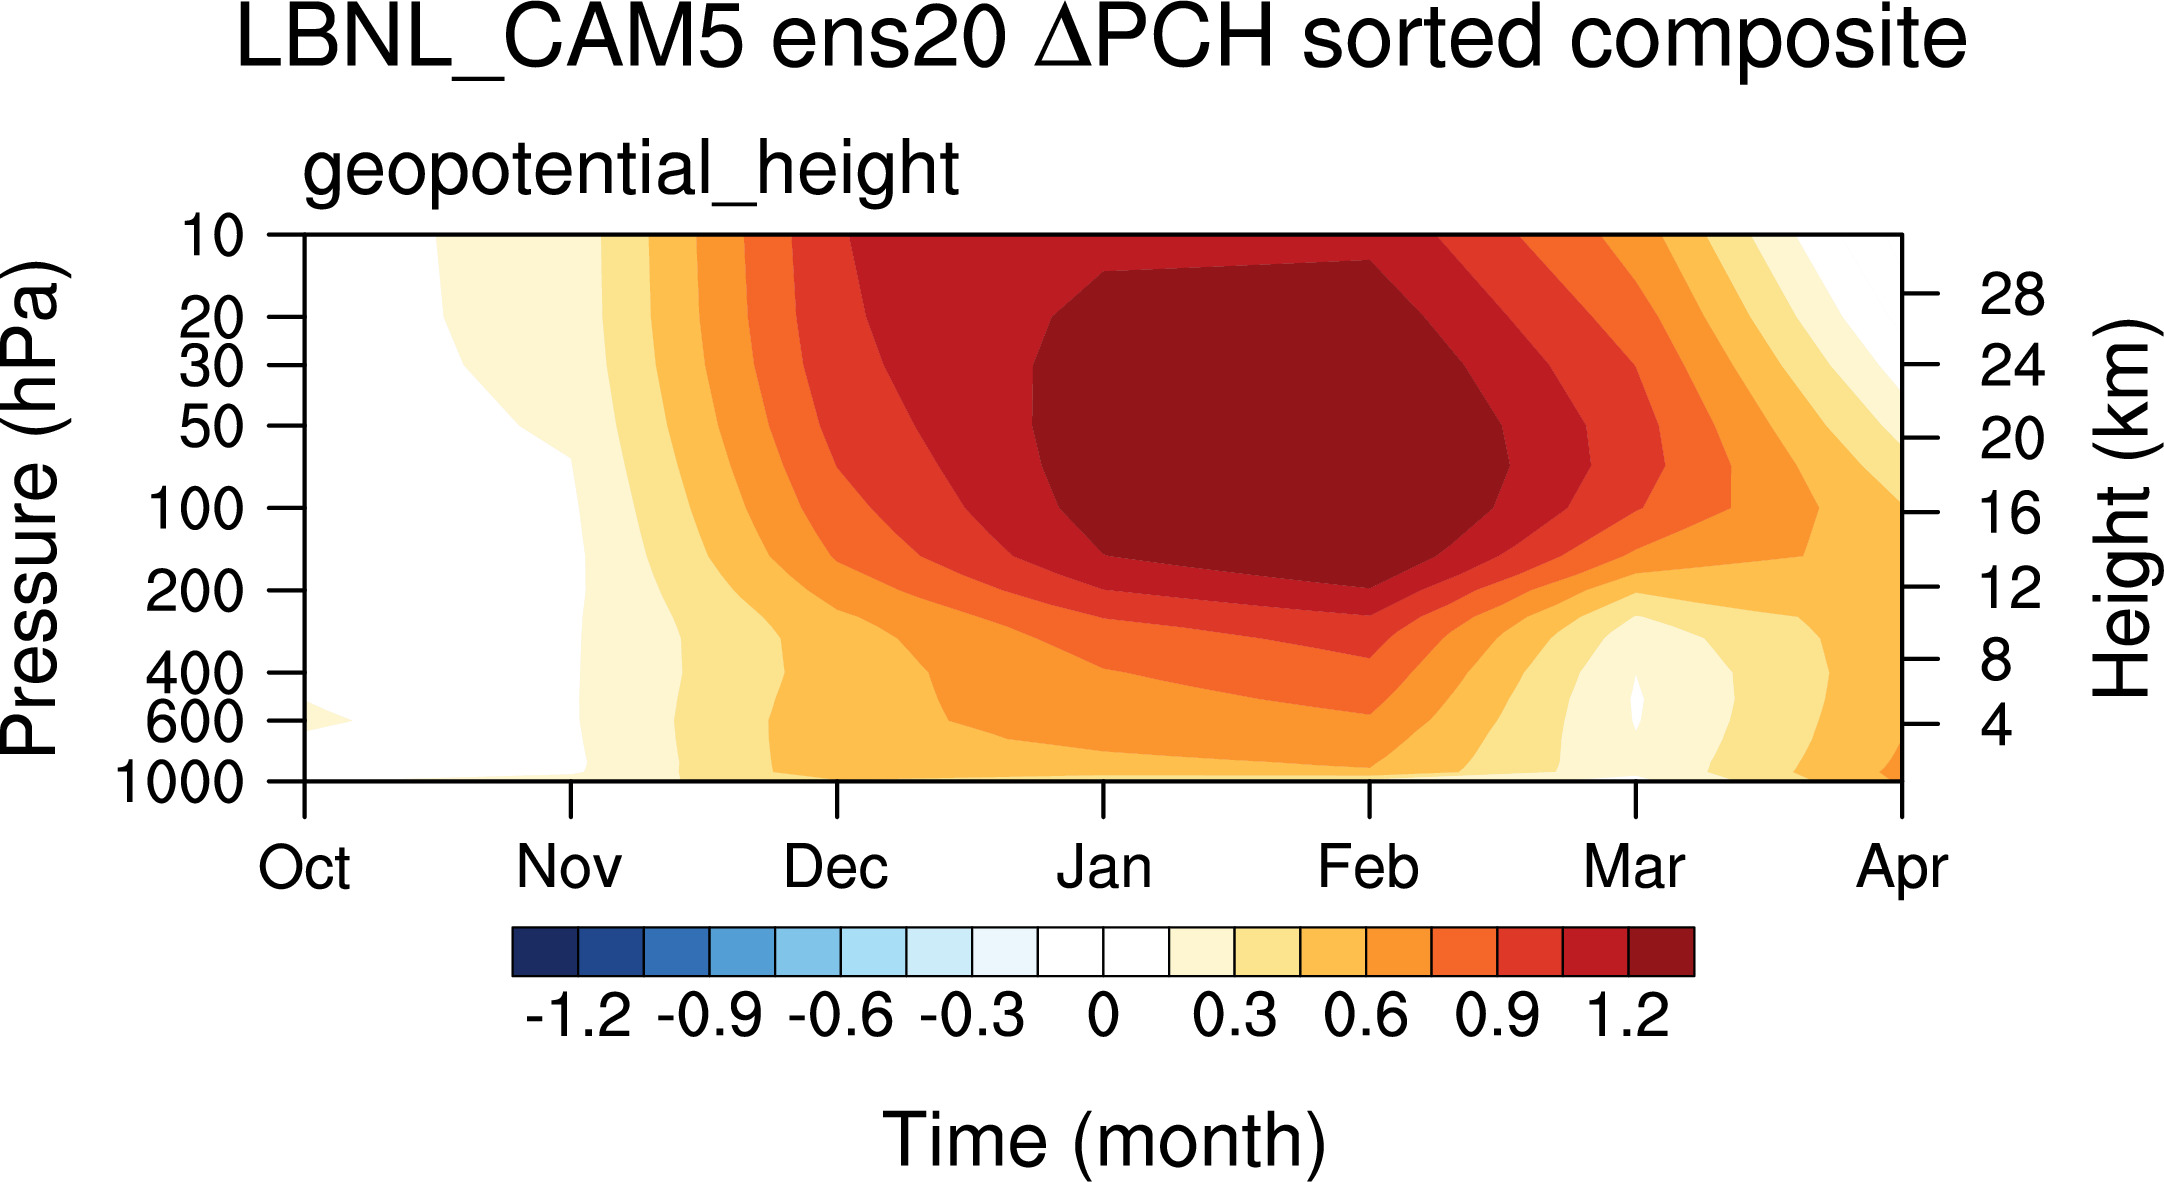
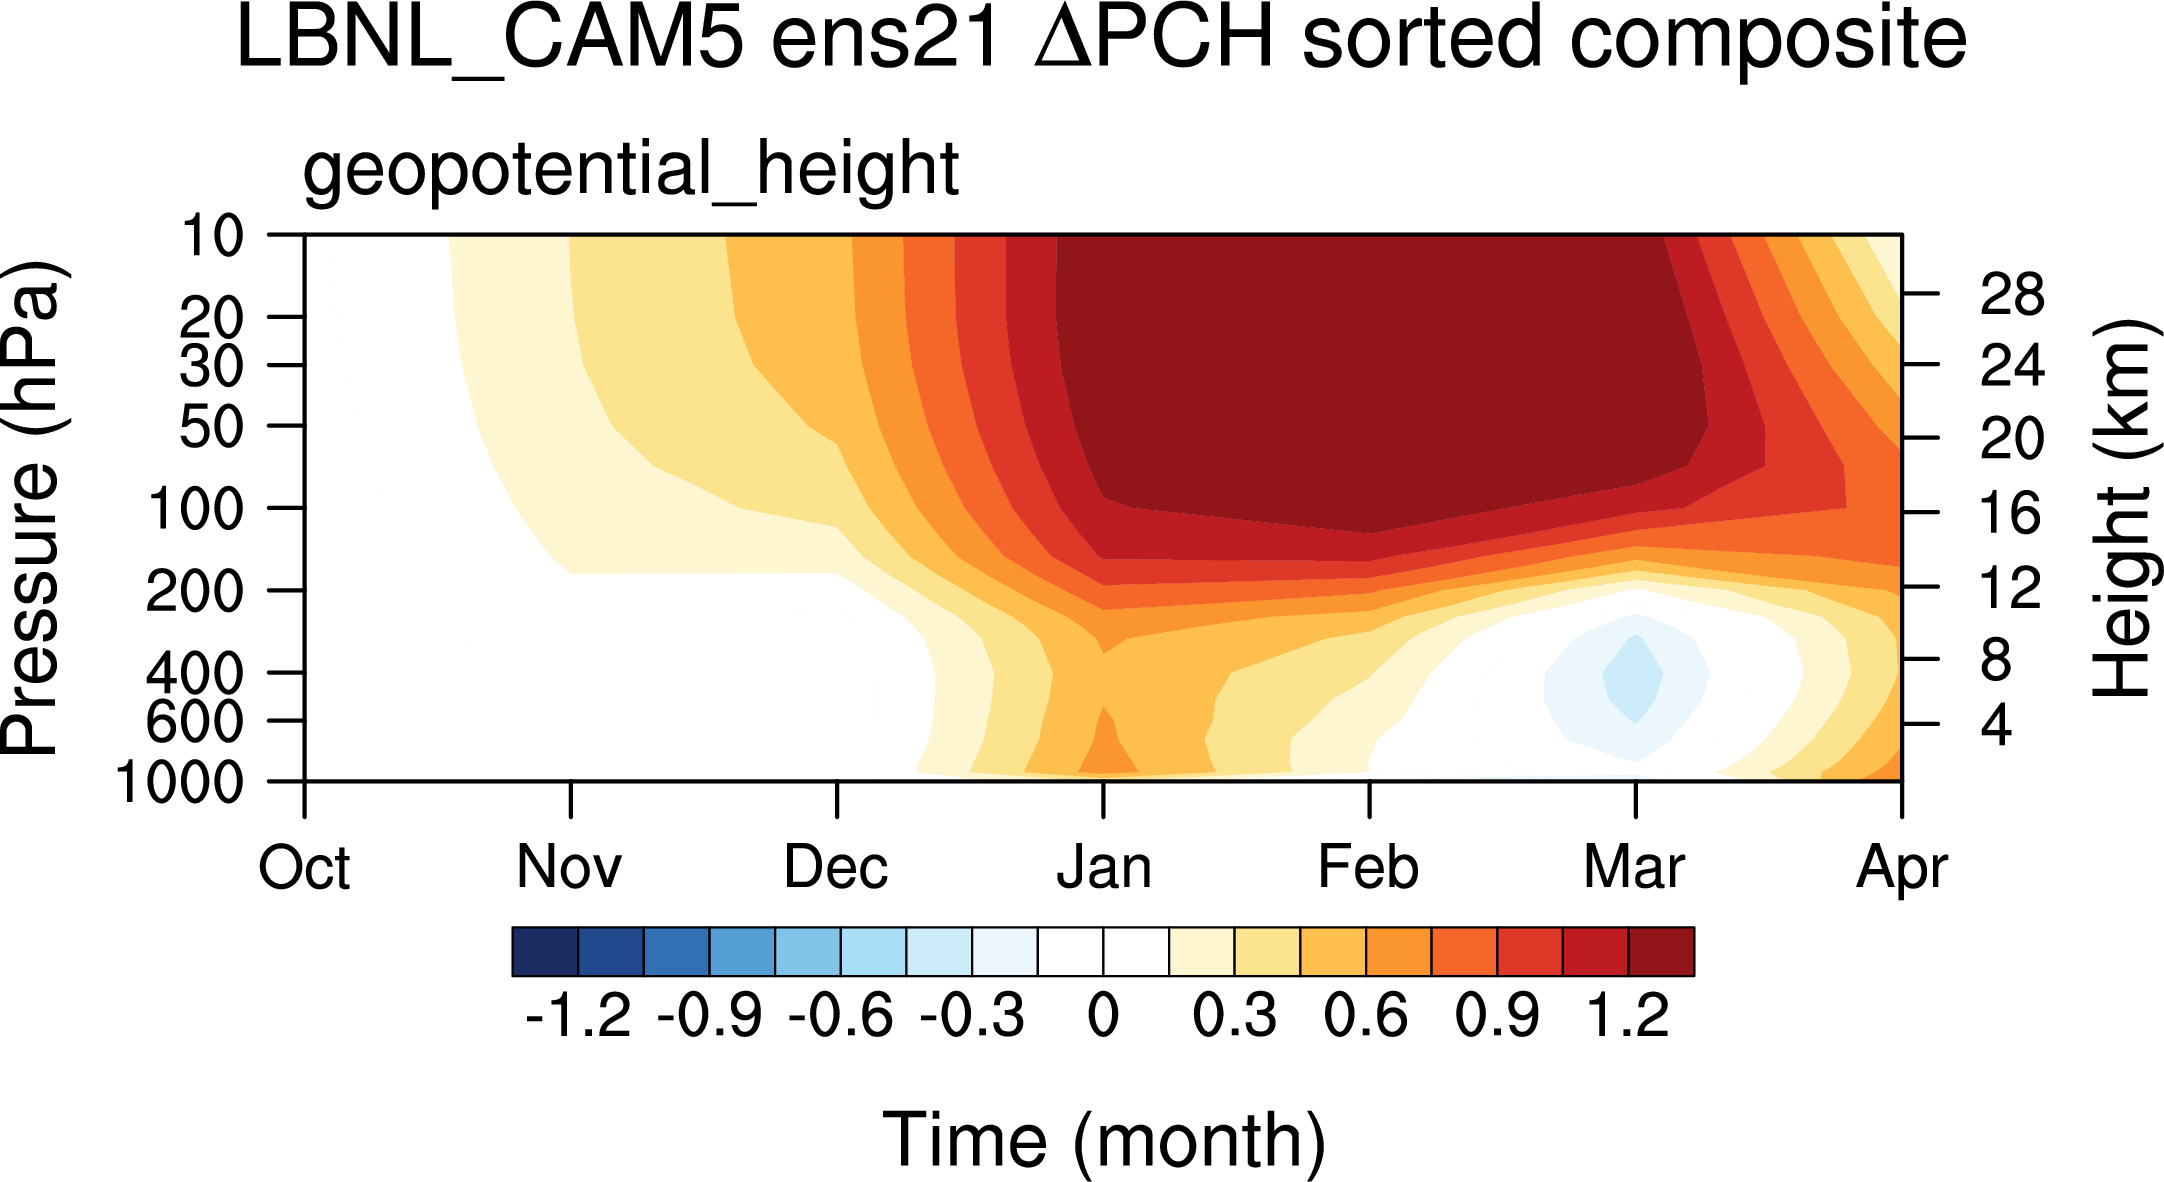
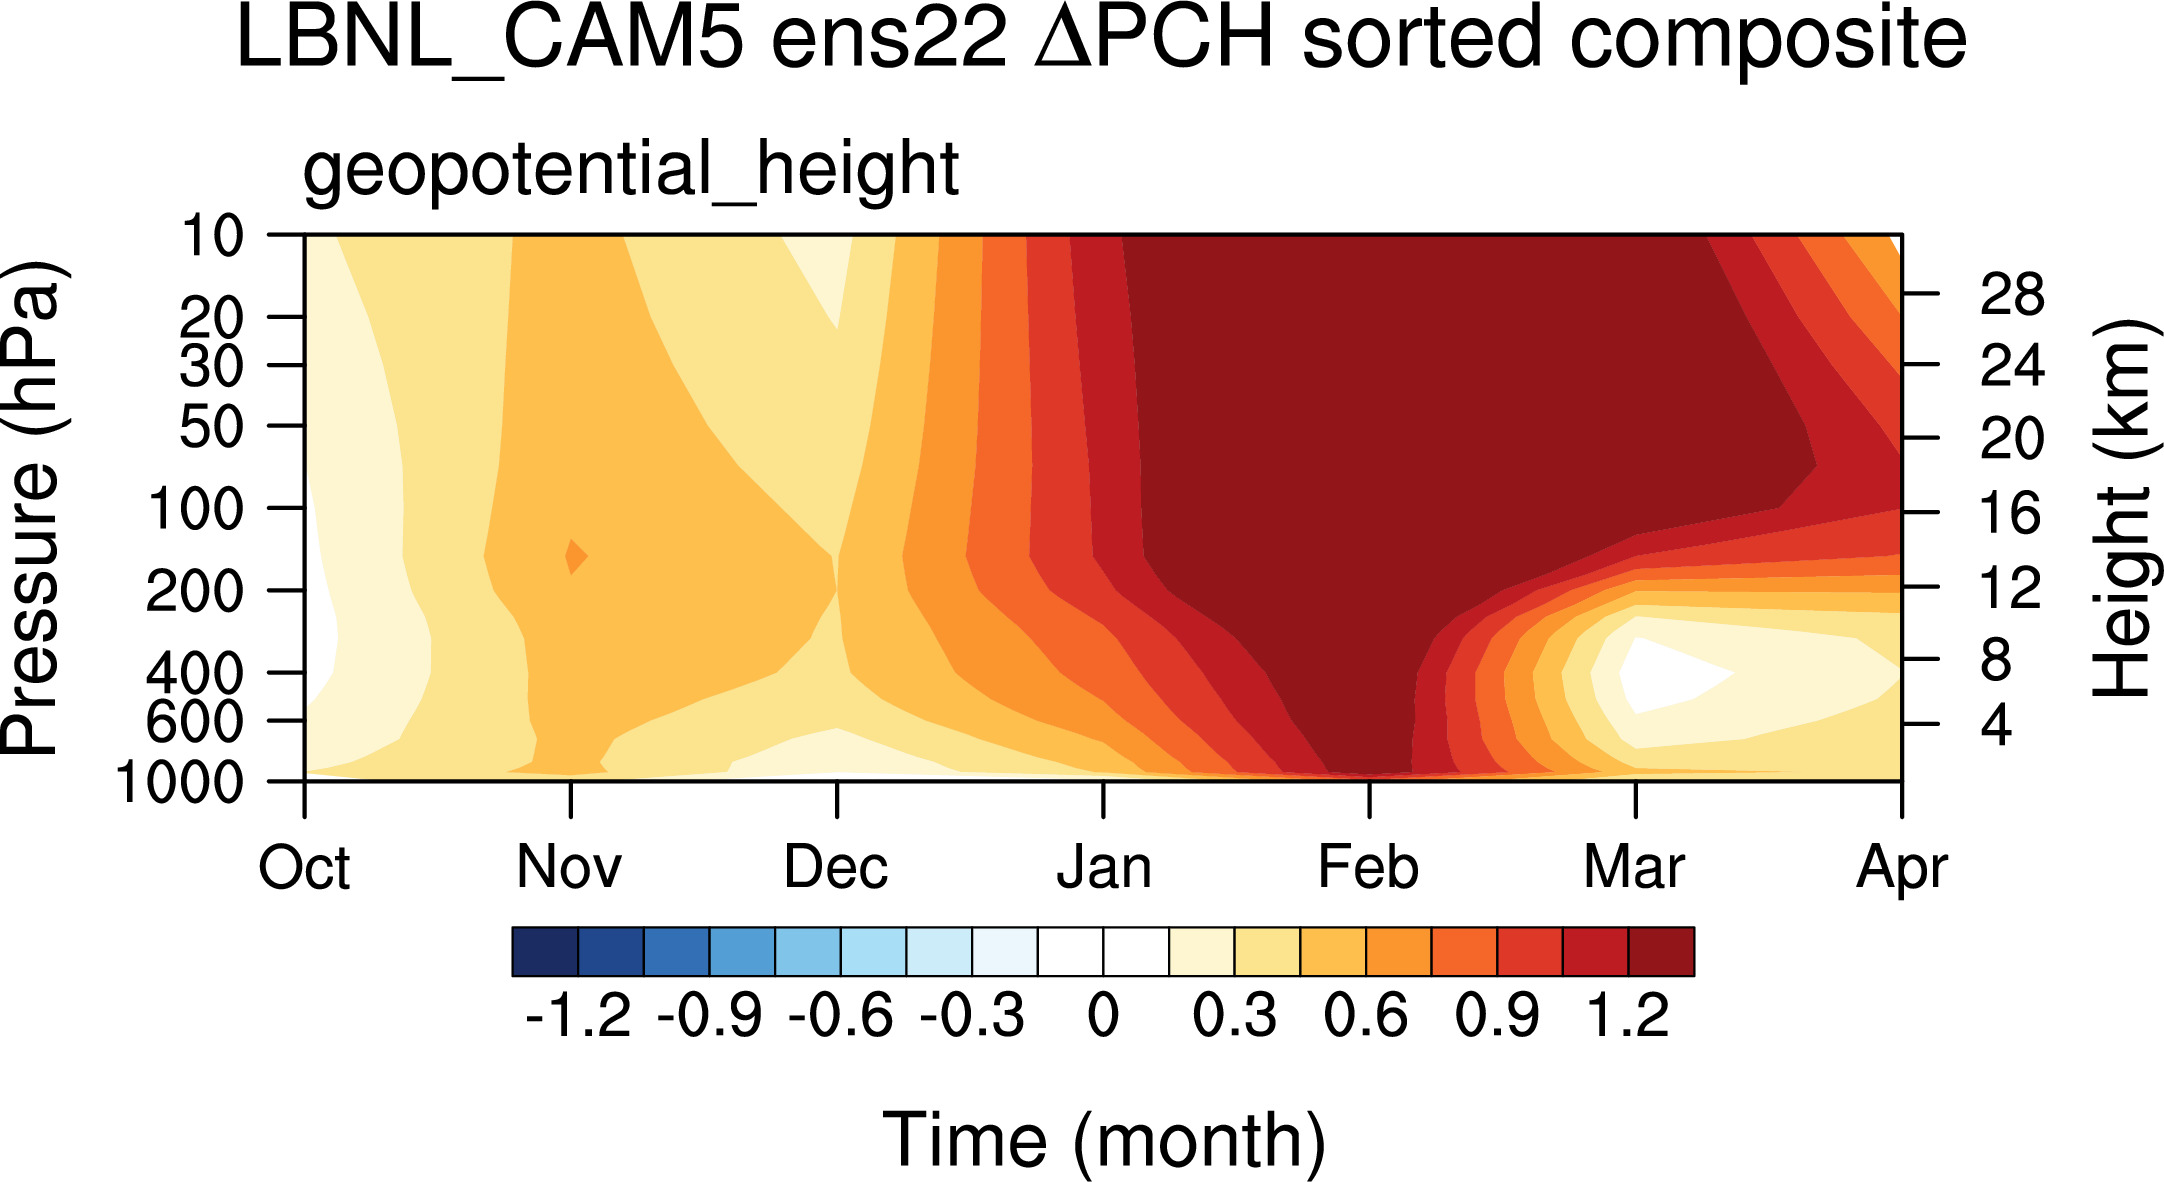
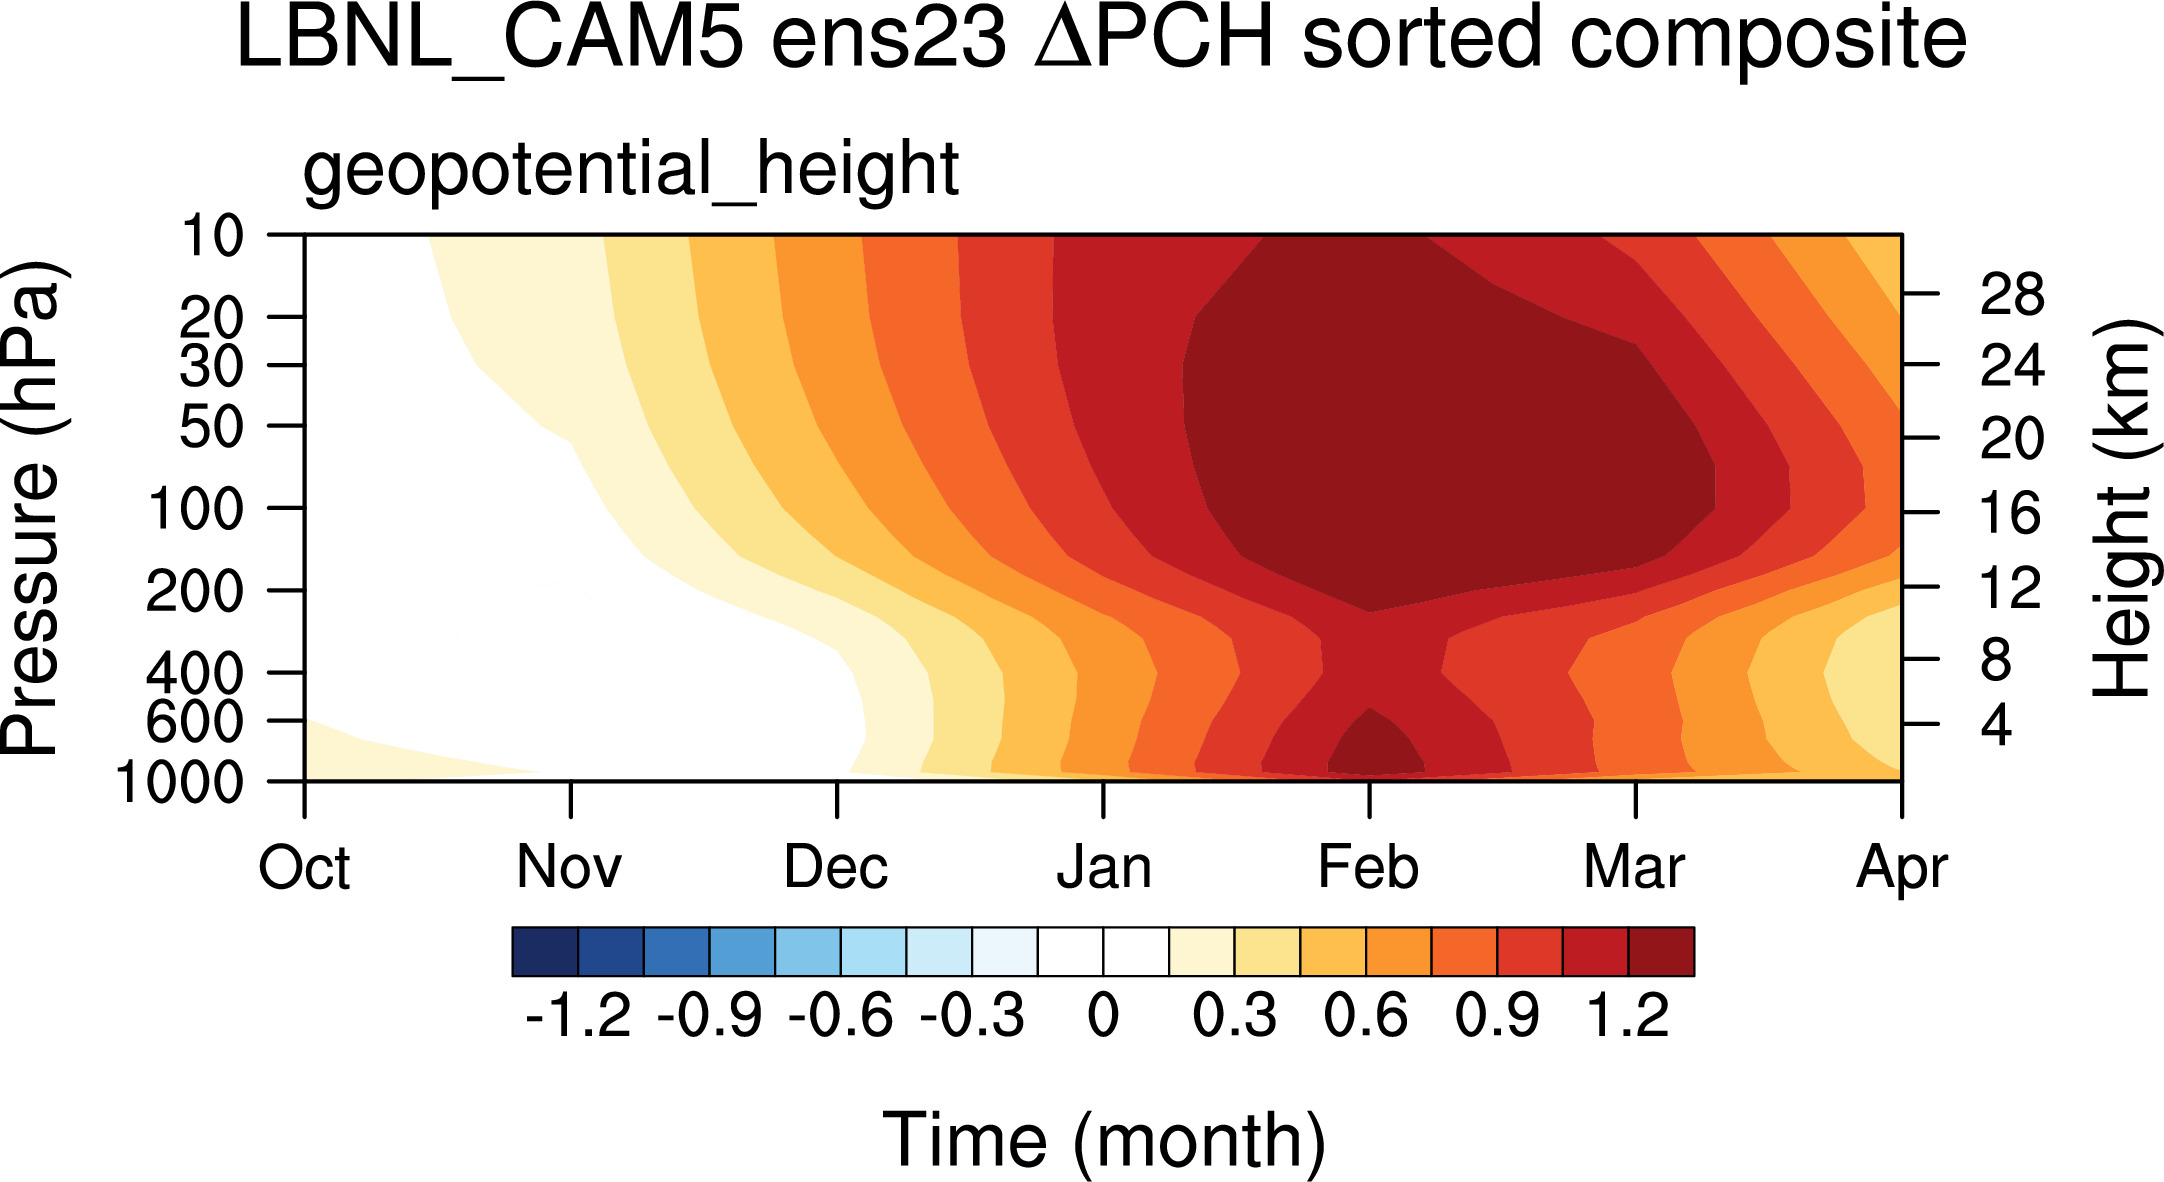
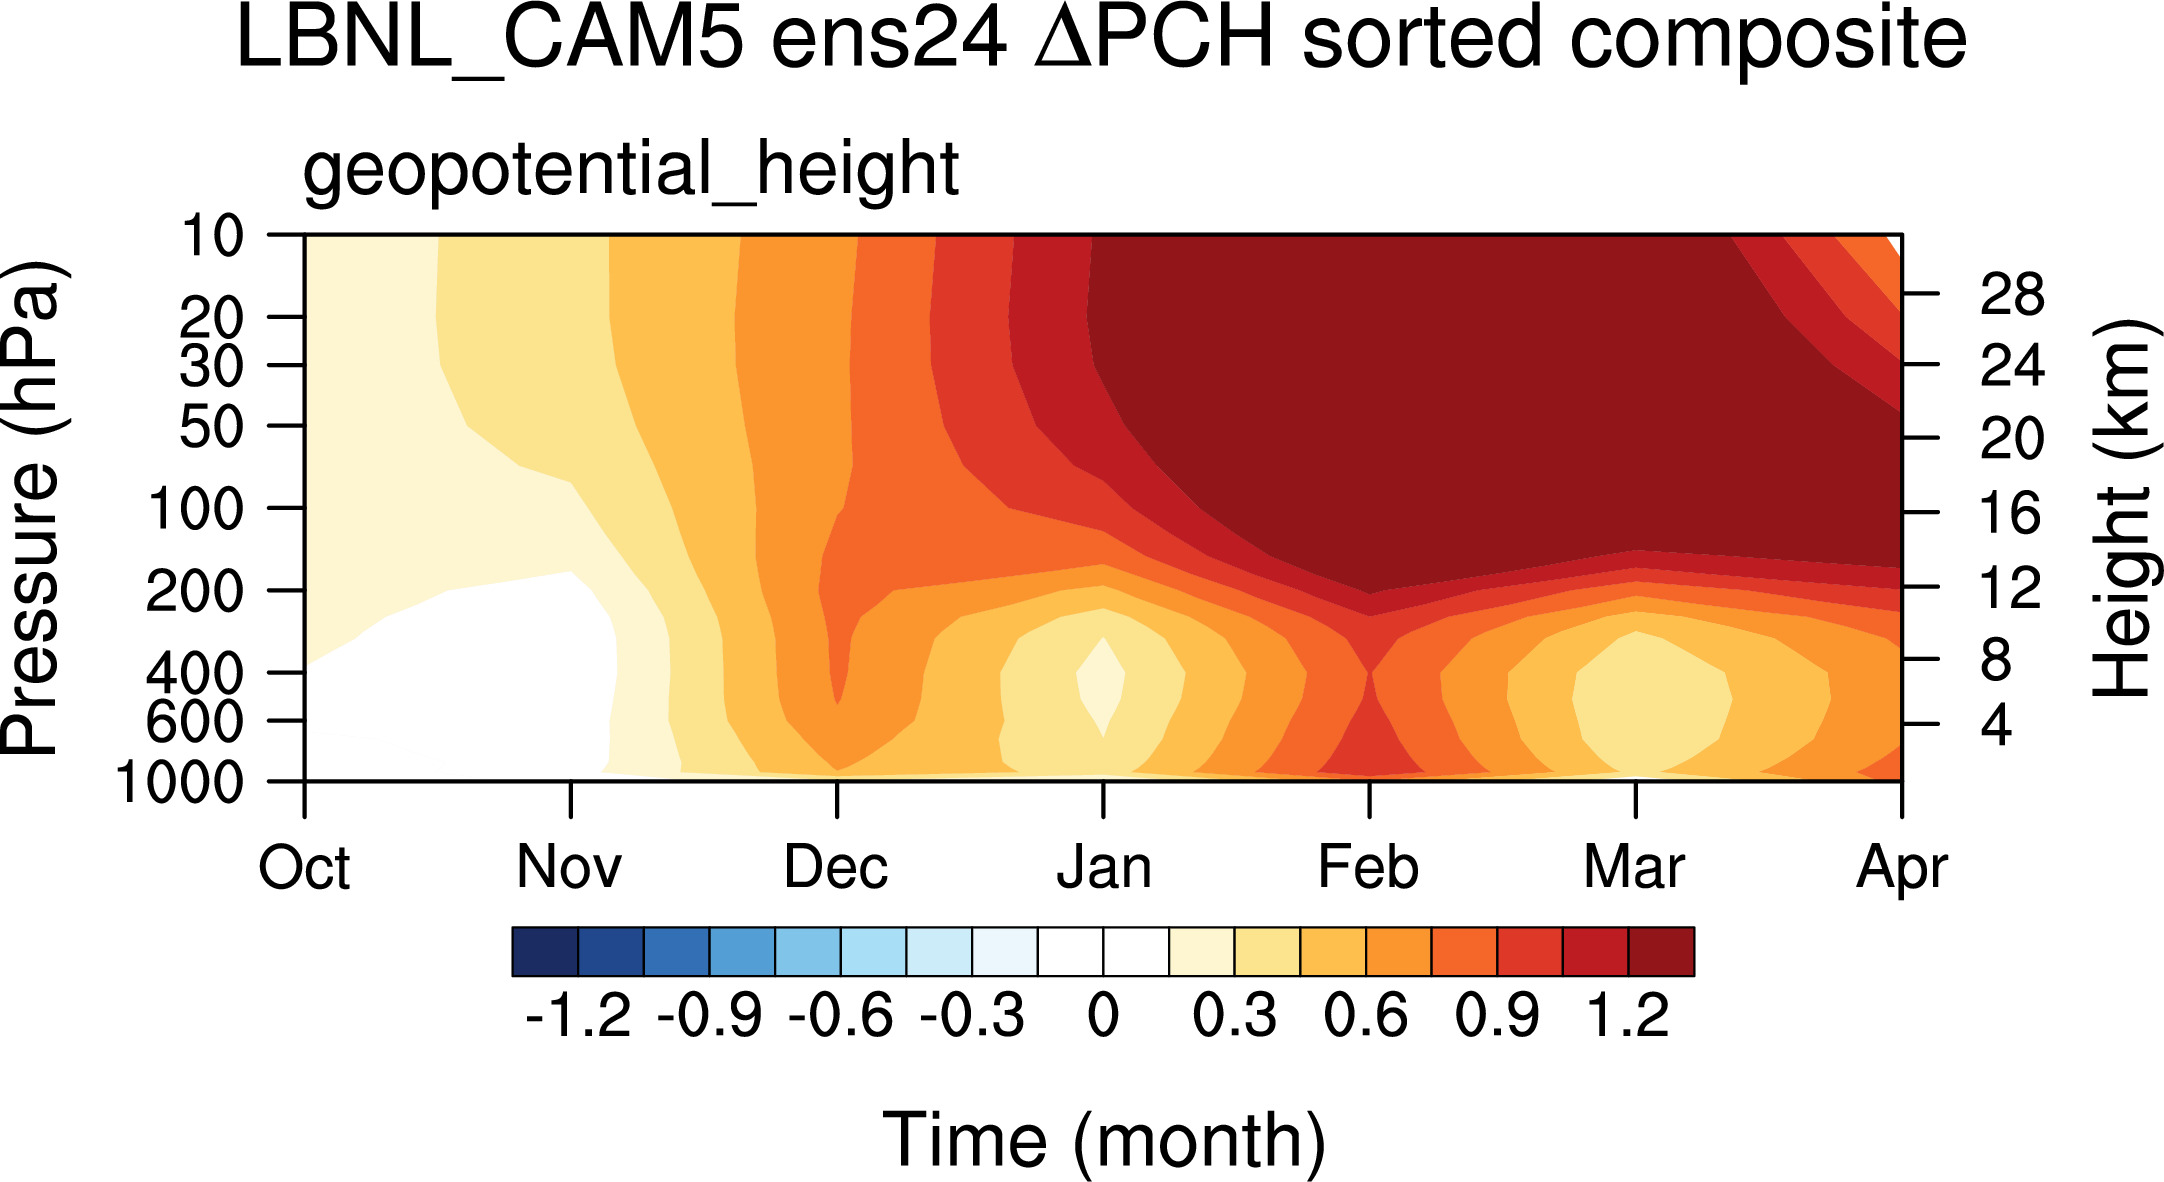
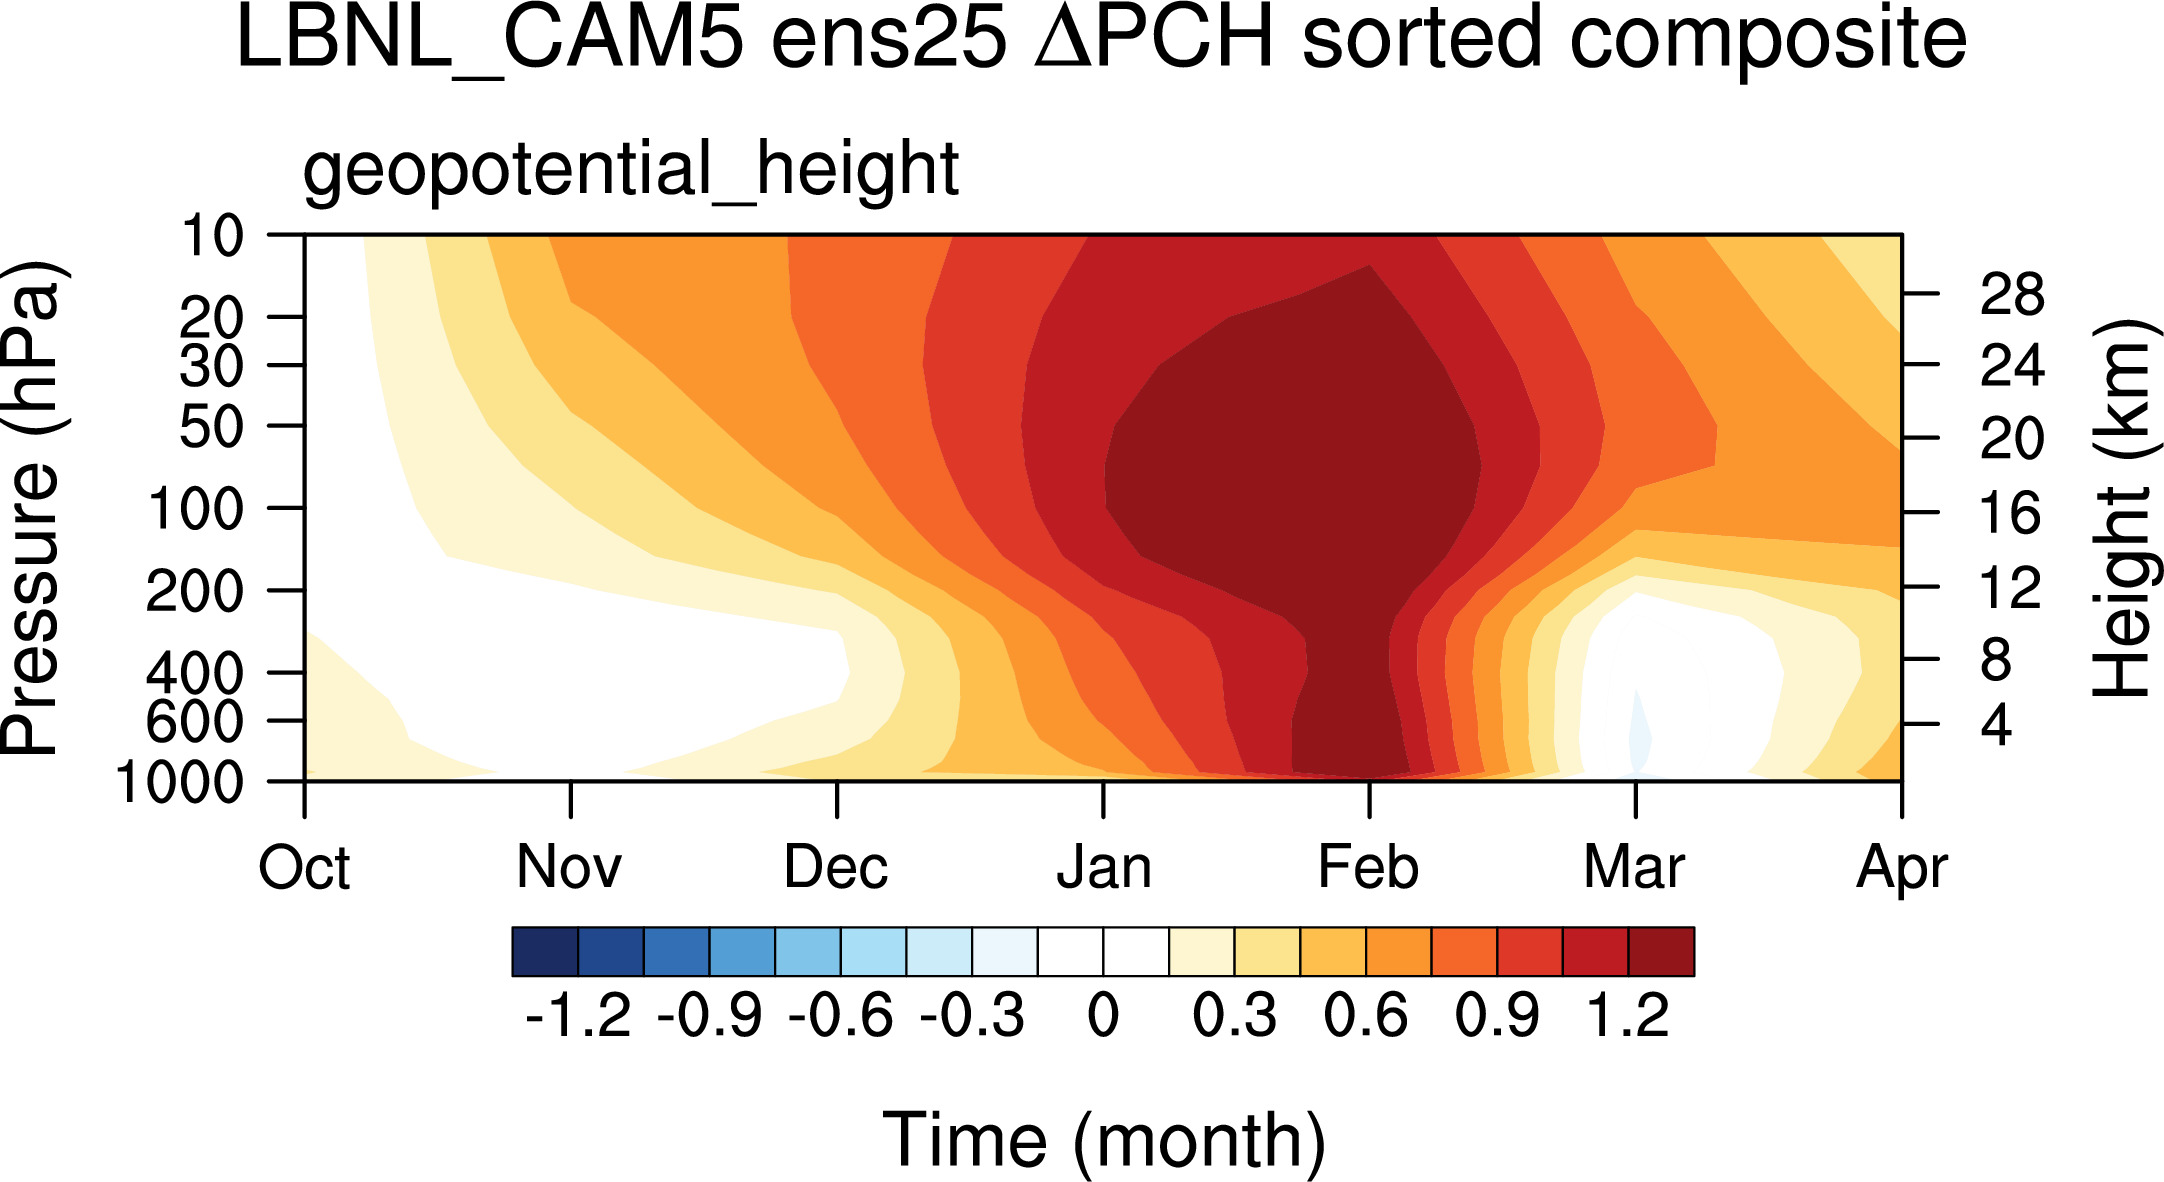
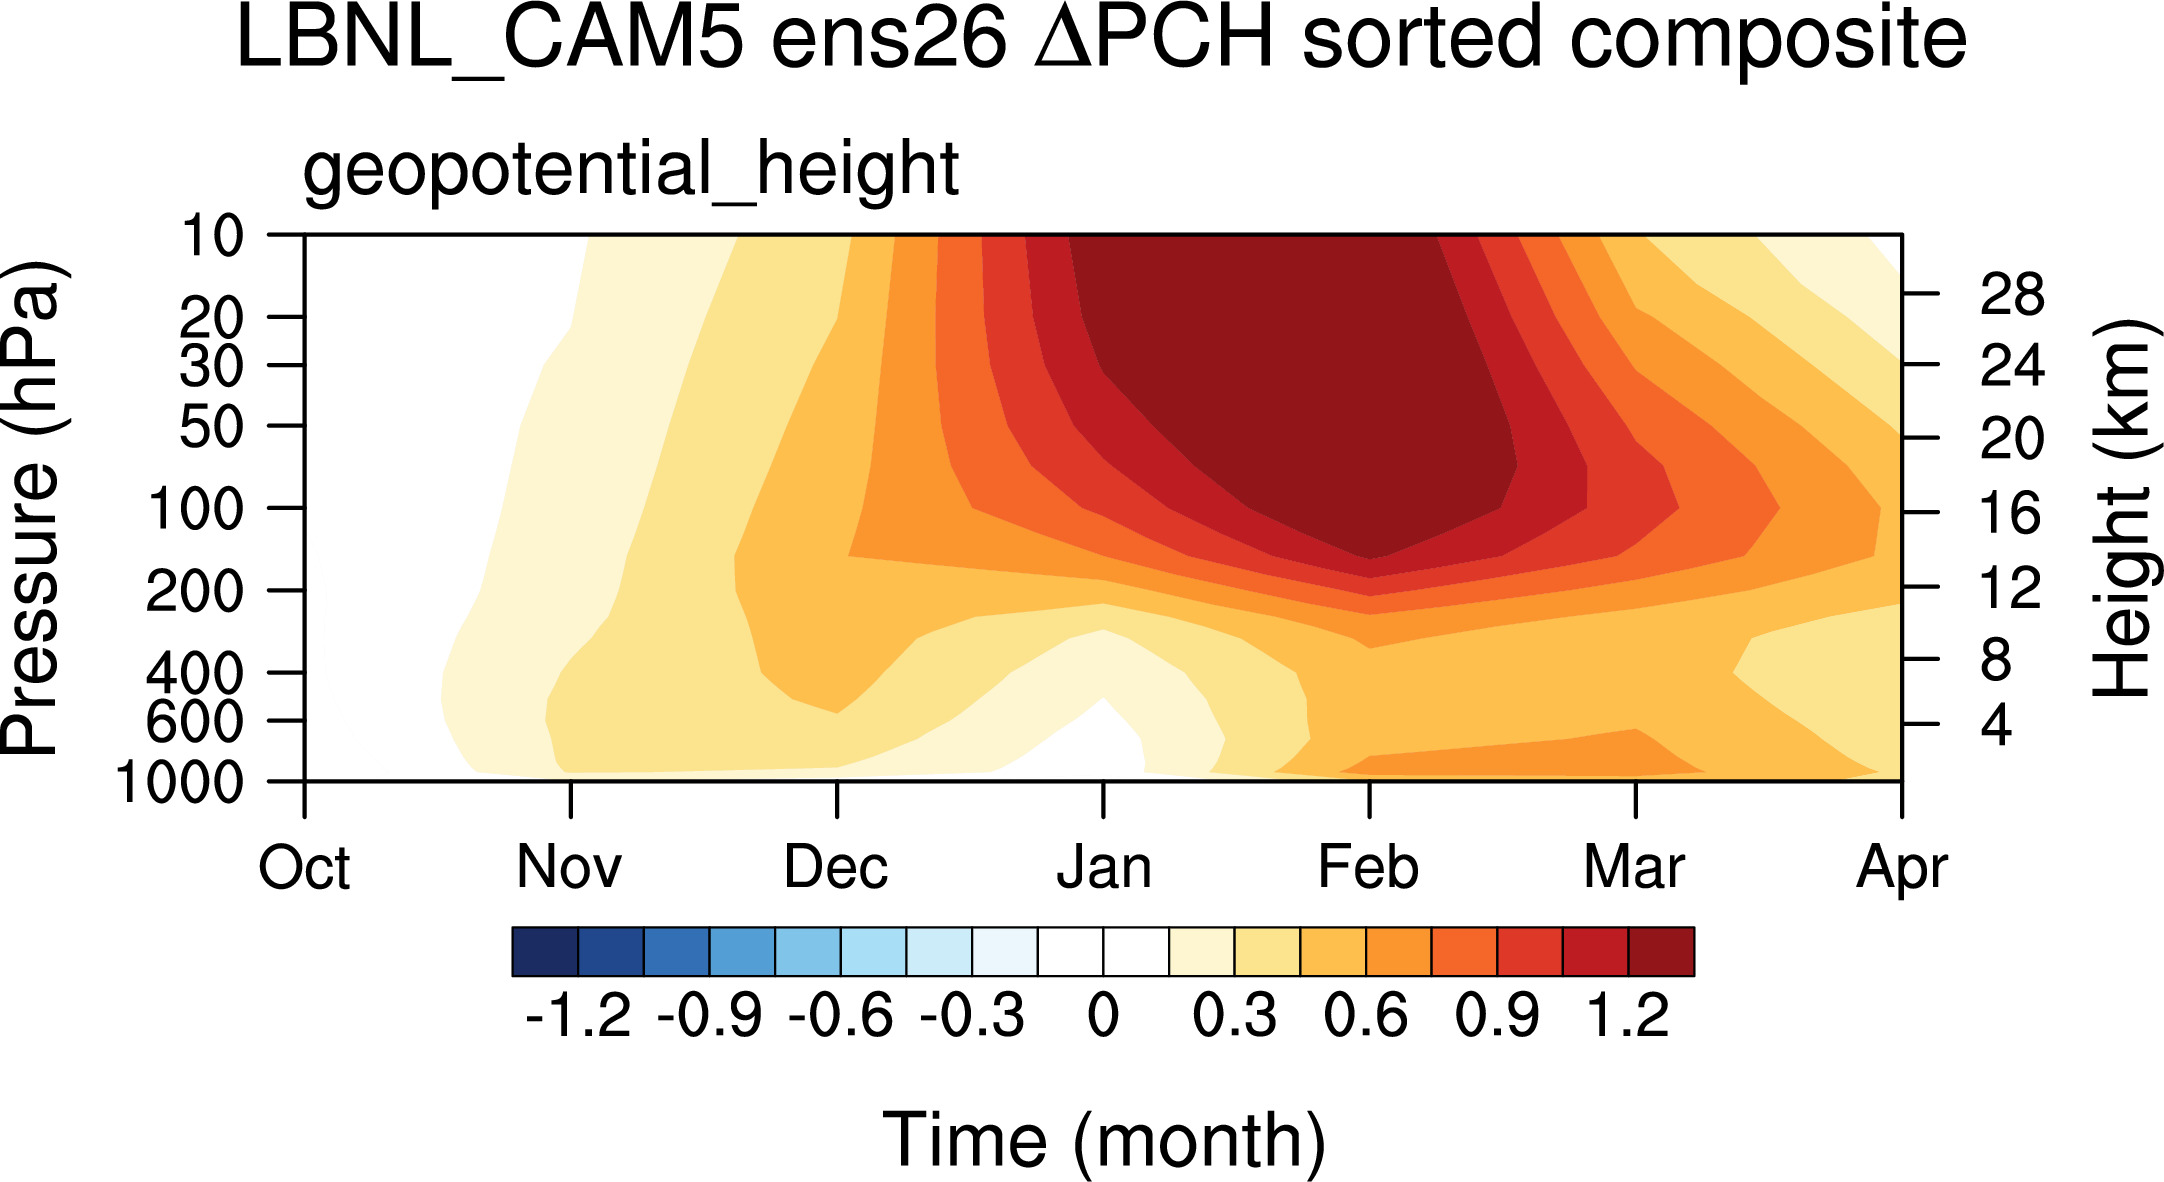
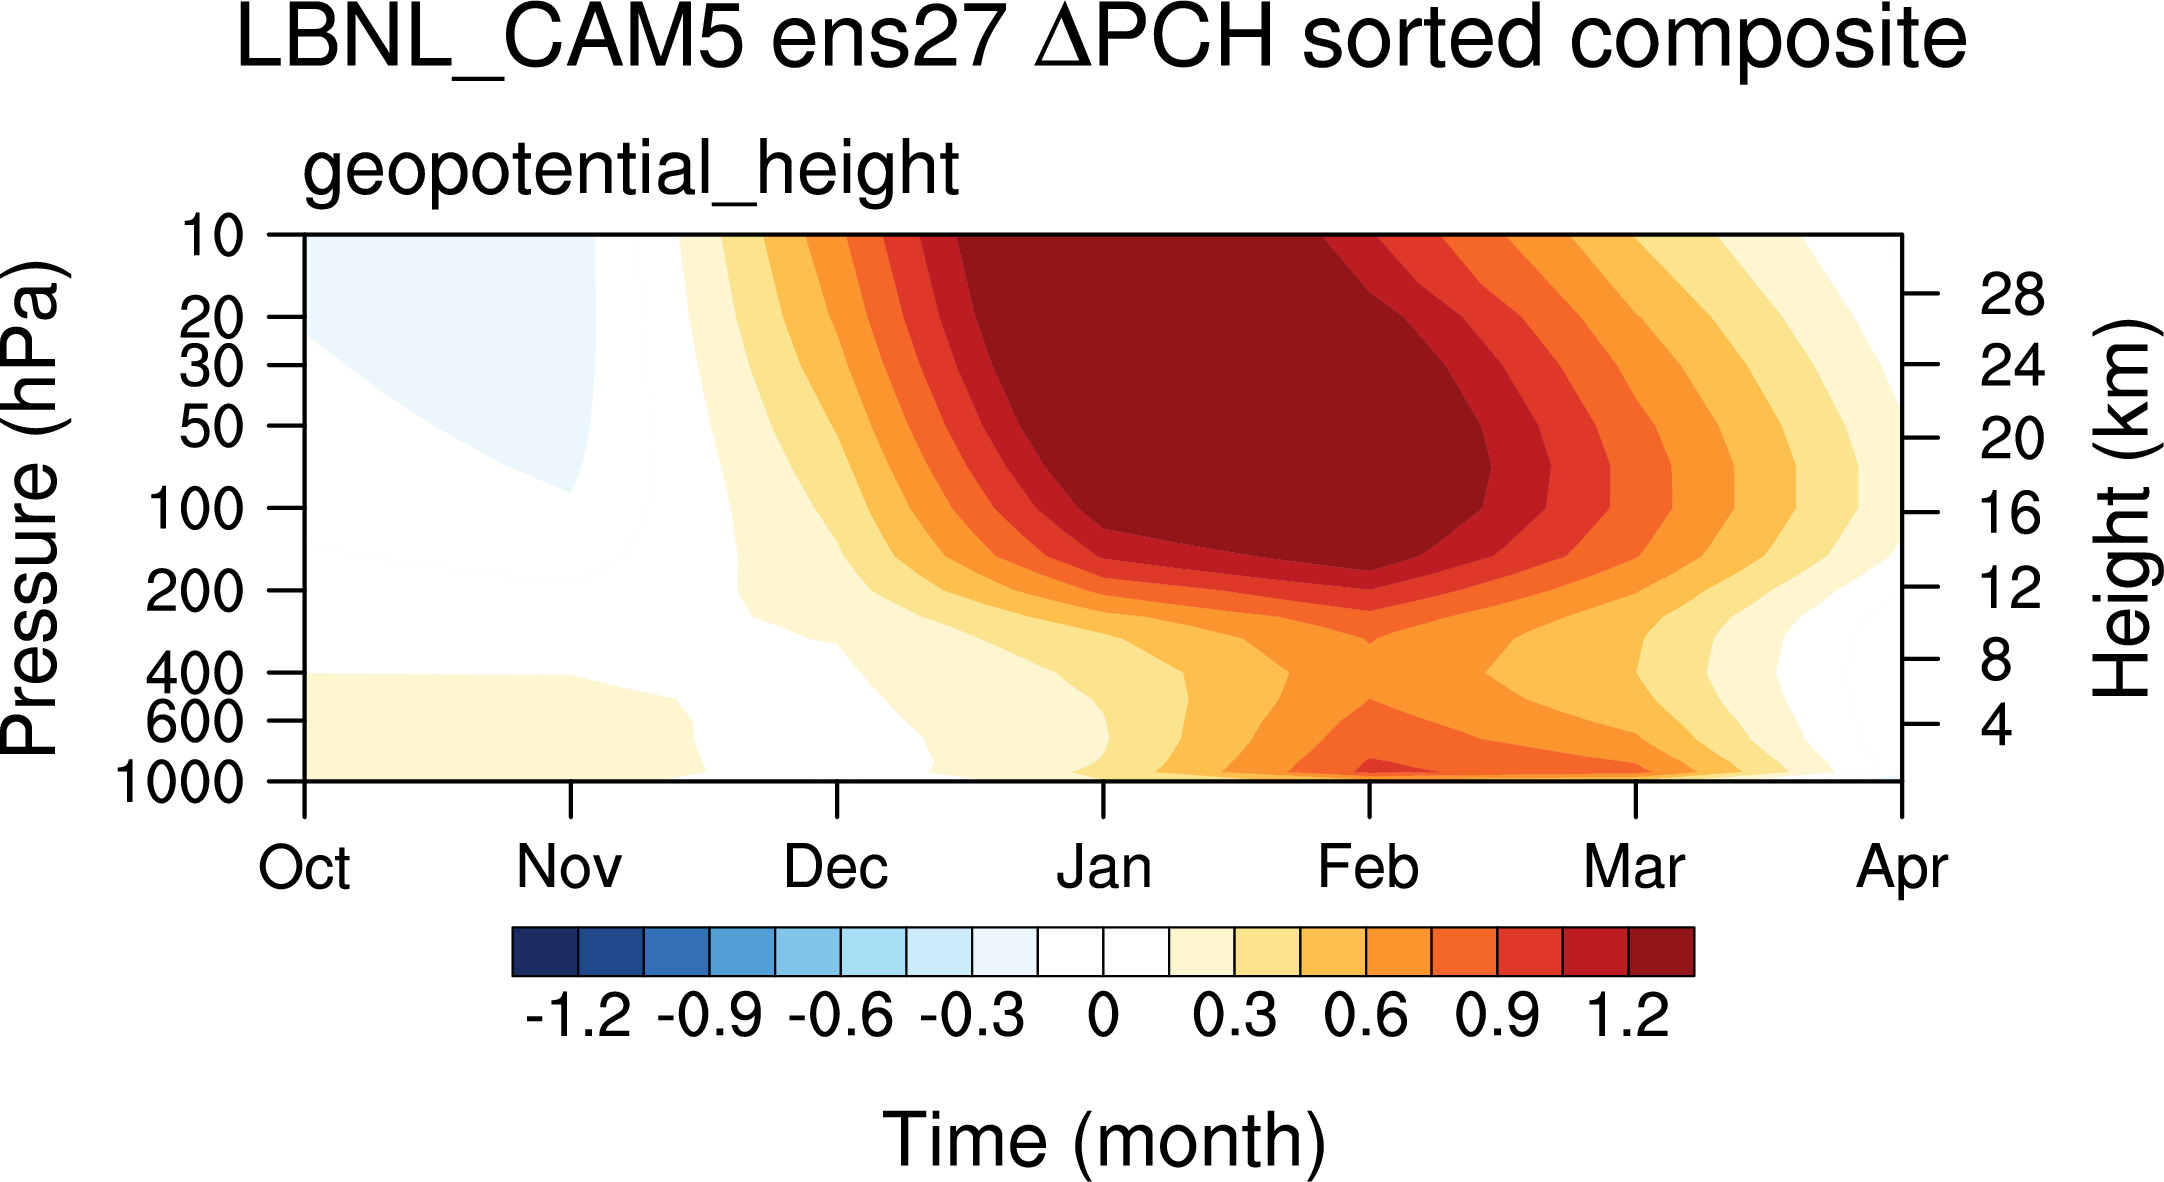
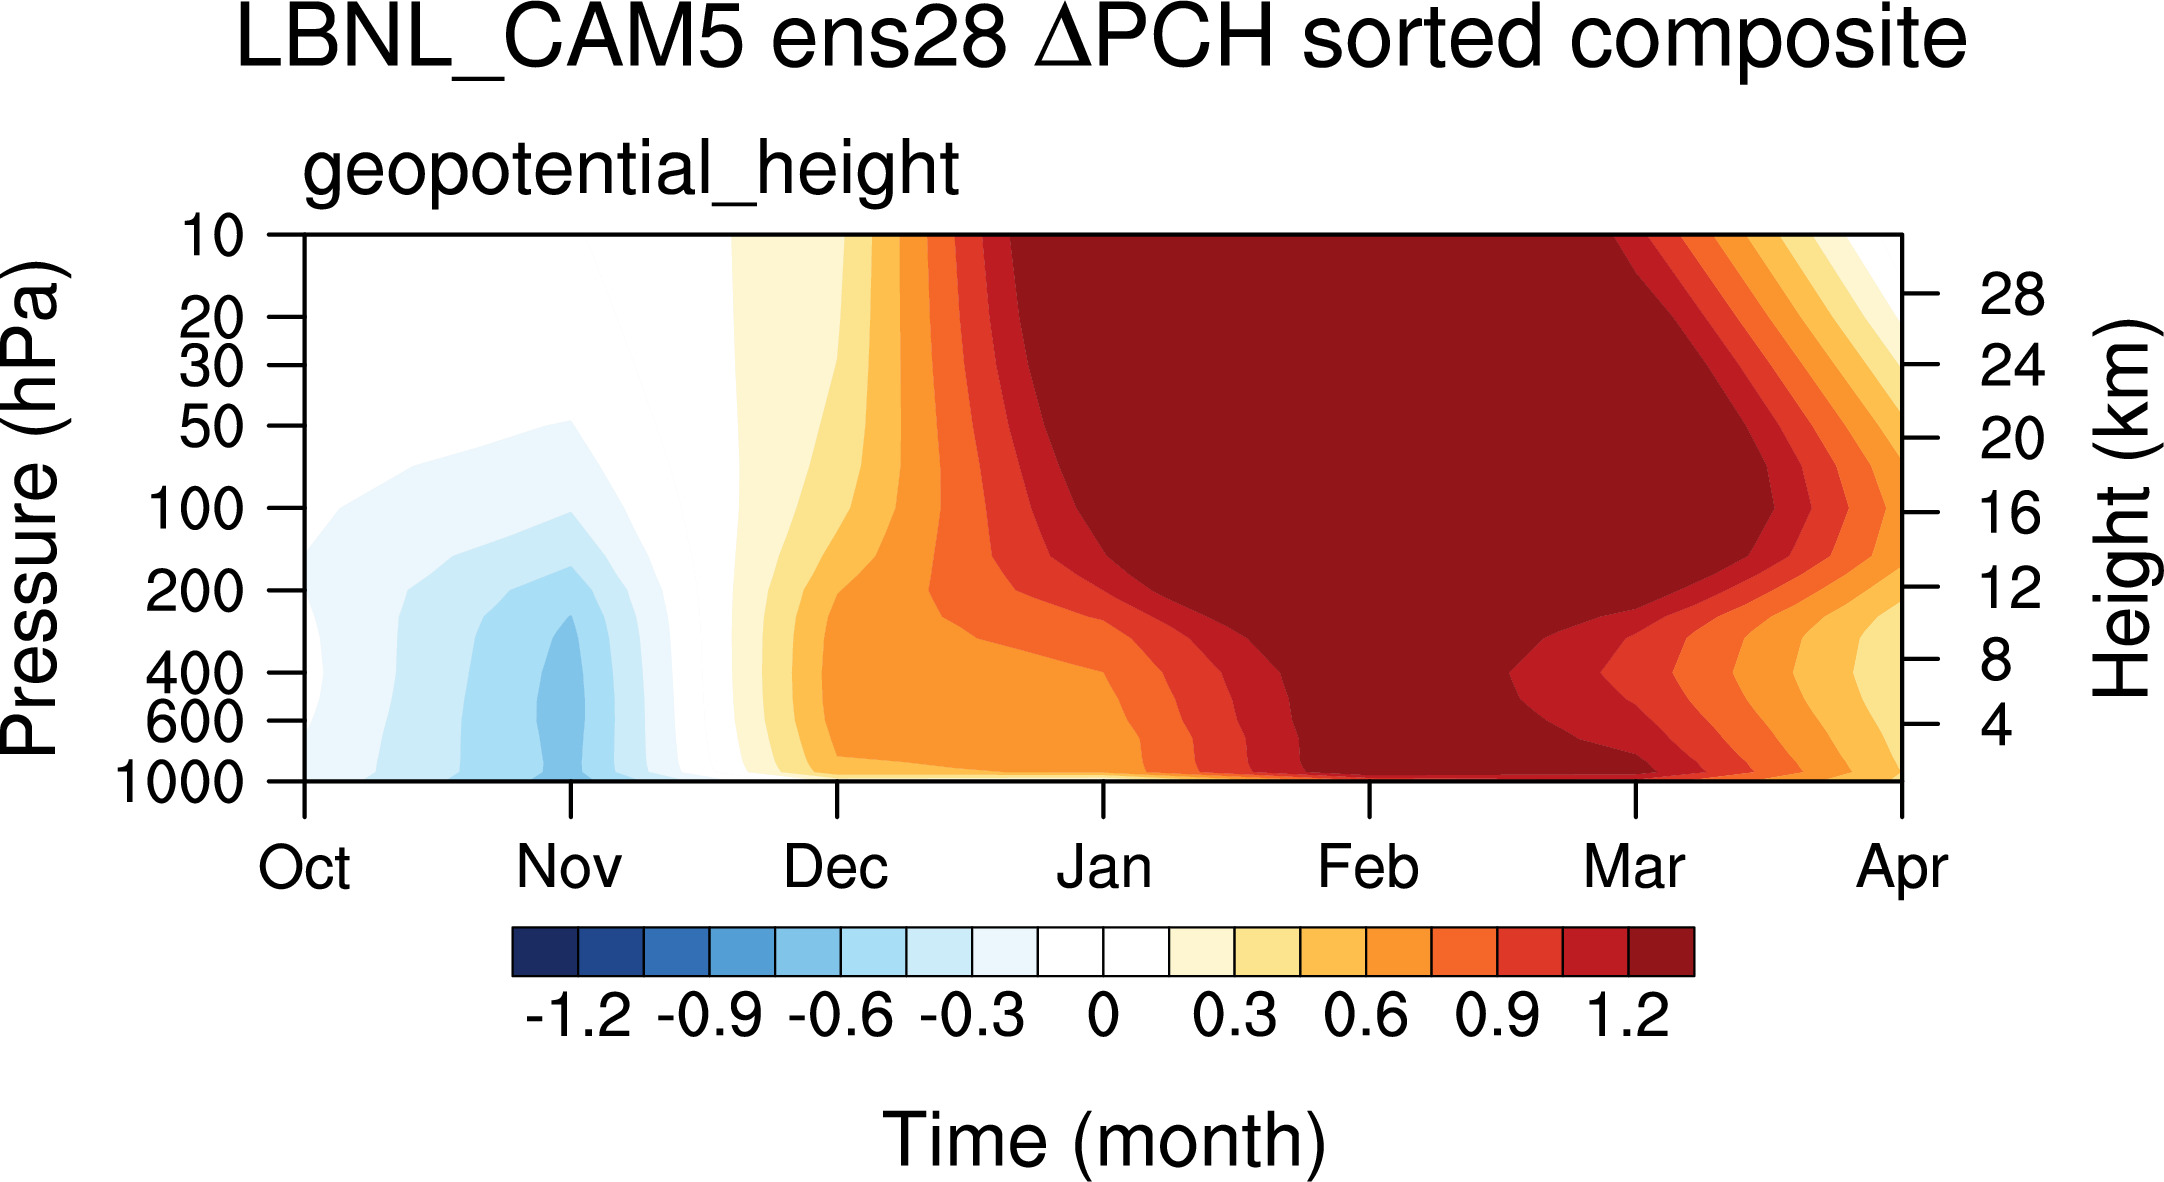
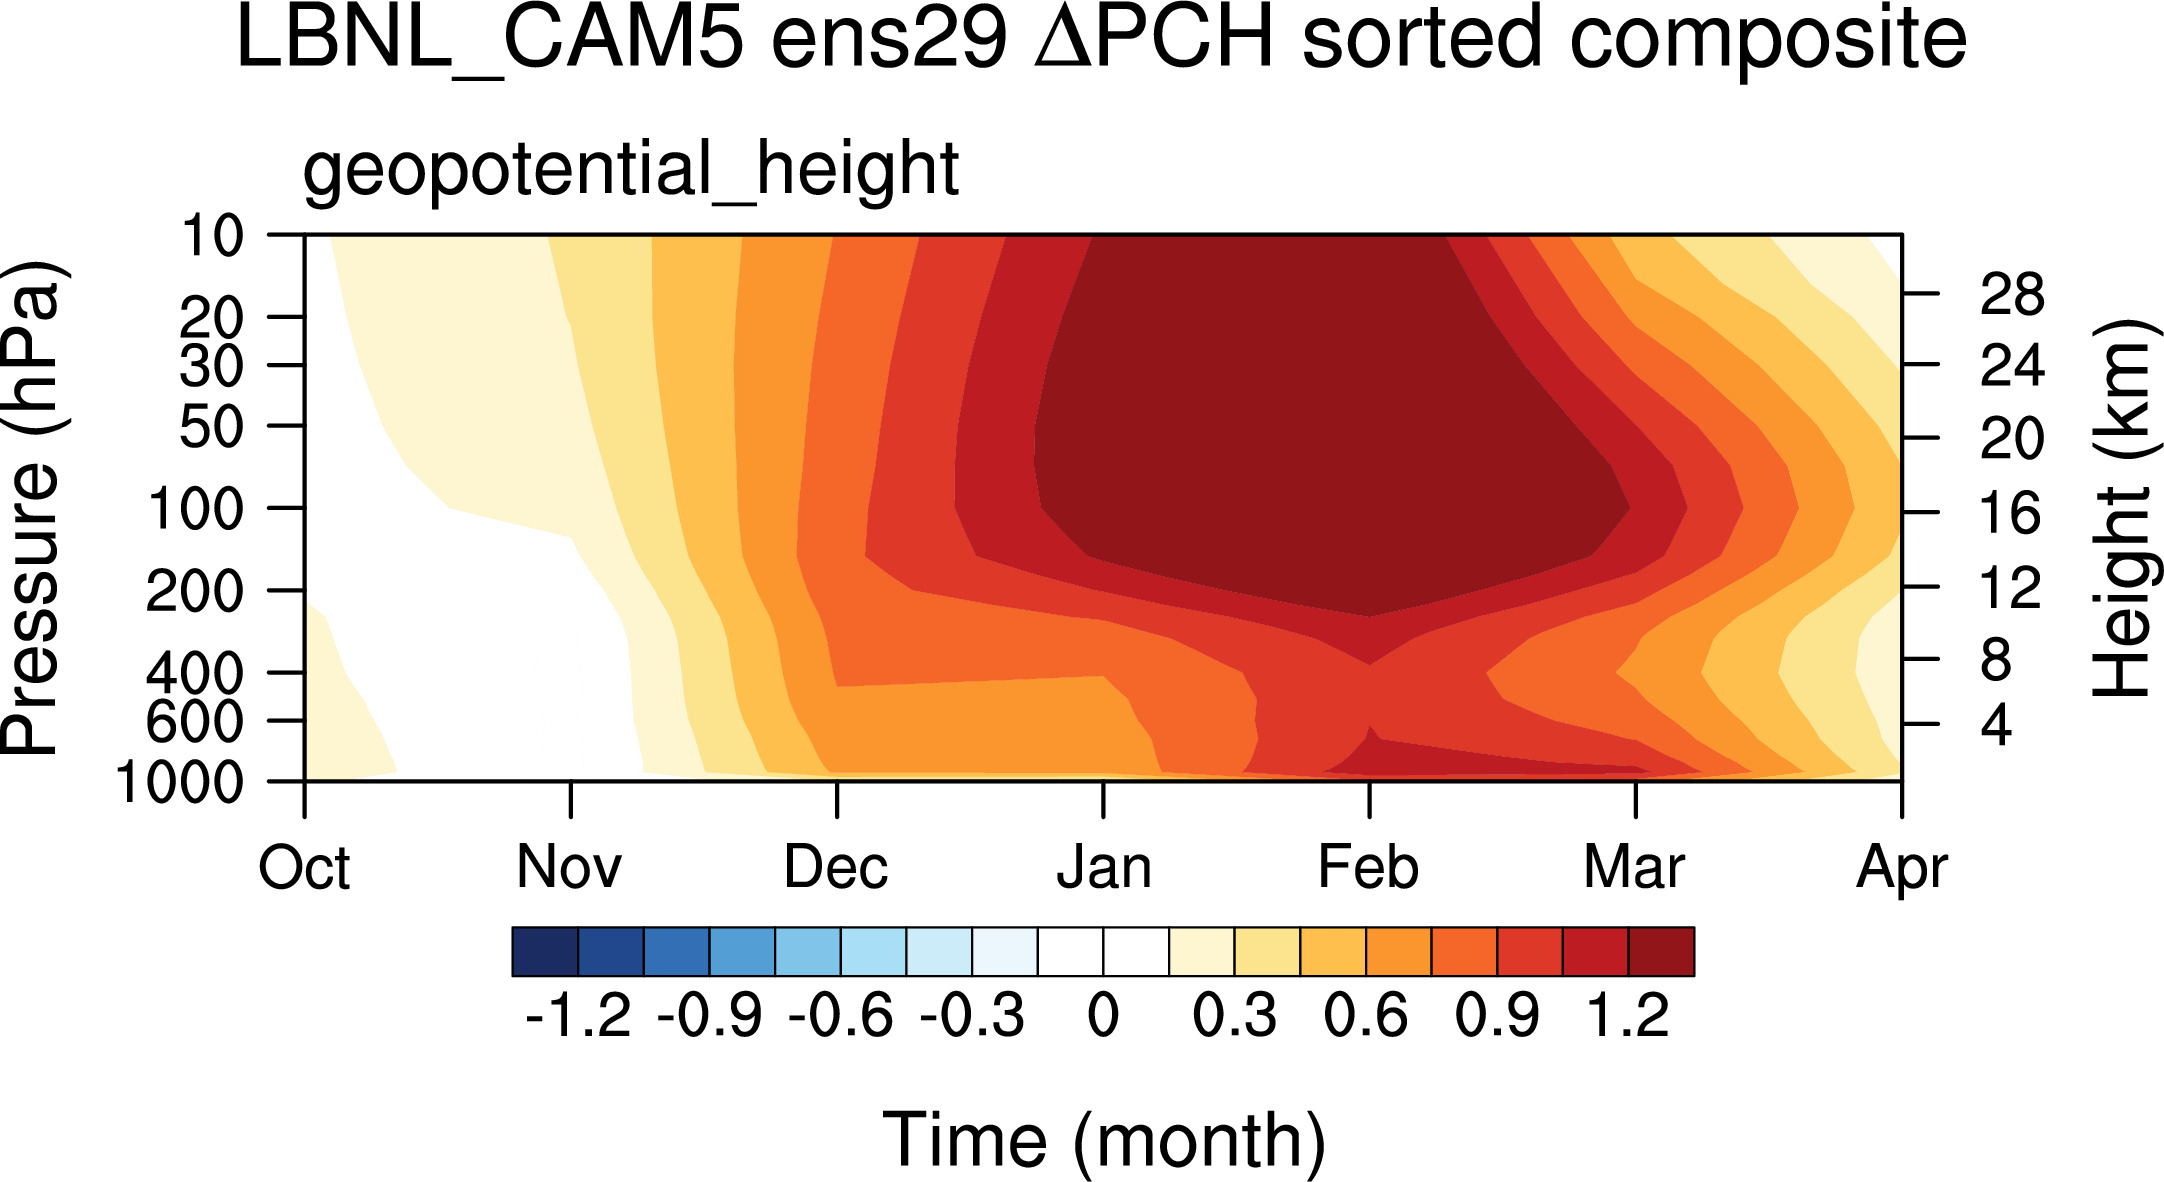
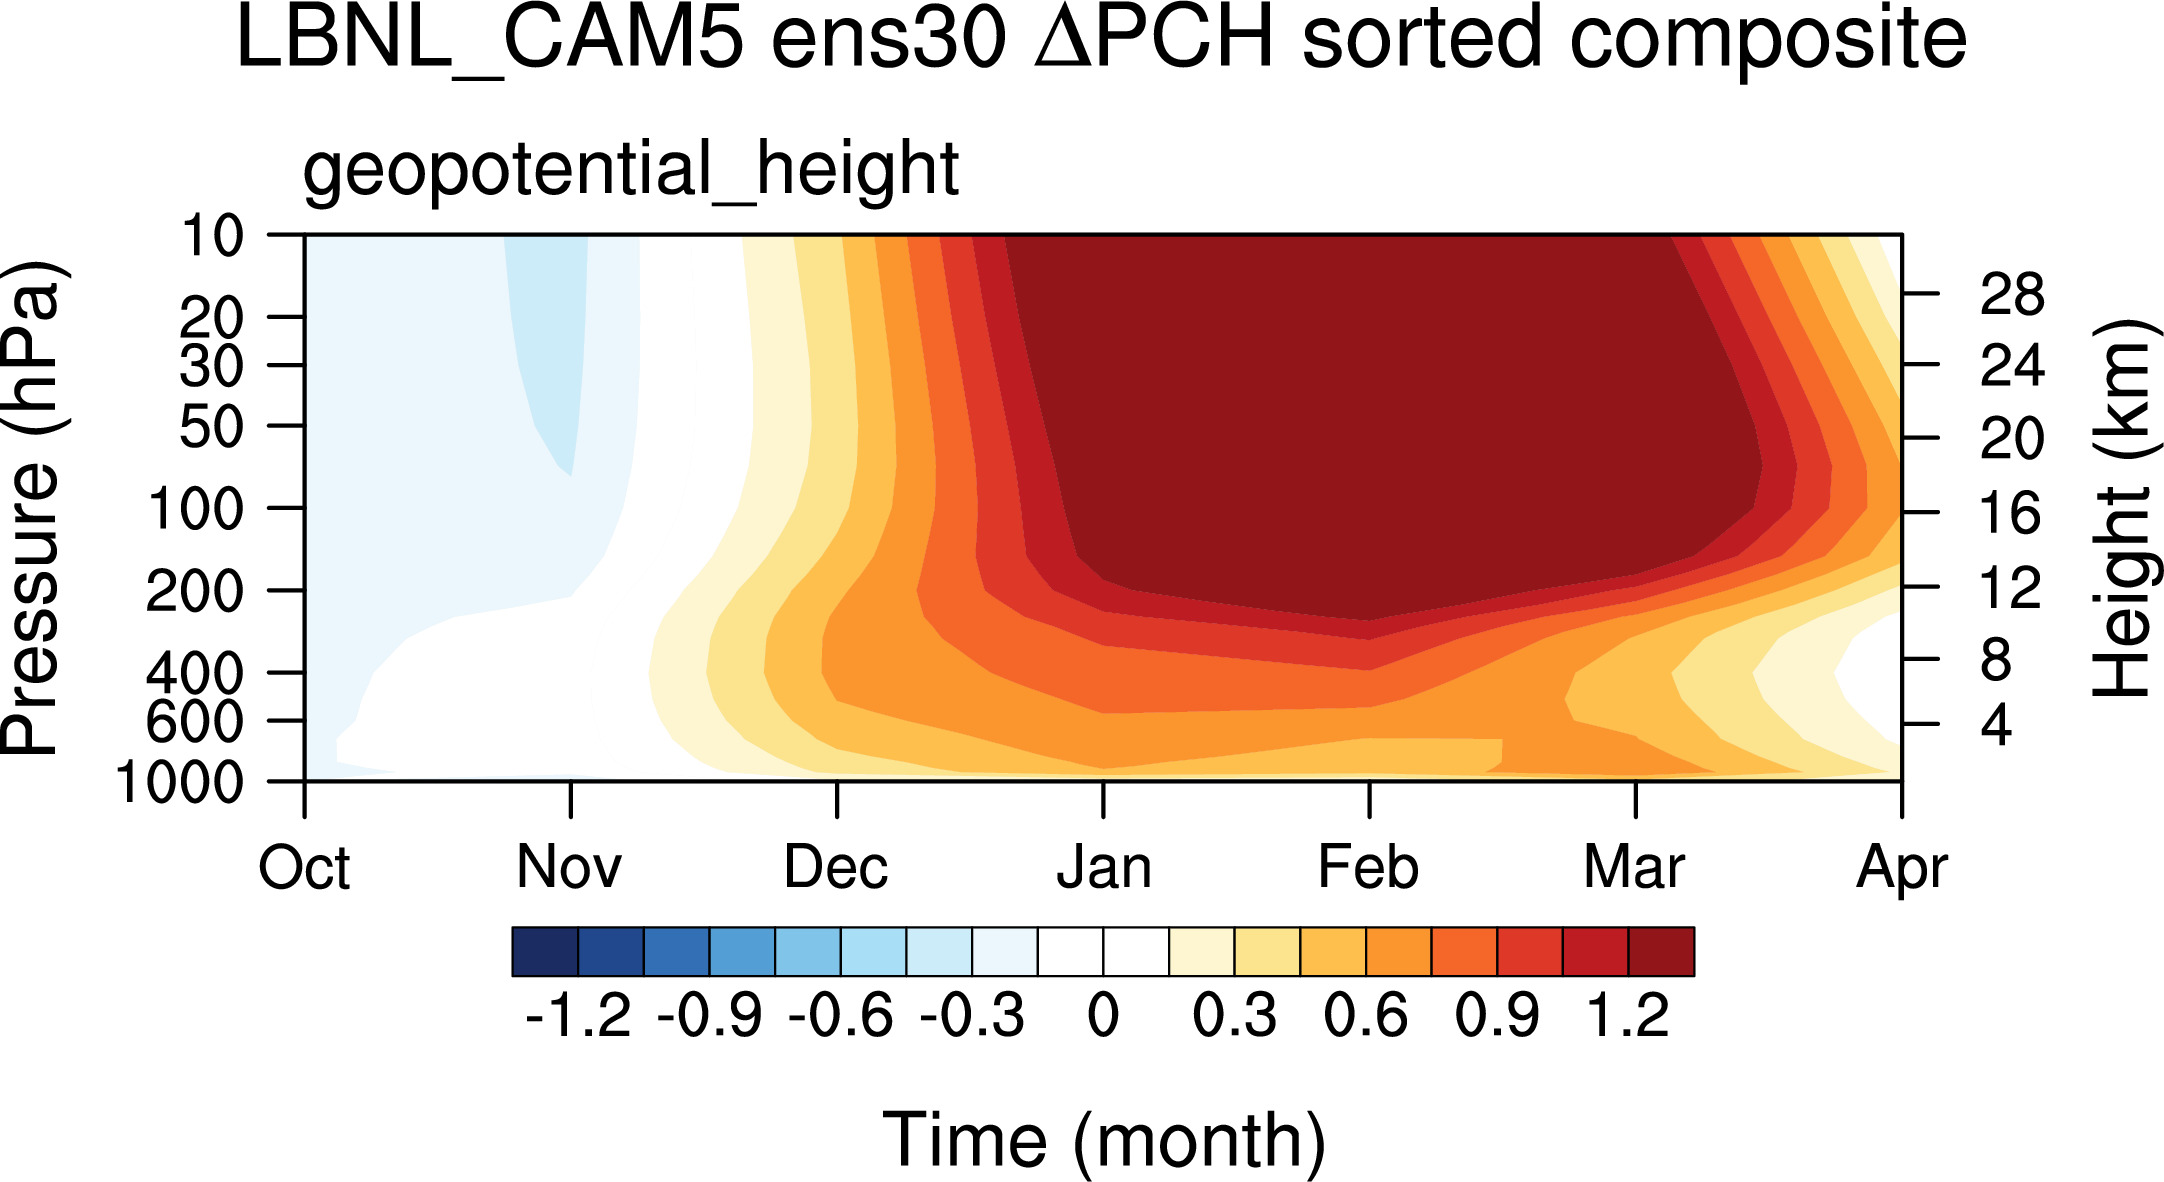
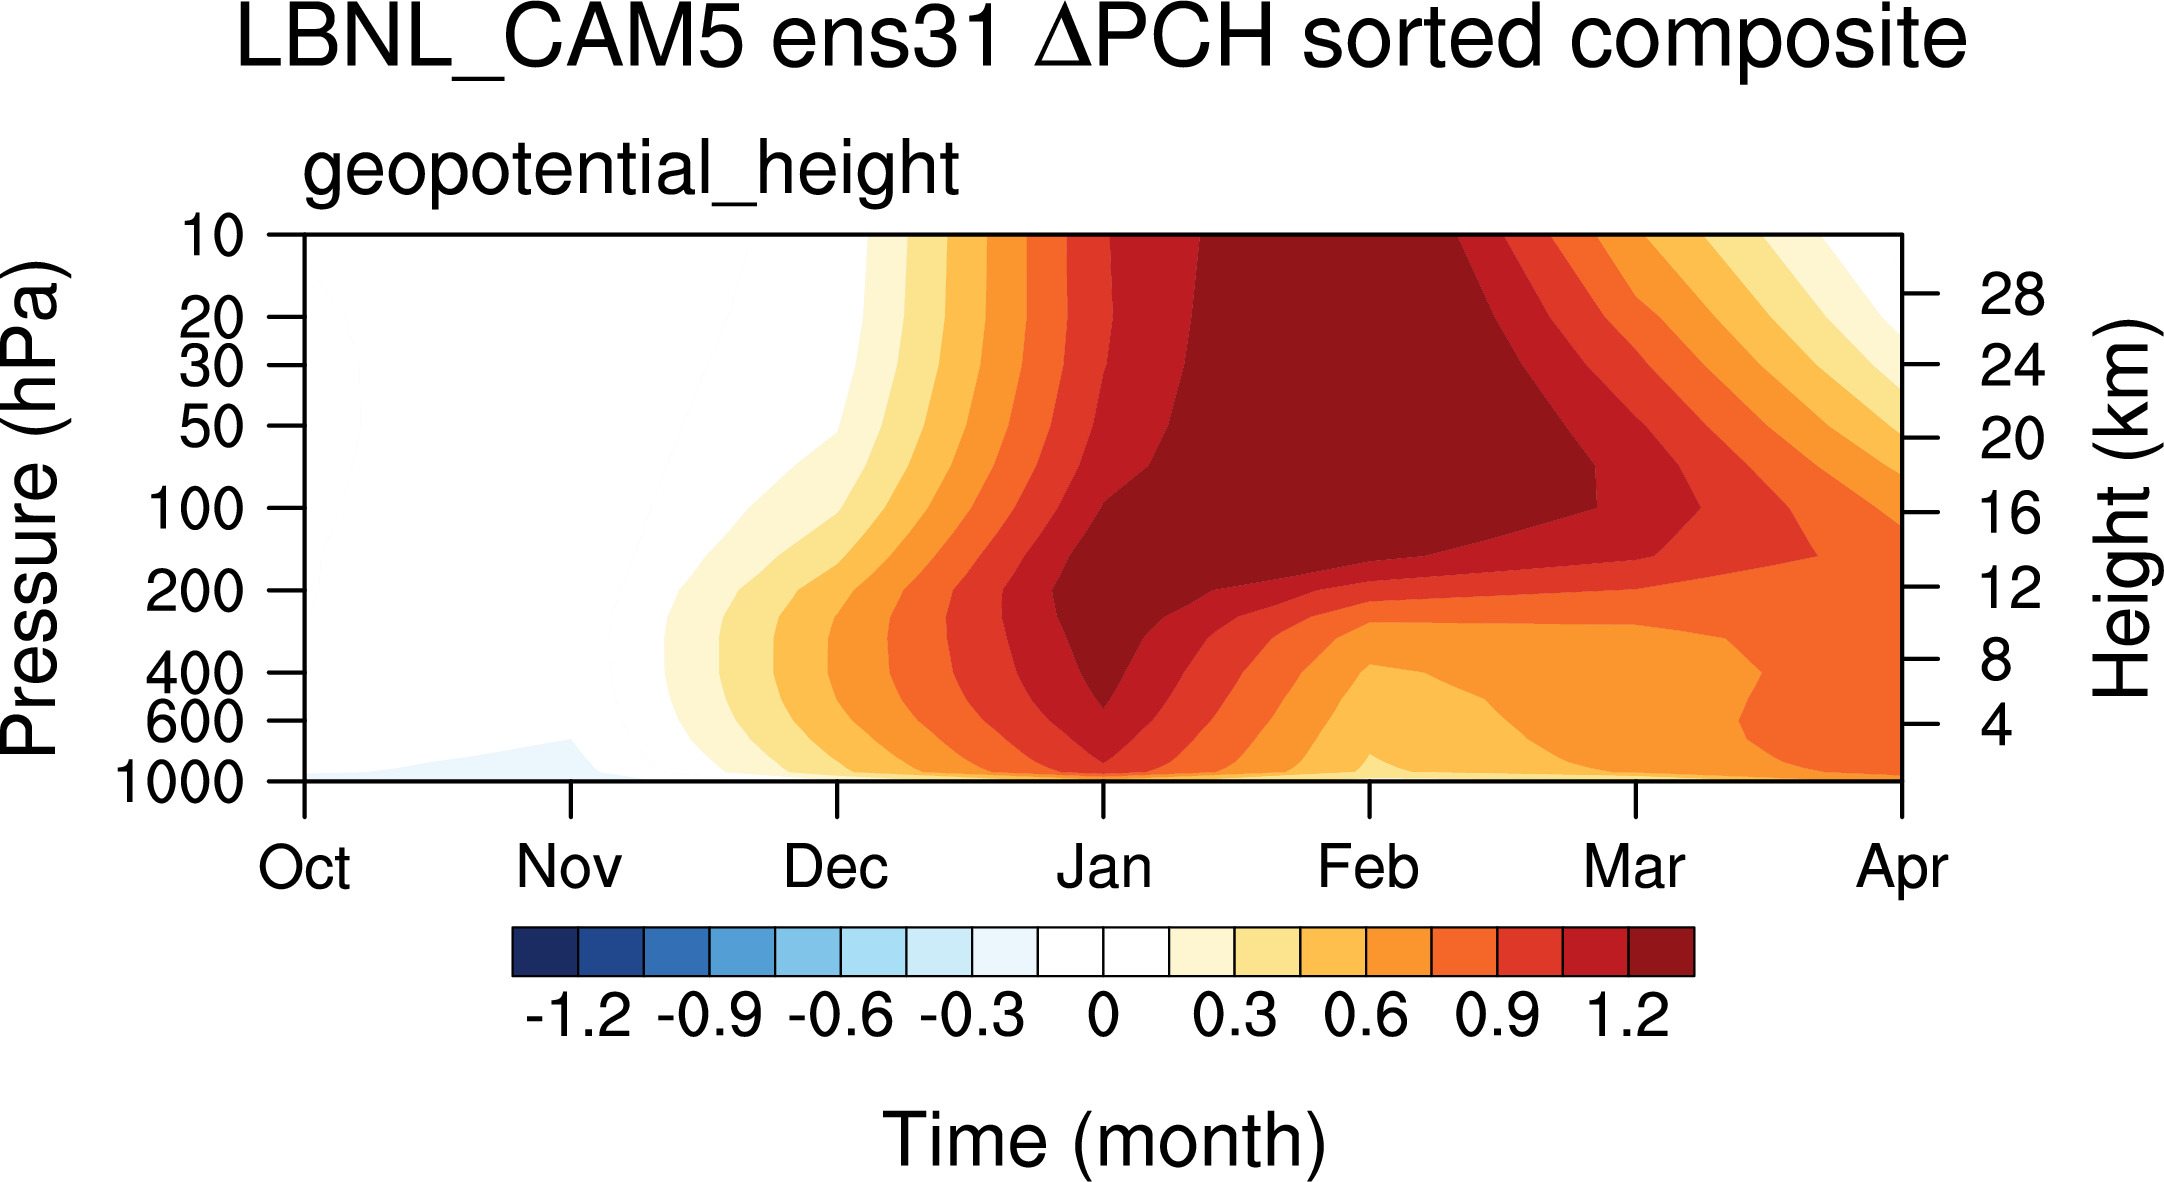
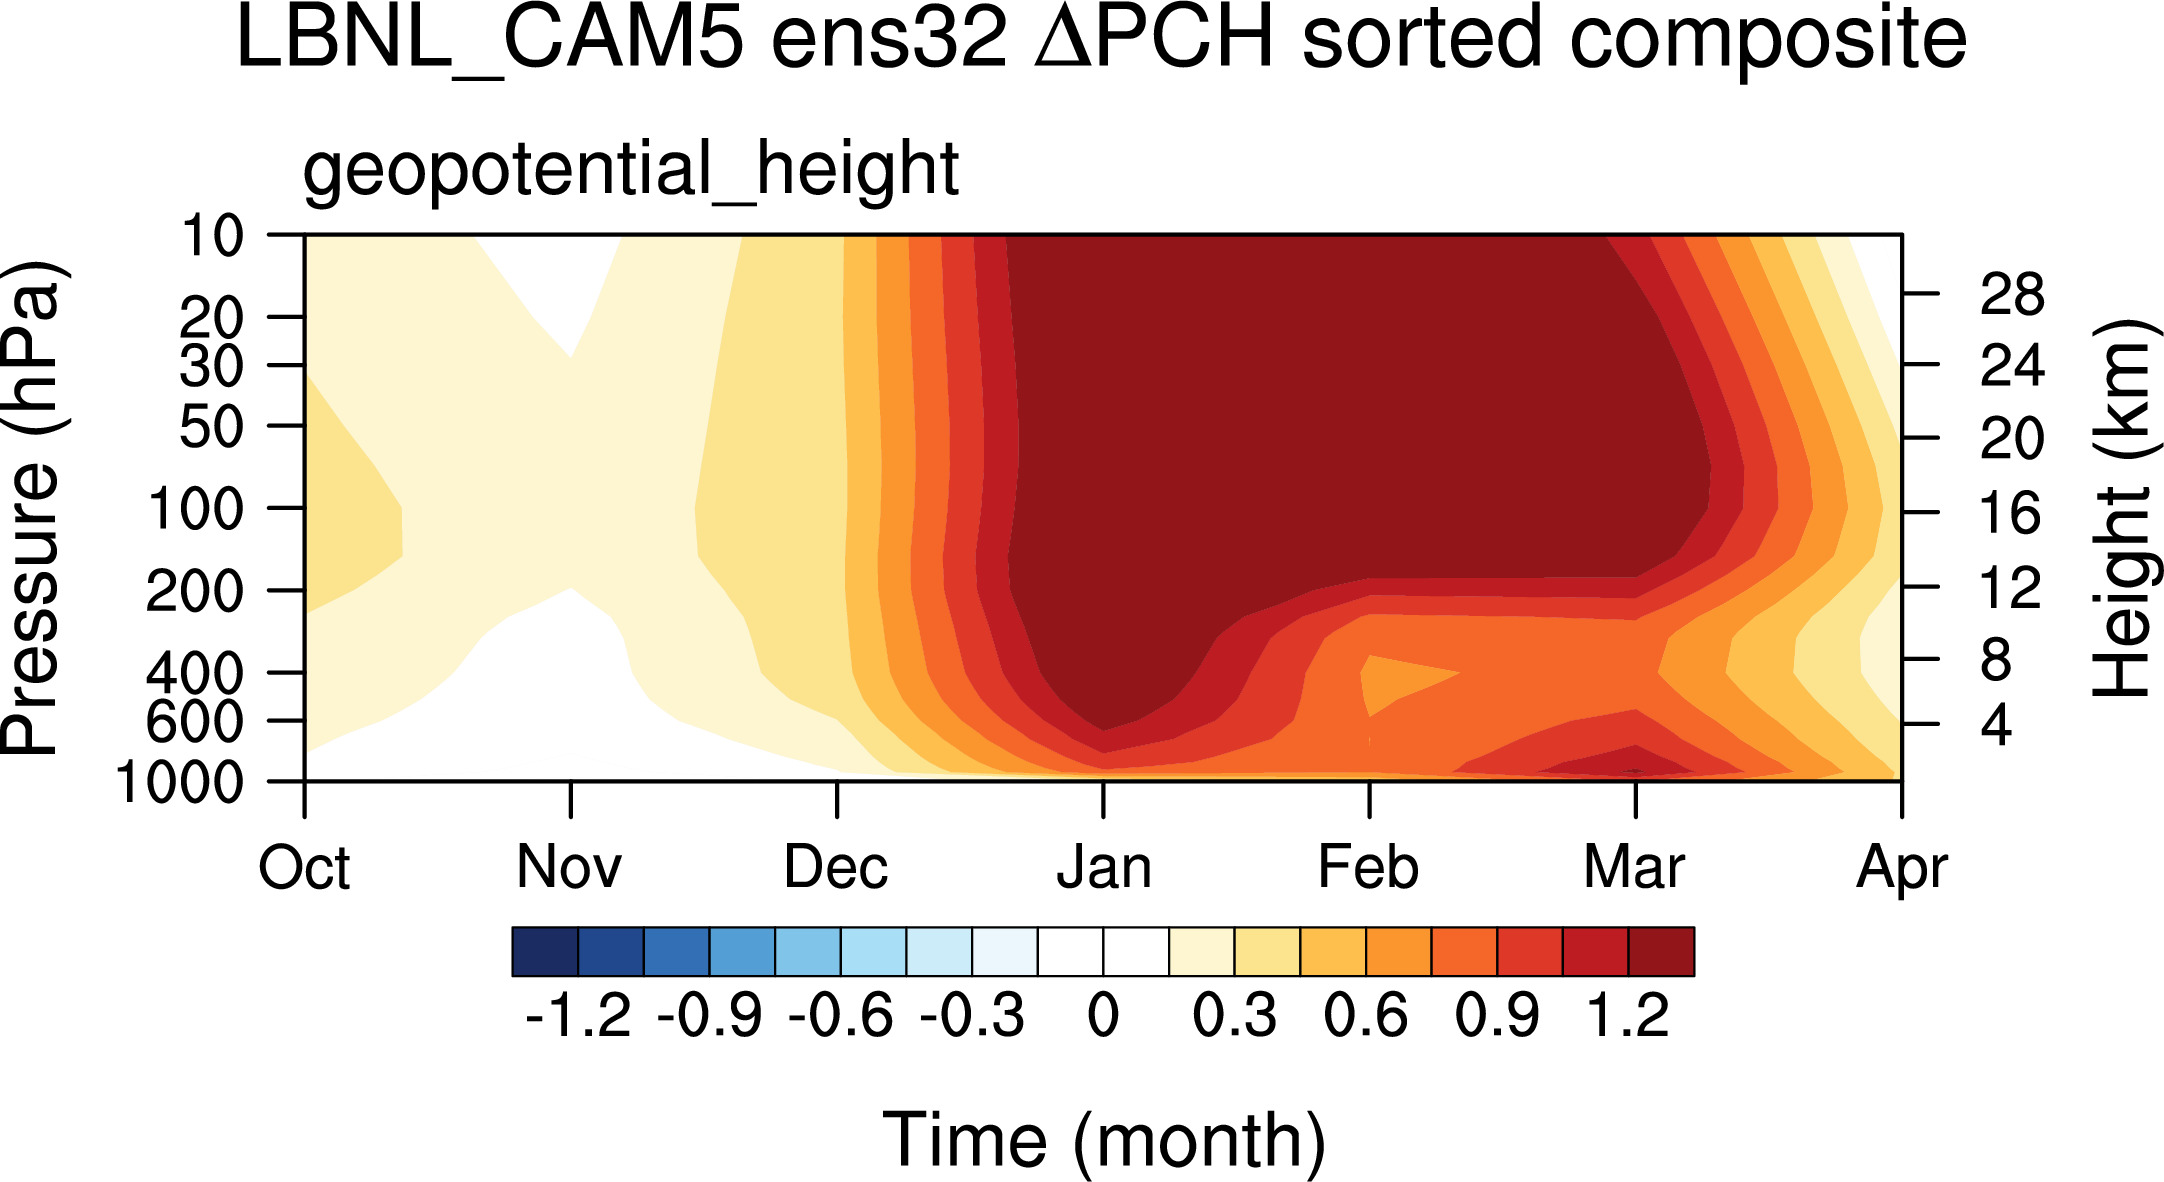
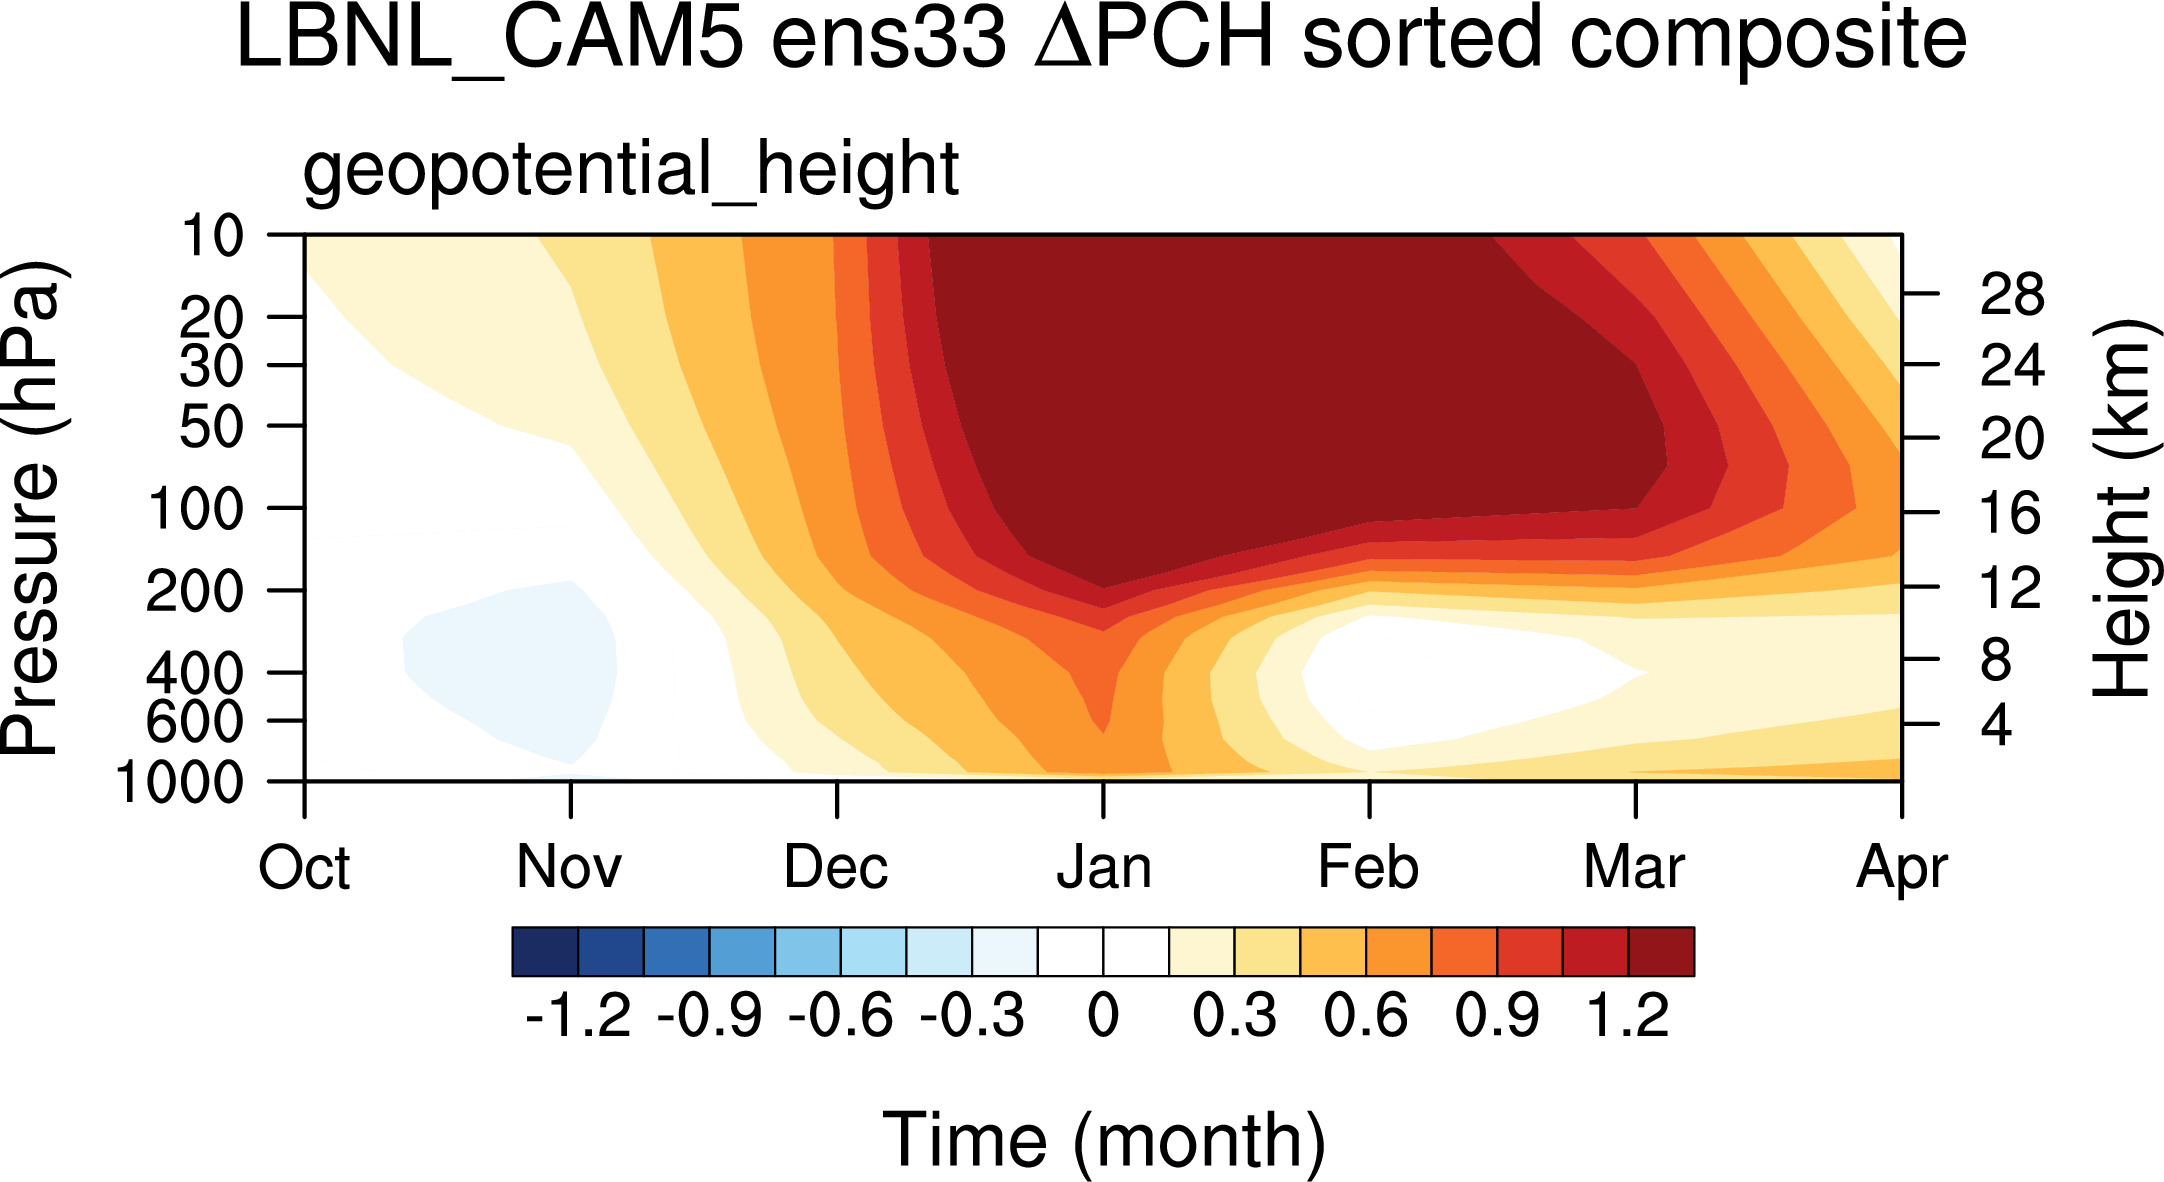
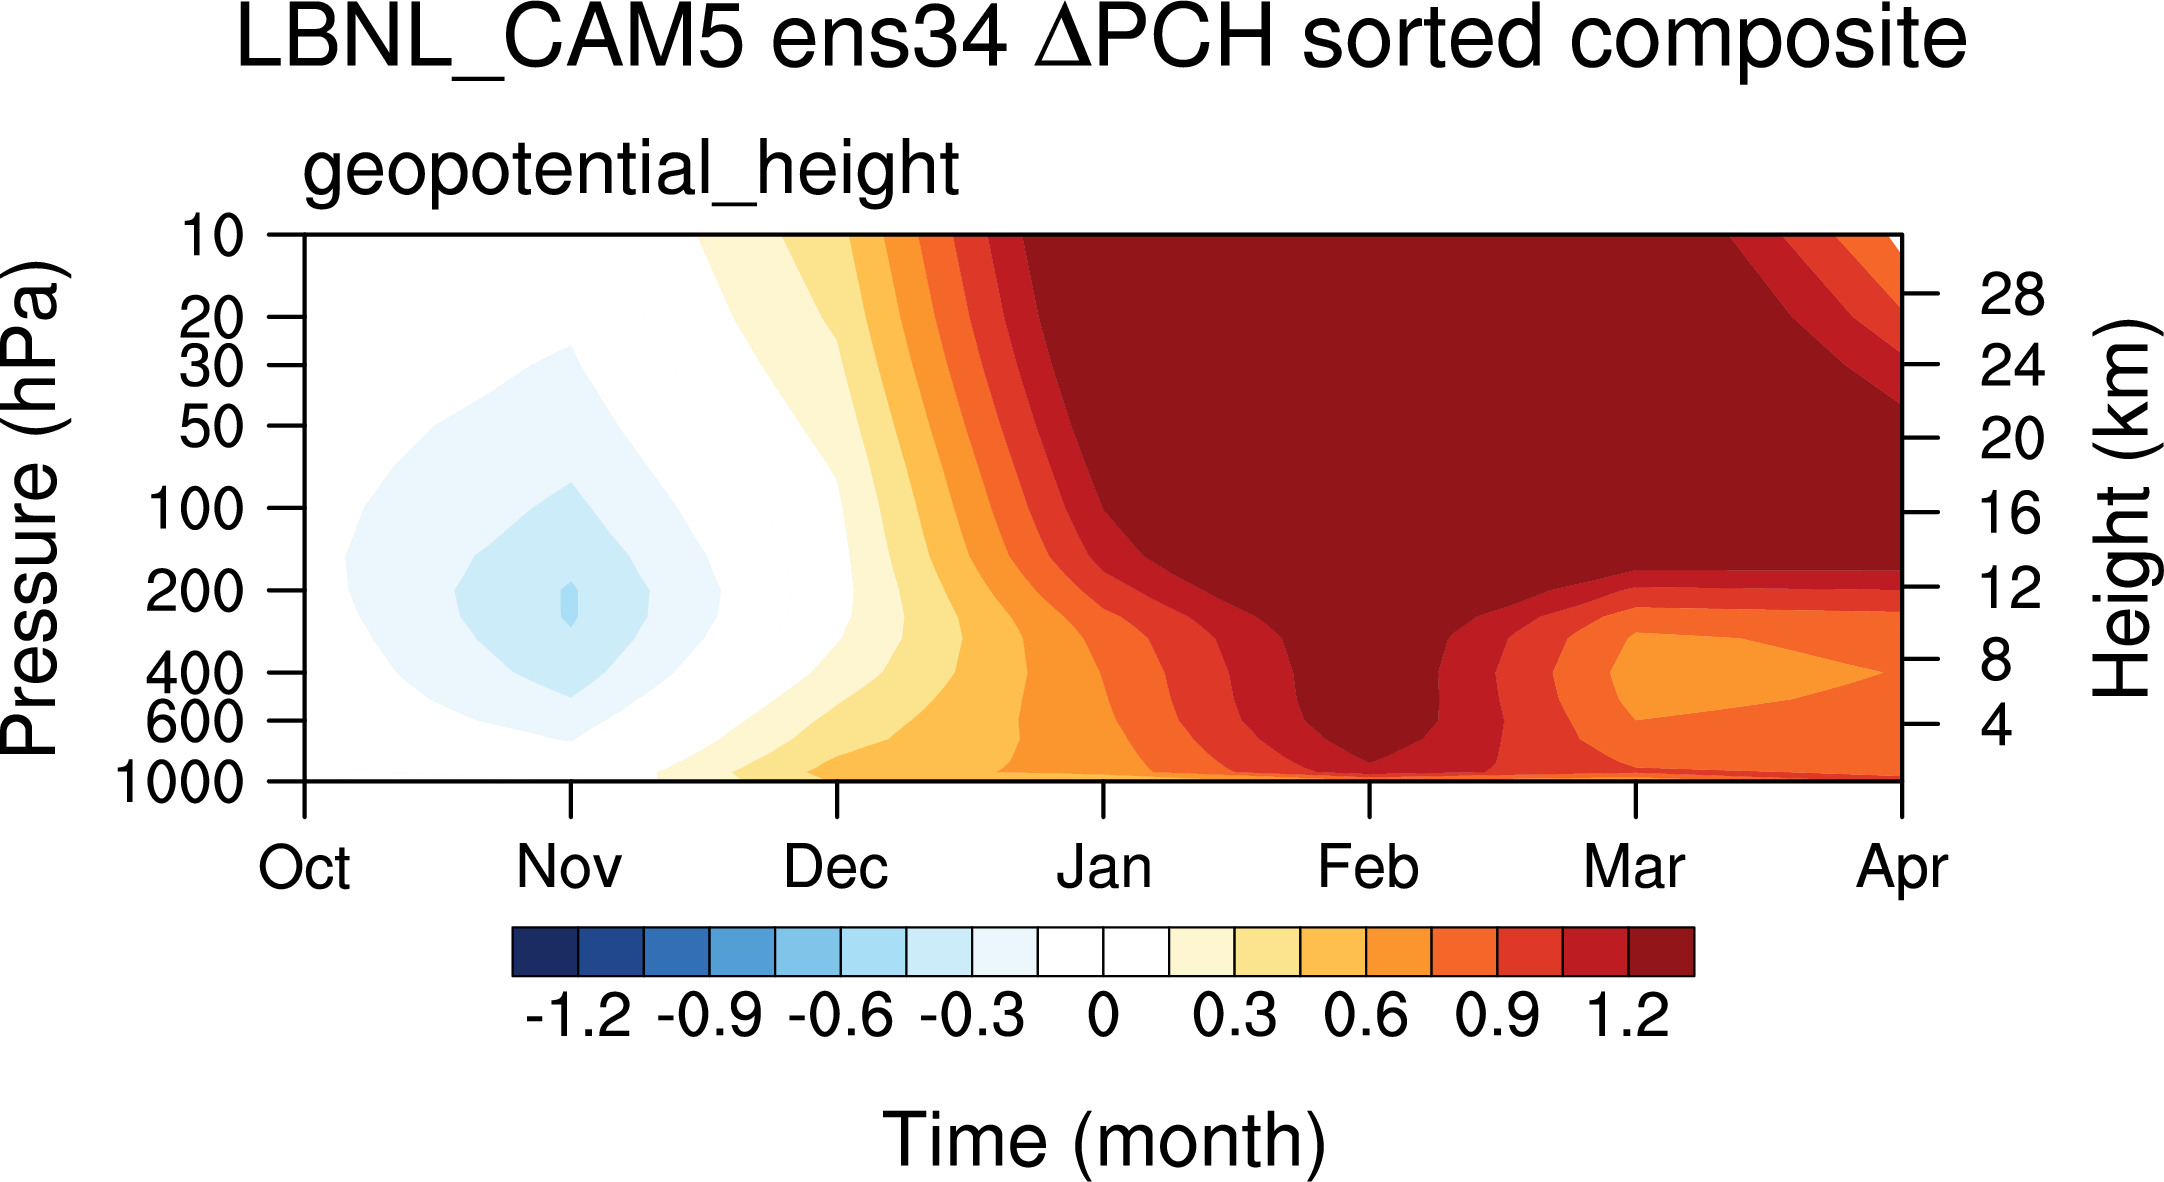
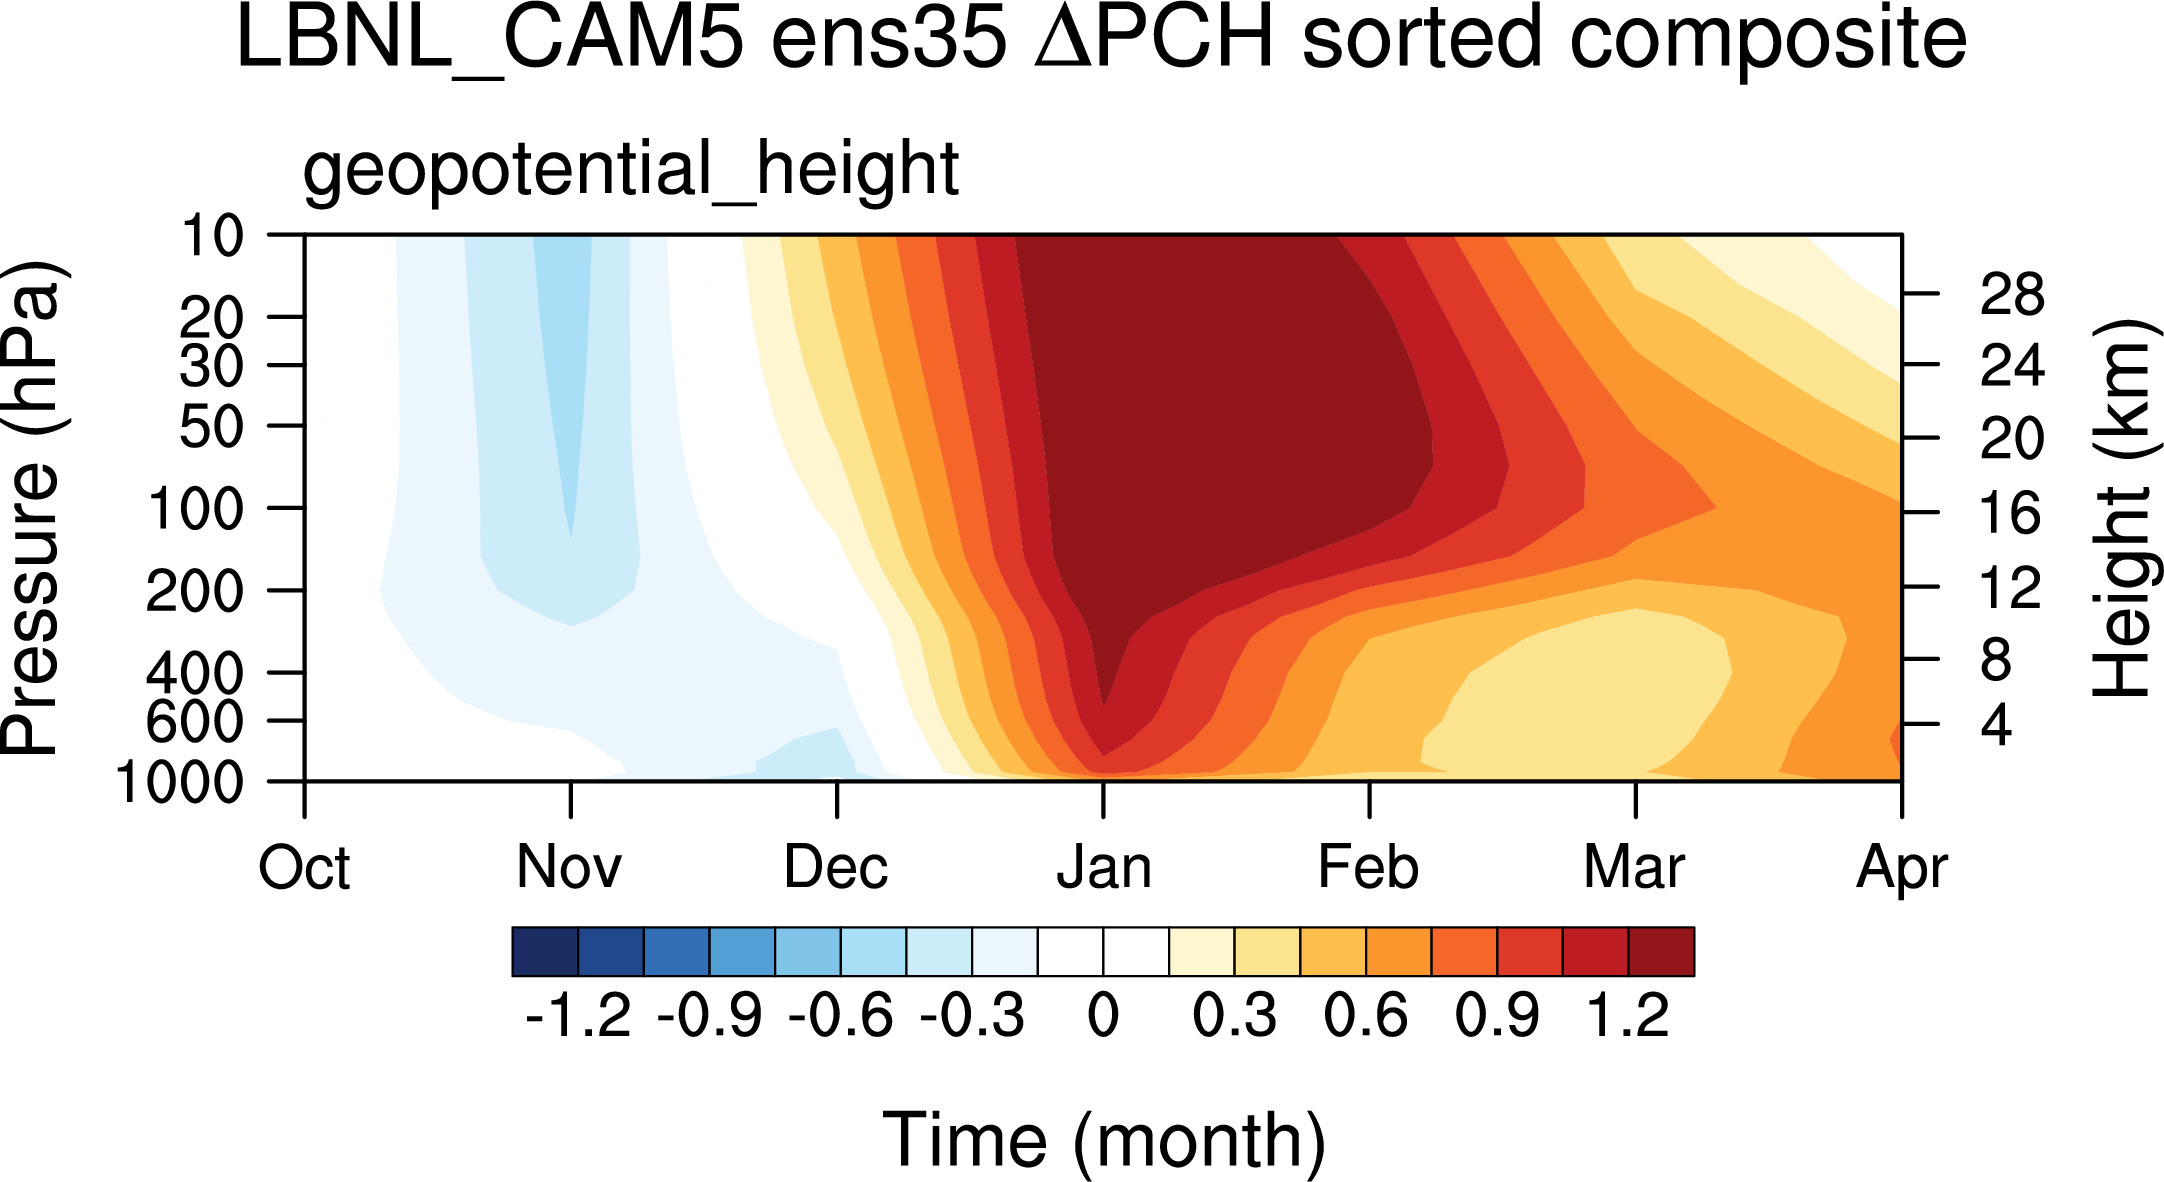
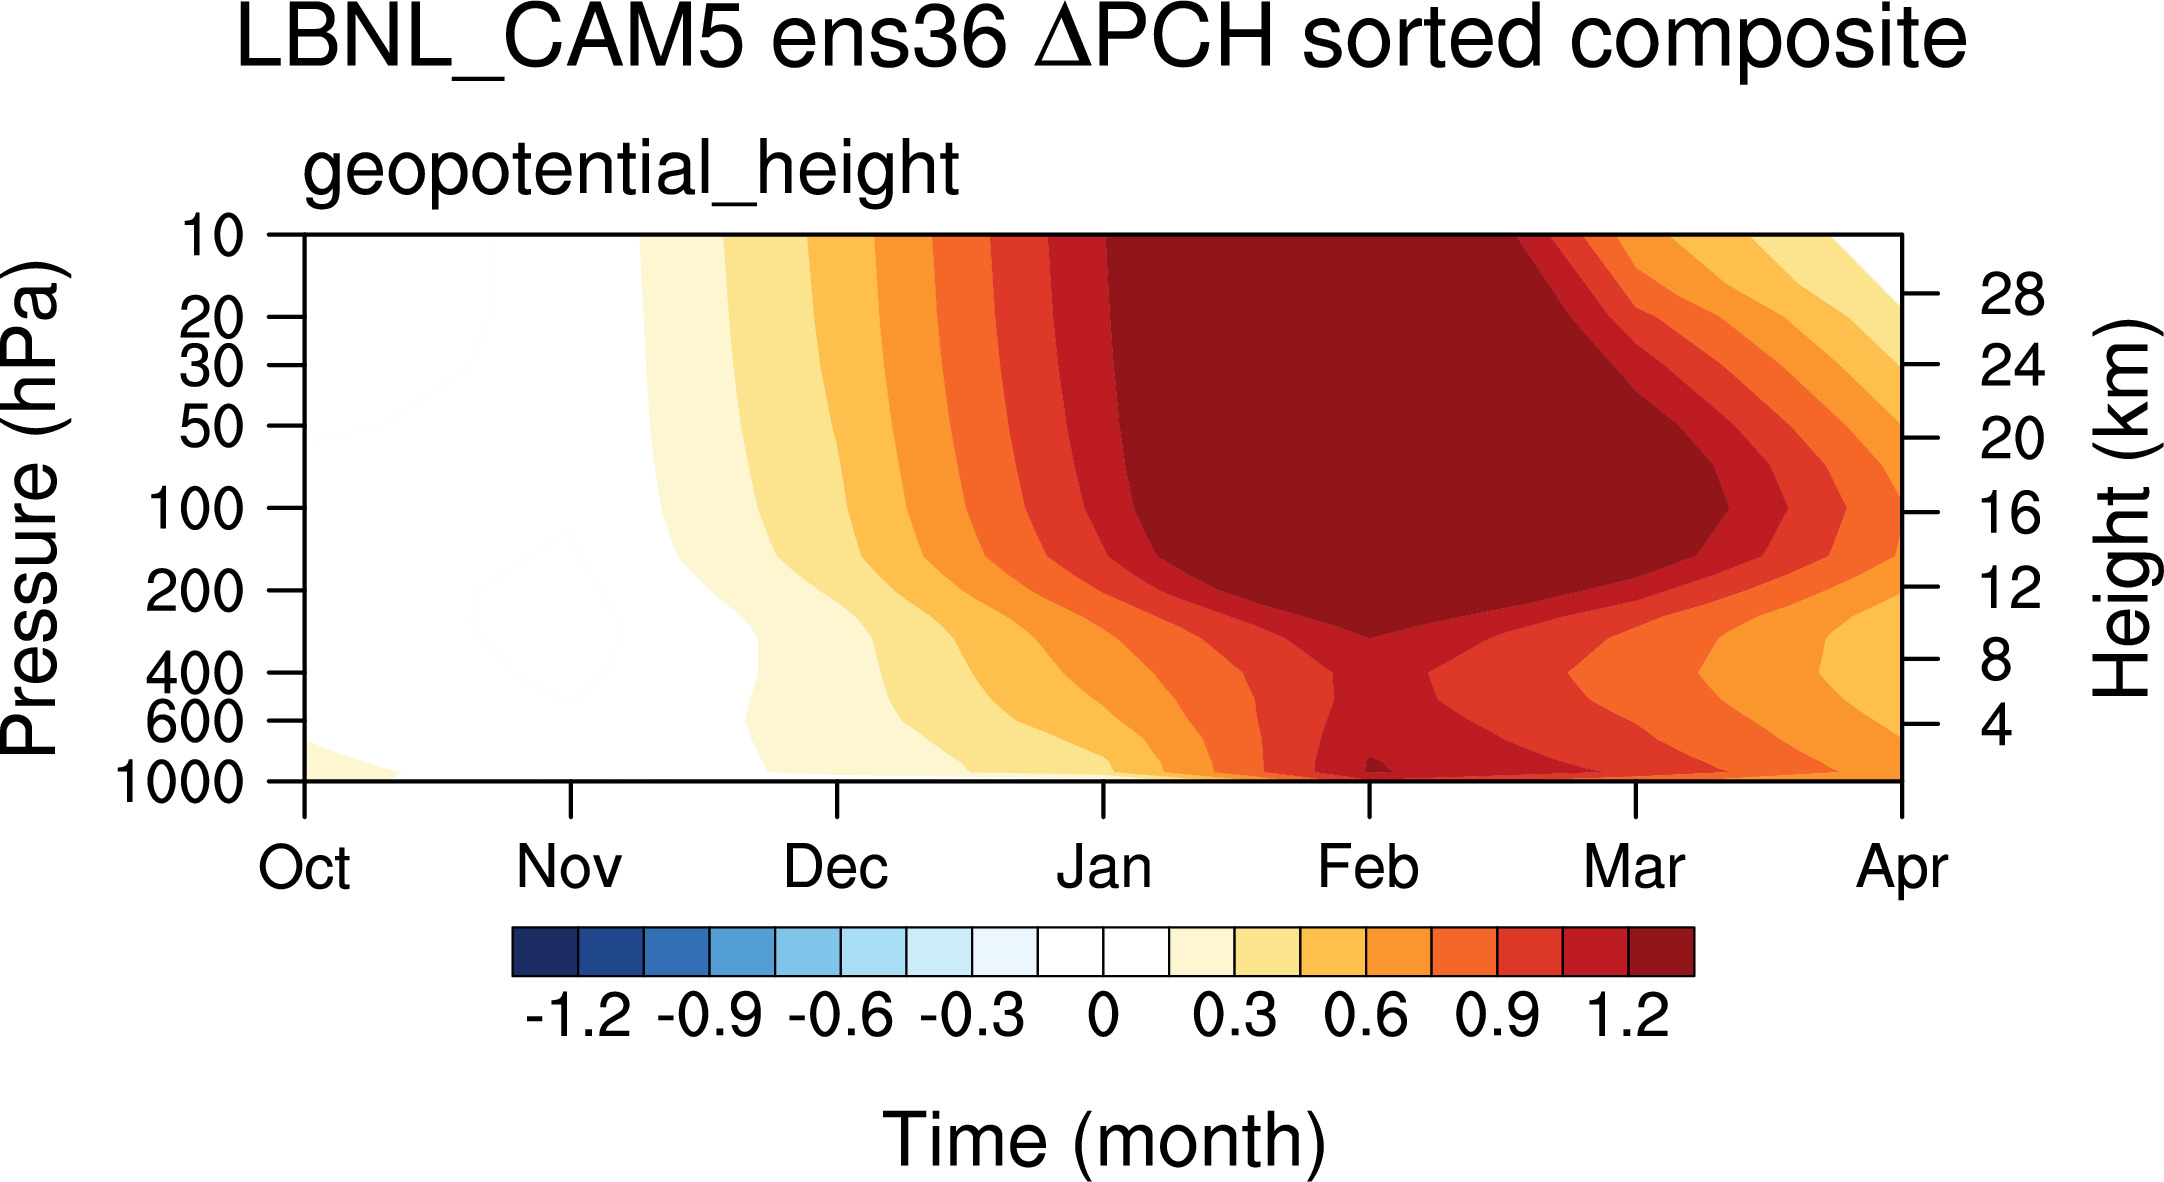
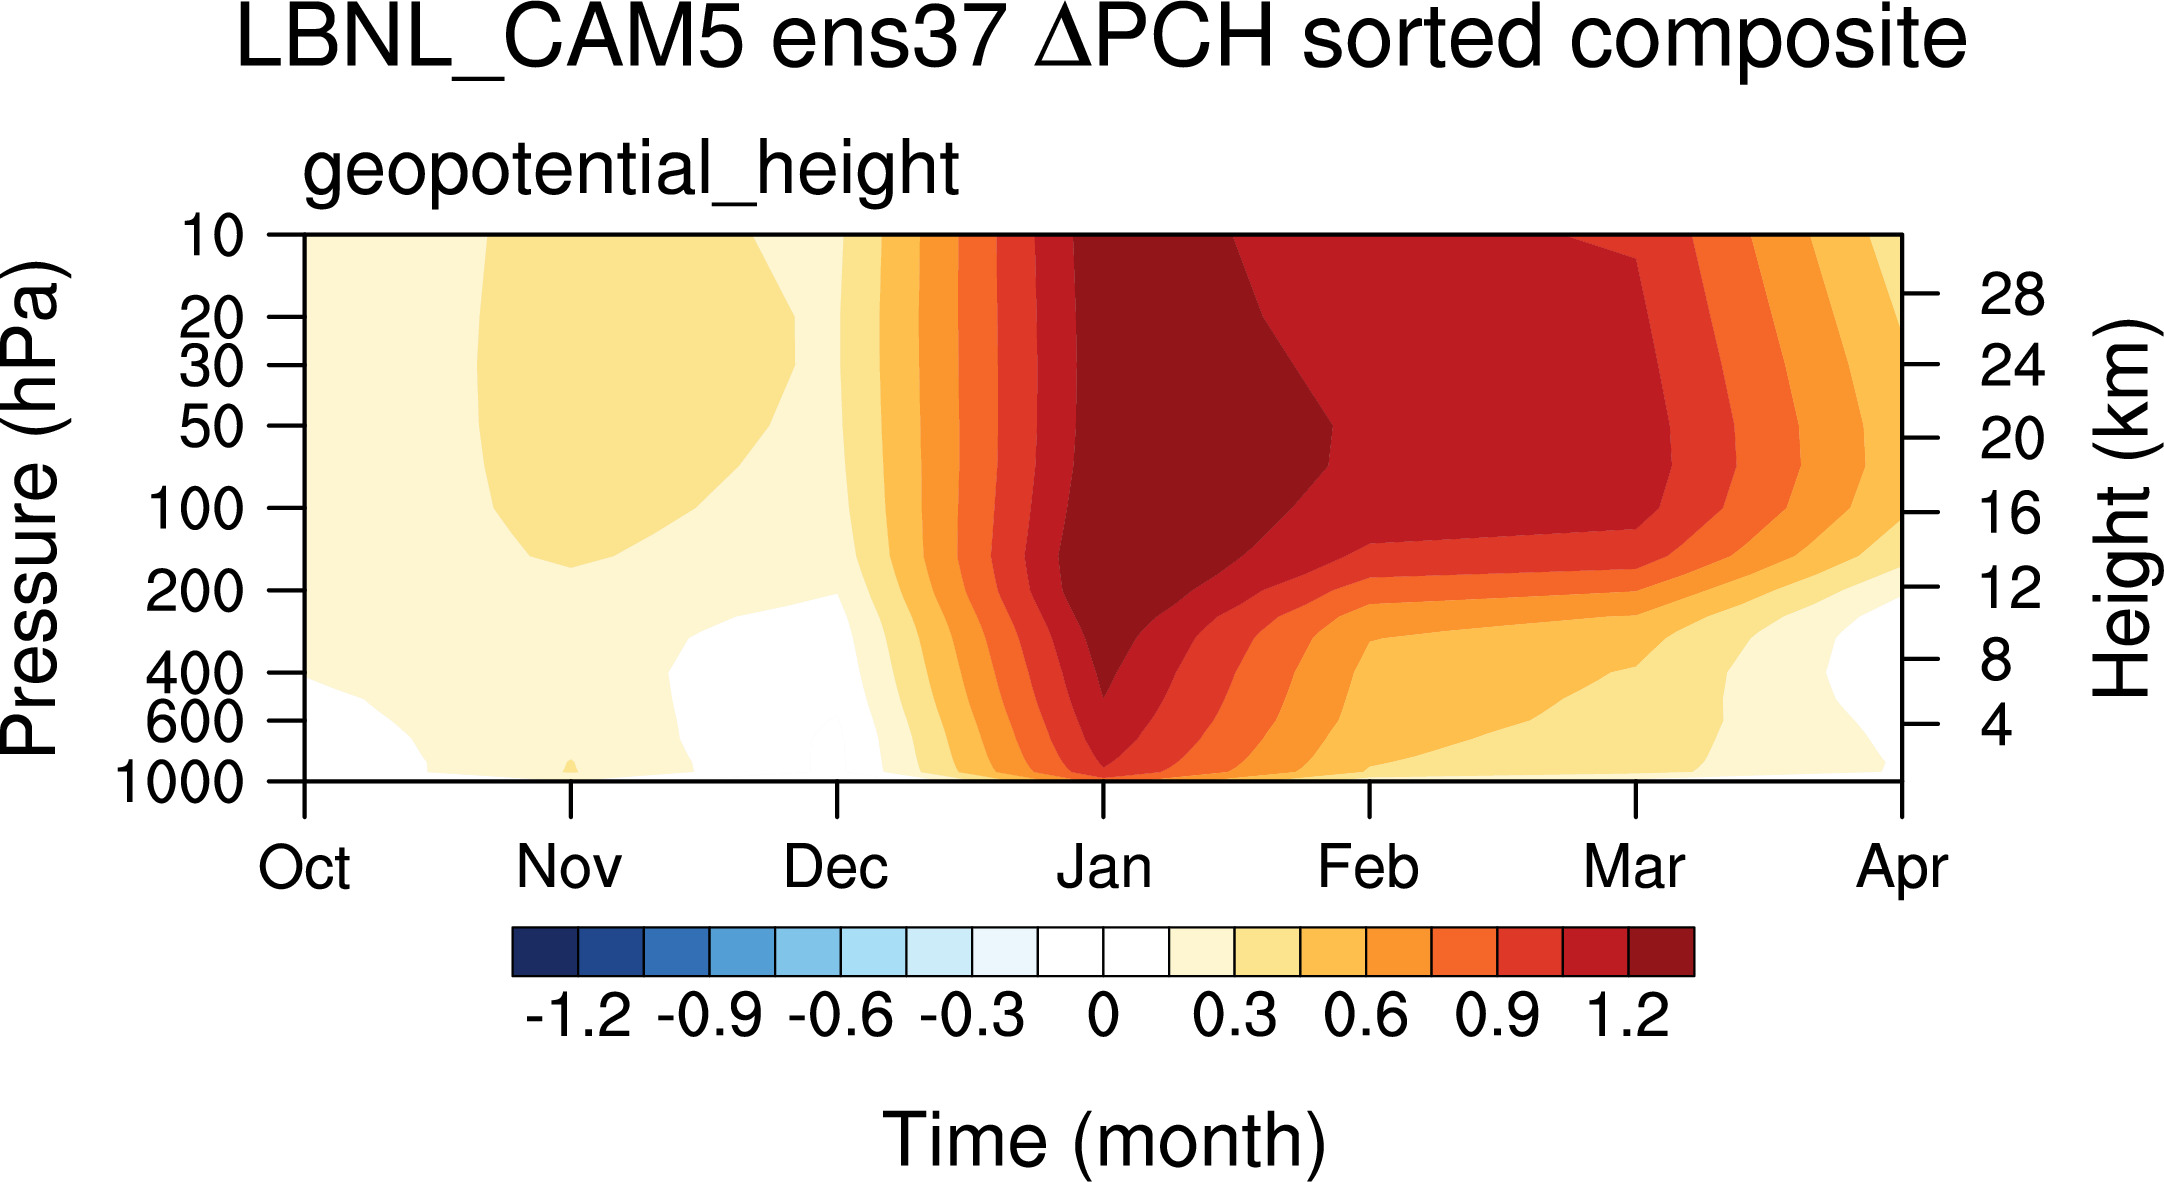
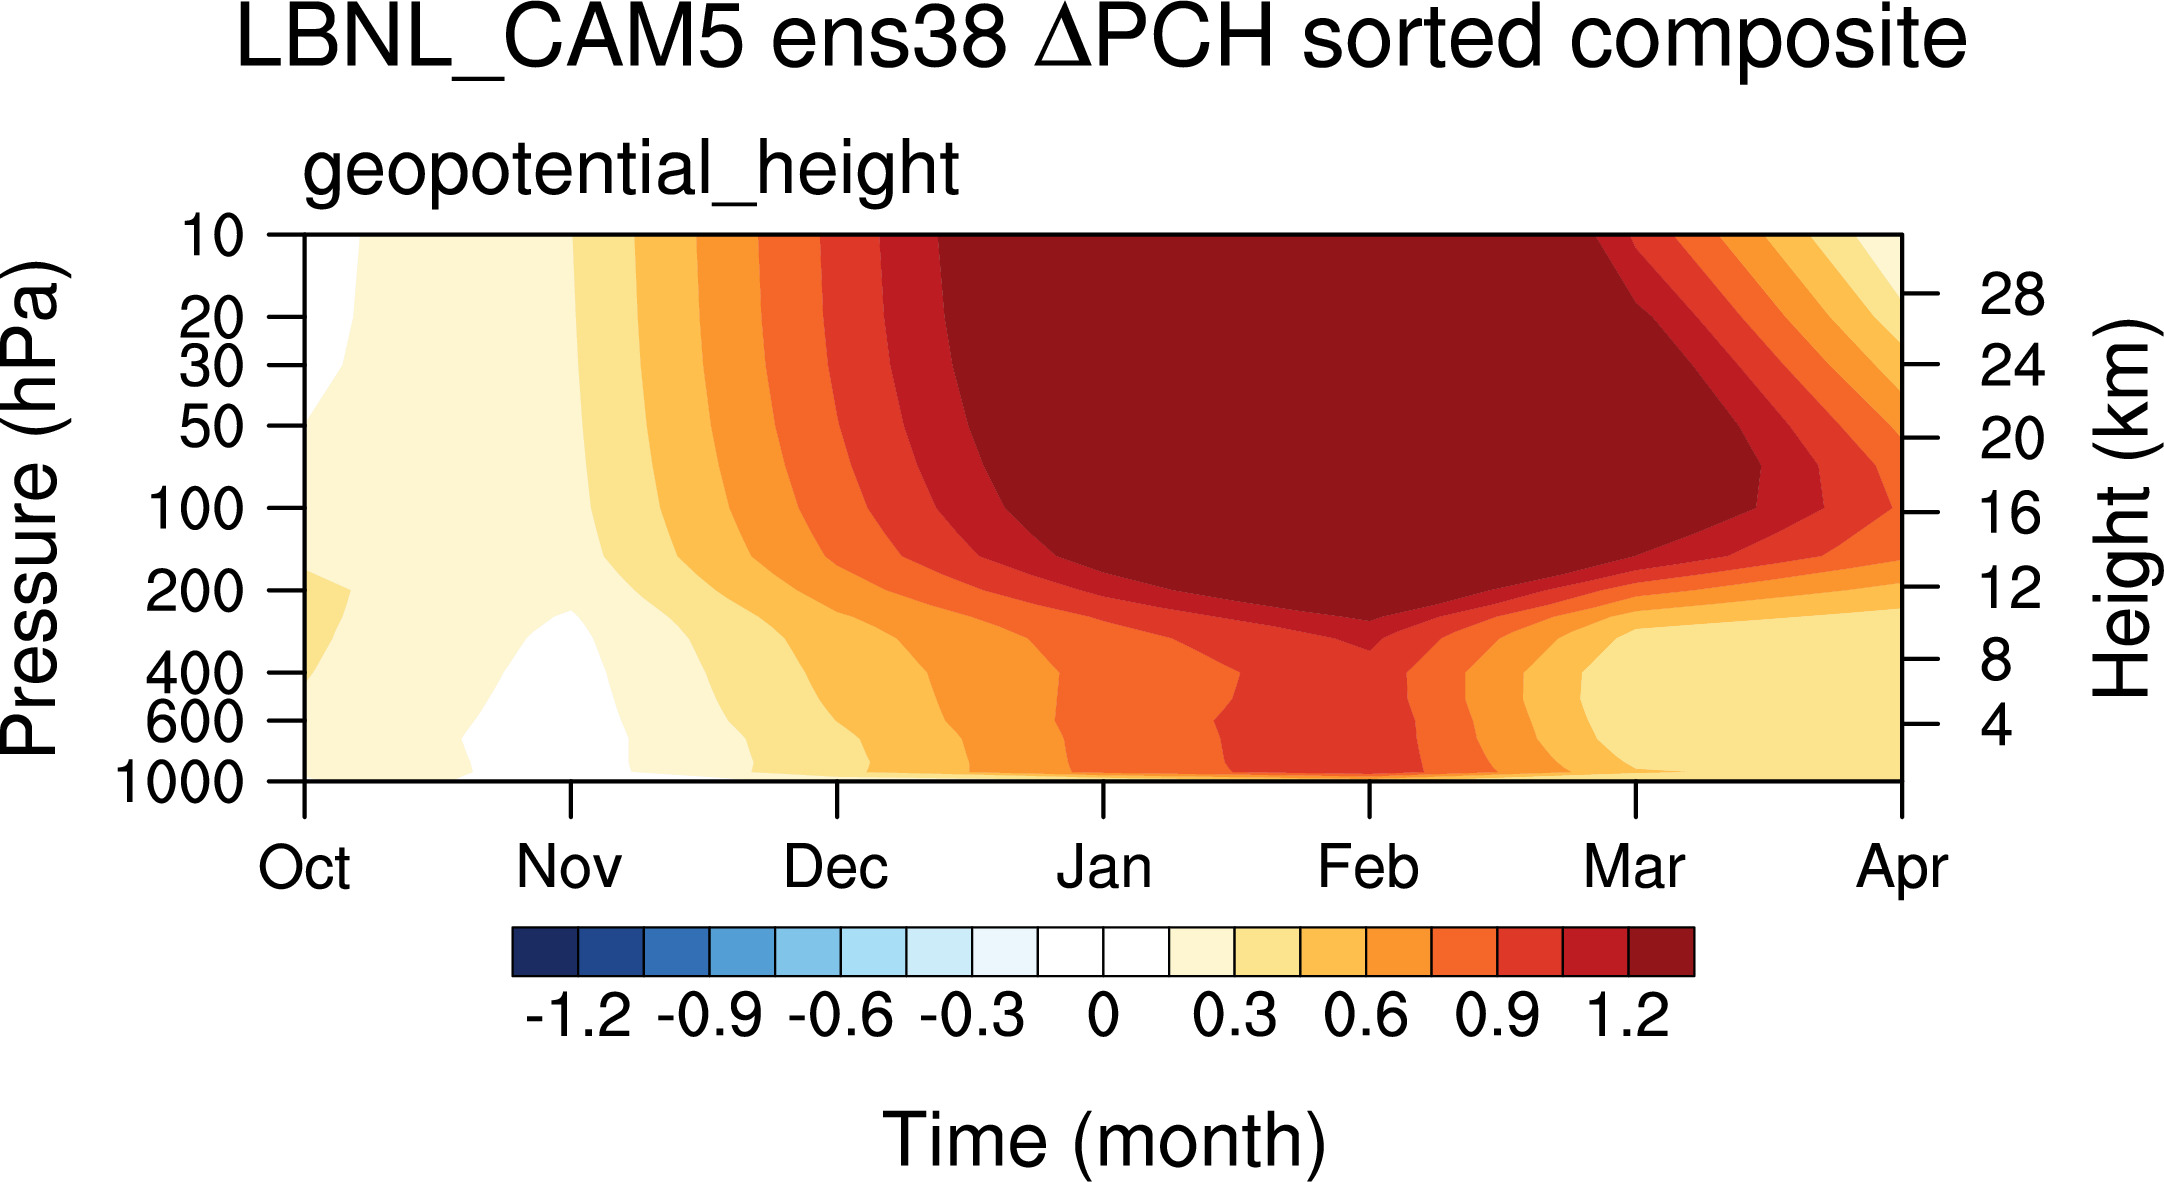
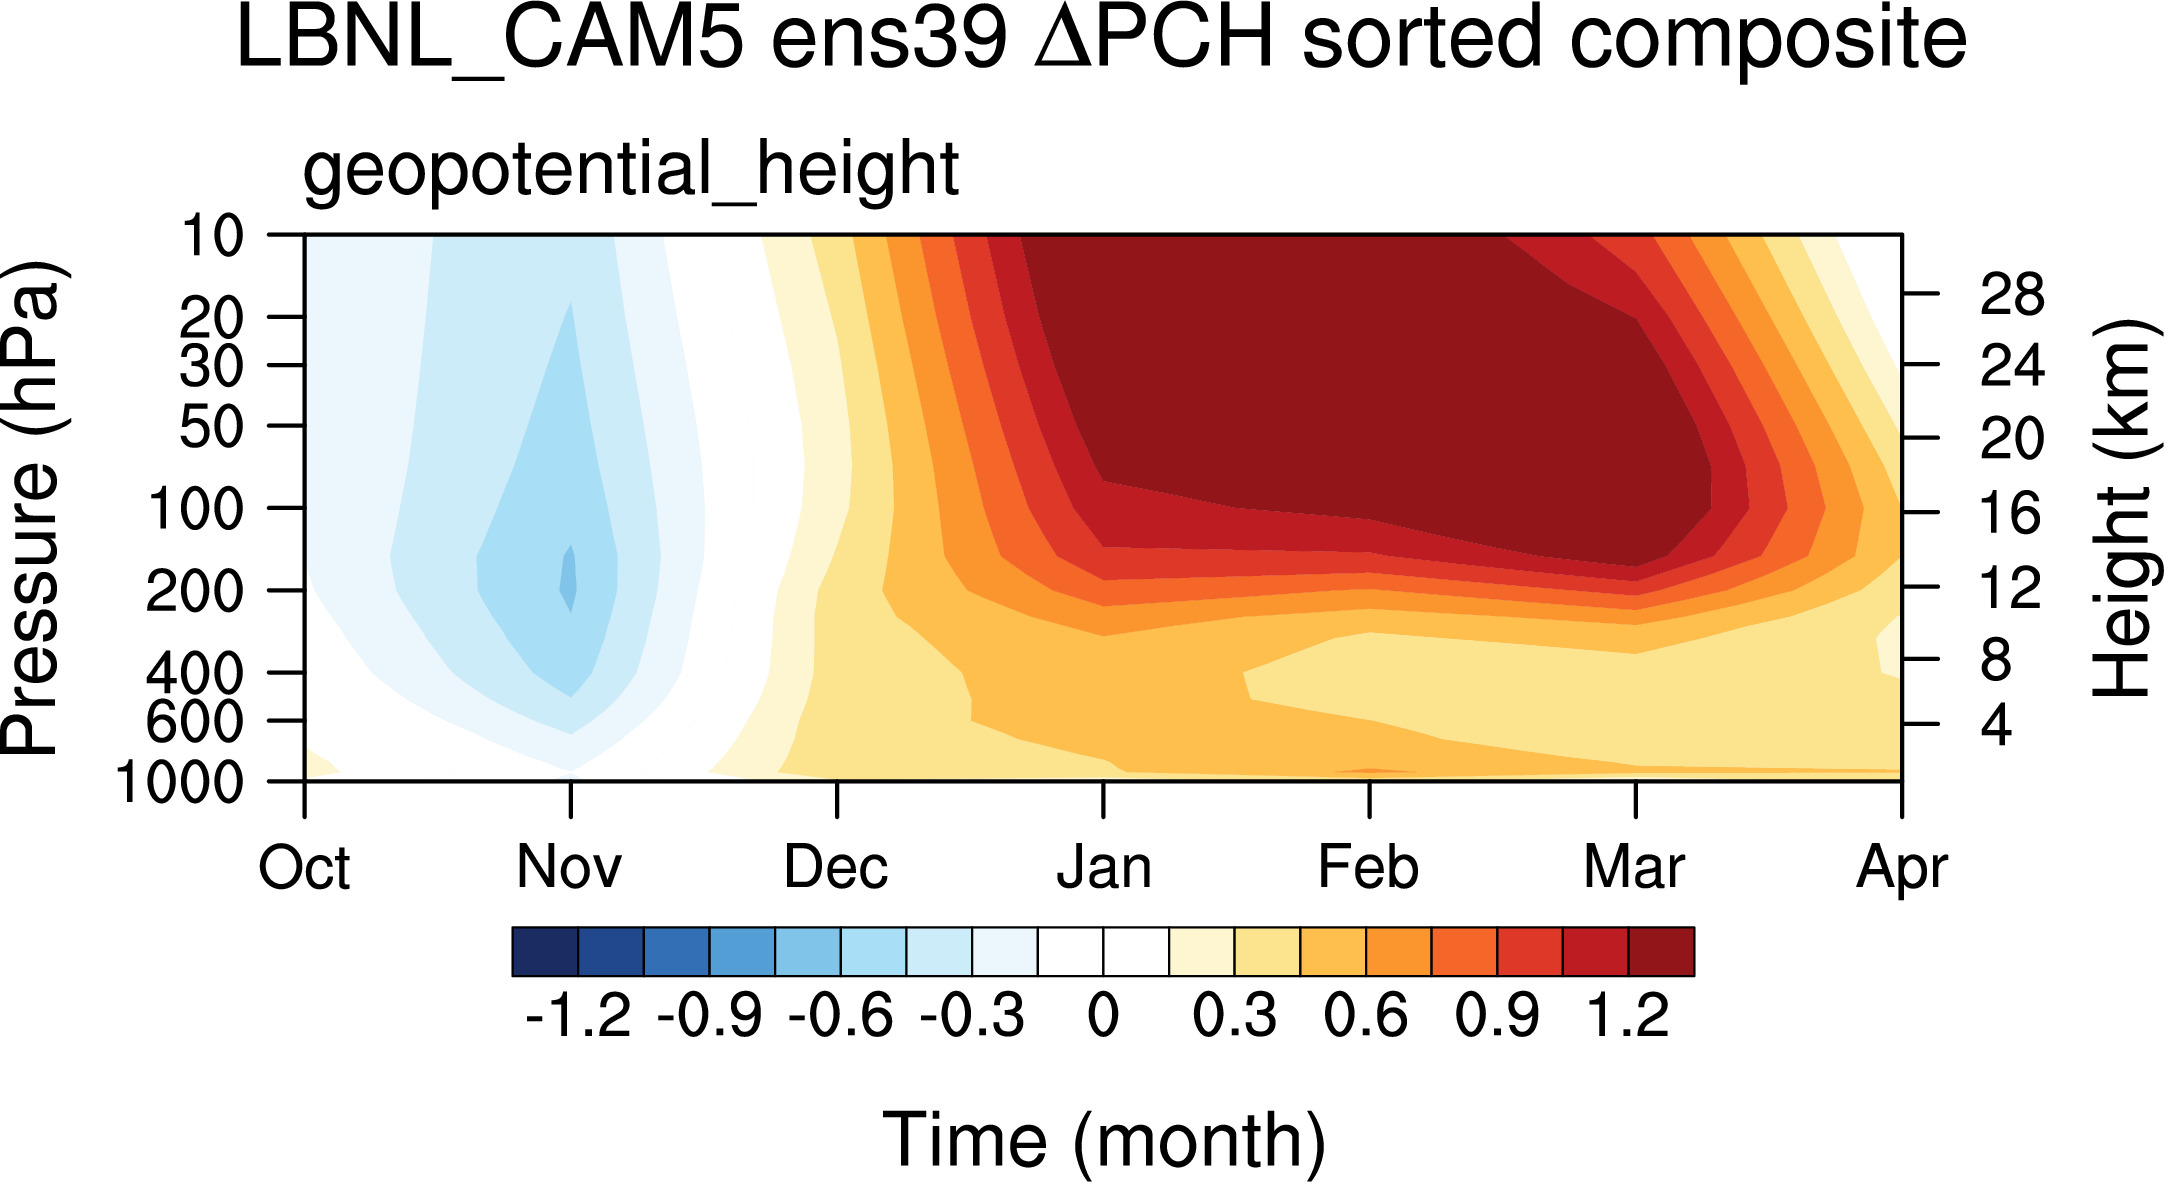
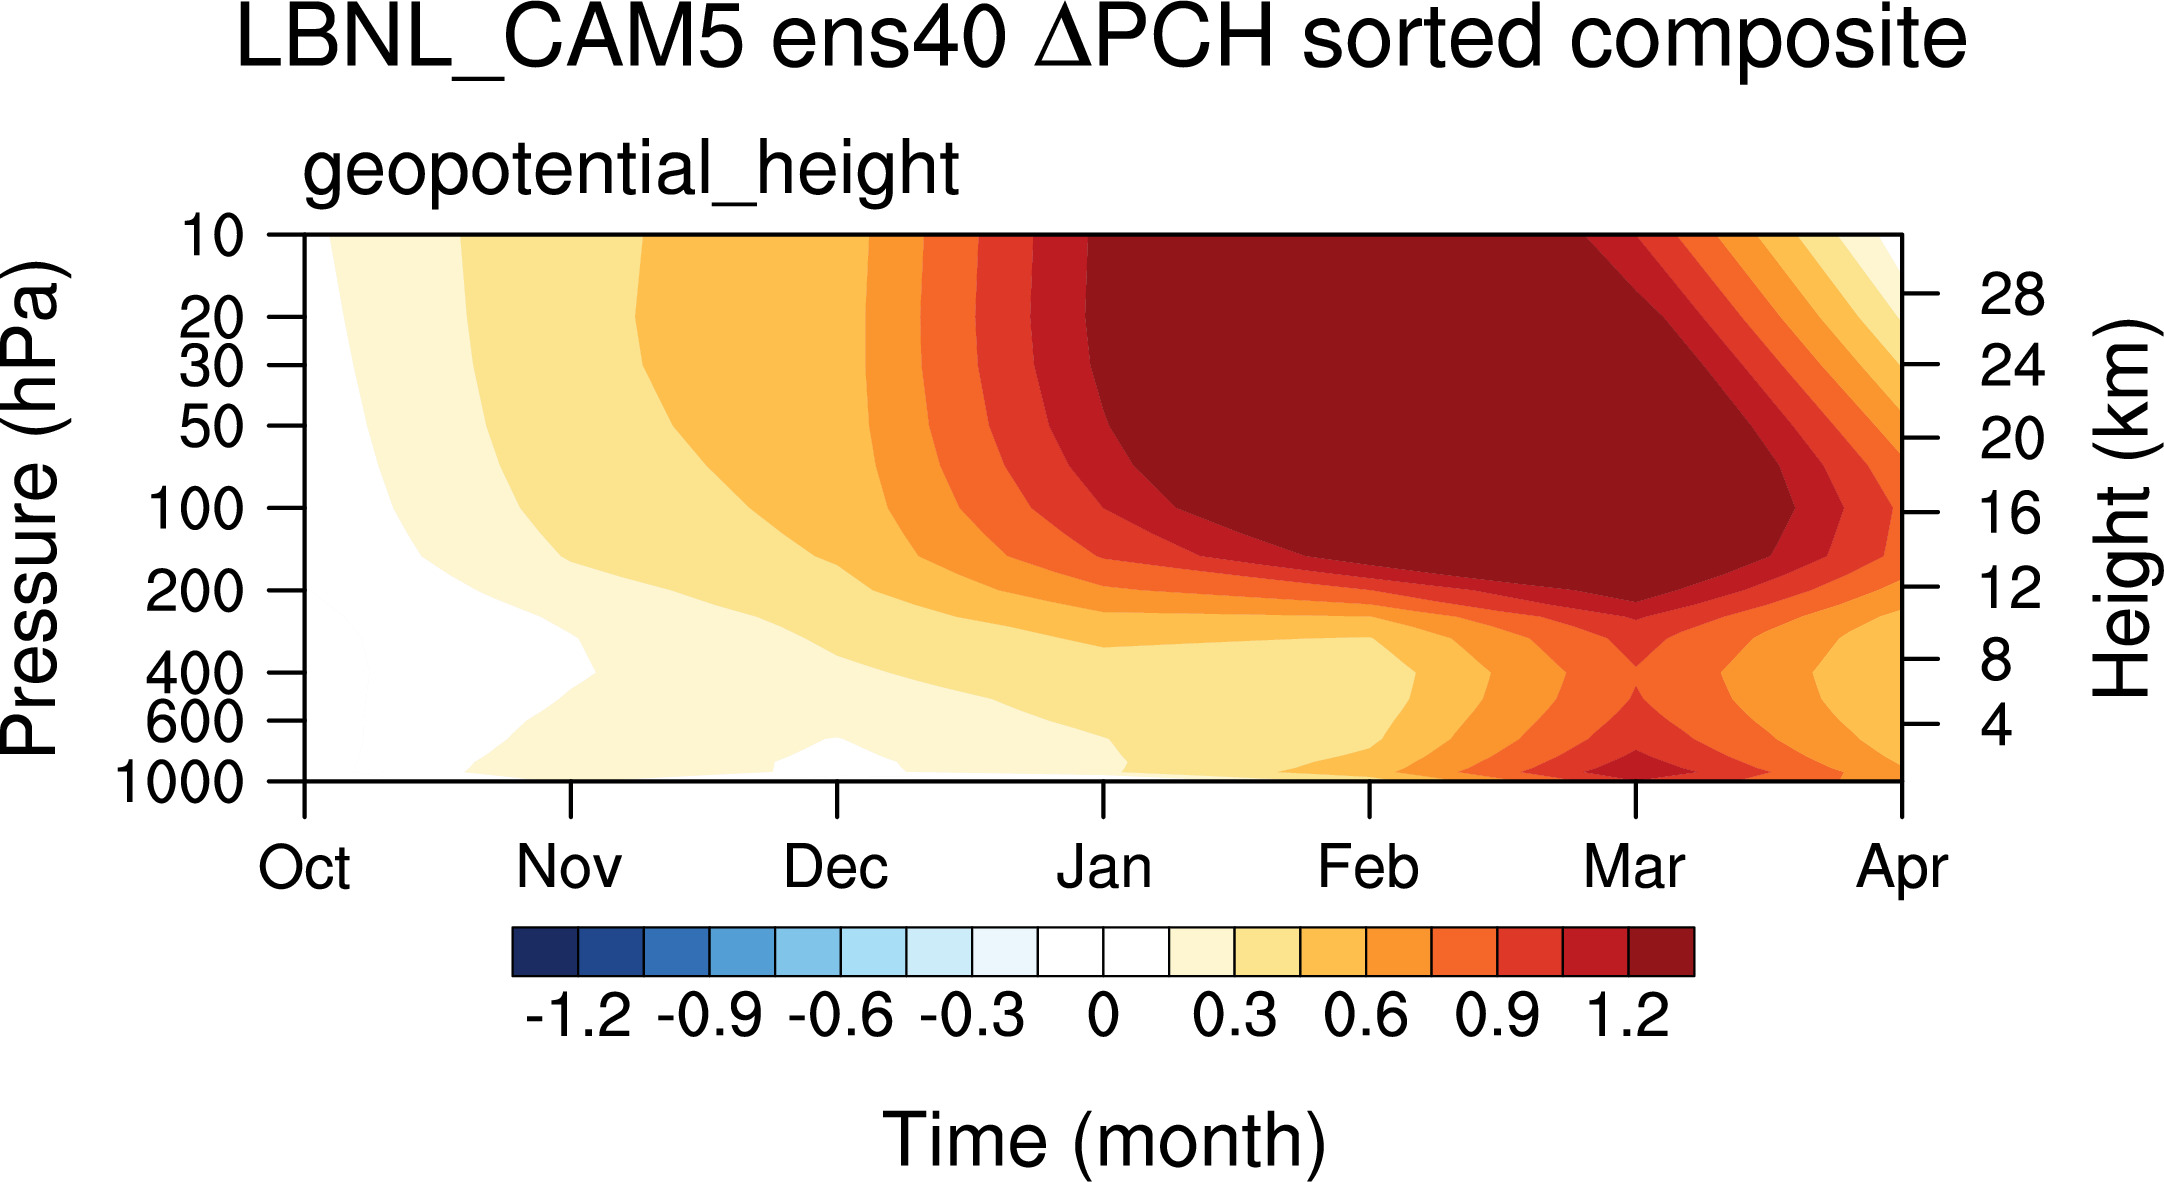
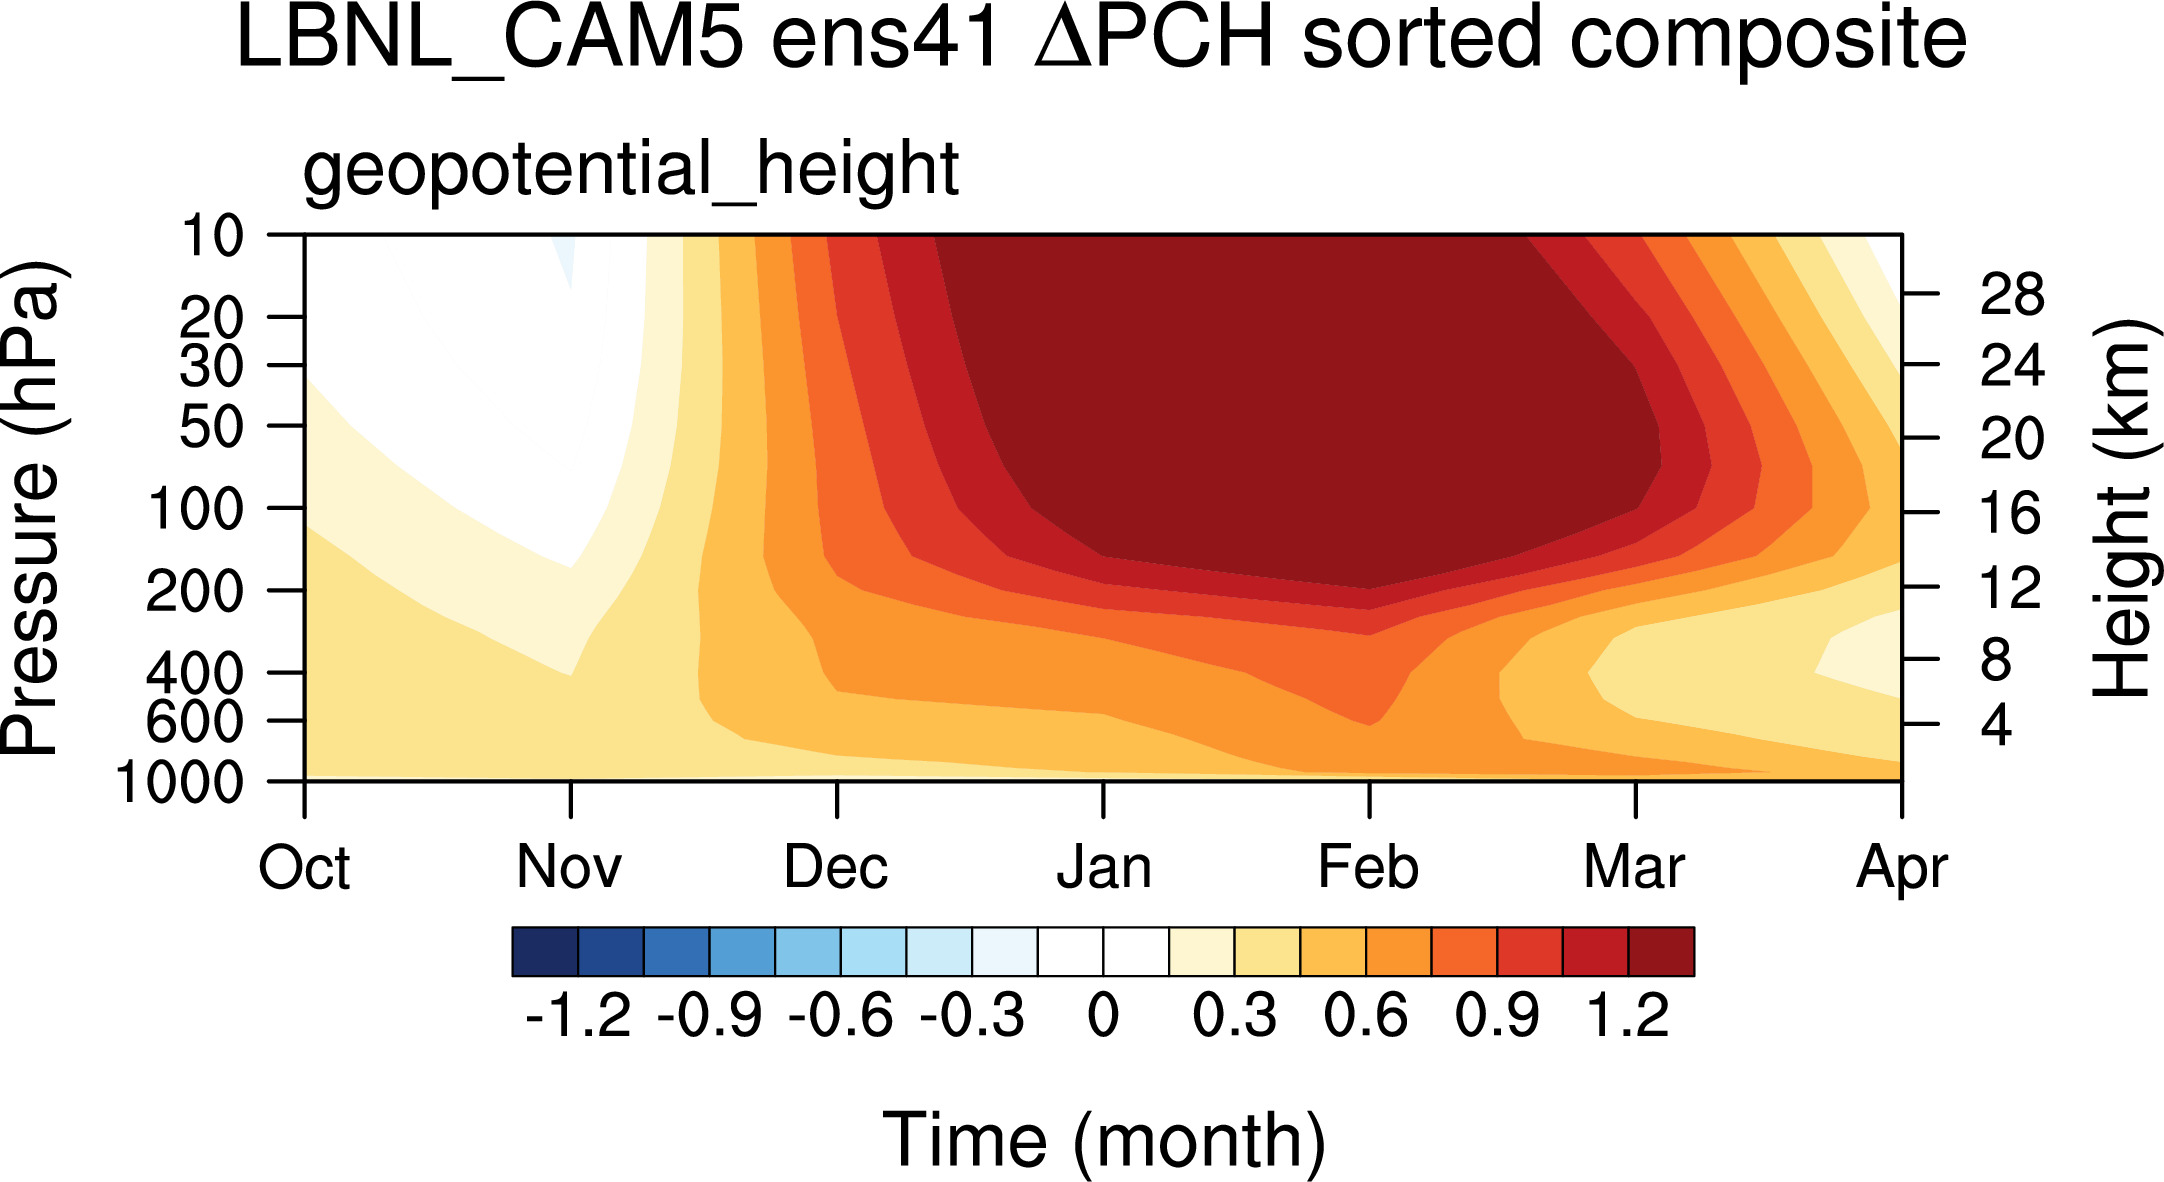
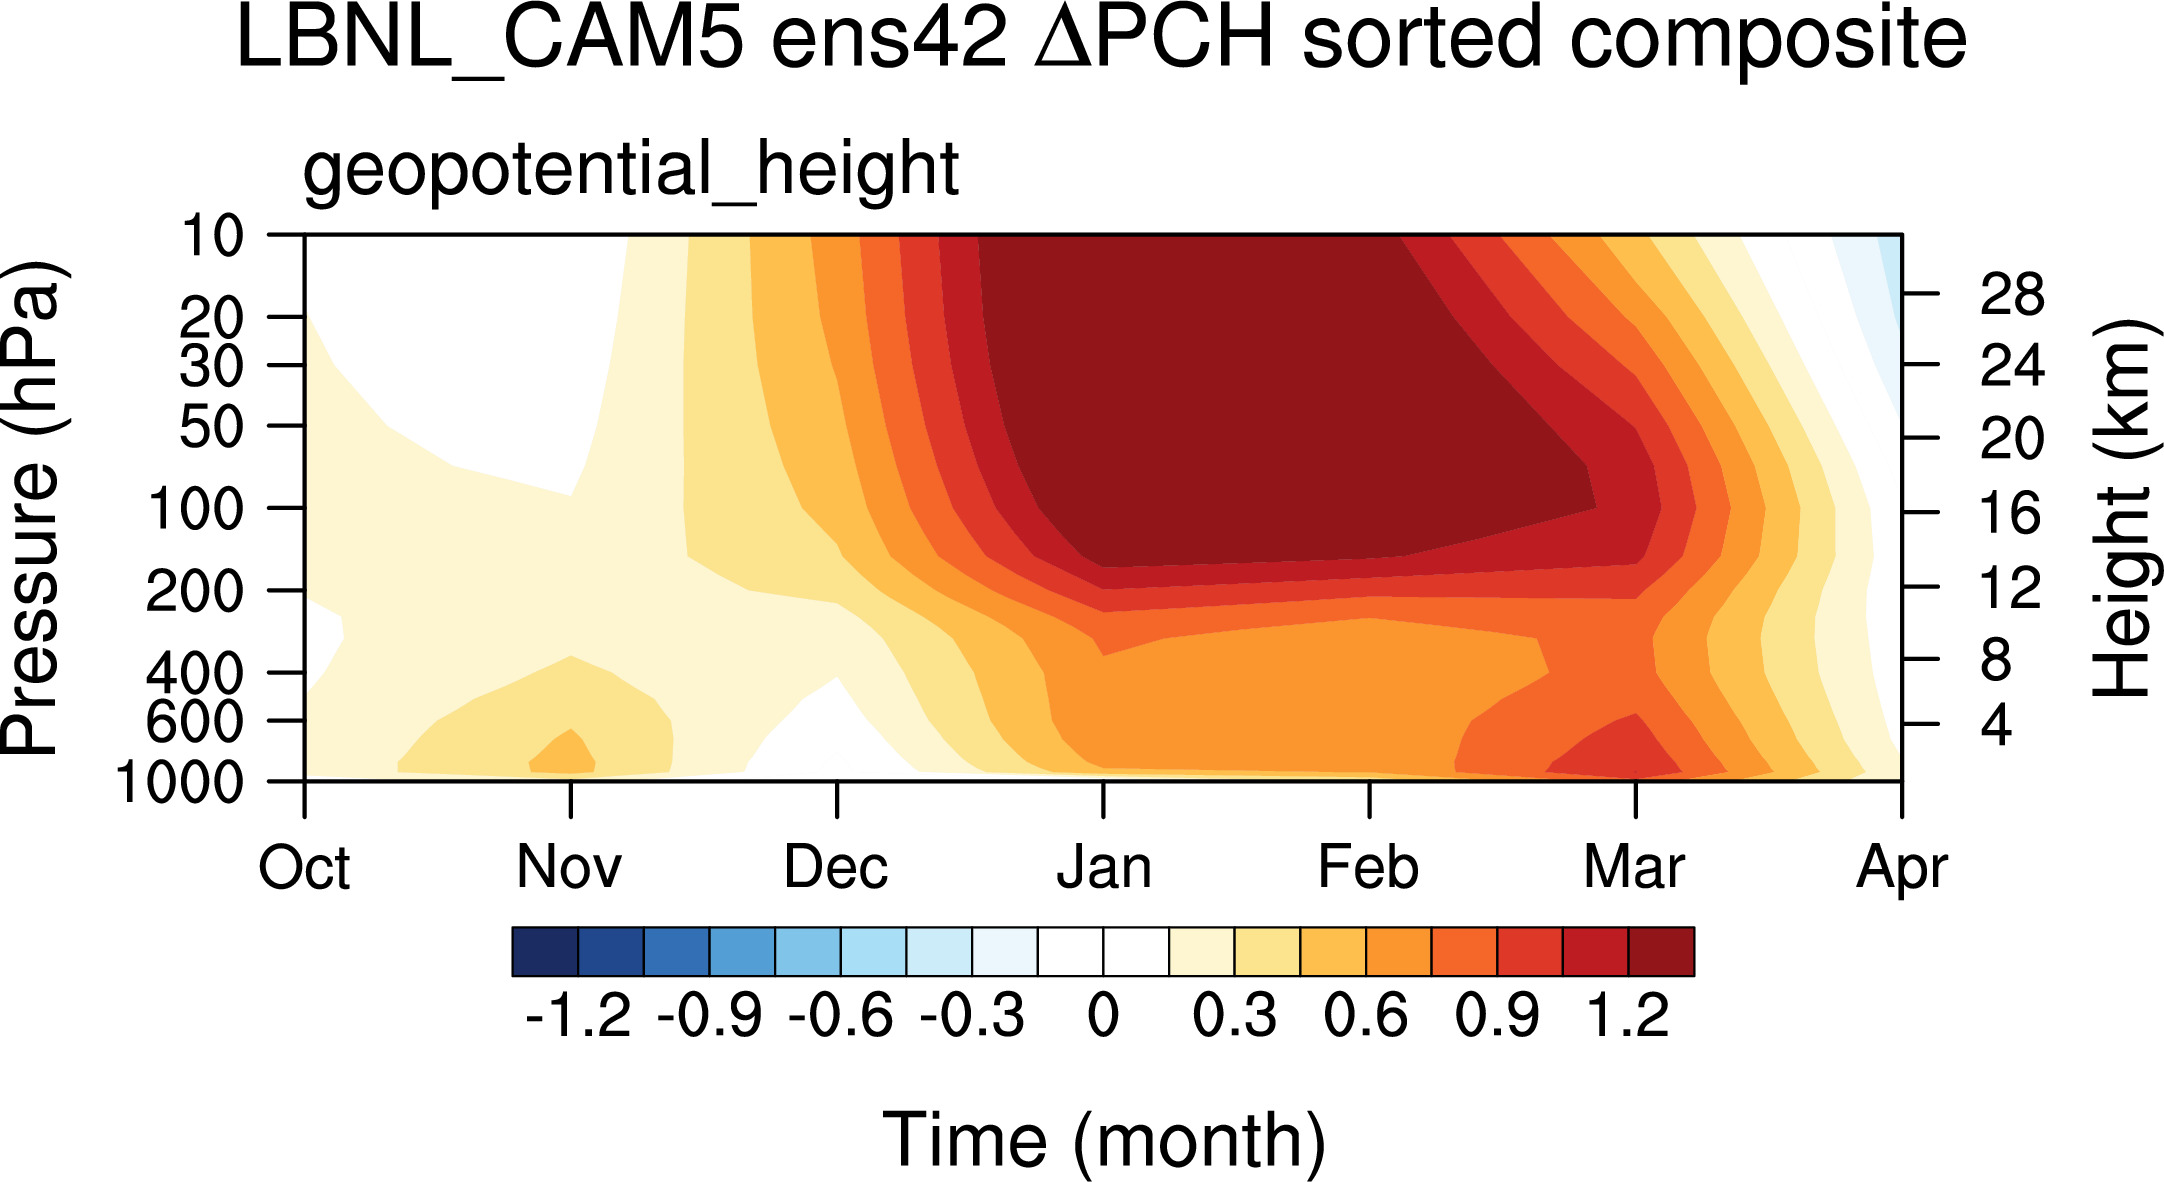
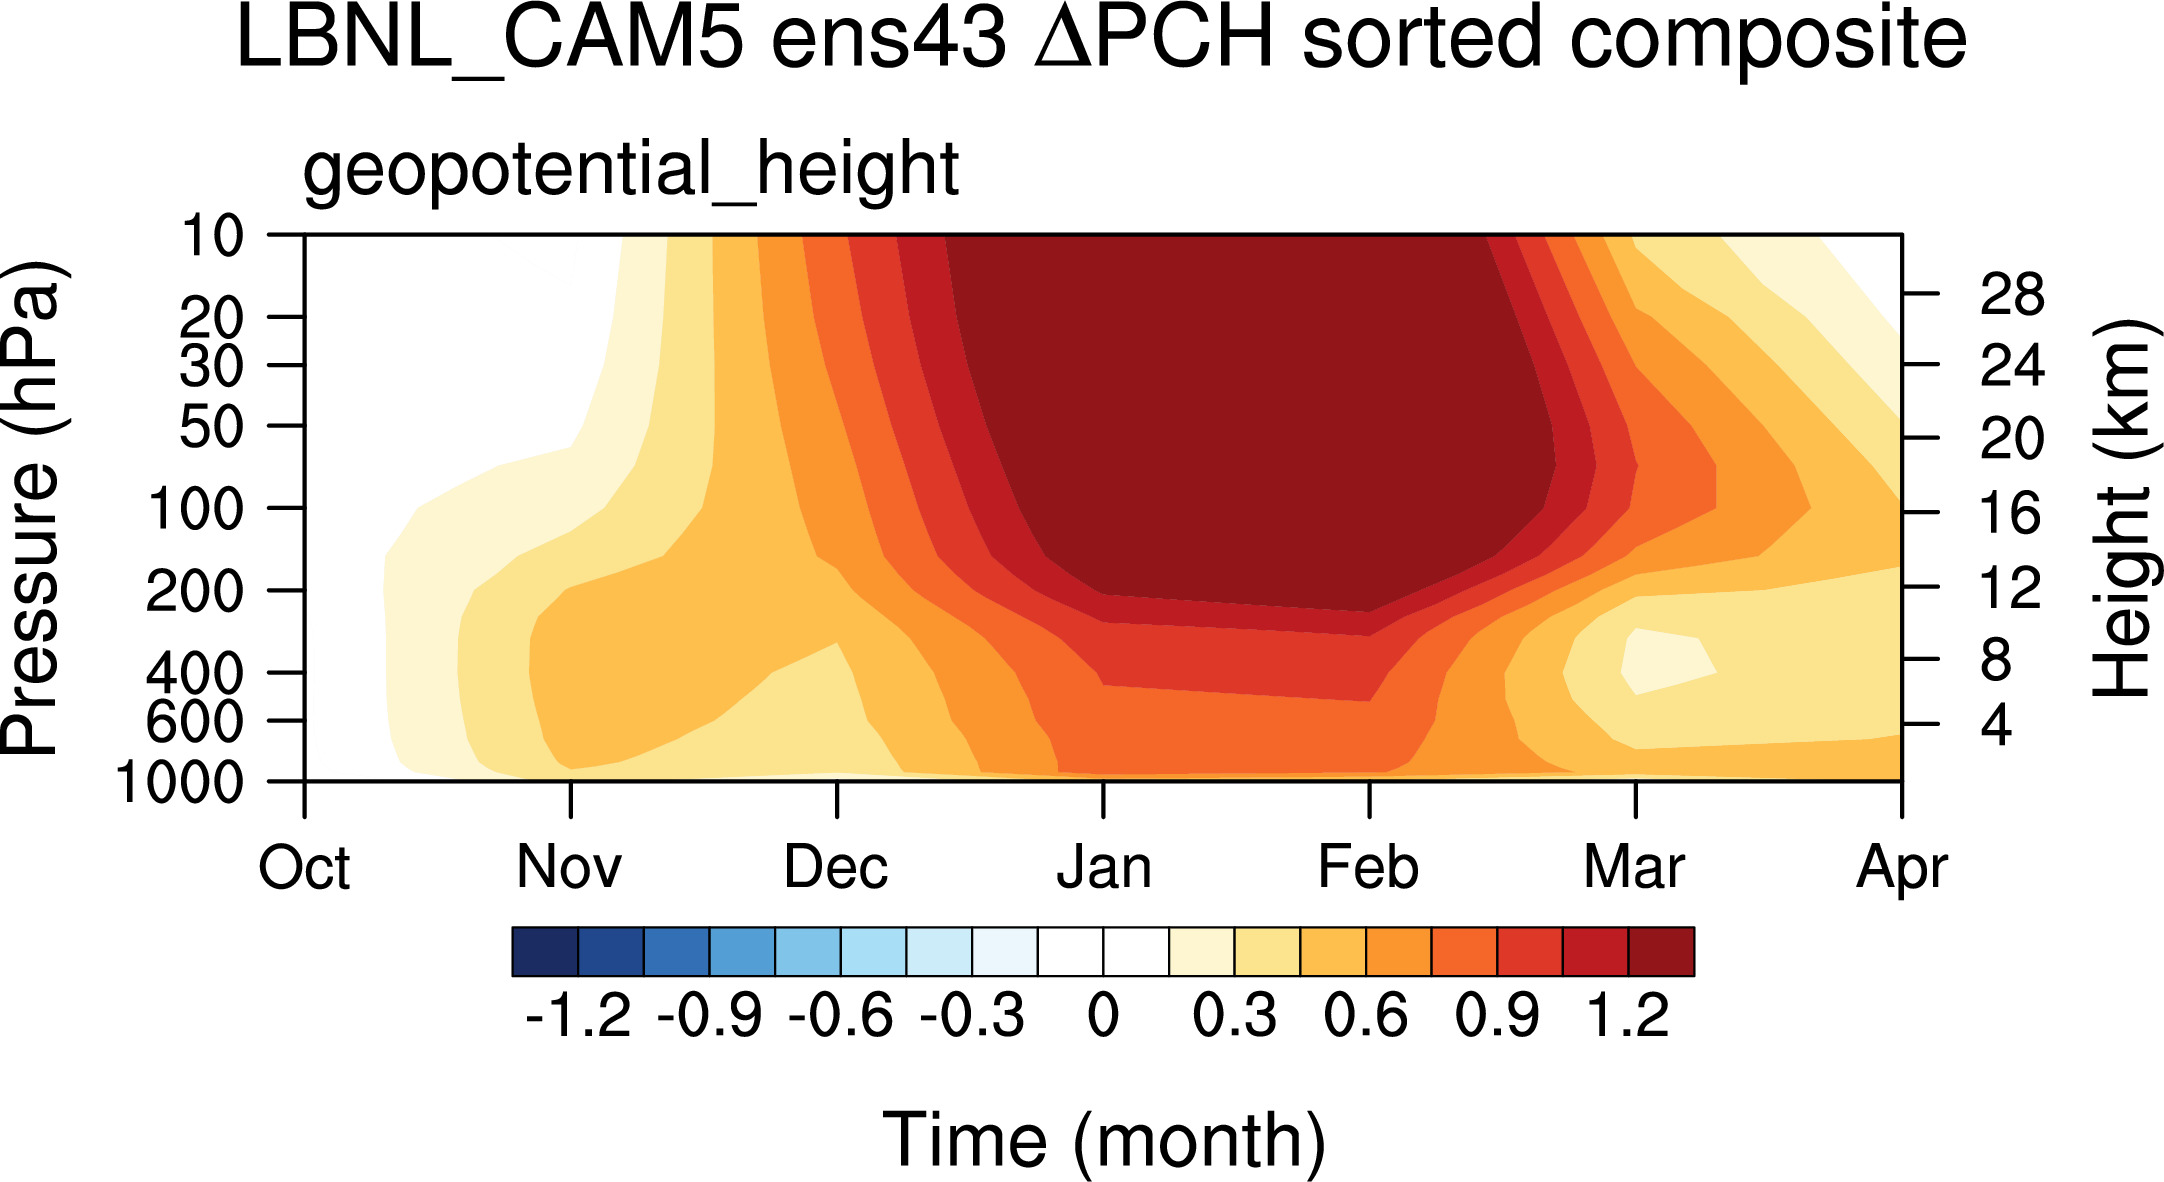
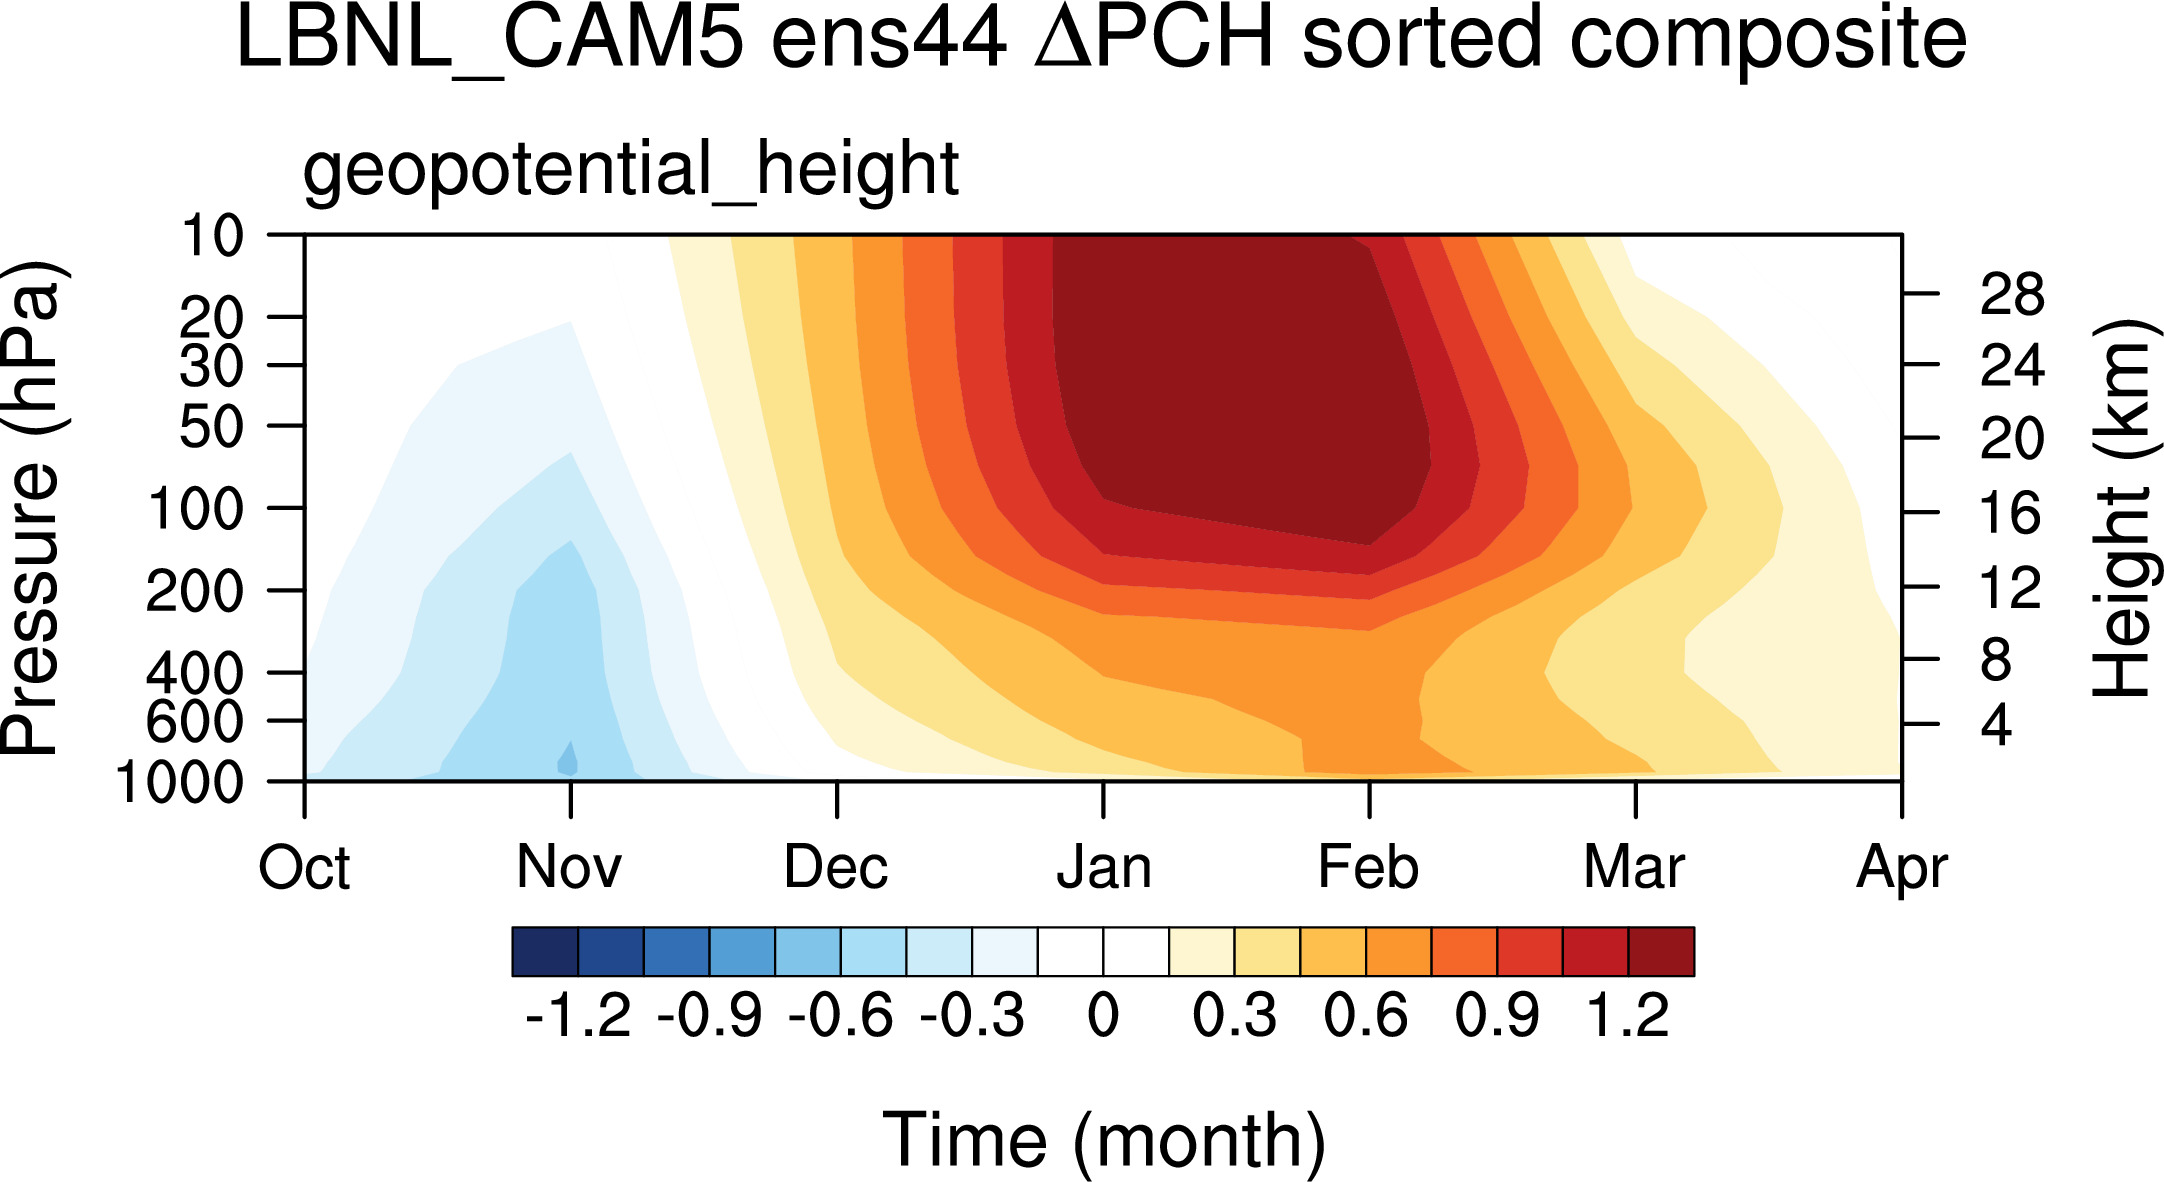
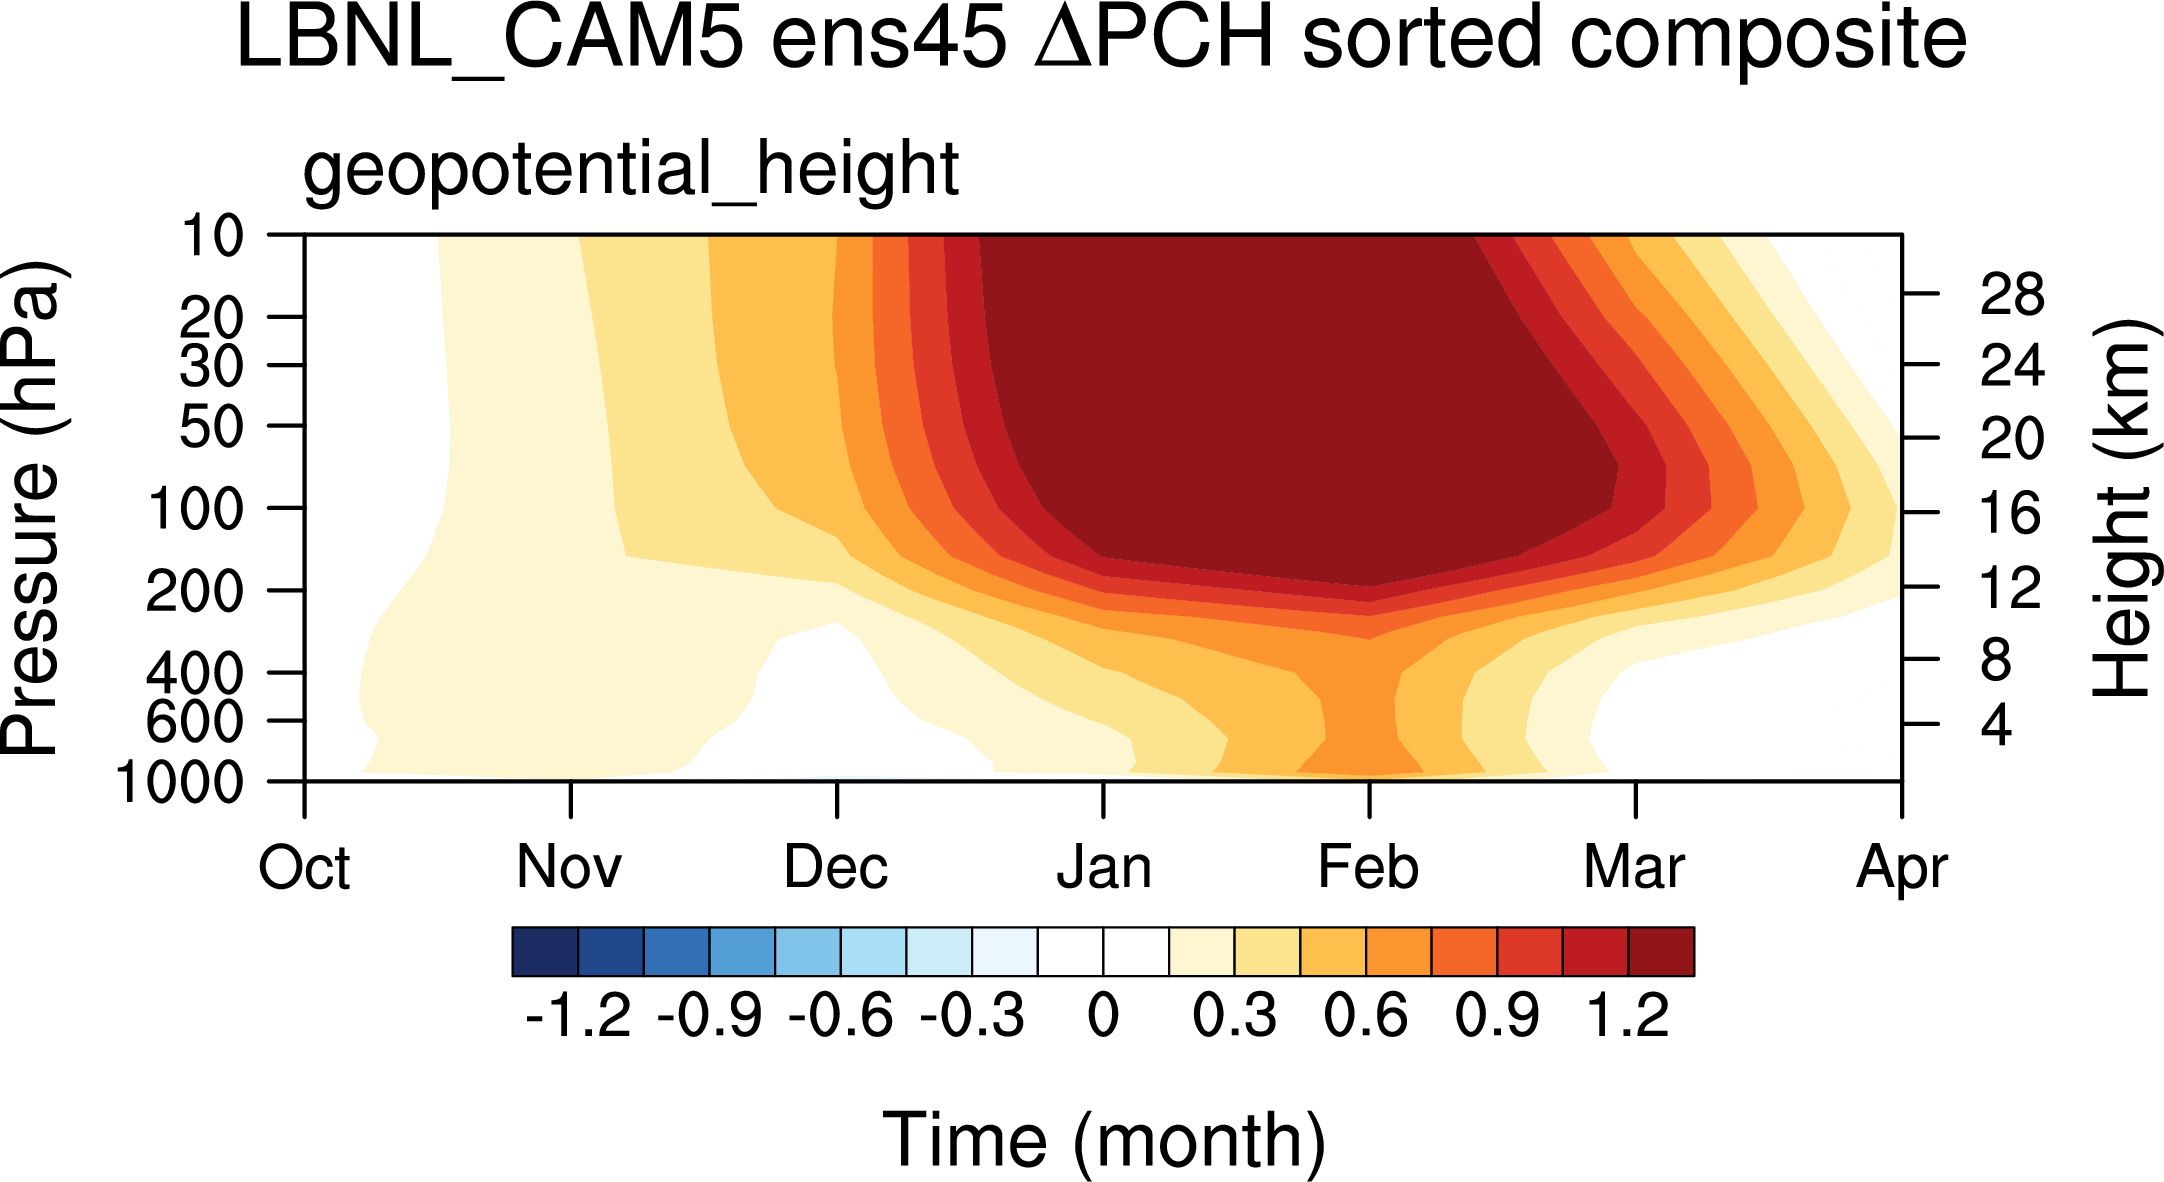
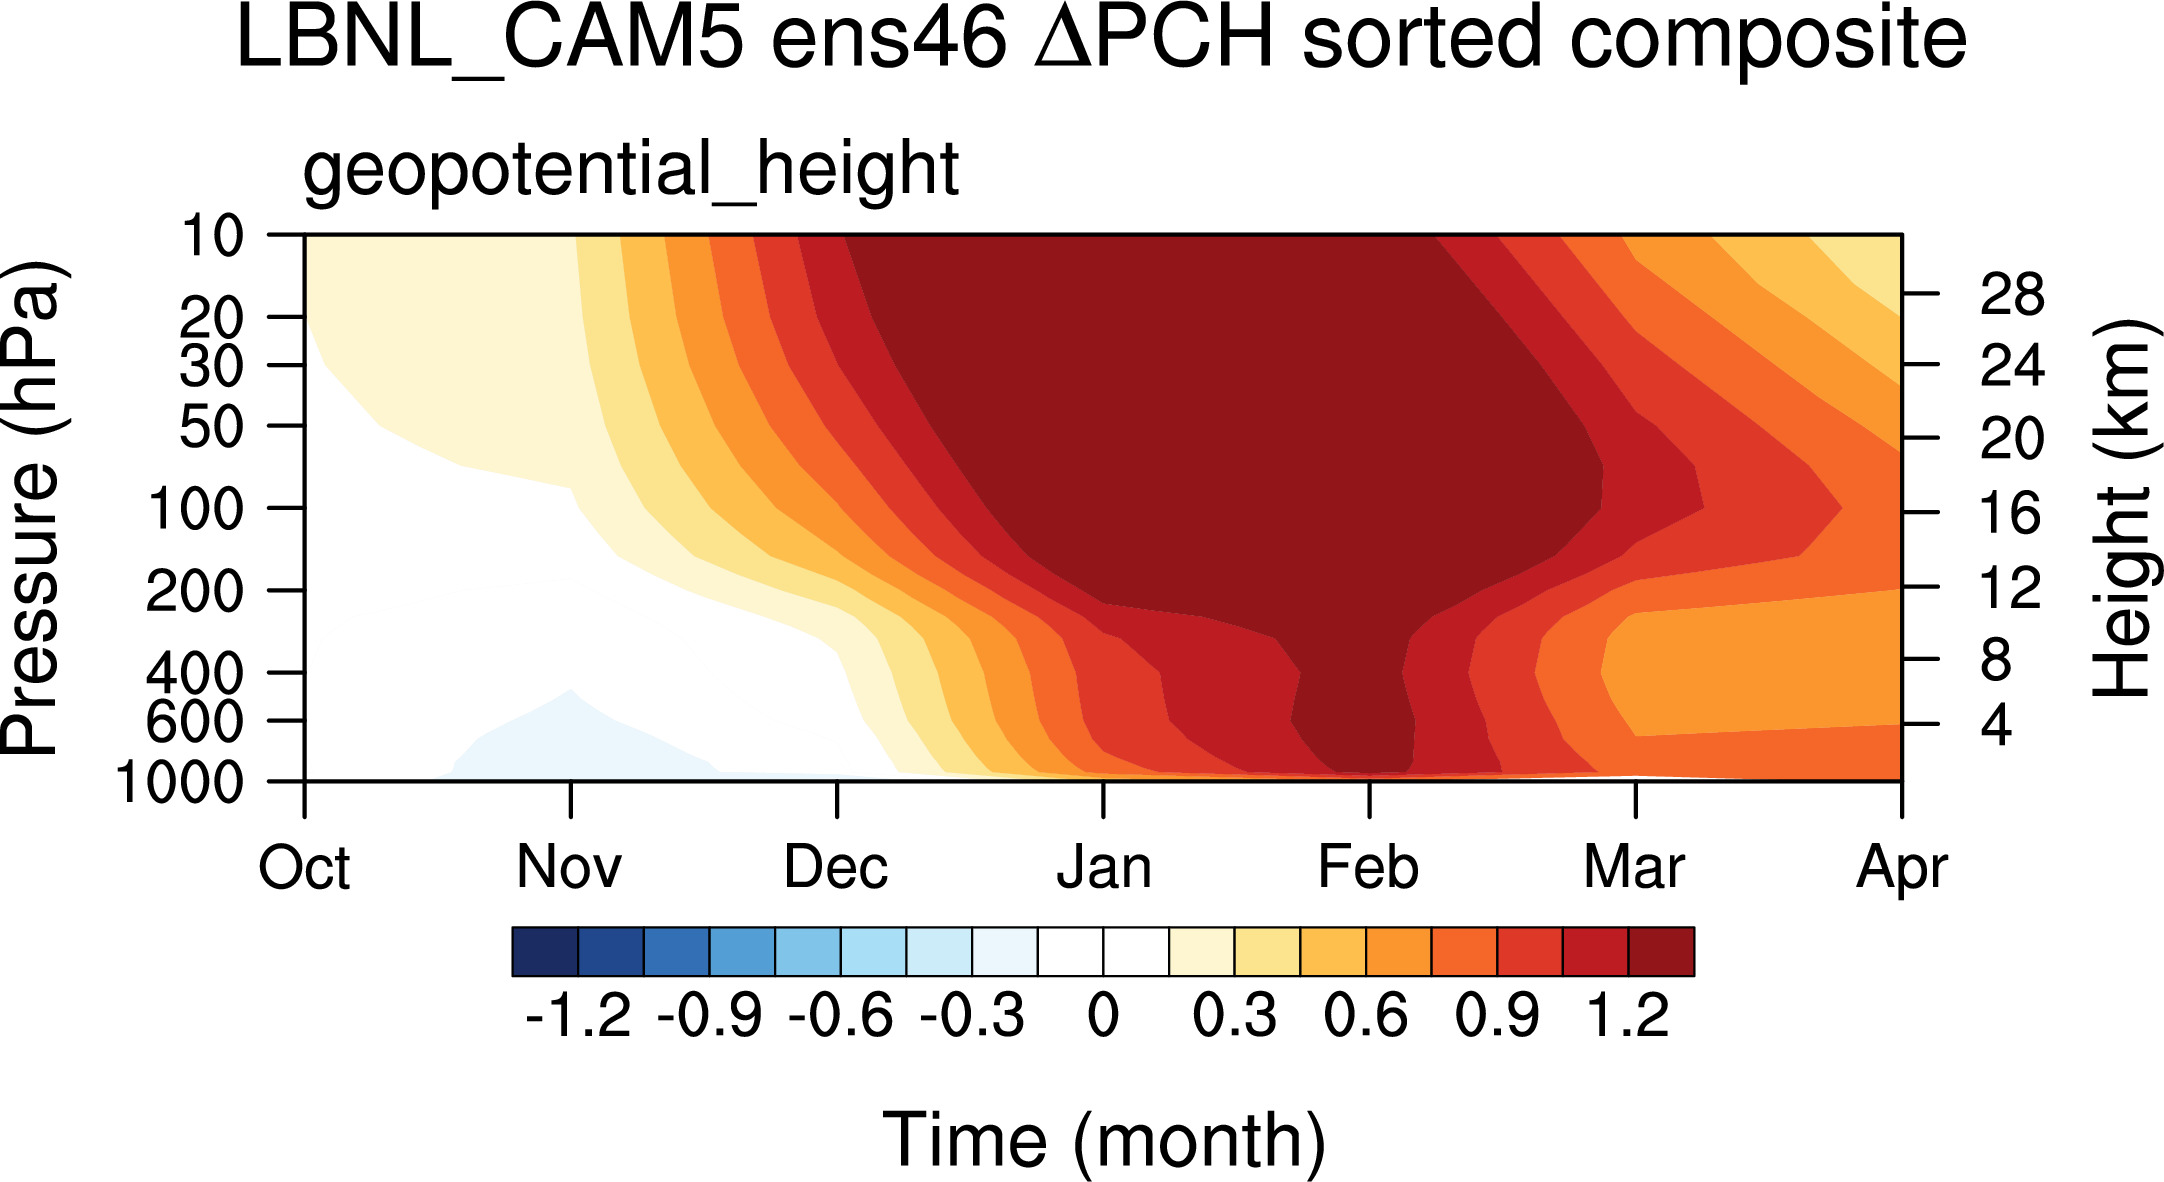
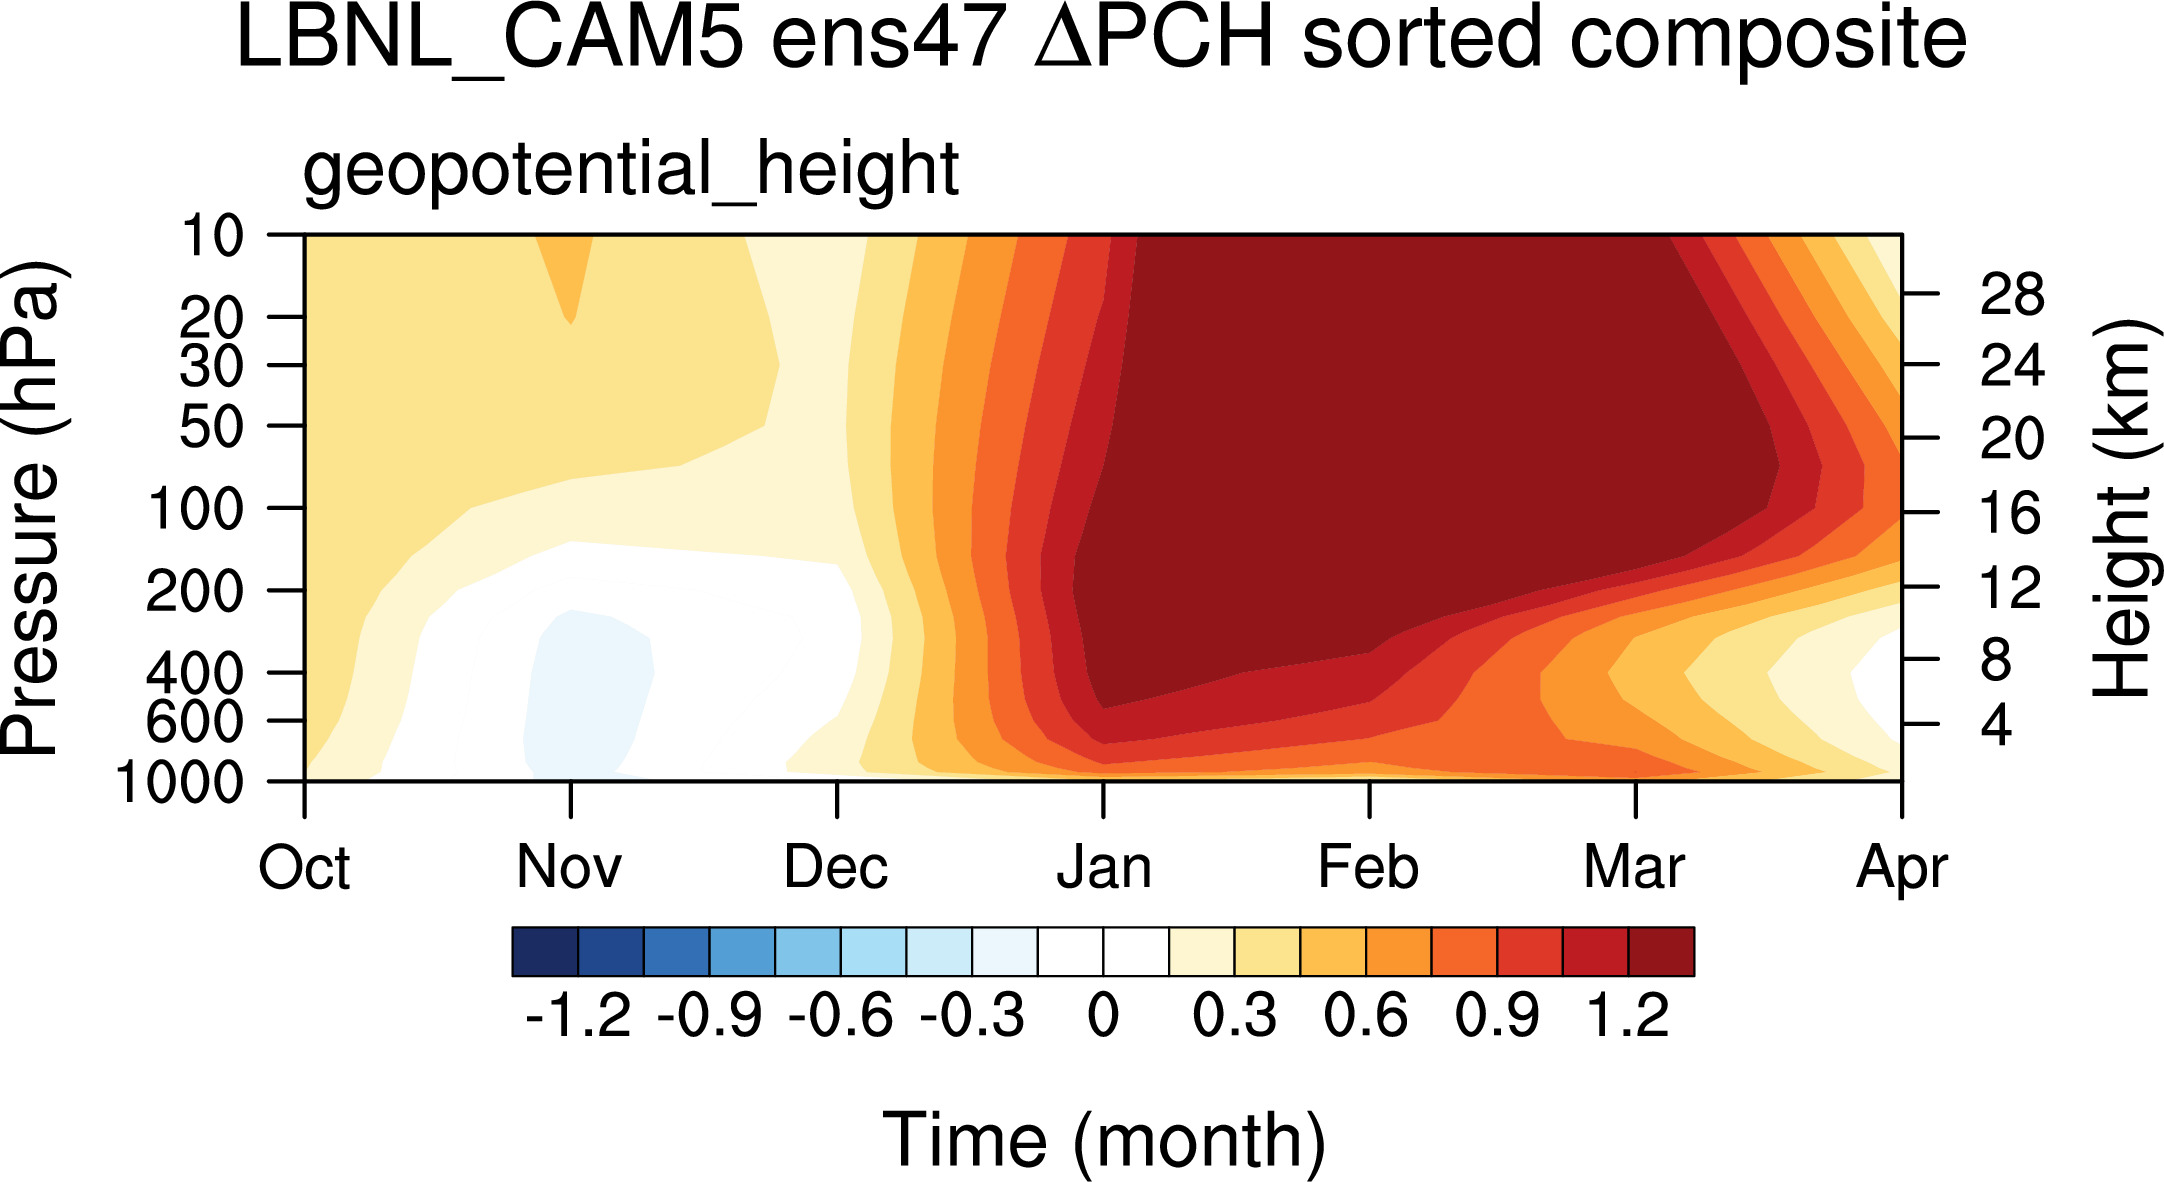
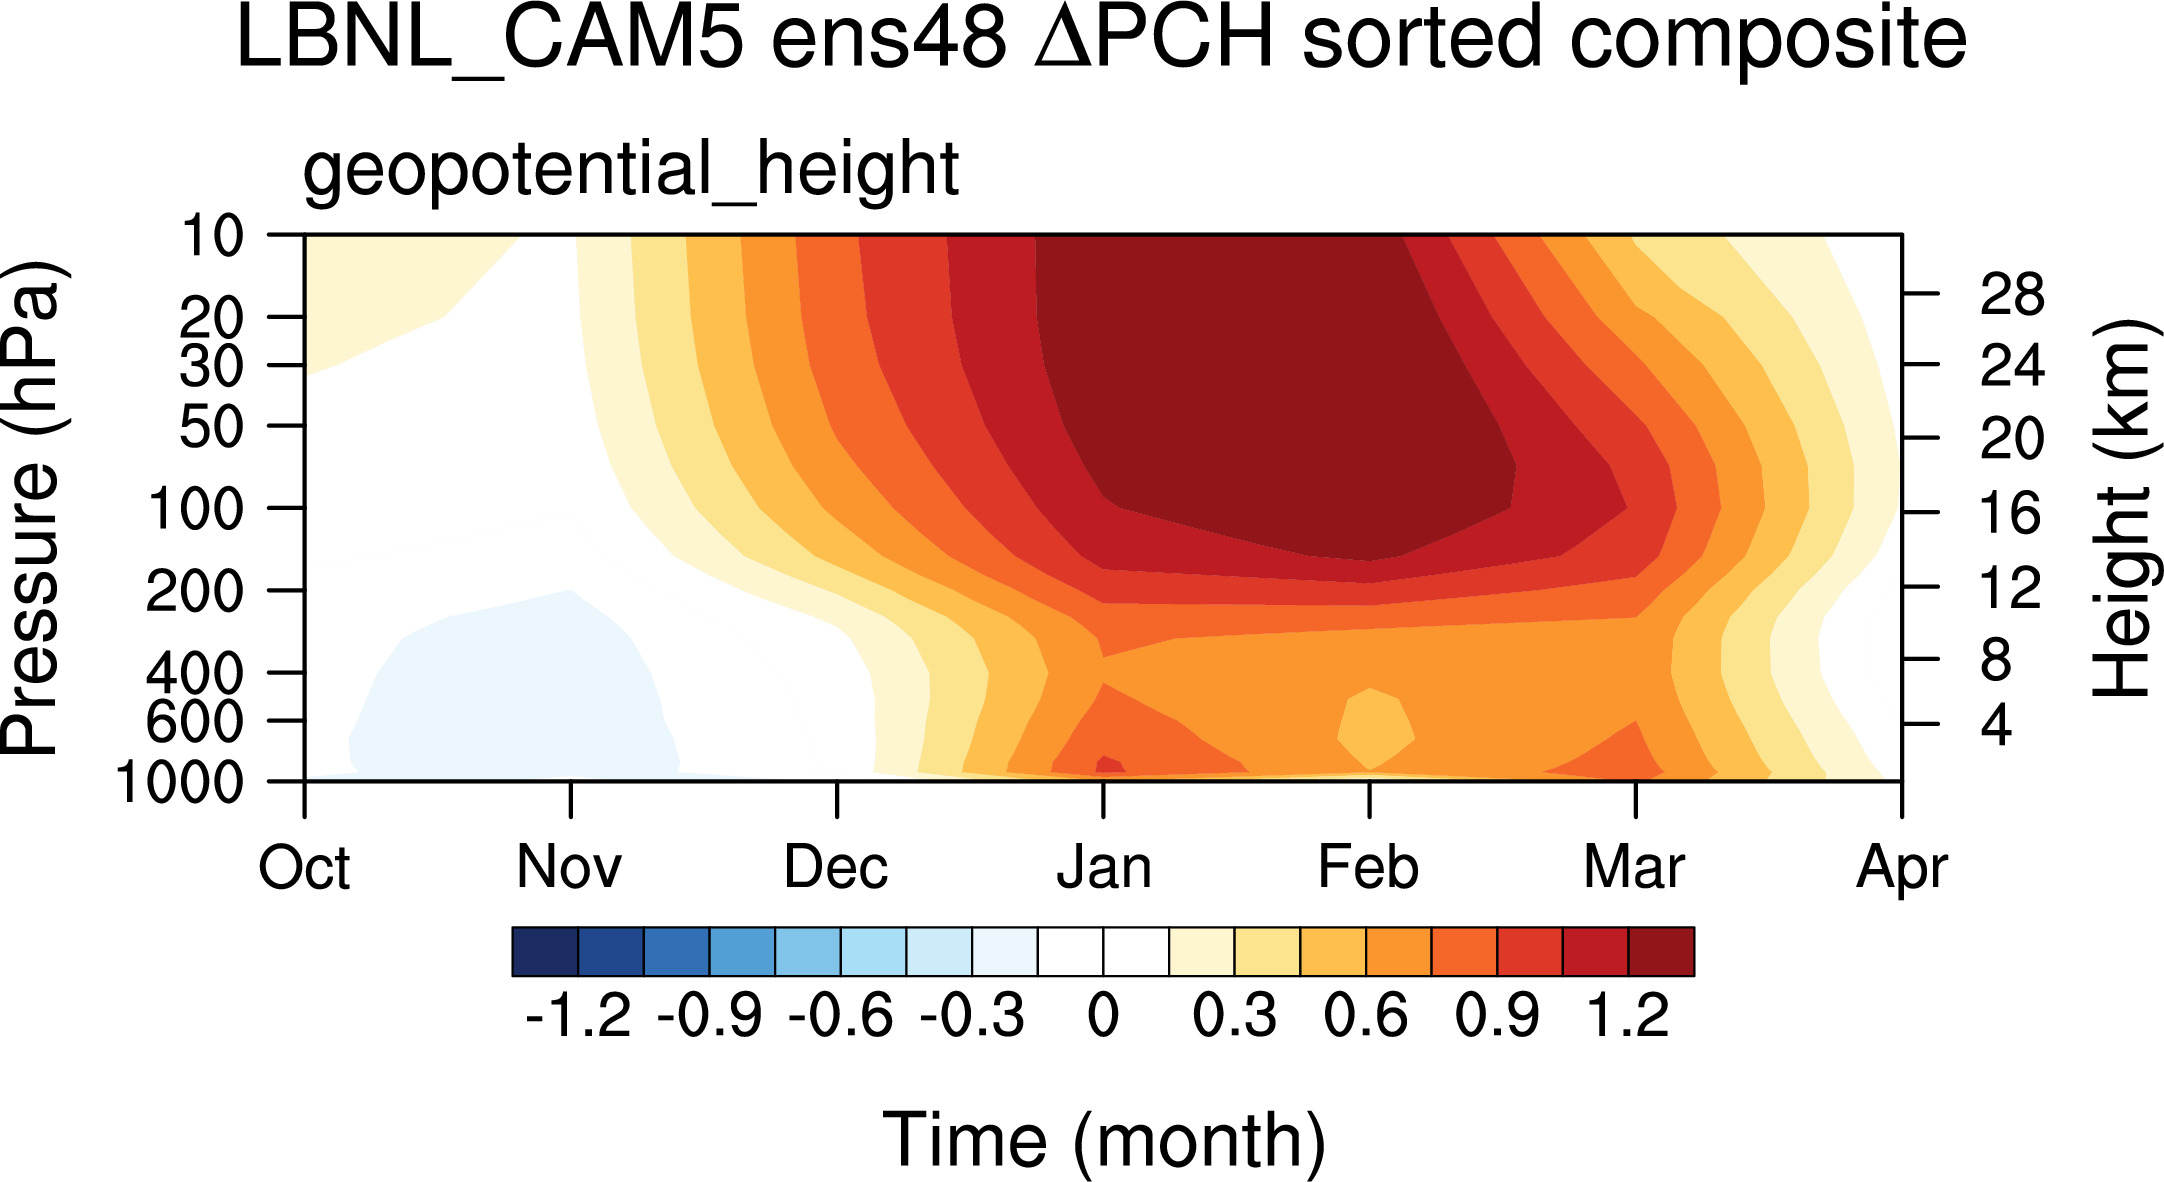
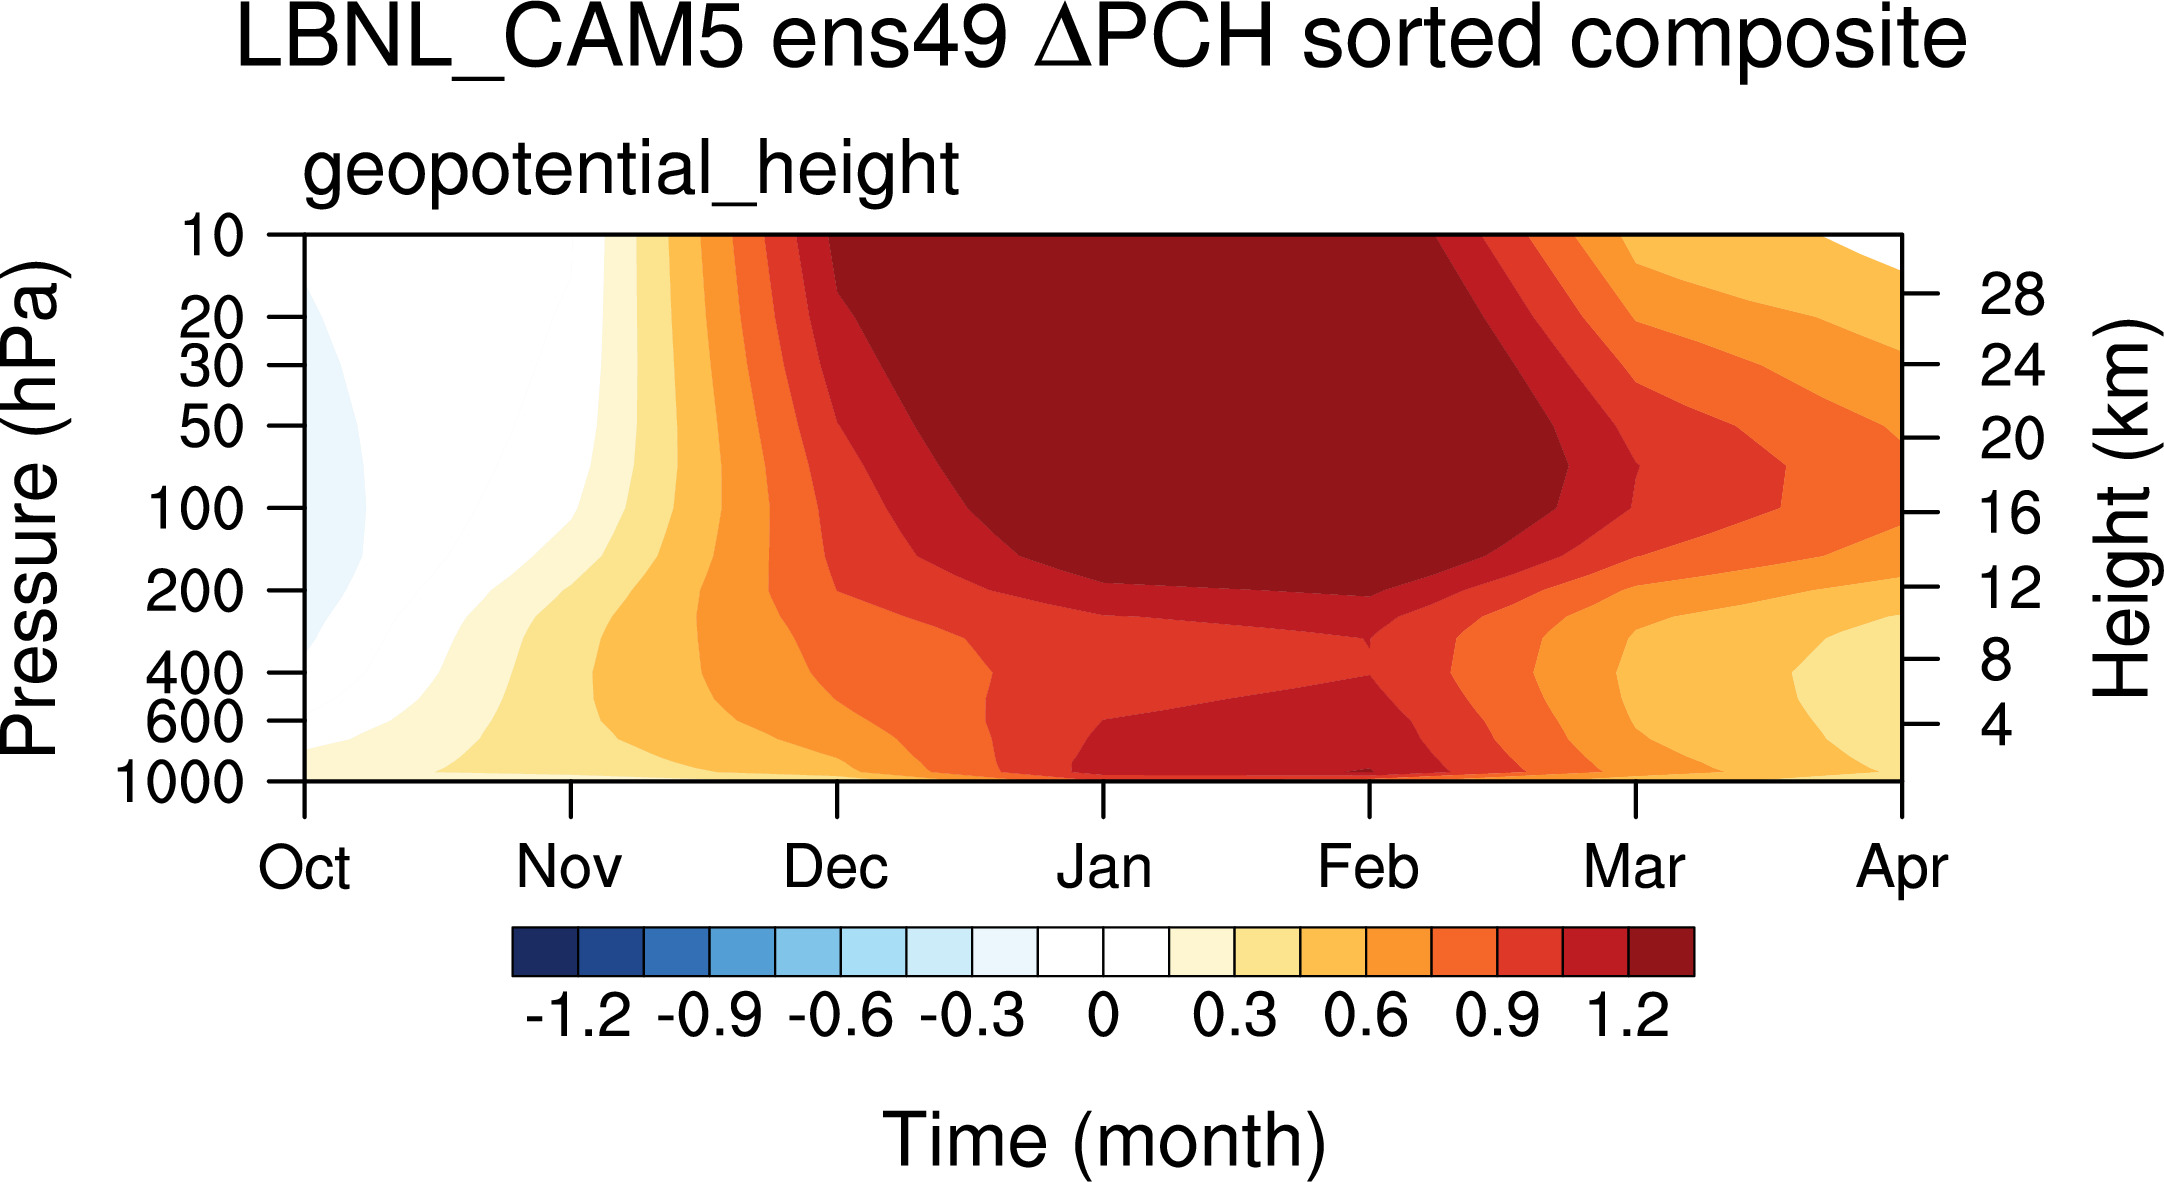
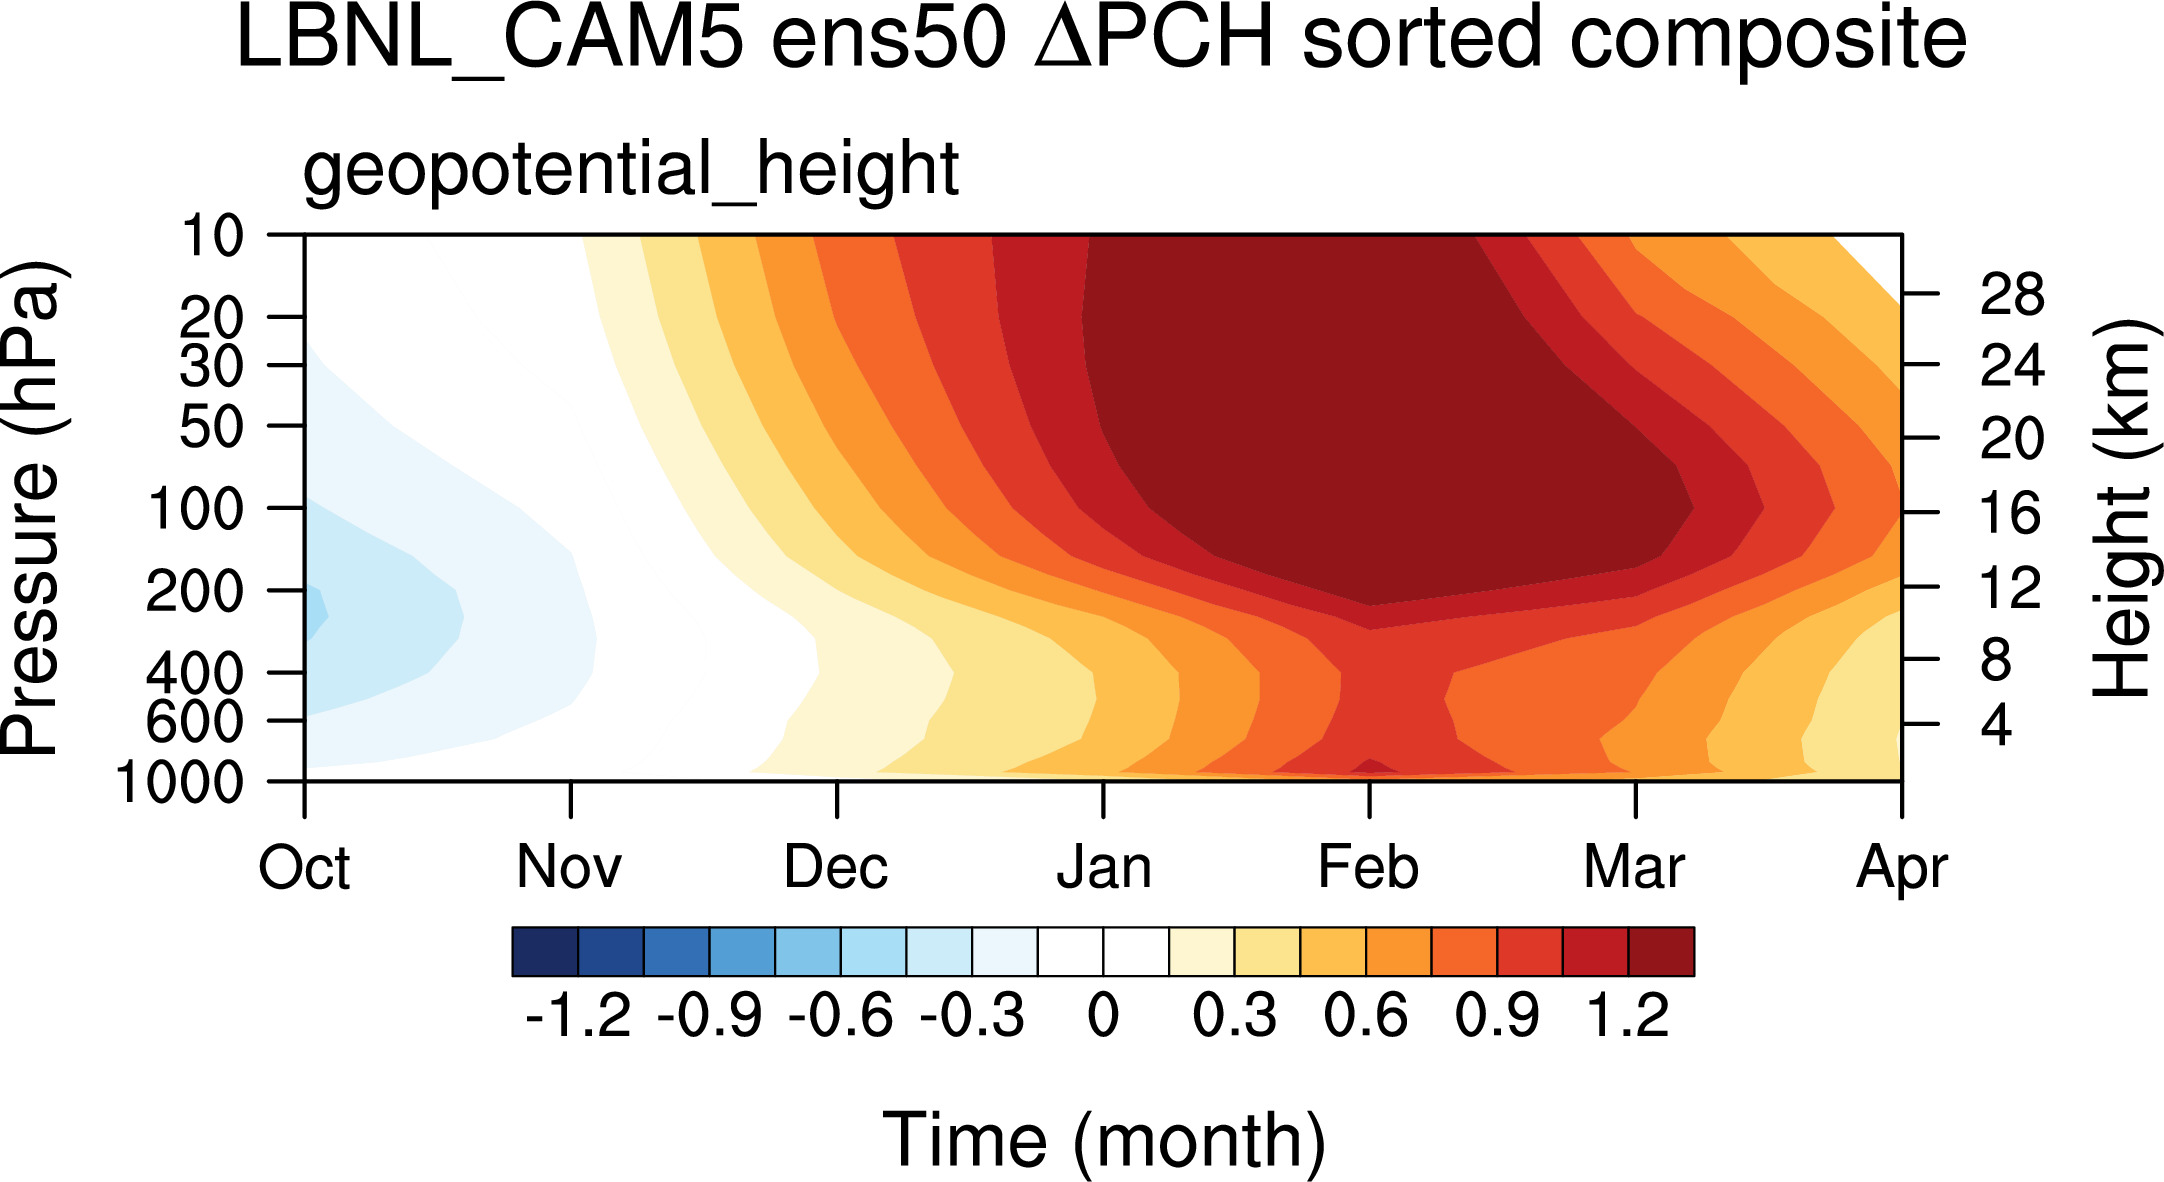
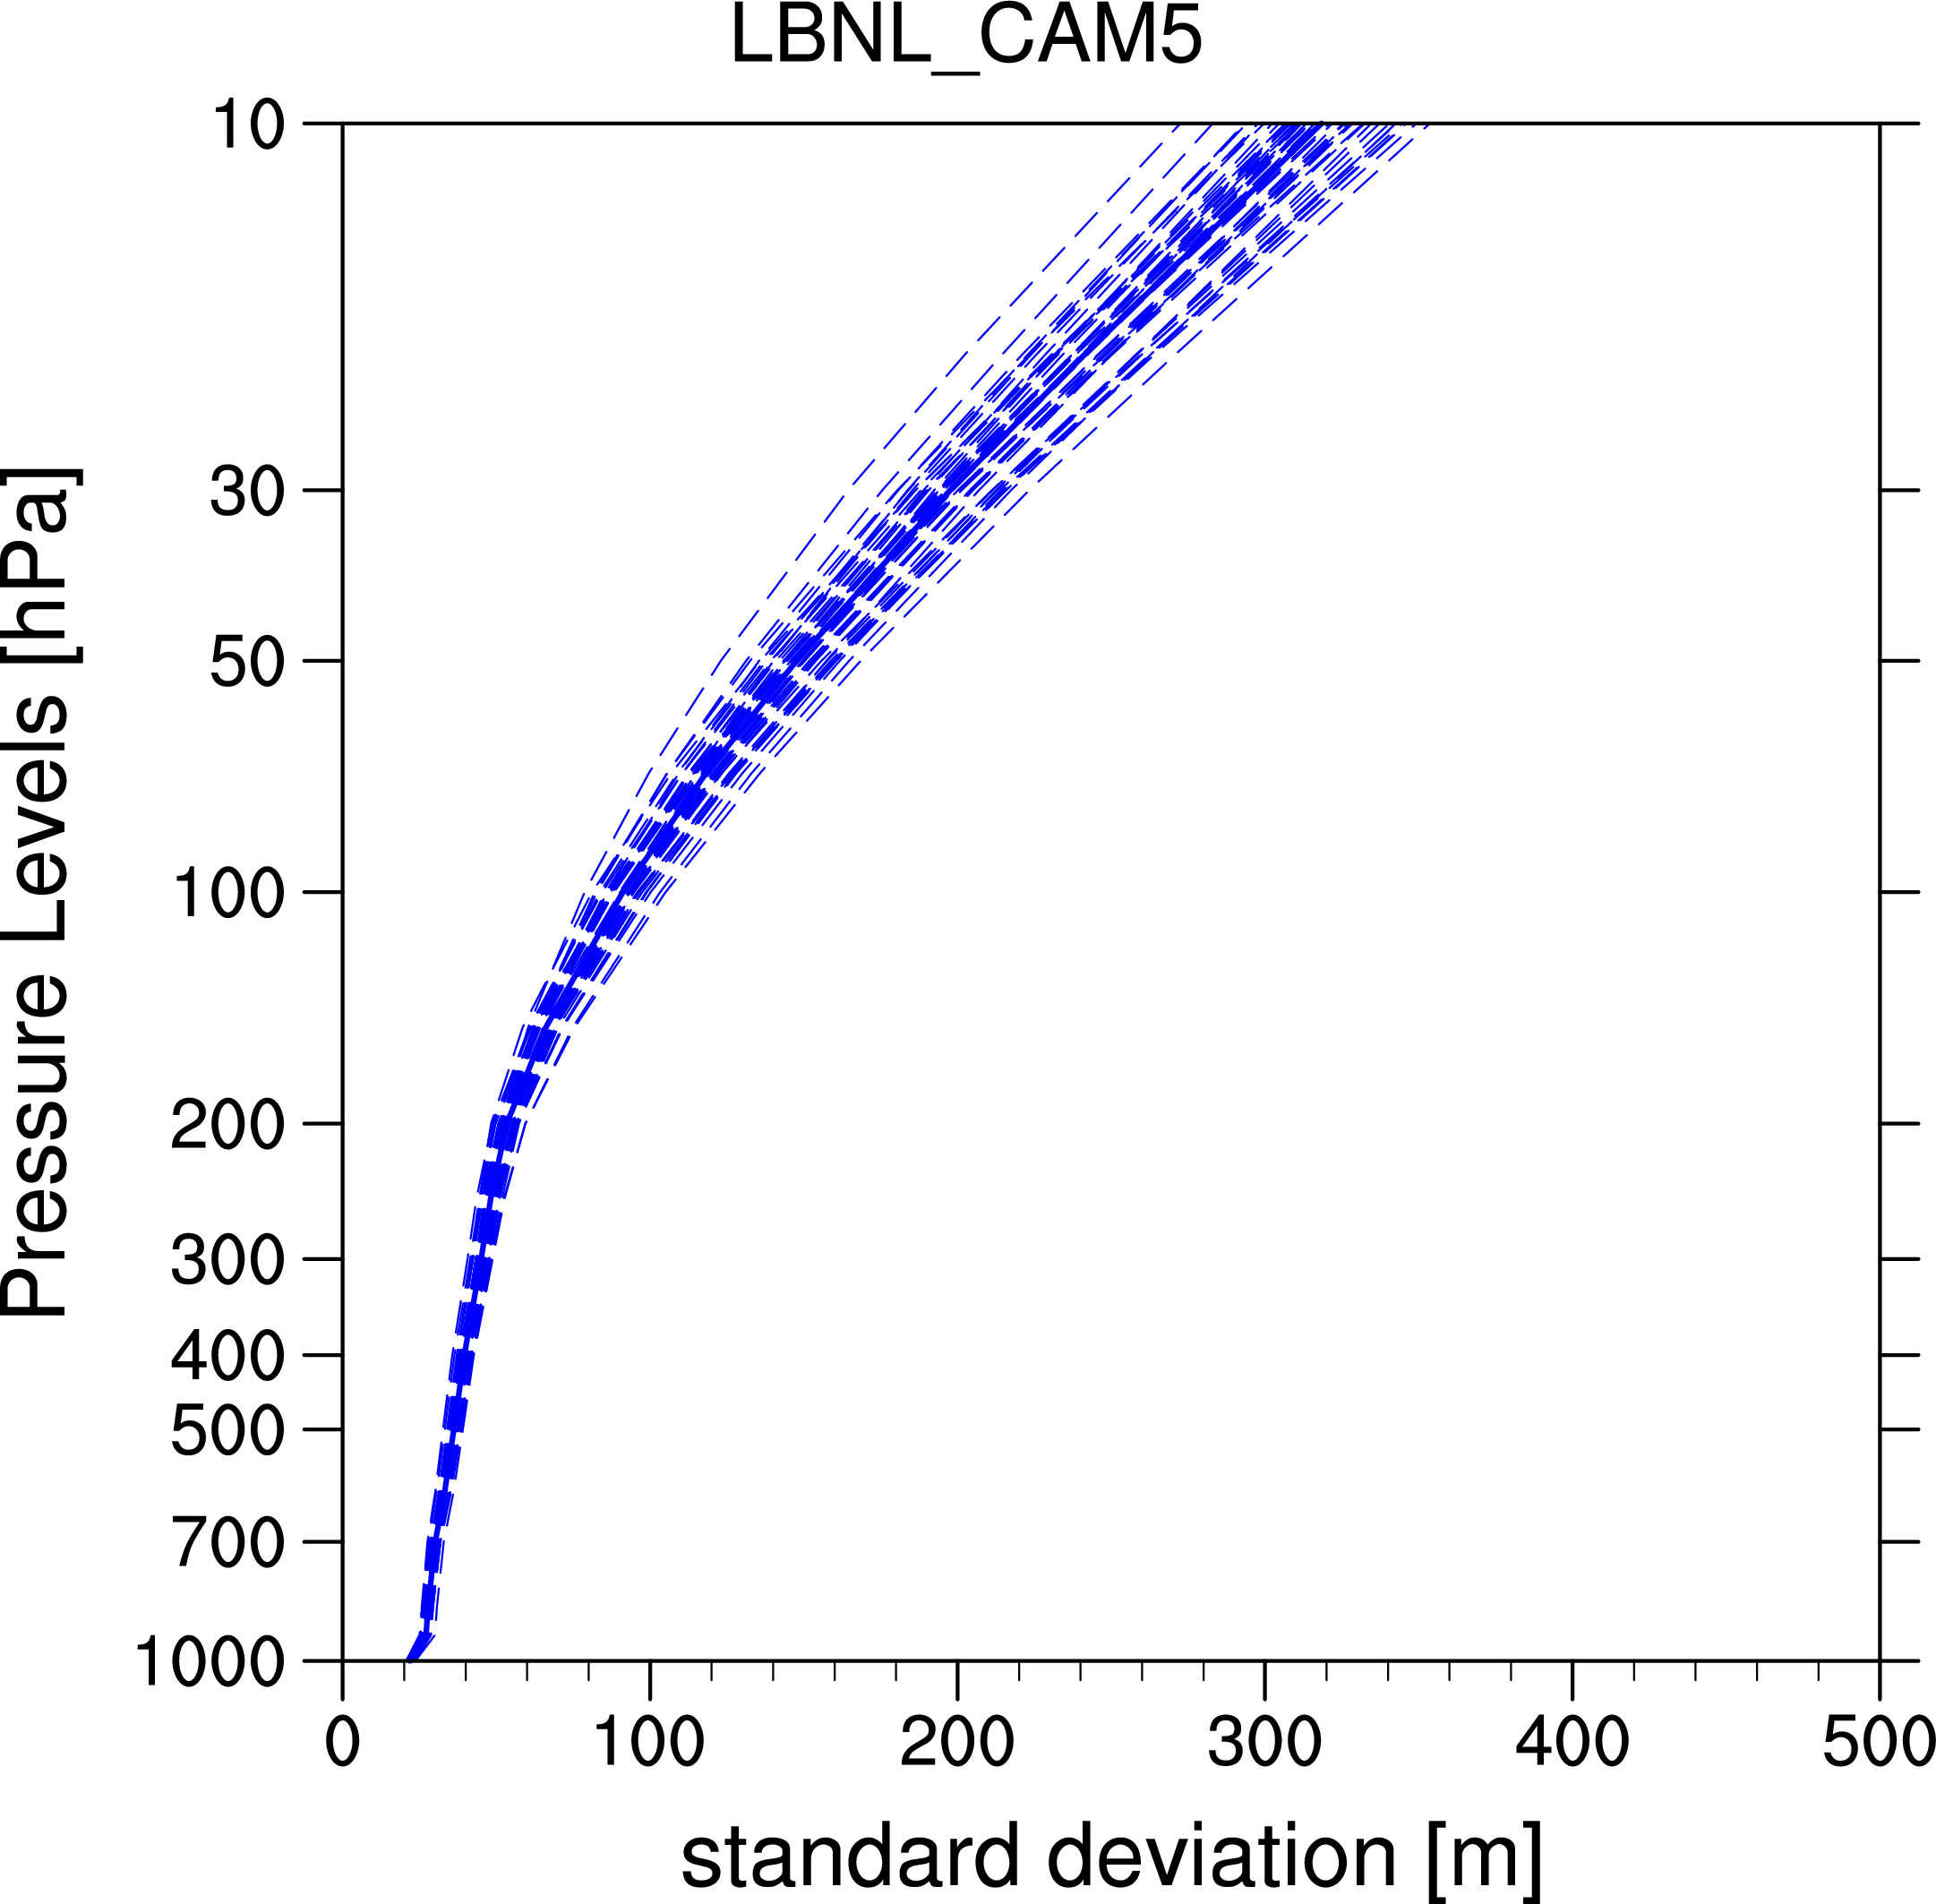 LBNL_CAM5
Ensemble mean:
Individual Runs:

Individual Years here
-----
Special case Sorted on largest values of Jan Feb mean at 50hPa
Ensemble mean:
Individual Runs:
-------------------------------------------------------------------------------
-----------------------------
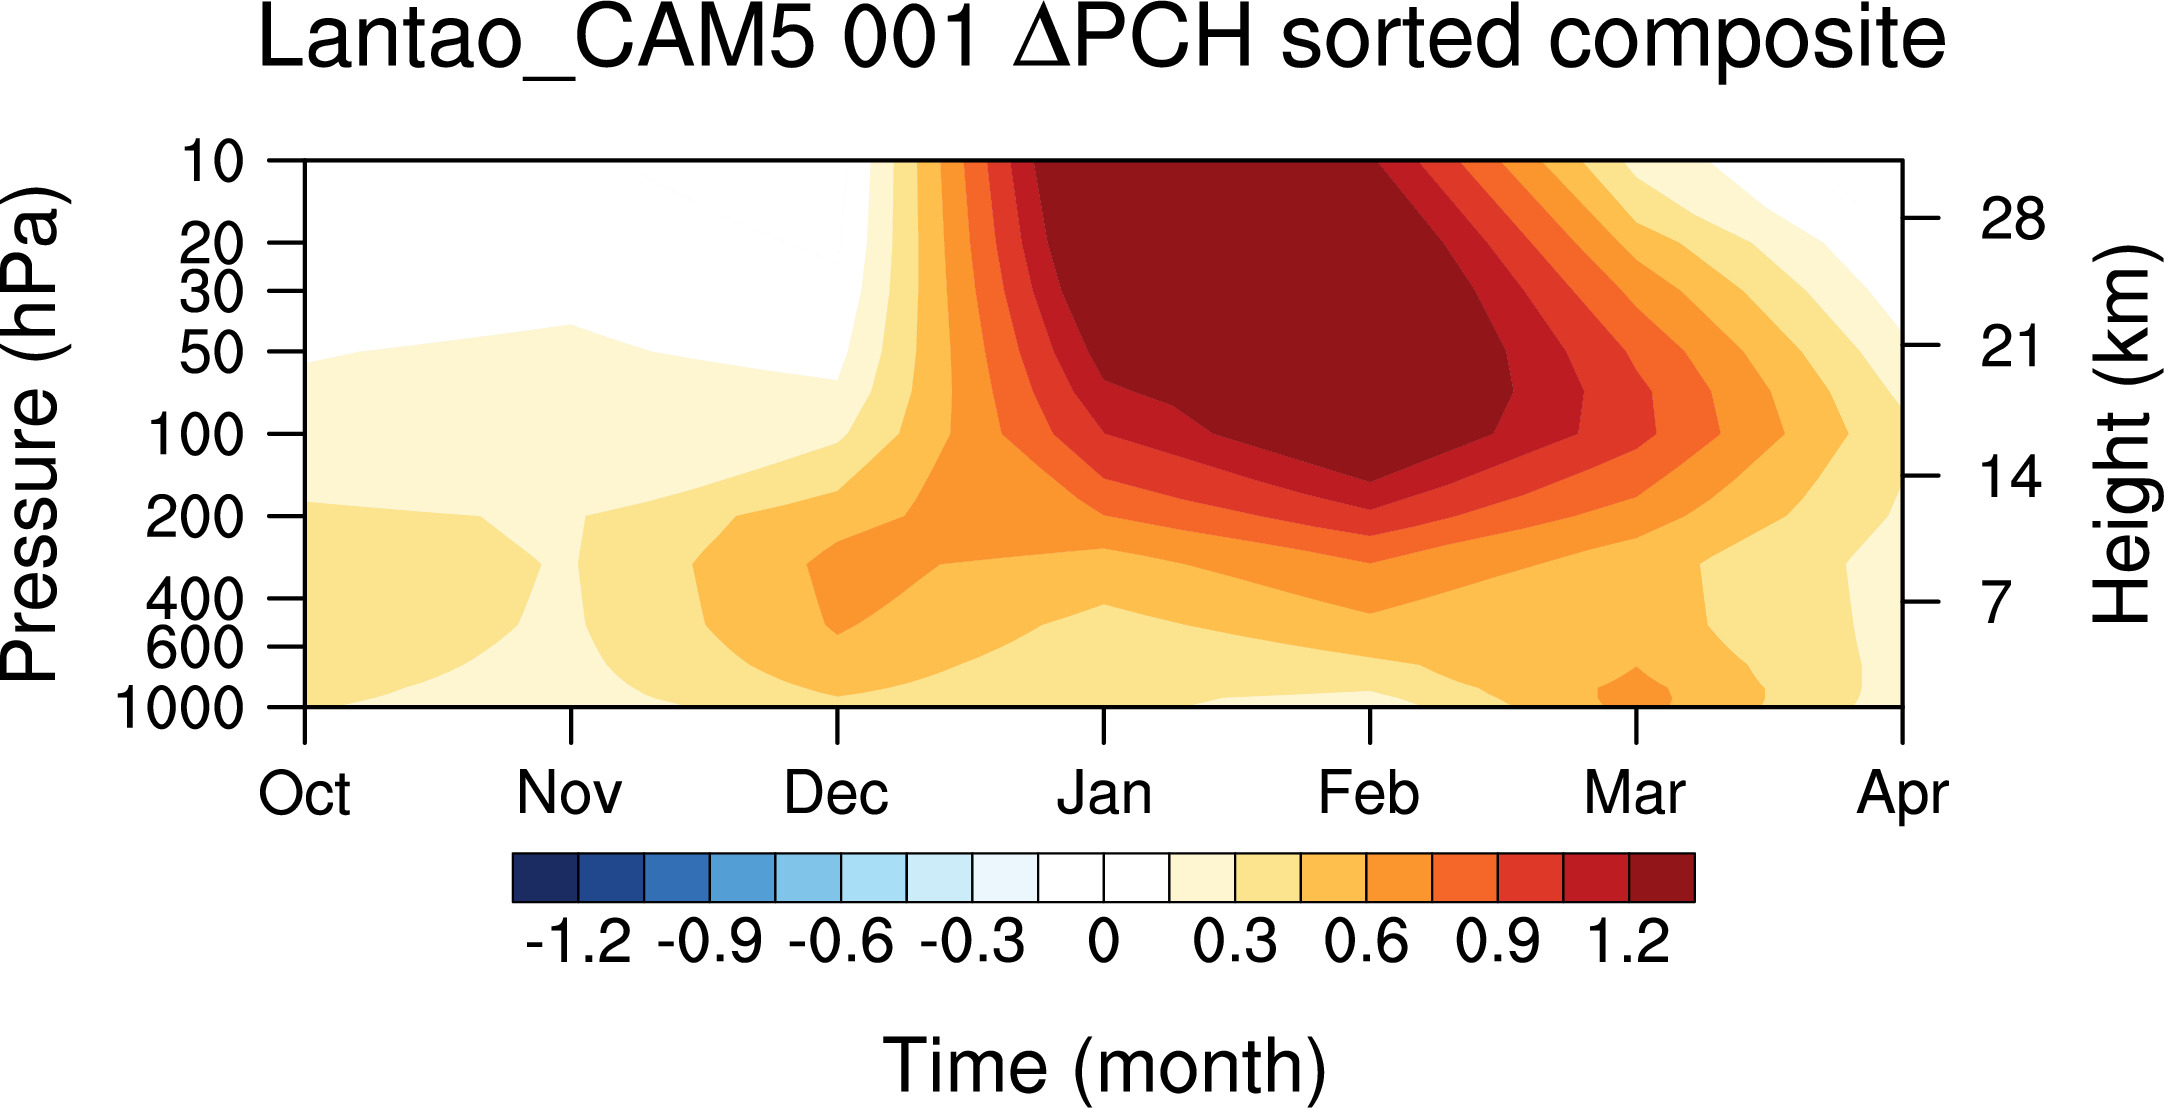
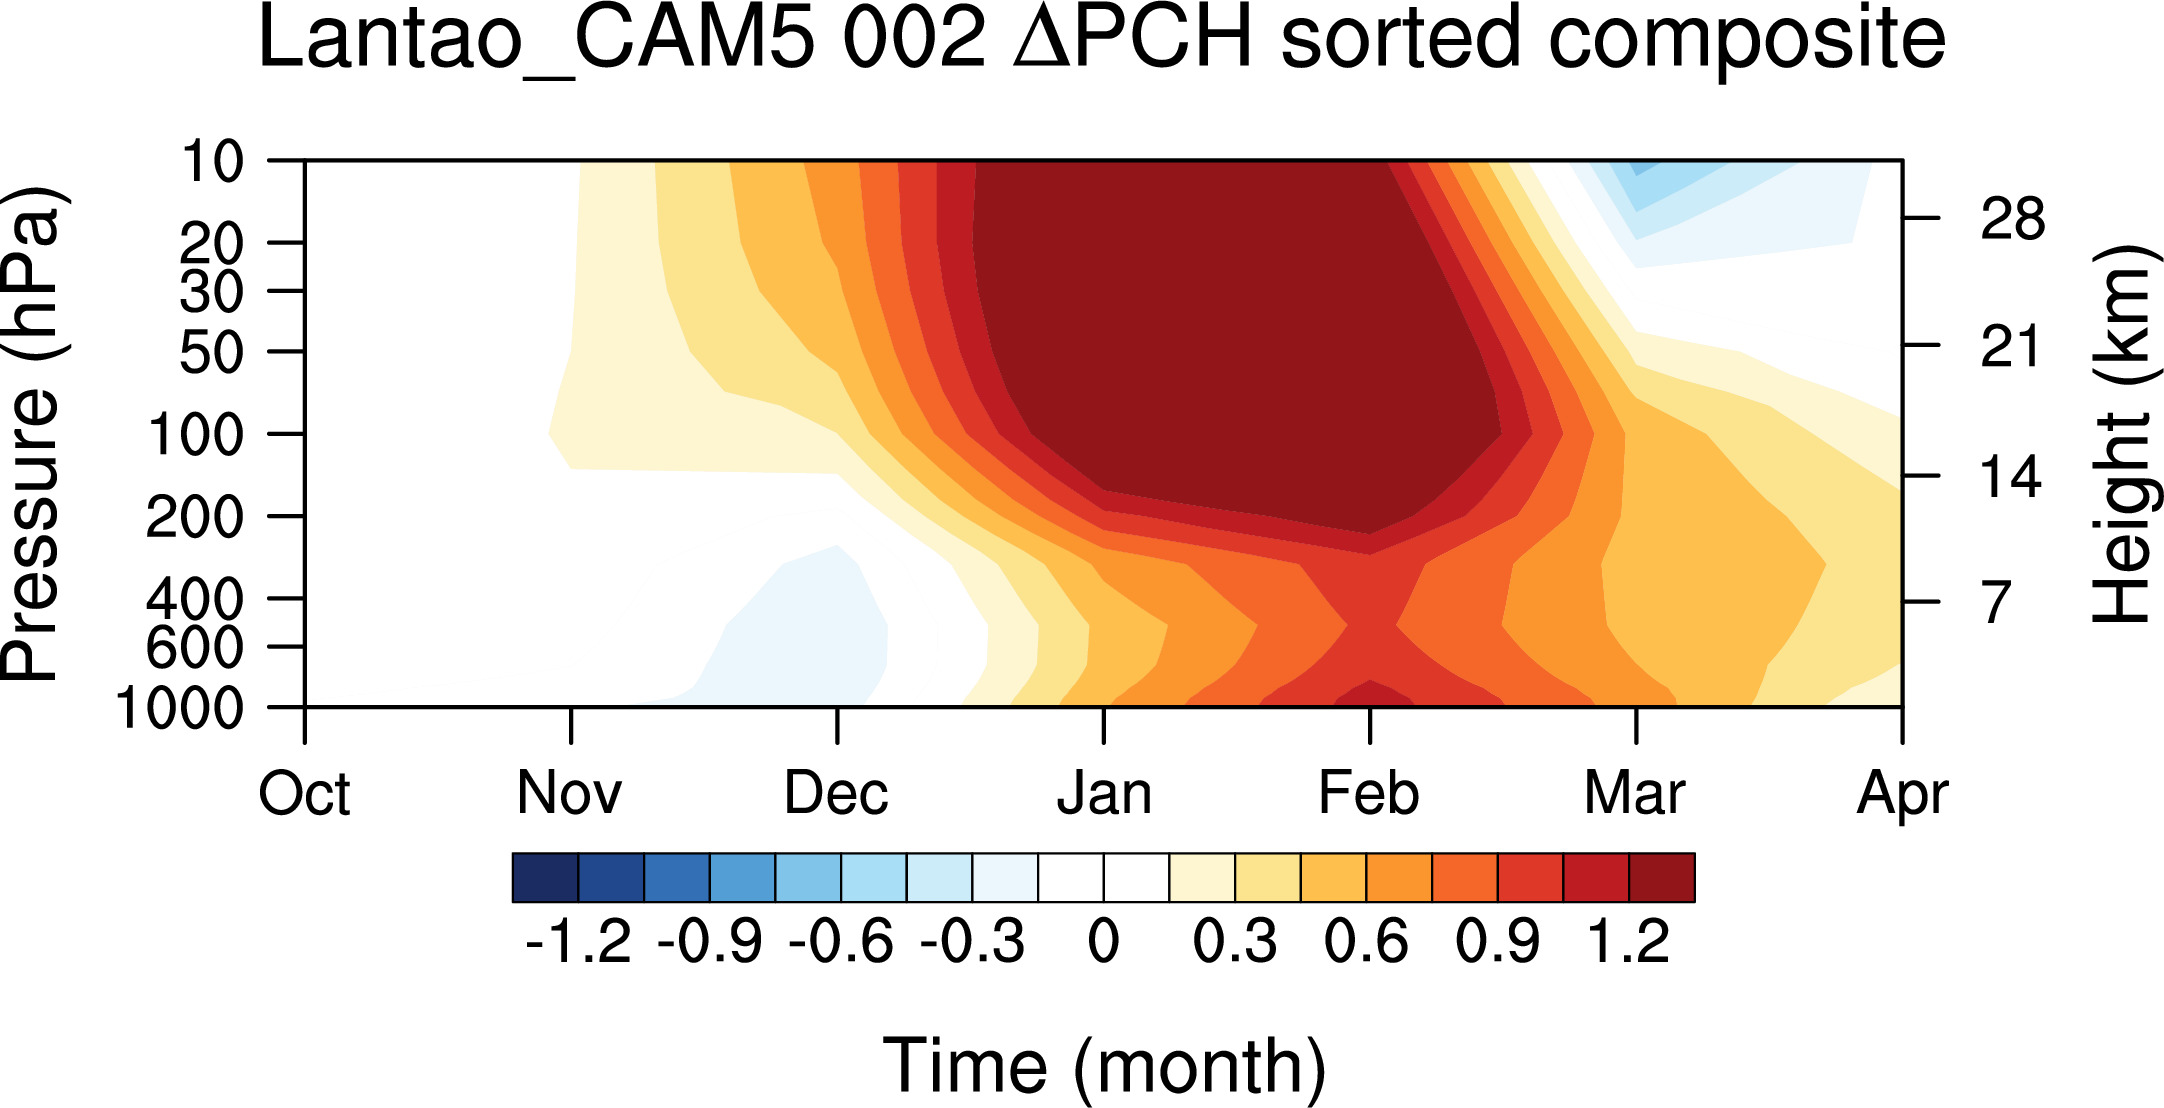
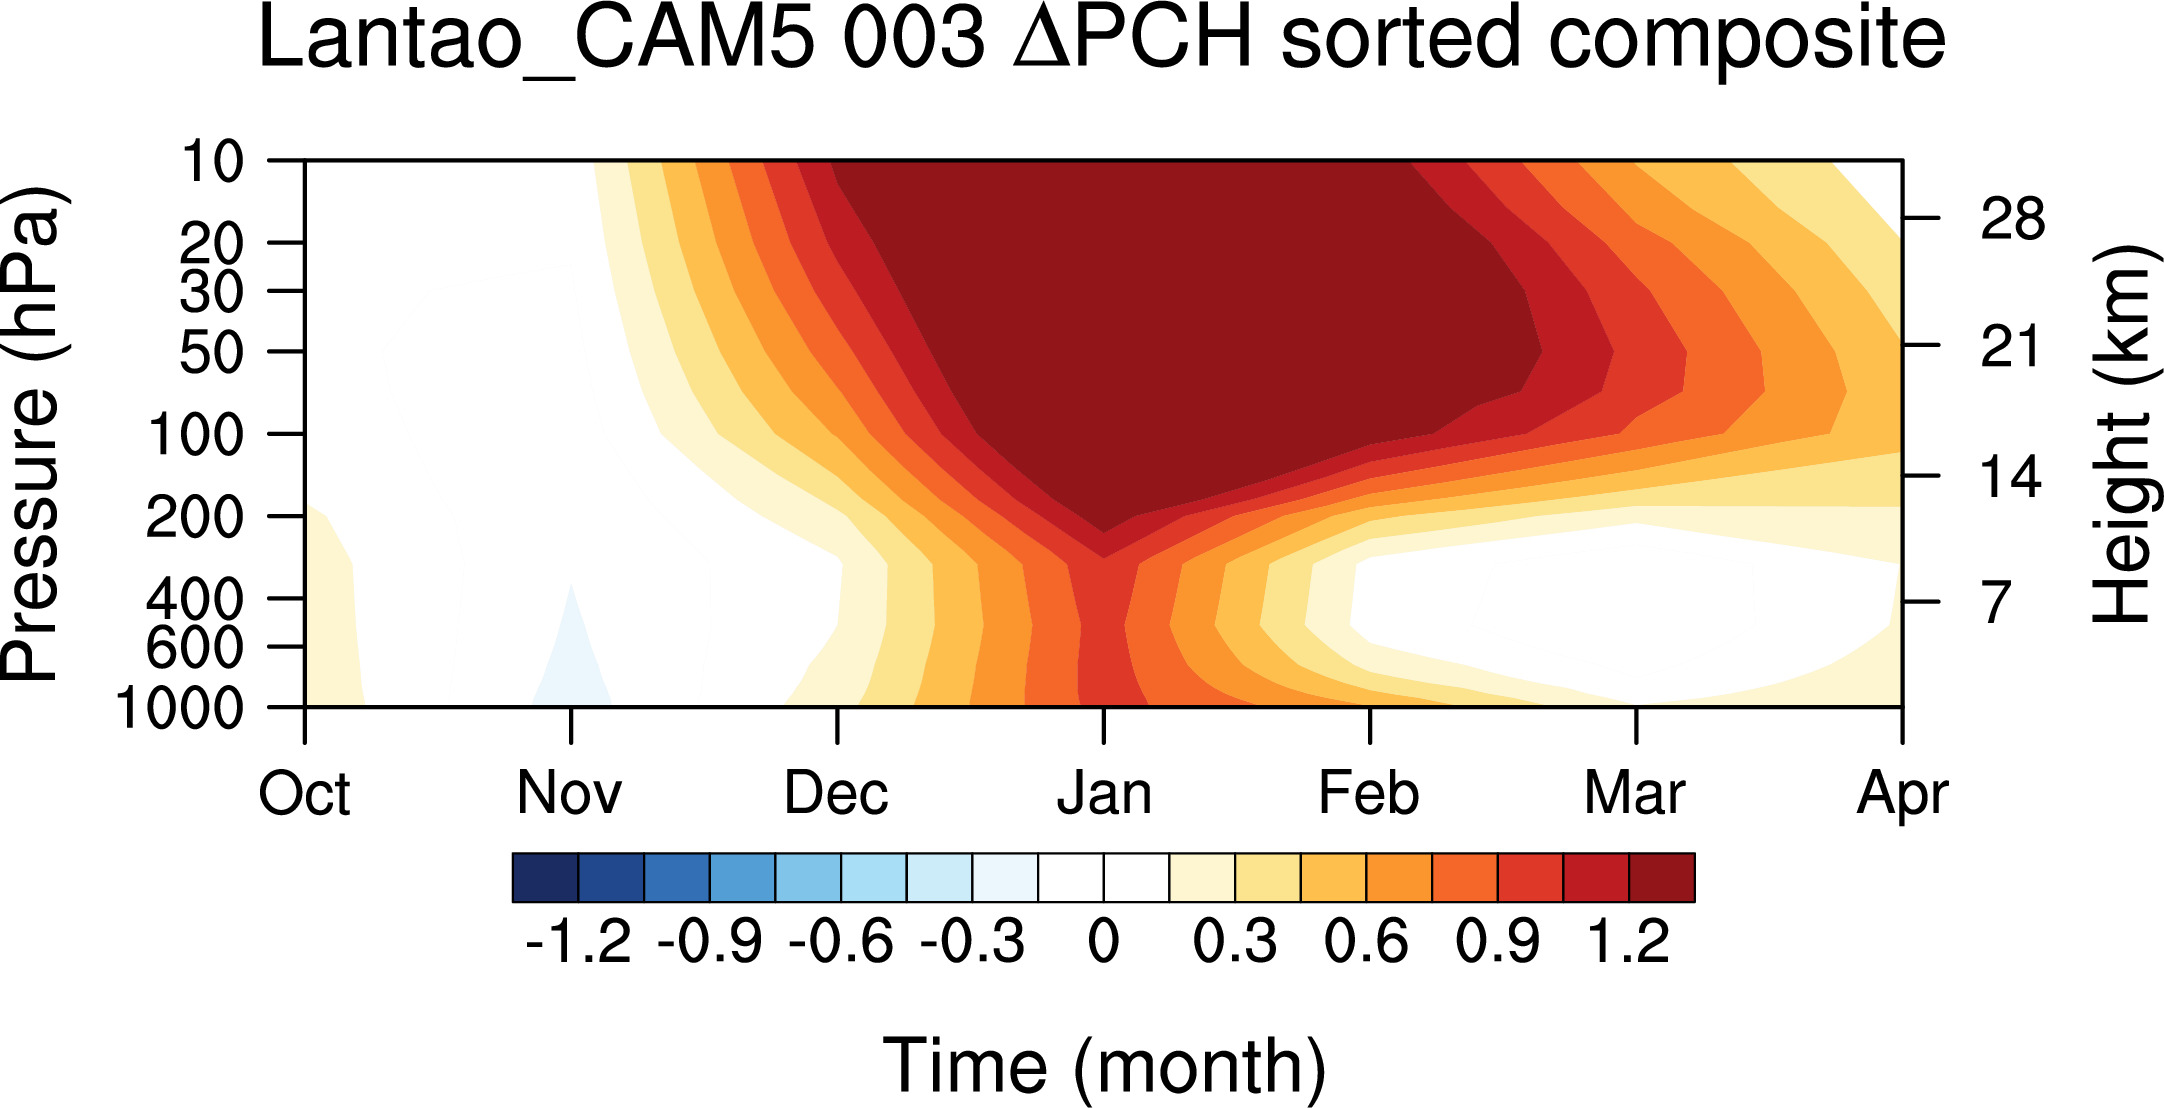
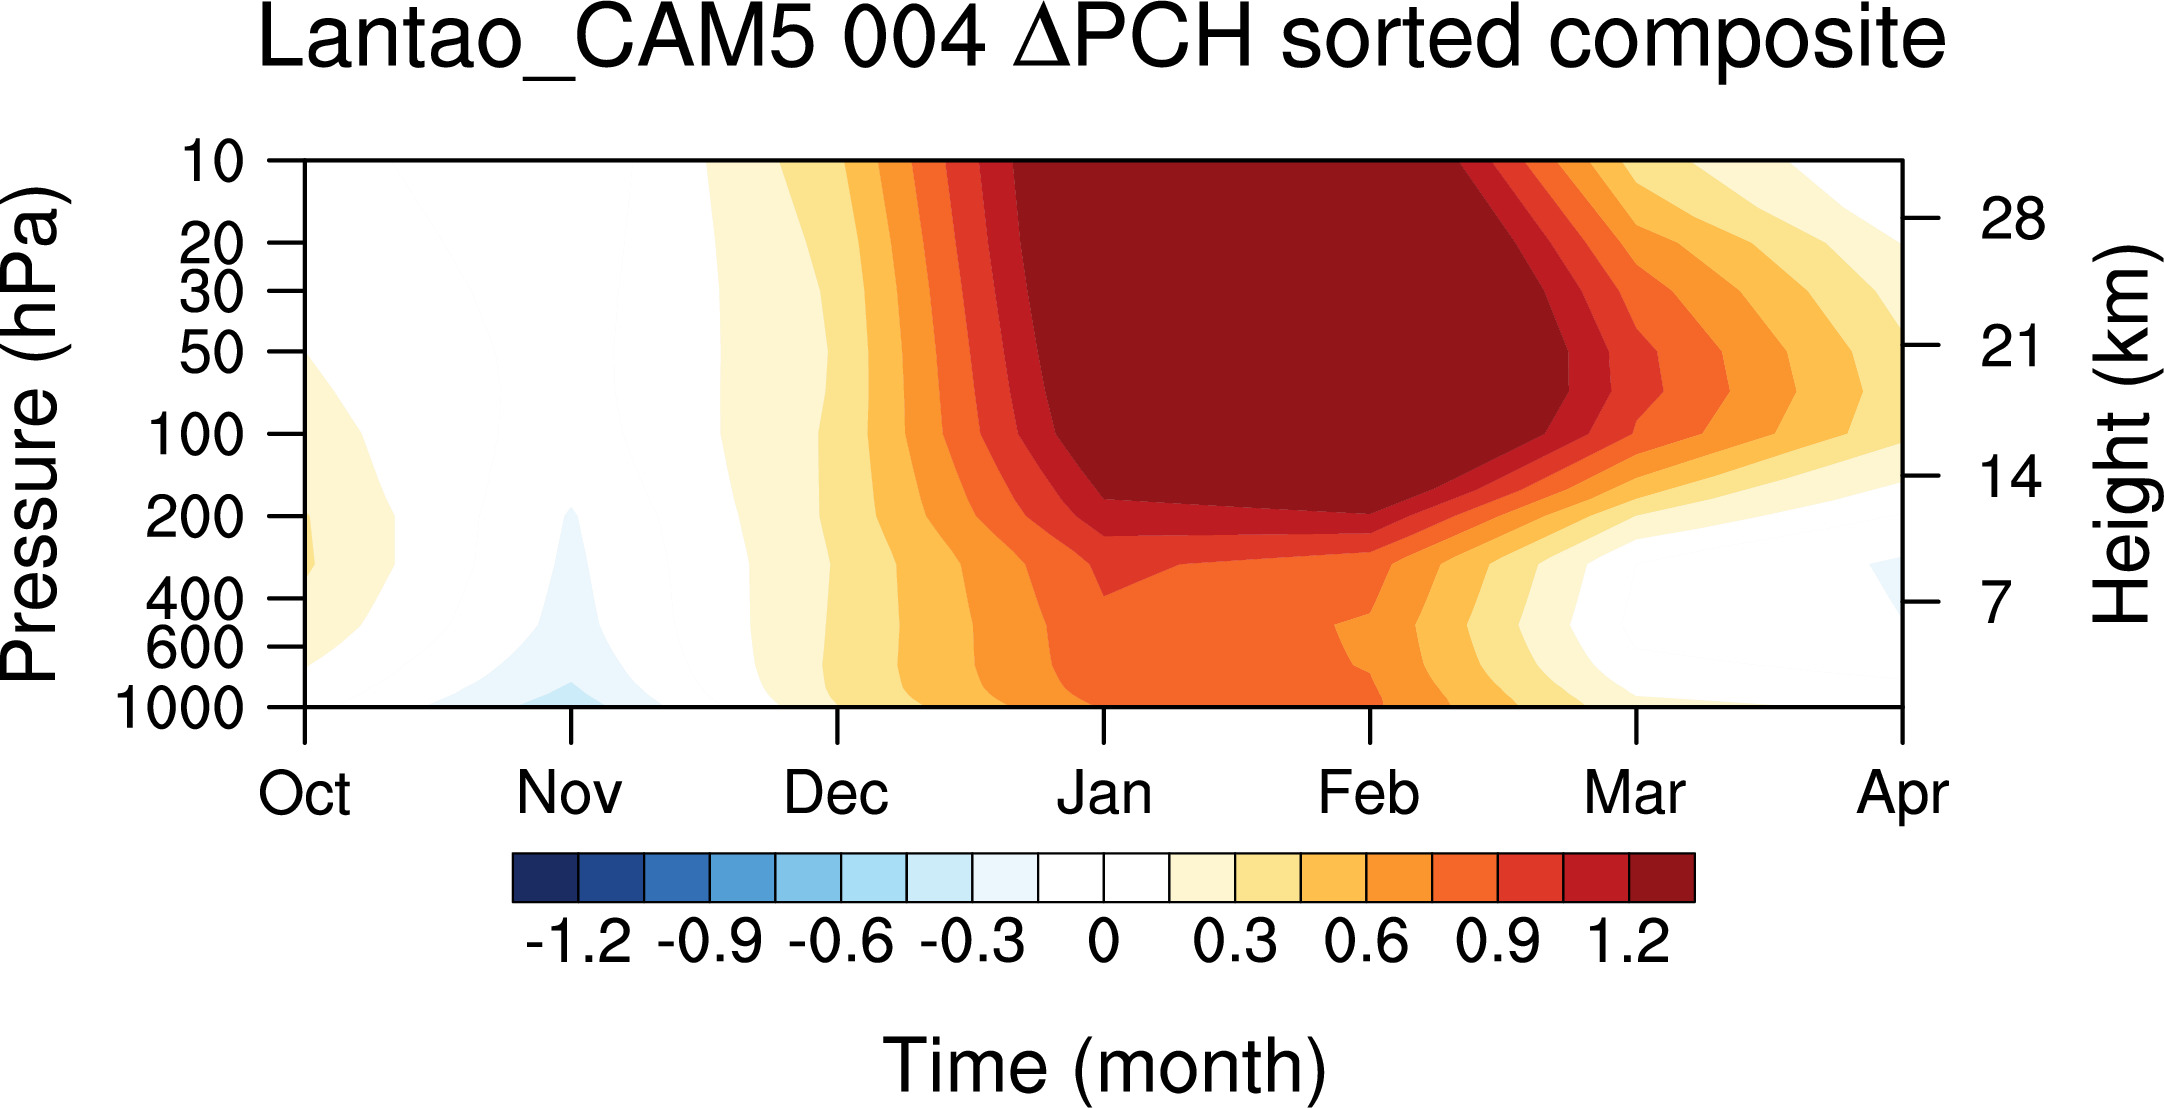
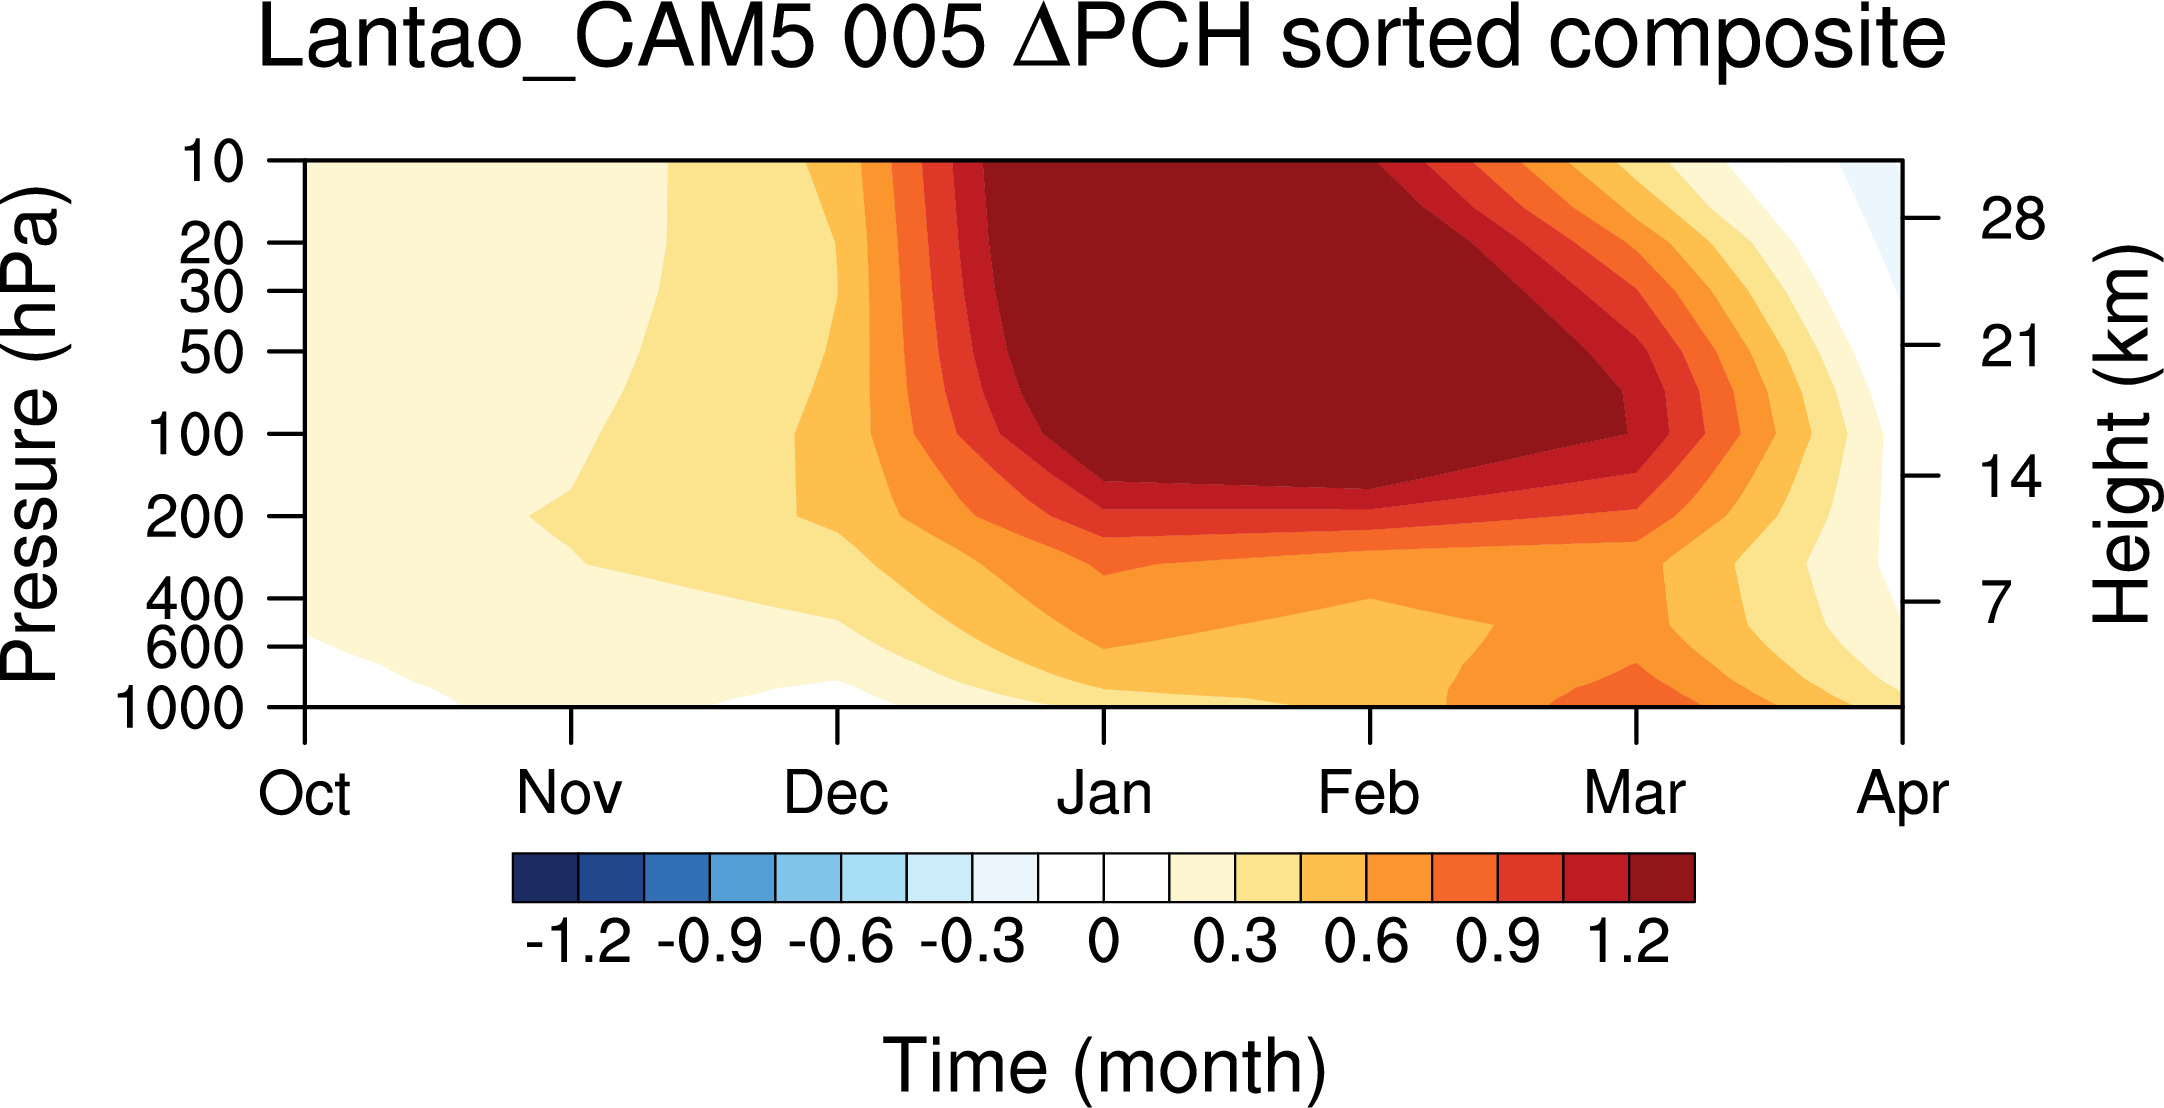
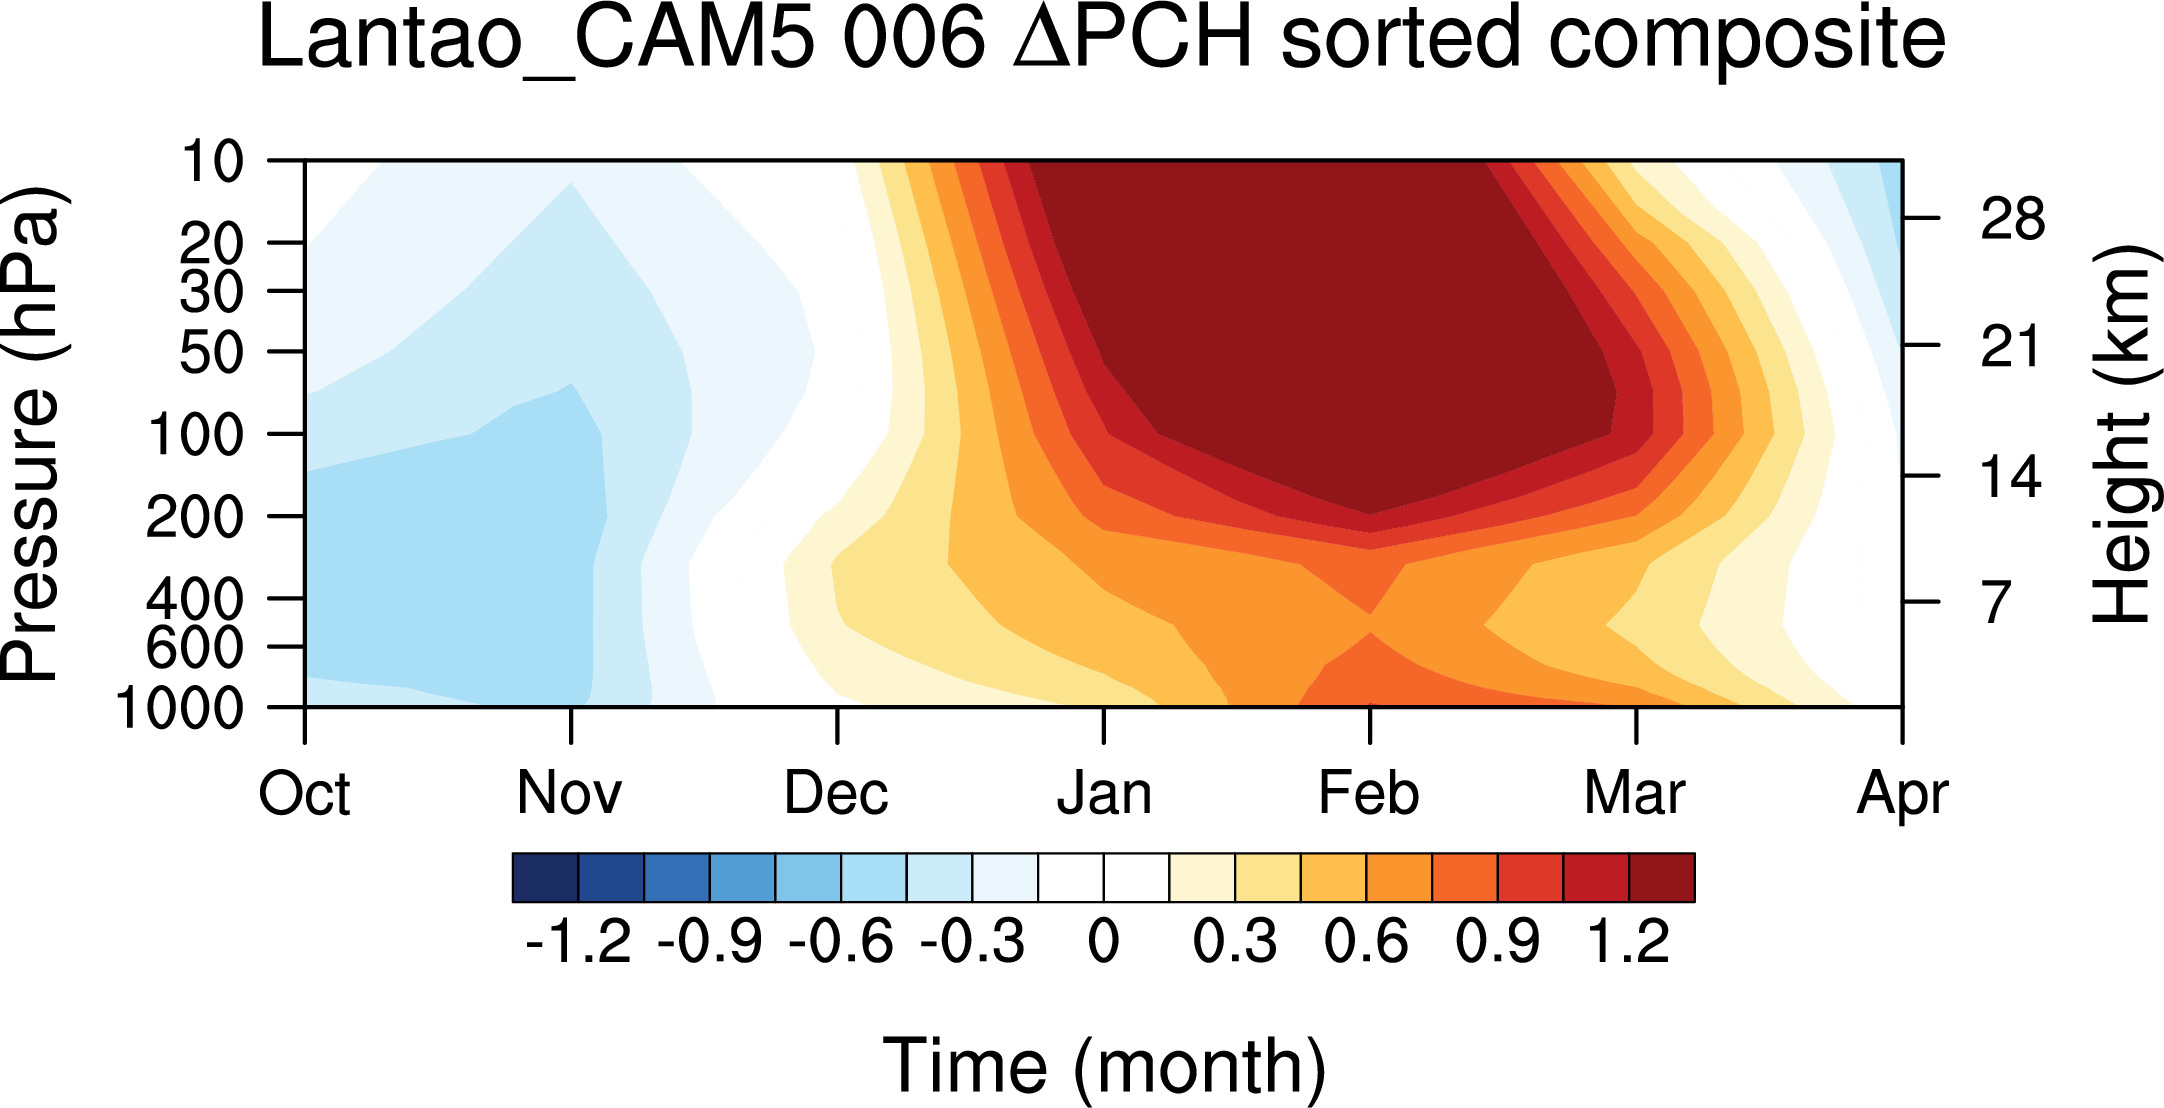
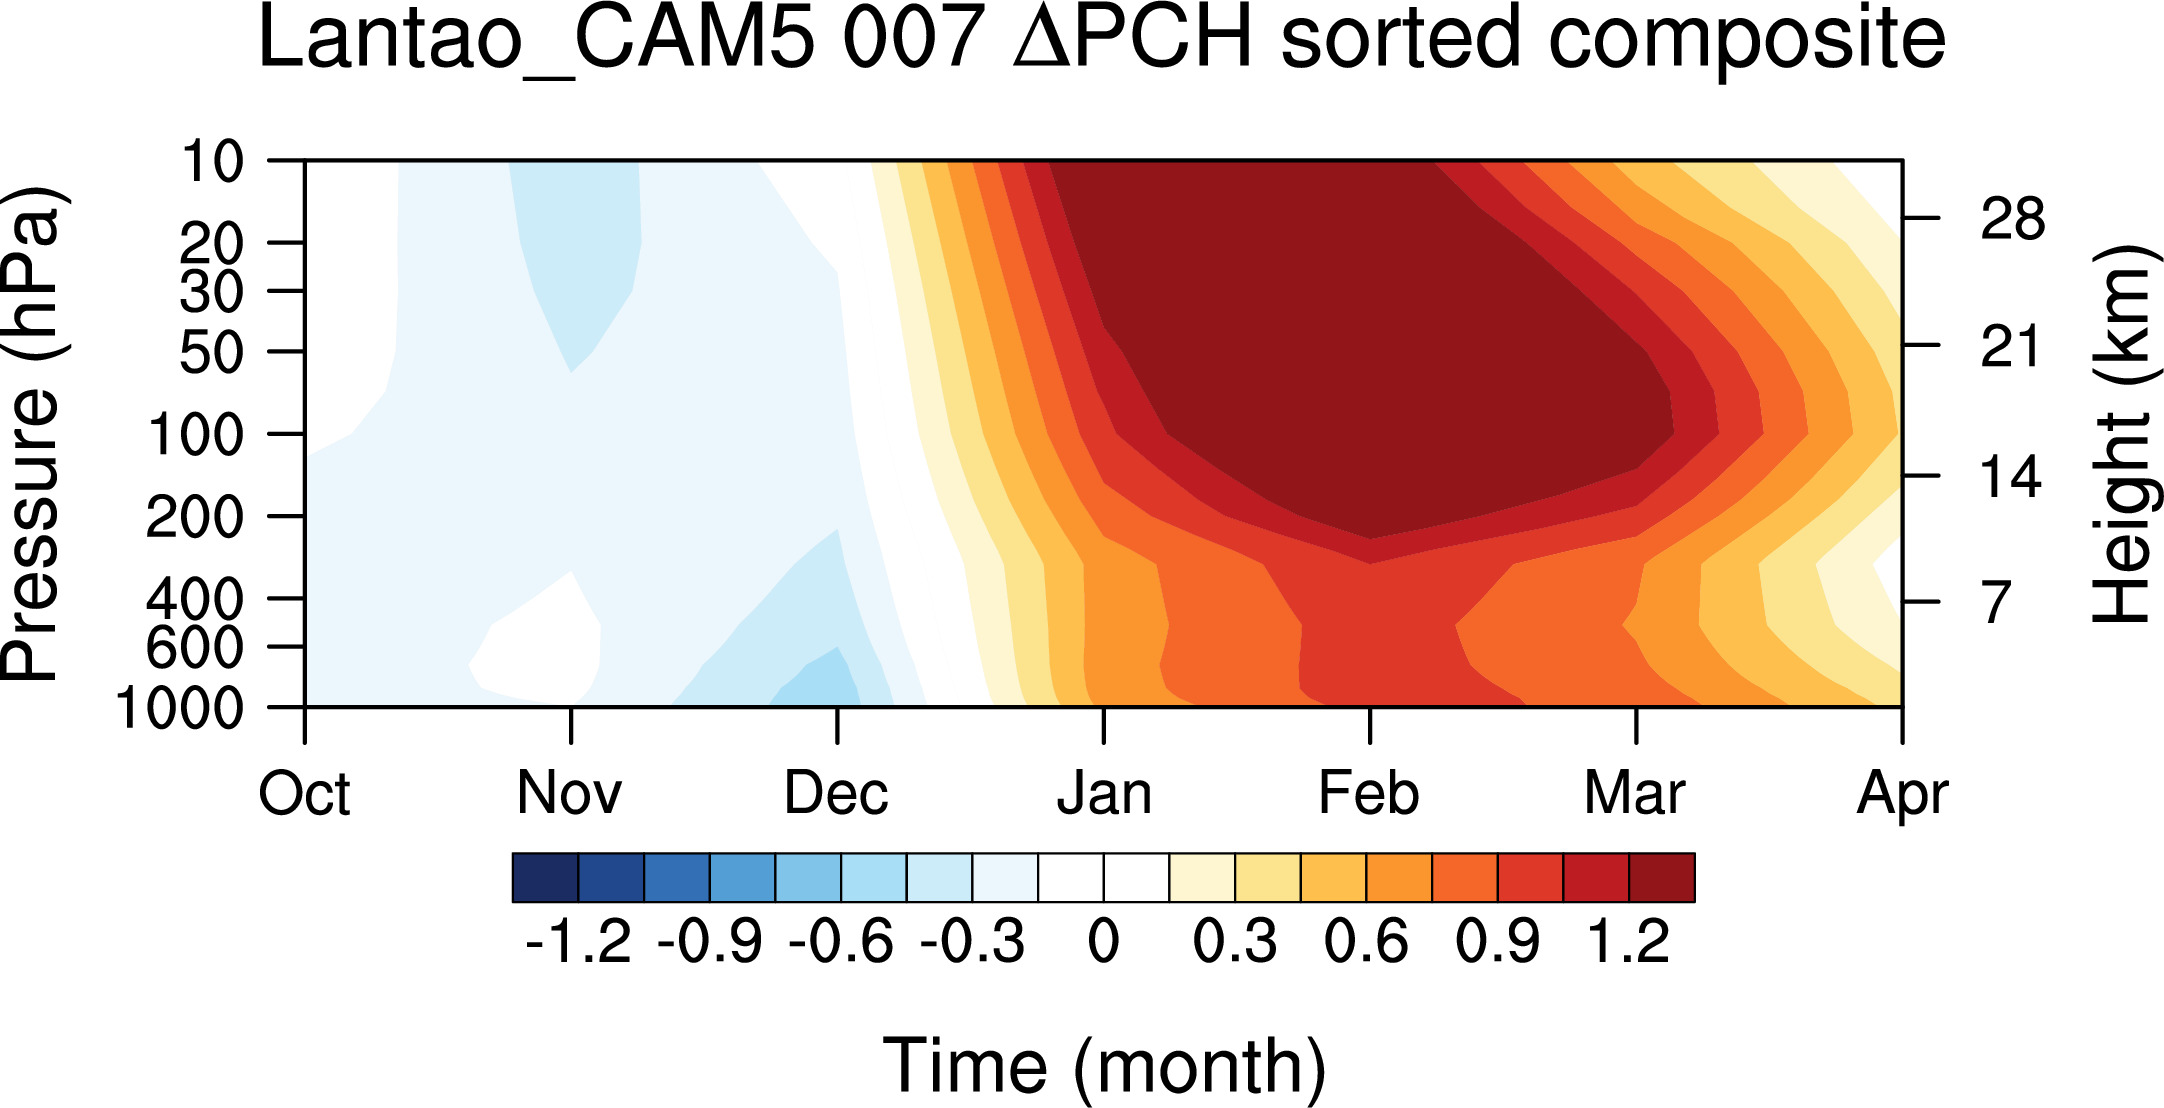
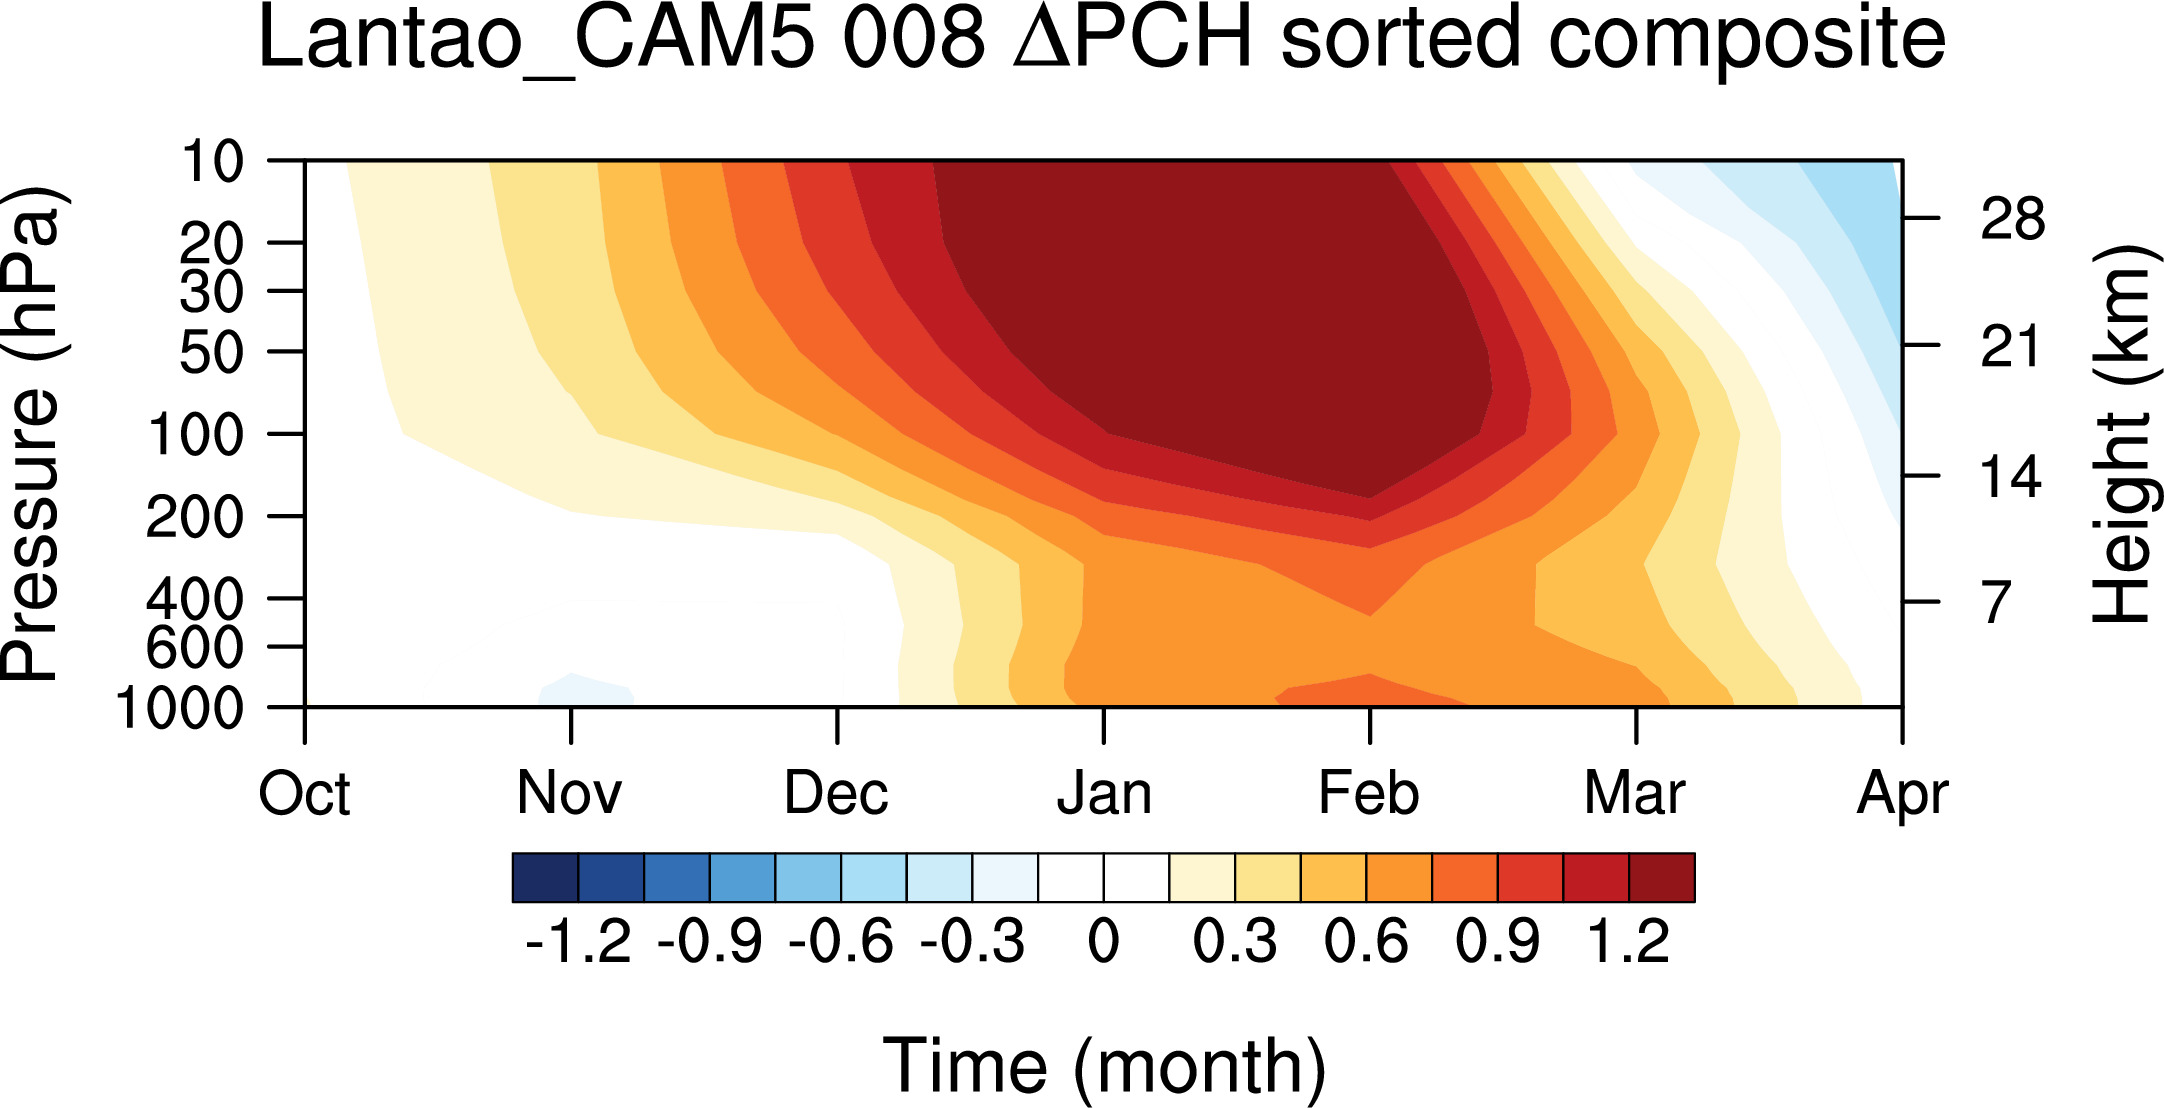
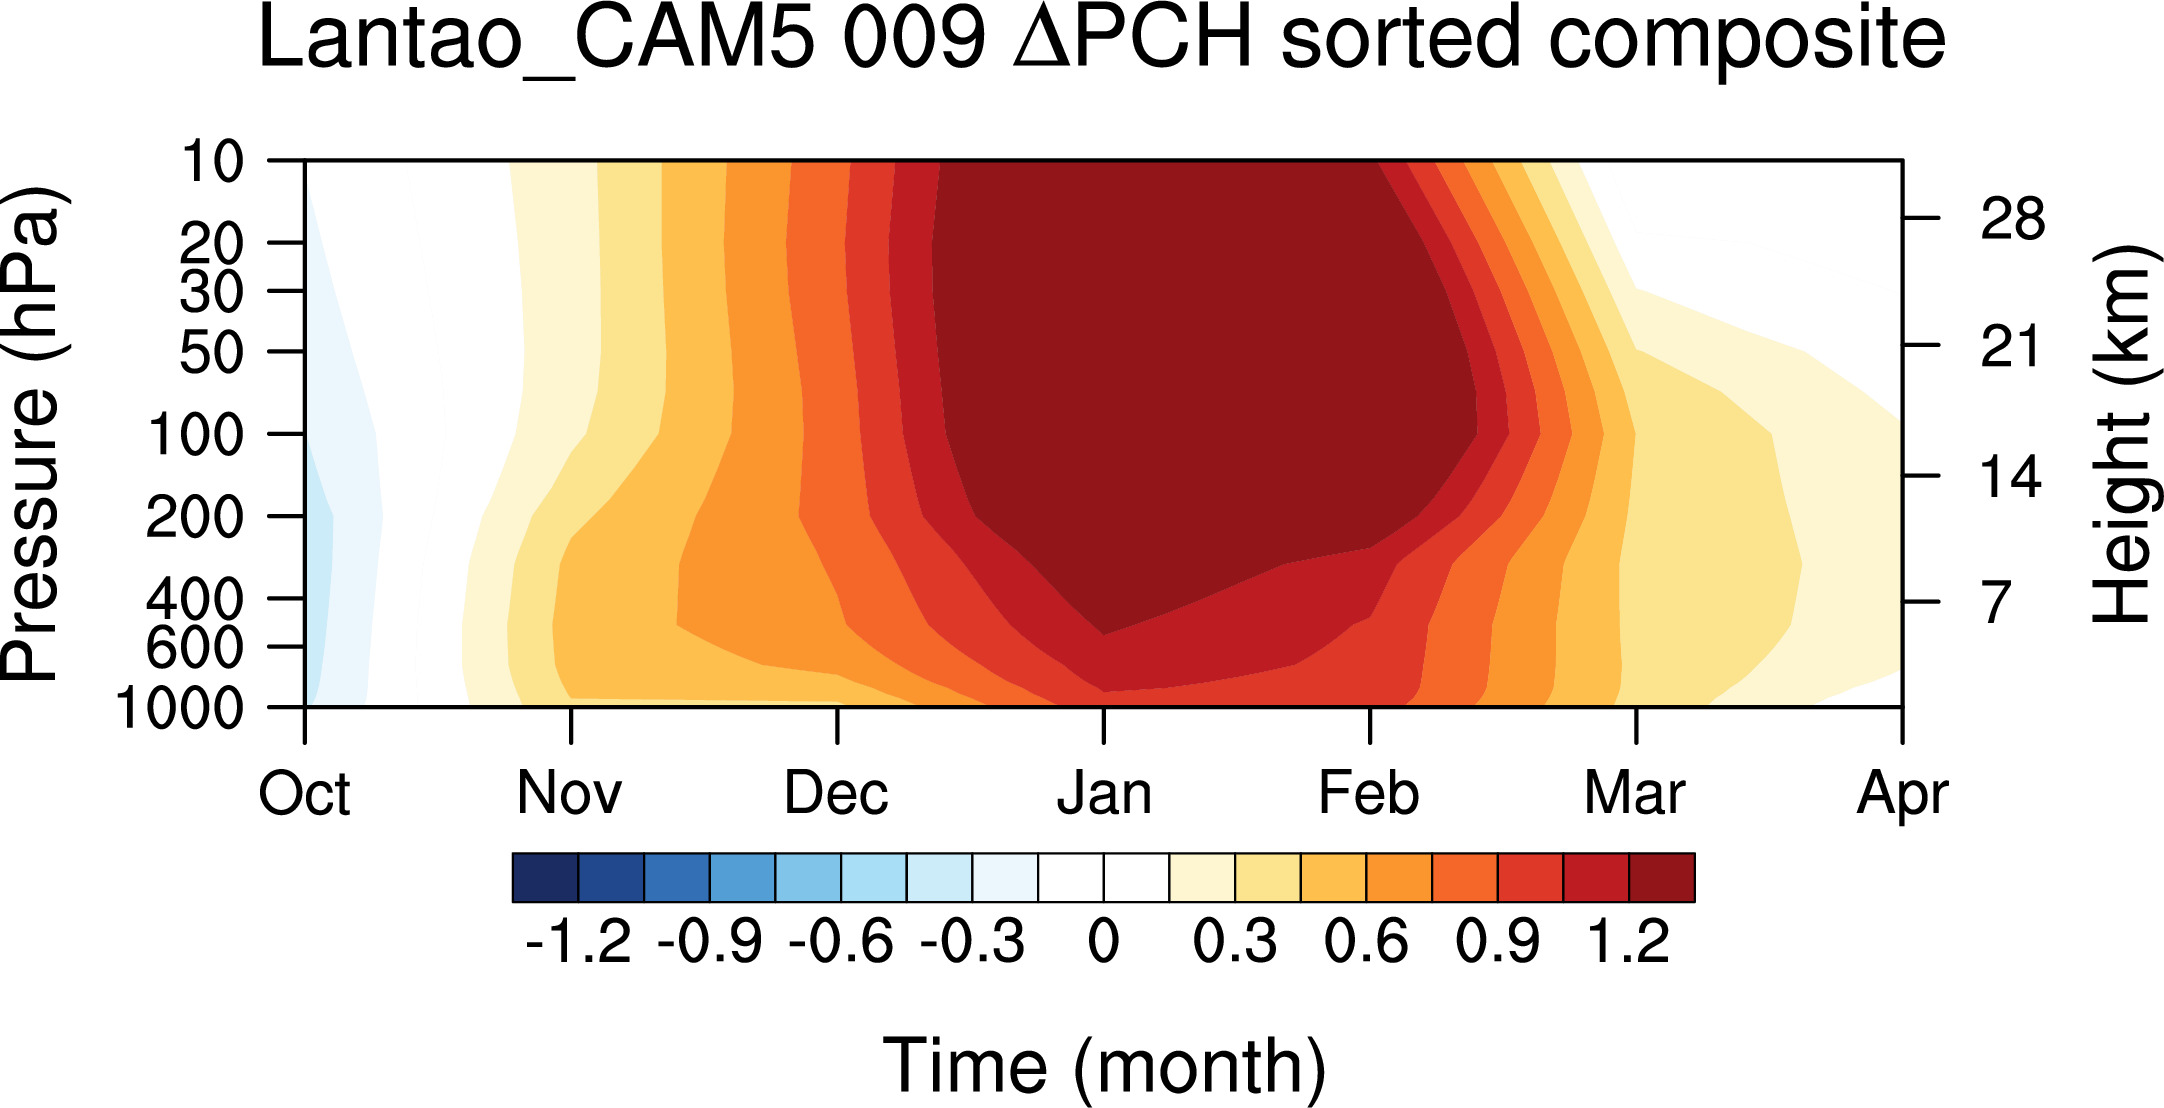
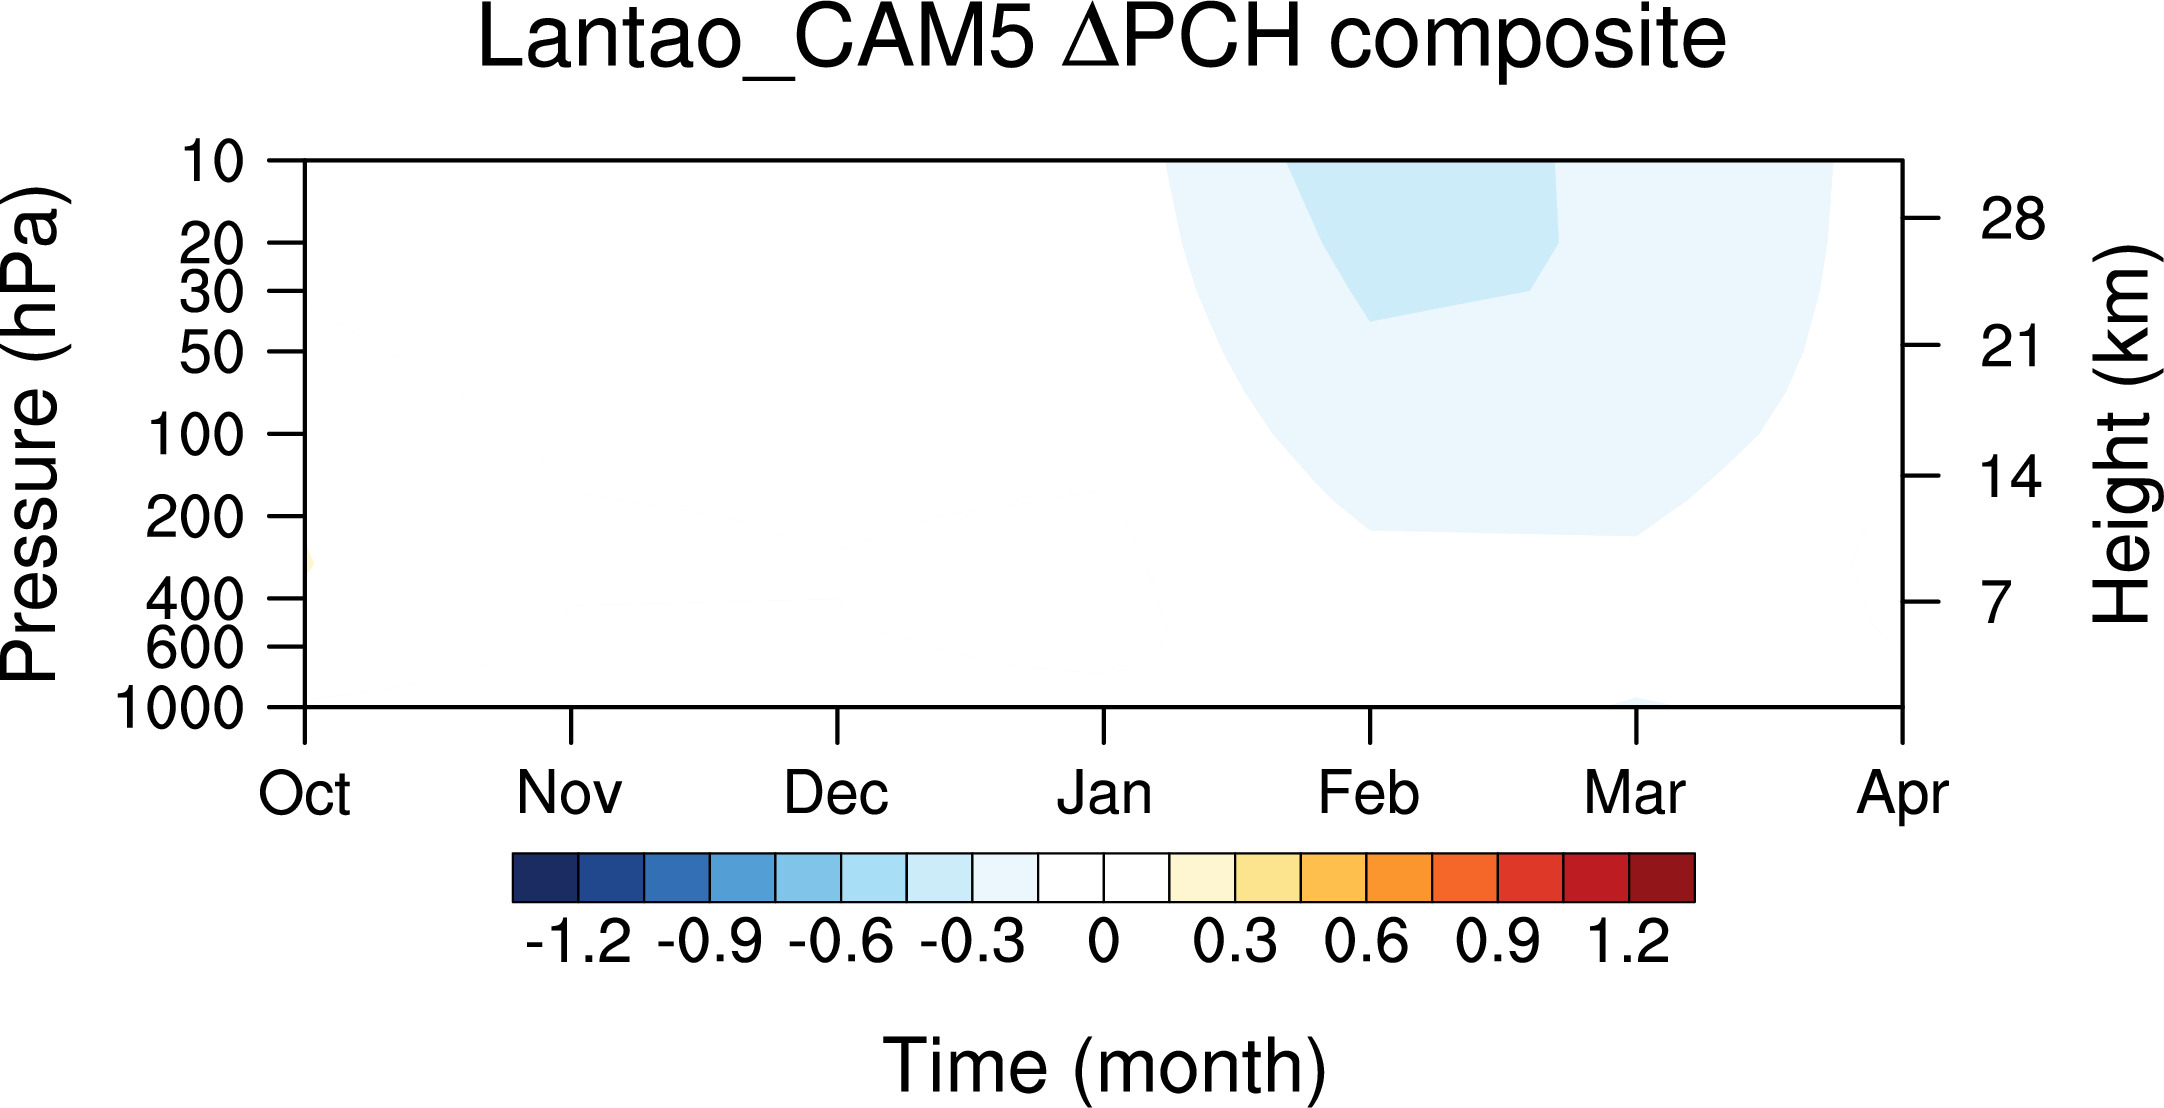
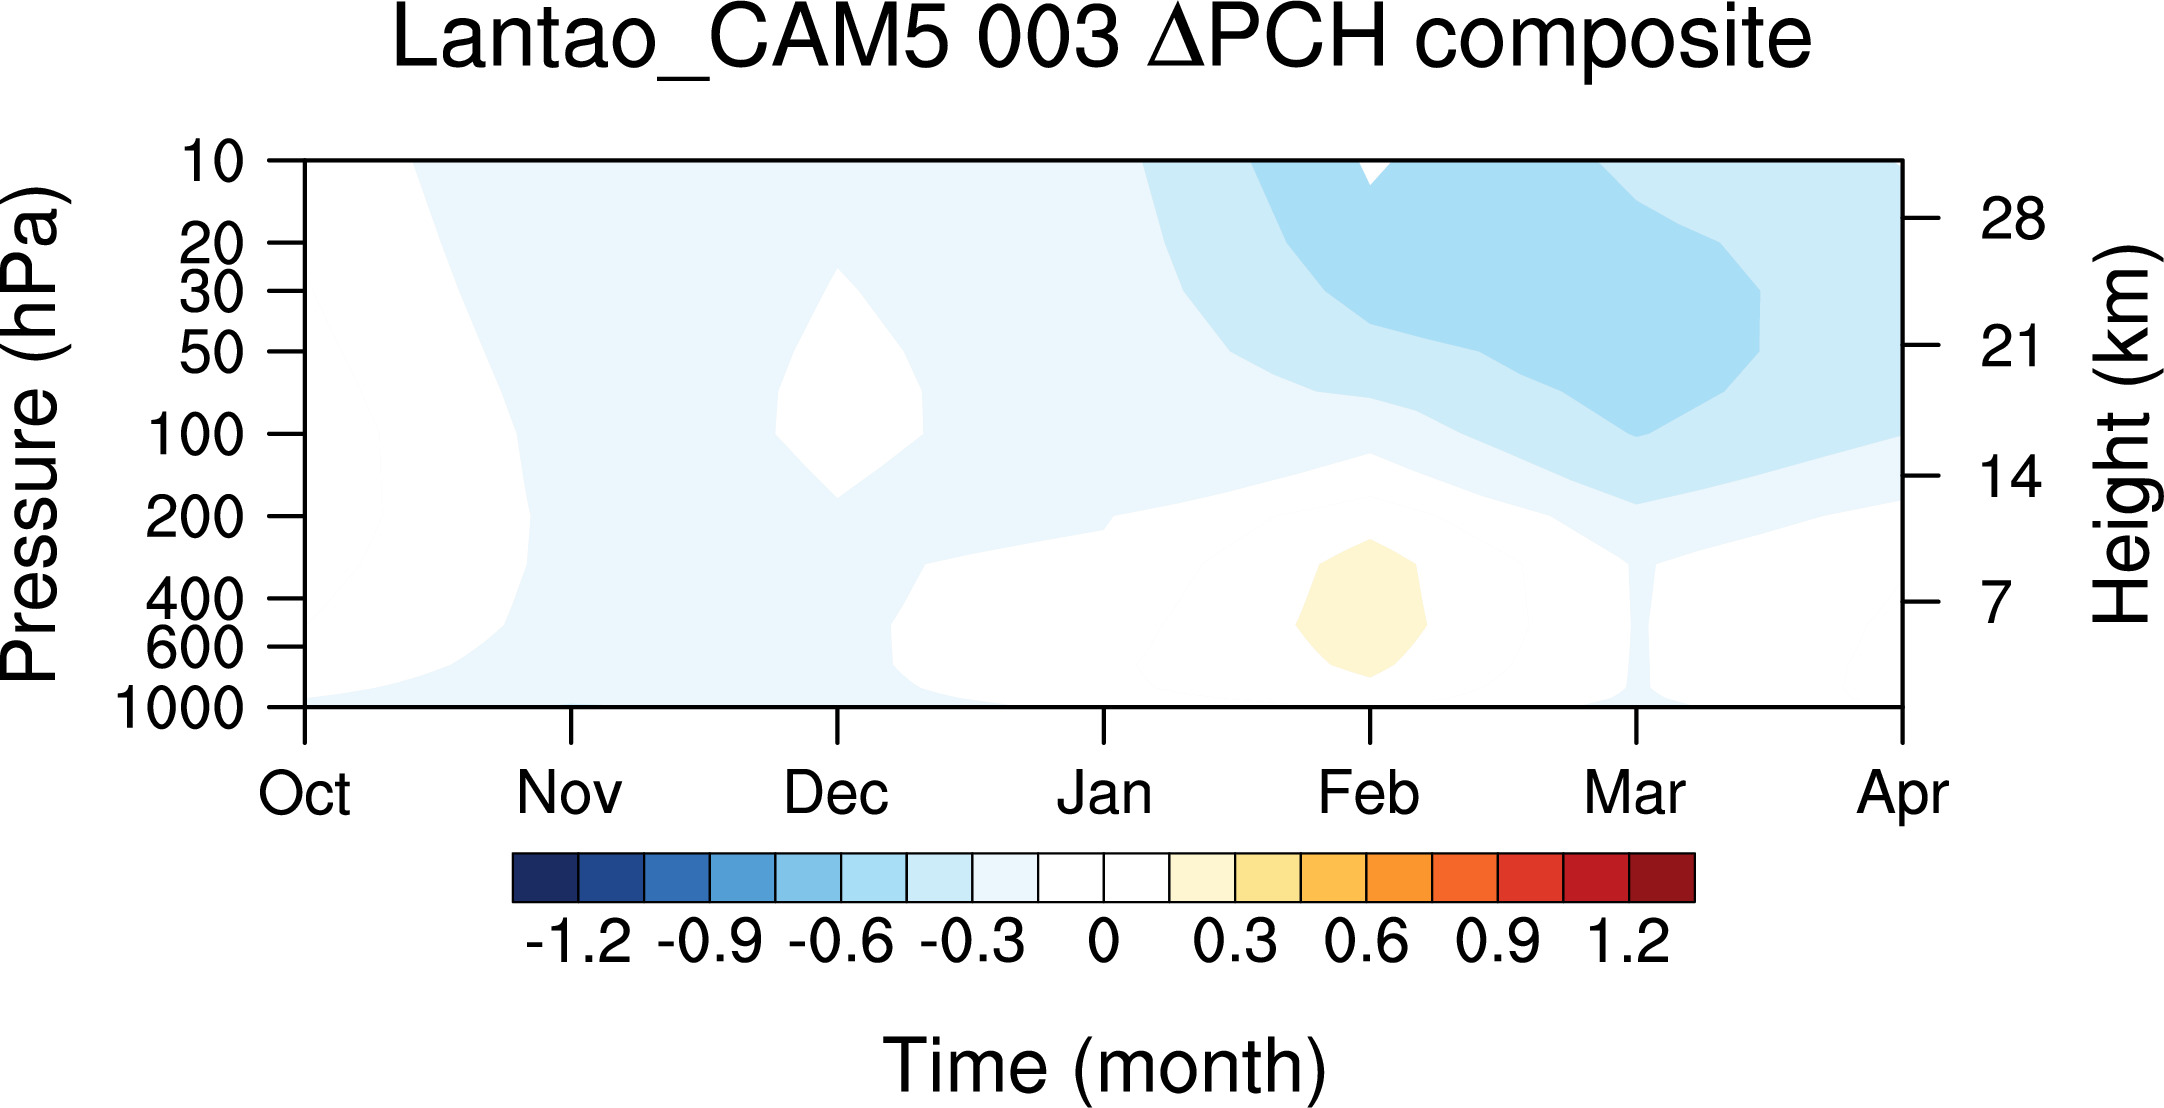
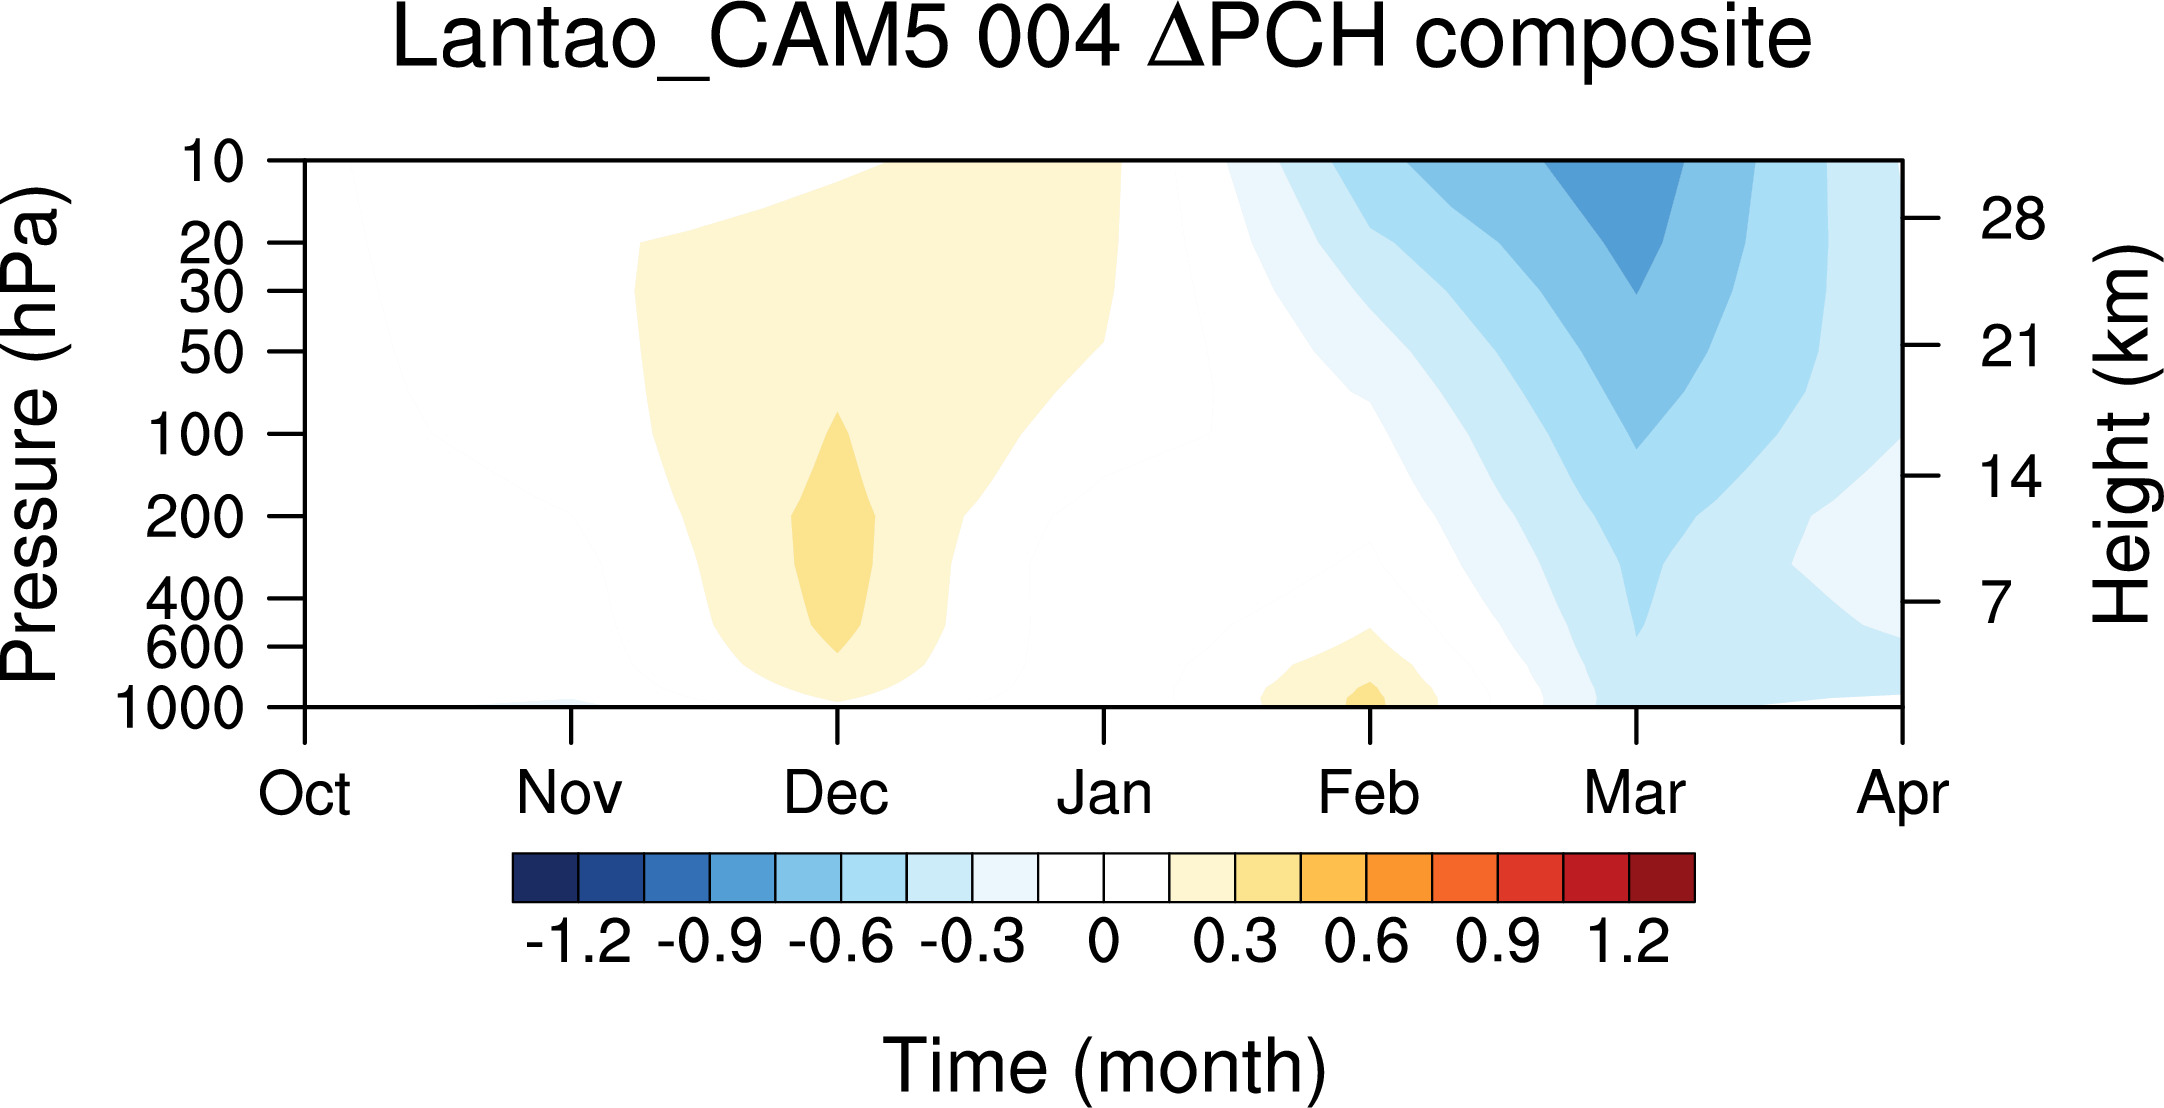
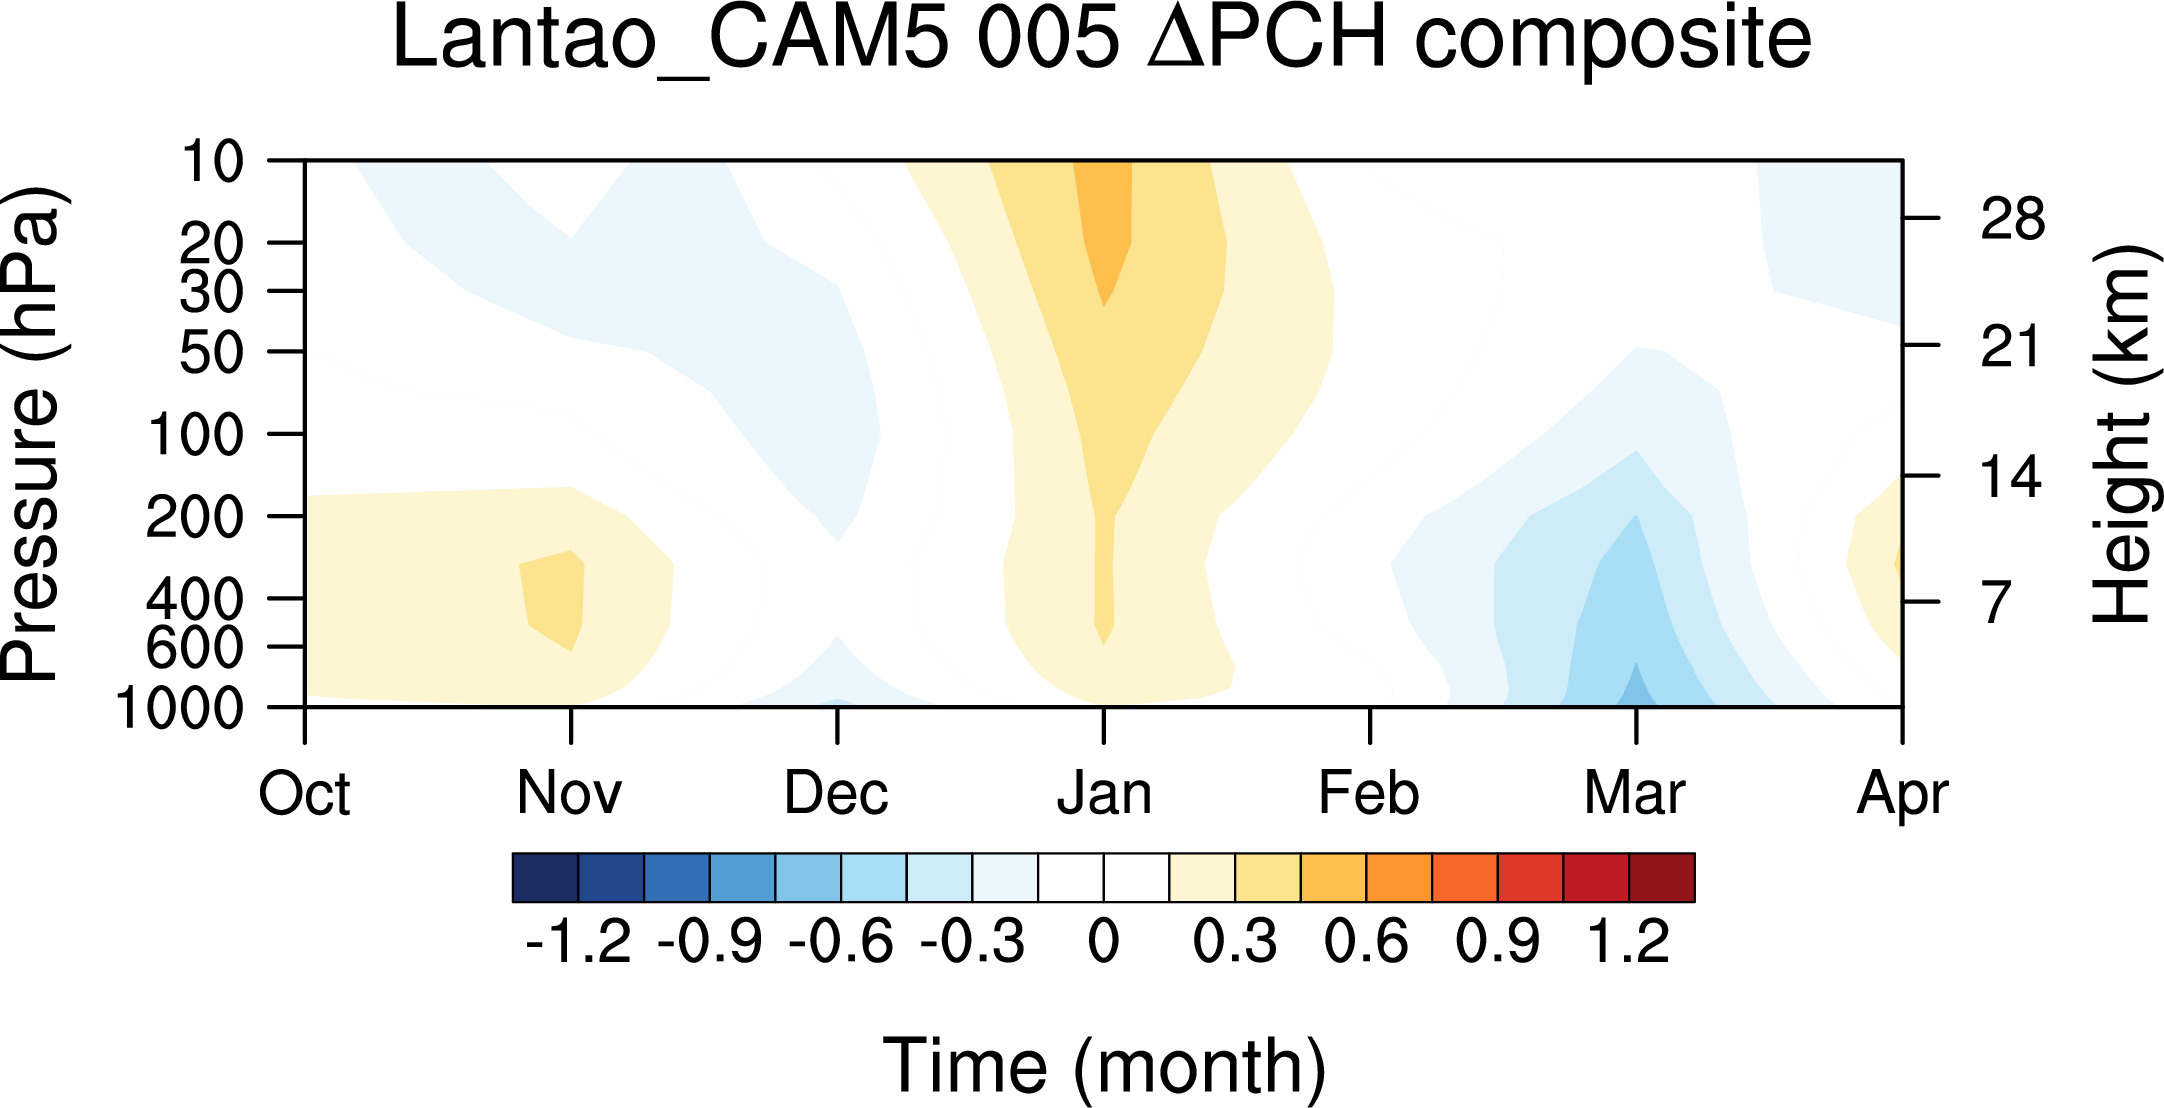
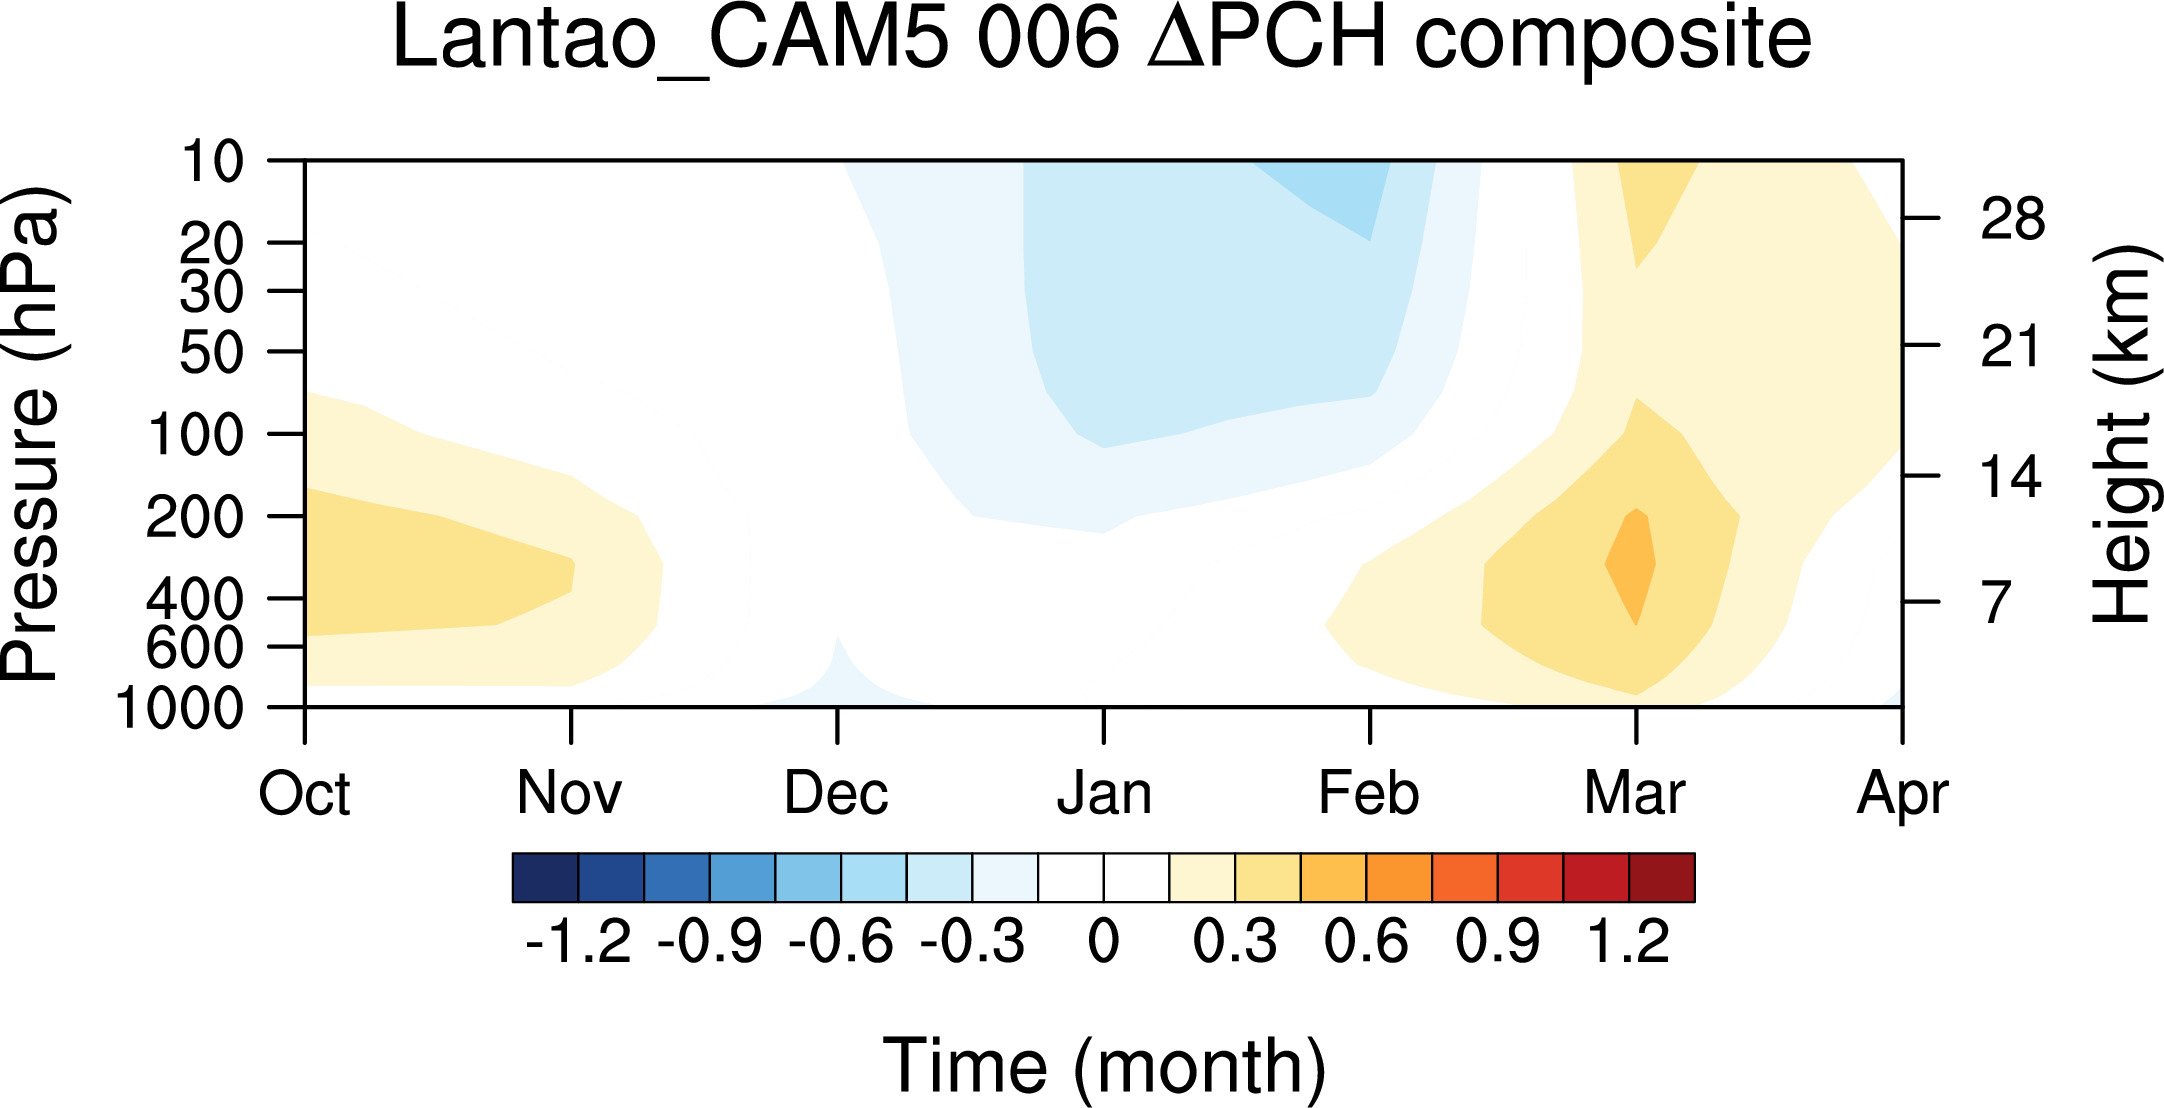
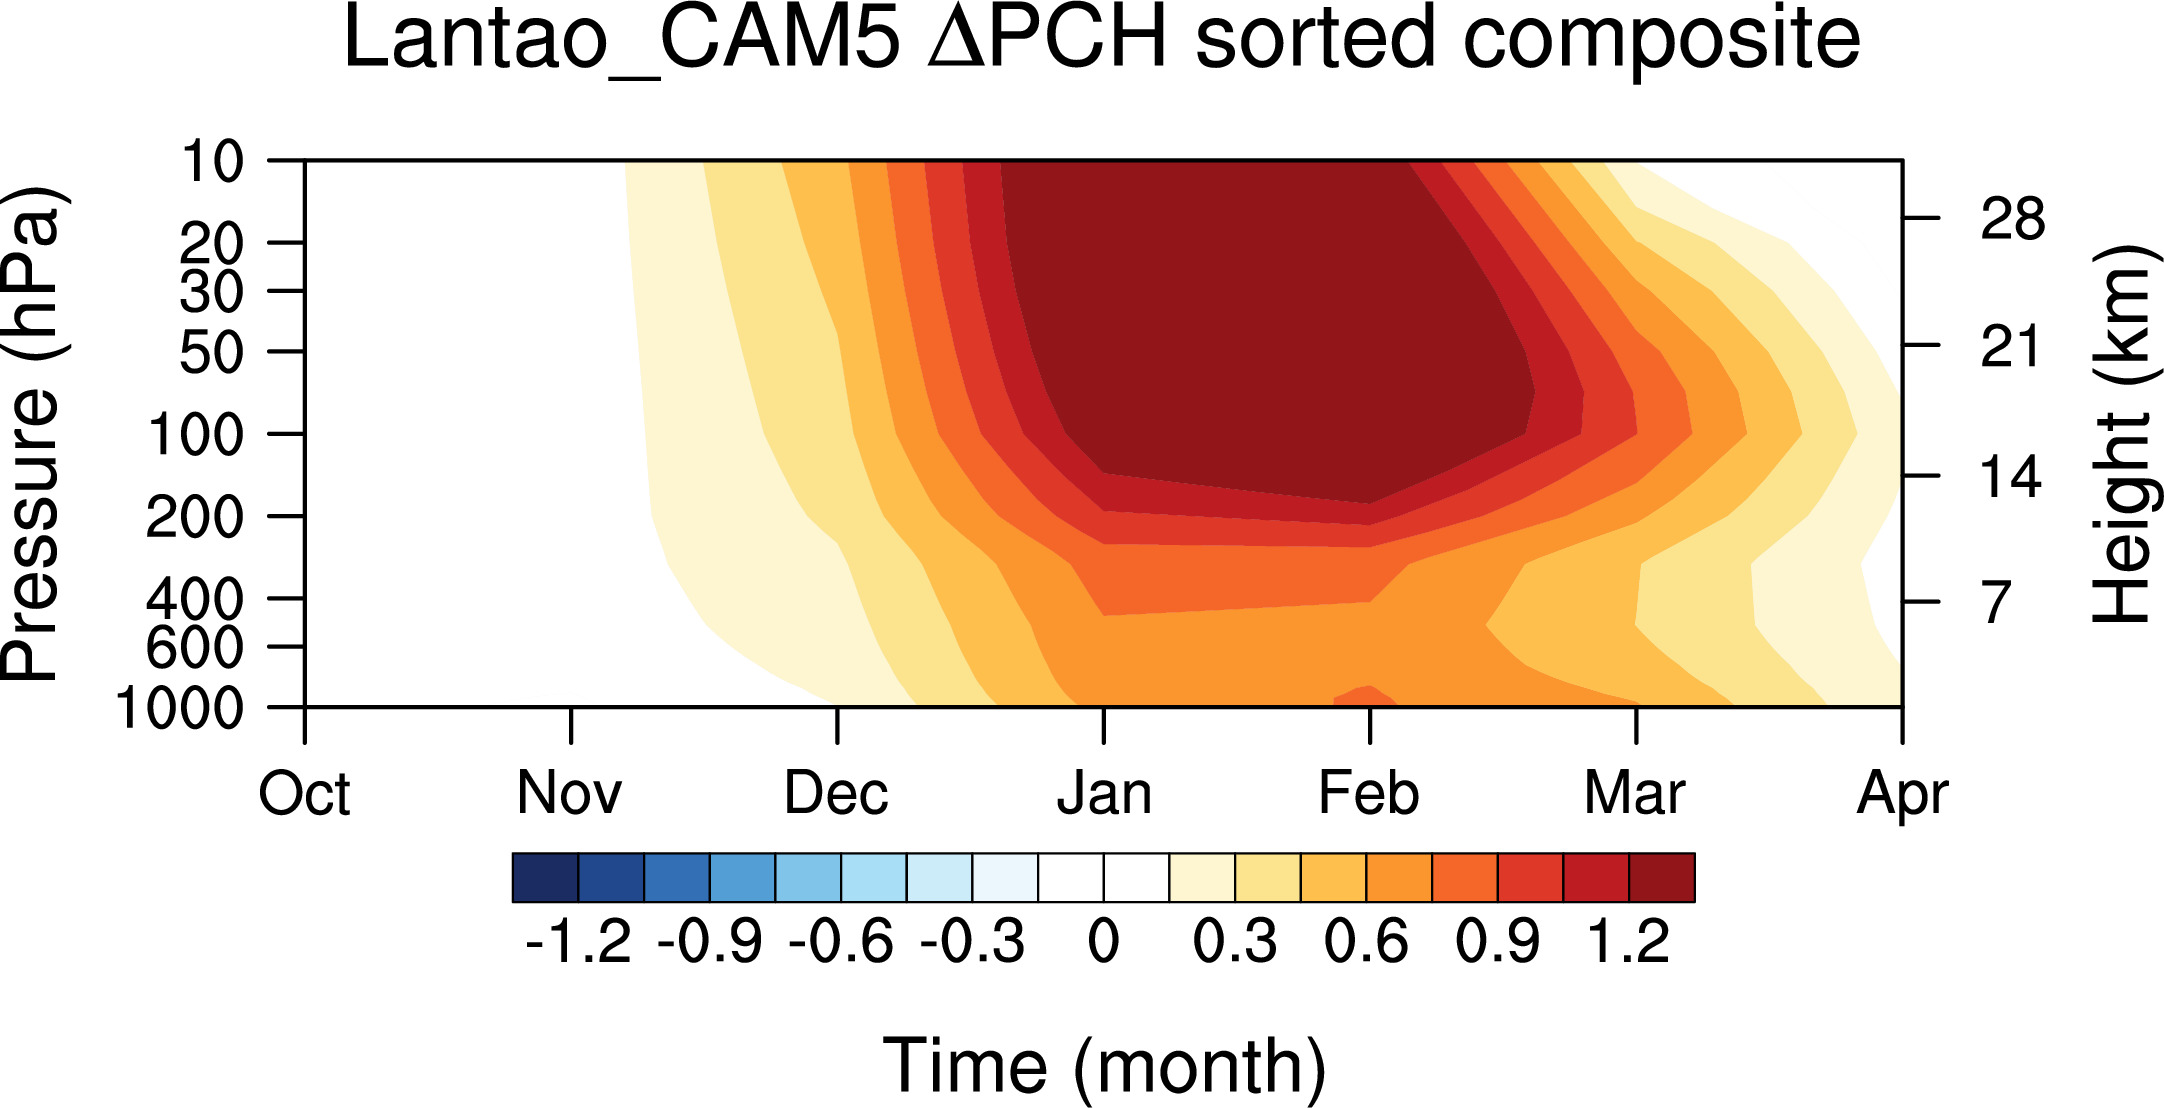
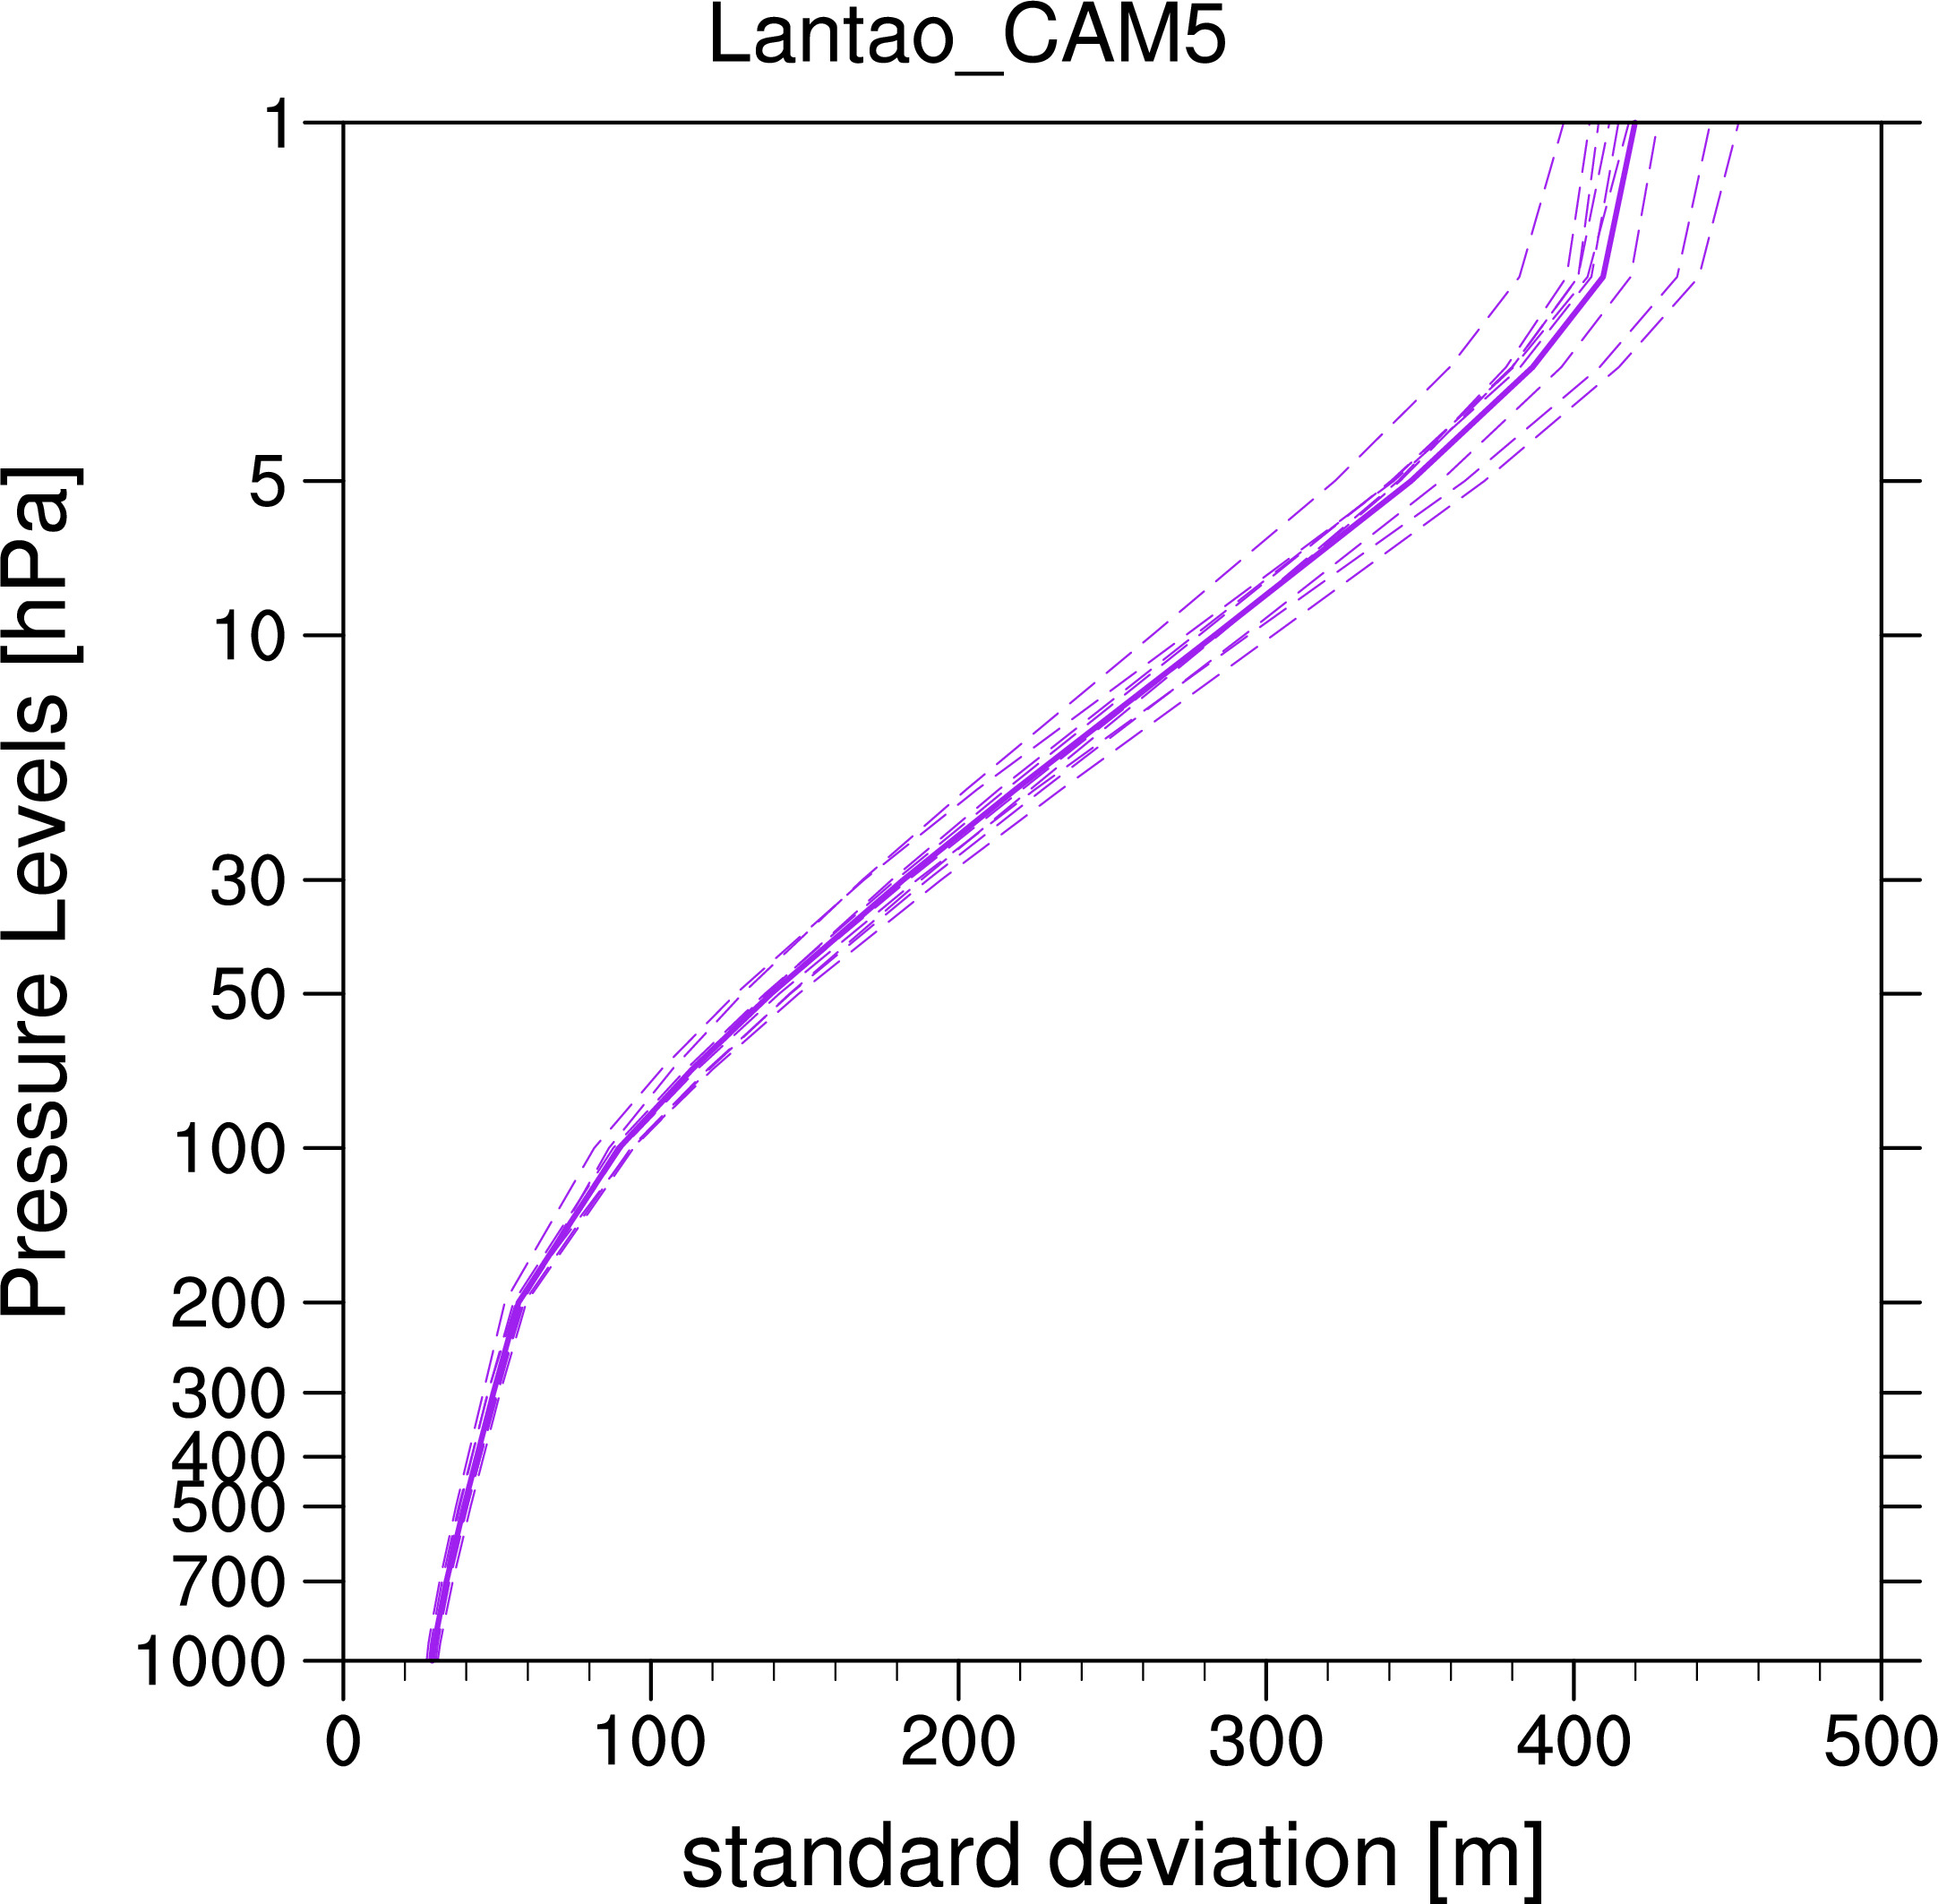 Lantao_CAM5
Ensemble mean:
Individual Runs:
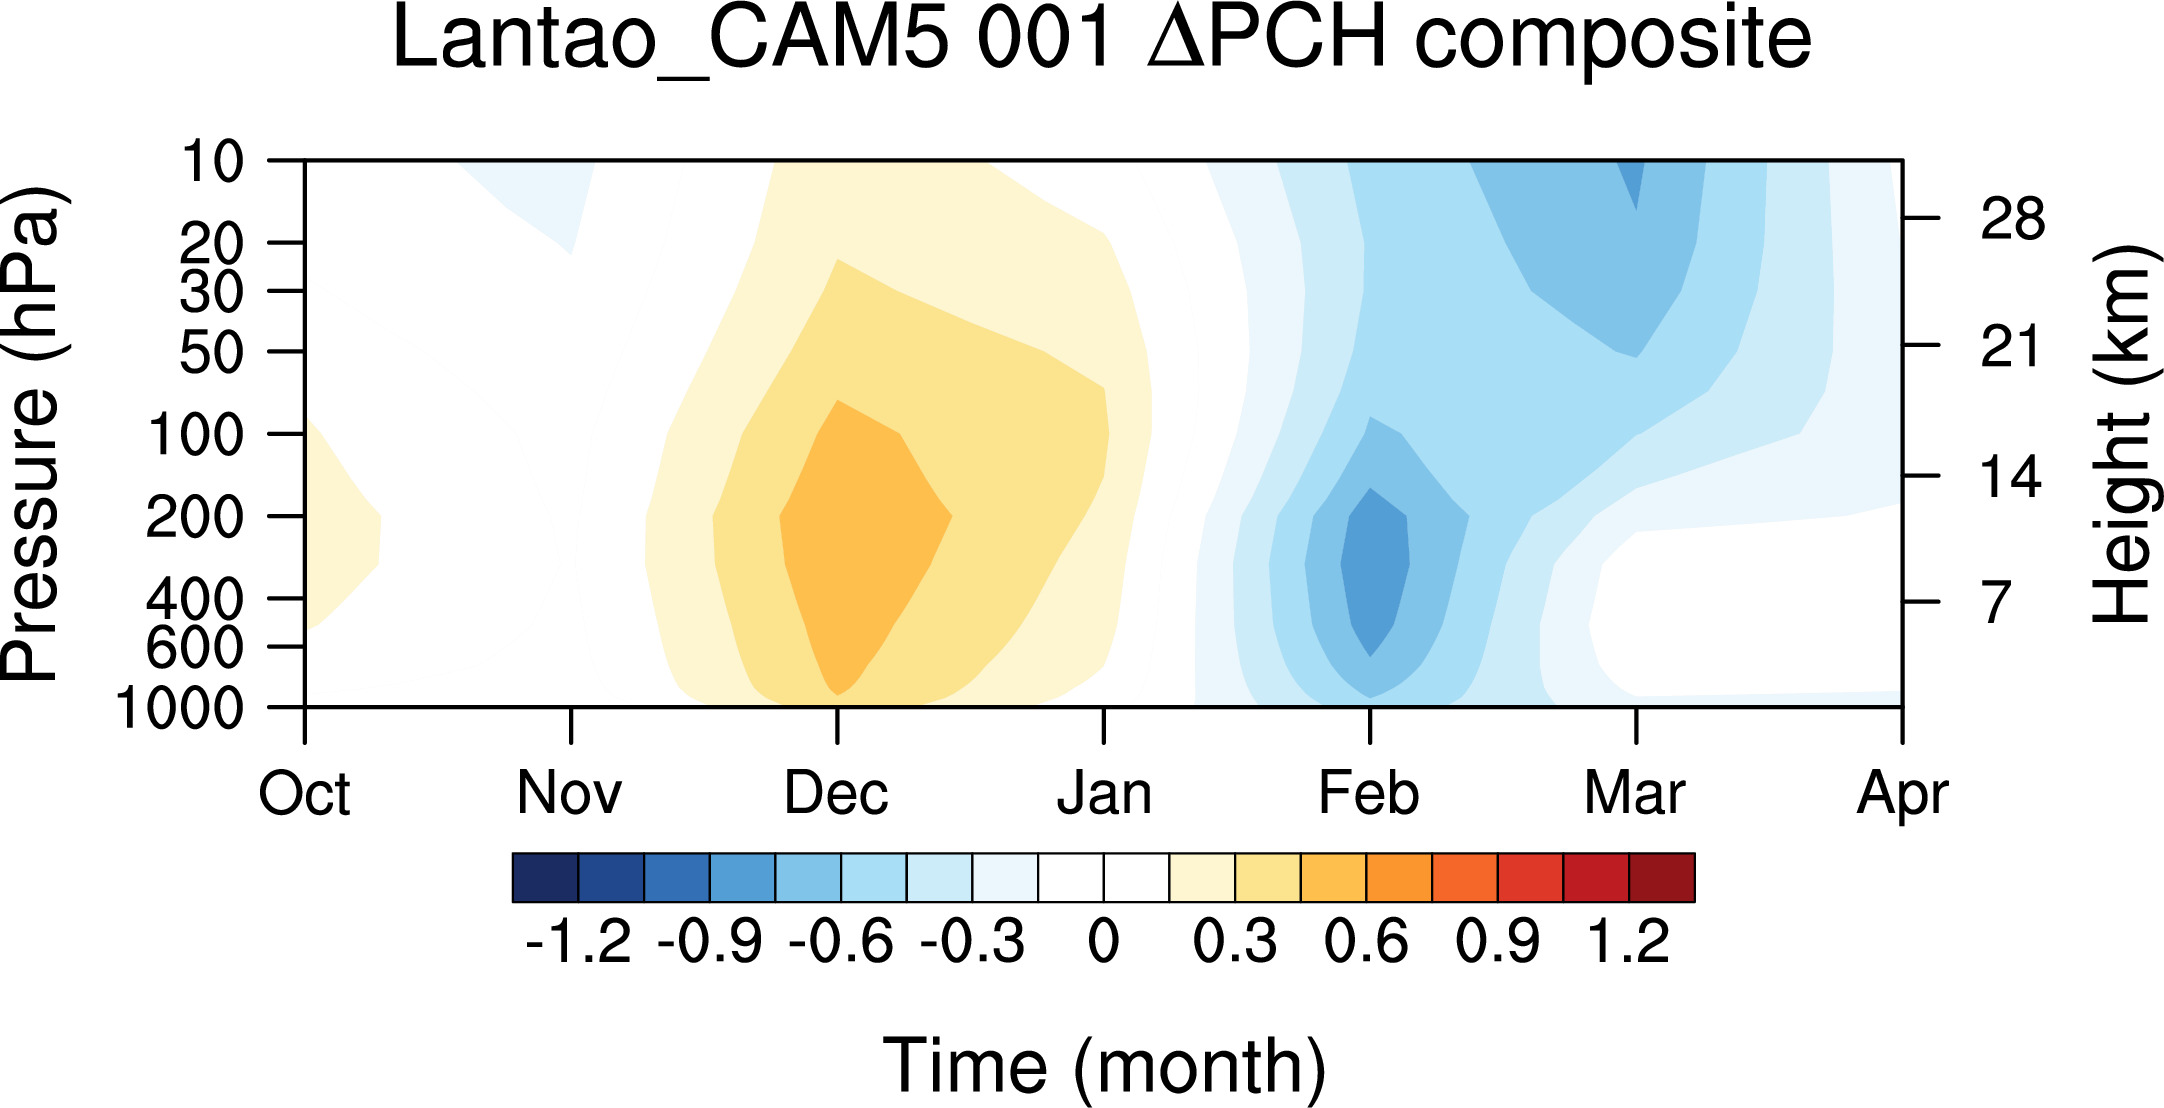
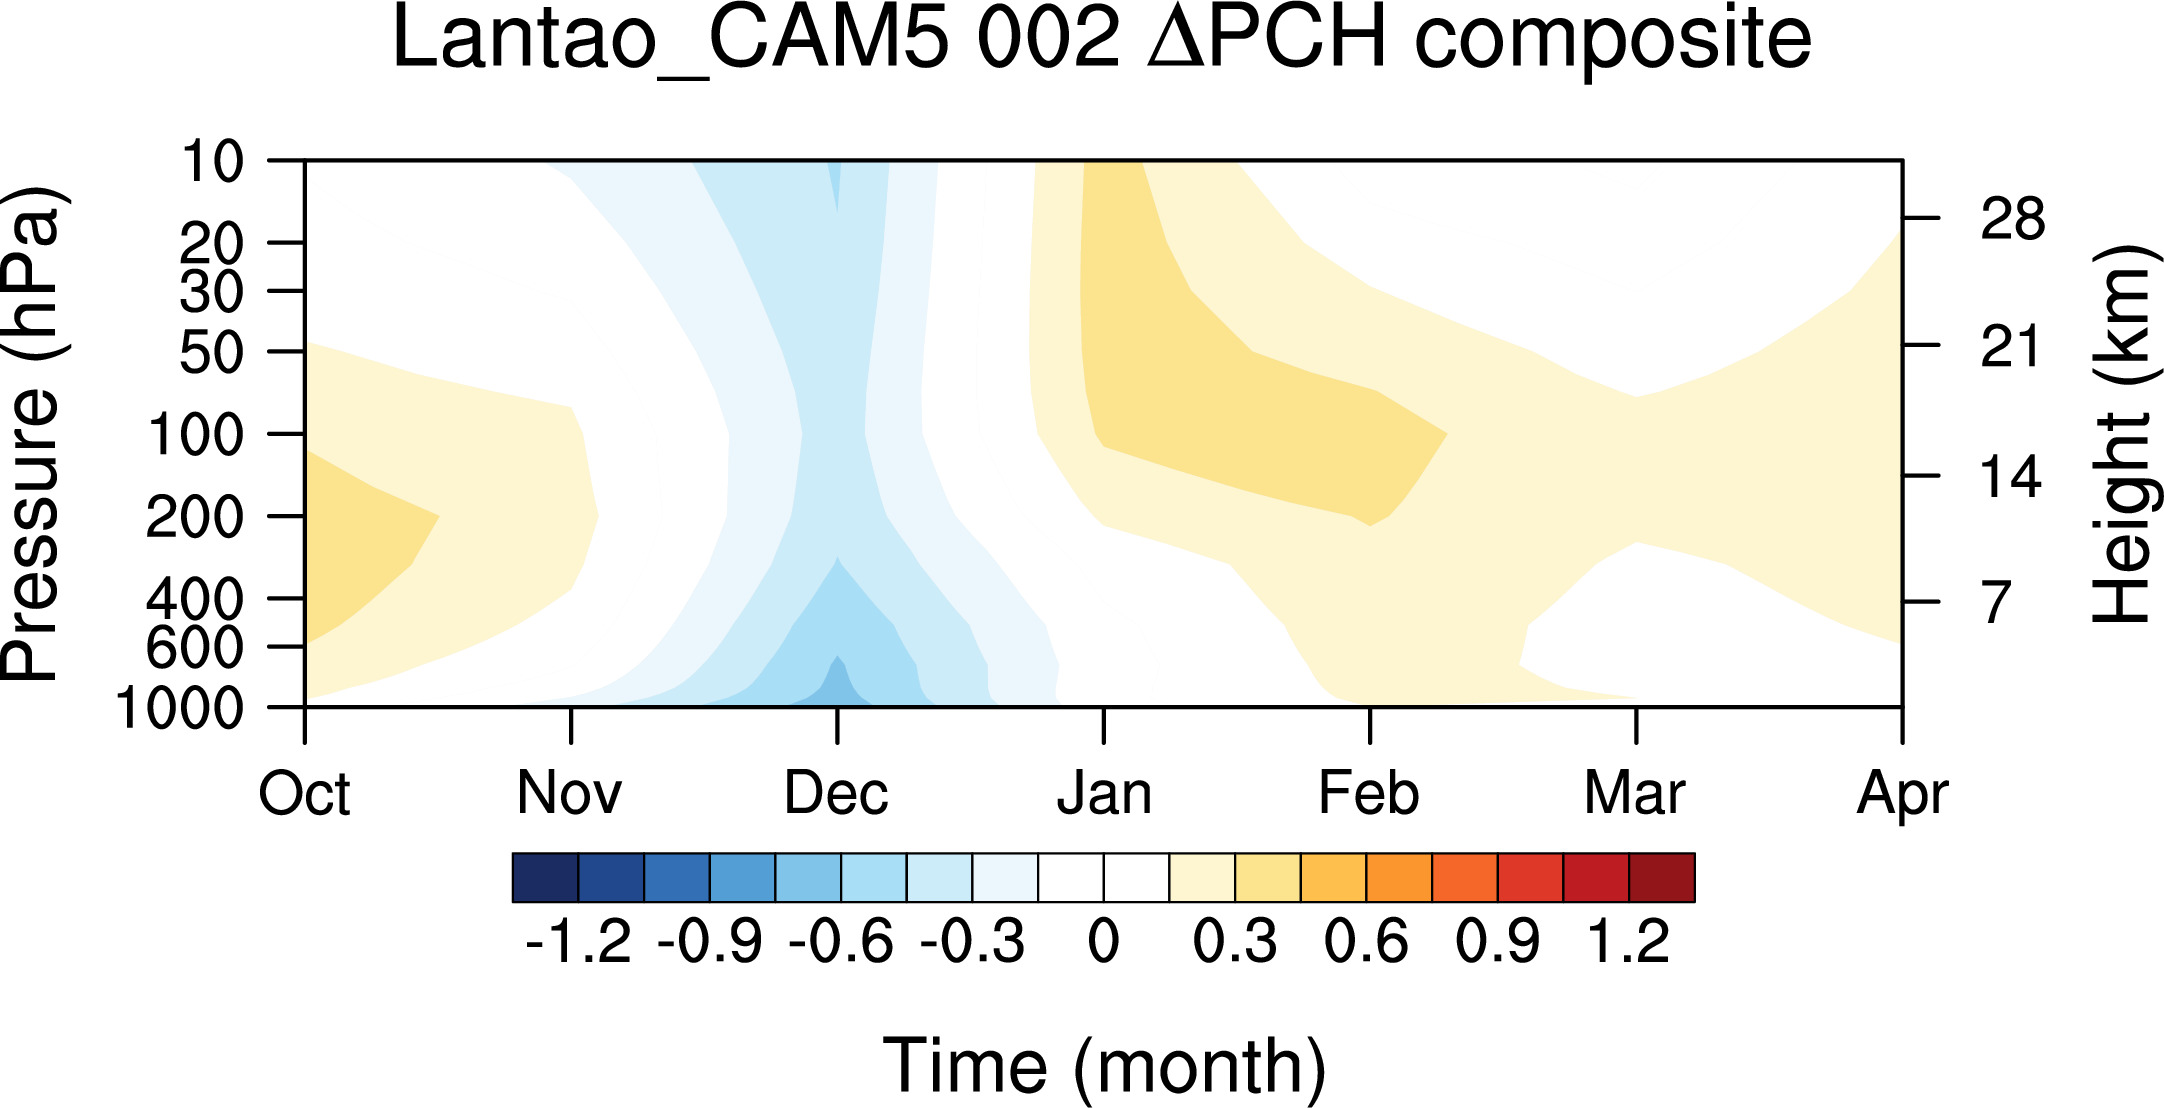
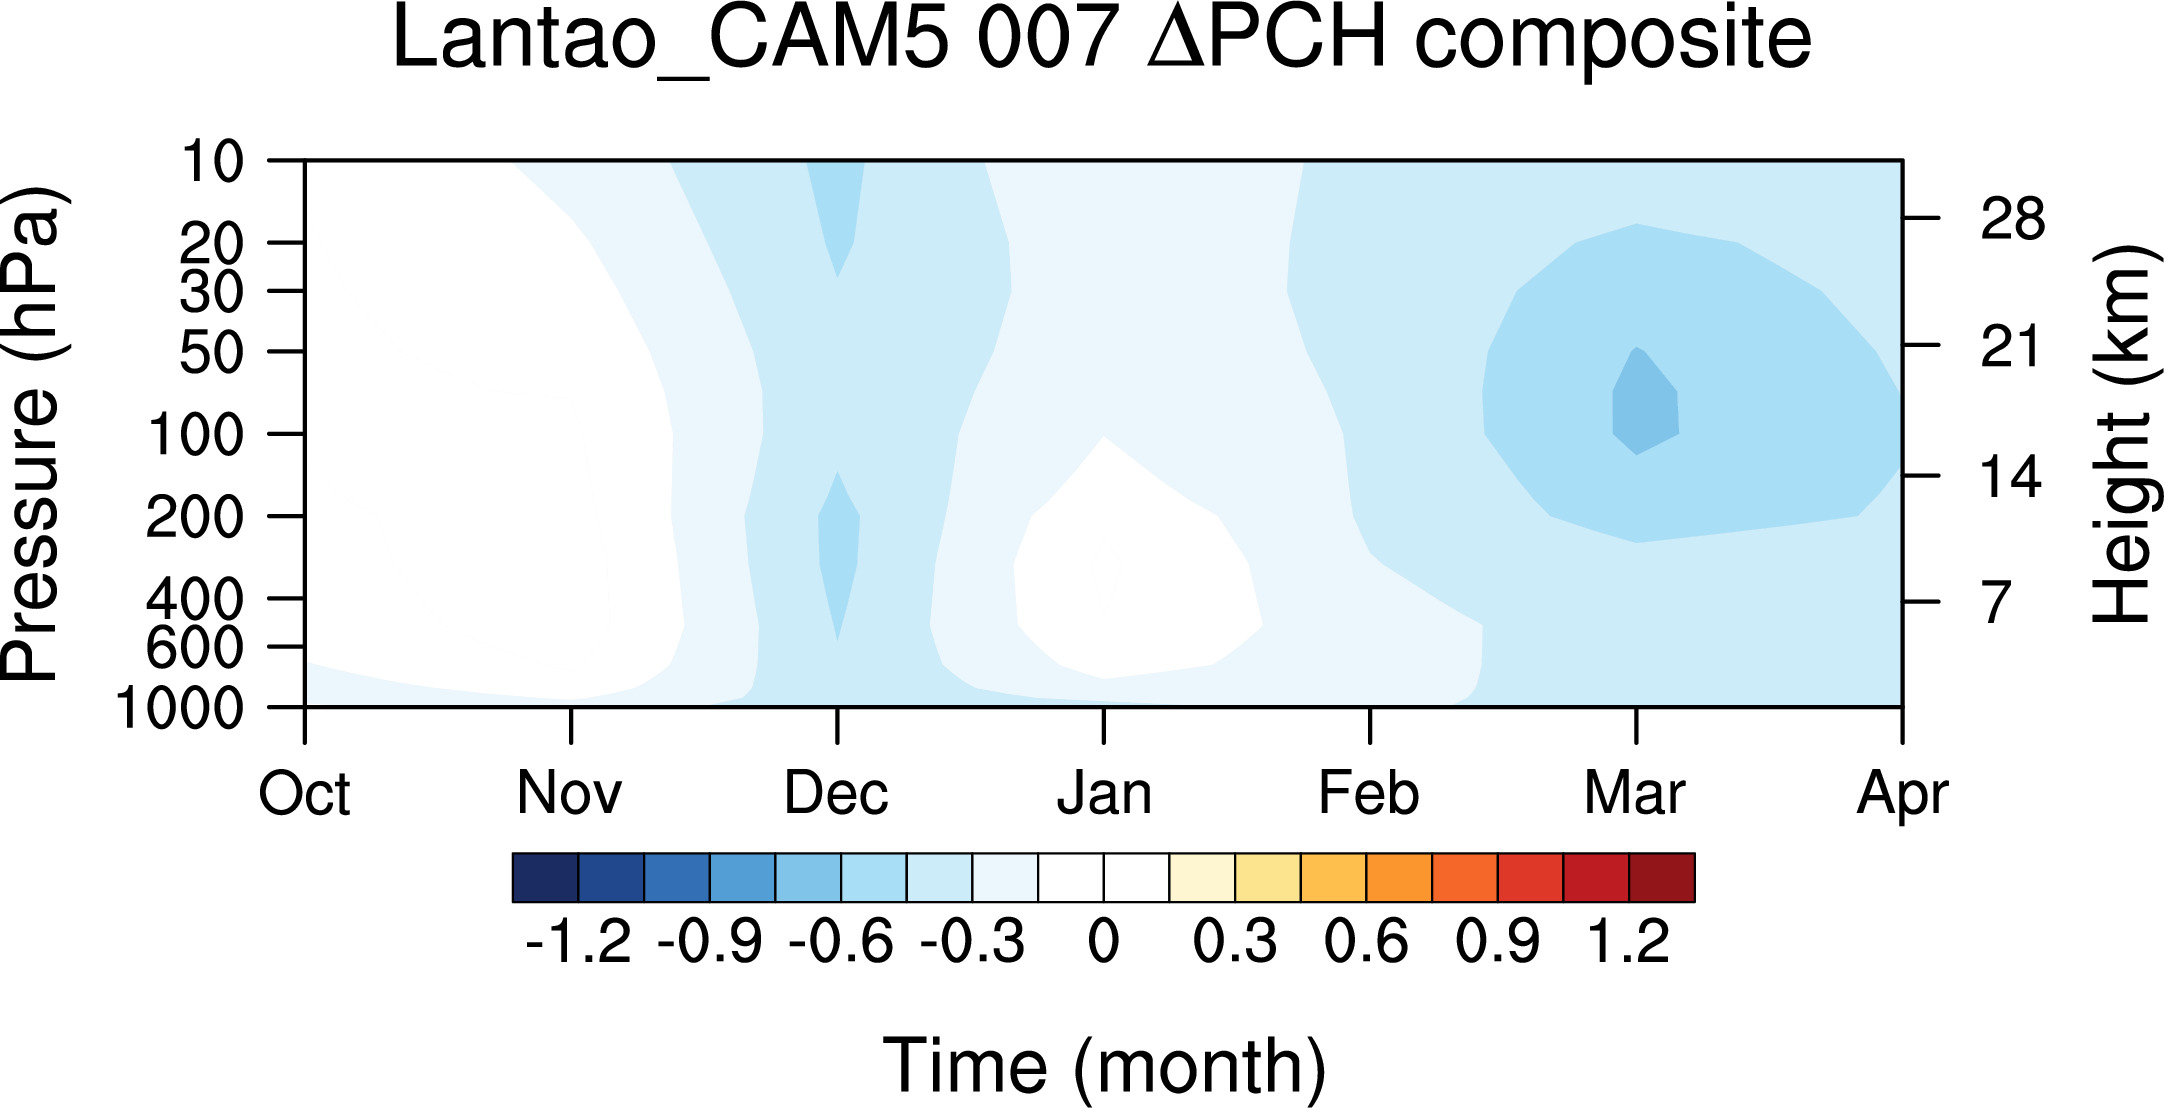
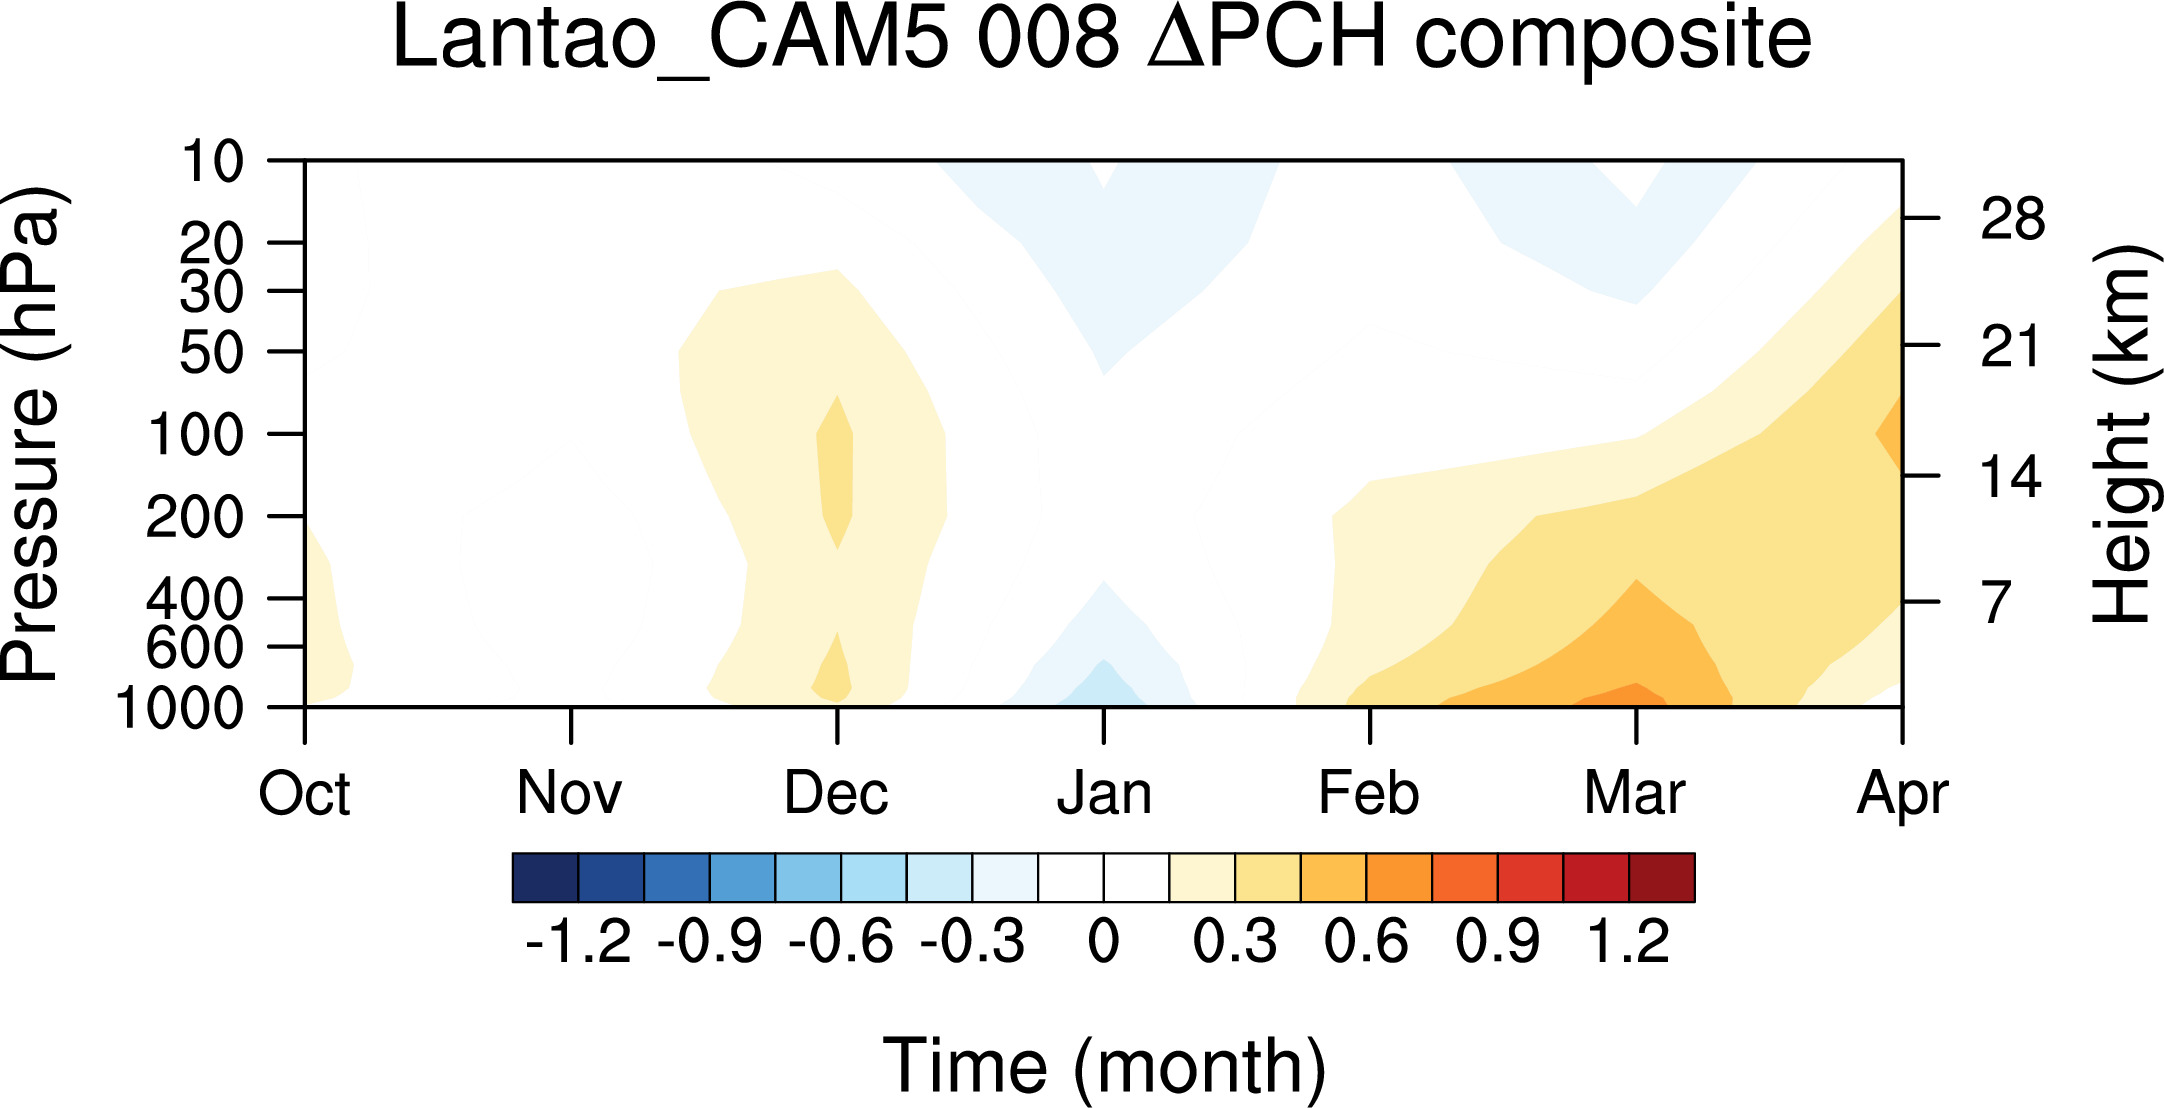
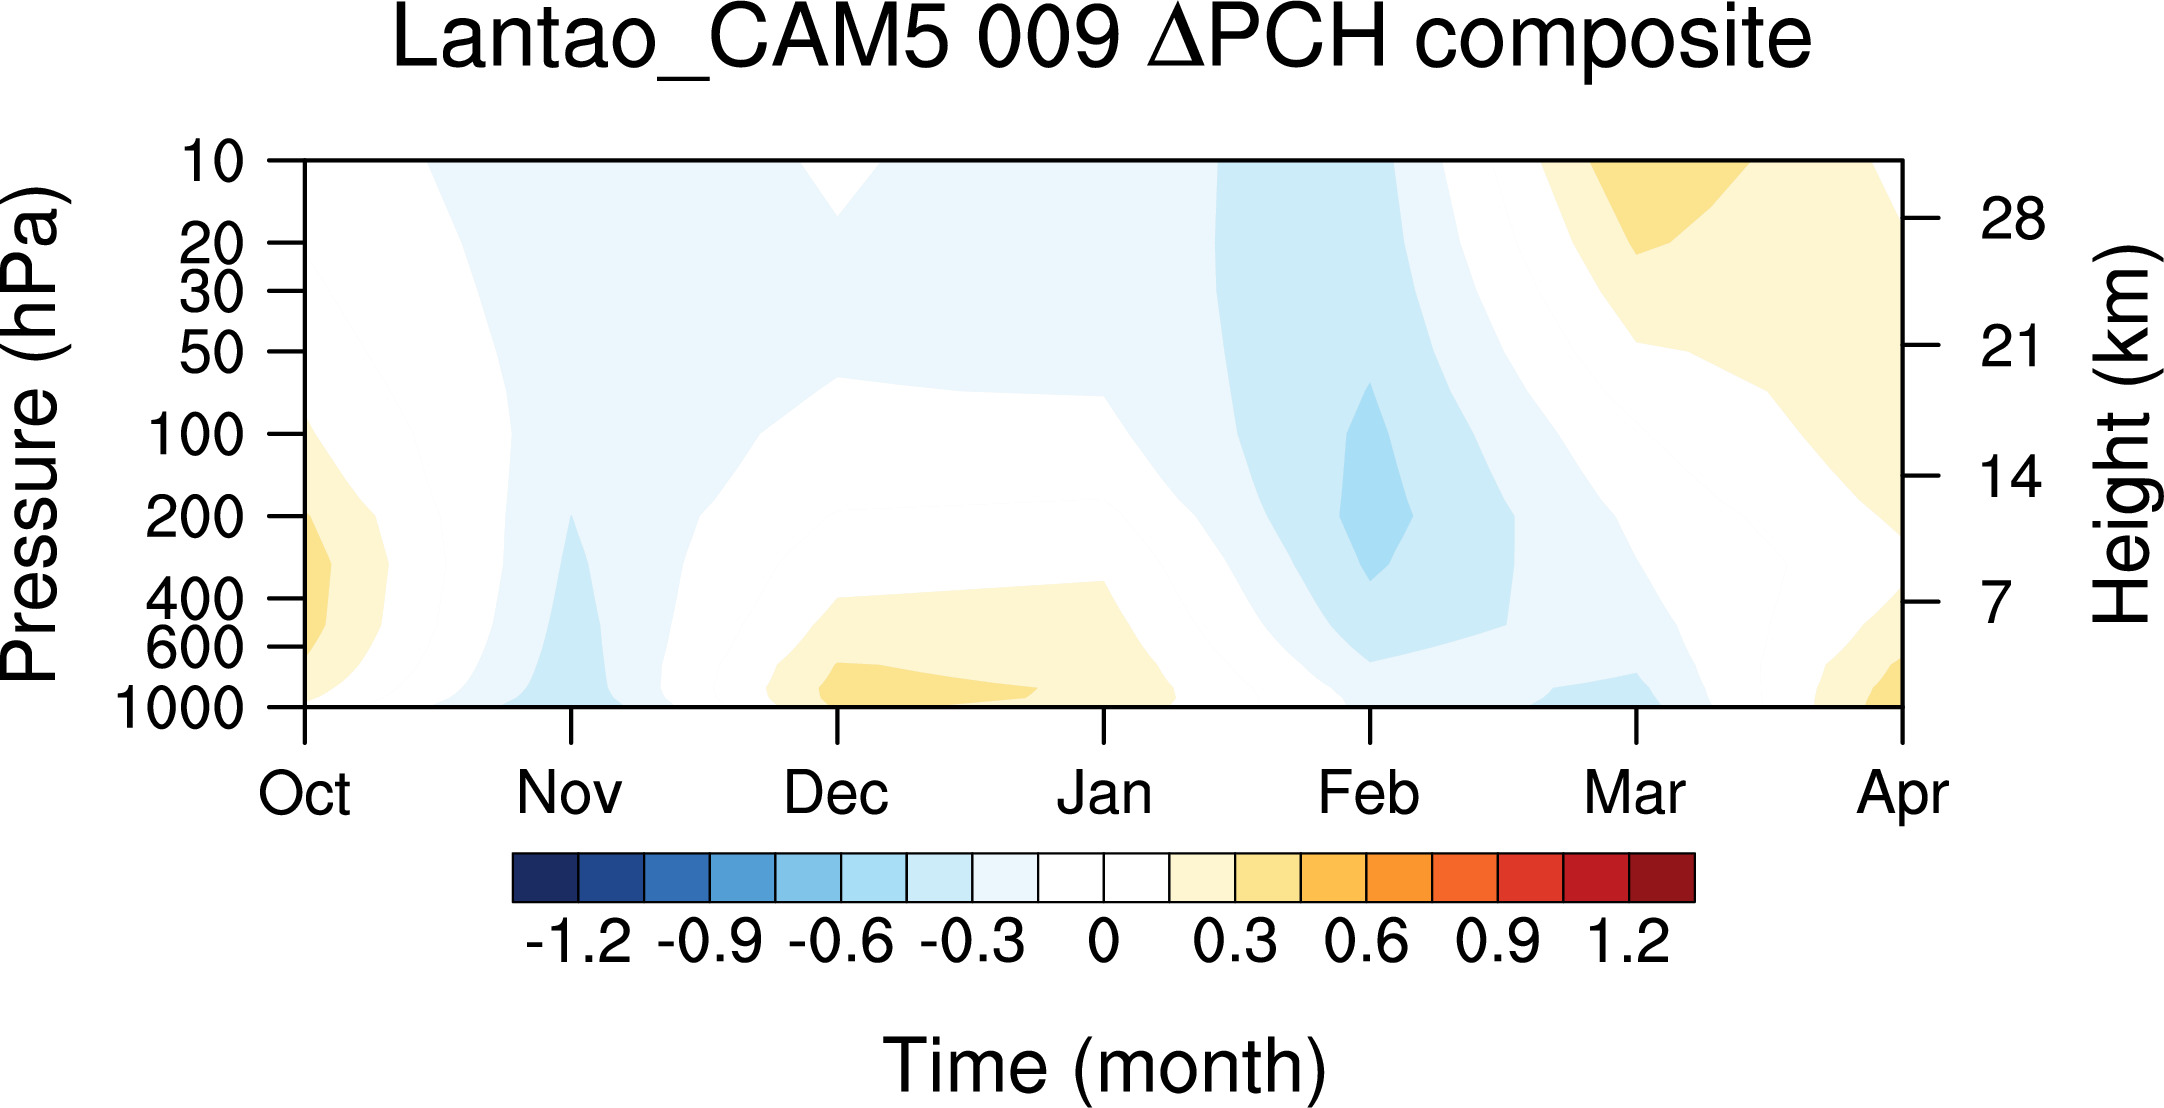
Individual Years here
-----
Special case Sorted on largest values of Jan Feb mean at 50hPa
Ensemble mean:
Individual Runs: