Datagrams – Improving data integrity by documenting its life story

The life story of a data value for even the simplest quantity is often complicated. Issues of data loss and misuse along the data transfer chain can lead to data degradation or worse – datasets that never get used. In an article published in the Bulletin of the American Meteorological Society, researchers from the Physical Sciences Laboratory introduced the concept of “datagrams” — a tool designed to improve data integrity by documenting the “life story” of a data value from start to finish. Datagrams provide a guide for humans to design, deploy, troubleshoot, repair, record, transmit, process and archive data collected from measuring devices. They are intended as a type of visual readme file, where users can see and follow the flow of the data value from its collection to its use scientifically. Datagrams are also meant to be public-facing documents that accompany a dataset, station or instrument platform.
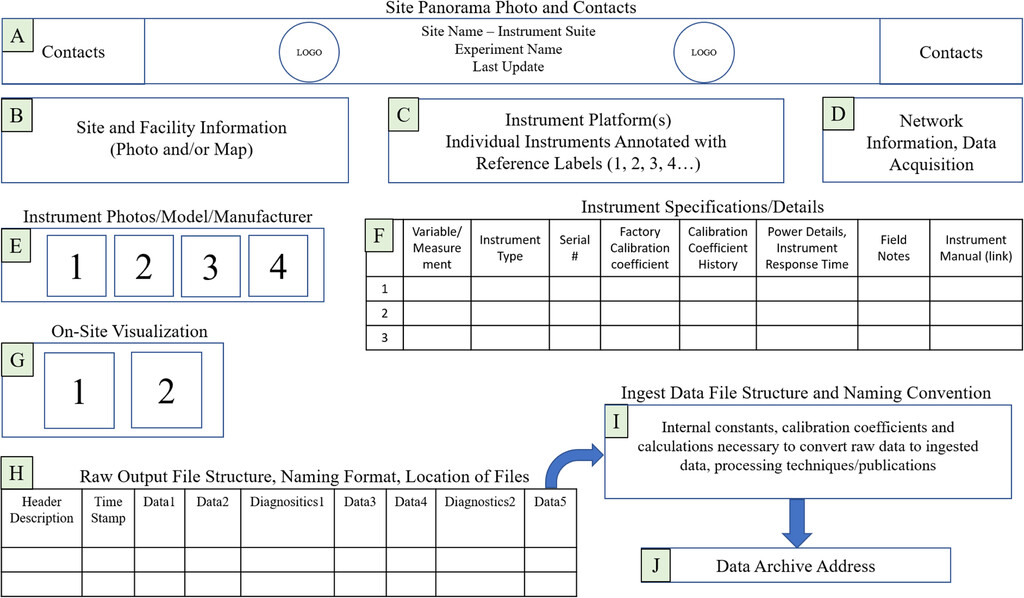
To compose a datagram, information is gathered from different sources and people and input into a spreadsheet or other type of schema. Ideally, the spreadsheet is used to build datagrams through a web interface, so they can be generated for large networks of instruments or stations. The main components of a datagram are: a) Site Panorama and Contacts, b) Site and Facility Information, c) Instrument Platform(s); Individual Instrument Annotated with Reference Labels, d) Network Information, e) Individual Instrument Photos, f) Instrument Details, g) On-Site Visualization, h) Raw Output File Structure and Naming Conventions, i) Ingest Data File Structure and Naming Format, and j) Data Archive Address.
A datagram is distinctly different from a follow-up data science paper, for example, it exists during deployment, it evolves as data is gathered, it can be viewed in poster format with no text explanations, it can be printed and accessed when off grid and it can be used as an engineering design tool, and it is a living document that can be updated as frequently as is necessary. Datagrams fill the gap between machine-oriented metadata and data science articles by providing metadata useful to a wider variety of specialties, like technicians, post-docs, engineers, data managers, and researchers alike – anyone who physically or virtually comes in contact with the instrument or the data that is collected. It is the duty of observers to make sure that the data collected is usable and contains accurate metadata. Documentation like datagrams help ensure that datasets are used far into the future – long after the measurements have been collected.
Morris, Sara M. (PSL) and Taneil Uttal (PSL) (2022): Datagrams: Diagrammatic Metadata for Humans. Bull. Am. Meteor. Soc., https://doi.org/10.1175/BAMS-D-21-0219.1.
Posted: August 1, 2022