MJO Phase Plots
Select an index and a date range (up to 366 days) and a phase plot based on the chosen index will be returned. More information about the indices is available.
Description of Returned Plot:
The labels on the line represent day of the month for that color. The amplitutde of the index is the radial distance from the center. An MJO event is defined as times when index amplitude local maxima within a centered 30 day period that also exceeds one standard deviation. The phases are the 8 standard MJO phases. Note the indices have been adjusted so they match the RMM phase convention (that is, PC1 is PC2(OMI) and PC2 is -PC1(OMI).
Phase Plot Parts
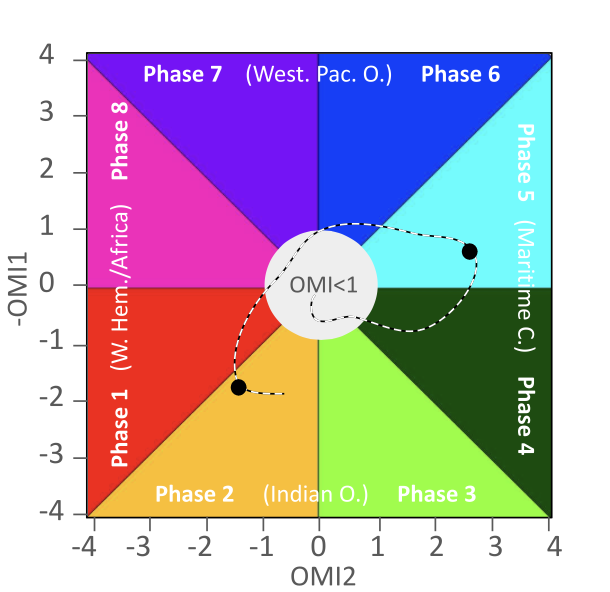
MJO Phases using OLR

Page Last Reviewed: Jan 24, 2025