All About the MJO - A Primer
Compiled by the NOAA Physical Sciences Laboratory
What is the MJO?
The Madden-Julian Oscillation is a mode of sub-seasonal atmospheric variability that influences the location and strength of tropical precipitation as in this classic schematic below from Rol Madden and Paul Julian. Typically the convectively active stage of the MJO starts over the equatorial Indian Ocean and moves slowly eastward at 3-5 m/s toward the west and central Pacific Ocean. The active stage is followed by a convectively suppressed stage and together they give rise to precipitation anomalies (i.e., departures from normal) that have a "dipole" structure. At times, the "cycle" repeats itself approximately every 40 days; however, in other instances, the MJO is more intermittent. Sometimes the signal from a previous event starts a new MJO over the Indian Ocean, resulting in more cyclical events.
The MJO was first described in 1971 but a field project held over the west equatorial Pacific during 1992-93 further raised awareness of the MJO as a coherent phenomenon, potentially useful for predictions of tropical precipitation and extratropical weather patterns on weekly to monthly timescales. The MJO is best defined over the oceanic warm pool, which extends from the Indian Ocean to the central Pacific and where complex variations of precipitation occur from day to day. The warm pool is generally defined by sea surface temperatures that are > 28 degrees C. As a result of this intense activity, the MJO is sometimes difficult to see in a sequence of satellite pictures of the Tropics.
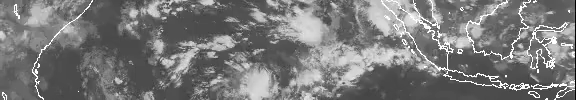
The video below shows a satellite animation of a strong MJO that took place from April 29 to May 2, 2002. Note the non-steady or transient nature of the convection, some of which can be seen more clearly when the data are averaged in space or time. Ways to monitor the MJO are illustrated later.
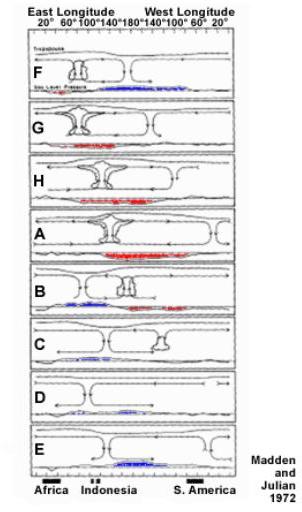
Schematic of the typical Madden-Julian Oscillation from Madden and Julian (1972).
How can an MJO affect the weather?
When an MJO moves eastward through the Indo-Pacific Ocean region, it produces large, slowly changing
departures
from the normal tropical precipitation. These departures change the atmospheric circulation and, through
the
phenomenon of Rossby wave dispersion, the changes can propagate into higher latitudes.
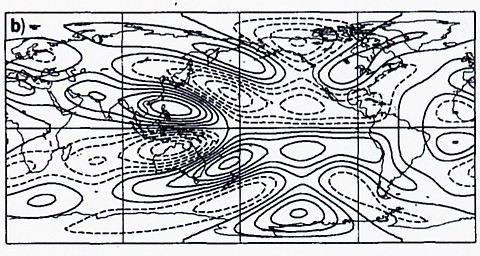
Rossby Wave Propagation | Sardeshmukh and Hoskins (1988)
The Rossby wave propagation picture above from Sardeshmukh and Hoskins (1988) illustrates the phenomenon for the situation where the "base state" atmospheric circulation is extremely simple. The picture shows upper atmospheric ridges and troughs emanating from a region of "precipitation" forcing over the west Pacific and extending poleward into both hemispheres. The circulation features can alter the path and intensity of synoptic waves in mid-latitudes and thereby can affect the weather. The actual "base state" through which these Rossby waves propagate is very complicated, involving jet streams, storm tracks and other regional circulation features. These features channel or interact with the Rossby wave energy and result in a pattern of troughs and ridges that is highly variable from case to case. This makes it difficult to impact the effect of an MJO, especially in regions far removed (e.g., North America) from the MJO's centers of action over the oceanic warm pool. The MJO signal is fairly small north of 30N on average.
How do MJOs interact with slower climate processes like ENSO?
MJOs may play a role in the transition to an El Niño or La Niña (ENSO). This means they help determine
details of
the timing and/or amplitude of a warming or cooling event. However, the transitional stage of an ENSO
event
is
complicated and the MJO's role is still being investigated. MJOs were prominent during the 1996-97
northern
winter at the early stage of the 1997-98 El Niño and this led to heightened awareness of a possible
MJO-ENSO
link. The 1996-97 MJO activity was by some measures the greatest in the ~30 year record of outgoing
longwave
radiation (OLR, a proxy for deep tropical convection). On the other hand, 1997-98 had the weakest
activity
in
the record.
The two years are contrasted here using a time-longitude or Hovmoller diagram of total OLR for 1996-97
and
1997-98.
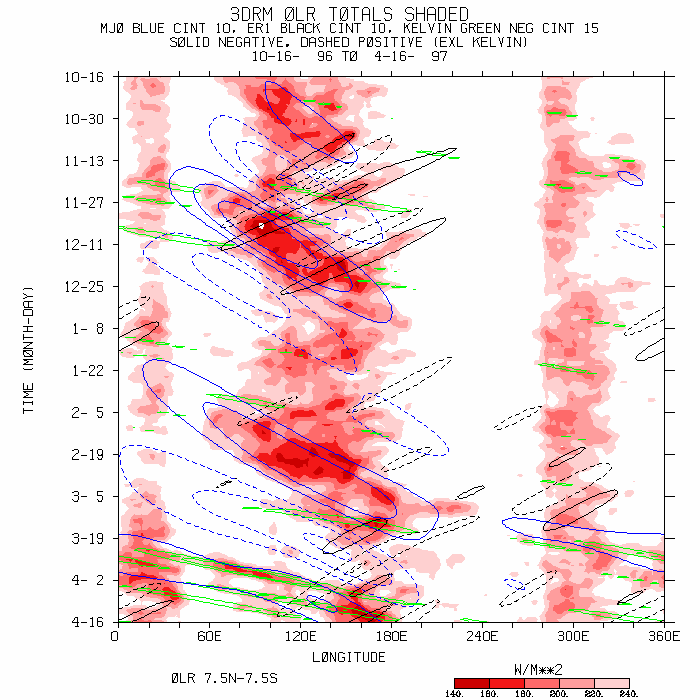
1996-1997 OLR
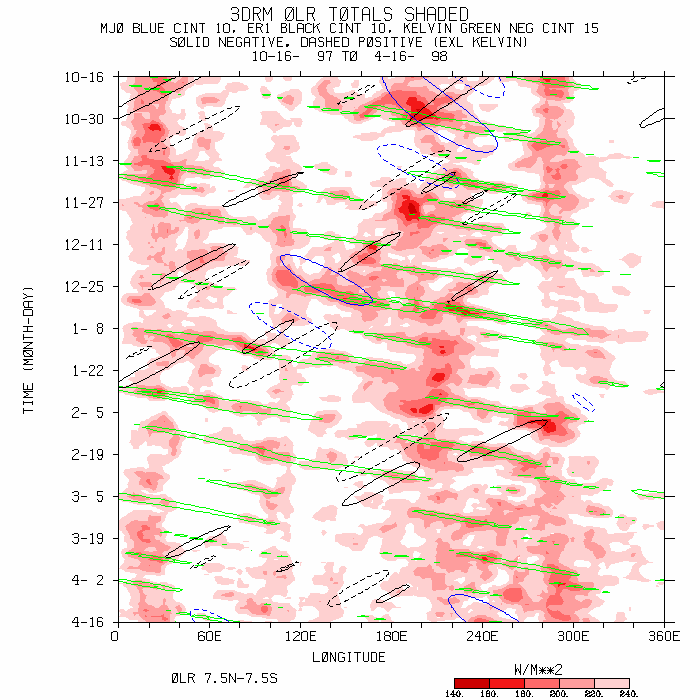
1997-1998 OLR
Once sea surface temperatures (SST) anomalies associated with an ENSO are in place, the MJO life cycle is influenced by the SST anomalies. When or if an MJO develops, the simplest effect during El Niño is a farther eastward movement of the convection into the central Pacific whereas during La Nina the convection anomalies barely get into the western Pacific. In both cases the MJO still "starts" over the Indian Ocean.
Despite this influence on the MJO life cycle, it is
unclear whether overall MJO activity is influenced by the phase of the
ENSO cycle. The natural variation of MJO activity is too large and observed
datasets are too short to provide a definitive answer to this question.
Transient convection at all time scales increases when SSTs reach ~29C (84F). On the other hand, there
is a
significant relationship between MJO activity and SST anomalies over the western Pacific Ocean
(140-180E).
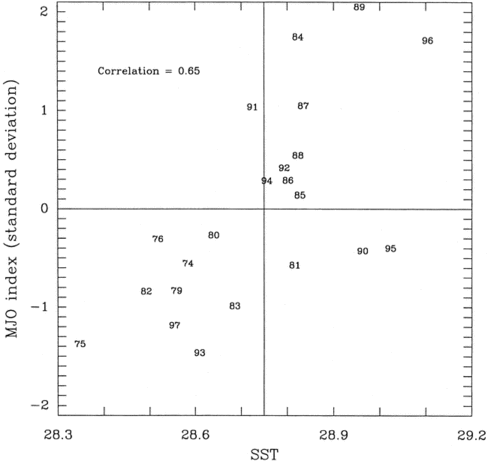
Scatter plot of SST vs. MJO activity
How can the atmosphere and ocean signals associated with the MJO be determined?
The MJO life cycle can be broken down into stages using an index based, for example, on the location of the MJO's tropical convection anomaly. The atmosphere's observed large-scale circulation and/or local weather anomalies can then be averaged over many cases to produce a "composite" anomaly for each stage. Time filtering is usually applied to exclude higher and lower frequency variability. The results produce an estimate of the MJO signal or influence based on the observational record. The composite anomalies of circulation and weather are generally weak in the extratropics and moderately strong in the tropics and subtropics.
How do MJOs interact with faster weather processes like synoptic scale waves and wavetrains?
The composite anomalies, assuming they are statistically significant and large enough, produce persistent (1-3 week) changes in the atmospheric flow due to the MJO. These changes can influence the development and propagation of synoptic-scale weather systems, i.e. they influence the storm track. For example, during one stage Pacific Ocean storms tend to be stronger and farther south when they make landfall on the U.S. west coast. At the opposite stage the storm or wave energy may split and move south into the tropics and north into Canada, favoring storms over the central U.S. Plains. Because the MJO extratropical signal is weak there are large variations of the actual circulation or weather observed in individual cases. Other processes may overwhelm or mask the MJO signal.
Daily monitoring of many individual cases has produced qualitative evidence for interaction between the circulation induced by flare-ups of convection within the MJO's convective envelope and synoptic scale waves or wavetrains passing by in mid-latitudes and the subtropics. These daily interactions are large amplitude and sometimes contribute to the rapid initiation of the composite MJO signal and/or major transitions in weather patterns.Until GCMs are able to simulate MJOs, we rely on daily monitoring and a subseasonal synoptic model to provide an early indication of such situations.