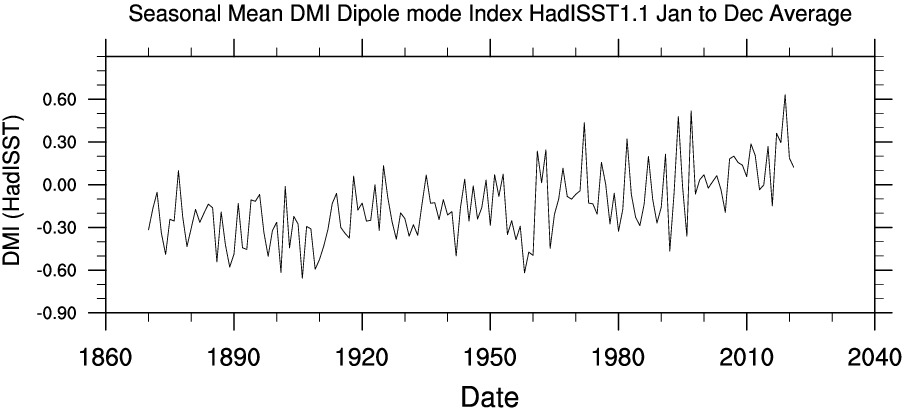
Dipole Mode Index (DMI) Monthly Time-series
Describes SST gradient in Indian ocean.

From WRIT Correlation page
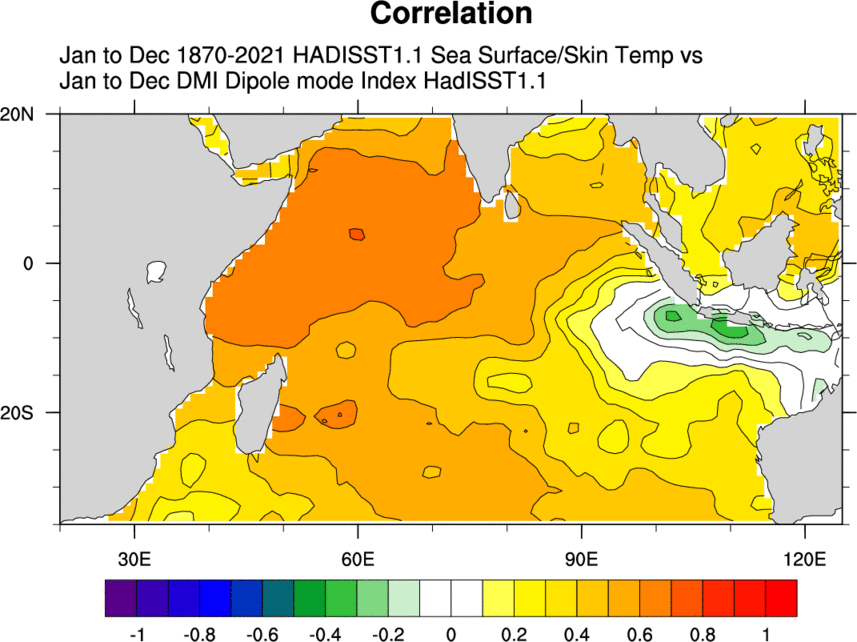
Map is correlation of annual DMI time-series with Annual SST from the HadISST1.1 SST dataset for 1870-2021. The east-west gradient is illustrated.
- Intensity of the IOD is represented by anomalous SST gradient between the western equatorial Indian Ocean (50E-70E and 10S-10N) and the south eastern equatorial Indian Ocean (90E-110E and 10S-0N). This gradient is named as Dipole Mode Index (DMI). When the DMI is positive then, the phenomenon is refereed as the positive IOD and when it is negative, it is refereed as negative IOD.
Temporal Coverage
- Monthly values: 1870/01 to near present
- Update Status: Monthly
Data Notes
- Units: degC
- Missing data value: -9999.0
Usage Restrictions
- None
Caveats
- None
Related Time-series
Links
- JAMSTEC via the page http://www.jamstec.go.jp/frcgc/research/d1/iod/e/iod/about_iod.html.<
- https://stateoftheocean.osmc.noaa.gov/sur/ind/dmi.php
Analysis pages
Original Source
- Index is calculated at PSL using this NCL code
Time-series source dataset(s)
- Input data for the mode calculation is the HadISST1.1 Dataset.
References
- Possible impacts of Indian Ocean Dipole mode events on global climate. Authors: Saji, NH;Yamagata, T, CLIMATE RES, 25 (2): 151-169 DEC 5 2003.M/li>
