Recreating the Great Blizzard of 1888 — A Case Study
Background
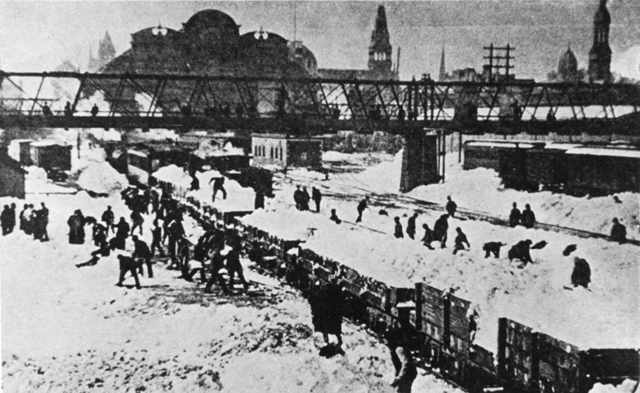
March 12-14, 1888 — The Great White Hurricane aka The Great Blizzard of 1888 was one of the most severe recorded blizzards in American history. The storm paralyzed the East Coast from the Chesapeake Bay to Maine to the Atlantic provinces of Canada. As much as 58 inches of snow fell in some regions. Trains and roads were shut down, boats were destroyed, and over 400 people died. Winds were particularly strong with some areas seeing gusts over 80mph. The strong winds were responsible for large snow drifts, many over 50 feet tall. Melting snow after the storm caused severe flooding in parts of the Northeast. Notably, the shutdown of transportation was the impetus for the start of NYC's subway system and the power/telegraph lines outages started the process of moving those them underground.(Courtesy of Wikipedia)
Reconstruction of Conditions
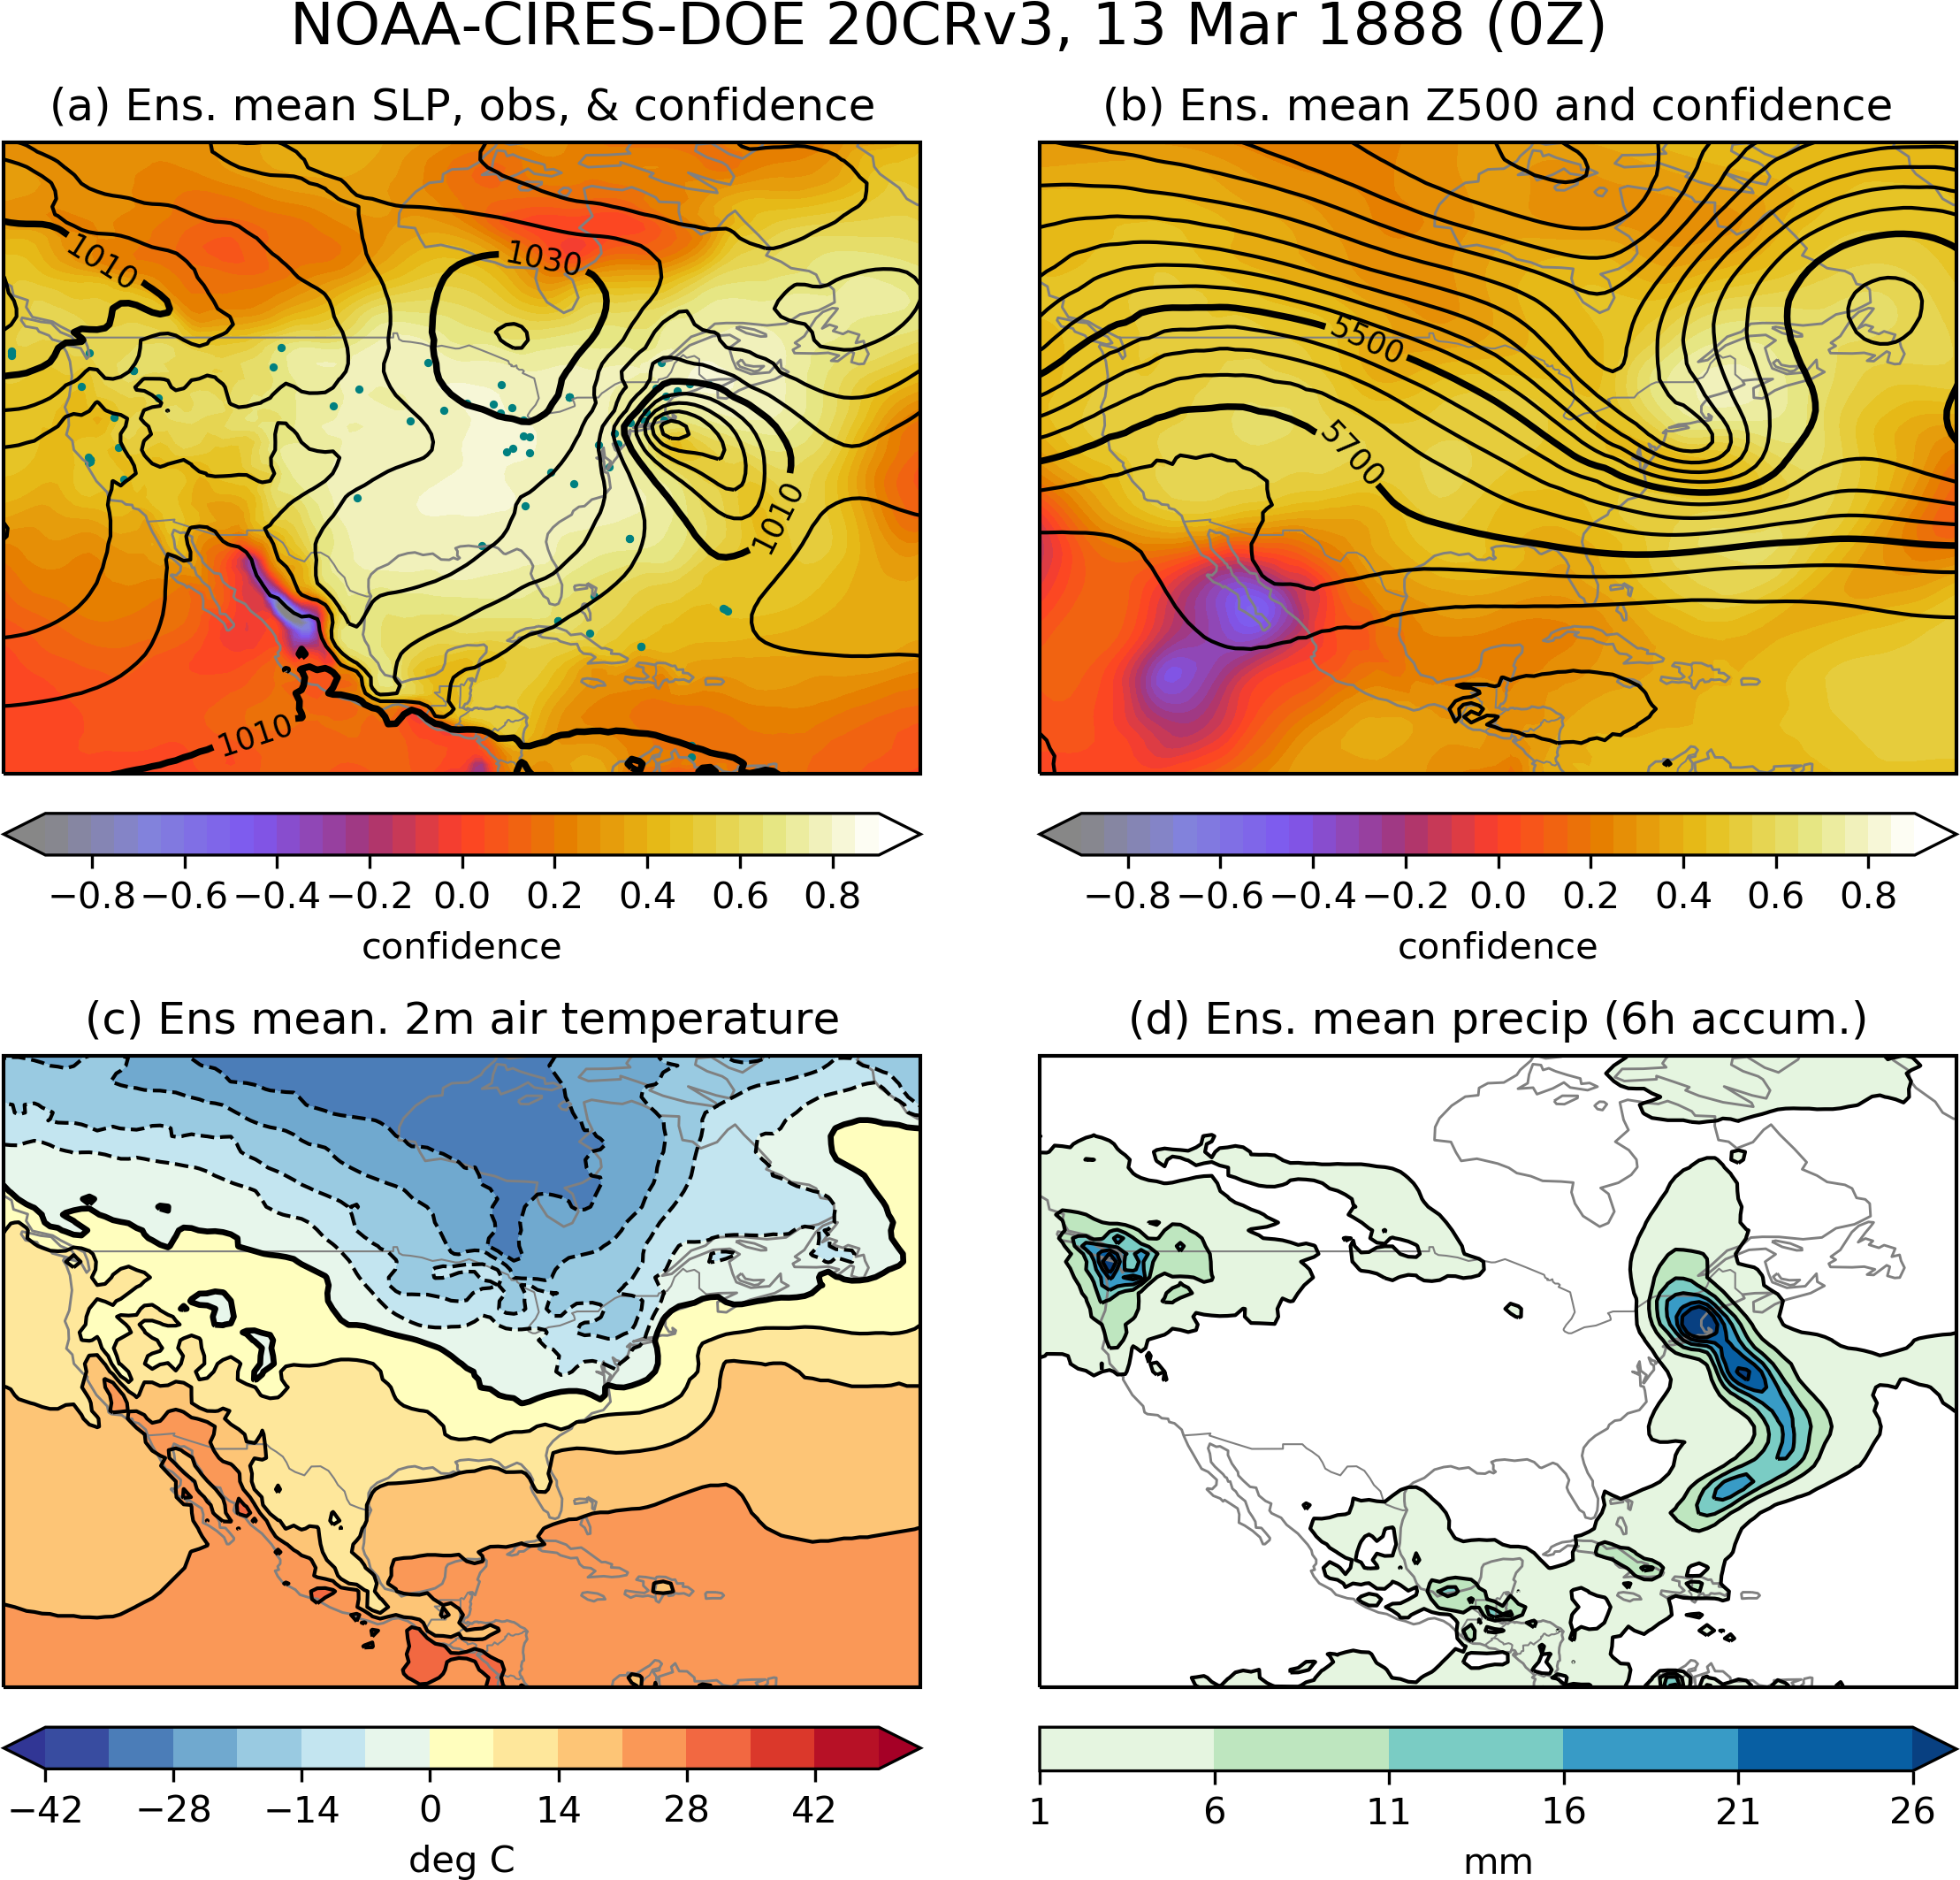
This four-panel plot shows synoptic conditions during the Great Blizzard of 1888, as reconstructed by the NOAA-CIRES-DOE 20th Century Reanalysis Version 3. Panel (a) includes ensemble mean sea level pressure (contours), observation locations (filled circles), and sea level pressure confidence (shading); panel (b) includes ensemble mean geopotential heights at 500 hPa and its confidence field; panel (c) shows ensemble mean 2m air temperatures; and panel (d) shows ensemble mean precipitation rate accumulated over 6 hours prior to 0Z on 13 March 1888. Confidence is calculated as a function of ensemble spread and an estimated climatological variance: a value of zero corresponds to a confidence value equal to climatological uncertainty, and positive (negative) values correspond to higher (lower) confidence than climatological uncertainty (see doi:10.1002/qj.3598 for more details.)
Click plot to enlarge