")
About

What is EDDI?
The Evaporative Demand Drought Index (EDDI) is an experimental drought monitoring and early warning guidance tool. It examines how anomalous the atmospheric evaporative demand (E0; also known as "the thirst of the atmosphere") is for a given location and across a time period of interest. EDDI is multi-scalar, meaning that this period—or "timescale"—can vary to capture drying dynamics that themselves operate at different timescales; we generate EDDI at 1-week through 12-month timescales.
This webpage offers a frequently updated assessment of current conditions across CONUS, southern parts of Canada, and northern parts of Mexico; a tool to generate historical time series of EDDI for a user-selected region; introductions to the EDDI team; and a list of resources for users to explore EDDI and its applications further.
Why use EDDI?
EDDI can offer early warning of agricultural drought, hydrologic drought, and fire-weather risk by providing near-real-time information on the emergence or persistence of anomalous evaporative demand in a region. A particular strength of EDDI is in capturing the precursor signals of water stress at weekly to monthly timescales, which makes EDDI a strong tool for preparedness for both flash droughts and ongoing droughts.
How often is EDDI updated?
Currently, EDDI is generated daily—though with a 5-day lag-time—by analyzing a near-real-time atmospheric dataset. This lag-time results from the procedures to quality control the meteorological data used to estimate evaporative demand. There is also an ongoing effort to forecast EDDI based on seasonal climate-forecast information.
Acknowledgements
This work is supported in part by grants from (i) NOAA's Joint Technology Transfer Initiative (JTTI) for the project titled "Operationalizing an Evaporative Demand Drought Index (EDDI) service for drought monitoring and early warning;" (ii) NOAA's Sectoral Applications Research Program (SARP): Coping with Drought in Support of the National Integrated Drought Information System (NIDIS) program for the project titled "Developing a wildfire component for the NIDIS California Drought Early Warning System;" (iii) DOI's North Central Climate Science Center for the project (Grant #G14AP00182) titled "Ecological Drought, Climate Extremes and the Water Cycle across Timescales;" and (iv) Western Water Assessment, an NOAA RISA program, for the project titled "Enhancing the usability of EDDI," with funding originating from NIDIS.
Any issues with accessing the plots and other information on this page are welcome and should be sent to psl.data@noaa.gov.
 |
Current EDDI Maps and EDDI-change Maps for the Contiguous U.S.
EDDI Category Map
EDDI Change Maps

|
|
|
|
|
Description of Maps and Underlying Data
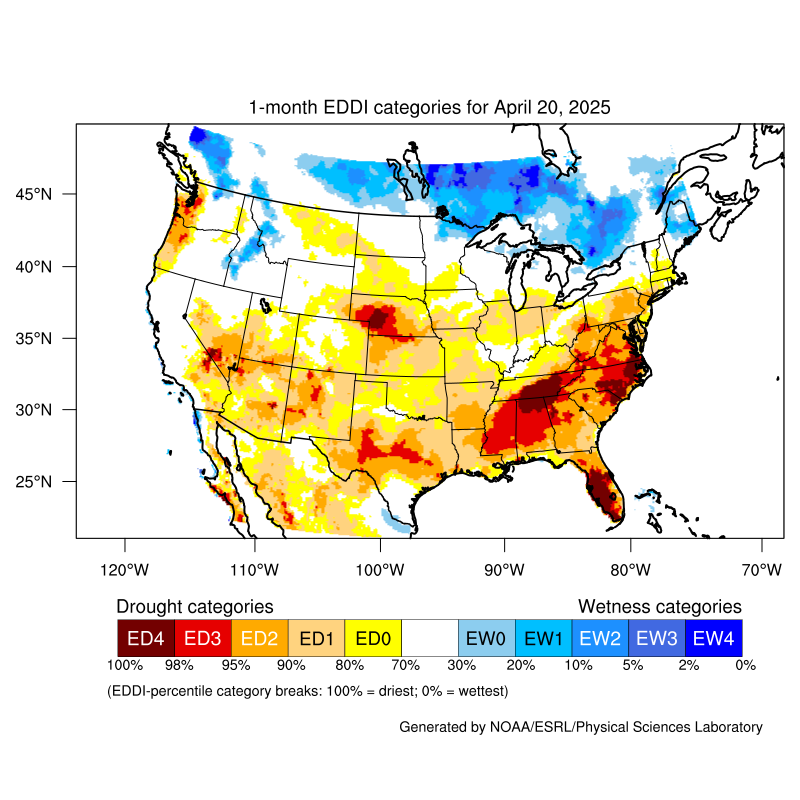
The EDDI maps displayed here use atmospheric evaporative demand (E0) anomalies across a timescale of interest relative to its climatology to indicate the spatial extent and severity of drought. This page provides access to near-real-time maps (with a five-day latency due to the most recent information being five days old) depicting both EDDI (EDDI Category Maps) and changes in EDDI (EDDI Change Maps), with timescales that measure E0 anomalies across the 1 to 12 weeks and 1 to 12 months prior to the most current date.
The E0 is calculated using the Penman-Monteith FAO56 reference evapotranspiration formulation (0.5-m tall reference crop), driven by data on temperature, humidity, wind speed, and incoming solar radiation, with these data extracted from the operational North American Land Data Assimilation System (NLDAS-2) dataset. For a particular time-window, EDDI is estimated by standardizing the E0 anomalies relative to the same accumulation time-window in the whole period of record (1979-present), using a rank-based non-parametric method described in Hobbins et al. (2016; see the "Resources" tab). EDDI data are available at a ~12-km resolution (0.125° lat and long) across CONUS since January 1, 1980, and are updated daily.
On the EDDI Category Maps, colors indicate the frequency at which the observed E0 anomaly has occurred in the climatology, with warm colors indicating conditions that are drier than normal and cool colors indicating wetter-than-normal conditions. As an example, the ED4 category indicates that the current E0 anomaly has only been observed less than 2% of the time in the past 38 years (1979-2016), which represents the most severe drought conditions; the EW4 category means indicates that the anomaly has been exceeded 98% of the time, which represents the wettest conditions. For plotting purposes, EDDI values are binned into different percentile categories analogous to the US Drought Monitor plots—however, in case of EDDI plots, both drought and anomalously wet categories are shown.
On the EDDI Change Maps, the evolution in EDDI is depicted over the period indicated in the title. For instance, the "1-month EDDI: Changes during the 7 days ending on March 10, 2021" shows by how many categories 1-month EDDI has changed from March 3 to March 10. Brown colors indicate deepening drought conditions (say from D0 to D1, which would show as a category change of -1); green colors indicate ameliorating drought conditions (say from D2 to D1, which would show as a category change of 1). In each case, deeper shades indicate greater changes in EDDI across the period. Only a few change periods are shown for each EDDI category map. Note these maps only depict regions either starting or ending the change period in categories D0-D4; regions that are either not in drought during the change period or that leave drought during the change period are shown as blank.
For more information regarding these plots and access to data, including customized EDDI maps, please contact Mike.Hobbins@noaa.gov (Phone: 307-228-0815)
This is a Research and Development Application
Plot EDDI Time Series of the Continental U.S.
Description of Time-Series Data and Plot
This page generates historical (1980-latest complete year) time-series data of EDDI across a user-selected region and timescale. You can select your region as a rectangular area by directly entering latitude and longitude values or by selecting the area in the adjacent map. The main output is a table with EDDI time series for timescales of 1 to 12 months. A plot will also be generated with user- (or default-) entered month and averaging period, which will accompany another table showing the time-series data with user-defined specifications. On the output page, you will have an option to readily replot EDDI time series with different specifications.
To estimate evaporative demand (E0), this tool uses daily reference evapotranspiration based on the Penman Monteith FAO56 method for tall (0.5m) reference crop that is available from the the operational North American Land Data Assimilation System (NLDAS-2) dataset. The spatial resolution of the data is 1/8th degree in latitude and longitude (i.e. approximately 12km). Daily E0 values are then aggregated to monthly values, and spatial averaging is done before monthly EDDI values are computed. At any point in time, there is large spatial variability in EDDI across CONUS. For generating these time series for meaningful assessment, we generally recommend that users select as small an area as possible (e.g., county, climate division, small watersheds), including point locations (i.e., by using a single latitude value in both the N and S boxes, and a single longitude value in both E and W boxes. for bounding the region, thereby getting the time series for just a single representative 12km x 12km pixel).
The main output table also includes reference evapotranspiration value (in mm) for each month used to calculate EDDI. The absolute values of E0 are highest during the warm season, during which there is also a heightened risk of water stress on the land surface in water-limited regions. For drought-related impacts, users can use time series of different EDDI timescales to compare with their own historical impacts data.
For further assistance or technical advice on the use of these timeseries data for research applications please contact Mike.Hobbins@noaa.gov.
This is a Research and Development Application
EDDI Map Archive
Description of Maps and Underlying Data
The EDDI maps displayed here use atmospheric evaporative demand (E0) anomalies across a timescale of interest relative to its climatology to indicate the spatial extent and severity of drought. This page provides access to historic and near-real-time (with a five-day latency, i.e., the most recent information is five days old) EDDI plots with timescales that measure E0 anomalies across the 1 to 12 weeks and 1 to 12 months prior to the most current date. The colors indicate the frequency at which the observed E0 anomaly has occurred in the climatology, with warm colors indicating conditions that are drier than normal and cool colors indicating wetter-than-normal conditions. As an example, the ED4 category indicates that the current E0 anomaly has only been observed less than 2% of the time in the past 38 years (1979-2016), which represents the most severe drought conditions; the EW4 category means indicates that the anomaly has been exceeded 98% of the time, which represents the wettest conditions. For plotting purposes, EDDI values are binned into different percentile categories analogous to the US Drought Monitor plots—however, in case of EDDI plots, both drought and anomalously wet categories are shown.
E0 is calculated using the Penman Monteith FAO56 reference evapotranspiration formulation (0.5m tall reference crop), driven by temperature, humidity, wind speed, and incoming solar radiation from the operational North American Land Data Assimilation System (NLDAS-2) dataset. For a particular time-window, EDDI is estimated by standardizing the E0 anomalies relative to the the same accumulation time-window in the whole period of record (1979-present), using a rank-based non-parametric method described in Hobbins et al. (2016). EDDI data are available at a ~12-km resolution (0.125° lat and long) across CONUS since January 1, 1980, and are updated daily.
Click here for access to these CONUSwide plots and here for access to the CONUSwide data. For more information regarding the plots and data, including arranging for customized EDDI maps, please contact Mike.Hobbins@noaa.gov (Phone: 307-228-0815).
This is a Research and Development Application
EDDI Project Team

Joe Barsugli
Joe is a research scientist at CIRES and NOAA’s Physical Sciences Laboratory. Trained in climate theory and modeling, he works at the technical interface connecting climate science with the practitioners and technical staff who are informing planning for water and land management in the Colorado region, and connecting researchers to the problems faced by managers.

Candida Dewes
Candida is a research scientist at CIRES and NOAA’s Physical Sciences Laboratory. She has extensive research experience in climate variability and climate change and their impacts on socio-ecological systems. Her current research focuses on regional-scale land surface processes contributing to drought, and in particular, the variability of evaporative demand under climate change. She is also interested in the role of rain versus snow in mountainous terrain how these precipitation types impact regional water resources.

Mike Hobbins
Since obtaining his Ph.D. in Hydrologic Science and Engineering from Colorado State University in 2004, Mike has worked in research into evapotranspiration, evaporative demand, and drought. As a Research Scientist for NOAA’s Physical Sciences Laboratory and CIRES, his recent work supports drought early warning across the US for the National Integrated Drought Information System (NIDIS) and famine early warning across the globe for the Famine Early Warning System Network (FEWS NET), including the development and dissemination of reanalyses of evaporative demand; the development of the Forecast Reference Evapotranspiration (FRET) product for daily and weekly evaporative demand forecasts across the US; and the development of the EDDI.

Justin Huntington
Justin is an associate research professor of hydrology at the Desert Research Institute, Reno, Nevada. His research interests are focused on remote sensing, land surface energy balance measurement and modeling, drought monitoring, and hydrologic modeling. His research primarily supports water use, water demand, and drought mapping and prediction efforts funded by the U.S. Bureau of Reclamation, U.S. Geological Survey, U.S. Bureau of Land Management, NASA, NOAA, and Google. He is one of 25 members of the 2012-2017 Landsat Science Team.

Jeff Lukas
Jeff is a research integration specialist with the Western Water Assessment program at CIRES, at the University of Colorado Boulder. Jeff works closely with water managers and other resource decision-makers in the Rocky Mountain West to help them understand and prepare for climate-related vulnerabilities by interpreting and applying paleoclimate data, historical climate records, and climate projections. He was lead author of the 2014 Climate Change in Colorado report for the Colorado Water Conservation Board, which summarized the latest science on climate trends and projections for the state. Jeff was initially trained in forest ecology (M.S., Forestry, University of Montana) and conducted fire history research, later shifting into applied climatology and hydrology.

Daniel McEvoy
Daniel is a researcher with the Western Regional Climate Center. His research interests are interdisciplinary and span the fields of climate, hydrology, and meteorology. They include advancing drought monitoring technology, seasonal drought prediction, the role of evaporative demand on drought, quality and uncertainty assessment of weather observations, and climate modeling.

Charles Morton
Charles is an assistant research scientist at the Desert Research Institute in Reno, NV. His research interests include surface energy balance modeling, hydrology, remote sensing, and cloud computing. For more than 10 years he has worked on numerous projects estimating evapotranspiration in the western United States using satellite remote sensing.

Imtiaz Rangwala
Imtiaz is a research scientist at North Central Climate Adaptation Science Center at the University of Colorado Boulder. He is a climate scientist with training in assessing and diagnosing regional scale climate change. Using climate observations and models, he works to understand and quantify climate processes relevant to regional warming trends and hydrological processes changes. This specifically ties into understanding climate extremes and changes in water balance in the western U.S., including the Great Plains region, and the how these extremes affect ecosystem response. Other work includes developing approaches to addressing and incorporating future climate change uncertainty into decision making and climate adaptation.

Andrea Ray
Andrea is a research scientist at NOAA's Physical Sciences Laboratory. Trained in environment and society geography, she studies user needs for climate forecasts, projections, and knowledge in natural resource management, decision making and adaptation. She often serves as a technical expert on planning and policy teams, working to transition research results into applications. Currently, she is serving on the interagency Climate Projections Team for the USGCRP Climate Resilience Toolkit, and on the Steering Team to develop a NOAA Water Resources Monitor and Outlook to provide enhanced outlooks on the runoff season. She recently led a climate analysis for the U.S. Fish and Wildlife Service to inform their Wolverine Species Status Assessment: Future snow persistence in Rocky Mountain and Glacier National Parks.

Cathy Smith
Cathy is an associate scientist at CIRES and NOAA’s Physical Sciences Laboratory. She has a background in climate and weather statistics and has been involved in research into the relationship between climate processes and rainfall. She has used this background to be involved in the creation of web-based climate/weather analysis tools for users to investigate climate relationships and web-pages that help educate the public about climate and weatherprocesses.

Heather Yocum
Heather is a research scientist at CIRES. An environmental anthropologist and political ecologist, Dr. Yocum studies how culture and social systems impact the way that humans understand and interact with the environment. Since earning her PhD in Anthropology from Michigan State University in 2013, she has researched the production and use of climate and weather information to support natural resource management and decision-making; changing patterns of land use and natural resource management in the face of climate change; and environmental markets and payments for ecosystem services.
Resources
Primary Background Material
Related Links
- A slow disaster scorched Wyo. No one saw it come or go
- A Wyoming Reservation Shows the New Face of Drought
- EDDI Webinar on 14 Mar 2018 — Slides (pdf)
- EDDI Webinar on 14 Mar 2018 — Recording (mp4)
- EDDI, a New Drought Index, Provides Early Warning of Flash Droughts
- A new NOAA tool is helping to predict US droughts, global famine
- New NOAA tool is helping to predict U.S. droughts, global famine
- EDDI: A powerfiul tool for early drought warning
- WWA: Intermountain West Climate Dashboard
- PSL News: New tool effectively identifies both rapid-onset and sustained droughts
- CONUS maps of monthly US climate division PDSI
- Time series of monthly US climate division PDSI and other variables
References
EDDI Development
- M. Hobbins, A. Wood, D. McEvoy, J. Huntington, C. Morton, M. Anderson, and C. Hain (June 2016): The Evaporative Demand Drought Index: Part I – Linking Drought Evolution to Variations in Evaporative Demand. J. Hydrometeor., 17(6),1745-1761, doi:10.1175/JHM-D-15-0121.1.
- D. J. McEvoy, J. L. Huntington, M. T. Hobbins, A. Wood, C. Morton, M. Anderson, and C. Hain (June 2016): The Evaporative Demand Drought Index: Part II – CONUS-wide Assessment Against Common Drought Indicators. J. Hydrometeor., 17(6), 1763-1779, doi:10.1175/JHM-D-15-0122.1.
EDDI-Related
- Dewes, C. F., I. Rangwala, J. J. Barsugli, M. T. Hobbins, and S. Kumar (March 2017): Drought risk assessment under climate change is sensitive to methodological choices for the estimation of evaporative demand. PLoS ONE, 12(3), e0174045, doi:10.1371/journal.pone.0174045
- McNeeley, S. M., C. F. Dewes, C. J. Stiles, T. A. Beeton, I. Rangwala, M. T. Hobbins, and C. L. Knutson CL (2017): Anatomy of an interrupted irrigation season: Micro-drought at the Wind River Indian Reservation. Clim. Risk Mgt., doi:10.1016/j.crm.2017.09.004.
- Rondeau, R. J., K. L. Decker, and G. A. Doyle (January 2018): Potential consequences of repeated severe drought for shortgrass steppe species. Rangeland Ecol. Mgt., 71(1), 91–97, doi:10.1016/j.rama.2017.07.002.
- Shrum, T., W. Travis, T. Williams, and E. Lih (Online February 2018): Managing Climate Risks on the Ranch with Limited Drought Information. Clim. Risk Mgt., doi:10.1016/j.crm.2018.01.002.